
AN ANALYSIS ANANTAPUR CLIMATE - [email protected]/7672/1/RP-07148.pdfAN ANALYSIS OF...
94
AN ANALYSIS OF ANANTAPUR CLIMATE P. Navten and N. Seet$snma Cerals Proglum, and D. Midp and S.M, V i d Rwce Mo~germnr Progrm, ICRIXAT Center, Parancheru, and DROUGhlT ReSEARCH SEMINAR FORUM * jntemtionel Crops Research Warte for the Semi-Arid Tropics (ICRISAT) Patandrm, AP. 502 324, India AGWULTUW BESEWPCB STATION * Adlm Prsdedb Agricultural Univdty Amtmr, A$, 515001, lndia
Transcript of AN ANALYSIS ANANTAPUR CLIMATE - [email protected]/7672/1/RP-07148.pdfAN ANALYSIS OF...

AN ANALYSIS OF ANANTAPUR CLIMATE
P. Navten and N. Seet$snma Cerals Proglum, and
D. Midp and S.M, V i d R w c e Mo~germnr Progrm,
ICRIXAT Center, Parancheru, and
DROUGhlT ReSEARCH SEMINAR FORUM *
jntemtionel Crops Research Warte for the Semi-Arid Tropics (ICRISAT) Patandrm, AP. 502 324, India
AGWULTUW BESEWPCB STATION *
Adlm Prsdedb Agricultural Univdty Amtmr, A$, 515001, lndia

AN ANALYSIS OF ANANTAPUR CLIMATE
P. Naveen and N. Seetharama Cereals Program, and
D. Midya and S.M. Virmani Resource Management Pro&yam,
ICRISAT Center, Patuncherrr, and
A. Yogeshwara Rao Andhra Pradesh Agricultural Ulriversity, Ananrapur
August 1991
DROUGHT RESEARCH SEMINAR FORUM
International Crops Research Institute for the Semi-Arid Tropics (ICRISAT) Patancheru, A.P. 502 324, India
and
AGRICULTURAL RESEARCH STATION
Andhra Pradesh Agricultural University Anantapur, A.P. 515001, India

PREFACE
The yields of rainfed crops in the semi-arid tropics have remained low and unstable because of sevual environmental constraints among which soil and climatic factors are the foremost. Success or failure of rainfed crops depends upon l c pattem and amounts of rainfall. However, other factors like temperature, photoperiod and Grid also significantly influence crop growth and yield. Ihe analysis of climate plays a key role in planning better farming systems to improve and stabilize yields, and to design appropriate crop breeding strategies.
The main objective of this repon is to demonstrdlc the extensive use of climatic dula for improving crop production by assessing the extent and intensity of climndc risks. We have chosen to study the climate of Anantapur which is in a dry tmcr with dcgredcd soil. The International Crop Research Institute for the Semi-arid Tropics (ICRISAT) and the Andhrn Pradesh Agricultuml University (APAU) use this locution for conducting drought research. Therefore, assessment and interpretation of the natural resources of this region in agronomically relevant terms (particularly those related to water), assume e special significance.
This is nor a formal publication endorsed either by lCRlSAT or APAU. Its purpose is mainly to stimulate discussion among professional colleagues, and therefore should not be cited. Comments are most welcome. We hope that similar exercise will bc carried out for other benchmark stations in the arid and semi-wid tropics.
ACKNOWLEDGMENTS
P. Naveen canied out most of the work reported here as a training project with the active support of N. Seethararna, D. Midya, S. M. Virmani, and A. Yogeshwarn Rao. The authors are very grateful to Drs. G. Alagarswamy, Plant physiologist, F.R. Bidinger, Principal plant physiologist and Piara Singh, Senior soil scientist, for critically going through the manuscript and making valuable suggestions.
P. Naveen is indebted to ICRISAT, and specially to Dr. J. M. J. de Wet, Program Director Cereals, and to Dr. D. L. Oswalt, Rincipal Training Officer and Program Leader, Human Resource Development Program, for giving him the opportunity to work at the ICRISAT Center.

CONTENTS
1 . 0 . Introduction
2.0. R.infrl1
2.1. Annual rainfall
2.1.1. Frequency of rainfall distribution 2.1.2. Frequency of drought occurrence during calendar years 2.1.3. Dependable annual precipitation
2.2. Seaaonal rainfall 5
2.3. Monthly rainfall 5
2.3.1. Dependable monthly precipitation
2.4. Rnalyses of weekly rainfall 6
2.4.1. Total number of rainy week3 2.4.2. Total amount of rainfall 2.4.3. Probability estimates of weekly rainfall
2.4.3.1. Constant rainfall analysis 2.4.3.2. Constant probability analysis
2.5. Analyses of decadal rainfall
2.5.1. Constant rainfall analysis 2.5.2. Constant probability analysis
2.6. Total number of rainy days
2.6.1. Total number of rainy days during a year 2.6.2. Total number of rainy days during the growing season
2.7. Dry spells
2.7.1. Dry spells during a year 2 .I .2. Dry spells during the growing season
2.8. Daily rainfall
2 . 8 . 1 . Number of rainy days in a month
2.8.1.1. Mean 2.8.1.2. Range 2.6.1.3. Extremee
2.8.2. Dry spell between rains within a month
2.9. Rainy season length
2.9.1. Start and end of rainy season 2 . 9 . 2 . Length of rainy season 2.9.3. Probable date of sowing of crops and probability
of dry spells

3.1. Maximum air temperature 3.2. Minimum air temperature 3.3. Heat units
4 . 0 . Wind #pod, Humidity and Evaporation
4.1. Wind speed and direction
4.2. Relative humidity, Mean atmospheric pressure, and Vapor pressure
4.2.1. Relative humidity 4.2.2. Mean atmospheric pressure, and Vapor prejsure
4 . 3 . Evaporation, and Moisture availability
4.3.1. Daily pan evaporation, and potential avdpotranspiration 4 . 3 . 2 . Moisture availability index 4 . 3 . 3 . Climatic water balance
5 . 0 . Othar C l h t i c factors
5.1. Cloudiness 5.2. Sunshine 5 . 3 . Daylength 5 . 4 . Solar radiation
6.0. SIGNITIUHCE OP CLMTIC FEATURE ON AGRICULZURAL PRODUCTION AT ANATAPUR 21
(ii)

A. Cooputation of initial and conditional probrbilitimr . B. Computation of gurma distribution.
C. Computation of daylength.

1. Monthly and annual rainfall data for Anantapur. 34
2. Probability of receiving a spcified a u n t of annual rainfall. 36
3. Frequency of drought occurrence during a calendar year.
4. Monthly rainfall statistics for Anantapur.
5. Monthly rainfall for specified probabilities using qanma distribution. 39
6. Total number of rainy weeks, and amounts of rainfall received during different weeks during 1911-1989. 4 0
1 , Weekly initial and conditional probabilities of rainfall for selected amount, and the mean weekly rainfall. 42
8. Weekly rsinfall for a givbn specified probability using g a m distribution. , 4 3
9. Decadal initial and conditional probabilities of rainfall for selected amount, and the mean rainfall. 44
10. Decadal rainfall for a ~pecified probability using g a m distribution, and the mean decadal rainfall. 4 5
11. Total number of rainy days during a year, and during the growing season. 46
12. Years with e x t r m a for total number of rainy days in a year, and during the growing season. 4 8
13. Dry spells between rainy days during a year and during the growing seaaon. 4 9
14. Years with extreme dry spells during a year and during the growing seaaon. 5 1
15. Generalized characteristics of daily rainfall. 52
16. Length of the growing season, and total amount of rainfall before, during, and after the start of the aeason. 53
17. Forward and backward accumulation of rainfall. 5 6
18. Probability of dry spells for two and three consecutive weeks. 5 B
19. Monthly statistica on maximum air taupbrature and its probabilities. 59
20. Monthly statistics on minimum air temperature and its probabilities. 60
21. Monthly statistics on heat units. 61
22. Monthly statistics on wind upred and wind direction. 62

23. Monthly s t a t i s t i c s on re la t ive hwaidity, Atmospheric pressure and Vapor pressure.
24 . Mom da i ly and monthly s t a t i s t i c s for pan evaporation, and p o t m t i a l evapotranspiration .
25. Monthly a t a t i s t i c s on cl imatic watrr balance.
2 6 . Heekly c l h t i c water balance,
21. Monthly s t a t i s t i c s fo r cloudiness, sunshine hours, daylength and so la r xadiation.
28. I n i t i a l and conditional probabil i ty of weekly r a i n f a l l for week 1 25 receiving more than 10 m ra in fa l l based on 79 yeara of r a i n f a l l b t a .
29 . Gamma d is t r ibu t ion of weekly r a i n f a l l for weak 1 25 fo r 79 years.
30. Comparison of r a i n f a l l charac te r i s t i cs a t Anantapur and Hyderabad.
1. G e q r a p h i c a l l oca t ion of Anantapur i n Andhra Pradesh, India . 73
2. V a r i a b i l i t y i n annual r a i n f a l l dur lng 1911 t o 1989. 7 4
3. Percentage dev ia t ion of annual r a i n f a l l from t h e m a n r a i n f a l l . 7 5
4 . Five-years moving average f o r annual r a i n f a l l exceeding specified minimum unountr. 76
5. Number of weeks receiving r a i n f a l l exceeding specified minimum amounts. 77
6 . I n i t i a l and cond i t i ona l p r o b a b i l i t i e s of mean weekly r a i n f a l l exceeding >10 m. - 78
7. Var ia t ion i n d a i l y r a i n f a l l during 1984 t o 1989. 79
8. Forward and backward accumulation of r a i n f a l l , and p robab i l i t y of d ry s p e l l s . 80
9. Cl imat ic water balance. 8 1
1 0 . I n i t i a l and cond i t i ona l p r o b a b i l i t i e s of r a n weekly r a i n f a l l receiving >10 nun a t Anantapur and Hydorabad. - 82
1, INTRODUCTION
Quantitative analyw of environmental characteristics deserve high priority in defining a&roclimrte, and in determining the crap production potential of a region. Rainfall and soil chsractaistics am the two primdty factors limiting the agriculmd production in dryland areas. ThGse two factors largely determine dre land use potential arid common cropping patterns. In this npon, we haw attempted to analyze the climate of Anantapur, a dry Md resource-pow m t .
The Anantapur dismct (Figure 1) is located in the Rayelaseema region in the southern part of Andhra Rsdesh, India. T h m is an Agricultural Research Station adminiaend by the Andhn Pradesh Agricultural University at Rekulakuntala village, which is 11 km East of Anantapur town on the Anantapur-Narpala road. The station is located at 14' 41' N latitude, 77" 44' E longitude at an elevation of 348 m above the mean sea level. It receives rains during the South-West monsoon from June to September, and during the North-East monsoons from May to November. However, being far from the coastal belt, Anantapur nceives meager rainfall. The high Wtslcrn Ghats also reduce the rainfall from South-West monsoon. The rainfall during thc later pan of the Nonh-East monsoon reason is erratic in this tract, as it is much influenced by the depressions in the Bay of Bengal. Eventhough the total rainfall may appear adequate, its poor disuibution nsults in partial or complete failure of crops during many years. Based on the pattern of monsoon rainfall, the pre-rainy, rainy and postrainy season periods are recognized. Re-rainy season is 18 weeks long [(sld. wks.) slandard weeks: 19-36] and the rainy season is very short (5 weeks; s d wks. 37-41). Postrainy reason is 11 weeks long (std. wh. 42-52).
In the tropics, rainfall is the major climatic element that affects crop growth and dcvclopmnt, particularly w h m rainfed farming practised widely. Data on long-term rainfall, in contrast to those on other climatic paruncm, are easily available. An understanding of rainfall disaibution in relation to the growth nages of the crop culdvm and soil condition is essential for successful nop planning and management. The discussion that follows is thenion confined largely to the methods of analysis of rainfall patterns as related to crop planning. Simple criteria related to sequential phenomena such as dry and wet spells can be used to obtain specific information needed for crop planning. The computation of probabilities of rainfall and drought, and water balance is discussed in W l .
At Anantapur, the soils are p W y red sandy I m (alfisols). They arc shallow (0.1-0.3 m deep), and have a compact subsoil layer that could maict the root growth. 'Ihe stored-soil moisaur: is about 100-1 15 mm m-' depth. The soils are neutral in reaftion, low in organic rnnttcr, dtficieot in nitrogen, phosphuu~, zinc, and low to medium in potassium.

Groundnut is the mp grown Orownghwt h e district On r limited scale, groundnut b in- with long duration redgram (p ippea) . Sorghum, pearl millet uld foxtail d e t (Serotia) an rlso grown, but during m n t yam these cereals are inneuingly nplacad by the
more nmunuative groundnut.
SOURCE OF DATA AND COMPUTATION PROCEDURES
Data w m assembled from several sources. Daily rainfall for the early period of 191 1-1965 w m obtained from the District Collctor's Office at Anantapur. For 1965-1989, data on rainfall, relative humidity, maximum and minimum air kmperatuns were collected from the Agricultural Research,Station, Anantapur. The data on wind velocity, wind direction, sunshine hours, and evaporation were available since 1976. Climatic water balance was calculated using Keig and Mc Alpine's p m e d m (1974). Initial and conditional probability analysis was carried out using Markov chain first order probability walysis (Gabriel and Neuman, 1962). The probability of receiving different amounts of rainfall was canied out using gamma distribution (de Anuda and Pinto 1980). The computation procedures for the initial and conditional probability analysis, and gamma distributions arc shown in appendices. Daily photoperiod including civil twilight (Jones and Kiniry 1986) and heat units (Ong et al. 1986, and AIagarsamy and Ritchie 1991) wen calculated. Tbe data were computed using SAS (1985), or FORTRAN and BASIC programs specially written for climatic analyses.

2. RAINFALL
Temporal variation in rainfall is high at Anantapur. We studied variation in rainfall on mud, monthly, dccadal (IO.dry period), weekly and daily basis. Using the daily rainfall data f a 1911-1989, we also analyzed followiing important characteristics of rainfall distribution:
(i) Means far the spccifM periods (i) Extremes (maximum and minimum) for the specifid periods (iii) Smadard deviation (sd), and d t i c i en t of varhtion (CV; %), and (iv) Probabiity of miv ing specified amount of rainfall during a year.
2.1. ANNUAL RAINFALL
At Anantapur, the mean annual rainfall over the 79 year period (191 1 - 1989) was only 565 mm with a CV of 30% (Table 1). Thc annual rainfall is low and highly erratic, and ranged hmn 176 nun (1984) to 976 mrn (1919; Hgun 2).
Rainfall exceeded 900 mm only lhrice during the study period: in 1917 (945 mm), 1919 (976 nun) and in 1988 (915 mm; TaMe 1). The m n t drought during 1984 was unique in its persistence: only 176 mm of rainfall was received during that year, which was the lowest annual rainfall during 191 1-1989 at Anantapur.
Rainfall deviations of 20% frorn the long-term mean wen quite common (Figure 3). The number of years receiving5 20% of long-term mean rainfall wen 21 (out of 79), and that above 20% was 22. Similar1y;in 9 years (out of 79) the rainfall was below 40% of the mean, and in 7 years it was 40% above the mean. Generally, the variation in rainfall across years was less during the recent past than during 1911-1960. The rainfall was normal (t 19% of man) in 38 yam, and above normal in 21 yean Dut of 79 years.
The five-years moving average of annual rainfall indicates that t hm was a frequent and mspicuous trend of decrease in annul rainfall between 1940-1950nsulting in drought. Similar and was rtpcatcd again between 1980-1990 (Figure 4).
2.1.1. Frequency ot ruinfall diiributiun
We used the definition of the Plruvling Commission, Government of India (1973), to calculate tbc frequency of axwnnce of drought. Acmding to the Commission, the years ncciving 4 5 % of the lag-tam man zainfall arc cbwght years. Tbe number of such dmught yeas during 1911 to 1989 af this station was 12 (ir., m y 1 in 6-7 years).

'I~K &hibution of years receiving specifid amounts of annual minfall is given in Table 2. Only in 1984, the rainfall was cZOO mm. Altogether, 82% (65 out of 79) of the years received A00 mm of rainfall, while only 38% of the years received >600 nun (30 out of 79 years). The probability of ~ceiving 800 rnm a more of rainfall i s only 7.6% (6 out of 79 years).
2.U. Frtqurncy of drought oeeumnce during calendar years:
We examined the scope for predicting drought as per the definition of the Planning Commission (see above section: 2.1.1). The objective was to find out how and when to decide whether a year is a drought year or a normal one, based on simpler calculations. This analysis is significant for initiating prompt drought relief operations by the public agencies during a drought year. Table 3 shows the frequency of years with specified percentage of excess or deficit rainfall up to specified calendar dates. On July 1, a drought year can be assumed once in 3, or twice in 7 years (30 out of 100). If the same exercise is done earlier on June 1, one out of two years can be considered as drought year (45 out of 100). For August 1, the chance is once in thne years (32 out of 100). However, based on rainfall rill December, it is once in five years (19 w t of 100). Thus, the chances of a year being classified as normal increases considerably during the season. The North-East monsoon rains, especially those caused by depression in the Bay of Bengal duriog Septernber-October mod considerably influence the outcome of above exercise at Anantapur.
2.13. Dependable annual precipitetion
Harpcaves (1977) defined dependable precipitation (DP) as the amount of rainfall received at 75% probability (P). For agriculml purposes, 70 or 75 % P is generally accepted as a reasonable risk level. For drought-sensitive or high value crops, or during critical crop growth stages, a higher P may bc m~ appropriate. Convcrscly, for drought hardy craps, or during a relatively less sensitive growth stage, a lower P may be acceptable.
At Ananulpur, the dependable m l precipitation (DPJ is 436 mrn. That is, in 3 out of 4 years the annual rainfall is 936 rnm (47% of the mean annual rainfall). At a lower P of 5096, DP, is 547 mm (=I 97% of loag-tam mean; please refer to section 2.3.1. for man details).

RAINFALL paga. . ,S
23 SEASONAL RAINFALL
Based on the rainfall distribution, thae uc four seasons at Anantapw:
1. South-West monsoon ruwur: Jum to September. . 2. North-East monsoon season : October to December. 3. Wim searon : Janunry to Februuy. 4. Summcr scuon , : March to May.
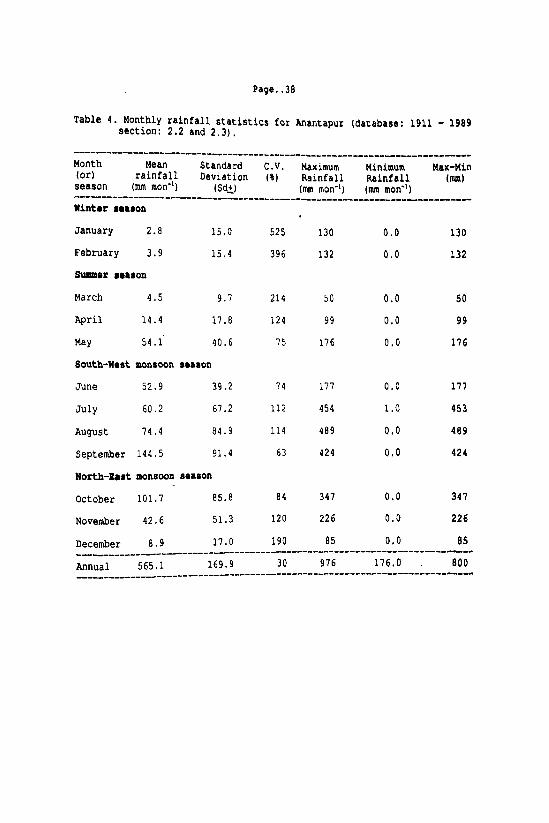
The data on seasonal distribution of rainfall (Table 4) reveal that 332 mm (58.8%) of the annual rainfall is nccivcd during South-West monsoon, and 153.2 mm (27.1%) during North-East monsoon. Thc Wita season conaibutes only 6.7 mm (1.2%), and summer season 75 mm (12.9%).
2.3. MONTHLY RAINFALL
The monthly rainfall statistics for the 79 years an summarized in Table 4. September (145 mm), followed by October (102 mm) are the wettest months. Together, they account for 44% of tbe annual precipitation. Monthly rainfall during May through August, and Novcmbcr varies between 43 to 74 mm (8 to 13% of the annual total rainfall).
The rainfall within a month ovcr the ycars varicd widely bctwccn nil and 489.0 mm. Evcn the wcttest month of September may go dry without any rain in certain ycars. The monthly highest rainfall of 489 mm fell during August 1938 (66% of the total rainfall during that yew TnMe 1). Rainfall during most months of the year (especially those between November and Febrwry) is nladvcly low.
The variability in the monthly rainfall is even greater than the variability of 'annual rainfall. While the CV for annual mun rainfall is only 30%, the CV's for rainfall during diffmnt months arc between 63-525% (Table 4). The CV is 63% even for the wcttcst months of
S c p h -
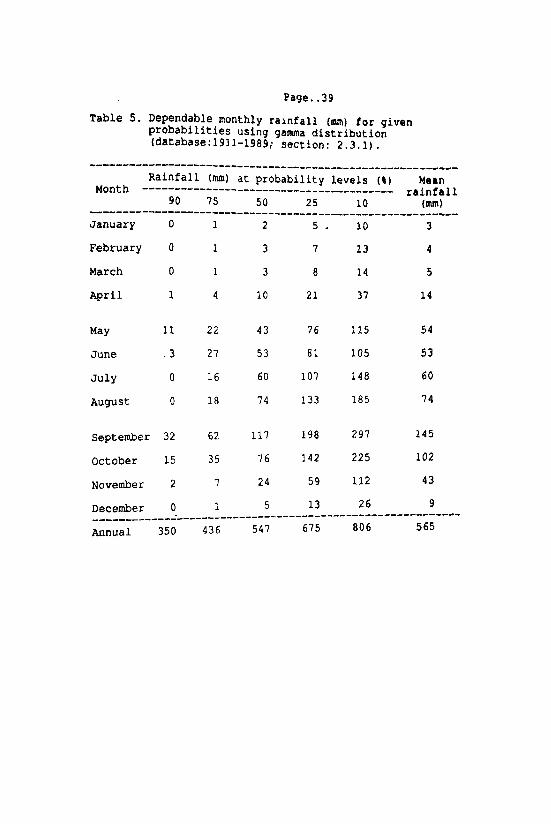
We computed he dependable monthly prccipitadon (DP3 at 90,75,50,25 and 10% P (Table 5). The DP, at 75% P during the early months was low. It is only 4 mm during April ud 22 mm chning May. Even with the stat of the South-West monsoon, it i s low (June: 27 mm;

- -
July: 16 mm; August 18 mm). DP. is highat during Septemkr (62 mm, which forms 14% of the annual DP, (annual DP) at 75% PI, followed by October (35 mm; 8% of DPJ. It declines fran November (7 mm) and continues to =main low until March (1.0 mm).
14. ANALYSES OF WEEKLY. RAINFALL
The information on annual, and even monthly rainfall is often grossly inadequate for making agricultural decisions. Thedon, we necd to analyze rainfall for a period shorta than a month. Weekly analyses an more appropriate to interpret and use than the decadal rainfall. We calculated probabilities of lainfall both on weekly and decade basis for comparison.
2.4.1. Total number of rainy week8
We calculated the total number of weeks at different threshold levels of rainfall for certain minimum amounts of rainfall (including drizzle: all recorded rainfall events): ~2.5,~10,120 and 230 rnm week". The results arc plotted in Figure 5. On an average, there are 22 weeks in a year that receive rains (including a driulo); the highest was 29 weeks in 1915, and the lowest was 9 wteks in 1946 (Figure SA). At 22.5 mm threshold value, the mean was 18 weeks year'; rhe highest was 26 weeks ycaI" in 1930, and the lowest was 7 in 1946 (not shown in the figure). At 210 mm the mean was 12 weeks yea"; the highest was 19 (1977) and the lowest was 6 in 1976 (Figure SB). At 220 mm, the mean was 8 weeks year", the highest was 14 (1916, 1917 and 1919) while the lowest.was 3 (1923, 1934 and 1984; Figure SC), For 230 mm, the mean was 6 rainy weeks yeat"; the highest was 12 (1977 and 1988), and the lowest was 1.0 in 1934,1980 and 1984 (Figure SD).
24.2. Total rmmt of rainfall
The total amount of rainfrll rcccivcd during a yurr with 12.5 mm threshold value day was 560 mm (range 172-%9 mm). Thiidid not differ much from the total rains in a year (565 mm; range: 176.974 ma; Table 6). For other tbrcshold levels the m a n during the year were rs follows: rains 210 mm: 525 m (range: 137-934 mm), rains mm: 471 mm (range: 92- 903 mm); and rains 230 mm: 419 mm (range: 43-813 mm). Such data arc useful in planning land aatmtots aod water harvesting.

Using the daily rainfall data, we characterized weekly rainfall in the following two ways:
- Constant rainfall analysis (CRA). - Constant probability analysis (CPA).
These an the two crucial parameters useful for planning farm operations like t i i l y land preparation, sowing and crop harvest
2.43.1. Constant rainfall analysis
Constanr rainfall analysis (CRA) deals with the probability of occurrence of a specged minimwn m u n r of rai@all. This analysis was cnrritd out by using Mcukov chain fust order probability analysis (Gabriel and Newman, 1962).
By analyzing constant rainfall on weekly basis, we can test the degree of certainty of rainfall to mcet the weekly demand at different crop growth slages. The threshold values of rainfall vary depending upon the name of farm operations during the week. We examined the probabiity of each standard week receiving ~ 1 0 , ~ 2 0 , 1 3 0 , N, and 250 mm of rainfall during the year (Table 7). Details of the calculations are presented in Appendix A.
The weekly rainfall probabilities can be studied in thw ways
(i) The initial probab'ity of a wet week P(WJ. (ii) Conditional pbab'iity of a we$ by a wet week P(W/WJ, and (i) Conditional probability of a bn, we& preceded by a wet week P(WID j.
ryWJ, indicatu the probability of miving certain amounts of rainfall during a given week. PyWIWJ lets m examine the Jnobability of rain during the next week following rain during the current we&. P(W1D.j docs tbe opposite; it deals witb the pmbability of next week being dry fallowing a cunent wet week (Vinnani a al. 1982).
k Anantapa, evar at 210 m rain we&', P(WJ is not mon than 46% in any one of the web during the ' p d y season'. Thwc early nina an not at rill dependable as fiesuently they an only li+t b w m . P(WJ dar not exctcd 70% d h g my pan of the year (Figure 6A).
RMVFALL ~ a q m . . .B
The plcviWJ also foUows a fairly similar pattern as PIWJ (Figure 6B). Only during the standard week 37, P(W1WJ exceeds 70%.
The P(WIDJ is high (>SO%) only in standard week 37 (Figure 6C).
These show the low and undependable rainfall pattern at Anantapur. This point is further illustrated, by comparing the Initial and Conditional probabilities of Hydcrabnd and Anantapur Appmdix A.
2.4.2.2. Constant probability analysis
Constant probability analysis (CPA), represents the amount ofrai$all expected a a given level of probability. We used the incomplete gamma distribution to find the probability of receiving diffennt amounts of rainfall in each week (de h d a and Pinto, 1980). Details of the calculations arc presented in Appendix B. Results of expectcd rainfall at 90,75, 50,25 and 10 per cent probability levels are presented in Table 8.
At 90% P, on an average thm arc only 2 weeks that receive at least 1.0 mm of rainfall (std. wks. 38 and 39), the maximum amount being only 1.9 mm. Even at a lower level of 75% probability, none of the weeks received 210 mm rain. The highest amount of rainfall w i v e d at 75% P i s 8.5 rnrn during week 38 (Sep 17-23).
25. DECADAL RAINFALL
The Food and Agricultural organization (FAO) has chosen the decade as the standard time
scale f a generating the weatha data for crop planning and monitoring (Fmc, 1986), Therefore, we also curried out the analysis on dccadal basis (Table 9). As expected, the decadal and weekly analyses agree with each other.
Far rainfall 210 nun W', only for three decades (26-28) the P o is gnatcr than 4096, P(WJ increaser from 19% (decade 25) to 46% (decade 28). The P(Wm f a the period afra d d c 18 rev& that fobwing early evenu, rains persist until decade 29 (P= 24%). The maximum P(WID3 at 10 mm week" is 54% (for decade 26). The dative m ~ l i t i e s of rainfall reduce amgidaobly with an iacna~e in the tltmhoId m u n u of Anfall.

The expected smounls of dcsdsl rainfall at 90, 75, 50, 25 and lO9b P levels were calculated using an incomplete gamm dirnibution (Table 10). At 90% P, rainfall was dl fm dl the dccdes except decdc 27 (1.0 mm). At 75% PI rainfall was nil up to decade 14 followed by 3.0 mm and 2.0 mm during the subsequent two consecutive decades. Again, then was no rain during the decades 17,19,U), 22 and 24. Further, rainfall was highest during the decade 27 (Sep 27 - Oct I; 11 mm), and no rain wls recorded from decade 29 to decade 14 of the next year. Thac were only four consecutive decades (25 to 28: Sep 1 to Oct 10) during a year that nceivcd some rainfall at 75% P. At 50% P, 11 consecutive decades received 25.0 mm of rainfall (d& 18-28). The highest amount of rainfall was received during decade 27,
2.6. TOTAL NUMBER OF RAINY DAYS
We calculated the total number of rainy days in a year, and during the growing season (Growing season is characterized in wtion 2.8). The following threshold rainfall amounts were considad all rains, ~ 2 . 5 , ~ 1 0 , ~ 2 0 , 2 3 0 mm.
2.6.1. Total number of rainy days in a year
The man total number of days in a year for different threshold amounts of rain varied as follows: all rains: 49 (range: 7 8 9 ) ; 22.5 mm: 33 (range 13-52); 210 mm: 16 (range: 6-28); >20 mm: 9 (range: 1-18) and 230 mm: 5 (range: 0-11; Table 11). The mean maximum and - minimum number of days for d i f fmt threshold levels of rain are shown in Table 12A with the list of years showing extreme value&
2.63. Total number of rainy days during the growing season
Tbc man total number of days during tho growing season for different threshold amounts of rainfall vericd as follows: all rain,: 28 (range: 6-55); 22.5 mm: 20 (range: 5-40); 210 m: 10 (range: 224); 220 m: 6 (range: 1.13) and 130 mm: 4 (range: 0-9; Table 11). Them tiguns (days wid, rain), constituted 57.1046 d the msponding rainy days during the year. The meximum and m i a i m numba of rainy days during the growing wason is shown in Table 12B with the list of years showing e x a m valuer

2.7. DRY SPELLS BETWEEN RAINY DAYS
We calculated the length of dry spells (mean duration of rain-fne days) between two cansecutive rainy days both in a year, and during r growing season. The following threshold rainfall amounts wae considend foe the computation of d;y spells: all rains: S.S,zIO, $ 0 , 8 0 m.
17.1. Dry spells between rniny days in a year
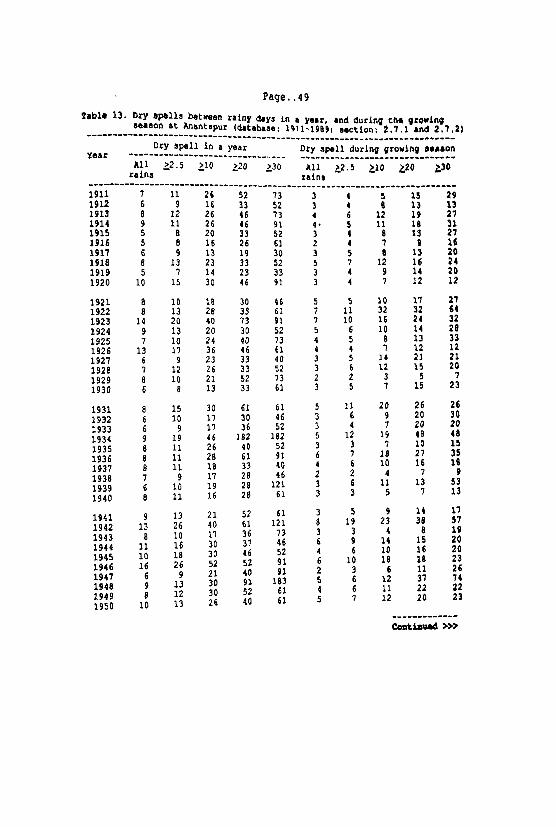
During a year, on an average, then is a dry spcll of 8 days (range: 5-16 days) between rains, when all rains arc c o n s i i d (Table 13). For rains 12.5 mm the average dry spcll was 12 days in its duration (pnge: 7-26), for rains 110 mm it was 25 days (range: 13-52), for rains 220 mm it was 44 days (range: 19-182), and for rains 230 mm it was 72 days (range: 30-365). The maximum dry spell for rainfall amount 230 mm was 365 days during 1984 (lowest annual rainfall), and the corresponding minimum was 30 days (during 1917). The mean maximum and minimum number of dry spells for different threshold levels are shown in Table 14A with the list of years showing the extreme values.
2.7.2. Dry spells between rainy d a y during the growing season
The mean duration of dry spells between consecutive rains for all rains was 4 days (range: 2-8); for rains22.5 mm: 6 days (range: 2-19); for rains 210 mm: I1 days (range: 3-32); for rains 220 mm: 17 days (range: 5-48), and for rains 230 mm: 28 days (range: 6-91; Table 13). The maximum dry spcll of 91 days at 230 mrn threshold rainfall was again in 1984; there was not even a single rainy day with 230 nnn of rainfall during that year, and the length of the growing season was only 92 days.
Thc mean maximum and minimum number of dry spells for different threshold levels an shown in Table 14B along with the list of y m showing the txm values. The number of dry spells during the growing season for all rains, and for 22.5 mm thnshold levels is exactly half that during a year (8 and 12 days during a yw, and 4 and 6 days during the growing season). For the &g dyeshold rainfall ltveIs, as expected, the dry spell is usually more than double of the dry spell during the growing #ason.

RAINFALL p a g e , . . l l
2.8 DAILY RAINFALL
As expected, the daily rainfall is highly variable at Anantapur. Figure 7 shows the variation in daily rainfall for the 6 mnconsecutive yean of 1984-1989. Lowest rainfall of 176 mm was rcceived during 1984. The subsequent thne ycan received below normal rainfall (1985: 392 mm; 1986: 436 mm, md 1987: 502 mm). During 1988, highest rainfall of 915 mm was m i v e d followed by 1989 (821 mm), which received above normal rainfall.
2.8.1. Number of rainy days in a month
The month-wise analysis of the number of rainy days with all rains, and those 8.5 nun are given in TaMe 15. The maximum numbers of rainy days are in September (9.1 days for all rains, i t . , 19% of the total rainy days, and 6.6 days for 22.5 mm rains, i.e., 14% of the total rainy days). It is followed by October (7.6 days for all rains, and 5.4 days for 12.5 mm). During August, September and October together there are 23.9 rainy days; this accounts for 49% of the total rainy days in a year (all rains considered). For threshold values of 22.5 mm during these thne months (Aug-Oct) there are only 16.5 rainy days (51% of the total rainy days in a year).
2.8.1.2. Range
Although the total number of mean rainy days is higher in September, the highest n u m b of rainy days ever recorded was in August (all rains: 20 and 12.5 mm: 17; Table 15) followed by October (all rains: 19 and 22.5 mm: 16) and September (all rains: 18 and 22.5 mm: 16).
Duriq all the months except July, then were at least few years without any rains for all the thnshold amounts of M a l l . Out of the 79 years, only during four years (1942, 1965, 1976 and 1987), there was no effective rainfall of 22.5 mm during July. Thcrtfm, July can k coasidcnd as the most assured month during which crops can be planted at Anantapur.
We analyzed drc him and lowest a m t of rainfall that was nceivcd during a shingle day in each manth (Table 15). The highest amount of 180.0 mm of rainfall during the 79 year paiod was &ved on July 17,1988. This rain was fo110wcd by next two high-rainfall events

RAINFALL Pap*. . .12
d 145.2 mm on October 10,1937, and 130.2 mm on September 28, 1974. The lowesl amount of recaded rainfall during a singk rainy day in a month was lower than 0.3 mm fw all the months except F e h q (1.0 mm: February 7, 1929, and Fetwuuy 2, 1956).
M13. Dry spdl between rains dtbln a month.
We calculated the mean duration of dry spells within a month (Table 15). During the season, the 6y spell is lowest during September (9 days) followed by October ( I I days), July (12 days) and August (13 days). The dry spell increases from November to lanuary. Thc mean dry spells wen highest in January (30 days) followed by Mnrch, February and December (28 days).
The exormes of dry spell are shown in the parenthesis in Table 15. These figures shows that the shonest dry spell is two days for all the months, while the longest dry spells wen equal to the number of days in a month.
2.9. RAINY SEASON LENGTH.
2.9.1. Start and end of mlny season.
We defined the beginning of rain8 (X) as the first day between. June 1 a d October 1 when (i) at least a total of 20 mm of rain is meivcd in five days (not necessary consecutive days). (ii) at least then is one rainy day with 22.5 mm rainfall in the next 10 days. The end d rains (Y) is &fined as the last day of the first dry spell of 10 days ending between October 1 and Nwmber 34. Ihc difference (days) between the beginning and end of rain is the length of rainy maon (Y-X).
The average date of beginning of rains at Anantapur is July 11 (sd= k32 days: June 9 to August 12; Table 16). The average date of ending of lains is Octobcr 15 (sd= k l l days: October 4 to October 26). Thacfm, the avcrage growing season lenM is 97 days (sd= i31 days: 66 to 128 days).
As mentimd above, the length of the rainy seeson varied six folds (Table 16). During the year 1x1, tho lengrh of the rainy season was longest (151 days; total seasonal rainfall was 288 mob). htrin* 1972, t& length oftfie rainy period was my sbon (26 days), but the nmount
of midall during the growing season (280 mm) was almost equal to the rainfall (288 mm) during the long rainy Jcsson of 1961 (151 days). Thus the length of he rainy season is not related to the mnal rainfall.
The amounrs of rainfall that is received before, during, and after the rainy season also wied widely (Table 16). The man rainfall received during the reason is 380 mm, the uunc before the start of season is 115 mm, and after the season, 70 mm.
We also calculated the amount of rainfall that was received during the growing season as the pucentagc of the total annual rainfall for each year. The mean seasonal rainfall is 66% of the annual total rainfall. It is the highest (93%) during 1965, and lowest (24%) during 1982. The number of yean that rcccived rainfall lower than the mean (66%) was 33 years; among them it was less than evcn 50% of the mean during three years.
During 4 years (1911, 1922, 1980 and 1982) more rainfall was received before the growing season than during the growing season itself. In 1951, almost equal amount of rainfall was w i v e d during (265 mm) and before (260 mm) the growing season. During 1928, 1935, 1944,1946,1953 and 1970, no rains were mived after the growing season. During 1922 (162 mm), 1948 (163 mm), 1982 (284 mm), higher amount of rainfall was rcccived after the growing season than during the growing season.
2.93. Probable date of sowing of crops, and the probability of dry spells
Monis and Zandra (1978) suggested that the rainfed crops can be sown when the rainfall accumulates to 75 mm at 75% P in b beginning of the rainy season, and the date of cessation of the rainy season can be determined by backward accumulation of 20 mm at 75% P of rainfall from the end of the rainy season. Acmrdingly, a program was developed to calculate the jmhble week receiving 75 mm rainfall for forward accumulation and 20 mm rain& for backward accumulation along with tbeir probability percentage. The standard weeks along with dKir probability pmentage wtre ranked and shown in Table 17 (also see in the next page).
The pmbabilities of occumnce of 2 consecutive, and 3 consecutive dry weeks w n also cabhi, using the Markov chain Model suggested by Robertson (1976). We assumed a standard week as dry when the &all was less than 20 rmn (approxhatcly equal to half the poteatial evapompiration)). These poobabilities indicates the risk of drought to the rainfed crops duriog a growing season. The probability of dry spells during the growing seaJon ranged between 548% for 2 d v e dry weeks and 147% fix 3 d v e dry weeks (Table 18; also see

RAINFALL Pbga.. .I4
below).
Using the data in Table 11 and T8bk 18 a graph has been ploned sec Fkun 8. Sowiq of rainfed crops in Annntnpur region is possible by second wuk of July (std, wk. 28) in 3 out of 4 years, and the rainy season practically ends by the last week of October (sd. wk. 43; probability r75%). Thus a crop of 15 weeks might succeed in this alfisols- dominated tnct.
After sowing the crop by the second week of July (Figure 8), a dry spell of 2 consecutive weeks could be expected to begin in standard weck 31 (July 30) at 38% P. Later the P falls down to 31%. Besides, a dry s p d s of 2 consecutive wecks could also be expected from the standard week 33 to 35 in 1 out of 5 years. Even during the cessation of rains the dry spell of 2 consecutive weeks touch as high as 42% P (std. wk. 45).
The dry spell of 3 constcutivc standard weeks could be expected to begin with standatd weeks. 30-31. Yogeshwara Rao et al. (1988) analyzed the probable decade of sowing of groundnut, and its effect on yield at Anantapur. They reported that the bunch type groundnut of 110 days duration is extensively grown in Anantapur region and subjected to dry spell during the fmt flush of flowering (18-28 DAS), thus adversely affecting the pod yield.

3, AIR TEMPERATURE
Anantapur is romewhat warm thmughoul the year. However, this wum environment is sursonally by changes in wata regimes and surface (land) conditions. Monthly air
temperatures, and probabilities of the temperatures exceeding specified threshold values using daily data for the period 191 1-1989 an presented in Table I9 (maximun~ temperam) and Table 20 (minimum temperature)
3.1, MAXIMUM AIR TEMPERATURE
Mean monthly maximum air temperatures exceed the annual mean maximum temperature of 33.10C h m March through July (Table 19); during this period, mean monthly air temperatures exceed 3S°C during all years except July (P = 100%). 'lhe CVs range between 1,O and 3.1%. The probabilities of maximum temperalures exceeding 4@C but below 45OC is 3.0% in May, and only 1.096 in April. Throughout the crop growing season (lul-Oct) the mean maximum temperature is always 1300C except during September (P47%).
3.2. MINIMUM AIR TEMPERATURE
Mean monthly minimum temperatures also show little variation as indicated by the low CV (Table 20). Their CVs for minimum temperature arc higher than those for the maximum air temperatures. Mean monthly minimum temperatures during November through February are below the annual mean of 22.0"C. It neva reaches above 24f'C at Anantapur. During all other months, it is >2tf'C. In May, during most years the mean minimum temperature exceeds 25'C, but is below 30°C (P = 95%); this is m l y so during April (P = 9%). During the growing season, the mean minimum temperature vary between 23.8% (July) to 2 2 . K (October).
33. HEAT UNFTS
The man heat units accumulated during a month have been calculated from the maximum and minimum temperatures using the equation of Alagarswamy and Ritchie (1991). This quation is given in the next page.
Hw units for groundnut have been calculated by modifying the equation given by Ong a al. (1986); we have considered an upper limit of 34°C and lower limit of 6'C with a base tern- of 10°C. When a base rempcram of 8.C is m$idcred instead of 1 K , the carespondins values incmd by 2'C.

AIR TEMPERATURLF
HU = ( ( W u m tempentun + Minimum temperaturc)n - BT), Whm Maximum tempmature ms34' C
Miniiumtempaanrre # C . BT (Base temperatun) = 8' C for Sorghum
I@ C for Groundnut
The mean heat unit during a year is 16.6 6'. The range in heat units is not large: it varied between 13.1 in December to 19.2 in May.
We analyzed the highest and lowest heat units that accumulated during a single day in each month (Table 21). The highest heal unit of 19.6 was in May, and the lowest heat unit of 10.0 was in March, May, July and August. The lowest was no1 during 'winter' season.
4. WIND SPEED, HUMIDITY, AND EVAPORATION
4.1. WIND SPEED AND DIRECTION
Tht wind Jpacd, and its direction raoorded at 3 m height arc given in Table 22. B e annual wind speed is 11.0 Ian h'l. High winds prevail during June to August, with the monthly average exceeding 18 km h". During this paid the wind speeds in the afternoons touch even 5060 km h" (Yogeshwara Rao a d. 1985). This coincides with the beginning of the crop season which is a special f e a m of Anantapur climate.
4.2. RELATIVE HUMIDITY, MEAN ATMOSPHERIC PRESSURE AND VAPOR PRESSURE
4.2.1. Rdalve humidity
Statistics on relative humidity (RH) in the morning (0720 hr) and afternoons (1420 hr) are prestntcd in Table 23. During summer months of March, April and Muy, the RH is low (5544% in the morning, and 25-31% in the afternoon). During rest of the year it excccded 65% in the morning, and 32% in the afternoon.
4.2.2. Mean atmospheric pressure and Vapor pressure
The annual mean atmospheric pressure is 967 mb (Table 23). The range is 965 (during May-Aug) to 974 (during Dec).
The mean vapor pressure deficit for Anantapur is 19.6 mb. Vapor pressure deficit is low during November to Apd (lowest in March, 13.4 mb; Tabk 23). It then increases with the onset of rains. Maximum vlpor pressure is recorded during August (23.5 mb). Throughout the pniod of June h g h October, it remains above 23.0 mb. Variation in the mean vapor pressure & f ~ i t is also n m w during the nop season.
4 3 . EVAPORATION, MOISTURE AVAILABILITY INDEX AND CLIMATIC WATER BALANCE.
43.1. Daily pm ewporaUon and potential evapotranspiration
We obtained daily pan evaporation (PE) from the U.S. Open pan cvaporimem (Table 24). The daily mean PE is 7.6 mm 6'. During M m h , April and May the PE! equalM or
WIND, HVMIDlTY and EVAPORATION ~agm. . . l o
arceeded 10.0 mm 6' as the solar mdiatian is high during the same period (23 MJ monrh" also rcs rsdbn 52). During the crop growing s e w n the PE value varied between 8.2 mm (July) md 5.2 mm day" (October).
We multiplied the mun monthly PE values w i l a factor 0.75 to get the Potential evrpmnspinfion (Pm. Tbe d d y mm PET is 5,8 mm 6'. During April and May, it exoesdr 8.0 mm d". It continuously declits from May (8.2 mm d") to November (3.8 mm d"). It is >200 mm month" during the beginning of the rainy season (May & June) but, declines 10 about 120- 130 mm month'' during luet put of the season.
Due to high winds that prevail during the crop growing season specially during June through September, the PET values are relatively high (7.1 - 4.4 mm d"), compared to most locations in the state of Andhra M e s h . For example, at Hydcrabad the PET values range between 6.5 to 4.0 mm during the same period.
433. Moisture availability index
We computed monthly moisture availability index (MAI) using Hargreaves (1975) formula. Only during September, MA1 is moderately deficient (0.47), while during the rest of the year it is low (Table 25). A montb is too long a penod to study crop weather relationship; therefore, we analyzed MA1 on a weekly basis (Table 26).
From the available crop watu u x data, it follows that at most stages of crop growth, the ratio of actual evaporation to potendal evapotranspiration (WET) had to be at kast 0.50 to met the crop water demand (Yogeshwara Rao et al. 1985). There an only 9 consecutive wetks (std. wks. 37-45) that have suficicm soil moisture (>20.0 mm) for crop growth at Anantapur (Table 24).
433. Climatic water bniollcc
Kcig and Mc Alphim (1974) water balance model was used to estimate the weekly available soil moisture m g e . This &I is based on two assumptions. F i t , a maximum soil moisture-storage capacity has to be known or at least assumed. Second, run-off or deep drainage losses of M a l l oavrs only after the maximum sail water norage capacity has been reached. Soil water-storage at ttw cad of a particnlar week was cakulatcd by subuscting the soil water loss due to ev- during tbe week from the sum of thc soil water s m g e at the end of r pnviouJ week and the rmouat of k n f d received during the week. Soil water lass through

the week was estimated by tht ratio of actual cvapmspirallon (AE) to potential cvapouansphdon (PET) multiplied by PE. The ntio of W E T is taken as 1.0 as the soil water storage deaeases fm 10096 to a minimum d u e , x%; and it dalleeres linearly from 1.0 to 0.0 as the w a g e denesses from x% to 0%. The value of x varies with the maximum soil water- s m g e capacity. P I 3 values for the last 13 years (1977-1989) w a t used in the water-balance computations. Using the above procedun, weekly available Eoil moisturt was estimated (Table 26). Maximum soil water-smpe capwity for Anantapur is taken as 74 mm (Bulk density is 1.58 Field capacity is 141, permanent wilting point is 4% meter' depth of soil.) The man annual rainfall is 565 mm and the mean PET is 2094 nun Average monthly PET varied between 115 @ec) and 254 (May). The total annual run-off is 79.5 mrn w i ~ h peak during the standard wcck 40 (14.6 mm). There arc only five consecutive weeks retaining soil moisture 130 mm (standard week 38-42).
Cocheme and Franquin (1967) proposed a graphical approach for climatic water balance. It is based on the computation of periods at which average ninfall (R) equals to 1/10, 1/2, and 1.0 of PET at the beginning, middle and end of the rainy season. The point where R equals to 1/10 of PET defines the beginning of the preparatory cultivation period, which in turn ends with the beginning of the first intcrmcdiate period (R = 1/2 PET). The humid period begins when R > PET. The inmediate period, during which R is more than half the PET b a does not exceed - it, occur before and afta the humid period. The moist period is the sum of the humid and the two adjoining subhumid and per-humid periods.
Figure 9 depicts the climatic water balance at Anantapur. According to Cocheme and Franquin (1967), the preparatory culdvation period could be used for preparation of the soil. The prepamtory cultivation period lasu far 81 days (April 25 to July 15). The beginning of the moist period is the best period for sowing. The moist period is 115 days (July 16 to Nw. 8) while the humid period is 39 days (Sep 5 to Od 14). The above calculation does not consider soil moisture m e s in the profile that could be u d by the crops after the rains end. Length of the rainy season discussed in the sedion 2.9 gives weightage to the profile water rewrve by computing the end of the seam as the Last day of first dry spell of 10 days ending between Oct 1 - Nov 30.
5. OTHER CLIMATIC FACTORS
The m r h l y data on clwdimss, sunshine and solar radiation art presented in Table 27.
Thc sky is generally clear throughout the year at Anantapw. During the two high rainfall months of September and October, the cloud covers an only 6 Okras compartd to 7 Oktai during July and August From November onwards the sky is nlatively clcar, it funha clears up in January.
5.2. SUNSHINE
The annual mean daily sunshine is 7 h 45 m d-'. Sunshine hours range from 8.0 (during Oct - Dec) to 10.0 h day" (Mar - May). During the crop growth period (Jul - Sep), the sunshine hours arc low, with July recording the lowest (5.0 h d").
5.3. DAYLENGTH
The daylength (including twilight) was computed using quations as shown in Appendx C. The variation at Anantapw (14' 41' N) is not much. Daylength varid from a low value of 12.0 h in December to a maximum of 13 h 13 m in Junc. h is 213.0 h d" during the growing season except September (12 h 12 m day"). The average annual mean was 13 h 02 m d". Except during the few s u k r months, the tcmperatw is also modaiatc; therefore, the phenological response to daylength may not vary much across planting dates without drought stress.
5.4. SOLAR RADIATION
Solar radiation was computed by using a FORTRAN program with the following input data: daily rainfall, tempmatun maximum, t e m p t u n minimum, sunshine hours, latitude and longitude of a muon. Tk avenge of daily solar radiation is 20.0 MJ d". Solar radiation is above avmgc during January to May (202 to 23.0 MJ dl), and below the average during the rest of the year. Solar radiation is lowest during July (16.2 MJ d"). It increases continuously from August to April (23.8 MI a'), and muad high during May and Junc.

6. SIGNIFICANCE OF CLIMATIC FEATURE ON AGRICULTURAL PRODUCTION AT ANANTAPUR
The amwnt of rainfall and duration of rainy-lieason dries not provide a good index of productivity. Ihc potential cvapwanspirntion, wata loss, water-holding capacity of soil dictates the amount of available watu for crop growth. Mon important than the quantity of rainfall in a given season is h e question of its persistency wer a shm interval (for instance, during one week a foxmight). For nd sandy roil of Anantapur, information on rainfall probabilida is importaot for agricultural planning. Alfisols, because of their poor structural stability at the surface are susceptible to erosion. Besides, the high winds of >I8 km hI" prevailing during cropping season take away the beneficial effect of a rain in no time. lnspite of this observation, rainfall inccnsities are seldom mcasurul.
The fanning'systcm at Anantapur is characterized by small farms, fragmented holdings, limited capital, use of mainly animal or human labor, sevm unemployment, limited biological n s o m s , lack of credit facilities and labor shortage at peak limes. lmproved productivity on this type of soils should consider the period available for crop growth. The beginning ud end of he p w i n g period show a wide fluctuation, by that reflecting the need to consiir different management swtcgies. Once the cxtracutblc waar-holding capacity is determined, watw- budgeting techniques can be used to find the pattern of changes in the profile moisture during the cropgrowing season. Above f w r s assume p t e r importance if the modem technologies, including the new genotypes, is popularized, and moderate amounts of purchased inputs are applied.
The growing season at Amtapur is only 15 weeks long; therefore, a crop that can complete its life cycle within 105 days must be deployed. But, we need to consider the poasibiity of postponement of flowuing time by droughts at pre-flowering stage; in such cases allowances should be made for tbe time to recover from early reason drought.
Climaac and mil characterinics of Anantapur make this place idcal for wndndocting drought rtsearch.

7. SUMMARY
Tht climate of Ananmpur is classified as aopical arid. The rainfall is vnriable between seaon% The rainfall is d c , and shallow sandy loam soils have low infilmtion capacity with he high tvaposanspimtion at this location, h g h a an very common and so successful farming is diffrult in the region.
Rainfall Ananmpur w i v e s a man nnnual rainfall of only 565 mm wilh a CV of 30%. According
to the Planning Commission's ddinition, drought prevails once in three, or twice in 7 years. The data on seasonal distribution of rainfall reveals that 58.8% of nnnual rainfall is received during South-West monsoon and 27.1% during North-East monsoon. The dependable annual precipitation at 75% probability is 436 mm. September and October are the wettest months, together accounting for 44% of the annual precipitation, n i e variability in rainfall within the month is so high that even the wetml month goes dry without rain.
During any part of the year, the Initial probability of wet week, P W J does not exceed 70%. The conditional probability of wet week followcd by wet week, PlWlW J follows a similar pattern as P(WJ except during the standard week 37. During none of the weeks the conditional probability of P(WIDJ exceeds 59%. Consmt probability analysis for rainfall 210 mm reveals that the highest amount of rainfall at 75% pmbability is 8.5 mm. At 75% probability t h m are only thne consecutive decades (2426) during the year receiving a minimum rainfall of 30 mm.
On an average, thm an 49 days in a year with at least some rainfall. During the rainy season thae an 28 rainy days. Thae is a dry spell of 8 days duration between rains when all rains an considacd during a year. Tbe mean dry spell during the growing season is 4 days only, but it can range from 2 to 8 days. I h e maximum number of rainy days is in September (mean:
9.1; range: 0.18).
The mean date of onset of South-West monsoon at Ananulpur is July 1 I(sd: +32 days). The man date of caution of North-East monsoon is October I5 (sd 211 days). Thmfore, the length of the rainy season is 97 days (sd: 231 days); it range from 26 . 151 days, thus shows the risks faced by the local fanmn.
The probable date of sowing crops at Anantapur is around standard week 28 in 3 out of 4 ytan. The rainy season pmically ceasad by standwl week 43. Thus, a crop of 15 weeks d4t ruccetd in this altisols-dominated uact.

SUMMARY page.. .23
After sowing the crop by rtcond wcck of July, a dry spell of 2 consecudve weeks are highly probable, which begin with the standard week 31 (38% pmbabiity). The probability of 3 consecutive std wks. mild be cxpccted beginning with sundard week 30-31.
T~nperatuw and beat unib The annual mean maximum lemperam is 33.X. The annual mean minimum
umpaatun is U.VC. During crop p w i n g Ksson (July-Oct), h e variation in maximum (32- 33T) and minimum (22.0 to 23.8"C) temperatures is low. The annual mean heat unit is 19.2 dl. During the growing season the heat units range between 19.0 to 20.4 b'. Given the growing season length of 15 weeks, a crop that quirt about 2500 heat units can mature in Anantapur.
Wind speed and relative humidity The annual kind spccd is 11.0 km h.'. The wind spccds during the afternoons nn high
touching 50-60 km h". This coincides with the beginning of the crop season, u special feature of Anantapur. During summer month of March, April and May, the relative humidity is low (55- 64% in the mornings, and 25-31% in the afternoons), while during rest of the year it exceeds 65% in the morning and 32% in the afternoons.
Atmospheric pressure and vapor pressure The annual mean amspheric pressure is 967 mb. The mean vapor pressure deficit is 19.6
mb. Maximum vapor pressure defdt of 23.5 mb is recorded during August. The change in the mean vapor pressure deficit is also narrow during the crop season.
Potential evaporation and water balance The monthly mean PET is 174.5 mm (5.8 mm day"). It exceeds 2200 mm month" during
the beginning of the season, but declines to about 120-130 mm mon&' during Later part of the scam. lhere is sufficient soil moisture for crop growth only during std, wks. 29-46. ,
A graphical approach of climatic water balance showed that the preparatory period lasts for 81 days (Apnl25-July IS), the moist period for 115 days (July 16 - Nov 8) and the humid paiod is only fot 39 days (Sep 5- Oec 14).
Cloudi~ronehiacraddayknoth The sky is geoaafly overcast 6om May to October with a peak o v m t between July and
August The annual mera daily sunshine is 7 b 45 m d". During the crop growth penod (Jul- Sep), tbt numba of sunshine bows is low, witb July ncordtrg thc lowest (5.0 h d"). The annual m#a daylength including twilight is 13 h 02 m 6'. During the gmwing season the daylength is

SUMMARY
13.0 h (r' cxcepl in September (12 h 12 m 6').
Implementation of &bow analysis on differen1 suattgits for crop production md research at Anatapw are discussed

Alaganwuny, G., and Ritchie, I. T. 1991. Phasic development in Curs-Sorghum Model. Pages 143.151 in Predicting phenology of crops (Hodges, T., ed.). B a r Ration, FL 33431, USA: CRC Reu.
Cocheme, J., and Franquin. P. 1%7. A study of the agmclimatology of the smi-uid ma south of the Sahara in West Africa. FAO/UNESCQWMO Inter-agency Pmject on Agroclimaalogy. Tech. Report
de Armda, H.V., and Pinto, ICS. 1980. A simplified gamma probability model for analysis of the frequency distribution of rainfall in the Region of Campinas, SP, Brazil. Agricultural Metunlogy 22: 101- 108.
F m , M., and Popov, G. 1979. Agroclimatological crop monitoring and forecasting. Rome. Italy: FAO.
Gabriel, K.R., and Neumann, 1. 1962. A Markov chain model for daily rainfall occmnce at Tel Aviv. Quanerly Journal of the Royal Mcteorolopial Society 88:90-95.
Harpves, G.H. 1975. Water requirements manual for irrigated crops and rainfed agriculum. Logan, Utah, USA: Utab Slate University. 40 pp.
Hargnavts, G.H. 1977. Wa~er requirements manual for irrigated crops and rainfed agriculture. Logan, Utah, USA: Utab State University.
J m s , C.A., Ritchie, J.R., Kiniry, J.R., and Godwin, D.C. 1986. Subroutine structure. Pages 49-1 11 in CEILES-Ma&. a dmulation model of m a k growth and development (Jones, C.A., and Kiniry J.R., eds.). College Station, Texas, Texns A & M University Rtrs.
Kcii G., and McAlphiat, J.R. 1974. WnM: a computer system for tho estimation and analysis of soil moistw fmn simple climatic data 2nd edn. Ausiralii Division of Land Research Technical Manornadum 7414. Melbourne, Ausealia: Commonwealth Scientific and Indastrial Rtstarch Orgaaizatioa. 45 pp.
Mo& IU., and Zandra, H.G. 1978. Land and c l i m in m l a h a cropping patterns in ninfcd lowlaad rice: selected papar from the 1978 I n m W Rice Rellearch Confenllce

In- Ria Rescurh Inrtihlte, La Banor, W l a , Philippines, pp. 255-274.
Ong, C.K. 1986. Agroclimatological factors affecting phenology of groundnut. Paps 1 15- 125 in Agromemlogy of groundnul: proctedings of an lntemational Symposium, 21-26 Aug 1985, ICRISAT Sahelian Center, Niamey, Nipr. Patnncberu, A.P. 502 324, India: International Cmpr Research Institute for the Suni arid Tropics.
India: Planning Commission. 1973. Integrated agricultural development in bought prone areas. Report of Task Force on Integmted Runl Development. New Delhi, India: Planning Commission.
Penman, H.L. 1948. Natural evaporation from open water, ban soil, and grasses. P d n g s of the Royal Society of London, Series A 193: 120-145.
Softwan system for data analysis (SAS), 1985. SAS users guide: Basics, Version. 5th Edn. NC 275 11, USA: SAS Institute.
Sivakumar, M.V.K. 1986, Climate of Niamey. Pmgrcss Repon-I. Niamey, Niger: International Crops Research Institute for the Semi-Arid Tropics. Sahelian Center.
Virmani, S.M. 1975. The agriculNal climate of the Hyderabnd region in relation to crop planning: a sample analysis. Patanchem, A.P. 502 324, India: International Crup Research Institute for the SemiiArid Tropics. 80 pp. (Limited distribution).
Virmmi, S.M., Reddy, S.J., and Bose, M.N.S. 1980. A handbook on rhe rainfall climamlogy of West Africa: data f a selected lofations. Information bulletin no. 7: Patanchau, A.P. 502 324, India: International Crops Research Institute for the Semi-Arid tropic^.
Viani, S.M., Sivahunar, M.V.K., and Rcddy, S.J. 1982. Rainfall probability estimates for selected locationr of semi-arid India 2nd edn. Reatarch Bulletin no. 1. Patancheru, A. P. 502 324, India: Intcmational CIopl Research Institutc for the Semi-Arid Tropics. 180 pp.
Yogcshwm Rao, A, Krishna Rao, K. and Ramana Rao, B.V. R. 1988. Rainfall pmbabiity analysis of 3 stations in Andhra Rsderh for crop planning. lndian Journal of A p k u l ~ Sciencet 58 (2):133-137.
Yogcshwam Rim, A., and Kridllll Rao, K. 1987. Climate of Anantapur. Rerearch Bulletin.

REFm.mc~ Page.. .21
Anrmtapur, Andhm W s h , India: Agricultunl Research Sution.
8. APPENDICES
A. Initial and Conditional probability analysis
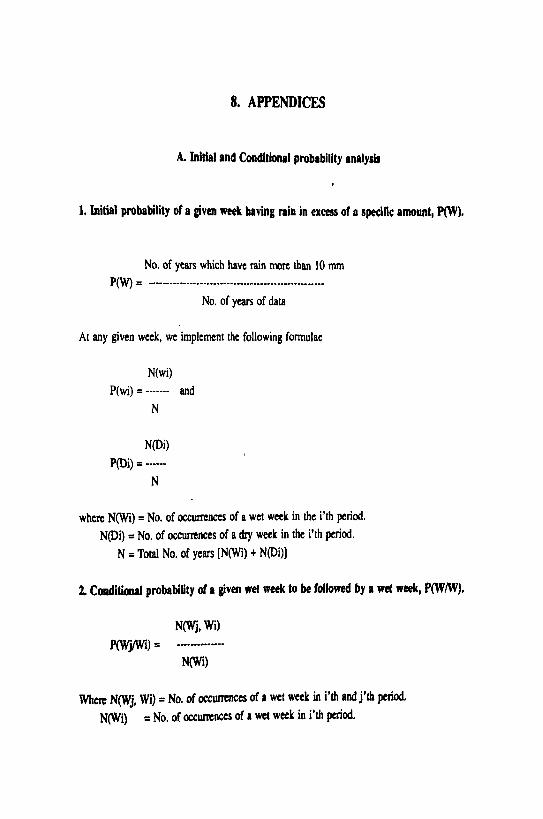
1. Initial probability of a given week having rain in excess of o specific amount, PW),
No. of years which have rain mm than 10 nun p(W) = ....................-.---......-...--*......-....---
No, of years of data
At any given week, we implement the following formulae
N(wi) p(wi) = ------- and
N
when N(Wi) = No. of occurnaccs of a wet week in the i'th period. N@i) = No, of occumnces of a dry week in the i'th period.
N = Total No, of years [N(Wi) + NPi)]
2. Conditional probability d a given wet week to be followed by a wd week, P(W/W).
When N(Wj, Wi) = No. of occumnces of a wet week in i'th end j'th period. NWi) = No. of occmnces of a wet week in i'th period.
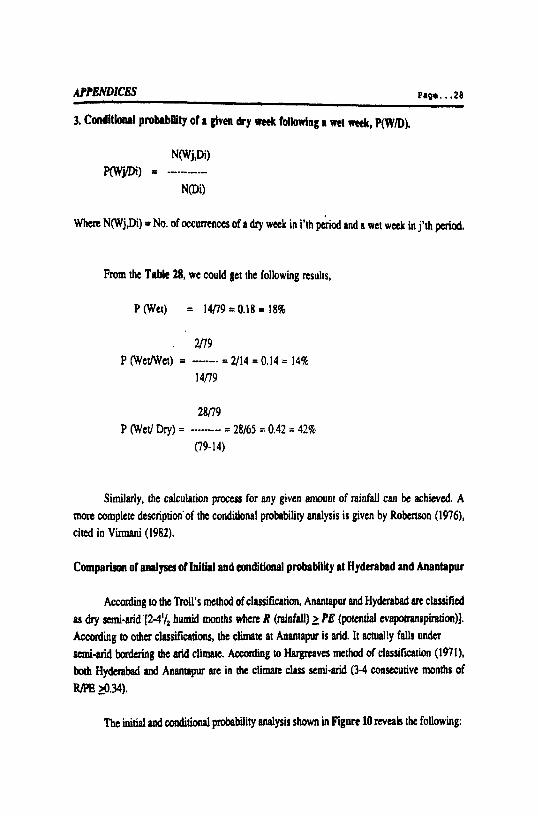
APPENDICES page.. .28 - 3. Conditloll~l probnbllity of a given dry week following a we^ mck, P o ) .
Where N(Wj,Di) * No. of o c m c e s of a dry week in i'th pdiod and a wet week in j'th period.
From the Table 24, we could get the following results,
Similarly, the calculation procesa for any given amount of rainfall can be achieved. A more complete description'of the conditional probability analysis is given by Robmson (1976), cited in Virmani (1982).
Cornparism of a n a l y ~ of Initial and m d i t i m l probability at Hyderabad and Anantnpur
Acconiing to the Troll's method of classifmtion, Ananrapur and Hyderabad are classified as dry semi-arid 124% h d months when R (rainfall) 2 PE (potential evapoaanspiuah)]. According to otha clasP~cations, the climate at Anmapur is arid. L actually falls under semi-arid bxdaing the erid climate. Accading to Fkgmves method of clasdfrntion (1971), both Hydcrabad and Anannpur are in the climate class semi-arid (3-4 consecutive months of RlPE 0.34).
The initial and conditional probability analysis shown in Figure 10 reveals the following:

The dufdl &fibudon at Anw~aput is bimodal. Not even a h g l e of w y initial mty of P(W) ex- the 7096 h h o l d (Flgurt 1h). Ihe p&wty of wst period fdlowed PlWW also follow9 r fairly sirnib pattan u Only during the staadard 37, p ( w ~ ~ ~xoeeds 7096 (Figurt lob). The conditional prohbilry of wet foUowad by dry Period PWD1 is not more than 59% in any of the wcek (FLguw 1Oc). In comparison, M a U distribution for Hydelabad is unitnod. A dependable rainfall (602 dismbutcd between June 18 to the end of July and from about mid-August to mldJaptmrbcr. Monsoon rainfall during rainy season (lun -Sep) at Anantapur is highly erndc and therefore undependable. It is the major environmental factor that has led to low sgricultural pmducdon; other factors arc rcd sandy soils (Alfsols) which arc well drained but possess low water holding- storage capacity, and traditional methods of rainfed fuming. The soils are both unproductive md prone to excessive m o f f , a n d erosion. Hydmbad seems to have much more favorable seam for crop production during rainy season as the soils an vertisols or medium or deep Alfi~olr with high water holding-storage capacity.
Thus from the study of rainfall, moisture index and the length of the growing sewn Table 30, it is closely seen that the two areas are quite different with each other. Funher, following observations can be made:
1. At Hyderabad the length of the growing season is long (130 days) and reliable especially on vertisols. Dry seeding can be adopted for Hyderabad region as the stan of the season is reliable. At Anantapur same is impossible as the stan of [he season is variable, s h a (97 days) and the soils arc Altisols (shallow and sandy soils) and prone to crusting.
2. At Hydcrabad, as evidenced from the rainfall probability analysis (Fig. 9) mid-sewn breaks in the continuity of rainfall are likely to occur once in 4 to 6 years in a 10-year period. Chc.mlly, one would not select a crop cultivu whose growth is sensitive to moisture strcsr during this paid. 'herefore, either a sole shondurat'mn mop (which completes most of its life cycle befm cessation of rainfall) or a long duration base crop with a shon d d m intercrop would be best suited for the Hydcrabad ulder dryland conditions (Virmani et a1 1980). At Anantapur, sole cmpping of groundnut or sorghum is possible as the rainfall is received for a shon period of 13-14 wceks, with an intcrrninent drought Thenfore, crop cultivars which can withstand w s during the early s t a m of crop gwwlh ate p r e f d . The porribiliks ffw
in- Ananmpur are low, and double cropping it is not feasible.
3. Tht pomtial benefit fur neycling of run-off water would be much more favorable in Anantapur re+ than at H y d d d The r u n 4 i s mm at ARenapw (102 mm ycaf') since the

A ~ P N I C B Pa*. . .30
wib ~lfisols with inherent characterittic, such as low wa~er-holding capacity, high d i l i t y , and a potential for excessive ~ n - o & that are consminu in nop productim undu lainfed conditions compand to vmisols which an high water-holding caprdty d high cadon
capacity because of physic0 chemical name of the soils.

B. Gamma distribution.
A number of models have k c n proposed for the panems of rainfall over s period of dm e i t k daily, weekly, or monthly. Gamma dishibution is one of the most appmpriale models for interpreting rainfall data. The gamma dismbution function is expressed by
Whcrt B is a scale parameter, Y is a shape parameter and S(v) is the ordinary gamma function of . However, this formula gives a poor estimate of the parameten. Adequate estimates are approximated by
where A is given by
- A = x - LA?? a $ln xi - In x
h
The disnibution function from which probabilities may be obtained is

A ~ P E N L N ~ S Pf igo . . .32
Gamma distribution for weJr: I 25 has beea calculated (Table 29). F m the a m p l e we en avaage rainfall of 6.32 mm and In x = 1.84372. The tolal of In x I 78-05. W m , A=
2 - Sln xfn 1 1.84372 - 0.99000 = 0.85372.
To determine the amount of rainfall at any given probability, i t must k put in the standard fom t (F) = X$.Frorn the gamma dismbution table, we can get the amount of rainfall.

C. Equation for calculating daylength including dvk tnlllght
Photopaid in hours (HRLT) is calculated from the day of the year (DATE) with a d s of three equations:
1. DECm 0.4093 * SIN [0.0172 * (JDATE-82.2)]
2. DLV= (-S, * SIN @EC) - 0.1047) 1 [C, * COS (DEC)]
3. H U T = 7.639 * ACOS (DLV)
Where,
DEC is solar declination angle (radinns). S, = SIN (LAT ' 0.01745) C, = COS (LAT * 0.01745)

TABLES

N O O O O D O O O O O O
C W
O O O N O O O O W O
C W W N W C N ~ ~ N W O W W P O I D
C W C W W C n W 4 C O O b e N m
C CIIW WCII N O Q I C n C n N N W O C I 1 W O W

Page. .35
(Table 1 . Continued from the previous page) ----------------------------------------------------------------. YEAR JAN FEB MAR APR HAY JUN JUL AUG SEP OCT NOV DEC
Mean 3 4 Sd+ 15 15 C V ( 8 ) 525 396

Page. .36
Table 2. Probability of receiving a specified amounts of annual rainfall at Anantapur (database: 1911-1989; section: 2.1.1).
Annual rainfall (mm)
Probability . ( $ 1
> 800 7.6 ( 6 ) ___-_-_____________------------------------- Figures in parenthesis represents the number of years out of total (79) years.

Page. .37
Table 3. Frequency of drought occurrence during a calendar year at ?aantapur (database: 1911-1989; calculated based on the definition of Planning Commission see section: 2.1.2)
Percentage Number of years ($ ) in frequency class of --------------------,-------------*---------------------
annual Jun Jul ~ u g Sept oct N O ~ Dec rainfall ------ ------ ------ ------ ----,- ,---,- ------
1 15 1 15 1 15 1 15 1 15 1 15 1 15 ---------------------------------------,----------------------- A. 25 4 Intarnal
Total 45 37 30 30 32 30 34 32 24 20 21 19 19 19
Total 34 47 57 54 55 63 44 58 69 73 62 73 65 75
Total 21 16 13 16 12 8 11 10 7 7 6 8 6 6 -- ....................................................... a. 12 .5 8 Interval
Long term mean rain 82 112 133 153 194 218 269 314 416 475 515 545 556 563 fall (mm) * ..................................................... * (upto that particular date)
Page. .38
Table 4. Monthly rainfall statistics for Anantapur (database: 1911 - 1989 section: 2.2 and 2.3).
......................................................................... Month Mean Standard C .V . Maximum Minimum Max-Min (or) rainfall Deviation (b ) Rainfall Rainfall season (mm mon-')
(ram) (Sdi) (mm mon") (mm rnon") ......................................................................
Winter raaron
January 2.8 15.0 525 130 0.0 130
February 3.9 15.4 396 132 0.0 132
March 4.5 9.7 214 5 0 0.0 50
South-Wast monsoon reaoon
June 52.9 39.2 7 4 177 0.0 177
July 60.2 67.2 112 454 1.0 453
August 74.4 84.9 114 489 0.0 489
September 144.5 91.4 6 3 424 0.0 424
North-Eart monroon sealon
October 101.7 85.8 84 347 0.0 347
November 42.6 51.3 120 226 0.0 226
December 8.9 17.0 190 8 5 0.0 85 ----------- ____________-___--_----------C------------------------
Annual 565.1 169.9 3 0 976 176.0 . 800 ______I____________-----------------------------------------------------
Page.. 39
Table 5. Dependable monthly rainfall (mm) for given probabilities using gamma distribution (database:1911-1989; section: 2.3.1).
---------------------------------------------------------- Rainfall (mm) at probability levels (%I Mean
Month ........................................ rainfall 90 75 5 0 25 10 (rn) _---------------------------------------------------------
January 0 1 2 5 . lo 3
February 0 1 3 7 13 4
March 0 1 3 8 14 5
Apr i 1 1 4 10 2 1 37 14
June . 3 2 7 53 8 1 105 53
July 0 16 60 107 14 8 6 0
August 0 18 74 133 185 74
~eptember 32 6 2 117 198 297 145
October 15 35 7 6 142 225 102
November 2 7 2 4 5 9 112
December 0 1 5 13 2 6 9 ___________________-----------------------------------_--- Annual 350 436 547 675 806 565

Page. . 4 0
Trble 6. Total nuab.r of rbln unk*, recelvlnq r.Inlall md the mount rmcmlvrd (a. unL.'I during dlIf8rent r n i s a t Arunrrpur I b r b b r a t i 9 l l - l ~ l ~ c . . o t l ~ n t 1 . 4 . 1 ) .
A l l rain8 >2.5 m 1 1 0 m >20 ma A30 u Iaar NO Amount No h u n t NO h u n t NO - h u n t NO Mount

Page. . 4 1
A l l rain8 22 .5 rn &I0 m r2O nr NO A M Y ~ L II? h u n t ~o h u n t IF h u n t &Io L n r

Page. . 42
Table 1. w**kl initial and conditlon~l probabilltl8~ of ralnfall I11 to: m*l*cted amuntl. and tK* m a n v**kly rainfall at An~nmrapur (databa.*r 1911-19W; 8eotLonr 2.4.2.1I.
---------------------------------*------- ------------.--------------------------.---------. Standard >I0 m >20 s >IO ~sn >40 m 90 WI man Weak ---------- - - z . . ,.: ........ ....,.._--. Uo W WIW WID Y WIN I10 w WIW WID Y WIN WID w YIN Y t D lanl ---------------------------------------------------------..--------------.--.--.-*----.*--.
<------.-.-------.------ -----prob.blllty (a)--------------------------> 1 4 33 0 3 SO 0 1 1 0 0 0 1 1 0 0 0 0 0 1 1.3 2 1 0 0 1 0 0 1 0 0 1 0 0 I 0 0 1 . 2 3 ~ ~ ~ 0 0 0 0 0 0 0 0 0 0 0 0 0 . J 4 0 0 0 0 3 0 0 1 0 0 1 0 0 1 0 . 1 5 4 0 1 3 0 0 I 0 D 1 0 0 1 0 0 2 . 3 6 1 0 0 0 0 0 0 0 0 ' 0 0 0 0 0 0 0 . 3 7 0 0 1 0 0 0 0 0 0 0 0 0 0 0 0 0 . 1 8 1 O 5 O o 3 O o o o o o o o o o . 8 9 5 0 3 3 o O o o o o o o o o o o . ~
10 3 0 3 0 0 1 0 0 1 0 0 0 0 0 0 0 . 5 11 3 0 4 1 0 3 1 0 1 0 0 0 0 0 0 0 . 6 12 4 0 9 3 0 3 1 0 1 0 0 1 0 0 0 1 . ~ 13 9 1 4 6 3 0 4 1 0 1 1 0 1 0 0 0 2 . 5 14 6 2 0 1 4 0 5 1 0 1 1 0 0 0 0 0 2 . 2 15 8 1 1 1 5 5 0 8 1 0 4 0 0 1 0 0 1 2.6 1 6 1 5 0 1 0 8 0 5 4 0 1 1 0 I 1 0 1 ~ ~ 7 17 9 43 13 5 2> 11 1 1 0 0 9 1 I00 6 1 1 0 0 L 3.1 18 15 17 19 11 22 9 10 13 6 8 0 5 6 0 4 7.3
(total: 264 I)
R.iny manon [total: 1.5 r)
po.t-rainy (total: 80 -1

Page. - 4 3
. . 4 8 0.2 4 9 0 .2 50 0.2 5 1 0 .4 52 0 . 3 _____-----------
annual 3 4 9 . 9 _________--_----

Page. . 4 4
Table 9. kcad.1 lnltlal and Condltlo~l prob&bllltl~m of ralnfall (I) for m*laated rrountm. and thm -m d*ca&l rainfall at knantapur (dar&brm*l 1911-l9OBi mmatlon~ 2 . 5 ) .
------------------------------.-------.--------------.---.*----------------.-------*-.------- Stm&rd >10 an >20 m ,lo m >40 m LSD m b a n dmcade ---:------- - - - ---?-.- .... ..-?------- -----.-..-. ralnfall
NO U WIW W I D U U/W UlD N rlu ula u u l r utn r utu utn I-t
0 0 0 0 0 0 0 0 0 0 O O O O O 0 0 0 0 0 0 0 0 0 0 0 0 0 0 0 0 0 0 0 0 0 0 0 0 0 O l O O l 0 0 1 0 0 0 1 0 0 1 0 0 1 0 0

Page. . 4 5
Tablo 10. Doerdal raLnlall (nun) to r a a c i f i o d probablllcl umlnq 9.- d l . t r K r l o n and tho a m dooadal ra in fa l l a t hancapur (aca&#or 1911-1WPt a.ct1on: 2 . 3 . 1 ) .
------------------------*------------------------------- Docado kinfall l a ) at probability l o v r l ~ ( b l Moan NO ----------------.----------------..------ t a u )
90 75 50 2 5 10
.. - __-__-_____-___--__--------------__------------------- Annual 345 4 3 2 545 616 810 365 _______________L____-----------------------------------

Page. . 4 6
T b l . 11. Total nunb.r of ra iny b y r durlnq r art and durln th. 91or1np a.raon at AnantaPur (drtrb8r.t l@ll-1949; 8rct!onaq2.6.l and ? . 6 . 1 ) .
during L
Y-AC
.--- 3%-x ur rainy abva Irinfrll durlnq
the qroulnq 88rron
Total nuabrr of rrlny dryr durlnq the grorin(l rraaon ---.---.-.-.--.------..---.--... ul >2 .s a0 1 1 0 230 rain#
-

Page. . 4 7
ITrbl* 1 1 cont1nu.d from the p r a v i o u ~ pap.) ---------------------------.-----*------------*-.----.----*-.*----------*.-----.------------
R a i n f a l l Tot.1 n b r of ra iny dry8 R a l n f a l l Total n w b . 5 of r a i n y day8 r o a r d u r i n g i n r yaar dur lnq dur lng the prorlng moanon
a -"------'..----"----.-..---.... ,kr ---.----------.--.----------- ...- Y-Ar A11 >2.5 $0 220 110 q r a l n p AIL 1 1 . ) ZlO S O 210
r a l n ~ - .*asan r a i n 8 ----------------------------------------------.*----.-----+.--------*--.--.----.-*-*--*.--- 1971 582 49 1? 15 1 6 3 I I 14 17 10 S 4 1972 558 48 31 15 8 5 210 11 9 7 5 4 1973 121 46 28 1 6 14 10 491 11 18 10 S 6 1974 615 45 28 16 8 7 3 J5 I4 1 1 6 5 1915 699 58 38 21 12 6 5 41 26 17 11 5

Table 12. Years with extremes for total number of rainy days in a year, and during the growing season at Anantapur (database: 1911-1989; section: 2.6.1 and 2 . 6 . 2 ) .
A . During 8 yoar .................................................. Threshold & pf Ppyg A ypll~ rainfall Mean Maximum Minimum
(M) (Year) (Year) --------------------------------------------------- All rains 4 9 78 (1956) 22 (1946)
B. During tho growing 8o88on _____--___-_----_-------------------------------------- Threshold No. of rainv days durinq a qrowinq 9eggR rainfall - Mean Maximum Minimum (mm) (Year) (Year) .......................................................
All rains 2 8 55 (1988) 6 (1976)
Page. . 4 9
Tab1e 13. Dry *W1ls between rainy ddys i n s yrrr, and during the growlnp aeaaon h a n t a p u r (drtabasa: 1911-19891 s r c t i o n : 2.7.1 and 2 . 7 . 1 ) ___----------------------------"*----- ----------------------"---*-.-.-----
Dry i n a year Dry spell during proving smrron rear ----------------------------..--- -_---------__--~-_---*-~-------
A l l '2.5 2 1 0 2 2 0 230 1 1 1 U.5 S O S O 230 r a i n s - ___--------------_------------ -_------_---_______------------------------- rains
1911 7 11 26 52 73 3 4 3 15 29 1912 6 9 16 33 52 3 4 8 13 13 1913 8 1 2 26 4 6 73 4 6 12 19 27 1914 9 11 26 4 6 91 4 . 5 1 1 18 31 1915 5 8 20 33 52 3 4 8 13 27 1916 5 B 16 26 61 2 4 7 9 16 1917 6 9 13 19 30 3 5 8 13 20 1918 B 13 23 33 52 5 7 12 1 6 24 1919 5 7 1 4 23 33 3 4 9 14 20 1920 10 15 3 0 4 6 9 1 3 4 7 12 1 2

Page.. SO
Table 13 continued from the oreviaus ------------------------- . ---- r - . - I -------------------------------------------------- Dry spell in a year
------------------------a-m----- Dry sprll durlnq growing swBOn --------------------------------
A l l 22.5 110 220 230 All 2 2 . 5 210 220 230 rain8 r a i n .
- - - - __-_________-------------- man 8 12 25 nax 16 26 52 Min 5 7 13
s* 2 4 9 __________-_---------------

Page. .51 Table 1 4 . Years with extreme dry spells during a
year, and during the growing season at Anantapur (database: 1911-1 989 section: 2.7.1 and 2.7.2).
A. During a ymar ..................................................... Threshold rainfall
WsPellsdurinaayepr Mean Maximum. Minimum
(mm) (days1 (Year) (Year) ------------------------------------------------------ A1 1 8 16 (1946) 5 (1915,1916,1919r rains 1955,1956,1988)
8. During the growing rmaron .................................................. Threshold &y durin9. lhg L U 2 d . U season
r a i n f a l l Mean Maximum Minimum (mm) (days) (Year) (Year) ....................................................
~ l l rains 4 8 (1942) 2 (1916,1929,1938, 1953,1955, 1956, 1968,1972,1975,

Page.. 52
-L-------------------I----- ----- --.." ---- ---- n u n to ta l nUlb.r Hi(lh.st no. m a r M. c a t r u . 01 ,~I,,!.II k~ 1~1111on of " 1 " ~ d.ys of rainy days ot rainy day, durlnp r~ng l . rainy (dl a l n a ------------------ -------- ----- dw1.0 tM lUKh All )1.1 111 22.) A11 I , HIQWL 1.1 -st ( I w a t - h 1 ) k U l
r . 1 ~ - rrlnn I.(.,. - JInLYR
rabnlaw
lurch
Wi'
MAY
Jun*
July
A"pU#t
s*premb.r
oc~0b . r 7 . 6 5 . 4 19 16
yov.mb.~ 4.0 2.6 12 I
~ac.mb.r 1.2 0.7 5 5
( 3 ) nban nluber of n l n y day, I n a mnth.

Page. .53
able 16. Length of t he rainy season (days: and t o t a l amount of ra infa1 (nun) before1 during, and a f t e r the s t a r t of the rainy reason. The annual r a in fa l l and the percentage of ra in f a l l i n g during t h e growing season are also shown (database 1911-19891 sect ion 2 .9 .1 and 2.9.2). ..................................... .................................
luRYseason &&fAll Annual Crowing Year Star t ' Endb Lengtho Before During After r a i n f a l l reason
<--- ( Ju l i an days) ---> (m) (nun) (mm) .................................. ( 8 ) -----------L-------------------"-----
1911 261 290 30 215 188 60 1912 196 285 90 463 4 1
87 473 160 1913 156 289 134 721 6 6
80 499 4 1914 161 286 126 503 8 6
36 358 30 1915 197 304 108 424 0 4
170 491 109 770 1916 179 277 99 64
39 554 170 763 73 1917 154 274 121 244 465 235 944 1918 180 274 95 49
117 240 140 497 48 1919 156 293 138 125 678 171 975 7 0 1920 246 283 38 176 208 10 394 5 3
Continued >>>
'Start of rainy season (X) : as the f i r s t day between June 1 and October 1 when a t l e a s t a t o t a l of 20 nun of rain i s received in f i v e days (not necessary consecutive days), and a t leas t there i s one rainy day with >2.5 r a i n f a l l i n t he next 10 days. %d of rainy searon (Y): as the l a s t day of t he f i r s t dry s p e l l of 10 days ending between October 1 and November 30, u ~ t h of n i n y season: the difference between the s t a r t and end of r a i n is t h e lenqth of rainy season (Y-X)
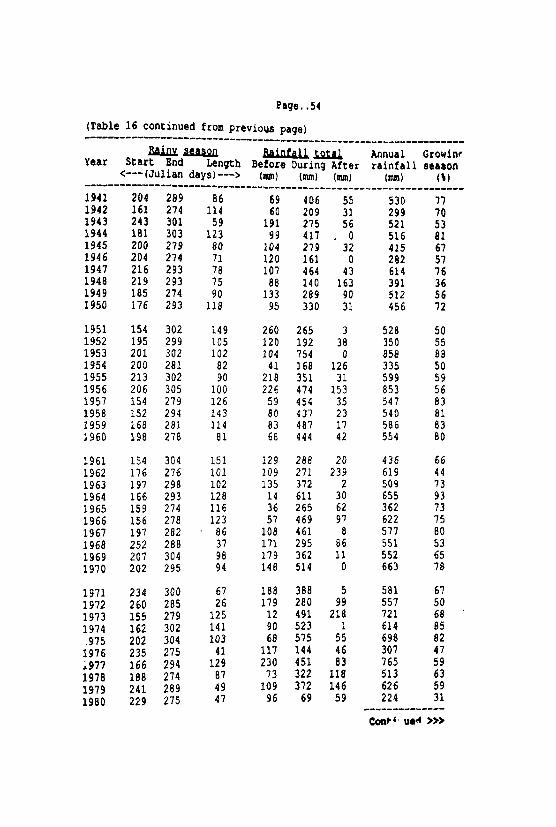
Page. -54
(Table 16 cont inued from previous page) -------------------------- --------------------*----*------------- uQ!Lseason Annual Growinr
Year S t a r t End Length Before During Af ter r a i n f a l l ssaaon c--- ( J u l i a n days) ---> (mm) (m) (M) ( b )
-----------------------------------------*-------*----------------
1941 204 289 86 69 406 55 530 77 1942 161 274 114 60 209 31 299 70 1943 243 301 59 191 275 56 521 53 1944 181 303 123 99 417 , 0 516 81 1945 200 279 80 104 279 32 435 67 1946 204 274 71 120 161 0 282 57 1947 216 293 78 107 464 43 614 76 1948 219 293 75 88 140 163 391 36 1949 185 274 90 133 289 90 512 56 1950 176 293 118 95 330 31 456 72
1951 154 302 149 260 265 3 528 5 0 1952 195 299 105 120 192 38 350 5 5 1953 201 302 102 104 754 0 858 8 8 1954 200 281 8 2 4 1 168 126 335 5 0 1955 213 302 90 218 351 31 599 5 9 1956 206 305 100 226 474 153 853 56 1957 154 279 126 59 454 35 54 7 8 3 1958 152 294 143 80 4 3 7 23 540 81 1959 168 281 114 83 487 17 586 8 3 1960 198 278 8 1 68 444 42 554 8 0

Page.. 55
(Table 16 continued from previous page) ----------------------------------------^-----"___-__--_-__----
BaLnvsbasan Beinfall- Annual Crowiacl Year Start End Length Before During After rainfall season
<--- (Julian days) ---> (rn) (mm) (Inn) tmm1 ................................................................. 1981 204 280 7 7 51 399 77 528 76 1982 190 274 85 192 148 284 624 24 1983 156 278 123 143 543 39 75 1984 194 285 92 25 130 21 725 176 74 1985 202 285 8 4 66 301 25 392 77 1986 155 283 129 22 366 47 435 84 1987 216 297 8 2 102 365 35 501 7 3 1988 152 285 134 112 793 9 914 8 7 1989 188 279 92 128 688 4 821 8 4 ................................................................ Mean 192' 288' 97 115 380 70 565 66 Max 261 305 151 260 793 284 975 93 Min 152 274 2 6 12 69 0 1?6 24 SdL 32 11 31 59 158 68 17 1 15 .................................................................. * Julian day 192 = July 11 * Julian day 288 = October 15

Page. .56
r .bh 11. Forward and b.ckrrrd hancapur (databr
2.9.3) --------------____-___ Forward accumu
Year s td . uk: 9w ------------------_---
*forward aacua la t lm rrCers to accuraulatlon of >?!I m of ra in fa l l from the atmdard reek l a . .std. wk.(stand.rd s o e k ) : Th* corrm8pondlng week r e u i v l n g s 5 a n and L20 sp ra ln fa l l r*sp.ct lvely .
.I taferm co che probabl l l ty prc -ntaqe .
.Backward a ~ l r t l o n r r l e r s t o backward accuaolatlon of .20 a of raLnfal1 from the standard week 5 9 .

Page. .57
( T a b l e 17 continued froar previoua p.qe) --------------------------------.----*------------- Forward a c s u W a t L o n Blckward aapuII la t lao
Year S t d . Wk. .b Std.Mh. * --"------------------------------------------------ 1961 2 6 64 4 4 3C 1961 2 6 65 4 4 15 1963 2 6 66 4 4 3 4 1964 2 6 60 4 4 3 3 1965 2 6 69 4 3 31 1966 I6 70 4 3 30 1Bbl 2 1 7 1 4 3 29 1968 2 7 73 43 20 1969 2a 7 4 4 3 3 c 1970 2 8 7 5 4 3 ' 2 5

Page. . 5 8
Table 18. Probability of dry spells f o r two consecutive, and three consecutive weeks at Ananrapur during the growing season (database: 1911-1989; section: 2.9.3). -_--------------------------------------
Std. Dry D ~ Y / D ~ Y E a &a i%?fLuL Wk . 2week 3 w e e k ---------------------------------------- Pre-rainy reason
Rainy searon

Page. .59
---- ------------- ------------ ---- nun if*&rd CV f i l l ~ IAN* AAIOIVC. # c M b l L t t y I&# .I. ~UIU - t u n
mth trp devlat lon 6 T o m IT! tq --,I.., ,-,,------ rcl (rqtr EI r c ~ ~ l o ~ pr 1 4 0 ~ 14-
---------------I------- .--.----.----..--.. -----.---- ~ . ~ v a r y 30.4 0.2 0.1 31.0 1 . 0 4 . loo 8) 0 o o
F . b n U r y 31.6 0.4 1.3 18.3 3.4 I . 100 $4 0 0 0
~ ~ c h 37.1 0.4 1.0 4 3.0 41.1 100 100 100 9 0
19.6 1.1 1.1 so., 1r .c 11.4 100, 100 100 I o

Page. .60
----------------- --̂ -.-.__- ^ ._.___- ---*-------- man A I M & ~ ~ CV Wlnlnu en* m o l r e trowbll lr) . I11 .I Y l n l w 'h#rItuN
W t h taw Q v l r t l o n Q T r g CCI mlniru ----I--------------------------
rcl (Id$ rcl ---------..---..,.-EL ---.- 6 ' ~ : ~ - r!ittttt~~oyOY.OY~:"c-"C"C~~ -..-.. --.
J U I .
July
A q u s t
Illpl88b81
act-r

Page.. 6 1
Table 21. Monthly statistics on heat units at Anantrpur, (database: 1911-1989; section: 3 . 3 )
Range Month Mean --------------,,---,__ Standard
Heat Maximum Minimum deviation units value va!ue C S Q , .........................................................
January 1 4 . 2 15 .0 12 .e 0 . 4
February 1 5 . 7 1 6 . 5 14.0 0 . 4
March 16.5 17.4 1 0 . 0 0 .0
April 1 8 . 7 1 9 . 3 15.5 0 . 6
May 19.2 19.6 10.0 1 . 2
June ' 1 8 . 8 1 9 . 0 17 .0 0 . 4
July 1 7 . 4 1 8 . 8 1 0 . 0 0 . 9
August 1 7 . 4 18 .4 10 .0 1 . 3
September 1 7 . 6 1 8 . 3 16.9 0 . 2
October 1 6 . 8 1 7 . 3 1 5 . 3 0 . 4
November 1 4 . 2 1 5 . 7 1 2 . 3 0 . 4
December 13.1 1 4 . 3 1 0 . 8 0 . 4 ________-__________------------------------------------- Annual 1 6 . 6 1 7 . 5 12.9 0.6
_^_________________-------------------------------------
Maximum upper limit of 34OC Minimum lower limit of 6OC Base temperature: 10°C

Page. .62
Table 22. Monthly s t a t i s t i c s on wind speed and wind direction a t Anantapur {database 1976-1989; sect ion: 4 .1 ) .
--------------------------------------------.------------ ~ ~ n t h Wind speed Wind direction
(Km h" ) _-_----------------------------- ......................... ~anuary 9 North East
~ebruary 8 North Erst
March 8 North East
Apr i 1
May
~ u n e . 18
July 2 0
August 20
September 11
North East
North East
South West
South West
South West
sou th west
October 6 North East
November 6 North East
December 8 North East
-----,-------,----------------------------------------------
Annual I1 -
.........................................................
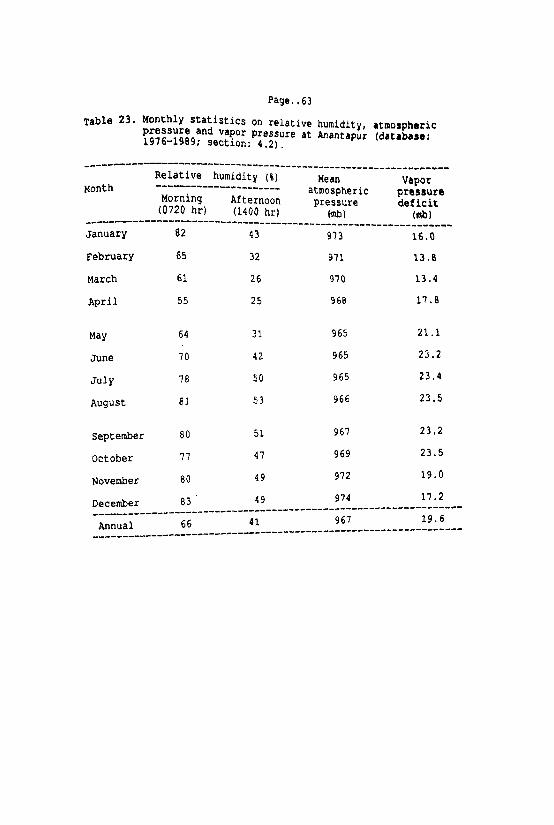
Page.. 63
Table 23. Monthly s t a t i s t i c s on relative humidity, atmospheric pressure and vapor Pressure a t bantapur (database: 1976-1989; section: 4.2).
______-------------------------- -------------------------------- Relative humidity (%) ------------------_--- Mean Vapor
Month atmospheric pressure Morning Afternoon pressure d e f i c i t (0720 hr ) (1400 hr) tmb (nb) ................................................................
~anuary 8 2 4 3 91 3 16.0
February 65 3 2 91 1 13.8
March 61 26 91 0 13.4
April 55 25 968 17.8
June 7 0 42 965 23.2
July 78 5 0 965 23.4
August 8 1 53 966 23.5
September 8 0 5 1 967 23.2
October 7 7 4 7 969 23.5
November 8 0 4 9 972 19.0
December 83 4 9 974 17.2 ................................................................ Annual 6 6 41 967 19.6
_____________C_____--------------------------------------------

Page. .64
able 24. Mean daily and monthly statistics for pm evaporation and Potential rvapotranspirstion at hantrpur ldrtrba8l 1911-1989; section: 4.3).
Manth . &a e- Daily Monthly Daily Monthly (mm) --_---------------_--- (mm) ( m f i ) (mm)
-------------------*-------------------
January 5.7 176.7 4.3 132.8
February 8.0 224.0 6.0 168.0
March 10.0 310.0 7.5 232.5
April 11.0 330.0 8.3 248.3
May 10.9 337.9 8.2 254.3
June 9.4 282.0 7.1 212.3
July 8.2 254.2 6.2 191.3
August 7.6 235.6 5.7 175.5
September 5.7
October 5.2 161.2 3.9 120.0
November 5.0 150.0 3.8 112.5
December 4.9
___________________---------------------------------e--------
Annual 7.6 210.0 5.8 174.5 ......................................................

Page. .65
Table 25. Monthly statistics on climatic water balance at Anantapur (database: 1976 -1989; section: 4 . 3 . 2 ) .
--------------------------------------------------*
Month Mean Mean Mean Mean Mean rainfall PET R/PETe DP HA1
tmm) (mm) (759) --------------------------------------------------- January 2.8 132.8 0.02' 1 0.007
February 3.9 168.0 0.02 1 0.006
March 4.5 232.5 0.02 1 0.004
April 14.4 248.3 0.06 4 0.016
June 52.9 212.3 0.25 27 0.127
July 60.2 191.3 0.31 16 0.084
August 74.4 175.5 0.42 18 0.103
September 144.5 131.3 1.10 62 0.472
October 101.7 120.0 0.85 35 0.292
November 42.6 112.5 0.38 7 0.062
December . 8.9 114.8 0.08 1 0.009 ___________--______-------------------_----_------- Annual 565.1 2093.6 - - - _______-___-____-__----------_--------------------- .R/PET Calculated as the ratio of rainfall to
potential evapotranspiration (PET).
(Moisture availability index) calculated as ratio of DP (Dependable precipitation) to potential evapotranspiration (PET) .

Page. . 66
fable 26. Wnkly climatic water balance at Anmtmpur ( d a t b a n : 1911-1919: sootlon: 4.3.3).
...--------*-------------------*-
Man Man b a n b a n k r n Man Man b a n Man Rain PET *E U I P I T DP HA1 Dmllclt Run-off 181~6 (a) (an) (m) (1st) (MI (.an) (an)
------------------.---------------------*---.*---------------*---.------------ 1 1.3 28.0 1.8 0.07 0.6 0.021 0.9 0.0 I. 2 1.2 29.0 1.3 0.04 0.6 0.021 0.7 0.0 1.. 3 0.3 31.0 1.2 0.04 0.8 0.026 0.1 0.0 0. 4 0.1 33.0 1.0 0.03 0.9 0.027 0.6 0.0 0. 5 2.3 36.0 1.6 0.04 0.5 0.014 0.3 0.3 1.2 6 0.3 39.0 1 . 5 0.04 0.0 0.000 O.'! 0.0 0. 1 0.1 42.0 1.3 0.03 0.2 0.007 0.) 0.0 0.1 0 0.0 44.0 1.4 0.03 0 . 0 0.000 0.1 0.0 0.1 9 0.9 47.0 1.7 0.04 0.6 0.005 0.1 0.0 0.1 10 0.5 50.0 1.4 0.03 0.7 0.014 0.1 0.0 0.1 11 0.6 52.0 1.5 0.03 0.7 0.013 G.1 0.0 0.0 12 1.2 54.0 1.1 0.04 0.7 0.013 0.1 0.0 0.0 13 2.5 55.0 3.5 0.06 0.7 0.013 0.3 0.0 0.0 14 2.2 56.0 3.2 0.06 0.8 0.014 0.3 0.0 0.0 15 2.6 57.0 3 . 6 0.06 0.8 0.014 0.4 0.0 0.0 16 4.7 58.0 5 . 5 0.10 0.9 0.016 0.6 0.0 0.4 11 3.1 58.0 4.7 0.09 0 . 9 0 .016 1 . 0 0.0 0.0 18 7.3 58.0 8.3 0.14 1.1 0.019 C.0 0.0 0.4
srm-rliny
root-rainy
Rain- 565.6 ra. per . pocmntlml ovapotrsnsplration; mz - ~ c t u r l ovmporatlon; - m r l o of .afurl wapormtlon and p t e n t i a l ~vapotranrpirrt im~ w - rn-10 prmcl itarion; mr . woisture a . v a i ~ J i l i t y 1nd.w lkficlt - 147.6 ri
o::o;l"-,:srr.) - 433.2 r.

Page. .67
Table 2 3 . nonthly statl8tlcs for cloudiness lunshrno haura. daylength and 1~1.r radiation ar inantap*r ldarabaaer 1911-1989; aectloni 5 . 0 ) .
----------------------------------.------.-----.-------------.-- nonch Cloudina8s Sunshine Paylenpth RbdlrtlOn
(Oktas) h mon-' h d~y.' h mln NJ\drL\yl -----------------.---------------------------------------------. January 2 279 9.0 .I2 O J 20.7
February 2 252 9.0 I2 OS 22 .7
March 2 310 10.0 12 15 23 .a
hpril 3 300 10.0 13 0'1 23.8
May s 310 10.0 11 12 2 3 . 0
Juna 6 210 7.0 1 3 1 J 19 .1
July 7 1 5 5 5 . 0 13 I0 1 6 . 7
AuqUJL 7 186 6 . 0 11 02 1 7 . J
Ssptmrhar 6 , 210 7 . 0 1 2 11 1 9 . 7
accabrr 6 2 4 8 8.0 13 0 3 1 9 . 1
November 4 2 4 1 0 . 0 12 07 1 8 . 7
Daccmbwr 3 3 4 8 8 . 0 I ? OD 1 9 . 7 _ _ _ _ _ _ _ _ _ _ _ _ _ _ _ _ _ _ _ - - - - % - - - - - - - - * - - - - - - - - - - - - - - - - - - - - - - - - - - - - -
Annul l 4 2 1 0 8.0 1 3 0 2 2 0 . 0 . . . . . . . . . . . . . . . . . . . . . . . . . . . . . . . . . . . . . . . . . . . . . . . . . . . . . . . . . . . . . .

Page. . 6 0 T l b l * 28. 1nltl.l and eondltlonal probability of ralnlall for
week 1 25 for Anantepuc sc+tlon recelvln nor* than 10 tun rrlnfall based on 79 yaarm of rainla11 dace (d*t.baa* 1911-19951; section? Lpp~ndlr A).
............................... ----------------.--------- Rainfall data
Year -----------,--- No. o r *~ohm ........................ Y*.k Ueok * 25 * 16 I urn * I D
-----------------------------------------------------*--- 1911 0 . 0 6.9 0 1912
0 1 1.8 1 7 . 8
1913 0 0 2
1.3 10.2 0 1914
0 0.0 3 . 3 0 0 3
1915 4 . 6 6 . 6 0 0 1916
3 2 . 5 2 8 . 5 0 0
1911 4
7 . 9 2 6 . 9 0 0 5 1918 0 . 8 25.5 0 0 6 1919 33.0 3.3 1 0 6 1920 6 . 6 7 . 1 1 0 6
42.6 0.0 0 . 0
PO. I 0.0
11.3 1.0 9.3 2.3 9.0

rage. .o9
ffeblr 2a contlnurd from prrvloua pago) -------------------------------------------------------- ~ainlall date NU. of work*
X m a L --------------- ------------------------ UH* Y O * ~ # 25 @ 3 6 w N I X WID

Page. - 7 0
Trblr 29. C a n u d l s c r i b u t l o n a t r a i n f a l l lor rrrk ) 25 far ?* y r r r 8 o f Anmncmpur ldacrbr8m
1911-1919: r roc lon: Appondlw 8 ) .
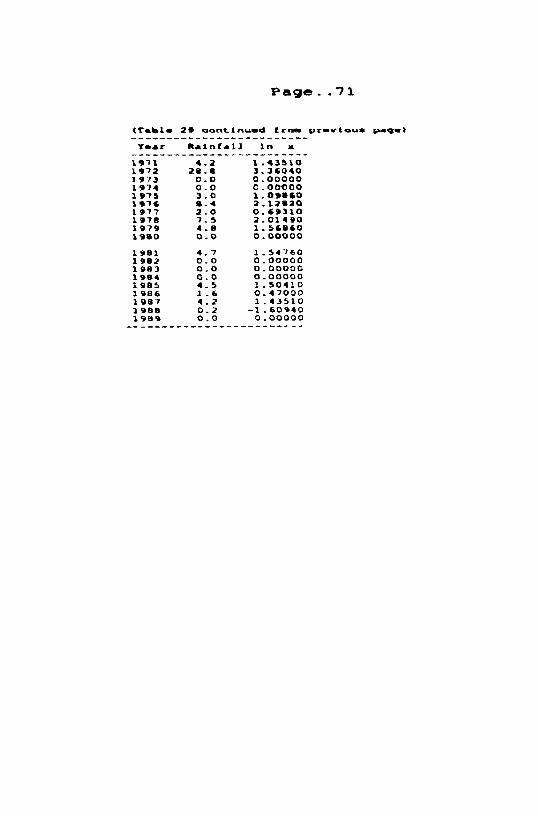
Page. -71
(Trhlr 2. auntlr\urd L r o r prrwloua pap-) ------------------------- lrsr Rainfall In at -------------------------

Page. . 7 2
Table 30. Comparison of rainfall characteristics of Mantaput rnd Hydrrrbad (database 1911-1989 tor Anantapur and 1901-1970 for Hydorrbadr section: Apprndix A ) .
Characteristics
1. Latitude
Locrt ion --------.------------------------------- Anantapur Hydrrrbrd
- - - - - - - - - - -*- - - - - - - -*- - - - - - - -m-*--- -m---
14' 41' 17' 21'
2. Longitude 77' 37' 77' 37'
3. Altitude (meters1 349 545
4. Mean rainfall (mn) 565 764
5. Dependable- precipitation (nun)
6. Mean potential- evapotranspiration Imm) 2094
7. Coefficient of variation ( \ I 3 0 2 6
8. Water holding capacity (m) 5 0 150
9. Thornthwaite moisture index -13.0 -56.5
10. Rainfall characteristics:
a. Start of the rainy season July 11 (+32)" June 12 (29)
b. End of the rainy season Oct 15 (2111 NOV 8 (A91
c. Length of the rainy serron 97 daya (t31) 130 days(il4) ___-______-___--_--------------~ $$ - Standard deviation.

FIGURES
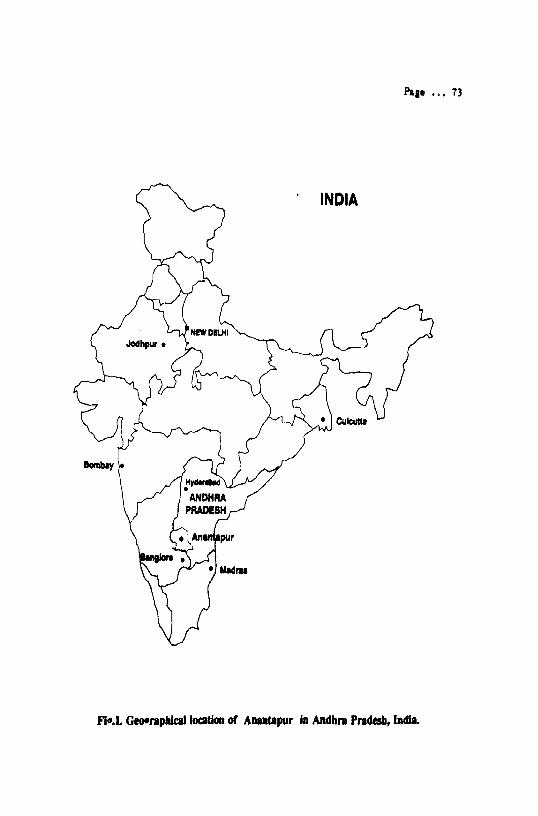
' INDIA

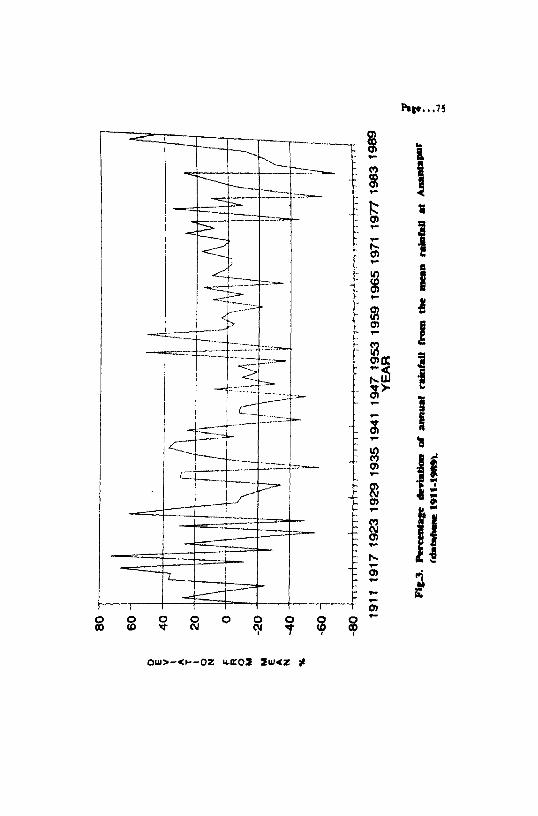


Age.. .79
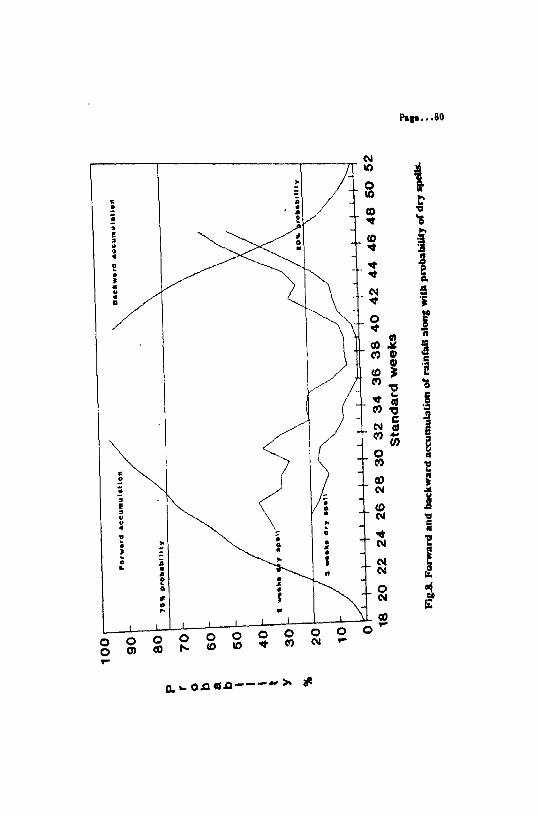

PET
PET/ 2
PET/X)
I3 15 17 19 21 23 25 27 29 31 33 35 37 39 41 43 46 47 49 Standard weeks


![[XLS] · Web viewIntl Network COUNTRY TYPE PROVIDER NAME CITY AREA CODE TEL NO FAX NO. Anantapur AASHA HOSPITAL(APOLLO HOSPITAL-ANANTAPUR) Hospital Door No 7/201 Court Road Anantapur](https://static.fdocuments.net/doc/165x107/5b1d438c7f8b9acf678b6e13/xls-web-viewintl-network-country-type-provider-name-city-area-code-tel-no.jpg)


