An amplified dusty star-forming galaxy at z=6: unveiling an ... · PDF fileAn amplified...
14
arXiv:1707.09022v2 [astro-ph.GA] 6 Nov 2017 An amplified dusty star-forming galaxy at z =6: unveiling an elusive population of galaxies Jorge A. Zavala 1∗ , Alfredo Monta˜ na 2 , David H. Hughes 1 , Min S. Yun 3 , R. J. Ivison 4,5 , Elisabetta Valiante 6 , David Wilner 7 , Justin Spilker 8 , Itziar Aretxaga 1 , Stephen Eales 6 , Vladimir Avila-Reese 9 , Miguel Ch´ avez 1 , Asantha Cooray 10 , Helmut Dannerbauer 11,12 , James S. Dunlop 5 , Loretta Dunne 5,6 , Arturo I. G ´ omez-Ruiz 2 , Michal J.Michalowski 13 , Gopal Narayanan 3 , Hooshang Nayyeri 10 , Ivan Oteo 5,4 , Daniel Rosa Gonz´ alez 1 , David S´ anchez-Arg¨ uelles 1 , Stephen Serjeant 14 , Matthew W. L. Smith 6 , Elena Terlevich 1 , Olga Vega 1 , Alan Villalba 1 , Paul van der Werf 15 , Grant W. Wilson 3 , Milagros Zeballos 1 1 Instituto Nacional de Astrof´ ısica, ´ Optica y Electr´ onica (INAOE), Luis Enrique Erro 1, 72840, Puebla, Mexico 2 CONACYT-Instituto Nacional de Astrof´ ısica, ´ Optica y Electr´ onica, Luis Enrique Erro 1, 72840, Puebla, Mexico 3 Department of Astronomy, University of Massachusetts, MA 01003, USA 4 European Southern Observatory, Karl Schwarzschild Strasse 2, Garching, Germany 5 Institute for Astronomy, University of Edinburgh, Royal Observatory, Blackford Hill, Edinburgh EH9 3HJ, UK 6 School of Physics and Astronomy, Cardiff University, The Parade, Cardiff CF24 3AA, UK 7 Harvard-Smithsonian Center for Astrophysics, 60 Garden Street, Cambridge, MA 02138, USA 8 Steward Observatory, University of Arizona, 933 North Cherry Avenue, Tucson, AZ 85721, USA 9 Instituto de Astronom´ ıa, Universidad Nacional Aut´ onoma de M´ exico, A.P. 70-264, 04510, CDMX, Mexico 10 Dept. of Physics & Astronomy, University of California, Irvine, CA 92697, USA 11 Instituto de Astrof´ ısica de Canarias (IAC), E-38205 La Laguna, Tenerife, Spain 12 Universidad de La Laguna, Dpto. Astrof´ ısica, E-38206 La Laguna, Tenerife, Spain 13 Astronomical Observatory Institute, Faculty of Physics, Adam Mickiewicz University, ul. Sloneczna 36, 60-286 Pozna´ n, Poland 14 Department of Physical Sciences, The Open University, Milton Keynes, MK7 6AA, UK 15 Leiden Observatory, Leiden University, P.O. Box 9513, NL-2300 RA Leiden, The Netherlands Since their discovery, submillimeter-selected galaxies 1,2 (SMGs) have revolutionized the field of galaxy formation and evolution. Hundreds of square degrees have been mapped at submillime- ter wavelengths 3–5 and notwithstanding the neg- ative K-correction in the submm bands 6 , where there is no significant loss of sensitivity to the de- tection of these sources up to z ∼ 10, only a hand- ful of sources have been confirmed to lie at z> 5 (ref. 7–11 ) and only two at z ≥ 6 (ref. 12, 13 ). All of these SMGs are rare examples of extreme star- burst galaxies with star formation rates (SFRs) of 1000 M ⊙ yr −1 and therefore are not repre- sentative of the general population of dusty star- forming galaxies. Consequently, our understand- ing of the nature of these sources, at the earli- est epochs, is still incomplete. Here we report the spectroscopic identification of a gravitation- ally amplified (μ =9.3 ± 1.0) dusty star-forming galaxy at z =6.027. After correcting for grav- itational lensing we derive an intrinsic SFR of 380 ± 50 M ⊙ yr −1 for this source, and find that its gas and dust properties are similar to those mea- sured for local Ultra Luminous Infrared Galaxies (ULIRGs), extending the local trends up to an un- explored territory at high redshift. This ULIRG- like galaxy at z =6 suggests a universal star- formation efficiency during the last 12.8 Gyr for dusty star-forming galaxies. HATLAS J090045.4+004125 (α = 09 h 00 m 45.8, δ = +00 ◦ 41 ′ 23 ′′ ; hereafter G09 83808, since it was detected in the GAMA 09hrs field) is part of a sub-sample of the Herschel ATLAS ‘500 μm-riser’ galaxies 14 with ultra-red far-infrared (FIR) colours of S 500μm /S 250μm > 2 and S 500μm /S 350μm > 1, 1
Transcript of An amplified dusty star-forming galaxy at z=6: unveiling an ... · PDF fileAn amplified...

arX
iv:1
707.
0902
2v2
[as
tro-
ph.G
A]
6 N
ov 2
017
An amplified dusty star-forming galaxy at z=6: unveiling an elusive
population of galaxies
Jorge A. Zavala1∗, Alfredo Montana2, David H. Hughes1, Min S. Yun3, R. J. Ivison4,5, Elisabetta Valiante6,
David Wilner7, Justin Spilker8, Itziar Aretxaga1, Stephen Eales6, Vladimir Avila-Reese9, Miguel Chavez1,
Asantha Cooray10, Helmut Dannerbauer11,12 , James S. Dunlop5, Loretta Dunne5,6, Arturo I. Gomez-Ruiz2,
Michał J.Michałowski13 , Gopal Narayanan3, Hooshang Nayyeri10, Ivan Oteo5,4, Daniel Rosa Gonzalez1,
David Sanchez-Arguelles1 , Stephen Serjeant14, Matthew W. L. Smith6, Elena Terlevich1, Olga Vega1, Alan
Villalba1, Paul van der Werf15, Grant W. Wilson3, Milagros Zeballos1
1Instituto Nacional de Astrofısica, Optica y Electronica (INAOE), Luis Enrique Erro 1, 72840, Puebla, Mexico2CONACYT-Instituto Nacional de Astrofısica, Optica y Electronica, Luis Enrique Erro 1, 72840, Puebla, Mexico3Department of Astronomy, University of Massachusetts, MA 01003, USA4European Southern Observatory, Karl Schwarzschild Strasse 2, Garching, Germany5Institute for Astronomy, University of Edinburgh, Royal Observatory, Blackford Hill, Edinburgh EH9 3HJ, UK6School of Physics and Astronomy, Cardiff University, The Parade, Cardiff CF24 3AA, UK7Harvard-Smithsonian Center for Astrophysics, 60 Garden Street, Cambridge, MA 02138, USA8Steward Observatory, University of Arizona, 933 North Cherry Avenue, Tucson, AZ 85721, USA9Instituto de Astronomıa, Universidad Nacional Autonoma de Mexico, A.P. 70-264, 04510, CDMX, Mexico10Dept. of Physics & Astronomy, University of California, Irvine, CA 92697, USA11Instituto de Astrofısica de Canarias (IAC), E-38205 La Laguna, Tenerife, Spain12Universidad de La Laguna, Dpto. Astrofısica, E-38206 La Laguna, Tenerife, Spain13Astronomical Observatory Institute, Faculty of Physics, Adam Mickiewicz University, ul. Słoneczna 36, 60-286
Poznan, Poland14Department of Physical Sciences, The Open University, Milton Keynes, MK7 6AA, UK15Leiden Observatory, Leiden University, P.O. Box 9513, NL-2300 RA Leiden, The Netherlands
Since their discovery, submillimeter-selected
galaxies1, 2 (SMGs) have revolutionized the field
of galaxy formation and evolution. Hundreds of
square degrees have been mapped at submillime-
ter wavelengths3–5 and notwithstanding the neg-
ative K-correction in the submm bands6, where
there is no significant loss of sensitivity to the de-
tection of these sources up to z ∼ 10, only a hand-
ful of sources have been confirmed to lie at z > 5(ref.7–11) and only two at z ≥ 6 (ref.12, 13). All of
these SMGs are rare examples of extreme star-
burst galaxies with star formation rates (SFRs)
of & 1000 M⊙ yr−1 and therefore are not repre-
sentative of the general population of dusty star-
forming galaxies. Consequently, our understand-
ing of the nature of these sources, at the earli-
est epochs, is still incomplete. Here we report
the spectroscopic identification of a gravitation-
ally amplified (µ = 9.3 ± 1.0) dusty star-forming
galaxy at z = 6.027. After correcting for grav-
itational lensing we derive an intrinsic SFR of
380±50 M⊙ yr−1 for this source, and find that its
gas and dust properties are similar to those mea-
sured for local Ultra Luminous Infrared Galaxies
(ULIRGs), extending the local trends up to an un-
explored territory at high redshift. This ULIRG-
like galaxy at z = 6 suggests a universal star-
formation efficiency during the last 12.8 Gyr for
dusty star-forming galaxies.
HATLAS J090045.4+004125 (α = 09h00m45.8,
δ = +00◦41′23′′; hereafter G09 83808, since it
was detected in the GAMA 09hrs field) is part of a
sub-sample of the Herschel ATLAS ‘500 µm-riser’
galaxies14 with ultra-red far-infrared (FIR) colours
of S500µm/S250µm > 2 and S500µm/S350µm > 1,
1

with a flux density threshold of S500µm < 80 mJy.
The FIR colours of this source are consistent with
thermal dust emission redshifted to z > 4 and
represent a relatively simple selection criterium to
find high-redshift galaxies. A similar selection al-
lowed the identification of HFLS312, an extreme star-
burst galaxy (even after corrected for gravitational
amplification15) at z = 6.3, in the HerMES blank
field survey3.
G09 83808 was observed, among other ultrared-
Herschel dusty star-forming galaxies, as part of a
follow-up program with the Large Millimeter Tele-
scope Alfonso Serrano (LMT) using the AzTEC
camera, in order to obtain higher angular resolution
(∼ 8.5 arcsec) continuum observations at 1.1 mm.
A sub-sample of those galaxies detected as a single
source in the AzTEC images (i.e. with no evidence
of multiple components) and with photometric red-
shifts of > 4, was selected for spectroscopic obser-
vations in the 3 mm band using the Redshift Search
Receiver (RSR) on the LMT. In the LMT/RSR spec-
trum of G09 83808 we identify three emission lines
corresponding to 12CO(6 − 5), 12CO(5 − 4), and
H2O(211 − 202) (see Fig. 1). Based on these lines
we unambiguously determine the galaxy redshift to
be z = 6.0269 ± 0.0006 (i.e. when the Universe
was just 900 million years old). Follow-up observa-
tions with the SMA telescope confirm this solution
through the detection of the redshifted [CII] ionized
carbon line at 270.35 GHz (Fig. 1).
High-angular resolution observations (0.24 arcsec×0.13 arcsec, corresponding to a physical scale of
∼ 1 kpc at this redshift) taken with the Atacama
Large Millimeter/submillimeter Array (ALMA) at
∼ 890 µm reveal a double arc structure (in a par-
tial Einstein ring configuration of radius ∼ 1.4 arc-
sec) around a foreground galaxy at z = 0.776 (see
Fig. 2), implying strong gravitational amplification
of the high-redshift background galaxy. Using these
ALMA continuum observations to constrain the ef-
fects of gravitational lensing, modelling directly the
visibilities in the uv plane (see Methods section for
additional details), we derive a gravitational amplifi-
cation factor of µ = 9.3 ± 1.0. This amplification
factor is used to derive the intrinsic physical proper-
ties of G09 83808.
Using the Herschel 250, 350, and 500 µmphotometry14, combined with the SCUBA-2 850
µm14 imaging and our AzTEC 1.1 mm observa-
tions (see Table 1), we model the continuum spec-
tral energy distribution (SED; see Figure 3). We
estimate an infrared (IR, 8 − 1000 µm) luminos-
ity, LIR, of 3.8 ± 0.5 × 10¹² L⊙ (corrected for
gravitational magnification) which implies a SFRa of
380± 50 M⊙yr−1 (see Methods section for more in-
formation). This implies that G09 83808 is a member
of the Ultra Luminous Infrared Galaxy (ULIRGs16)
population. This is the only SMG with an un-
ambiguous spectroscopic redshift in this luminos-
ity range at z & 5, lying between the extreme ob-
scured starbursts7–9, 12, 13 (& 1000 M⊙ yr−1) discov-
ered at submm wavelengths and the UV/optical se-
lected star-forming galaxies with follow-up detec-
tions at submm wavelengths17–19 (. 100 M⊙ yr−1).
Although these galaxies are unreachable with the
current generation of submm wide-area surveys3, 4
without the benefit of gravitational amplification,
they can be found in the deepest surveys recently
achieved with ground-based telescopes, such as the
James Clerk Maxwell Telescope (JCMT) SCUBA-2
Cosmology Legacy Survey (S2CLS). However, none
of them has yet been spectroscopically confirmed.
With the caveat of using the position of the dust
SED peak as an estimation of redshift, a study based
on S2CLS observations5 has derived a comoving
space density of 3.2× 10⁻⁶ Mpc−3 for sources with
300 < SFR < 1000 M⊙ yr−1 at 5 < z . 6 (i.e.
in the range probed by our galaxy). With a duty-
cycle correction of ≈ 40 Myr, as the gas depletion
time scale measured for G09 83808 (see below) and
other galaxies12, we estimate the corrected comov-
ing space density of this population of galaxies to be
≈ 2× 10⁻⁵ Mpc−3, which perfectly matches that of
massive quiescent galaxies at z ≈ 3 − 4 (refs.20).
This suggests, that these ULIRG-type galaxies at
5 . z . 6 are the progenitors of these quiescent
aHere we will use SFR to refer to the dust-obscured SFR
2

galaxies, which cannot be explained only by the rare
extreme starburst (like HFLS3), since they are an or-
der of magnitude less abundant14 .
Based on the CO lines detected in the LMT/RSR
spectrum we derive a molecular gas mass of
M(H2) = 1.6±0.6×10¹⁰ M⊙ (see Methods section
for details). This implies a gas depletion timescale
of M(H2)/SFR ≈ 40 Myr, consistent with the
value found for other SMGs at lower redshifts with
ULIRG-luminosity22. G09 83808 shows a remark-
able large gas mass fraction of fgas = MH2/Mdyn ∼
60% (see Methods secction), among the largest mea-
sured for star forming galaxies at z ≈ 2 − 3 (ref.21). The CO(6-5)/CO(5-4) line luminosity ratio of
0.4 ± 0.1 is in agreement with local ULIRGs (al-
though lower than the average24), and implies a CO
ladder peaking at J≤ 5 (i.e. less excited than AGN-
dominated galaxies23). These two CO transitions,
as well as the H2O line, lie (within the error bars)
on their respective FIR/IR-line luminosity relations
(LFIR ∝ L0.93CO(6−5), LFIR ∝ L0.97
CO(5−4), and LH2O ∝
L1.16IR ) found for local ULIRGs and lower redshifts
SMGs24, 25. The star-formation efficiency (SFE) of
our galaxy, estimated through the L′
CO−LIR relation
(which describes the relationship between the lumi-
nosity due to star formation and the gas content), is
similar to local (U)LIRGs (see Fig. 4). This suggests
a universal SFE across several decades of molecular
gas masses from z = 6 to z ∼ 0 (i.e., during the last
12.8 Gyr of the Universe) for this kind of galaxies
(although some works26 have reported a slight evo-
lution of the SFE with redshift). In addition, the esti-
mated dust mass of Md = 1.9±0.4×10⁸ M⊙ results
in a gas-to-dust ratio, δGDR, of 80 ± 30. This is in
agreement with the value estimated for HFLS312 and
also with local (U)LIRGs27 (δGDR = 120 ± 28).
The luminosity of the [CII] ionized carbon line de-
tected with the SMA is 1.3 ± 0.4 × 10⁹ L⊙ which
corresponds to a [CII]/FIR ratio of 3.4± 1.1× 10⁻⁴,
a value that is among the lowest measured for lo-
cal (U)LIRGs and SMGs. As shown in Figure 4,
our source follows the same [CII] deficiency trend
measured for local LIRGS28 extending it to LFIR &
1012 L⊙ and up to z = 6. The [CII]/FIR ratio of G09
83808 is also consistent with the lowest values mea-
sured for lower-redshift SMGs and lies on a region
where SMGs and AGN-host galaxies converge (Fig.
4). It may be the case that other SMGs suffer from
gravitiational amplification, which could help to re-
duce the large scatter since many of these galaxies
should fall along the LIRG relation when corrected
for magnification. However, the intrinsic scatter in
the relation is high28, even for the local sample, and
therefore, larger samples of SMGs are required to
derive conclusions about the origin of the [CII] de-
ficiency.
We confirm the existence of ULIRG-like galaxies
within the first billion years of Universe’s history.
These sources may be more representative of the
dusty star-forming galaxy population at these epochs
than the extreme starbursts previously discovered.
Four emission-line-selected galaxies with similar lu-
minosities and redshifts have been recently found
around quasars29 (with the caveat of using just one
line for redshift determination), however, the prop-
erties of these sources may be affected by the com-
panion quasar and therefore not representative of the
whole population. Although G09 83808 shows sim-
ilar properties to those measured in lower-redshift
SMGs, its higher dust temperature (Td = 49 ± 3 K)
and compact morphology (R1/2 = 0.6 ± 0.1 kpc)
resemble that of local ULIRGs. For comparison,
typical UV/optically-selected star-forming galaxies
at z ∼ 6 have SFRs ∼ 10 times lower and radii
∼ 1.7 times larger than G09 8380830. This study is
hence crucial for understanding the evolutionary path
of SMGs and their link with local galaxies. Although
a larger sample is needed to statistically estimate the
properties of these sources and their contribution to
the cosmic star formation history, this galaxy sug-
gests that star formation in dusty star-forming galax-
ies has been driven by similar physical processes dur-
ing the last ∼ 12.8 Gyr .
3

Correspondence Correspondence and requests for
materials should be addressed to JAZ (email:
Acknowledgements We thank Ian Smail for insightful
comments that improved the quality of the paper. JAZ
acknowledges support from a mexican CONACyT stu-
dentship. RJI, LD and IO acknowledge support from
ERC in the form of the Advanced Investigator Pro-
gramme, 321302, COSMICISM. LD additionally ac-
knowledges support from the ERC Consolidator Grant
CosmicDust. HD acknowledges financial support from
the Spanish Ministry of Economy and Competitiveness
(MINECO) under the 2014 Ramon y Cajal program
MINECO RYC-2014-15686. MJM acknowledges the
support of the National Science Centre, Poland through
the POLONEZ grant 2015/19/P/ST9/04010 and the Euro-
pean Union’s Horizon 2020 research and innovation pro-
gramme under the Marie Skłodowska-Curie grant agree-
ment No. 665778. This work would not have been pos-
sible without the long-term financial support from the
Mexican CONACyT during the construction and early
operational phase of the Large Millimeter Telescope Al-
fonso Serrano, as well as support from the US Na-
tional Science Foundation via the University Radio Ob-
servatory program, the Instituto Nacional de Astrofısica,
Optica y Electronica (INAOE), and the University of Mas-
sachusetts (UMass). The Submillimeter Array is a joint
project between the Smithsonian Astrophysical Observa-
tory and the Academia Sinica Institute of Astronomy and
Astrophysics and is funded by the Smithsonian Institution
and the Academia Sinica. ALMA is a partnership of ESO
(representing its member states), NSF (USA) and NINS
(Japan), together with NRC (Canada), MOST and ASIAA
(Taiwan), and KASI (Republic of Korea), in cooperation
with the Republic of Chile. The Joint ALMA Observatory
is operated by ESO, AUI/NRAO and NAOJ.
Author Contributions JAZ led the scientific analysis
and the writing of the paper, as well as the SMA follow-
up proposal. RJI, EV, SE, AC, HD, JSD, LD, MJM, SS,
MWLS, and PW have contributed to the original Herschel
proposals and source selection of the red sources, where
this source was originally identify. AM, DHH, EV, IA,
VAR, MC, DRG, ET, and OV performed the selection of
the sample for the LMT observations and lead the LMT
proposals. MSY, GN, GW, DSA, AV, and MZ carried
out LMT data reduction and interpretation. DW, MY, and
AIGR assisted with the SMA observations and data reduc-
tion. JS, IO, HN have contributed to the data analysis and
to fitting and modeling the results. All the authors have
discussed and contributed to this manuscript.
Competing Interests The authors declare that they
have no competing financial interests.
REFERENCES
1. Smail, I. et. al. A Deep Sub-millimeter Survey of
Lensing Clusters: A New Window on Galaxy For-
mation and Evolution. Astrophys. J. Lett. 490 L5-L8
(1997).
2. Hughes, D. et. al. High-redshift star formation in
the Hubble Deep Field revealed by a submillimetre-
wavelength survey. Nature 394, 241-247 (1998).
3. Oliver S. et. al. The Herschel Multi-tiered Extragalac-
tic Survey: HerMES. Mon. Not. R. Astron. Soc. 424,
1614-1635 (2012).
4. Valiante E. et. al. The Herschel-ATLAS data release 1
- I. Maps, catalogues and number counts. Mon. Not. R.
Astron. Soc. 462, 3146-3179 (2016).
5. Michałowski, M. et. al. The SCUBA-2 Cosmology
Legacy Survey: the nature of bright submm galaxies
from 2 deg2 of 850-um imaging. Mon. Not. R. Astron.
Soc.; arXiv preprint: 1610.02409 (2017).
6. Blain, A. & Longair, M. Submillimetre cosmology.
Mon. Not. R. Astron. Soc. 264, 509-521 (1993).
7. Capak, P. et. al. A massive protocluster of galaxies at
a redshift of z ∼ 5.3. Nature 470 233-235 (2011).
8. Combes, F. et. al. A bright z = 5.2 lensed
submillimeter galaxy in the field of Abell 773.
HLSJ091828.6+514223. Astron. Astrophys. Lett. 538,
L4 (2012).
9. Walter, F. et. al. The intense starburst HDF850.1 in a
galaxy overdensity at z=5.2 in the Hubble Deep Field.
Nature 486, 233-236 (2012).
10. Ma, J. et. al. Stellar Masses and Star Formation Rates
of Lensed, Dusty, Star-forming Galaxies from the SPT
Survey. Astrophys. J. 812, 88-104 (2015).
11. Riechers, D. et. al. Rise of the Titans: A Dusty,
Hyper-Luminous ‘870 micron riser’ Galaxy at z˜6. As-
trophys. J. arXiv preprint: 1705.09660 (2017).
12. Riechers, D. et. al. A Dust-Obscured Massive
Maximum-Starburst Galaxy at a Redshift of 6.34. Na-
ture 496, 329-333 (2013).
13. Strandet, M. et. al. ISM properties of a Massive Dusty
Star-Forming Galaxy discovered at z ˜ 7. Astrophys. J.
Lett. arXiv preprint: 1705.07912 (2017).
14. Ivison, R. et. al. The Space Density of Luminous
Dusty Star-forming Galaxies at z > 4: SCUBA-
2 and LABOCA Imaging of Ultrared Galaxies from
Herschel-ATLAS. Astrophys. J. 832, 78- (2016).
4

15. Cooray, A. et. al. HerMES: The Rest-frame UV
Emission and a Lensing Model for the z = 6.34 Lu-
minous Dusty Starburst Galaxy HFLS3. Astrophys. J.
790, 40- (2014).
16. Sanders, D & Mirabel, I. Luminous Infrared Galax-
ies. Ann. Rev. Astron. Astrophys. 34, 749- (1996).
17. Capak, P. et. al. Galaxies at redshifts 5 to 6 with sys-
tematically low dust content and high [C II] emission
Nature 522 455-458 (2015).
18. Watson, D. et. al. A dusty, normal galaxy in the epoch
of reionization. Nature. 519, 327-330 (2015).
19. Willott, C., Carilli, C., Wagg, J. & Wang, R. Star
Formation and the interstellar medium in z > 6 UV-
luminous Lyman-break galaxies. Astrophys. J. 807,
180- (2015).
20. Straatman, C. et. al. The Sizes of Massive Quiescent
and Star-forming Galaxies at z ∼ 4 with ZFOURGE
and CANDELS. Astrophys. J. Lett. 808, L29- (2015).
21. Tacconi, L. et. al. High molecular gas fractions in
normal massive star forming galaxies in the young
Universe. Nature. 463, 781-784 (2010).
22. Bothwell, M. et. al. A survey of molecular gas in lu-
minous sub-millimetre galaxies. Mon. Not. R. Astron.
Soc. 429, 3047-3067 (2013).
23. Carilli, C. & Walter, F. Cool Gas in High-Redshift
Galaxies. Ann. Rev. Astron. Astrophys. 51, 105-161
(2013).
24. Greve, T. et. al. Star Formation Relations and CO
Spectral Line Energy Distributions across the J-ladder
and Redshift. Astrophys. J. 794, 142- (2014).
25. Yang, C. et. al. Submillimeter H2O and
H2O+emission in lensed ultra- and hyper-luminous
infrared galaxies at z = 2− 4. Astron. Astrophys. 595,
80- (2016).
26. Scoville, N. et. al. Evolution of Interstellar Medium,
Star Formation, and Accretion at High Redshift. As-
trophys. J. 837, 150- (2017).
27. Wilson, C. et. al. Luminous Infrared Galaxies with
the Submillimeter Array. I. Survey Overview and the
Central Gas to Dust Ratio. Astrophys. J. Suppl. Ser.
178, 189-224 (2008).
28. Dıaz-Santos, T. et. al. Explaining the [C II]157.7 µm
Deficit in Luminous Infrared Galaxies - First Results
from a Herschel/PACS Study of the GOALS Sample.
Astrophys. J. 774, 68- (2013).
29. Decarli, R. et al. Rapidly star-forming galaxies adja-
cent to quasars at redshifts exceeding 6. Nature. arXiv
preprint:1705.08662 (2017).
30. Rodriguez-Puebla, A, Primack, J., Avila-Reese, V.
& Faber, S. Constraining the galaxy-halo connection
over the last 13.3 Gyr: star formation histories, galaxy
mergers and structural properties. Mon. Not. R. Astron.
Soc. arXiv preprint:1703.04542 (2017).
5

a)
b) c) d) e)
Figure 1: Identification of molecular emission lines and redshift derivation. a), Wide-band Redshift
Search Receiver (RSR) 3 mm spectrum of G09 83808 taken with the Large Millimeter Telescope
(LMT). The transitions detected above S/N = 5 are marked with vertical dashed lines, and corre-
spond to 12CO(5-4), 12CO(6-5), and H2O(211−202) at z = 6.0269±0.0006. The spectrum has been
rebinned into 2 pixels bins (∼ 200km/s) for better visualization. b), c), d), LMT/RSR raw spectra at
the position of the detected lines along with the best-fitting Gaussian profiles. e), SMA spectrum
centered at the position of the detected line. The x-axes is in velocity offset with respect to the
derived redshift of z = 6.0269. The derived properties of the lines are reported in Table 1.
6
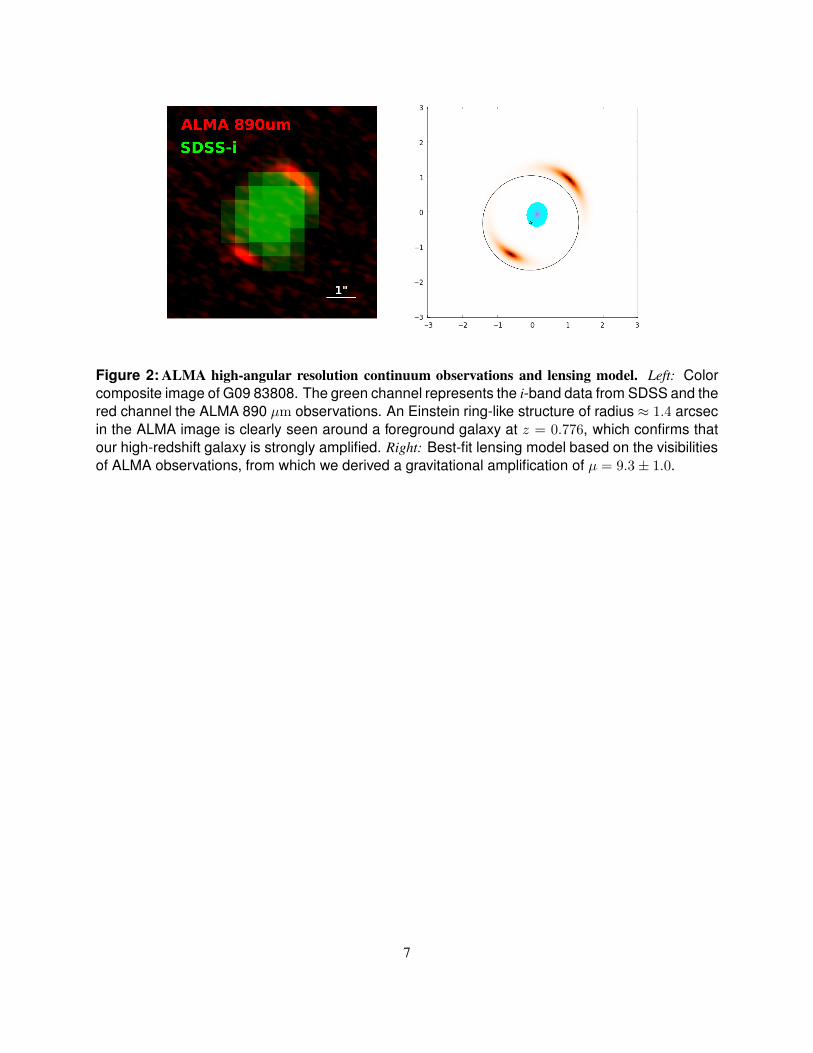
Figure 2: ALMA high-angular resolution continuum observations and lensing model. Left: Color
composite image of G09 83808. The green channel represents the i-band data from SDSS and the
red channel the ALMA 890 µm observations. An Einstein ring-like structure of radius ≈ 1.4 arcsec
in the ALMA image is clearly seen around a foreground galaxy at z = 0.776, which confirms that
our high-redshift galaxy is strongly amplified. Right: Best-fit lensing model based on the visibilities
of ALMA observations, from which we derived a gravitational amplification of µ = 9.3± 1.0.
7

Figure 3: Photometry and spectral energy distribution (SED). De-magnified (with µ = 9.3 ± 1.0)
flux densities at 250, 350, 500, 850 and 1100 µm from Herschel/SPIRE, JCMT/SCUBA-2, and
AzTEC/LMT are represented by the blue circles. These flux densities were fitted with different
SED templates, including: Arp220, Cosmic Eyelash, two average SMG templates, an average 24
µm-selected star-forming galaxy template, and a modified black body (MBB, see Methods section
for details). We achieve the lowest χ2 with the Arp220 template, from which we derive an IR
luminosity of 3.8 ± 0.5 × 10¹² (corrected for magnification). From the best-fit modified black body
distribution we derive a dust temperature of 49 ± 3 K. As discussed in the Methods section, the
CMB effects are not significant.
8

Figure 4: Star formation efficiency and [CII] deficiency. Left: Lens-corrected CO(1-0) luminosity
versus IR luminosity (L′
CO(1−0) − LIR) as a proxy for the star-formation efficiency of G09 83808.
For comparison, local LIRGS31, ULIRGS32, and lower-redshift SMGs22,33 are plotted along with
the best-fit relation to the three samples22. As can be seen, G09 83808 falls on the same rela-
tion (as well as HFLS312 after correcting for magnification15), which suggests that the same star
formation efficiency holds from z ∼ 0 to z = 6 (i.e. during the last ∼ 12.8 Gyr). The empty cir-
cle represents the position of our source if no lensing amplification correction is applied. Right:
[CII]/FIR versus de-magnified (filled circle) and amplified (empty circle) FIR luminosity for G09
83808. For comparison, we also plot a sample of (U)LIRG galaxies from the Great Observatories
All-sky Survey (GOALS28), and a compilation of high-redshift sources45 that includes SMGs and
AGN-dominated sources. Our source follows the same trend as local (U)LIRGs and lies in a region
between lower-redshift SMGs and AGNs.
Table 1: Measured spectral line and continuum properties (not corrected for gravitational amplifica-
tion).
Transition Photometrya
CO(5-4) CO(6-5) H2O(211 − 202) [CII] [µm] [mJy]
νobs [GHz] 82.031± 0.007 98.41± 0.01 106.993± 0.007 270.35± 0.03 250 9.7± 5.4FWHM [km s−1] 490± 60 320± 70 240± 40 400± 70 350 24.6± 7.9Sint [Jy km s−1] 1.6± 0.3 0.9± 0.3 0.8± 0.2 13.8± 3.0 500 44.0± 8.2L′ [1010 K km s−1 pc−2] 7.6± 1.2 2.9± 0.8 2.3± 0.5 6.1± 1.3 850 36.0± 3.1
1100 20.0± 1.0aThe flux densities at 250, 350, 500, and 850 µm were taken from ref.14
9

Methods
1 Observations and data reduction
1.1 LMT observations
Continuum and spectroscopic observations were
obtained using the Large Millimeter Telescope
(LMT34, PI: D. Hughes), located on the summit
of Volcan Sierra Negra (Tliltepetl), Mexico, at ∼4600 m.a.s.l. Observations were carried out dur-
ing the Early Science Phase of the telescope us-
ing the 1.1 mm continuum camera, AzTEC35, and
the 3 mm spectrograph, Redshift Search Receiver
(RSR36). During these observations only the inner
32-m diameter region of the telescope active surface
was illuminated, which provided an effective beam
size of ≈ 8.5 arcsec at 1.1 mm and between 20− 28arcsec in the RSR 3 mm window (75 GHz - 110
GHz).
AzTEC observations were performed on 2014
November 10 with an opacity of τ225 = 0.07 and
total on-source integration time of 11 min. Data re-
duction were done following the AzTEC Standard
Pipeline37. G09 83808 was detected with a S/N ≈ 20with a flux density of S1.1mm = 20.0±1.0 mJy. RSR
observations were subsequently taken at the AzTEC
position in two different periods: February 2016 and
February 2017, along five different nights with an
opacity range of τ225 = 0.05 − 0.15 and a total inte-
gration time of 8 hrs. Pointing observations on bright
millimetre sources were done every hour. Data re-
duction was performed using the Data Reduction and
Analysis Methods in Python (DREAMPY). The final
spectra were obtained by averaging all scans using
1/σ2 weights after flagging bad data. Finally, to con-
vert from antenna temperature units to flux, a factor
of 7 Jy K−1 was used38. The final spectrum shows
three lines detected at S/N & 5 associated to CO(6-
5), CO(5-4) and H2O(211 − 202) at z = 6.0269. A
cross-correlation template analysis38 also identifies
this redshift as the best solution with a S/N = 9.1.
Figure 1 shows the final spectrum after a Savitzky-
Golay filter39 has been applied for better visualiza-
tion (the filter does not modified any of the properties
of the detected lines).
At the redshift of our source the [CII] 158 µm line
(see below) falls within the AzTEC band pass and
then contributes to the total flux density measured at
1.1 mm. However, the contamination from the line
is measured to be less than 2 per cent. Even if the
[CII] line luminosity was as high as 1 per cent of the
total IR luminosity, the contamination to the AzTEC
measurement would be only ∼ 6 per cent, which is
similar to the absolute flux calibration uncertainty.
Therefore, and at least for this source, the contami-
nation of the emission line to the 1.1 mm continuum
flux density is less important than anticipated40 .
1.2 SMA observations
G09 83808 was observed with the Submillimeter Ar-
ray (SMA, PI: J. Zavala) on Mauna Kea, Hawaii, on
2017 April 03. The weather conditions were good,
with an average atmospheric opacity of τ225 = 0.07and stable phase. The seven available array antennas
were in a compact configuration that provided base-
line lengths from 8 to 77 meters. The ‘345’ receiver
set was tuned to provide spectral coverage ±(4 −12) GHz from a LO frequency of 277.5 GHz, specifi-
cally to span a broad range around the estimated (red-
shifted) [CII] line frequency of ∼ 270.5 GHz in the
lower sideband. The SWARM correlator provided
uniform channel spacing of 140 kHz (∼0.16 km s−1)
over the full bandwidth. The usable field of view is
set by the FWHM primary beam size of ∼ 47 arcsec
at this frequency.
The basic observing sequence consisted of a loop of
2 minutes each on the gain calibrators J0909+013
(1.57 Jy) and J0831+044 (0.47 Jy) and 17.5 min-
utes on G09 83808. The track spanned an hour an-
gle range of −0.8 to 4.8 for the target source. Pass-
band calibration was obtained with observations of
the strong quasar 3C279. The absolute flux scale
was set using observations of Callisto, with an es-
timated accuracy of 20%. All of the basic calibration
steps were performed using standard procedures in
the MIR software package. The calibrated visibili-
ties were exported to the MIRIAD software package
for imaging and deconvolution. Within MIRIAD,
the task uvaver was used to combine the 4 corre-
lator windows of the lower sideband and to resam-
10

ple the visibilities to 50 km s−1 spectral resolution.
The task uvlin was used for continuum subtrac-
tion, using a linear fit to line-free channel ranges in
the band. The task invert provided Fourier inver-
sion for both continuum and spectral line imaging,
followed by clean for deconvolution. The synthe-
sized beam size obtained with natural weighting was
2.5′′
× 2.3′′
, p.a. 82◦ for the spectral line data cube,
with rms noise 7.1 mJy per 50 km s−1 bin. The final
spectrum (see Fig. 1) was then extracted from a rect-
angular region that comprise all the continuum emis-
sion. We measured the continuum flux density of the
source to be 21.5 ± 3 mJy, in very good agreement
with the AzTEC photometry.
2 Lensing model
The lens model was created using the publicly-
available visilens code41; details of the code are
given in that work. Briefly, the lens mass profile
is parameterized as a Singular Isothermal Ellipsoid,
and the background source is modeled with a sin-
gle elliptical Sersic profile. The parameter space is
explored using a Markov Chain Monte Carlo sam-
pling method, generating a model lensed image at
each proposed combination of lens and source pa-
rameters. The redshift of both sources is fixed at
z = 0.776 (based on X-Shooter/VLT observations42)
and z = 6.027, respectively. Because pixel val-
ues in interferometric images are correlated and sub-
ject to difficult-to-model residual calibration errors,
the proposed model image is inverted to the visibil-
ity domain and sampled at the uv coordinates of the
ALMA data (Project code: 2013.1.00001.S; PI: R.
Ivison; Oteo et al. in preparation). We also allow for
residual antenna-based phase calibration errors in the
model which could be due to, for example, uncom-
pensated atmospheric delays. The phase shifts of all
antennas are < 10 deg, indicating that no significant
antenna-based calibration problems remain.
The lensed emission is reasonably well-fit by a single
background Sersic component, leaving peak residu-
als of ∼ 4σ (the source is detected at peak signifi-
cance ∼ 20σ). These residuals may indicate that ei-
ther the lens, source, or both are more complex than
the simple parametric forms we have assumed. We
have verified that an additional background source
component is not statistically motivated. The best-fit
magnification of the source is µ890µm = 9.3 ± 1.0,
with an intrinsic flux density S890 µm = 4.3 ± 0.5mJy and half-light radius 0.10 ± 0.01” (= 0.6 ± 0.1kpc). This compact morphology resembles the sizes
found for local ULIRGs43 (∼ 0.5 kpc), which are
smaller than the typical values in SMGs (∼ 1.8 kpc,
ref:44).
3 SED fitting and dust properties
We fit different galaxy SED templates to the pho-
tometry of G09 83808 through a χ2 minimization
method. We include the SED template of Arp22046,
Cosmic Eyelash47 (SMM J2135-0102), two aver-
age SMGs templates48, 49, and finally a composite
SED of 24 µm-selected star-forming galaxy50. All
the SED templates were fixed at z = 6.027. The
Arp220 SED template gives us the best fit with
χ2red = 0.7. Using this template we derive an IR
(8 − 1000µm) luminosity of 3.8 ± 0.5 × 10¹² L⊙
and a FIR (42.5 − 122.5µm) luminosity of 2.3 ±0.3 × 10¹² L⊙ (both corrected for gravitational am-
plification) . For comparison, if we adopt instead
a SMGs average template (χ2red = 1.2) we obtain
LIR = 3.0 ± 0.4 × 10¹² L⊙, which is in good
agreement with the value derived using the Arp220
template. Using Kennicutt standard relation51 for a
Chabrier initial mass function (IMF)53, this IR lumi-
nosity corresponds to a star formation rate (SFR) of
380 ± 50 M⊙ yr−1, or to 570 ± 70 M⊙ yr−1 if the
most recent relation52 is used. If we adopt instead
the Kennicutt calibration51 for a Salpeter IMF54, the
SFR increases to 640 ± 90 M⊙ yr−1, still below the
range probed by other SMGs at z & 5.
We also use a modified blackbody function to fit our
photometric measurements described by
Sν ∝ {1− exp[−(ν/ν0)β]}B(ν, Td), (1)
where Sν is the flux density at frequency ν, ν0 is the
rest-frame frequency at which the emission becomes
optically thick, Td is the dust temperature, β is the
emissivity index, and B(ν, Td) is the Planck function
at temperature Td. To minimize the number of free
parameters, the emissivity index is fixed (previous
11

observational works suggest β = 1.5−2; refs.55–57),
as well as ν0 = c/100 µm (refs.12, 58), where c is the
speed of light. From the best fit (χ2 ≈ 1.1) we de-
rive Td = 49± 3 K for β = 1.8 and Td = 52± 3 Kfor β = 1.5. For these dust temperatures and at the
redshift of our source the CMB effects59 are not sig-
nificant (∆T . 1 K).
Assuming the dust is isothermal, the dust mass, Md,
is estimated from
Md =Sν/(1+z)D
2L
(1 + z)κνB(ν, Td), (2)
where Sν is the flux density at frequency ν, κν is the
dust mass absorption coefficient at ν, Td is the dust
temperature, and B(ν,Td) is the Planck function at
temperature Td. The dust mass absorption follows
the same power law as the optical depth, κ ∝ νβ .
Assuming normalization of κd(850µm) = 0.07 m2
kg−1 (ref.60) and a dust temperature of 49± 3 K, we
estimate a dust mass of Md = 1.9 ± 0.4 × 10⁸ M⊙
after correcting for the CMB effects59 (although this
correction is less than 5 per cent). These calculations
do not include the uncertainties of the dust mass ab-
sorption coefficient, which could be at least a factor
of 3 (ref. 61). If we use instead a lower dust temper-
ature of 35 K, the dust mass increases by a factor of
∼ 2.
We also fit the observerd photometry with the
MAGPHYS62 SED modelling code finding consis-
tent results, within the error bars, with median val-
ues of SFR= 360+80−70 M⊙ yr−1, LIR = 4.5 ± 0.7 ×
1012 L⊙, Td = 40+4−2 K, and Md = 4.2 ± 0.7 ×
108 M⊙.
4 Spectral line properties
We calculate the line luminosity for each detected
line following the standard relation63 described by:
L′
CO = 3.25×10⁷SCO∆V ν−2obs D
2L (1+z)−3, (3)
where L′
CO is the line luminosity in K km s−1 pc2,
SCO∆V is the velocity-integrated line flux in Jy
km s−1, νobs is the observed central frequency of
the line in GHz and DL is the luminosity distance
in Mpc. The integrated flux, SCO∆V , is calcu-
lated as the integral of the best-fit Gaussian distri-
bution, and its associated uncertainty through Monte
Carlo simulations taking into account the errors in
the Gaussian parameters (i.e. peak flux density and
line width). To estimate the line luminosity in L⊙,
we use L = 3× 10⁻¹¹ν3rL′, where νr is the rest fre-
quency of the line63. All properties are summarized
in Table 1.
5 CO(1-0) line luminosity and molecular gas
mass
The molecular gas mass, M(H2), can be derived us-
ing the CO luminosity to molecular gas mass conver-
sion factor, α, following the relation
M(H2) = α L′
CO(1−0). (4)
For the L′
CO(1−0) line luminosity we adopt the
average value of L′
CO(1−0) = 2.0 ± 0.8 ×
1010 K km s−1 pc−2 extrapolated from our CO(6-
5) and CO(5-4) transitions and correcting for grav-
itational amplification. The extrapolation was done
using average brightness ratios found for lower-
redshift SMGs22 (L′
CO(5−4)/L′
CO(1−0) = 0.32 ±
0.05, L′
CO(6−5)/L′
CO(1−0) = 0.21± 0.04), this sam-
ple includes galaxies with similar luminosities to
G09 83808 and are in agreement with those found
for local ULIRGs24 (within the large scatter). On
the other hand, if we use the relationship between
the Rayleigh-Jeans specific luminosity and CO(1-0)
luminosity64, L′
CO(1−0) [K km s−1pc2] = 3.02 ×
10−21Lν [erg s−1 Hz−1], we obtain a consistent
line luminosity of 1 ± 0.1 × 10¹⁰ K km s−1 pc−2
(assuming a mass-weighted dust temperature of
35 K, which is different from the luminosity-
weighted dust temperature determined from the
SED fitting64). Using the former value and α =0.8 M⊙ (K km s−1 pc−2)−1, which is appropriate
for starburst galaxies23 (although some studies sug-
gest larger values65), we derive a molecular mass of
M(H2) = 1.6 ± 0.6× 10¹⁰ M⊙.
6 Dynamical mass and gas mass fraction
Dynamical mass has been derived using the
‘isotropic virial estimator’, which has been shown to
12
be appropriate for lower-redshift SMGs66:
Mdyn[M⊙] = 2.8×10⁵ ∆ν2FWHM[km s−1]R1/2[kpc],(5)
where ∆νFWHM is the integrated line FWHM, which
has been assumed to be 400 km/s (as the average be-
tween the CO and [CII] lines), and R1/2 is the half-
light radius of ∼ 0.6 kpc (derived from the lesing
model of the continuum emission). This results in
a dynamical mass of Mdyn = 2.6 × 10¹⁰ M⊙. Us-
ing this estimation we calculate a gas mass fraction
of fgas = MH2/Mdyn ≈ 60%. This constrain the
CO luminosity to molecular gas mass conversion fac-
tor to α . 1.4 M⊙ (K km s−1 pc−2)−1, otherwise
the molecuar gas mass would exceed the dynamical
mass.
REFERENCES
31. Sanders, D., Scoville, N. & Soifer, B. Molecular gas
in luminous infrared galaxies. Astrophys. J. 370 158-
171 (1991).
32. Solomon, P. et al. The Molecular Interstellar Medium
in Ultraluminous Infrared Galaxies. Astrophys. J. 478,
144-161 (1997).
33. Aravena, M. et al. A survey of the cold molecular gas
in gravitationally lensed star-forming galaxies at z >2. Mon. Not. R. Astron. Soc. 457, 4406-4420 (2016).
34. Hughes, D. et al. The Large Millimeter Telescope.
SPIE. 7733, 12- (2010).
35. Wilson, G. et al. The AzTEC mm-wavelength cam-
era. Mon. Not. R. Astron. Soc. 386 807-818 (2008).
36. Erickson, N. et al. An Ultra-Wideband Receiver and
Spectrometer for 74–110 GHz ASPCS 375 71- (2007).
37. Scott, K. B. et al. AzTEC millimetre survey of the
COSMOS field - I. Data reduction and source cat-
alogue. Mon. Not. R. Astron. Soc. 385 12225-2238
(2008).
38. Yun, M. et. al. Early Science with the Large Mil-
limeter Telescope: CO and [C II] Emission in the z
= 4.3 AzTEC J095942.9+022938 (COSMOS AzTEC-
1). Mon. Not. R. Astron. Soc. 454, 3485-3499 (2015).
39. Savitzky, A & Golay, M. Smoothing and differenti-
ation of data by simplified least squares procedures.
Analytical Chemistry 36 1627-1639 (1964).
40. Smail, I. et. al. The potential influence of far-infrared
emission lines on the selection of high-redshift galax-
ies. Mon. Not. R. Astron. Soc. Lett. 414, L95-L99
(2011).
41. Spilker, J. et. al. ALMA Imaging and Gravitational
Lens Models of South Pole Telescope-Selected Dusty,
Star-Forming Galaxies at High Redshifts. Astrophys.
J. 826, 112- (2016).
42. Fudamoto, Y. et al. The most distant, luminous, dusty
star-forming galaxies: redshifts from NOEMA and
ALMA spectral scans. Mon. Not. R. Astron. Soc. ac-
cepted (2017).
43. Lutz, D. et al. The far-infrared emitting region in lo-
cal galaxies and QSOs: Size and scaling relations. As-
tron. Astrophys. 591 136- (2016).
44. Hodge, J. et al. Kiloparsec-scale Dust Disks in High-
redshift Luminous Submillimeter Galaxies. Astrophys.
J. 833 103- (2016).
45. Gullberg, B. et al. The nature of the [C II] emission in
dusty star-forming galaxies from the SPT survey. Mon.
Not. R. Astron. Soc. 449 2883-2900 (2015).
46. Silva, L. et al. Modeling the Effects of Dust on Galac-
tic Spectral Energy Distributions from the Ultraviolet
to the Millimeter Band. Astrophys. J. 509 103-117
(1998).
47. Ivison, R. et al. Herschel and SCUBA-2 imaging and
spectroscopy of a bright, lensed submillimetre galaxy
at z = 2.3. Astron. Astrophys. Lett. 518 L35- (2010).
48. Michałowski, M., Hjorth, J. & Watson, D. Cosmic
evolution of submillimeter galaxies and their contribu-
tion to stellar mass assembly. Astron. Astrophys. 514,
A67- (2010).
49. Pope, A. et al. Mid-Infrared Spectral Diagnosis of
Submillimeter Galaxies. Astrophys. J. 675, 1171-1193
(2008).
50. Kirkpatrick, A. et al. GOODS-Herschel: Impact of
Active Galactic Nuclei and Star Formation Activity on
Infrared Spectral Energy Distributions at High Red-
shift. Astrophys. J. 759, 139- (2012).
51. Kennicutt, R. The Global Schmidt Law in Star-
forming Galaxies. Astrophys. J. 498, 541-552 (1998).
52. Kennicutt, R. and Evans, N. Star Formation in the
Milky Way and Nearby Galaxies. Ann. Rev. Astron.
Astrophys. 50, 531-608 (2012).
53. Chabrier, G. The Galactic Disk Mass Function:
Reconciliation of the Hubble Space Telescope and
Nearby Determinations. Astrophys. J. 586, L133-
L136 (2003).
54. Salpeter, E. The luminosity function and stellar evo-
lution. Astrophys. J. 121, 161- (1955).
13

55. Dunne, L. & Eales, S. The SCUBA Local Universe
Galaxy Survey - II. 450-µm data: evidence for cold
dust in bright IRAS galaxies. Mon. Not. R. Astron. Soc.
Lett. 327, 697-714 (2001).
56. Chapin, E. et al. An AzTEC 1.1mm survey of the
GOODS-N field - II. Multiwavelength identifications
and redshift distribution. Mon. Not. R. Astron. Soc.
Lett. 398, 1793-1808 (2009).
57. Magnelli, B. et al. A Herschel view of the far-infrared
properties of submillimetre galaxies. Astron. Astro-
phys. 539, 155- (2012).
58. Simpson, J. et al. The SCUBA-2 Cosmology Legacy
Survey: Multi-wavelength Properties of ALMA-
identified Submillimeter Galaxies in UKIDSS UDS.
Astrophys. J. 839, 58- (2017).
59. da Cunha, E. et al. On the Effect of the Cos-
mic Microwave Background in High-redshift (Sub-
)millimeter Observations. Astrophys. J. 766, 13-
(2013).
60. James, A., Dunne, L., Eales, S. & Edmunds, M.
SCUBA observations of galaxies with metallicity
measurements: a new method for determining the rela-
tion between submillimetre luminosity and dust mass.
Mon. Not. R. Astron. Soc. Lett. 335, 753-761 (2002).
61. Dunne, L. et al. Type II supernovae as a signifi-
cant source of interstellar dust. Nature. 424, 285-287
(2003).
62. da Cunha, E. et al. An ALMA Survey of Sub-
millimeter Galaxies in the Extended Chandra Deep
Field South: Physical Properties Derived from
Ultraviolet-to-radio Modeling. Astrophys. J. 806, 110-
(2015).
63. Solomon, P. & Vanden Bout, P. Molecular Gas at
High Redshift. Ann. Rev. Astron. Astrophys. 43, 677-
725 (2005).
64. Scoville, N. et al. ISM Masses and the Star formation
Law at z = 1 to 6: ALMA Observations of Dust Con-
tinuum in 145 Galaxies in the COSMOS Survey Field.
Astrophys. J. 820, 83- (2016).
65. Papadopoulos, P. et al. The Molecular Gas in Lumi-
nous Infrared Galaxies. II. Extreme Physical Condi-
tions and Their Effects on the X co Factor. Astrophys.
J.751, 10- (2012).
66. Engel, H. et al. Most Submillimeter Galaxies are Ma-
jor Mergers. Astrophys. J.724, 233-243 (2010).
14