AN AGENDA FOR THE FUTURE - columbia.edu · An Agenda for the Future ... Report of the Working Group...
82
AN AGENDA FOR THE FUTURE Report of the Task Force on Undergraduate Education Columbia University April 2009
Transcript of AN AGENDA FOR THE FUTURE - columbia.edu · An Agenda for the Future ... Report of the Working Group...
AN AGENDA FOR THE FUTURE
Report of the
Task Force on Undergraduate Education
Columbia University
April 2009

2
3
Table of Contents Acknowledgements....................................................................................................... 5
Background................................................................................................................... 7
An Agenda for the Future............................................................................................ 11
Introduction........................................................................................................ 11
Enlarging the College......................................................................................... 13
Strengthening General Studies............................................................................ 14
Internationalizing Undergraduate Education....................................................... 16
Facilitating New Interdisciplinary Opportunities ................................................ 17
Advancing Undergraduate Science Education .................................................... 19
Addressing Inequalities and Anomalies in Undergraduate Teaching ................... 20
Reconsidering Curricular Structure..................................................................... 21
Appendices ................................................................................................................. 25
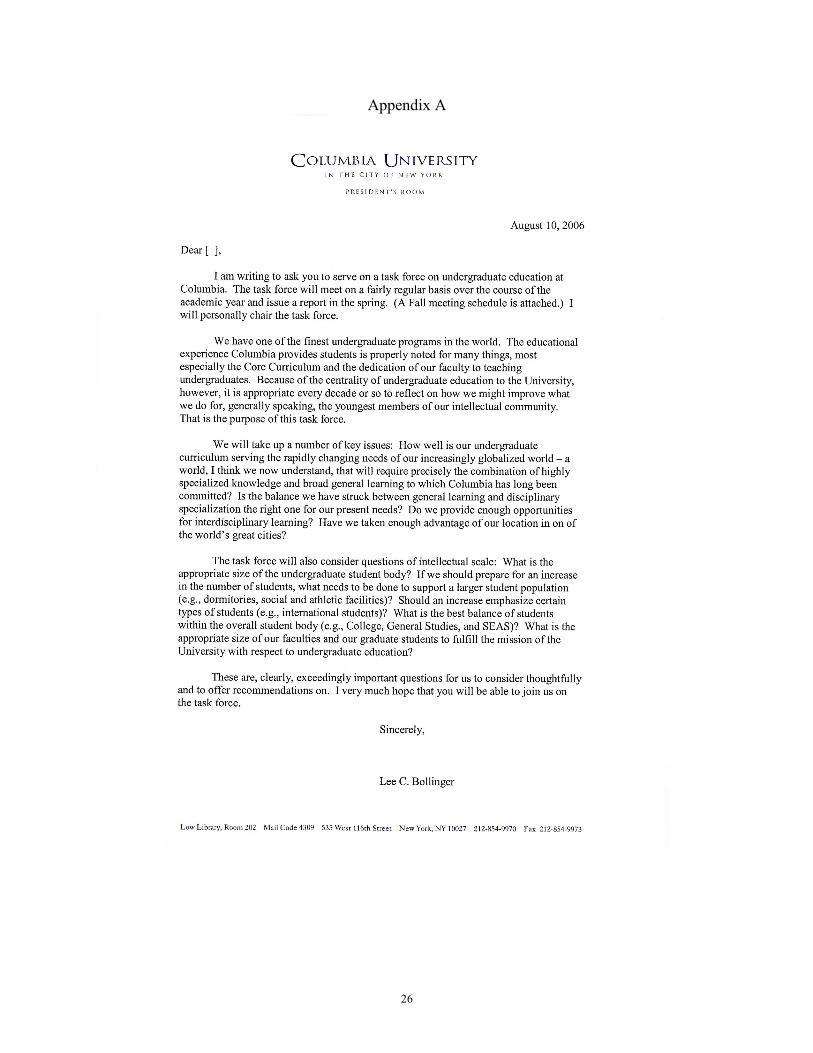
Appendix A – Letter Naming Task Force ........................................................... 26
Appendix B – Membership of the Task Force on Undergraduate Education ....... 27
Appendix C – Membership of the Working Groups............................................ 30
Appendix D – Possible Topics for Working Groups ........................................... 34
Appendix D-1: Report of the Working Group on Curricular Structure ......... 35
Appendix D-2: Considering College Expansion........................................... 48
Appendix D-3: Report of the Working Group on Science Education............ 56
Appendix D-4: Report of the Working Group on Teaching.......................... 69

4
5
Acknowledgements This report is the product of the collective thinking of the Task Force on Undergraduate
Education. The Task Force included faculty, student, and administrative representation from all
of the relevant constituencies. Members of the four working groups and their chairs were key
collaborators in the process. The chairs of the four working groups – Peter Awn, Martha
Howell, Ann McDermott, and David Weinstein – prepared drafts, consulted widely and made
presentations to the Arts and Sciences faculty as well as to the Board of Trustees of the
University. The Task Force was also assisted by the advice of numerous faculty who met with
the Task Force and who commented on its proposals throughout the entire process.
Columbia University April 2009

6
7
Background Undergraduate instruction is offered in three schools and colleges of the University and at
Barnard College. Two of the schools are overseen by the Faculty of the Arts and Sciences –
Columbia College and the School of General Studies. Columbia College is the largest and oldest
of the undergraduate schools at Columbia. Established as King’s College in 1754 with an
entering class of 8 young men; the College today enrolls over 4,200 women and men of
traditional college age. Students complete a liberal arts curriculum composed of three parts: a
common set of general education courses known as the Core Curriculum, a major or
concentration, and electives. Literature Humanities, Contemporary Civilization, Music
Humanities, Art Humanities, Undergraduate Writing, and Frontiers of Science are taken by all
College students; in addition, every student completes two “global core” courses in non-western
cultures and two science or quantitative reasoning courses chosen from approved distributional
lists. Students are required to complete at least one of the 70 majors, 48 concentrations or 24
premedical concentrations approved by the Arts and Sciences, and may take electives to deepen
their understanding of their chosen field or to explore other areas of interest. Approximately
1,000 students are awarded the Bachelor of Arts degree from the College each year.
The School of General Studies (GS) was established in 1947, although its roots extend
back to University Extension, which first began awarding the bachelor’s degree in 1921. GS
provides a traditional Ivy League liberal arts education for students who have, for personal or
professional reasons, interrupted their education. Most bring 1-2 years of previous college-level
study, but all are required to complete a minimum of half of their degree requirements at
Columbia and complete the same majors. The 1,200 GS students are taught by the same Arts
and Sciences faculty as teach the students of Columbia College (and SEAS), in the same classes
8
at the same time. The School of General Studies awards both Bachelor of Arts and Bachelor of
Science degrees, and students must complete one of the 70 Arts and Sciences majors in pursuit
of the degree. Approximately 250 students graduate from GS each year.
The School of Engineering and Applied Science (SEAS) first began enrolling young men
in 1864 in the then School of Mines. It currently enrolls over 1,400 men and women for
undergraduate study in a total of 15 majors. Students may also pursue one of 34 minors, most of
which are in fields in the Arts and Sciences. Students in SEAS complete much of the same Core
Curriculum (see above) as is taken by students in Columbia College. SEAS awards
approximately 365 bachelor’s degrees each year.
Established in 1889, Barnard College currently enrolls 2,400 undergraduate women
studying for the Bachelor of Arts degree in 47 fields of study. Barnard students complete certain
majors, in part or in whole at Columbia, while some Columbia College, GS and SEAS
undergraduates take most or all of their major, concentration or certificate programs in Barnard-
based departments. Pursuant to an inter-corporate agreement first established in June 1900 with
Columbia University, Barnard College maintains its own Board of Trustees, president, faculty,
facilities, and financial independence. The agreement includes a key provision which stipulates
that Barnard students would receive a Columbia degree and be permitted to take upper-level
courses at the University. Thus, a faculty member teaching an undergraduate course in the Arts
and Sciences or in Engineering and Applied Science could well have students sitting in her or his
classroom from all four schools - Columbia College, SEAS, GS and Barnard. The same can hold
true for a Barnard faculty member teaching undergraduate courses.
It should be noted that the School of Nursing offers an accelerated combined-degree
(BS/MS) program for college graduates without previous nursing education. There are two
9
components: pre-licensure study which prepares the student for basic nursing practice and
specialty study which focuses on an advanced practice role in professional nursing. Students
receive the bachelor’s degree on route to the master’s degree. The Task Force did not address
School of Nursing undergraduates.

10
11
An Agenda for the Future
Report of the Task Force on Undergraduate Education
Introduction
The Task Force on Undergraduate Education assembled for the first time in the fall of
2006 at the invitation of, and under the chairmanship of, President Lee C. Bollinger. The
creation of this Task Force represented the belief of the senior leadership of the University that
the continuing excellence of undergraduate education is the central commitment of the institution
and its most compelling concern. President Bollinger asked the Task Force to consider a number
of important questions relating to undergraduate education, and the members of the Task Force
considered these questions over the course of two years.
The deliberations of the Task Force fell into two, sometimes overlapping, categories.
The first category involved a series of what came to be called “structural” questions: What is the
appropriate size of the undergraduate student body, and what is the appropriate distribution of
students among the various undergraduate schools (Columbia College, the School of Engineering
and Applied Science, and the School of General Studies)? What steps should Columbia take to
enhance the quality and improve the conditions of students in General Studies, and would a
changed relationship between GS and the College contribute to those goals? How can Columbia
increase the number of international undergraduate students? The second category involved a
wide range of questions about the ways the curricula of the undergraduate schools might be
revised and enhanced.
From the beginning, the President made clear that the Task Force had no authority by
itself to make changes in the curriculum. Its goal was to make recommendations that would then
be considered through existing or revised academic processes. But because the Task Force,
12
unlike most standing committees, was so broadly representative of the University – including
administration, faculty, and students – its members hope and believe that its recommendations
will receive serious attention.
This Task Force follows in the footsteps of many earlier examinations of undergraduate
education at Columbia. A Committee on Undergraduate Education (CUE) published a report in
1994 that raised many of the same issues that emerged in the discussions of the current Task
Force. (Some of the faculty who served on the CUE in the early 1990s served on this Task Force
as well.) Other studies of undergraduate education occurred almost every decade from at least
the 1940s. The current Task Force initiative, like the earlier efforts, reflects the longstanding
commitment of the University, and of the faculty in particular, to undergraduate education at
Columbia. It also reflects the recent growth in both the size and the stature of Columbia College
and the School of Engineering and Applied Science, the recognition of the changes in higher
education that have occurred, and will continue to occur, in the face of a rapidly and profoundly
changing world.
The Task Force has come to the end of its work in a time of significant financial
constraints, and many of the aspirations and recommendations that appear in this report may be
deferred for consideration until new revenues become available. But we believe that this
exercise has provided an important vision of how undergraduate education at Columbia – already
a source of great pride to the University – can become stronger and better aligned with the issues
facing the University in the twenty-first century.
This report addresses a series of issues that the Task Force has identified as important,
and it presents proposals that have gained the support of most (but not always all) of the
members of the group. They include proposals for increasing the size of Columbia College,
13
enhancing General Studies, internationalizing the undergraduate experience, facilitating
interdisciplinary studies, strengthening undergraduate science, addressing concerns about
teaching, and providing the Arts and Sciences with a vehicle that will make possible a
coordinated vision of the curriculum, the deployment of faculty, and the impact of related
proposals in this document.
Much of the Task Force’s work on curriculum was conducted by a series of Working
Groups on particular topics, which included members of the task force and some faculty from
outside the Task Force. Their reports are summarized in this document, and the reports of the
working groups themselves are included in the appendices.
1. Enlarging Columbia College
Columbia College, despite considerable growth in recent decades, remains the smallest in
the Ivy League and among our other peers around the country. The College is small not only in
relation to peer institutions, but also in relation to the size of the University. Columbia College
enrolls only 46 percent of the undergraduates at Columbia – with the remainder in the School of
Engineering and Applied Science, the School of General Studies, and Barnard College. It is, in
other words, a relatively small college positioned in the midst of other substantial undergraduate
schools. The 4,100 College students are also positioned among approximately 25,000 total
students enrolled in Columbia’s undergraduate, graduate, and professional schools.
The Task Force proposes a carefully planned and long-term expansion of Columbia
College of approximately 15 to 20 percent, with the aim of strengthening the College, Arts and
Sciences, and the University. Such an expansion would provide more students with the
opportunity to benefit from a Columbia education, would allow the College to accept more
14
international students without reducing the number of American students, would make the
College proportionately larger within the University and within the undergraduate population,
and over time would generate more additional revenues through tuition. Growth would also
create a larger College alumni body and thus enhance the College’s and the University’s
fundraising capacities. The extraordinary quality of our enormous pool of undergraduate
applicants (21,300 for 1,000 places in 2009) ensures that a larger student body would not lead to
any diminution in the quality of students.
The costs of expansion at this scale are significant and would extend over more than a
decade. Those costs would include funding for incremental financial aid to maintain our deep
commitment to need-blind, fully-funded admissions; additional dormitory, dining, classroom,
athletic, and study space; increased student services; faculty growth; and close attention to the
staffing of the core curriculum. Significant additional revenues will need to be identified before
we will be able to meet all these goals. But the Task Force believes that, were expansion to
become affordable and were it to be done consistent with the needs of students and faculty, it
would be worth pursuing.
2. Strengthening General Studies Columbia is unusual, perhaps unique, among American universities in having created a
separate school for nontraditional students and, at the same time, making few distinctions
between traditional and nontraditional students in their access to courses, majors, faculty, and
other academic opportunities. General Studies students, many of whom enter the University
after having spent time at other institutions, do not fully participate in the College’s core
curriculum; but in almost all other respects, their academic experience is identical to that of
15
students in the College. The students in the School of General Studies bring with them
substantial non-academic experiences that enrich the character of undergraduate life and the
quality of the classroom experience.
There are, however, significant differences in other aspects of the lives of General
Studies students. They enter Columbia through an admissions process separate from that of the
College. They do not have access to established undergraduate housing, although the School has
acquired its own housing for some of its students. They are not eligible for the need-blind, fully-
funded financial aid that is available to students in the College and SEAS, although they do
receive some financial aid through their school. For General Studies to reach its full potential, it
will need to address these problems. Increasing the amount of housing available to General
Studies students and significantly increasing financial aid would deepen the applicant pool
significantly, make it possible to attract many more students from across the nation and the
world, and over time improve the already high quality of students. It would also, of course,
improve the experience of students once they are here. Such enhancements would require
significant additional revenues, and so this goal as well will await better financial times.
In the meantime, there are opportunities to integrate General Studies more effectively
into the larger undergraduate population. Members of the Task Force have proposed a closer
relationship between the College and General Studies in undergraduate admissions, student
services, and advising. Members of the Task Force also recommended that students in General
Studies should have greater and easier access to the core curriculum.
A closer relationship between General Studies and the College – both in the short term
and the long term – could create a more unified undergraduate population, with many common
experiences and qualifications.
16
3. Internationalizing Undergraduate Education
Columbia has established as one of its core missions a greater engagement with the world
beyond our campus. For undergraduates, that means, among many other things, bringing more
international undergraduates to Columbia College, creating a curriculum that provides students
with a greater understanding of global issues, and providing greater opportunities for students to
have academic and other experiences abroad.
The Task Force proposes a significant increase in the number of international students in
the College, SEAS, and General Studies, both because we believe that a Columbia education will
be of value to non-American students and because the presence of international students will
enrich the experience of all undergraduates. This will require, in all three schools, new revenues
to ensure that international students will be eligible for levels of financial aid comparable to
those now available to North American students in the College and SEAS.
The Task Force also supports a significant increase in the number and range of
international experiences available to students. Because of the difficulty many students face in
spending an entire semester or year abroad, Columbia should ensure that there are international
opportunities in the summer and during other, shorter-term breaks in the academic year. Such
experiences could include, among others, research trips, independent study, internships, and
sponsored volunteer activities. Not all such programs would be linked to language instruction.
As Columbia opens global centers in various parts of the world, undergraduate programs should
be integrated into their mission at an early point.
17
International experiences for undergraduates do not always require travel abroad.
Columbia should take advantage of its location in one of the world’s most global cities to bring
students into contact with diverse international communities in the metropolitan area.
And not least, the Task Force proposes a broad effort to bring greater international
content to the curriculum, including the core curriculum. There is broad support for a continuing
re-examination of the formerly Major Cultures component of the core, now the Global Core, and
a faculty committee was reviewing this part of the core at the same time that the Task Force was
meeting. Over time, the goal should be to staff and structure the Global Core in ways
comparable to that of the Western core. In addition, the Committee on Global Thought has
considered ways in which to engage with undergraduate education, and the Earth Institute – itself
a highly international institution – is in the process of planning and proposing an undergraduate
major.
4. Facilitating New Interdisciplinary Opportunities
It should not be the role of the Task Force to identify what kind of interdisciplinary
programs would be of value to undergraduates. That is the job of the faculty. But it is
appropriate to recommend vehicles for facilitating interdisciplinary opportunities for students
and to identify obstacles that might be removed.
Columbia is a highly balkanized university, divided not only by the high level of
autonomy of the various schools but also by a tradition of independence within departments and
programs. There has been significant progress over the last two decades in creating
interdisciplinary programs for undergraduates. From a point in the late 1980s where there were
virtually no interdisciplinary programs for undergraduates, there are now important new
18
institutions that offer majors in an array of interdisciplinary fields, among them the Institute for
Research on Women and Gender; the Institute for Research in African American Studies; the
Center for the Study of Ethnicity and Race; the Program in American Studies; and the Institute
for Comparative Literature and Society. But obstacles remain. There are both budgetary and
cultural barriers that inhibit such simple interdisciplinary activities as faculty from different
schools or departments teaching courses together, let alone creating robust interdisciplinary
programs.
The University and the individual Schools should create agreements that would remove
budgetary obstacles that prevent faculty from teaching in departments and schools not their own.
Academic units must be protected from too many faculty moving their teaching to other units, so
there must be limits on the “freedom of trade” that would be necessary to enhance
interdisciplinary activity. But it would be of great value to the university to create carefully
limited opportunities for faculty to teach from time to time outside their home units.
Several decades ago, Columbia supported a small number of non-departmental seminars
known as Colloquia, through which upper-class undergraduates could revisit aspects of the core
curriculum at a later stage of their education. These colloquia attracted some of the most
eminent faculty in the University and often brought professors from different disciplines together
in the classroom. Reviving something similar to those team-taught colloquia would enhance
undergraduate education today. The Faculty should support seminars outside of departments that
would be selected on the basis of their innovative quality. Such teaching opportunities are
common in many colleges in the form of freshman seminars. Columbia’s core curriculum leaves
little room for first-year students to take such courses, but that should not prevent the creation of
comparable courses available to students at any point in their undergraduate program. These
19
courses might be called College Seminars. They could build upon the interdisciplinary strengths
of both the core curriculum and the majors, as the former colloquia did.
The College and GS already offer some opportunities for students to take courses in
Columbia’s professional schools. It would be particularly valuable to find more ways to attract
faculty from Columbia’s many professional schools to offer undergraduate courses. Some of the
University’s most distinguished scholars teach outside the undergraduate schools. Finding a way
to make possible undergraduate teaching by those professional school scholars who wish to do so
would open important new opportunities for students. The creation of College Seminars would
also help facilitate such teaching opportunities.
5. Advancing Undergraduate Science Education
In many ways, Columbia offers extraordinary opportunities to undergraduates for the
study of science. The distinguished science faculty of the Arts and Sciences is deeply committed
to undergraduate teaching. In many fields, classes are small; and students have many
opportunities to work closely with faculty on research. Despite some overcrowded classes,
substandard classrooms and teaching labs, undergraduate scientists at Columbia do very well in
their studies and, to the degree we can tell, do very well in subsequent careers, many of them in
scientific fields.
For many years, however, Columbia has been concerned about the relatively low number
of undergraduate science majors. The College has responded to this challenge with, among other
things, a new core course in science, and the very successful Rabi Scholars Program, named after
one of the great Columbia physicists of the middle of the twentieth century. The Rabi program
demonstrates that Columbia can effectively serve very talented and highly motivated science
20
students by providing them with close faculty supervision, early research opportunities, and
summer-on-campus programs. Rabi scholars typically do extremely well in their studies and in
their subsequent careers. “Opportunities for supervised research are likely to be a very important
component of our science program, but are in short supply,” the report of the Working Group on
Science Education states.
Among the many important recommendations for enhancing science education for
undergraduates is a substantial enlargement of the Rabi scholars program, or the creation of
additional programs in other areas of science, which would help the College attract more of the
best science applicants. The Working Group also noted the particularly low undergraduate
enrollment in biology, which suggests that a focused effort to recruit biologists – through an
expanded Rabi program or a new program focused on the field – would help address this
anomaly. The Task Force also recommends an increase in summer research opportunities for
science students whether or not they are Rabi scholars. And it recommends, finally, that the
proposed Education Policy and Planning Committee (see below) provide leadership for
departments in the development of curricular innovations for science students in their first two
years and for modernizing the majors.
6. Addressing Inequalities and Anomalies in Undergraduate Teaching The Working Group on Teaching called attention to inequalities in the classroom
experience of many undergraduates. Students in some of the most popular majors encounter
very large lecture classes, sometimes – but not always – accompanied by discussion sections
conducted by graduate students. Newly popular fields have not always been able to match the
growth in students with growth in faculty. Students in smaller majors are more likely to have
21
small courses, many seminars, and robust relationships with faculty. This is a common dilemma
in all universities, but that should not prevent Columbia from trying to address the problem.
Growth in faculty size has not always been tied closely to instructional demand, and few
believe that instructional demand should be the only basis for hiring faculty. But attention to
teaching needs should be a significant factor in determining faculty size. The Working Group on
Teaching recommends improving data analysis on course enrollments and, over time, leveraging
faculty expansion to bring Columbia more in line with evolving undergraduate demand for
classes.
Grading standards are also highly variable from department to department, which may
create inappropriate incentives when students are choosing courses or majors. The Working
Group recommends, therefore, strengthening current efforts to disseminate information about
grading norms so that faculty and administrators can better understand their evaluation policies.
Columbia already includes information on transcripts on the percentage of A grades in each
course. But further study of disparities in grading standards among undergraduate departments,
and of grade inflation, are clearly needed.
7. Reconsidering Curricular Structure
The Working Group on Curricular Structure looked at the curriculum as a whole, with
attention not only to the College and General Studies, but to SEAS, Barnard, the Post-Bac Pre-
Med Program, and the small number of “special students” who take courses at the University.
The Working Group noted a potential tension between the College’s robust and very extensive
core curriculum and the demands of the majors. It noted too, as the 1993 CUE report did as well,
that the combination of the core and the majors leaves less room for electives than would be the
22
case in other universities. Recent data suggests that students take on average one elective per
semester, although many students may use these “electives” to support their majors.
The Working Group affirmed its commitment to the core curriculum as the signature of
the Columbia undergraduate curriculum and noted that “there is little disagreement, here or in
the nation, that Columbia’s general education is exceptionally successful.” That success rests on
its “coherent curriculum” and its “pedagogical structure – the small seminar in which students
confront the primary texts and cultural documents themselves and are compelled to come to their
own understanding of them, with the help of their instructors and classmates.” The Working
group also noted that at least one key element of the core curriculum – the “Major Cultures”
(now “Global Core”) requirement – should be strengthened. The College’s Committee on the
Core was working on a revision of the requirement as the Task Force was meeting and has
already established the revised “Global Core” requirement that provides an important first step in
strengthening this vital part of the core. Continued attention to the global core should be a high
priority for the College and SEAS.
The Working Group’s principal recommendation, strongly endorsed by a unanimous vote
by those attending the final meeting of the Task Force, is “that a faculty-led group – the
Education Policy and Planning Committee – be appointed to work with the Deans of
Undergraduate and Graduate Education and the Vice President on coordinating curriculum
across schools, departments, institutes, and programs and to advise the Vice President regarding
allocation of faculty resources to undergraduate teaching.” The goal of this committee is “to
provide a structure for the coordination of existing bodies that manage curriculum (whether
departmental committees, institute or program committees, the Committees on Instruction for the
23
respective schools, or the committees that design and manage the Core) with those responsible
for faculty planning.”
The Task Force supports this proposal because it believes that the current division of
authority over the many different pieces of the curriculum makes it difficult to coordinate and
reconsider the structure of undergraduate academic life. In many ways, this proposal is the most
important of all those that have emerged from the Task Force. It will create a vehicle for
consideration of all the other proposals in this report, and it will make possible careful and
reasoned changes in the undergraduate curriculum over time in a way that, in the past, has been
continually frustrated by the absence of any group capable of looking broadly at the overall
pattern of the undergraduate experience.

24
25
Appendices
26
Appendix A
27
Appendix B
Membership of the Task Force on Undergraduate Education Lee C. Bollinger, President, Chair Alan Brinkley, Provost and Allan Nevins Professor of American History, Vice Chair Alfred V. Aho, Lawrence Gussman Professor of Computer Science, Department of Computer Science Paul J. Anderer, Theodore and Fanny de Bary and Class of 1941 Collegiate Professor of Asian Humanities, Department of East Asian Languages and Cultures (2006-07) Peter Awn, Dean of the School of General Studies and Professor of Religion Brody Berg, Student Council President, School of General Studies (2008-09) Elizabeth Boylan, Provost and Dean of the Faculty of Barnard College Niko Cunningham, Student Council President, School of General Studies (2007-08) Andrew Delbanco, The Julian Clarence Levi Professor in the Humanities, Department of English and Comparative Literature George Deodatis, Professor, Department of Civil Engineering and Engineering Mechanics Michelle Diamond, Student Council President, Columbia College (2007-08) Nicholas B. Dirks, Vice President for the Arts and Sciences and Dean of the Faculty and Franz Boas Professor of Anthropology and History Geraldine Downey, Vice Provost for Diversity Initiatives and Professor of Psychology Stuart J. Firestein, Professor, Department of Biological Sciences Seth E. Flaxman, Student Council President, Columbia College (2006-07) Morton B. Friedman, Vice Dean, Fu Foundation School of Engineering and Applied Science and Professor of Civil Engineering and Engineering Mechanics Robert D. Friedman, Professor, Department of Mathematics Zvi Galil, Dean, Fu Foundation School of Engineering and Applied Science and Morris A. and Alma Shapiro Professor and Julian Clarence Levi Professor of Mathematical Methods and Computer Science (2006-07)
28
Steven Gregory, Professor, Department of Anthropology Patricia E. Grieve, Nancy and Jeffrey Marcus Professor of the Humanities, Department of Spanish and Portuguese Robert E. Harrist, Jane and Leopold Swergold Professor of Chinese Art History, Department of Art History and Archeology Jean E. Howard, William B. Ransford Professor of English, Department of English and Comparative Literature Martha C. Howell, Miriam Champion Professor of History, Department of History Susannah Karlsson, Student Council President, School of General Studies (2006-07) Ira Katznelson, Ruggles Professor of Political Science and History, Department of Political Science and Department of History George Krebs, Student Council President, Columbia College (2008-09) Andrew F. Laine, Vice Chair and Professor of Biomedical Engineering and Professor of Radiology, Department of Biomedical Engineering and Department of Radiology George E. Lewis, Edwin H. Case Professor of Music, Department of Music Claudio W. Lomnitz, Professor, Department of Anthropology Anne E. McDermott, Associate Vice President for Science Initiatives and Professor of Chemistry Christia Mercer, Gustave M. Berne Professor in the Core Curriculum, Department of Philosophy Andrew J. Millis, Chair and Professor, Department of Physics Vijay Modi, Professor, Department of Mechanical Engineering Shahid Naeem, Chair and Professor, Department of Ecology, Evolution, and Environmental Biology Gerald Navratil, Interim Dean, Fu Foundation School of Engineering and Applied Science and Thomas Alva Edison Professor of Applied Physics and Applied Mathematics (2007-09) Daniel A. Okin, Student Council President, School of Engineering and Applied Science (2006-07) Susan G. Pedersen, Professor, Department of History
29
Sheldon Pollock, William B. Ransford Professor of Sanskrit and Indian Studies and Chair, Department of Middle East and Asian Languages and Cultures Austin E. Quigley, Dean of Columbia College and Lucy G. Moses Professor and Brander Matthews Professor of Dramatic Literature Robert Shapiro, Professor, Department of Political Science (2007-09) Elaine Sisman, Anne Parsons Bender Professor of Music, Department of Music Joan E. Spero, Trustee of Columbia University, President of the Doris Duke Charitable Trust Foundation (observer) Elizabeth Strauss, Student Council President, School of Engineering and Applied Science (2007-08) Peter Valeiras, Student Council President, School of Engineering and Applied Science (2008-09) David Weinstein, Carl Sumner Shoup Professor of Japanese Economics, Department of Economics,
Staffing Support for the Task Force and Working Groups
Jerome Davis, Secretary of the University, Office of the President Lucy Drotning, Associate Provost, Office of the Provost Susan Glancy, Chief of Staff, Office of the President Norberto Govin, Data Analyst, Office of the Provost Mia Mendicino, Coordinator of Academic Affairs, Columbia College Scott W. Norum, Vice President for Finance and Administration, Arts and Sciences Evelyn Schwalb, Director, Office of the President Jose Uribe, Research Analyst, Office of the Provost
30
Appendix C
Membership of the Working Groups Working Group on Curricular Structure
Martha Howell, Miriam Champion Professor of History, Department of History, Chair Niko Cunningham, Student Council President, School of General Studies (2007-08) Andrew Delbanco, Julian Clarence Levi Professor in the Humanities, Department of English and Comparative Literature Michelle Diamond, Student Council President, Columbia College (2007-08) Nicholas B. Dirks, Vice President for the Arts and Sciences and Dean of the Faculty and Franz Boas Professor of Anthropology and History Jean Howard, George Delacorte Professor in the Humanities, Department of English and Comparative Literature
Ira Katznelson, Ruggles Professor of Political Science and History, Department of Political Science and the Department of History Andrew F. Laine, Vice Chair and Professor of Biomedical Engineering and Professor of Radiology, Department of Biomedical Engineering and the Department of Radiology Jacob Matilsky, Student Council Representative, General Studies (2007-08) Anne E. McDermott, Associate Vice President for Science Initiatives and Professor of Chemistry Christia Mercer, Gustave M. Berne Professor in the Core Curriculum, Department of Philosophy Austin E. Quigley, Dean, Columbia College and Lucy G. Moses Professor and Brander Matthews Professor of Dramatic Literature Susan Pedersen, James P. Shenton Professor of the Core Curriculum, Department of History Robert Shapiro, Professor, Department of Political Science Elaine Sisman, Anne Parsons Bender Professor of Music, Department of Music
31
Working Group on Globalization Peter Awn, Dean, School of General Studies and Professor of Religion, Chair
Victoria De Grazia, Moore Collegiate Professor of History, Department of History David Freedberg, Pierre Matisse Professor of Art History, Department of Art History and Archeology Robert E. Harrist, Jane and Leopold Swergold Professor of Chinese Art History, Department of Art History and Archeology Robert Hymes, Horace Walpole Carpentier Professor of Oriental Studies, Department of East Asian Languages and Cultures George E. Lewis, Edwin H. Case Professor of Music, Department of Music Lydia Liu, Wun Tsun Tam Professor in the Humanities, Department of East Asian Languages and Cultures Claudio W. Lomnitz, Professor, Department of Anthropology Mahmood Mamdani, Herbert Lehman Professor of Government and Professor of Anthropology, Department of International and Public Affairs and Department of Anthropology Vijay Modi, Professor, Department of Mechanical Engineering Jack Snyder, Robert and Renee Belfer Professor of International Relations, Department of Political Science
Working Group on Organization and Expansion
Alan Brinkley, Provost and Allan Nevins Professor of American History, Chair
Peter Awn, Dean, School of General Studies and Professor of Religion Nicholas B. Dirks, Vice President for the Arts and Sciences and Dean of the Faculty and Franz Boas Professor of Anthropology and History Zvi Galil, Dean, Fu Foundation School of Engineering and Applied Science and Morris A. and Alma Shapiro Professor and Julian Clarence Levi Professor of Mathematical Methods and Computer Science (2006-07)
32
Gerald Navratil, Interim Dean, Fu Foundation School of Engineering and Applied Science and Thomas Alva Edison Professor of Applied Physics and Applied Mathematics (2007-09) Austin E. Quigley, Dean, Columbia College and Lucy G. Moses Professor and Brander Matthews Professor of Dramatic Literature
Working Group on Science Education
Anne E. McDermott, Associate Vice President for Science Initiatives and Professor of Chemistry, Chair
Geraldine Downey, Vice Provost for Diversity Initiatives and Professor of Psychology
Stuart J. Firestein, Professor, Department of Biological Sciences
Morton B. Friedman, Vice Dean, Fu Foundation School of Engineering and Applied Science and Professor of Civil Engineering and Engineering Mechanics
Robert D. Friedman, Professor, Department of Mathematics Charles Hailey, Pupin Professor of Physics, Department of Physics
Mary McGee, Dean of Students and Associate Dean of Faculty, School of General Studies (2006-08)
Andrew J. Millis, Chair and Professor, Department of Physics
Shahid Naeem, Chair and Professor of Ecology, Evolution, and Environmental Biology Gerald Navratil, Interim Dean, Fu Foundation School of Engineering and Applied Science and Thomas Alva Edison Professor of Applied Physics and Applied Mathematics (2007-09)
Duong Phong, Professor, Department of Mathematics
Elizabeth Strauss, Student Council President, School of Engineering and Applied Science (2007-08)
Kathryn Yatrakis, Dean of Academic Affairs, Columbia College
Working Group on Teaching
David Weinstein, Carl Sumner Shoup Professor of Japanese Economics, Department of Economics, Chair
33
Alfred V. Aho, Lawrence Gussman Professor of Computer Science, Department of Computer Science Nicholas Dames, Theodore Kahan Associate Professor in the Humanities, Department of English and Comparative Literature George Deodatis, Professor, Department of Civil Engineering and Engineering Mechanics Michelle Diamond, College Student Council President, Columbia College (2007-08) Patricia E. Grieve, Nancy and Jeffrey Marcus Professor of the Humanities and Chair of Literature Humanities, Department of Spanish and Portuguese Tory Higgins, Stanley Schachter Professor of Psychology and Professor of Business, Department of Psychology and School of Business Nicholas Turro, William P. Schweitzer Professor of Chemistry and Professor of Chemical Engineering and of Environmental Engineering and Materials Science, Department of Chemistry and Department of Earth and Environmental Engineering Gregory Wawro, Professor, Department of Political Science
34
Appendix D
Possible Topics for Working Groups
November 14, 2006 1. Expanding Opportunities
How might we expand curricular opportunities for undergraduates that do not emerge naturally out of existing institutions (departments, institutes, and the core)? Should we create vehicles to encourage more teaching of undergraduates by members of our professional school faculties? By people from outside the University? For more extensive undergraduate instruction in the arts? Is the core carrying too much of the burden of general education? What other mechanisms would facilitate such offerings?
2. Internationalizing the Curriculum
Does our curriculum adequately prepare undergraduates for the new, globalized world in which they will live? What kinds of courses and experiences (e.g. study abroad, internships) do we want them to have, and do we make adequate opportunities available now? Is there reason to review the Major Cultures requirement in response to a changing world?
3. Interdisciplinarity
Do we provide enough interdisciplinary opportunities for undergraduates? Should we consider creating, or making it easier for students to create, joint majors (as opposed to the double majors so many of them now pursue)? What areas of inquiry would be served by new interdisciplinary programs?
4. The Classroom Experience
Who is teaching our students? Are we content with the present situation? Do we need to reconsider the way we staff the core curriculum? Are graduate teaching fellows properly utilized? And what is the mixture of students that undergraduates experience in their classes?
5. The Structure of the Curriculum
Are what some have called the “containers” of our undergraduate curriculum appropriately sized? We probably agree that a strong undergraduate education should include general education (our core), specialized education (our majors), and opportunities for exploration (electives). Do we provide ample opportunities for all three of these goals? Are there adjustments that might make the balance among these elements more appropriate?
35
Appendix D-1 Report of the Working Group on Curricular Structure
Task Force on Undergraduate Education April 22, 2008
Committee Members: Martha Howell, Miriam Champion Professor of History, Chair Andrew Delbanco, Department of English, Julian Clarence Levi Professor in the Humanities Michelle Diamond, Student, President of Columbia College Student Council Jean Howard, Department of English, George Delacorte Professor in the Humanities Andrew Laine, Professor of Biomedical Engineering and Radiology (Physics), SEAS Jacob Matilsky, Academic Affairs Representative, School of General Studies Ann McDermott, Esther Breslow Professor of Biological Chemistry; Associate Vice President for Academic Planning and Science Initiatives Christia Mercer, Department of Philosophy, Gustave M. Berne Professor in the Core Curriculum Susan Pedersen, Department of History, James P. Shenton Professor of the Core Curriculum Austin Quigley, Dean, Columbia College Robert Shapiro, Professor of Political Science Elaine Sisman, Anne Parsons Bender Professor of Music Staff: Lucy Drotning, Associate Provost Mia Mendicino, Coordinator, Academic Affairs, Columbia College
36
Introduction The committee on curricular structure has looked at the curriculum as a whole, both from the point of view of undergraduates and of the faculty who have responsibility for the undergraduate classroom. Much of the year was spent gathering information about the precise structure and content of the curriculum as experienced, not just by Columbia College and General Studies students, but also by students from SEAS, Barnard, the Post-Bac program and the smaller category of “special students,” who together constitute almost half of undergraduate enrollment in Arts and Sciences classrooms. In the past, none of those responsible for undergraduate education has had such robust and detailed information -- not the Deans, not the faculty, and not the Vice President. Although no specific recommendations flow from that material – considerably more study and discussion would have to follow from it – it is clear that responsible planning about faculty resources, structure of the curriculum, and any plans for future growth of the College must begin with the secure knowledge of what our faculty and students are now doing that data of this kind can provide. In the following pages I provide a very abbreviated overview of what we have learned. The principal focus of this report is, however, to present our recommendation that a faculty-led committee be appointed to work with the Deans of Undergraduate and Graduate Education and the Vice President on coordinating curriculum across schools, departments, institutes, and programs and to advise the Vice President regarding allocation of faculty resources to undergraduate teaching. As the data I present makes clear, our present structure, the product of a complex history of once-distinct schools and faculties, makes it hard for faculty, Deans, and the Vice President to work together on planning undergraduate education. In our view, the Educational Policy and Planning Committee we recommend would provide the structure for assuring better use of our faculty resources, better fits among departmental curricula, better coordination with the College’s Core curriculum, and better planning about such cross-school matters as advising, grading, assignment of credits, and the like. We have devoted a lot of thought and discussion to the committee’s functions and structure. Although the precise composition of the committee is not finally decided, it is clear that we want faculty to have ownership and leadership of the committee but we also want them to be positioned to draw upon the expertise of senior administrators, to have access to the data that research staff in the Provost’s, Vice President’s, and College Dean’s office are now able to provide, and to be able to plan together with the Schools, Departments, Institutes, and Programs that manage curriculum. We do not intend that this committee replace any existing structures at these levels, but expect that it will work with, and among, them to improve communication and planning and to standardize policies where such standardization makes sense.
Curricular Structure The following analysis of some defining features of our overall curriculum is keyed to a power point presentation that is attached in a separate file. It is based on extensive research of enrollment patterns, course offerings, and faculty allocation, but the slides are not intended to summarize the range or depth of that research. Instead, they attempt only to sketch an overview of the whole. In particular, the presentation omits any consideration of our science programs, since a separate committee is reporting on that aspect of our curriculum.
37
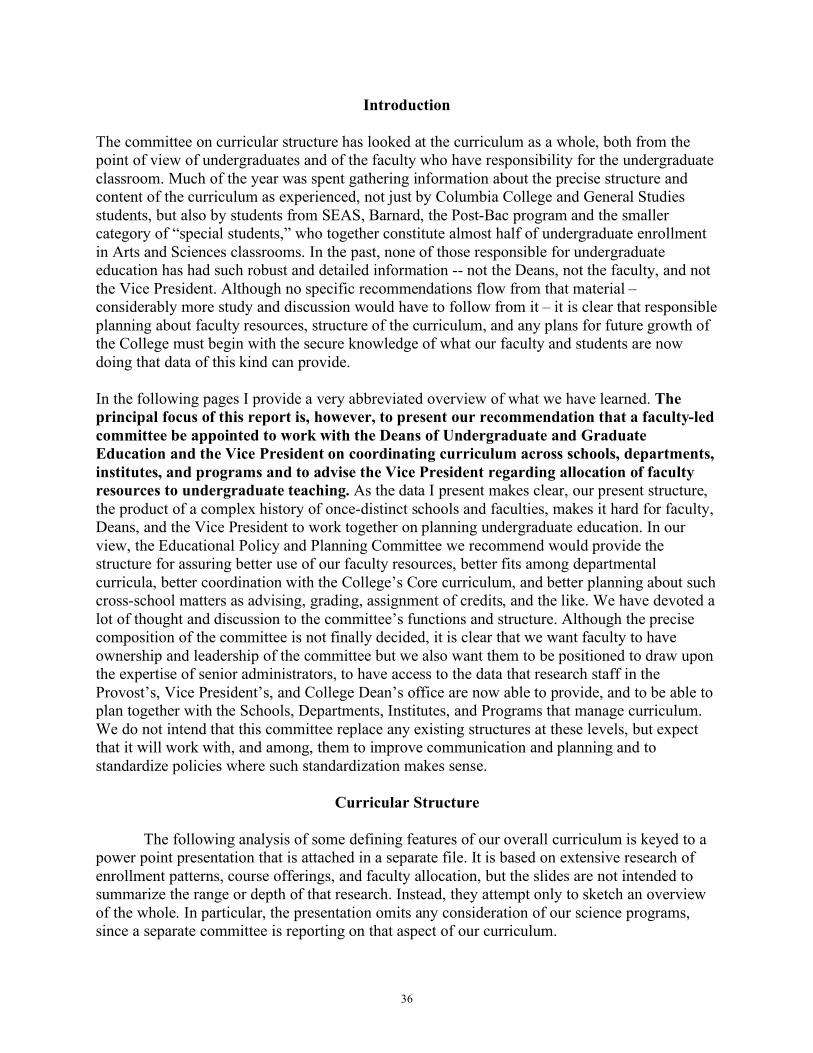
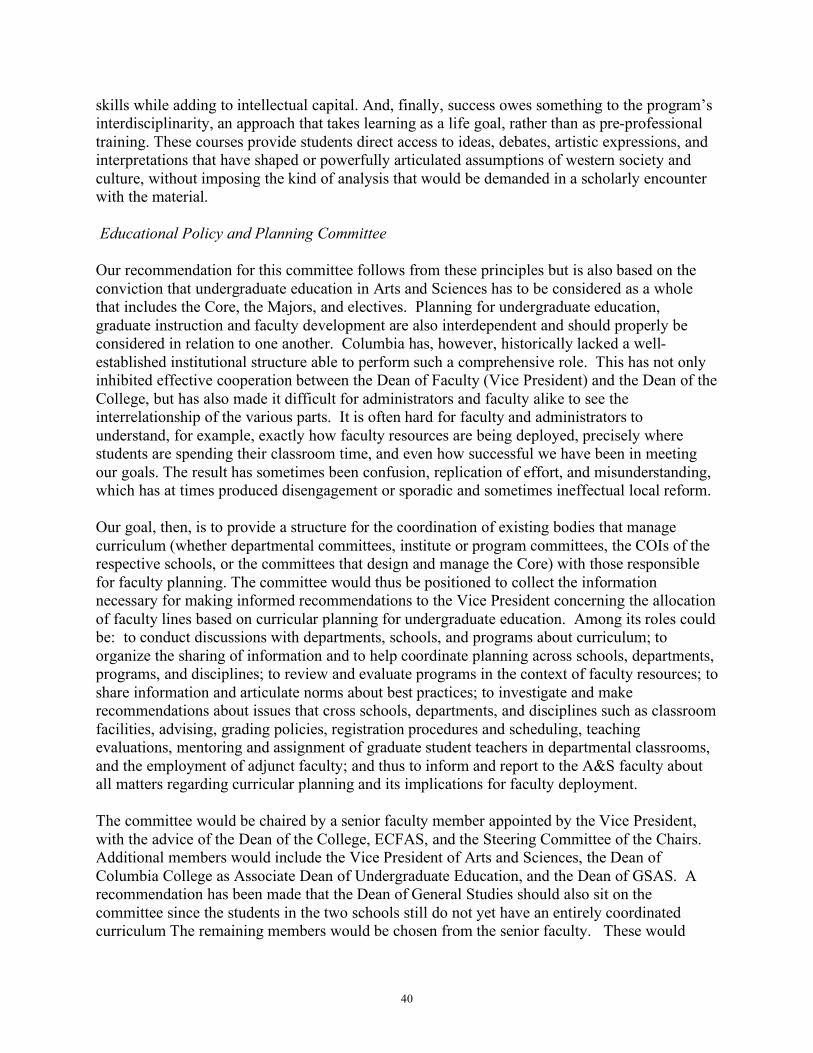
The first slide is intended to represent the overall experience of Columbia College students. Slide 1
• Of the 124 credits required for graduation, 29 are spent in Core courses: Lit Hum, CC, Music Hum, Art Hum, Frontiers of Science, and University Writing.
• Another 14 to 34 are spent on two more science courses, two courses in the Major Cultures sequence, and up to four courses of basic language instruction (students can place out but less than a third of College students are exempted from the entire requirement). Together, the Core and these “distributional” courses make up Columbia College’s General Education program. Both General Studies and SEAS students have access to parts of that program, but not in its entirety.
• Between 29 and 69 credits are devoted to a major (if the student chooses to major; it is possible to graduate only with a smaller “concentration” but few students do).
• On average, then (taking 39 credits as the actual weighted average major), students spend 35-51% of their time in General Education courses (Core plus the required science, Major Cultures and language courses), 31% in the major, and 18-34% of the time on electives.
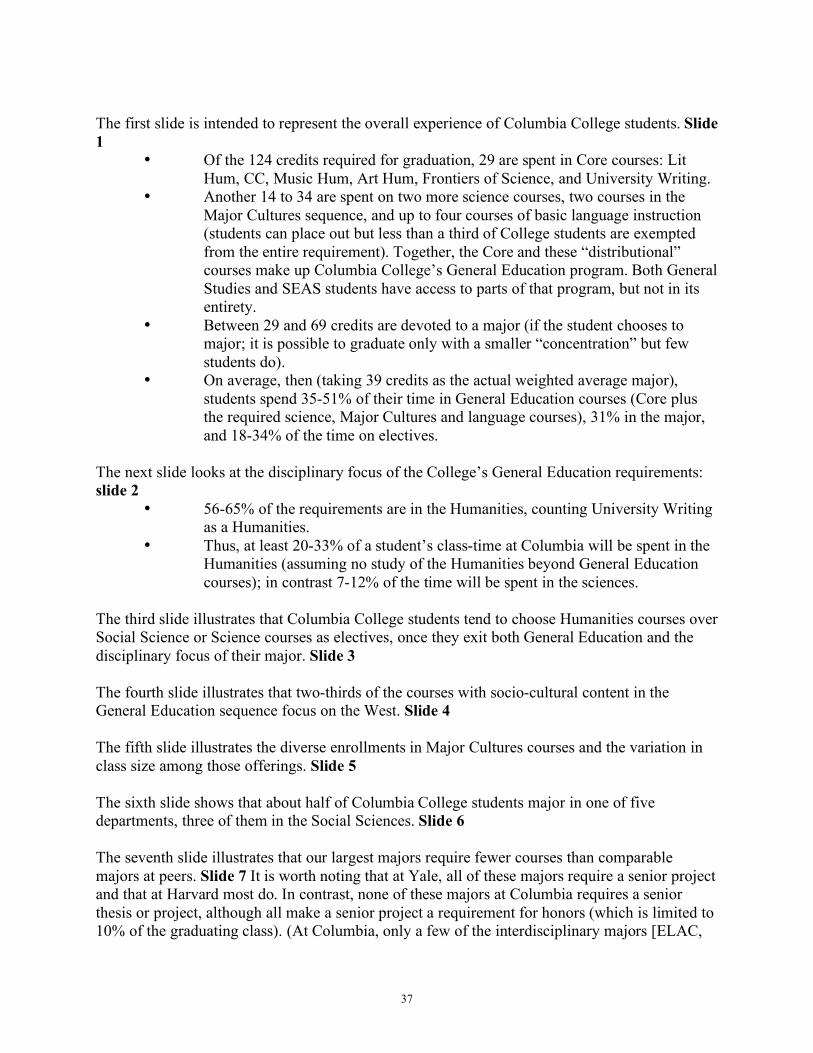
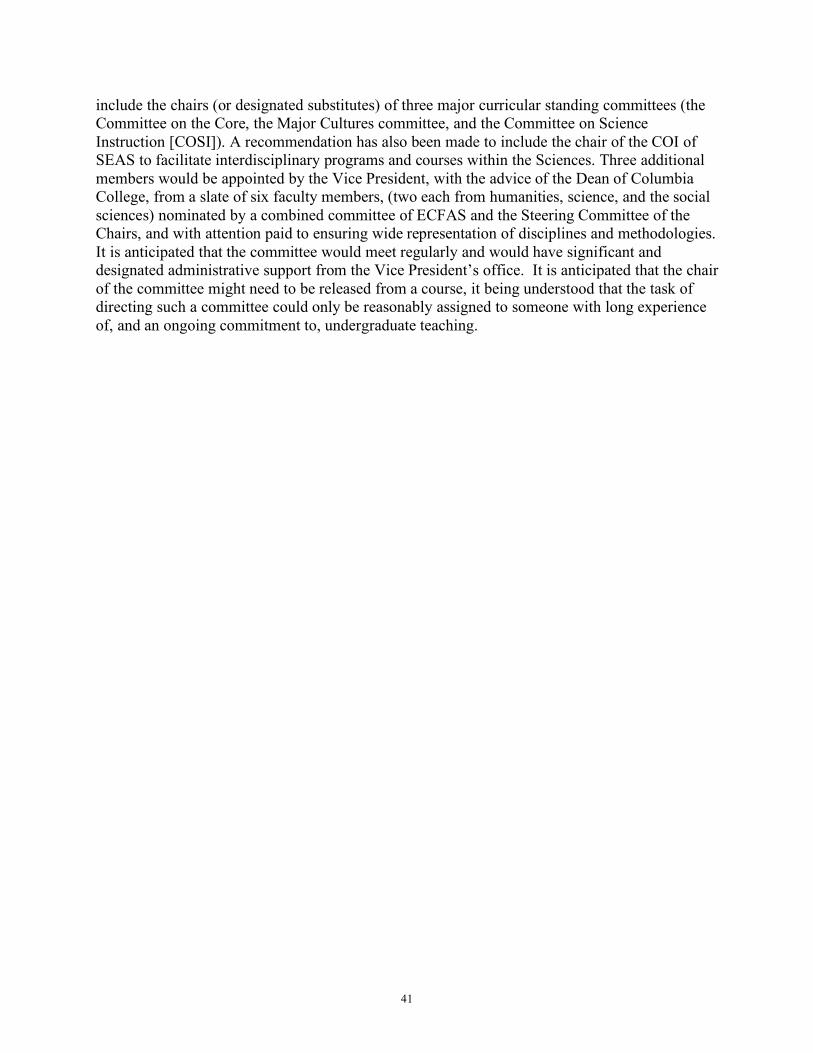
The next slide looks at the disciplinary focus of the College’s General Education requirements: slide 2
• 56-65% of the requirements are in the Humanities, counting University Writing as a Humanities.
• Thus, at least 20-33% of a student’s class-time at Columbia will be spent in the Humanities (assuming no study of the Humanities beyond General Education courses); in contrast 7-12% of the time will be spent in the sciences.
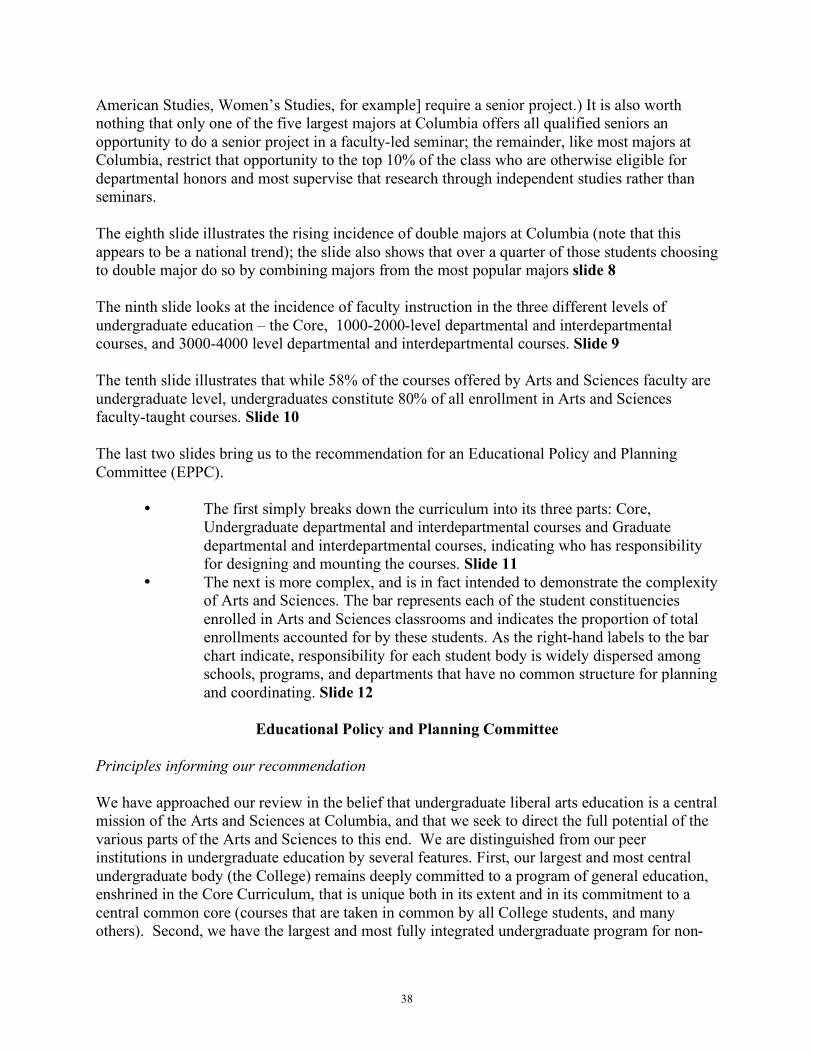
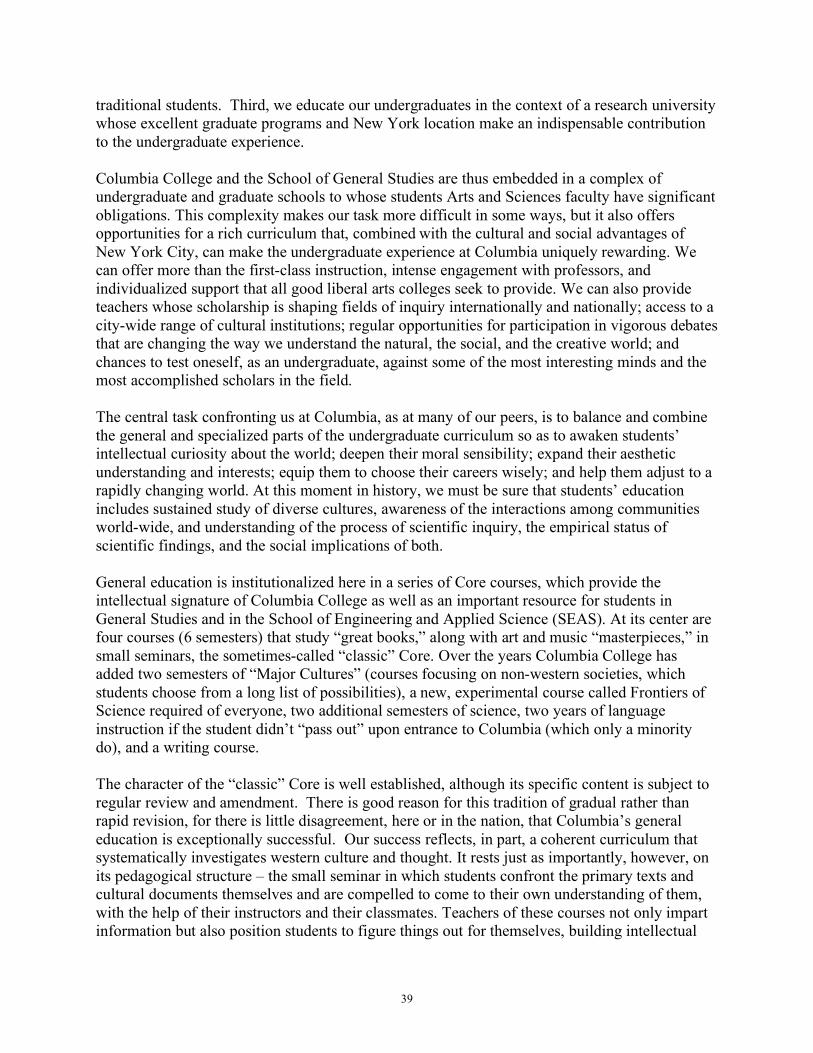
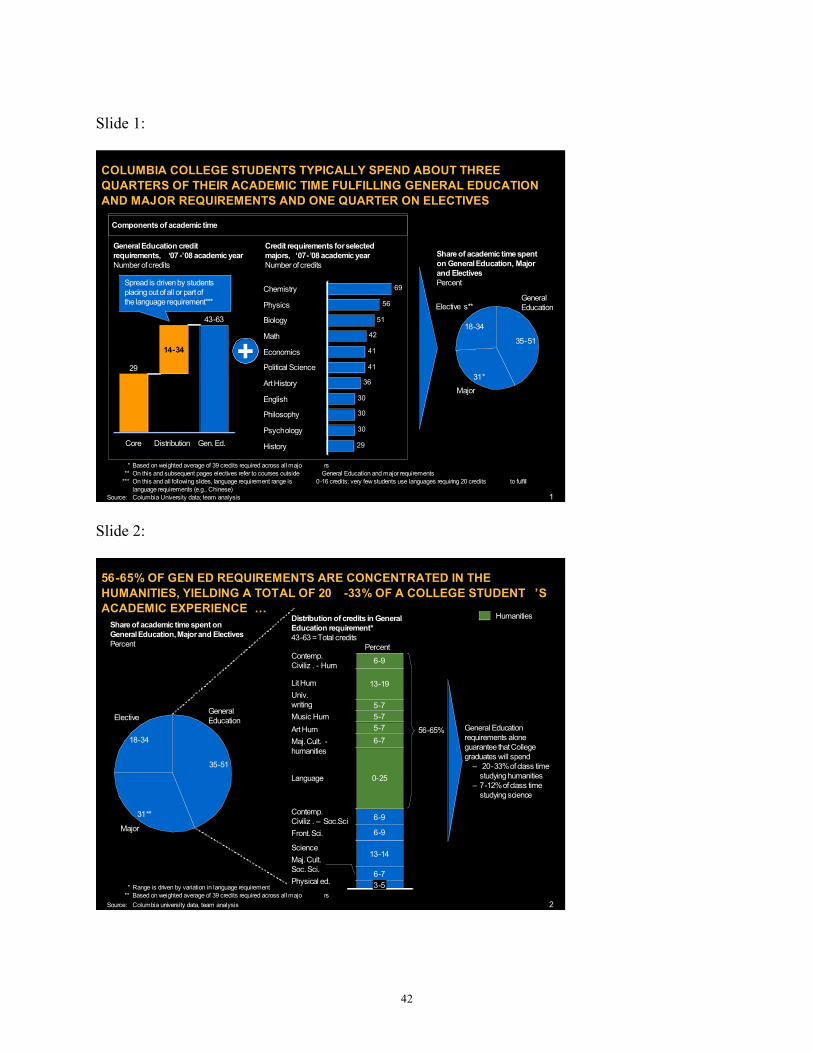
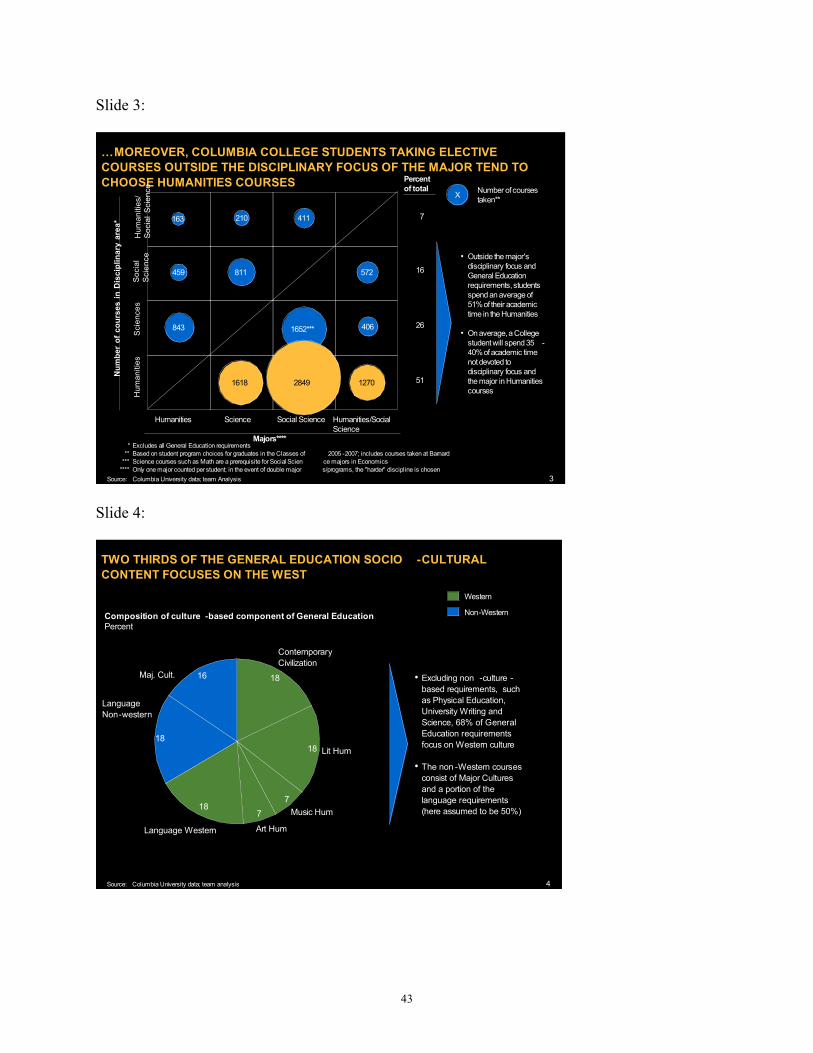
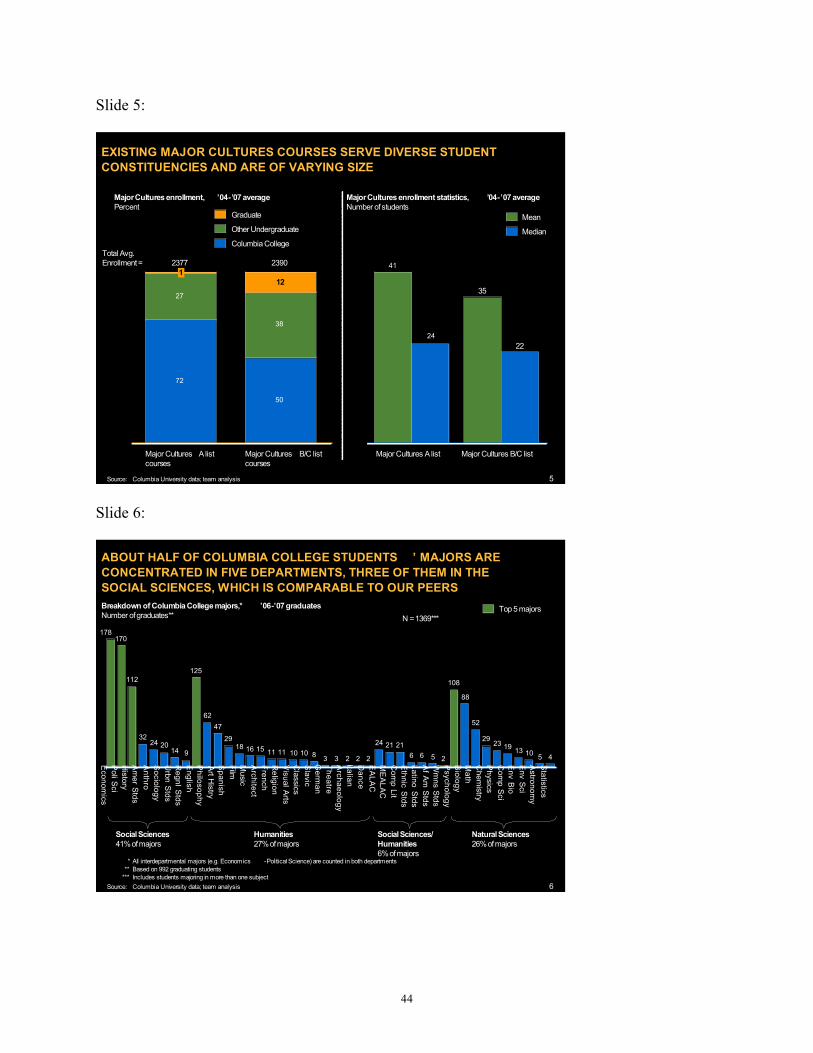
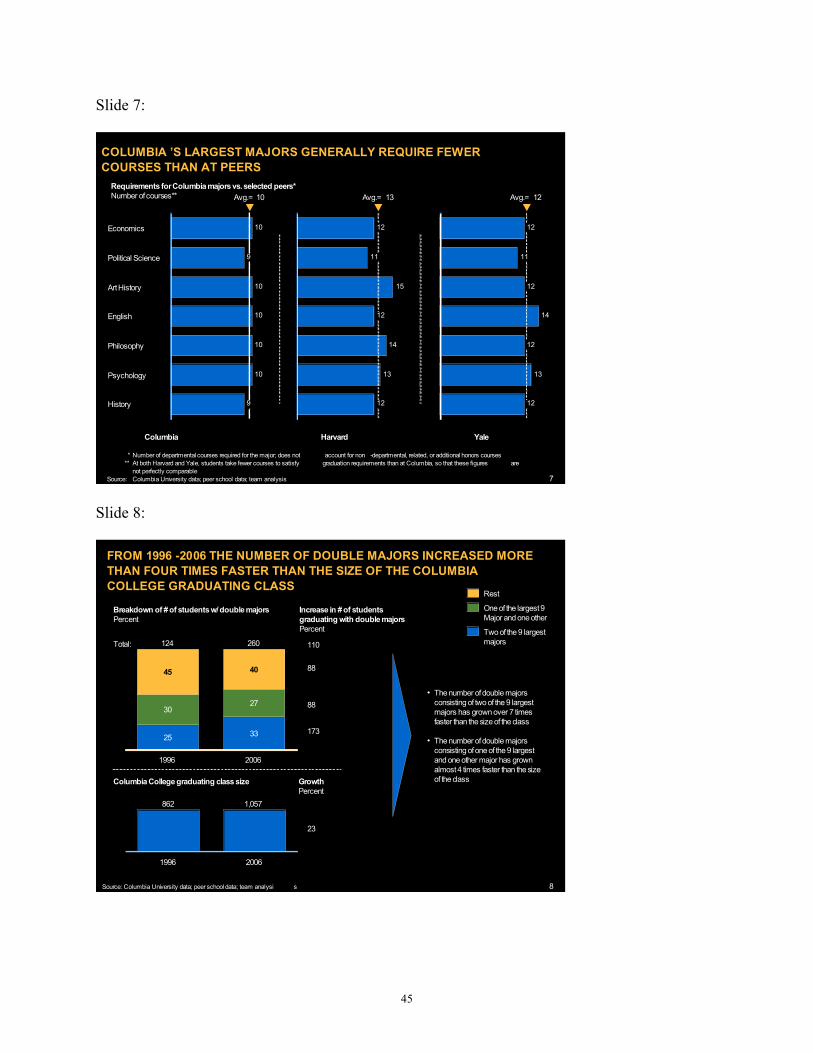
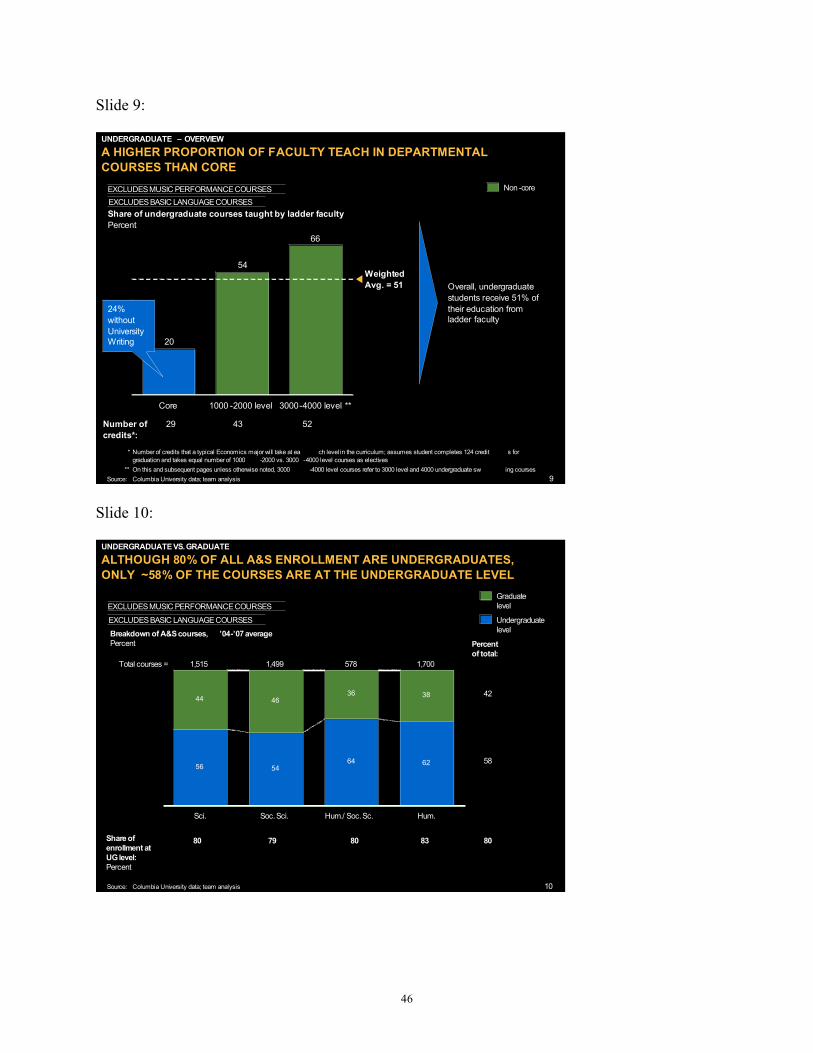
The third slide illustrates that Columbia College students tend to choose Humanities courses over Social Science or Science courses as electives, once they exit both General Education and the disciplinary focus of their major. Slide 3 The fourth slide illustrates that two-thirds of the courses with socio-cultural content in the General Education sequence focus on the West. Slide 4 The fifth slide illustrates the diverse enrollments in Major Cultures courses and the variation in class size among those offerings. Slide 5 The sixth slide shows that about half of Columbia College students major in one of five departments, three of them in the Social Sciences. Slide 6 The seventh slide illustrates that our largest majors require fewer courses than comparable majors at peers. Slide 7 It is worth noting that at Yale, all of these majors require a senior project and that at Harvard most do. In contrast, none of these majors at Columbia requires a senior thesis or project, although all make a senior project a requirement for honors (which is limited to 10% of the graduating class). (At Columbia, only a few of the interdisciplinary majors [ELAC,
38
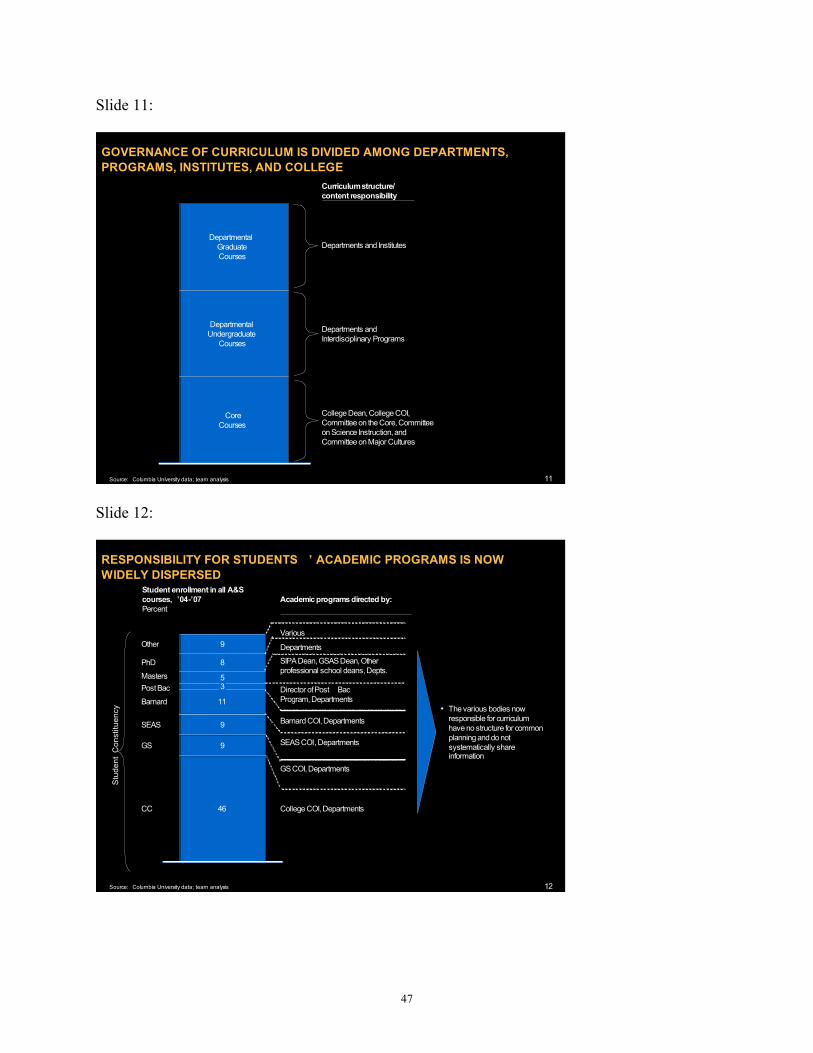
American Studies, Women’s Studies, for example] require a senior project.) It is also worth nothing that only one of the five largest majors at Columbia offers all qualified seniors an opportunity to do a senior project in a faculty-led seminar; the remainder, like most majors at Columbia, restrict that opportunity to the top 10% of the class who are otherwise eligible for departmental honors and most supervise that research through independent studies rather than seminars. The eighth slide illustrates the rising incidence of double majors at Columbia (note that this appears to be a national trend); the slide also shows that over a quarter of those students choosing to double major do so by combining majors from the most popular majors slide 8 The ninth slide looks at the incidence of faculty instruction in the three different levels of undergraduate education – the Core, 1000-2000-level departmental and interdepartmental courses, and 3000-4000 level departmental and interdepartmental courses. Slide 9 The tenth slide illustrates that while 58% of the courses offered by Arts and Sciences faculty are undergraduate level, undergraduates constitute 80% of all enrollment in Arts and Sciences faculty-taught courses. Slide 10 The last two slides bring us to the recommendation for an Educational Policy and Planning Committee (EPPC).
• The first simply breaks down the curriculum into its three parts: Core, Undergraduate departmental and interdepartmental courses and Graduate departmental and interdepartmental courses, indicating who has responsibility for designing and mounting the courses. Slide 11
• The next is more complex, and is in fact intended to demonstrate the complexity of Arts and Sciences. The bar represents each of the student constituencies enrolled in Arts and Sciences classrooms and indicates the proportion of total enrollments accounted for by these students. As the right-hand labels to the bar chart indicate, responsibility for each student body is widely dispersed among schools, programs, and departments that have no common structure for planning and coordinating. Slide 12
Educational Policy and Planning Committee
Principles informing our recommendation We have approached our review in the belief that undergraduate liberal arts education is a central mission of the Arts and Sciences at Columbia, and that we seek to direct the full potential of the various parts of the Arts and Sciences to this end. We are distinguished from our peer institutions in undergraduate education by several features. First, our largest and most central undergraduate body (the College) remains deeply committed to a program of general education, enshrined in the Core Curriculum, that is unique both in its extent and in its commitment to a central common core (courses that are taken in common by all College students, and many others). Second, we have the largest and most fully integrated undergraduate program for non-
39
traditional students. Third, we educate our undergraduates in the context of a research university whose excellent graduate programs and New York location make an indispensable contribution to the undergraduate experience. Columbia College and the School of General Studies are thus embedded in a complex of undergraduate and graduate schools to whose students Arts and Sciences faculty have significant obligations. This complexity makes our task more difficult in some ways, but it also offers opportunities for a rich curriculum that, combined with the cultural and social advantages of New York City, can make the undergraduate experience at Columbia uniquely rewarding. We can offer more than the first-class instruction, intense engagement with professors, and individualized support that all good liberal arts colleges seek to provide. We can also provide teachers whose scholarship is shaping fields of inquiry internationally and nationally; access to a city-wide range of cultural institutions; regular opportunities for participation in vigorous debates that are changing the way we understand the natural, the social, and the creative world; and chances to test oneself, as an undergraduate, against some of the most interesting minds and the most accomplished scholars in the field. The central task confronting us at Columbia, as at many of our peers, is to balance and combine the general and specialized parts of the undergraduate curriculum so as to awaken students’ intellectual curiosity about the world; deepen their moral sensibility; expand their aesthetic understanding and interests; equip them to choose their careers wisely; and help them adjust to a rapidly changing world. At this moment in history, we must be sure that students’ education includes sustained study of diverse cultures, awareness of the interactions among communities world-wide, and understanding of the process of scientific inquiry, the empirical status of scientific findings, and the social implications of both. General education is institutionalized here in a series of Core courses, which provide the intellectual signature of Columbia College as well as an important resource for students in General Studies and in the School of Engineering and Applied Science (SEAS). At its center are four courses (6 semesters) that study “great books,” along with art and music “masterpieces,” in small seminars, the sometimes-called “classic” Core. Over the years Columbia College has added two semesters of “Major Cultures” (courses focusing on non-western societies, which students choose from a long list of possibilities), a new, experimental course called Frontiers of Science required of everyone, two additional semesters of science, two years of language instruction if the student didn’t “pass out” upon entrance to Columbia (which only a minority do), and a writing course. The character of the “classic” Core is well established, although its specific content is subject to regular review and amendment. There is good reason for this tradition of gradual rather than rapid revision, for there is little disagreement, here or in the nation, that Columbia’s general education is exceptionally successful. Our success reflects, in part, a coherent curriculum that systematically investigates western culture and thought. It rests just as importantly, however, on its pedagogical structure – the small seminar in which students confront the primary texts and cultural documents themselves and are compelled to come to their own understanding of them, with the help of their instructors and their classmates. Teachers of these courses not only impart information but also position students to figure things out for themselves, building intellectual
40
skills while adding to intellectual capital. And, finally, success owes something to the program’s interdisciplinarity, an approach that takes learning as a life goal, rather than as pre-professional training. These courses provide students direct access to ideas, debates, artistic expressions, and interpretations that have shaped or powerfully articulated assumptions of western society and culture, without imposing the kind of analysis that would be demanded in a scholarly encounter with the material. Educational Policy and Planning Committee Our recommendation for this committee follows from these principles but is also based on the conviction that undergraduate education in Arts and Sciences has to be considered as a whole that includes the Core, the Majors, and electives. Planning for undergraduate education, graduate instruction and faculty development are also interdependent and should properly be considered in relation to one another. Columbia has, however, historically lacked a well-established institutional structure able to perform such a comprehensive role. This has not only inhibited effective cooperation between the Dean of Faculty (Vice President) and the Dean of the College, but has also made it difficult for administrators and faculty alike to see the interrelationship of the various parts. It is often hard for faculty and administrators to understand, for example, exactly how faculty resources are being deployed, precisely where students are spending their classroom time, and even how successful we have been in meeting our goals. The result has sometimes been confusion, replication of effort, and misunderstanding, which has at times produced disengagement or sporadic and sometimes ineffectual local reform. Our goal, then, is to provide a structure for the coordination of existing bodies that manage curriculum (whether departmental committees, institute or program committees, the COIs of the respective schools, or the committees that design and manage the Core) with those responsible for faculty planning. The committee would thus be positioned to collect the information necessary for making informed recommendations to the Vice President concerning the allocation of faculty lines based on curricular planning for undergraduate education. Among its roles could be: to conduct discussions with departments, schools, and programs about curriculum; to organize the sharing of information and to help coordinate planning across schools, departments, programs, and disciplines; to review and evaluate programs in the context of faculty resources; to share information and articulate norms about best practices; to investigate and make recommendations about issues that cross schools, departments, and disciplines such as classroom facilities, advising, grading policies, registration procedures and scheduling, teaching evaluations, mentoring and assignment of graduate student teachers in departmental classrooms, and the employment of adjunct faculty; and thus to inform and report to the A&S faculty about all matters regarding curricular planning and its implications for faculty deployment. The committee would be chaired by a senior faculty member appointed by the Vice President, with the advice of the Dean of the College, ECFAS, and the Steering Committee of the Chairs. Additional members would include the Vice President of Arts and Sciences, the Dean of Columbia College as Associate Dean of Undergraduate Education, and the Dean of GSAS. A recommendation has been made that the Dean of General Studies should also sit on the committee since the students in the two schools still do not yet have an entirely coordinated curriculum The remaining members would be chosen from the senior faculty. These would
41
include the chairs (or designated substitutes) of three major curricular standing committees (the Committee on the Core, the Major Cultures committee, and the Committee on Science Instruction [COSI]). A recommendation has also been made to include the chair of the COI of SEAS to facilitate interdisciplinary programs and courses within the Sciences. Three additional members would be appointed by the Vice President, with the advice of the Dean of Columbia College, from a slate of six faculty members, (two each from humanities, science, and the social sciences) nominated by a combined committee of ECFAS and the Steering Committee of the Chairs, and with attention paid to ensuring wide representation of disciplines and methodologies. It is anticipated that the committee would meet regularly and would have significant and designated administrative support from the Vice President’s office. It is anticipated that the chair of the committee might need to be released from a course, it being understood that the task of directing such a committee could only be reasonably assigned to someone with long experience of, and an ongoing commitment to, undergraduate teaching.
42
Slide 1:
1
Components of academic time
COLUMBIA COLLEGE STUDENTS TYPICALLY SPEND ABOUT THREE
QUARTERS OF THEIR ACADEMIC TIME FULFILLING GENERAL EDUCATION
AND MAJOR REQUIREMENTS AND ONE QUARTER ON ELECTIVES
* Based on weighted average of 39 credits required across all majo rs
** On this and subsequent pages electives refer to courses outside General Education and major requirements
*** On this and all following slides, language requirement range is 0-16 credits; very few students use languages requiring 20 credits to fulfill
language requirements (e.g., Chinese)
Source: Columbia University data; team analysis
29
Core
14-34
Distribution
43-63
Gen. Ed. 29
30
30
30
36
41
41
42
51
56
69Chemistry
Physics
Biology
Math
Economics
Political Science
Art History
English
Philosophy
Psychology
History
35-51
General
Education
31*
Major
18-34
Elective s**
Share of academic time spent
on General Education, Major
and Electives
Percent
General Education credit
requirements, ‘07 -’08 academic year
Number of credits
Credit requirements for selected
majors, ‘07-’08 academic year
Number of credits
+
Spread is driven by students
placing out of all or part of
the language requirement***
Slide 2:
2
56-65% OF GEN ED REQUIREMENTS ARE CONCENTRATED IN THE
HUMANITIES, YIELDING A TOTAL OF 20 -33% OF A COLLEGE STUDENT ’S
ACADEMIC EXPERIENCE …
* Range is driven by variation in language requirement
** Based on weighted average of 39 credits required across all majo rs
Source: Columbia university data, team analysis
Share of academic time spent on
General Education, Major and Electives
Percent
3-5
PercentContemp.
Civiliz . - Hum
Lit Hum
Univ.
writing
Music Hum
Art Hum
Maj. Cult. -
humanities
Language
Contemp.
Civiliz . – Soc.Sci
Front. Sci.
Science
Maj. Cult.
Soc. Sci.
Physical ed.
6-9
13-19
5-7
5-7
5-7
6-7
0-25
6-9
6-9
13-14
6-7
Distribution of credits in General
Education requirement*
43-63 = Total credits
General Education
requirements alone
guarantee that College
graduates will spend
– 20-33% of class time
studying humanities
– 7-12% of class time
studying science
Humanities
35-51
General
Education
31**
Major
18-34
Elective
56-65%
43
Slide 3:
3
…MOREOVER, COLUMBIA COLLEGE STUDENTS TAKING ELECTIVE
COURSES OUTSIDE THE DISCIPLINARY FOCUS OF THE MAJOR TEND TO
CHOOSE HUMANITIES COURSES
* Excludes all General Education requirements
** Based on student program choices for graduates in the Classes of 2005 -2007; includes courses taken at Barnard
*** Science courses such as Math are a prerequisite for Social Scien ce majors in Economics
**** Only one major counted per student; in the event of double major s/programs, the "harder" discipline is chosen
Source: Columbia University data; team Analysis
Majors****
Humanities Science Social Science Humanities/Social
Science
Nu
mb
er
of
co
urs
es
in
Dis
cip
lin
ary
are
a*
Scie
nce
sS
ocia
l
Scie
nce
Hu
ma
nitie
s/
So
cia
l S
cie
nce
Hu
ma
nitie
s
459 811
210163
843
572
4061652***
411
• Outside the major's
disciplinary focus and
General Education
requirements, students
spend an average of
51% of their academic
time in the Humanities
• On average, a College
student will spend 35 -
40% of academic time
not devoted to
disciplinary focus and
the major in Humanities
courses
XNumber of courses
taken**
2849 12701618
7
Percent
of total
16
26
51
Slide 4:
4
TWO THIRDS OF THE GENERAL EDUCATION SOCIO -CULTURAL
CONTENT FOCUSES ON THE WEST
Source: Columbia University data; team analysis
16
18
187
7
18
18
Contemporary
Civilization
Lit Hum
Music Hum
Art HumLanguage Western
Language
Non-western
Maj. Cult.
Non-Western
Western
Composition of culture -based component of General Education
Percent
• Excluding non -culture -
based requirements, such
as Physical Education,
University Writing and
Science, 68% of General
Education requirements
focus on Western culture
• The non -Western courses
consist of Major Cultures
and a portion of the
language requirements
(here assumed to be 50%)
44
Slide 5:
5
EXISTING MAJOR CULTURES COURSES SERVE DIVERSE STUDENT
CONSTITUENCIES AND ARE OF VARYING SIZE
Source: Columbia University data; team analysis
Major Cultures enrollment, ’04-’07 average
Percent
72
50
27
38
2377 2390
1
Major Cultures A list
courses
12
Major Cultures B/C list
courses
Graduate
Other Undergraduate
Columbia College
41
24
Major Cultures A list
35
22
Major Cultures B/C list
Mean
Median
Major Cultures enrollment statistics, ’04-’07 average
Number of students
Total Avg.
Enrollment =
Slide 6:
6
ABOUT HALF OF COLUMBIA COLLEGE STUDENTS ’ MAJORS ARE
CONCENTRATED IN FIVE DEPARTMENTS, THREE OF THEM IN THE
SOCIAL SCIENCES, WHICH IS COMPARABLE TO OUR PEERS
* All interdepartmental majors (e.g. Economics -Political Science) are counted in both departments
** Based on 992 graduating students
*** Includes students majoring in more than one subject
Source: Columbia University data; team analysis
451013
192329
52
88
108
2566
212124
22233810101111151618
29
47
62
125
9142024
32
112
170178
Sla
vic
Cla
ssic
s
En
v B
io
Astro
no
my
En
v S
ci
Sta
tistic
s
Arc
ha
eo
log
y
Th
ea
tre
Da
nce
EA
LA
C
ME
AL
AC
Co
mp
Lit
Eth
nic
Std
s
La
tino
Std
s
Af A
m S
tds
Wm
ns S
tds
Psych
olo
gy
Co
mp
Sci
Ph
ysic
s
Chem
istry
Ma
th
Bio
log
y
En
glis
h
Re
gn
l Std
s
Urb
n S
tds
So
cio
log
y
An
thro
Am
er S
tds
His
tory
Po
li Sci
Eco
no
mic
s
Film
Sp
an
ish
Vis
ua
l Arts
Re
ligio
n
Fre
nch
Arc
hite
ct
Music
Art H
istry
Ph
iloso
ph
y
Social Sciences
41% of majors
Humanities
27% of majors
Natural Sciences
26% of majors
Breakdown of Columbia College majors,* ’06-’07 graduates
Number of graduates**
Social Sciences/
Humanities
6% of majors
N = 1369***
Top 5 majors
Ge
rma
n
Italia
n
45
Slide 7:
7
COLUMBIA ’S LARGEST MAJORS GENERALLY REQUIRE FEWER
COURSES THAN AT PEERS
Requirements for Columbia majors vs. selected peers*
Number of courses**
Columbia Harvard Yale
9
10
10
10
10
9
10
Avg.= 10
Economics
Political Science
Art History
English
Philosophy
Psychology
History
* Number of departmental courses required for the major; does not account for non -departmental, related, or additional honors courses
** At both Harvard and Yale, students take fewer courses to satisfy graduation requirements than at Columbia, so that these figures are
not perfectly comparable
Source: Columbia University data; peer school data; team analysis
12
13
14
12
15
11
12
Avg.= 13
12
13
12
14
12
11
12
Avg.= 12
Slide 8:
8
FROM 1996 -2006 THE NUMBER OF DOUBLE MAJORS INCREASED MORE
THAN FOUR TIMES FASTER THAN THE SIZE OF THE COLUMBIA
COLLEGE GRADUATING CLASS
Breakdown of # of students w/ double majors
Percent
Source: Columbia University data; peer school data; team analysi s
Increase in # of students
graduating with double majors
Percent
Total:
88
88
173
110
862
1996
1,057
2006
Growth
Percent
23
• The number of double majors
consisting of two of the 9 largest
majors has grown over 7 times
faster than the size of the class
• The number of double majors
consisting of one of the 9 largest
and one other major has grown
almost 4 times faster than the size
of the classColumbia College graduating class size
2006
45
One of the largest 9
Major and one other
124 260
Two of the 9 largest
majors
Rest
27
33
1996
40
30
25
46
Slide 9:
9
A HIGHER PROPORTION OF FACULTY TEACH IN DEPARTMENTAL
COURSES THAN CORE
* Number of credits that a typical Economics major will take at ea ch level in the curriculum; assumes student completes 124 credit s for
graduation and takes equal number of 1000 -2000 vs. 3000 -4000 level courses as electives
** On this and subsequent pages unless otherwise noted, 3000 -4000 level courses refer to 3000 level and 4000 undergraduate sw ing courses
Source: Columbia University data; team analysis
Non -core
Share of undergraduate courses taught by ladder faculty
Percent
Overall, undergraduate
students receive 51% of
their education from
ladder faculty
UNDERGRADUATE – OVERVIEW
66
54
20
Core 1000 -2000 level 3000-4000 level **
Weighted
Avg. = 51
29 43 52Number of
credits*:
EXCLUDES BASIC LANGUAGE COURSES
EXCLUDES MUSIC PERFORMANCE COURSES
24%
without
University
Writing
Slide 10:
10
ALTHOUGH 80% OF ALL A&S ENROLLMENT ARE UNDERGRADUATES,
ONLY ~58% OF THE COURSES ARE AT THE UNDERGRADUATE LEVEL
56 5464 62
44 4636 38
1,515
Sci.
1,499
Soc. Sci.
578
Hum./ Soc. Sc.
1,700
Hum.
Graduate
level
Undergraduate
level
Total courses =
Breakdown of A&S courses, ’04-’07 average
Percent
Source: Columbia University data; team analysis
Percent
of total:
42
58
Share of
enrollment at
UG level:
Percent
80 79 80 83 80
UNDERGRADUATE VS. GRADUATE
EXCLUDES BASIC LANGUAGE COURSES
EXCLUDES MUSIC PERFORMANCE COURSES
47
Slide 11:
11
GOVERNANCE OF CURRICULUM IS DIVIDED AMONG DEPARTMENTS,
PROGRAMS, INSTITUTES, AND COLLEGE
Source: Columbia University data; team analysis
Departmental
Graduate
Courses
Departmental
Undergraduate
Courses
Core
Courses
Departments and Institutes
Departments and
Interdisciplinary Programs
College Dean, College COI,
Committee on the Core, Committee
on Science Instruction, and
Committee on Major Cultures
Curriculum structure/
content responsibility
Slide 12:
12
RESPONSIBILITY FOR STUDENTS ’ ACADEMIC PROGRAMS IS NOW
WIDELY DISPERSED
Source: Columbia University data; team analysis
9
8
53
11
9
9
46
Other
PhD
Masters
Post Bac
Barnard
SEAS
GS
CC
Student enrollment in all A&S
courses, ’04-’07
Percent
Academic programs directed by:
Various
Departments
SIPA Dean, GSAS Dean, Other
professional school deans, Depts.
SEAS COI, Departments
GS COI, Departments
Barnard COI, Departments
Director of Post Bac
Program, Departments
• The various bodies now
responsible for curriculum
have no structure for common
planning and do not
systematically share information
College COI, Departments
Stu
de
nt
Co
nstitu
en
cy
48
Appendix D-2 Considering College Expansion
Task Force on Undergraduate Education March 2, 2007
Considering College Expansion
March 2, 2007
Page 3
N Y O - A A A 1 2 3 - 2 0 0 6 0 5 1 5 -
3
Working D
raft -
Last M
odified 5/15/2006
11:20:48 P
MP
rinted 5/15/2006
10:41:47 P
M
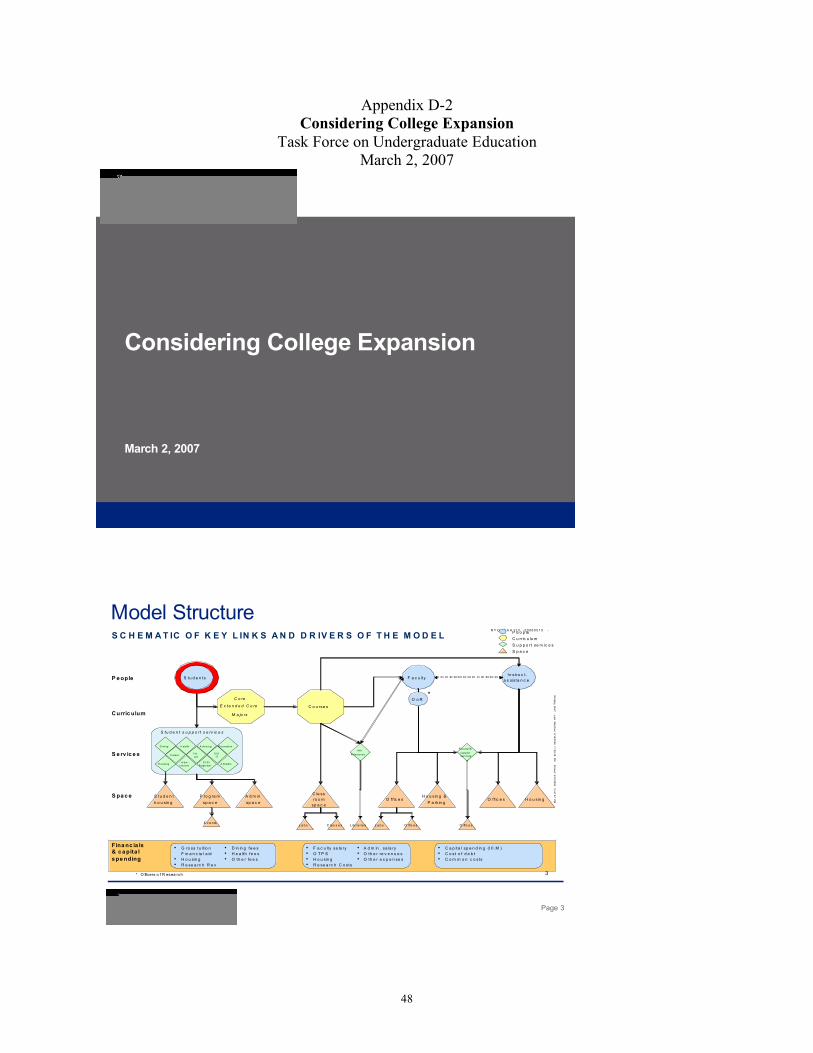
S C H E M A T IC O F K E Y L IN K S A N D D R IV E R S O F T H E M O D E L
P e ople
Curric ulum
S e rv ic e s
S pa c e
Fina nc ia ls & c a pita l s pe nding
P ro g ra msp a c e
C o u rse s
C la ssro o m
sp a c e
In st ru c t .a s sista n c eS tu d e n ts
* O fficers o f R esea rch
O f f ic e sH o u sin g &
P a rkin gS tu d e n th o u sin g
O f f ic e s H o u sin g
F a c u lty
• G ro ss tu it io nF in a n c ia l a id
• H o u sin g• R e se a rc h R e v
• D in in g fe e s• H e a lth fe e s• O th e r fe e s
• F a c u lty sa la ry• O T P S• H o u sin g• R e se a rc h C o sts
• A d m in . sa la ry• O th e r re v e n u e s• O th e r e x p e n se s
• C a p ita l sp e n d in g (I I I .M )• C o st o f d e b t• C o m m o n c o sts
*
D ining H eal th A dv is ing R ec reation
Fin.a id
H ous ingA dm -
is s ionsS FS /
R egis trarA th le tic s
C areer
Fac ul ty /IA
s upport s erv ic es
S ISIT
A d m insp a c e
O o RC o re
E x te n d e d C o re
M a jo rs
In fo
R es ourc es
L a b s C la s s e s L a b s O ffic e s
P e o p leC u rric u lu mS u p p o rt se rv ic e sS p a c e
O ffic e s
S tu d e n t s u p p o rt s e rv ic e s
E v e n tsL ib r a r ie s
Model Structure
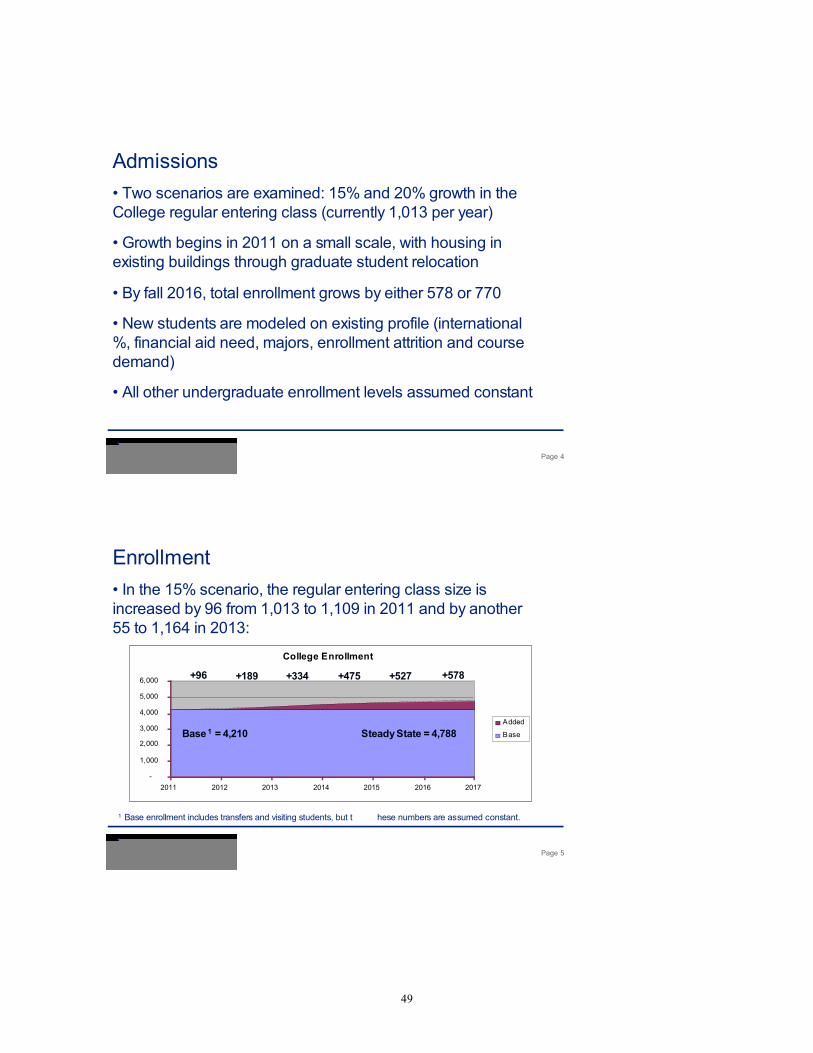
49
Page 4
Admissions• Two scenarios are examined: 15% and 20% growth in the College regular entering class (currently 1,013 per year)
• Growth begins in 2011 on a small scale, with housing in existing buildings through graduate student relocation
• By fall 2016, total enrollment grows by either 578 or 770
• New students are modeled on existing profile (international %, financial aid need, majors, enrollment attrition and course demand)
• All other undergraduate enrollment levels assumed constant
Page 5
College Enrollment
-
1,000
2,000
3,000
4,000
5,000
6,000
2011 2012 2013 2014 2015 2016 2017
Added
Base
Enrollment• In the 15% scenario, the regular entering class size is increased by 96 from 1,013 to 1,109 in 2011 and by another 55 to 1,164 in 2013:
+96 +189 +334 +475 +527 +578
Base 1 = 4,210 Steady State = 4,788
1 Base enrollment includes transfers and visiting students, but t hese numbers are assumed constant.
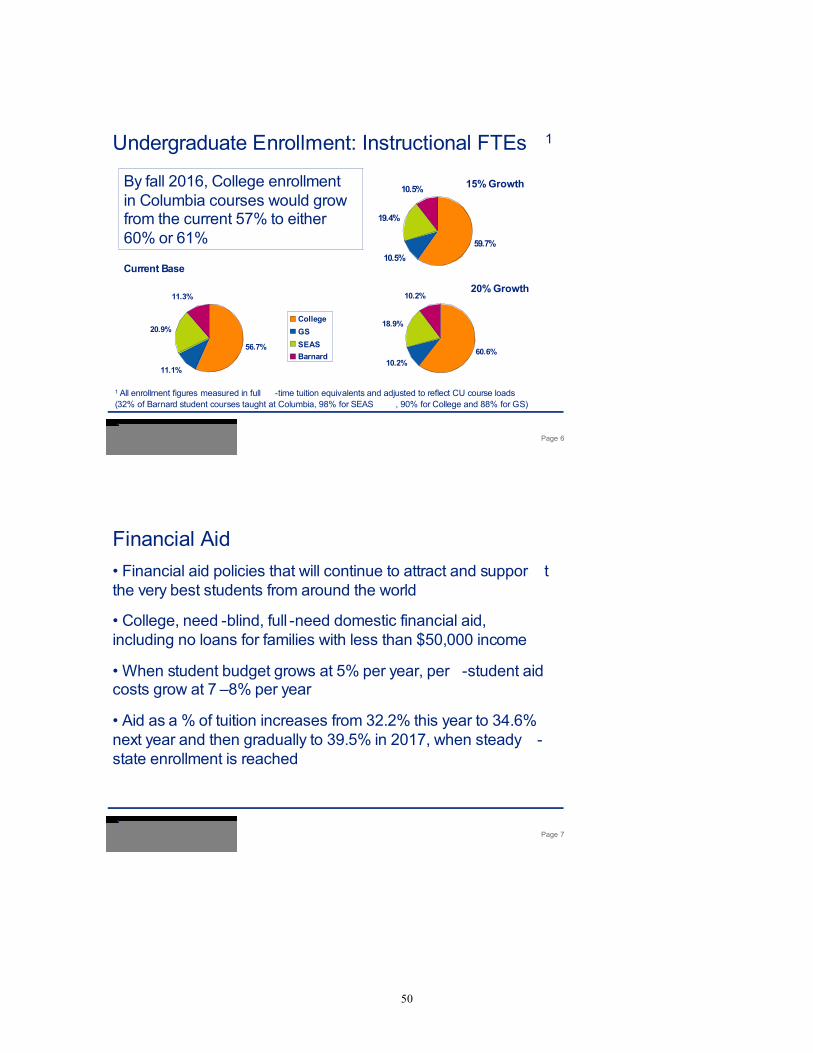
50
Page 6
Undergraduate Enrollment: Instructional FTEs 1
Current Base
56.7%
11.1%
20.9%
11.3%
CollegeGSSEASBarnard
15% Growth
59.7%10.5%
19.4%
10.5%
20% Growth
60.6%10.2%
18.9%
10.2%
By fall 2016, College enrollment in Columbia courses would grow from the current 57% to either 60% or 61%
1 All enrollment figures measured in full -time tuition equivalents and adjusted to reflect CU course loads(32% of Barnard student courses taught at Columbia, 98% for SEAS , 90% for College and 88% for GS)
Page 7
Financial Aid• Financial aid policies that will continue to attract and suppor t the very best students from around the world
• College, need -blind, full -need domestic financial aid, including no loans for families with less than $50,000 income
• When student budget grows at 5% per year, per -student aid costs grow at 7 –8% per year
• Aid as a % of tuition increases from 32.2% this year to 34.6% next year and then gradually to 39.5% in 2017, when steady -state enrollment is reached

51
Page 8
Instructional Costs: Undergraduate Enrollment• Existing registration patterns used to project course demand
• Current faculty course loads, distribution of faculty ranks across courses assumed to persist
• Costs include current salary levels, housing costs, research and teaching assistants
• Since the College represents only about 57% of undergraduate enrollment, total growth is muted by constant enrollment assumption in other schools (SEAS, GS and Barnard)
Page 9
Instructional Costs: Courses and Faculty• As enrollment grows, some courses will need to be added (core courses); others will have empty seats
• Course growth will be less than undergrad enrollment, but A&S faculty increase will be about the same as enrollment due to relative weighting of faculty towards College students:
15% 20%Undergraduate Enrollment in CU courses 8.9% 11.9%Number of Courses 5.2% 6.9%Number of A&S Professorial Rank Faculty 7.9% 10.5%
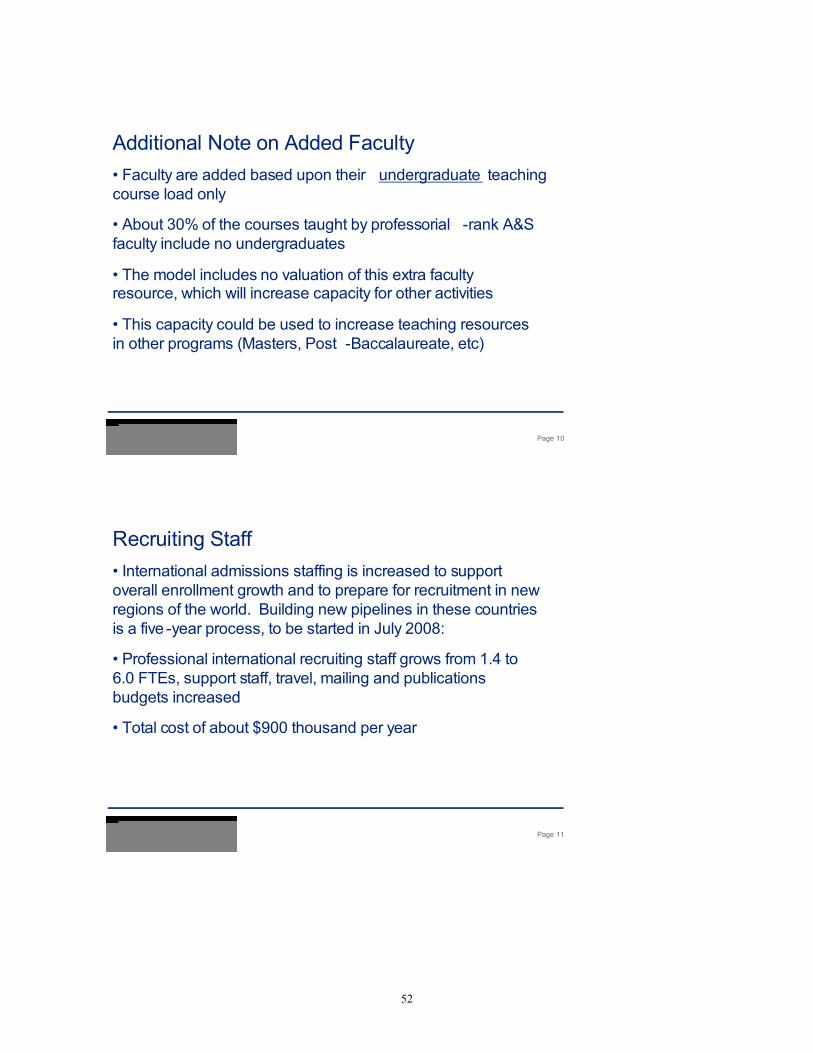
52
Page 10
Additional Note on Added Faculty• Faculty are added based upon their undergraduate teaching course load only
• About 30% of the courses taught by professorial -rank A&S faculty include no undergraduates
• The model includes no valuation of this extra faculty resource, which will increase capacity for other activities
• This capacity could be used to increase teaching resources in other programs (Masters, Post -Baccalaureate, etc)
Page 11
Recruiting Staff• International admissions staffing is increased to support overall enrollment growth and to prepare for recruitment in new regions of the world. Building new pipelines in these countriesis a five -year process, to be started in July 2008:
• Professional international recruiting staff grows from 1.4 to 6.0 FTEs, support staff, travel, mailing and publications budgets increased
• Total cost of about $900 thousand per year
53
Page 12
Student Services• In the first year of expansion (fall 2011), budgets for all student services are increased to support higher enrollment (admissions/financial aid, residential programs, career education, student development, etc.)
• For instance, in the 20% growth scenario staffing is increased by 16; operating budget by $3 million
• Timing is in advance of enrollment, in three equal parts 2011 – 2013 (enrollment increases by 17% in 2011, 33% in 2012 and 58% in 2013)
Page 13
Construction and Renovation Costs• Dormitories and dining facilities: $126 –168 million, depending on growth scenario, with a $60 million gift assumed, remainder financed with 25 -year debt
• Renovation of classrooms, faculty offices and laboratories in existing and planned buildings ($12 –18 million), financed with 10-year debt
• Student service relocations and renovations required to support expansion of office including admissions, financial aid and career education ($30 million), financed with 10 -year debt
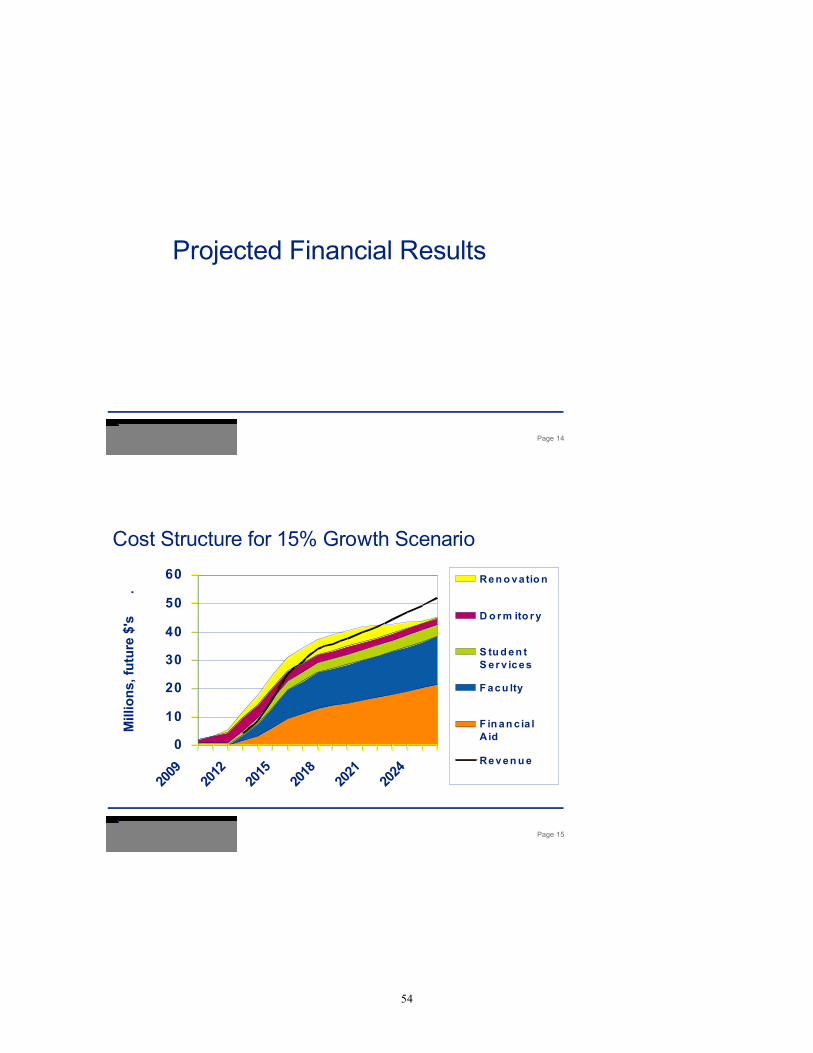
54
Page 14
Projected Financial Results
Page 15
Cost Structure for 15% Growth Scenario
0
10
20
30
40
50
60
2009
2012
2015
2018
2021
2024
Mill
ions
, fut
ure
$'s
.
Ren o va tio n
D o r m ito r y
S tu d en tS er v ices
F acu lty
F in an c ia lAid
Reven u e
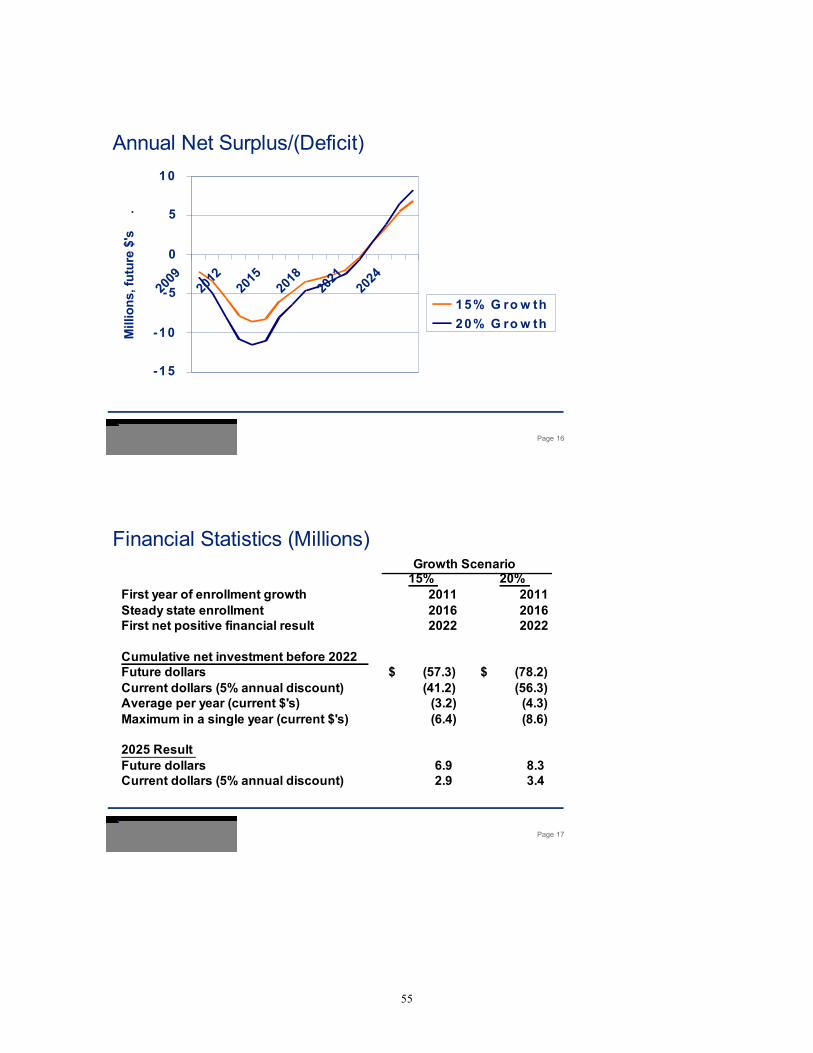
55
Page 16
Annual Net Surplus/(Deficit)
-15
-10
-5
0
5
10
2009
2012
2015
2018
2021
2024
Mill
ions
, fut
ure
$'s
.
1 5% G ro w th20% G ro w th
Page 17
Financial Statistics (Millions)Growth Scenario
15% 20% First year of enrollment growth 2011 2011Steady state enrollment 2016 2016First net positive financial result 2022 2022
Cumulative net investment before 2022Future dollars (57.3)$ (78.2)$ Current dollars (5% annual discount) (41.2) (56.3) Average per year (current $'s) (3.2) (4.3) Maximum in a single year (current $'s) (6.4) (8.6)
2025 ResultFuture dollars 6.9 8.3 Current dollars (5% annual discount) 2.9 3.4

56
Appendix D-3 Report of the Working Group on Science Education
Task Force on Undergraduate Education April 12, 2008
Purpose:
Describes the state of undergraduate science education at Columbia University with a focus the connection to the research mission of the university. Examines recent innovations in programs and trends in students. Makes recommendations for policies, efforts, and resource allocations going forward. Committee Membership:
Geraldine Downey, Vice Provost for Diversity Initiatives, Professor (formerly Chair) of Psychology Stuart Firestein, Professor of Biological Sciences Mort Friedman, Vice Dean of SEAS, Professor of Civil Engineering and Engineering Mechanics Robert Friedman, Professor of Mathematics Charles Hailey, Pupin Professor of Physics Andy Millis, Professor and Chair of Physics Shahid Naeem, Professor and Chair, Department of Ecology, Evolution and Environmental Biology Gerry Navratil, Dean of SEAS Duong Phong, Professor of Mathematics Kathryn Yatrakis, Dean of Academic Affairs, Columbia College, and Professor of Political Science Chair: Ann McDermott, Esther Breslow Professor of Chemistry and AVP for Academic Planning and Science Initiatives in the A&S Staff: Lucy Drotning, Associate Provost
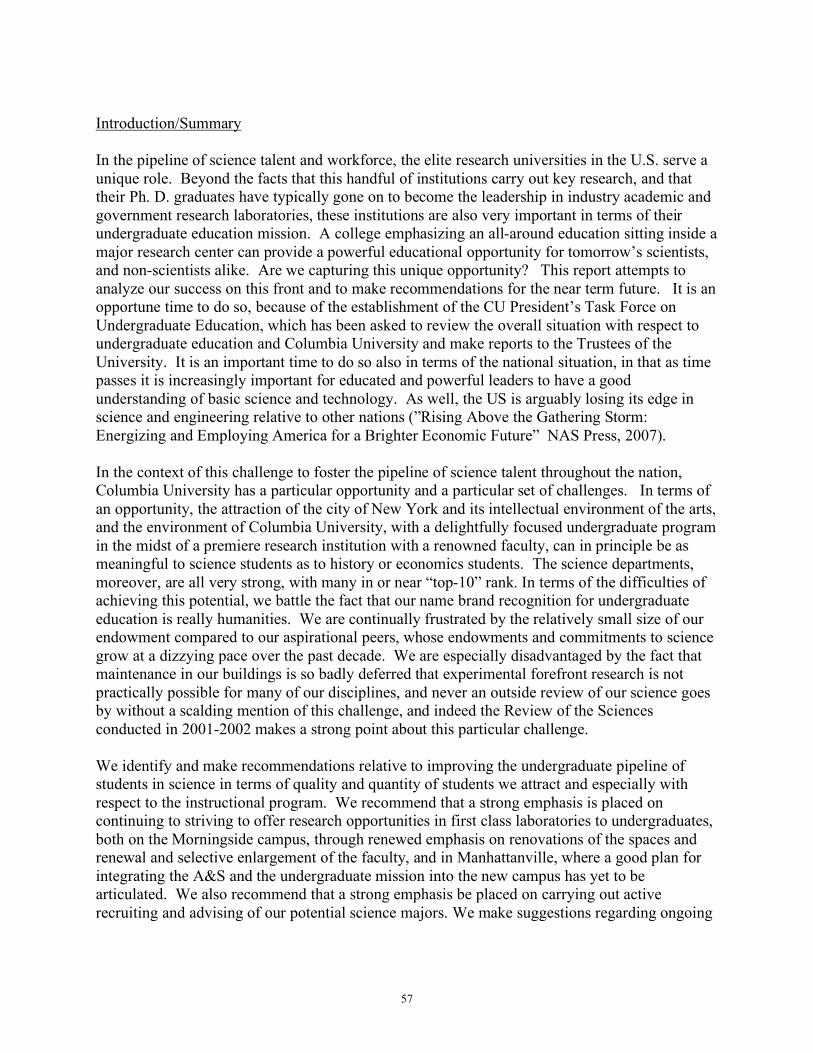
57
Introduction/Summary In the pipeline of science talent and workforce, the elite research universities in the U.S. serve a unique role. Beyond the facts that this handful of institutions carry out key research, and that their Ph. D. graduates have typically gone on to become the leadership in industry academic and government research laboratories, these institutions are also very important in terms of their undergraduate education mission. A college emphasizing an all-around education sitting inside a major research center can provide a powerful educational opportunity for tomorrow’s scientists, and non-scientists alike. Are we capturing this unique opportunity? This report attempts to analyze our success on this front and to make recommendations for the near term future. It is an opportune time to do so, because of the establishment of the CU President’s Task Force on Undergraduate Education, which has been asked to review the overall situation with respect to undergraduate education and Columbia University and make reports to the Trustees of the University. It is an important time to do so also in terms of the national situation, in that as time passes it is increasingly important for educated and powerful leaders to have a good understanding of basic science and technology. As well, the US is arguably losing its edge in science and engineering relative to other nations (”Rising Above the Gathering Storm: Energizing and Employing America for a Brighter Economic Future” NAS Press, 2007). In the context of this challenge to foster the pipeline of science talent throughout the nation, Columbia University has a particular opportunity and a particular set of challenges. In terms of an opportunity, the attraction of the city of New York and its intellectual environment of the arts, and the environment of Columbia University, with a delightfully focused undergraduate program in the midst of a premiere research institution with a renowned faculty, can in principle be as meaningful to science students as to history or economics students. The science departments, moreover, are all very strong, with many in or near “top-10” rank. In terms of the difficulties of achieving this potential, we battle the fact that our name brand recognition for undergraduate education is really humanities. We are continually frustrated by the relatively small size of our endowment compared to our aspirational peers, whose endowments and commitments to science grow at a dizzying pace over the past decade. We are especially disadvantaged by the fact that maintenance in our buildings is so badly deferred that experimental forefront research is not practically possible for many of our disciplines, and never an outside review of our science goes by without a scalding mention of this challenge, and indeed the Review of the Sciences conducted in 2001-2002 makes a strong point about this particular challenge. We identify and make recommendations relative to improving the undergraduate pipeline of students in science in terms of quality and quantity of students we attract and especially with respect to the instructional program. We recommend that a strong emphasis is placed on continuing to striving to offer research opportunities in first class laboratories to undergraduates, both on the Morningside campus, through renewed emphasis on renovations of the spaces and renewal and selective enlargement of the faculty, and in Manhattanville, where a good plan for integrating the A&S and the undergraduate mission into the new campus has yet to be articulated. We also recommend that a strong emphasis be placed on carrying out active recruiting and advising of our potential science majors. We make suggestions regarding ongoing
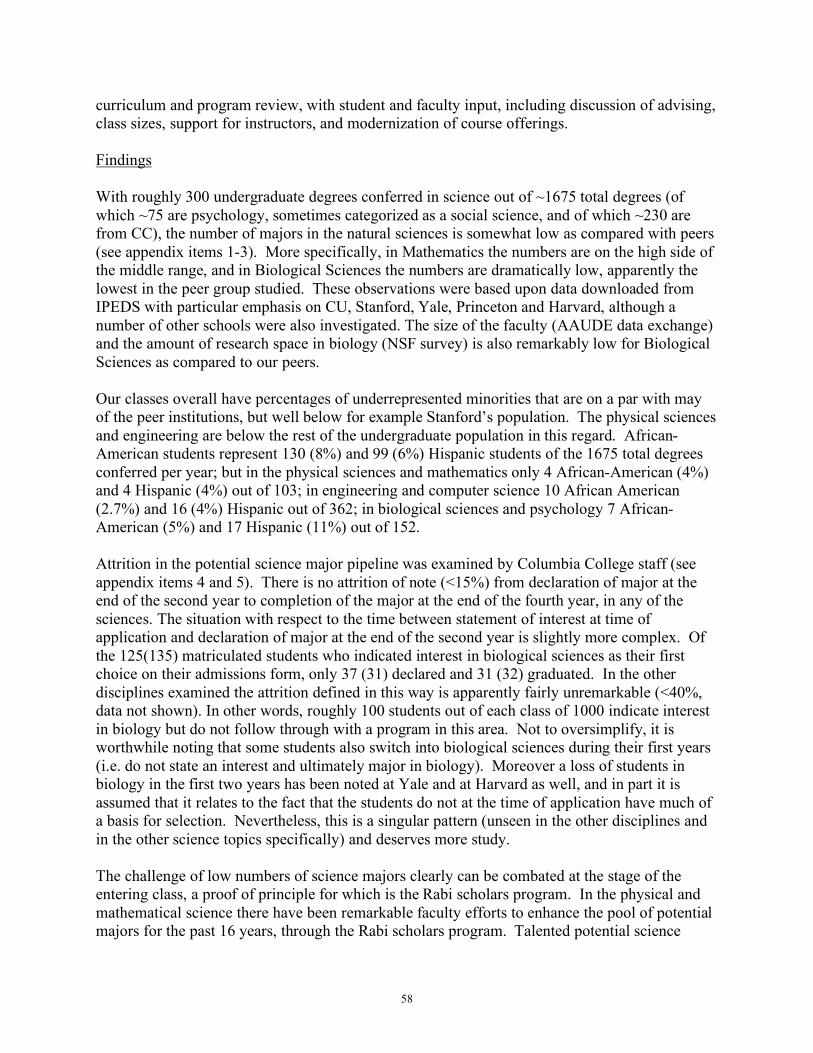
58
curriculum and program review, with student and faculty input, including discussion of advising, class sizes, support for instructors, and modernization of course offerings. Findings With roughly 300 undergraduate degrees conferred in science out of ~1675 total degrees (of which ~75 are psychology, sometimes categorized as a social science, and of which ~230 are from CC), the number of majors in the natural sciences is somewhat low as compared with peers (see appendix items 1-3). More specifically, in Mathematics the numbers are on the high side of the middle range, and in Biological Sciences the numbers are dramatically low, apparently the lowest in the peer group studied. These observations were based upon data downloaded from IPEDS with particular emphasis on CU, Stanford, Yale, Princeton and Harvard, although a number of other schools were also investigated. The size of the faculty (AAUDE data exchange) and the amount of research space in biology (NSF survey) is also remarkably low for Biological Sciences as compared to our peers. Our classes overall have percentages of underrepresented minorities that are on a par with may of the peer institutions, but well below for example Stanford’s population. The physical sciences and engineering are below the rest of the undergraduate population in this regard. African-American students represent 130 (8%) and 99 (6%) Hispanic students of the 1675 total degrees conferred per year; but in the physical sciences and mathematics only 4 African-American (4%) and 4 Hispanic (4%) out of 103; in engineering and computer science 10 African American (2.7%) and 16 (4%) Hispanic out of 362; in biological sciences and psychology 7 African-American (5%) and 17 Hispanic (11%) out of 152. Attrition in the potential science major pipeline was examined by Columbia College staff (see appendix items 4 and 5). There is no attrition of note (<15%) from declaration of major at the end of the second year to completion of the major at the end of the fourth year, in any of the sciences. The situation with respect to the time between statement of interest at time of application and declaration of major at the end of the second year is slightly more complex. Of the 125(135) matriculated students who indicated interest in biological sciences as their first choice on their admissions form, only 37 (31) declared and 31 (32) graduated. In the other disciplines examined the attrition defined in this way is apparently fairly unremarkable (<40%, data not shown). In other words, roughly 100 students out of each class of 1000 indicate interest in biology but do not follow through with a program in this area. Not to oversimplify, it is worthwhile noting that some students also switch into biological sciences during their first years (i.e. do not state an interest and ultimately major in biology). Moreover a loss of students in biology in the first two years has been noted at Yale and at Harvard as well, and in part it is assumed that it relates to the fact that the students do not at the time of application have much of a basis for selection. Nevertheless, this is a singular pattern (unseen in the other disciplines and in the other science topics specifically) and deserves more study. The challenge of low numbers of science majors clearly can be combated at the stage of the entering class, a proof of principle for which is the Rabi scholars program. In the physical and mathematical science there have been remarkable faculty efforts to enhance the pool of potential majors for the past 16 years, through the Rabi scholars program. Talented potential science
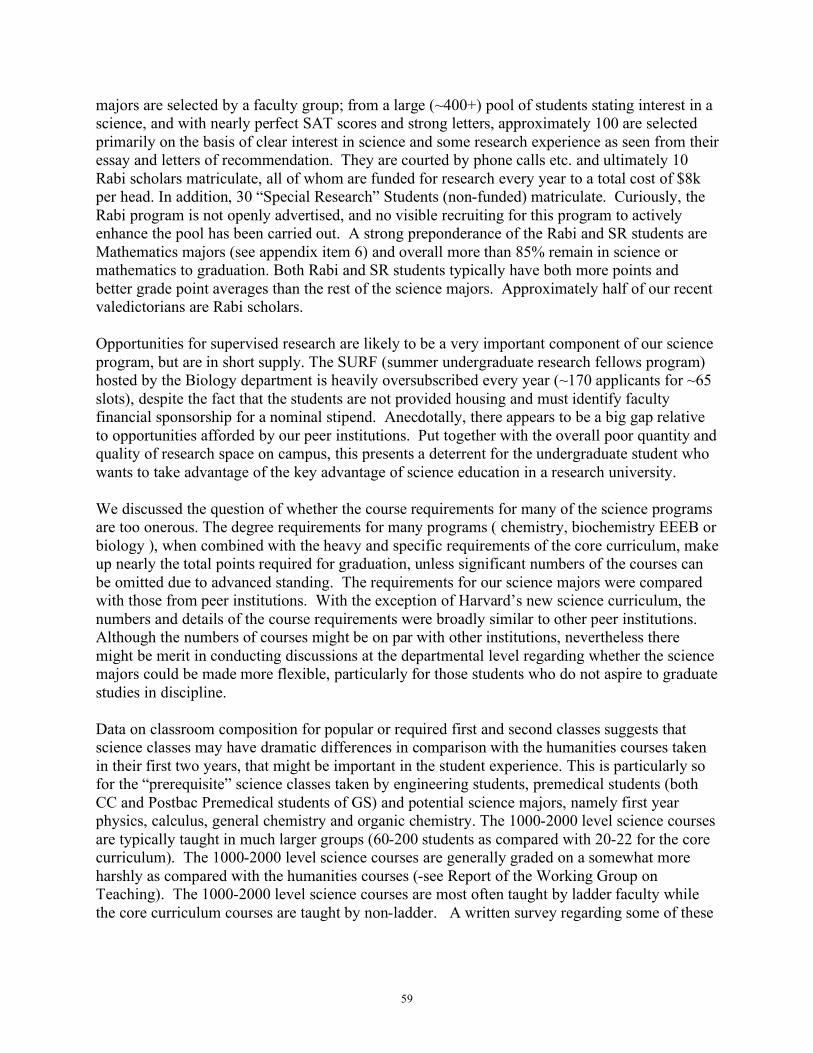
59
majors are selected by a faculty group; from a large (~400+) pool of students stating interest in a science, and with nearly perfect SAT scores and strong letters, approximately 100 are selected primarily on the basis of clear interest in science and some research experience as seen from their essay and letters of recommendation. They are courted by phone calls etc. and ultimately 10 Rabi scholars matriculate, all of whom are funded for research every year to a total cost of $8k per head. In addition, 30 “Special Research” Students (non-funded) matriculate. Curiously, the Rabi program is not openly advertised, and no visible recruiting for this program to actively enhance the pool has been carried out. A strong preponderance of the Rabi and SR students are Mathematics majors (see appendix item 6) and overall more than 85% remain in science or mathematics to graduation. Both Rabi and SR students typically have both more points and better grade point averages than the rest of the science majors. Approximately half of our recent valedictorians are Rabi scholars. Opportunities for supervised research are likely to be a very important component of our science program, but are in short supply. The SURF (summer undergraduate research fellows program) hosted by the Biology department is heavily oversubscribed every year (~170 applicants for ~65 slots), despite the fact that the students are not provided housing and must identify faculty financial sponsorship for a nominal stipend. Anecdotally, there appears to be a big gap relative to opportunities afforded by our peer institutions. Put together with the overall poor quantity and quality of research space on campus, this presents a deterrent for the undergraduate student who wants to take advantage of the key advantage of science education in a research university. We discussed the question of whether the course requirements for many of the science programs are too onerous. The degree requirements for many programs ( chemistry, biochemistry EEEB or biology ), when combined with the heavy and specific requirements of the core curriculum, make up nearly the total points required for graduation, unless significant numbers of the courses can be omitted due to advanced standing. The requirements for our science majors were compared with those from peer institutions. With the exception of Harvard’s new science curriculum, the numbers and details of the course requirements were broadly similar to other peer institutions. Although the numbers of courses might be on par with other institutions, nevertheless there might be merit in conducting discussions at the departmental level regarding whether the science majors could be made more flexible, particularly for those students who do not aspire to graduate studies in discipline. Data on classroom composition for popular or required first and second classes suggests that science classes may have dramatic differences in comparison with the humanities courses taken in their first two years, that might be important in the student experience. This is particularly so for the “prerequisite” science classes taken by engineering students, premedical students (both CC and Postbac Premedical students of GS) and potential science majors, namely first year physics, calculus, general chemistry and organic chemistry. The 1000-2000 level science courses are typically taught in much larger groups (60-200 students as compared with 20-22 for the core curriculum). The 1000-2000 level science courses are generally graded on a somewhat more harshly as compared with the humanities courses (-see Report of the Working Group on Teaching). The 1000-2000 level science courses are most often taught by ladder faculty while the core curriculum courses are taught by non-ladder. A written survey regarding some of these
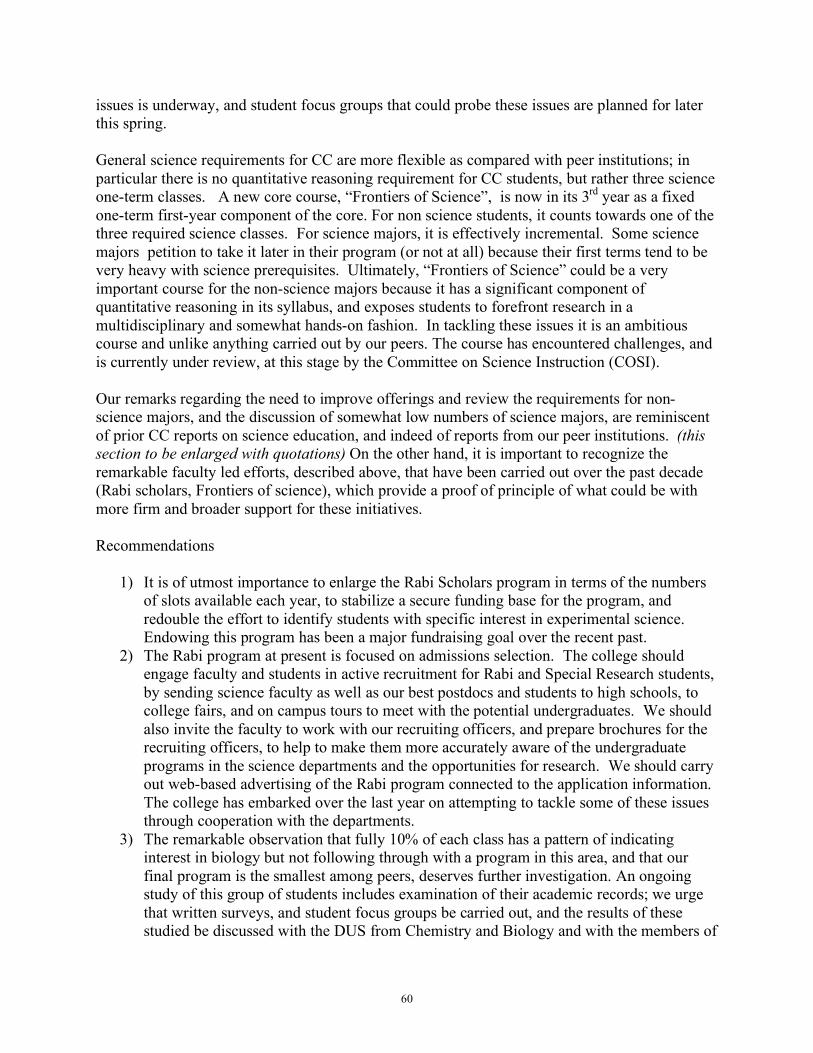
60
issues is underway, and student focus groups that could probe these issues are planned for later this spring. General science requirements for CC are more flexible as compared with peer institutions; in particular there is no quantitative reasoning requirement for CC students, but rather three science one-term classes. A new core course, “Frontiers of Science”, is now in its 3rd year as a fixed one-term first-year component of the core. For non science students, it counts towards one of the three required science classes. For science majors, it is effectively incremental. Some science majors petition to take it later in their program (or not at all) because their first terms tend to be very heavy with science prerequisites. Ultimately, “Frontiers of Science” could be a very important course for the non-science majors because it has a significant component of quantitative reasoning in its syllabus, and exposes students to forefront research in a multidisciplinary and somewhat hands-on fashion. In tackling these issues it is an ambitious course and unlike anything carried out by our peers. The course has encountered challenges, and is currently under review, at this stage by the Committee on Science Instruction (COSI). Our remarks regarding the need to improve offerings and review the requirements for non-science majors, and the discussion of somewhat low numbers of science majors, are reminiscent of prior CC reports on science education, and indeed of reports from our peer institutions. (this section to be enlarged with quotations) On the other hand, it is important to recognize the remarkable faculty led efforts, described above, that have been carried out over the past decade (Rabi scholars, Frontiers of science), which provide a proof of principle of what could be with more firm and broader support for these initiatives. Recommendations
1) It is of utmost importance to enlarge the Rabi Scholars program in terms of the numbers of slots available each year, to stabilize a secure funding base for the program, and redouble the effort to identify students with specific interest in experimental science. Endowing this program has been a major fundraising goal over the recent past.
2) The Rabi program at present is focused on admissions selection. The college should engage faculty and students in active recruitment for Rabi and Special Research students, by sending science faculty as well as our best postdocs and students to high schools, to college fairs, and on campus tours to meet with the potential undergraduates. We should also invite the faculty to work with our recruiting officers, and prepare brochures for the recruiting officers, to help to make them more accurately aware of the undergraduate programs in the science departments and the opportunities for research. We should carry out web-based advertising of the Rabi program connected to the application information. The college has embarked over the last year on attempting to tackle some of these issues through cooperation with the departments.
3) The remarkable observation that fully 10% of each class has a pattern of indicating interest in biology but not following through with a program in this area, and that our final program is the smallest among peers, deserves further investigation. An ongoing study of this group of students includes examination of their academic records; we urge that written surveys, and student focus groups be carried out, and the results of these studied be discussed with the DUS from Chemistry and Biology and with the members of
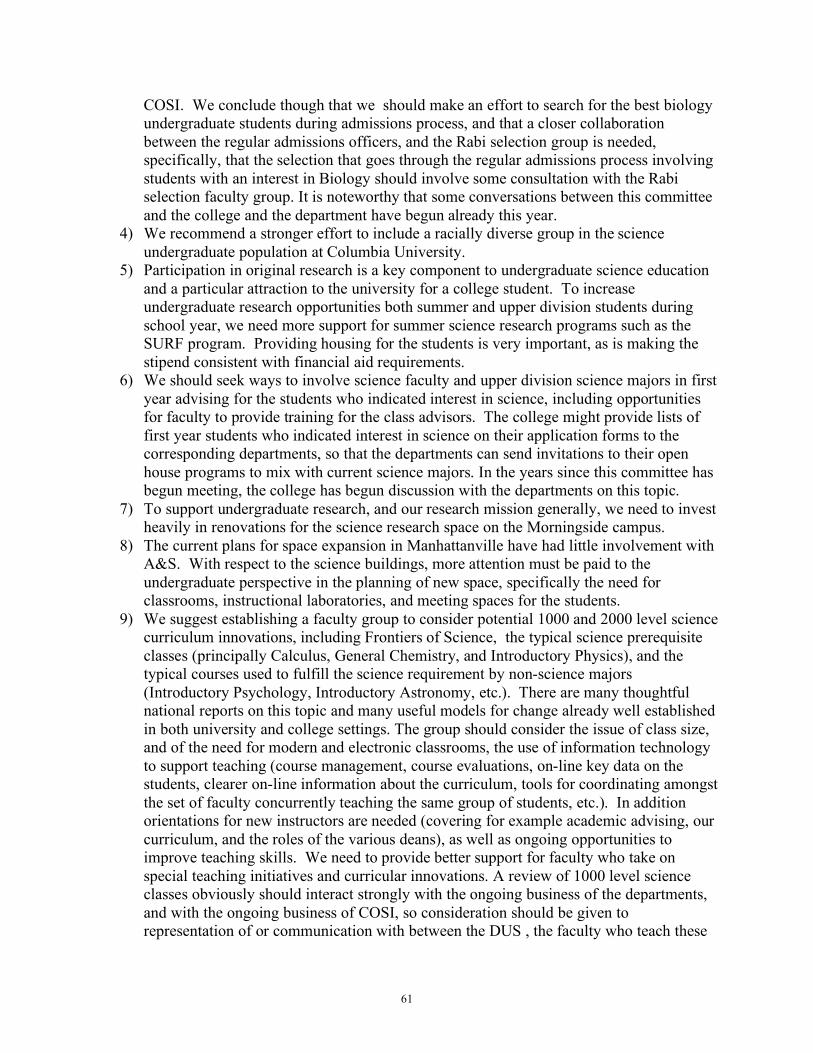
61
COSI. We conclude though that we should make an effort to search for the best biology undergraduate students during admissions process, and that a closer collaboration between the regular admissions officers, and the Rabi selection group is needed, specifically, that the selection that goes through the regular admissions process involving students with an interest in Biology should involve some consultation with the Rabi selection faculty group. It is noteworthy that some conversations between this committee and the college and the department have begun already this year.
4) We recommend a stronger effort to include a racially diverse group in the science undergraduate population at Columbia University.
5) Participation in original research is a key component to undergraduate science education and a particular attraction to the university for a college student. To increase undergraduate research opportunities both summer and upper division students during school year, we need more support for summer science research programs such as the SURF program. Providing housing for the students is very important, as is making the stipend consistent with financial aid requirements.
6) We should seek ways to involve science faculty and upper division science majors in first year advising for the students who indicated interest in science, including opportunities for faculty to provide training for the class advisors. The college might provide lists of first year students who indicated interest in science on their application forms to the corresponding departments, so that the departments can send invitations to their open house programs to mix with current science majors. In the years since this committee has begun meeting, the college has begun discussion with the departments on this topic.
7) To support undergraduate research, and our research mission generally, we need to invest heavily in renovations for the science research space on the Morningside campus.
8) The current plans for space expansion in Manhattanville have had little involvement with A&S. With respect to the science buildings, more attention must be paid to the undergraduate perspective in the planning of new space, specifically the need for classrooms, instructional laboratories, and meeting spaces for the students.
9) We suggest establishing a faculty group to consider potential 1000 and 2000 level science curriculum innovations, including Frontiers of Science, the typical science prerequisite classes (principally Calculus, General Chemistry, and Introductory Physics), and the typical courses used to fulfill the science requirement by non-science majors (Introductory Psychology, Introductory Astronomy, etc.). There are many thoughtful national reports on this topic and many useful models for change already well established in both university and college settings. The group should consider the issue of class size, and of the need for modern and electronic classrooms, the use of information technology to support teaching (course management, course evaluations, on-line key data on the students, clearer on-line information about the curriculum, tools for coordinating amongst the set of faculty concurrently teaching the same group of students, etc.). In addition orientations for new instructors are needed (covering for example academic advising, our curriculum, and the roles of the various deans), as well as ongoing opportunities to improve teaching skills. We need to provide better support for faculty who take on special teaching initiatives and curricular innovations. A review of 1000 level science classes obviously should interact strongly with the ongoing business of the departments, and with the ongoing business of COSI, so consideration should be given to representation of or communication with between the DUS , the faculty who teach these
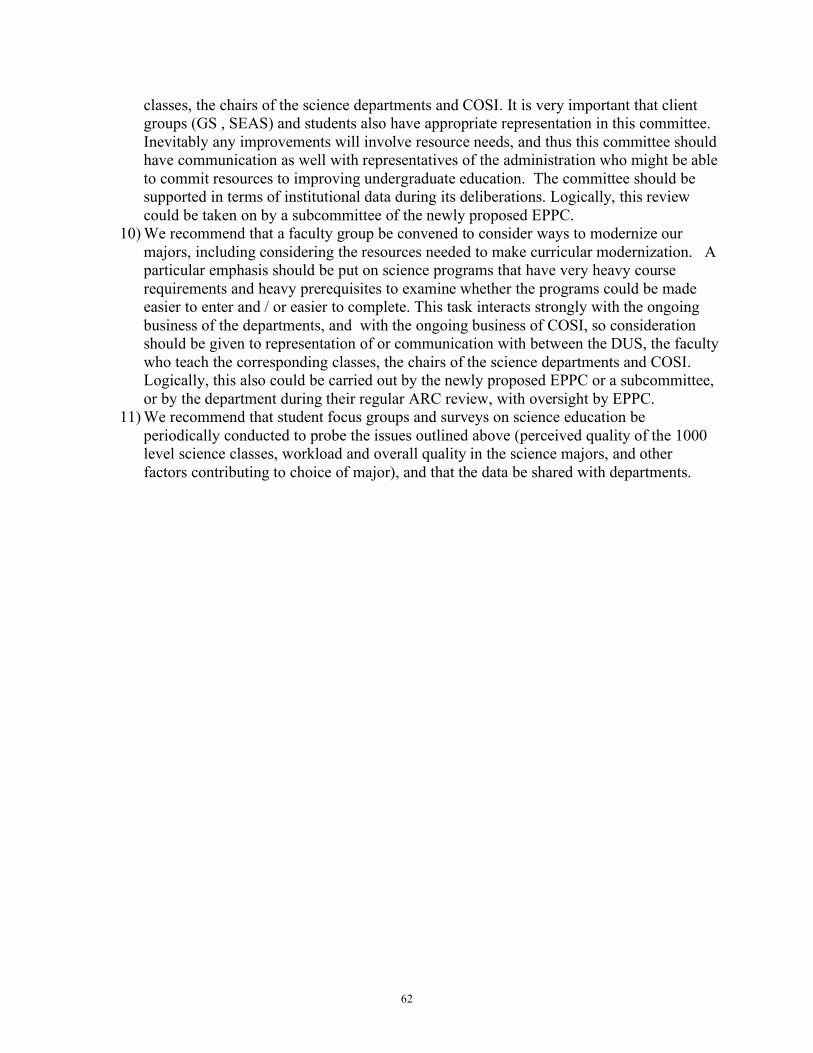
62
classes, the chairs of the science departments and COSI. It is very important that client groups (GS , SEAS) and students also have appropriate representation in this committee. Inevitably any improvements will involve resource needs, and thus this committee should have communication as well with representatives of the administration who might be able to commit resources to improving undergraduate education. The committee should be supported in terms of institutional data during its deliberations. Logically, this review could be taken on by a subcommittee of the newly proposed EPPC.
10) We recommend that a faculty group be convened to consider ways to modernize our majors, including considering the resources needed to make curricular modernization. A particular emphasis should be put on science programs that have very heavy course requirements and heavy prerequisites to examine whether the programs could be made easier to enter and / or easier to complete. This task interacts strongly with the ongoing business of the departments, and with the ongoing business of COSI, so consideration should be given to representation of or communication with between the DUS, the faculty who teach the corresponding classes, the chairs of the science departments and COSI. Logically, this also could be carried out by the newly proposed EPPC or a subcommittee, or by the department during their regular ARC review, with oversight by EPPC.
11) We recommend that student focus groups and surveys on science education be periodically conducted to probe the issues outlined above (perceived quality of the 1000 level science classes, workload and overall quality in the science majors, and other factors contributing to choice of major), and that the data be shared with departments.
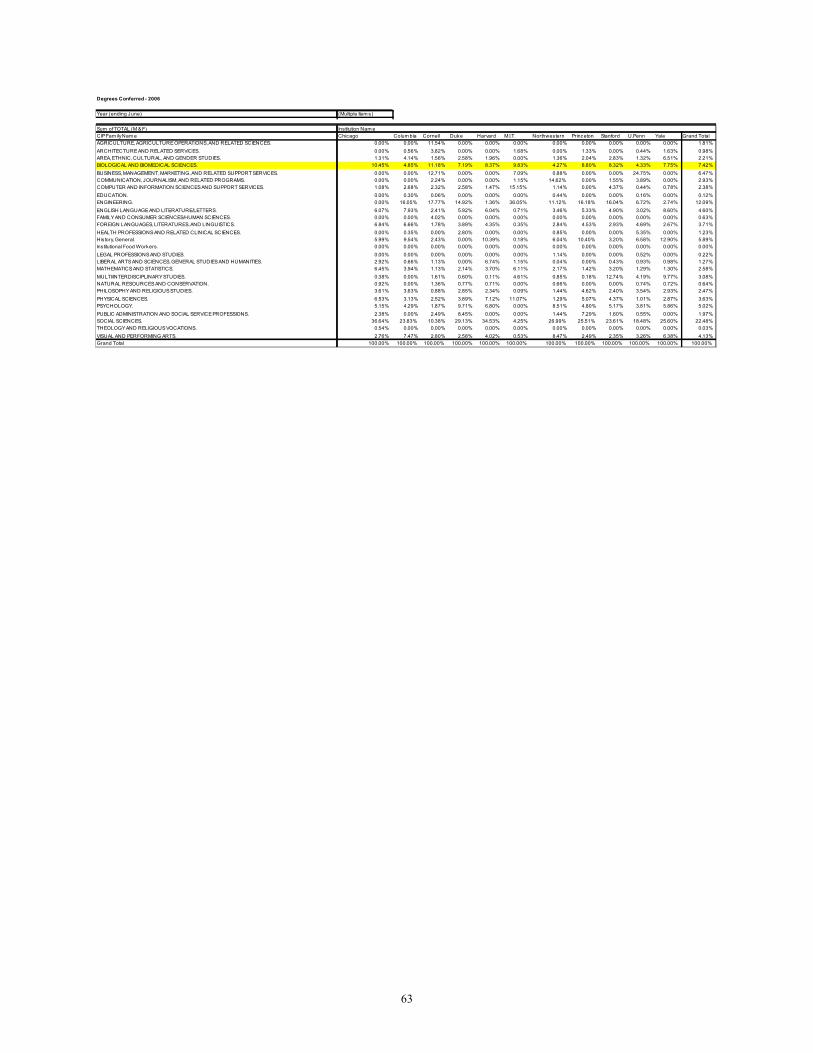
63
Degrees Conferred - 2006
Year (ending June) (Multiple Item s)
Sum of TOTAL (M & F) Institution Nam e
CIP Fam ily Nam e Chicago Colum bia Cornell Duke Harvard M.I.T. Northwestern Princeton Stanford U.Penn Yale Grand Total
AGRICULTURE, AGRICULTURE OPERATIONS, AND RELATED SCIENCES. 0.00% 0.00% 11.54% 0.00% 0.00% 0.00% 0.00% 0.00% 0.00% 0.00% 0.00% 1.81%
ARCHITECTURE AND RELATED SERVICES. 0.00% 0.56% 3.82% 0.00% 0.00% 1.68% 0.00% 1.33% 0.00% 0.44% 1.63% 0.98%
AREA, ETHNIC, CULTURAL, AND GENDER STUDIES. 1.31% 4.14% 1.56% 2.58% 1.96% 0.00% 1.36% 2.04% 2.83% 1.32% 6.51% 2.21%
BIOLOGICAL AND BIOMEDICAL SCIENCES. 10.45% 4.85% 11.18% 7.19% 8.37% 9.83% 4.27% 8.80% 8.32% 4.33% 7.75% 7.42%
BUSINESS, MANAGEMENT, MARKETING, AND RELATED SUPPORT SERVICES. 0.00% 0.00% 12.71% 0.00% 0.00% 7.09% 0.88% 0.00% 0.00% 24.75% 0.00% 6.47%
COMMUNICATION, JOURNALISM, AND RELATED PROGRAMS. 0.00% 0.00% 2.24% 0.00% 0.00% 1.15% 14.62% 0.00% 1.55% 3.89% 0.00% 2.93%
COMPUTER AND INFORMATION SCIENCES AND SUPPORT SERVICES. 1.08% 2.68% 2.32% 2.58% 1.47% 15.15% 1.14% 0.00% 4.37% 0.44% 0.78% 2.38%
EDUCATION. 0.00% 0.30% 0.06% 0.00% 0.00% 0.00% 0.44% 0.00% 0.00% 0.16% 0.00% 0.12%
ENGINEERING. 0.00% 16.05% 17.77% 14.92% 1.36% 36.05% 11.12% 16.18% 16.04% 6.72% 2.74% 12.09%
ENGLISH LANGUAGE AND LITERATURE/LETTERS. 6.07% 7.93% 2.41% 5.92% 6.04% 0.71% 3.46% 5.33% 4.90% 3.02% 8.60% 4.60%
FAMILY AND CONSUMER SCIENCES/HUMAN SCIENCES. 0.00% 0.00% 4.02% 0.00% 0.00% 0.00% 0.00% 0.00% 0.00% 0.00% 0.00% 0.63%
FOREIGN LANGUAGES, LITERATURES, AND LINGUISTICS. 6.84% 6.66% 1.78% 3.89% 4.35% 0.35% 2.84% 4.53% 2.93% 4.69% 2.67% 3.71%
HEALTH PROFESSIONS AND RELATED CLINICAL SCIENCES. 0.00% 0.35% 0.00% 2.80% 0.00% 0.00% 0.85% 0.00% 0.00% 5.35% 0.00% 1.23%
History, General. 5.99% 9.54% 2.43% 0.00% 10.39% 0.18% 6.04% 10.40% 3.20% 6.58% 12.90% 5.89%
Institutional Food Workers. 0.00% 0.00% 0.00% 0.00% 0.00% 0.00% 0.00% 0.00% 0.00% 0.00% 0.00% 0.00%
LEGAL PROFESSIONS AND STUDIES. 0.00% 0.00% 0.00% 0.00% 0.00% 0.00% 1.14% 0.00% 0.00% 0.52% 0.00% 0.22%
LIBERAL ARTS AND SCIENCES, GENERAL STUDIES AND HUMANITIES. 2.92% 0.66% 1.13% 0.00% 6.74% 1.15% 0.04% 0.00% 0.43% 0.93% 0.98% 1.27%
MATHEMATICS AND STATISTICS. 6.45% 3.94% 1.13% 2.14% 3.70% 6.11% 2.17% 1.42% 3.20% 1.29% 1.30% 2.58%
MULTI/INTERDISCIPLINARY STUDIES. 0.38% 0.00% 1.61% 0.60% 0.11% 4.61% 0.85% 0.18% 12.74% 4.19% 9.77% 3.08%
NATURAL RESOURCES AND CONSERVATION. 0.92% 0.00% 1.36% 0.77% 0.71% 0.00% 0.66% 0.00% 0.00% 0.74% 0.72% 0.64%
PHILOSOPHY AND RELIGIOUS STUDIES. 3.61% 3.63% 0.88% 2.85% 2.34% 0.09% 1.44% 4.62% 2.40% 3.54% 2.93% 2.47%
PHYSICAL SCIENCES. 6.53% 3.13% 2.52% 3.89% 7.12% 11.07% 1.29% 5.07% 4.37% 1.01% 2.87% 3.63%
PSYCHOLOGY. 5.15% 4.29% 1.87% 9.71% 6.80% 0.00% 8.51% 4.80% 5.17% 3.81% 5.86% 5.02%
PUBLIC ADMINISTRATION AND SOCIAL SERVICE PROFESSIONS. 2.38% 0.00% 2.49% 8.45% 0.00% 0.00% 1.44% 7.29% 1.60% 0.55% 0.00% 1.97%
SOCIAL SCIENCES. 36.64% 23.83% 10.38% 29.13% 34.53% 4.25% 26.99% 25.51% 23.61% 18.48% 25.60% 22.48%
THEOLOGY AND RELIGIOUS VOCATIONS. 0.54% 0.00% 0.00% 0.00% 0.00% 0.00% 0.00% 0.00% 0.00% 0.00% 0.00% 0.03%
VISUAL AND PERFORMING ARTS. 2.76% 7.47% 2.80% 2.58% 4.02% 0.53% 8.47% 2.49% 2.35% 3.26% 6.38% 4.13%
Grand Total 100.00% 100.00% 100.00% 100.00% 100.00% 100.00% 100.00% 100.00% 100.00% 100.00% 100.00% 100.00%
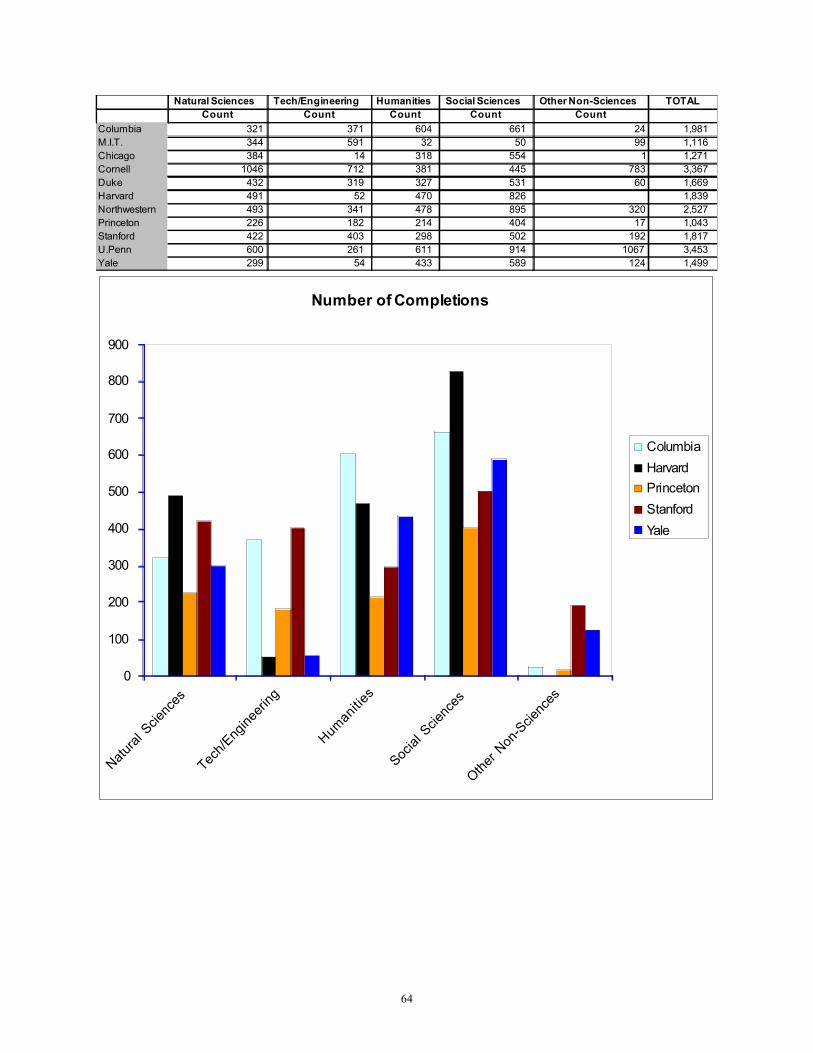
64
Natural Sciences Tech/Engineering Humanities Social Sciences Other Non-Sciences TOTAL
Count Count Count Count Count
Columbia 321 371 604 661 24 1,981
M.I.T. 344 591 32 50 99 1,116
Chicago 384 14 318 554 1 1,271
Cornell 1046 712 381 445 783 3,367
Duke 432 319 327 531 60 1,669
Harvard 491 52 470 826 1,839
Northwestern 493 341 478 895 320 2,527
Princeton 226 182 214 404 17 1,043
Stanford 422 403 298 502 192 1,817
U.Penn 600 261 611 914 1067 3,453
Yale 299 54 433 589 124 1,499
Number of Completions
0
100
200
300
400
500
600
700
800
900
Nat
ural
Scien
ces
Tech/
Eng
inee
ring
Hum
anities
Soc
ial S
cien
ces
Oth
er N
on-S
cien
ces
Columbia
Harvard
Princeton
Stanford
Yale
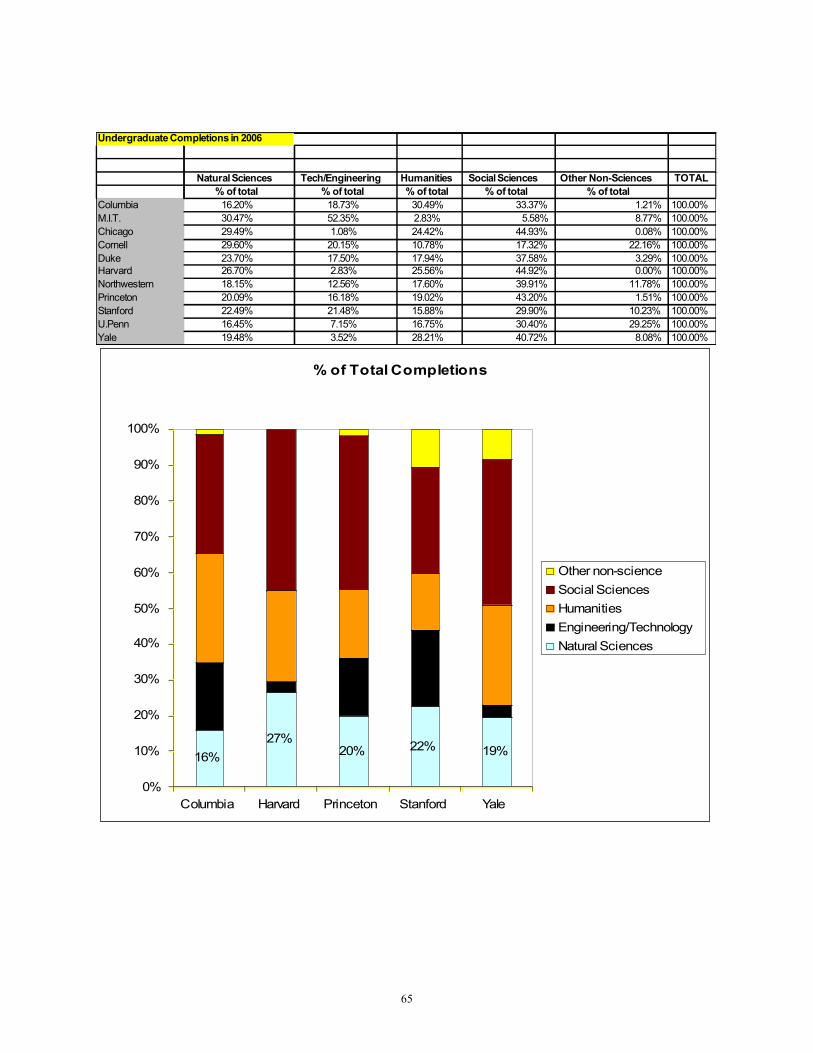
65
Undergraduate Completions in 2006
Natural Sciences Tech/Engineering Humanities Social Sciences Other Non-Sciences TOTAL
% of total % of total % of total % of total % of total
Columbia 16.20% 18.73% 30.49% 33.37% 1.21% 100.00%
M.I.T. 30.47% 52.35% 2.83% 5.58% 8.77% 100.00%
Chicago 29.49% 1.08% 24.42% 44.93% 0.08% 100.00%
Cornell 29.60% 20.15% 10.78% 17.32% 22.16% 100.00%
Duke 23.70% 17.50% 17.94% 37.58% 3.29% 100.00%
Harvard 26.70% 2.83% 25.56% 44.92% 0.00% 100.00%
Northwestern 18.15% 12.56% 17.60% 39.91% 11.78% 100.00%
Princeton 20.09% 16.18% 19.02% 43.20% 1.51% 100.00%
Stanford 22.49% 21.48% 15.88% 29.90% 10.23% 100.00%
U.Penn 16.45% 7.15% 16.75% 30.40% 29.25% 100.00%
Yale 19.48% 3.52% 28.21% 40.72% 8.08% 100.00%
% of Total Completions
16%
27%20% 22% 19%
0%
10%
20%
30%
40%
50%
60%
70%
80%
90%
100%
Columbia Harvard Princeton Stanford Yale
Other non-science
Social Sciences
Humanities
Engineering/Technology
Natural Sciences
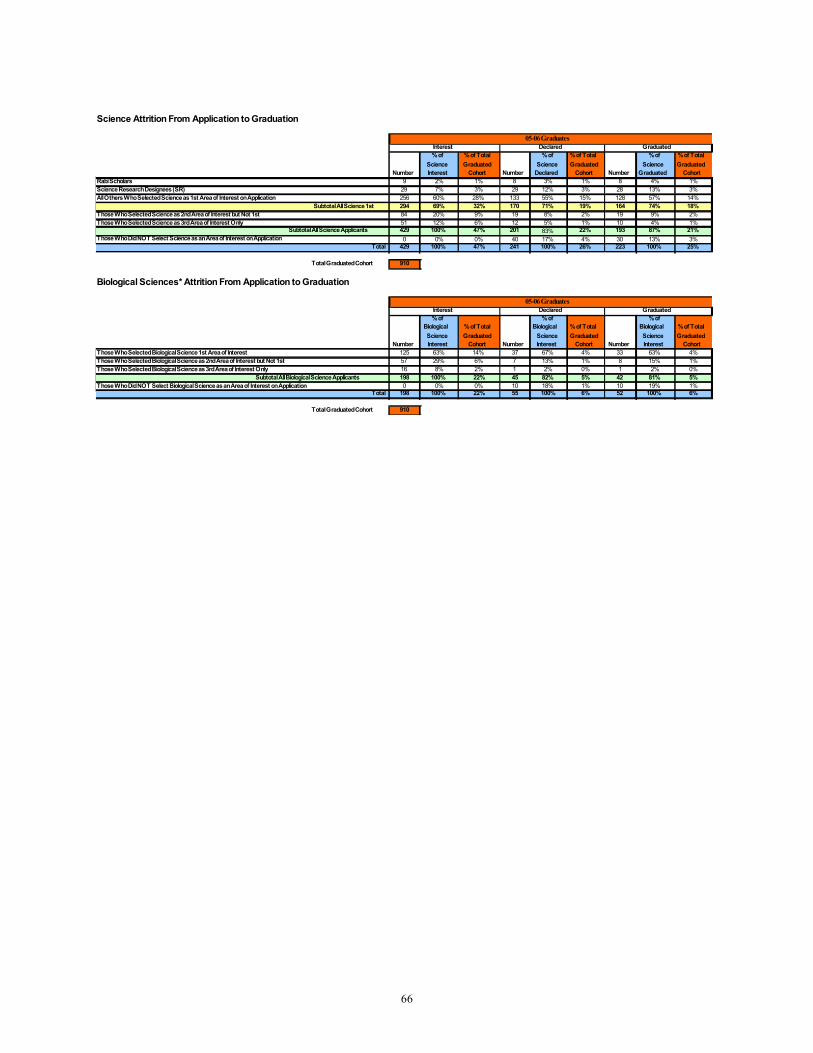
66
Science Attrition From Application to Graduation
Number
% of
Science
Interest
% of Total
Graduated
Cohort Number
% of
Science
Declared
% of Total
Graduated
Cohort Number
% of
Science
Graduated
% of Total
Graduated
Cohort
Rabi Scholars 9 2% 1% 8 3% 1% 8 4% 1%
Science Research Designees (SR) 29 7% 3% 29 12% 3% 28 13% 3%
All Others Who Selected Science as 1st Area of Interest on Application 256 60% 28% 133 55% 15% 128 57% 14%
Subtotal All Science 1st 294 69% 32% 170 71% 19% 164 74% 18%
Those Who Selected Science as 2nd Area of Interest but Not 1st 84 20% 9% 19 8% 2% 19 9% 2%
Those Who Selected Science as 3rd Area of Interest Only 51 12% 6% 12 5% 1% 10 4% 1%
Subtotal All Science Applicants 429 100% 47% 201 83% 22% 193 87% 21%
Those Who Did NOT Select Science as an Area of Interest on Application 0 0% 0% 40 17% 4% 30 13% 3%
Total 429 100% 47% 241 100% 26% 223 100% 25%
Total Graduated Cohort 910
Biological Sciences* Attrition From Application to Graduation
Number
% of
Biological
Science
Interest
% of Total
Graduated
Cohort Number
% of
Biological
Science
Interest
% of Total
Graduated
Cohort Number
% of
Biological
Science
Interest
% of Total
Graduated
Cohort
Those Who Selected Biological Science 1st Area of Interest 125 63% 14% 37 67% 4% 33 63% 4%
Those Who Selected Biological Science as 2nd Area of Interest but Not 1st 57 29% 6% 7 13% 1% 8 15% 1%
Those Who Selected Biological Science as 3rd Area of Interest Only 16 8% 2% 1 2% 0% 1 2% 0%
Subtotal All Biological Science Applicants 198 100% 22% 45 82% 5% 42 81% 5%
Those Who Did NOT Select Biological Science as an Area of Interest on Application 0 0% 0% 10 18% 1% 10 19% 1%
Total 198 100% 22% 55 100% 6% 52 100% 6%
Total Graduated Cohort 910
05-06 Graduates
Interest Declared Graduated
05-06 Graduates
Interest Declared Graduated
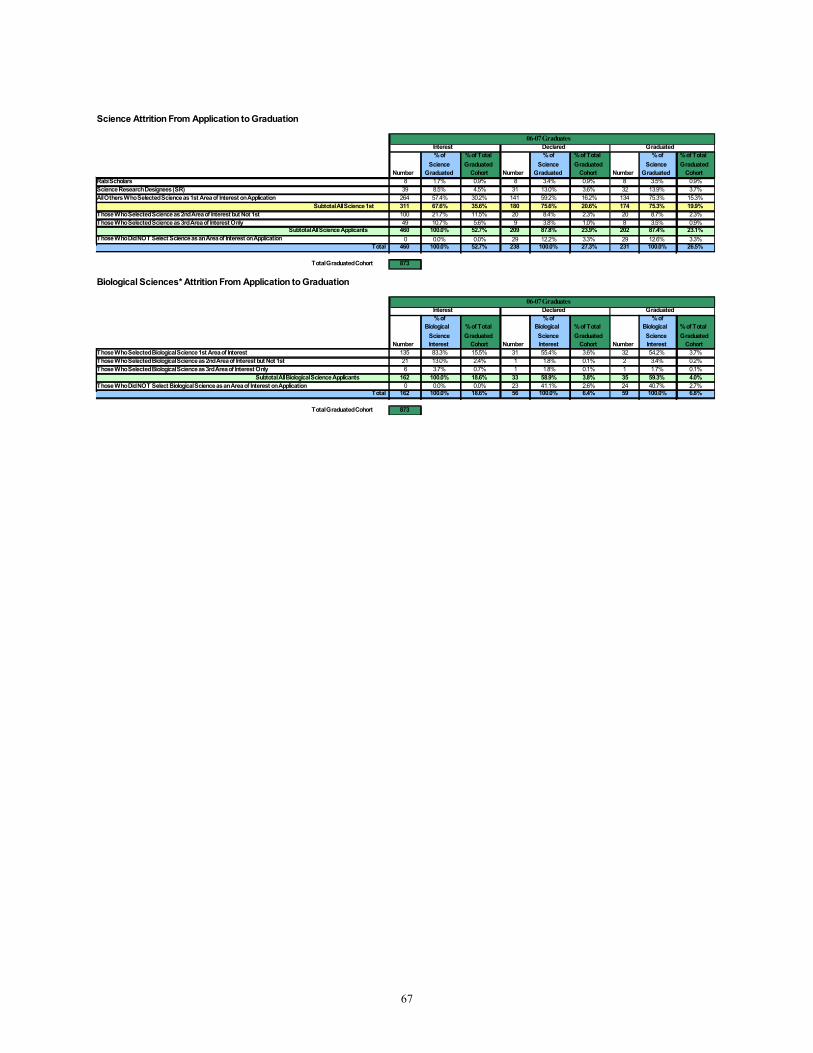
67
Science Attrition From Application to Graduation
Number
% of
Science
Graduated
% of Total
Graduated
Cohort Number
% of
Science
Graduated
% of Total
Graduated
Cohort Number
% of
Science
Graduated
% of Total
Graduated
Cohort
Rabi Scholars 8 1.7% 0.9% 8 3.4% 0.9% 8 3.5% 0.9%
Science Research Designees (SR) 39 8.5% 4.5% 31 13.0% 3.6% 32 13.9% 3.7%
All Others Who Selected Science as 1st Area of Interest on Application 264 57.4% 30.2% 141 59.2% 16.2% 134 75.3% 15.3%
Subtotal All Science 1st 311 67.6% 35.6% 180 75.6% 20.6% 174 75.3% 19.9%
Those Who Selected Science as 2nd Area of Interest but Not 1st 100 21.7% 11.5% 20 8.4% 2.3% 20 8.7% 2.3%
Those Who Selected Science as 3rd Area of Interest Only 49 10.7% 5.6% 9 3.8% 1.0% 8 3.5% 0.9%
Subtotal All Science Applicants 460 100.0% 52.7% 209 87.8% 23.9% 202 87.4% 23.1%
Those Who Did NOT Select Science as an Area of Interest on Application 0 0.0% 0.0% 29 12.2% 3.3% 29 12.6% 3.3%
Total 460 100.0% 52.7% 238 100.0% 27.3% 231 100.0% 26.5%
Total Graduated Cohort 873
Biological Sciences* Attrition From Application to Graduation
Number
% of
Biological
Science
Interest
% of Total
Graduated
Cohort Number
% of
Biological
Science
Interest
% of Total
Graduated
Cohort Number
% of
Biological
Science
Interest
% of Total
Graduated
Cohort
Those Who Selected Biological Science 1st Area of Interest 135 83.3% 15.5% 31 55.4% 3.6% 32 54.2% 3.7%
Those Who Selected Biological Science as 2nd Area of Interest but Not 1st 21 13.0% 2.4% 1 1.8% 0.1% 2 3.4% 0.2%
Those Who Selected Biological Science as 3rd Area of Interest Only 6 3.7% 0.7% 1 1.8% 0.1% 1 1.7% 0.1%
Subtotal All Biological Science Applicants 162 100.0% 18.6% 33 58.9% 3.8% 35 59.3% 4.0%
Those Who Did NOT Select Biological Science as an Area of Interest on Application 0 0.0% 0.0% 23 41.1% 2.6% 24 40.7% 2.7%
Total 162 100.0% 18.6% 56 100.0% 6.4% 59 100.0% 6.8%
Total Graduated Cohort 873
06-07 Graduates
Interest Declared Graduated
06-07 Graduates
Interest Declared Graduated
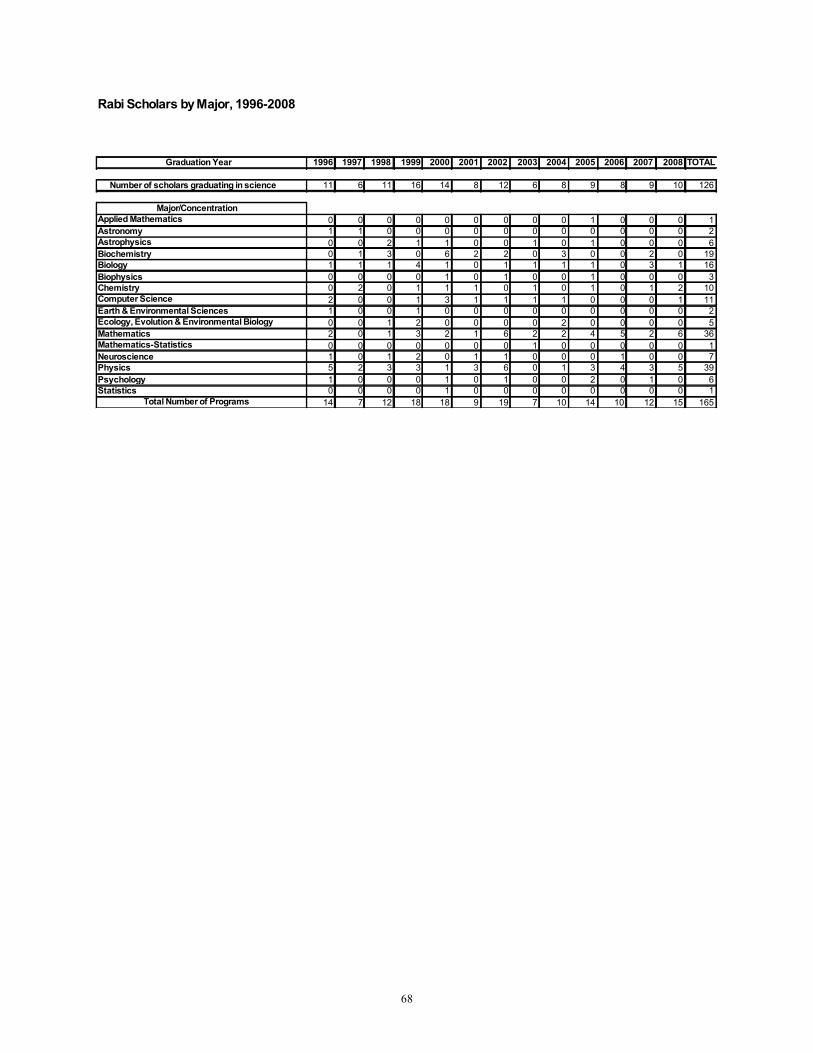
68
Rabi Scholars by Major, 1996-2008
Graduation Year 1996 1997 1998 1999 2000 2001 2002 2003 2004 2005 2006 2007 2008 TOTAL
Number of scholars graduating in science 11 6 11 16 14 8 12 6 8 9 8 9 10 126
Major/Concentration
Applied Mathematics 0 0 0 0 0 0 0 0 0 1 0 0 0 1
Astronomy 1 1 0 0 0 0 0 0 0 0 0 0 0 2
Astrophysics 0 0 2 1 1 0 0 1 0 1 0 0 0 6
Biochemistry 0 1 3 0 6 2 2 0 3 0 0 2 0 19
Biology 1 1 1 4 1 0 1 1 1 1 0 3 1 16
Biophysics 0 0 0 0 1 0 1 0 0 1 0 0 0 3
Chemistry 0 2 0 1 1 1 0 1 0 1 0 1 2 10
Computer Science 2 0 0 1 3 1 1 1 1 0 0 0 1 11
Earth & Environmental Sciences 1 0 0 1 0 0 0 0 0 0 0 0 0 2
Ecology, Evolution & Environmental Biology 0 0 1 2 0 0 0 0 2 0 0 0 0 5
Mathematics 2 0 1 3 2 1 6 2 2 4 5 2 6 36
Mathematics-Statistics 0 0 0 0 0 0 0 1 0 0 0 0 0 1
Neuroscience 1 0 1 2 0 1 1 0 0 0 1 0 0 7
Physics 5 2 3 3 1 3 6 0 1 3 4 3 5 39
Psychology 1 0 0 0 1 0 1 0 0 2 0 1 0 6
Statistics 0 0 0 0 1 0 0 0 0 0 0 0 0 1
Total Number of Programs 14 7 12 18 18 9 19 7 10 14 10 12 15 165
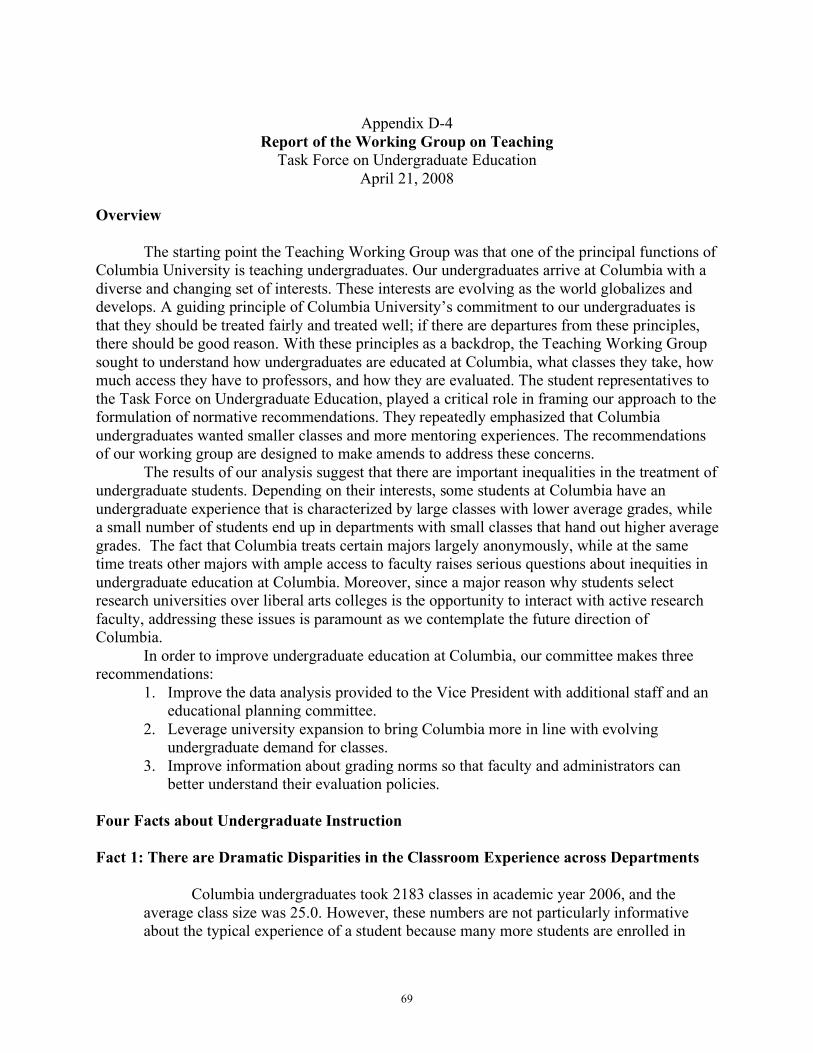
69
Appendix D-4
Report of the Working Group on Teaching Task Force on Undergraduate Education
April 21, 2008 Overview
The starting point the Teaching Working Group was that one of the principal functions of Columbia University is teaching undergraduates. Our undergraduates arrive at Columbia with a diverse and changing set of interests. These interests are evolving as the world globalizes and develops. A guiding principle of Columbia University’s commitment to our undergraduates is that they should be treated fairly and treated well; if there are departures from these principles, there should be good reason. With these principles as a backdrop, the Teaching Working Group sought to understand how undergraduates are educated at Columbia, what classes they take, how much access they have to professors, and how they are evaluated. The student representatives to the Task Force on Undergraduate Education, played a critical role in framing our approach to the formulation of normative recommendations. They repeatedly emphasized that Columbia undergraduates wanted smaller classes and more mentoring experiences. The recommendations of our working group are designed to make amends to address these concerns.
The results of our analysis suggest that there are important inequalities in the treatment of undergraduate students. Depending on their interests, some students at Columbia have an undergraduate experience that is characterized by large classes with lower average grades, while a small number of students end up in departments with small classes that hand out higher average grades. The fact that Columbia treats certain majors largely anonymously, while at the same time treats other majors with ample access to faculty raises serious questions about inequities in undergraduate education at Columbia. Moreover, since a major reason why students select research universities over liberal arts colleges is the opportunity to interact with active research faculty, addressing these issues is paramount as we contemplate the future direction of Columbia.
In order to improve undergraduate education at Columbia, our committee makes three recommendations:
1. Improve the data analysis provided to the Vice President with additional staff and an educational planning committee.
2. Leverage university expansion to bring Columbia more in line with evolving undergraduate demand for classes.
3. Improve information about grading norms so that faculty and administrators can better understand their evaluation policies.
Four Facts about Undergraduate Instruction Fact 1: There are Dramatic Disparities in the Classroom Experience across Departments
Columbia undergraduates took 2183 classes in academic year 2006, and the average class size was 25.0. However, these numbers are not particularly informative about the typical experience of a student because many more students are enrolled in
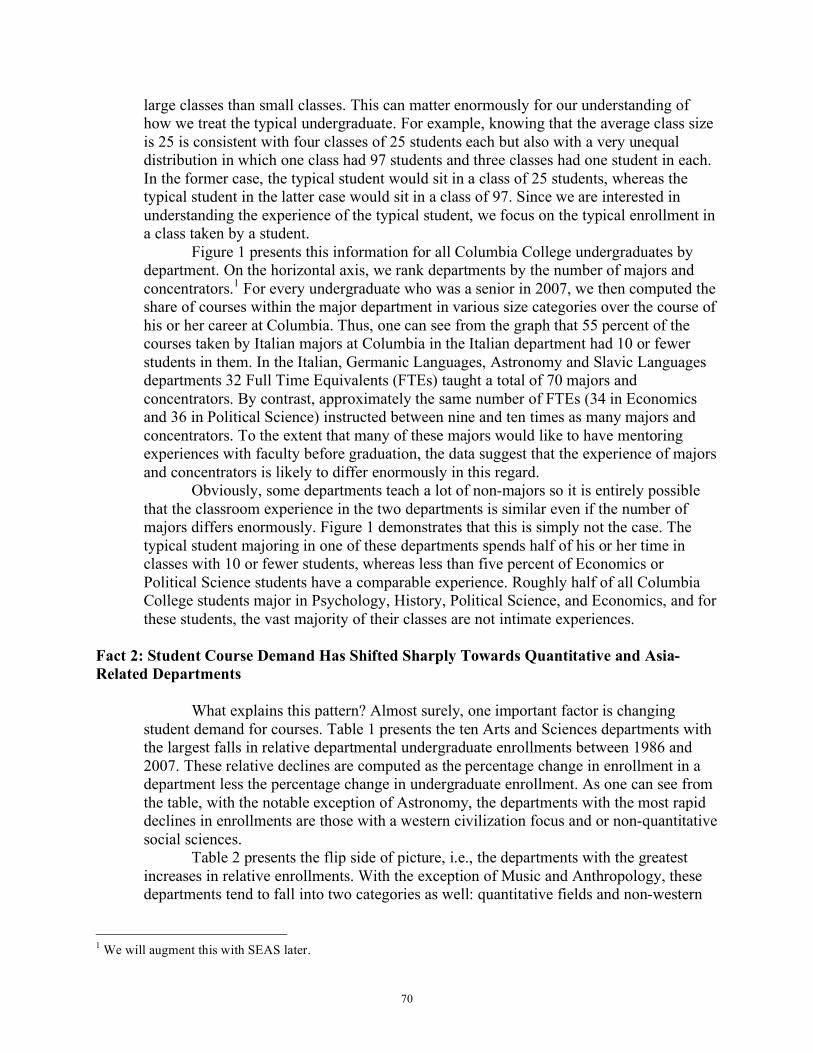
70
large classes than small classes. This can matter enormously for our understanding of how we treat the typical undergraduate. For example, knowing that the average class size is 25 is consistent with four classes of 25 students each but also with a very unequal distribution in which one class had 97 students and three classes had one student in each. In the former case, the typical student would sit in a class of 25 students, whereas the typical student in the latter case would sit in a class of 97. Since we are interested in understanding the experience of the typical student, we focus on the typical enrollment in a class taken by a student.
Figure 1 presents this information for all Columbia College undergraduates by department. On the horizontal axis, we rank departments by the number of majors and concentrators.1 For every undergraduate who was a senior in 2007, we then computed the share of courses within the major department in various size categories over the course of his or her career at Columbia. Thus, one can see from the graph that 55 percent of the courses taken by Italian majors at Columbia in the Italian department had 10 or fewer students in them. In the Italian, Germanic Languages, Astronomy and Slavic Languages departments 32 Full Time Equivalents (FTEs) taught a total of 70 majors and concentrators. By contrast, approximately the same number of FTEs (34 in Economics and 36 in Political Science) instructed between nine and ten times as many majors and concentrators. To the extent that many of these majors would like to have mentoring experiences with faculty before graduation, the data suggest that the experience of majors and concentrators is likely to differ enormously in this regard.
Obviously, some departments teach a lot of non-majors so it is entirely possible that the classroom experience in the two departments is similar even if the number of majors differs enormously. Figure 1 demonstrates that this is simply not the case. The typical student majoring in one of these departments spends half of his or her time in classes with 10 or fewer students, whereas less than five percent of Economics or Political Science students have a comparable experience. Roughly half of all Columbia College students major in Psychology, History, Political Science, and Economics, and for these students, the vast majority of their classes are not intimate experiences.
Fact 2: Student Course Demand Has Shifted Sharply Towards Quantitative and Asia-Related Departments
What explains this pattern? Almost surely, one important factor is changing
student demand for courses. Table 1 presents the ten Arts and Sciences departments with the largest falls in relative departmental undergraduate enrollments between 1986 and 2007. These relative declines are computed as the percentage change in enrollment in a department less the percentage change in undergraduate enrollment. As one can see from the table, with the notable exception of Astronomy, the departments with the most rapid declines in enrollments are those with a western civilization focus and or non-quantitative social sciences.
Table 2 presents the flip side of picture, i.e., the departments with the greatest increases in relative enrollments. With the exception of Music and Anthropology, these departments tend to fall into two categories as well: quantitative fields and non-western
1 We will augment this with SEAS later.
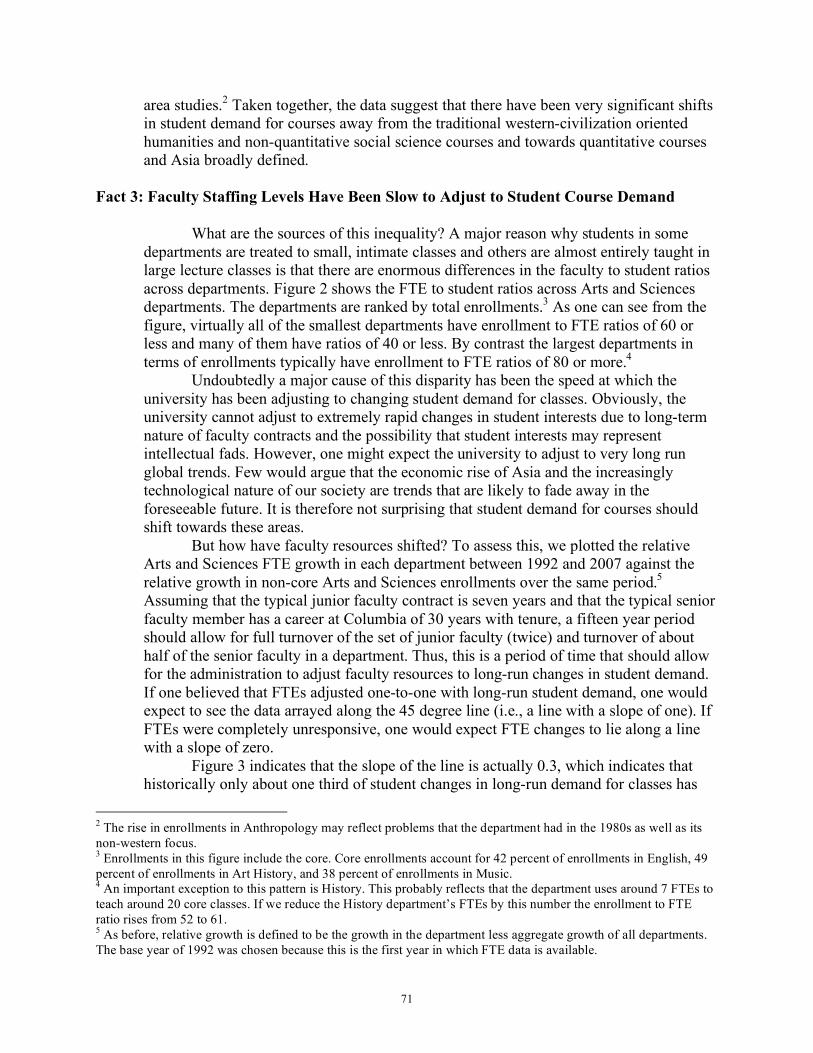
71
area studies.2 Taken together, the data suggest that there have been very significant shifts in student demand for courses away from the traditional western-civilization oriented humanities and non-quantitative social science courses and towards quantitative courses and Asia broadly defined.
Fact 3: Faculty Staffing Levels Have Been Slow to Adjust to Student Course Demand
What are the sources of this inequality? A major reason why students in some
departments are treated to small, intimate classes and others are almost entirely taught in large lecture classes is that there are enormous differences in the faculty to student ratios across departments. Figure 2 shows the FTE to student ratios across Arts and Sciences departments. The departments are ranked by total enrollments.3 As one can see from the figure, virtually all of the smallest departments have enrollment to FTE ratios of 60 or less and many of them have ratios of 40 or less. By contrast the largest departments in terms of enrollments typically have enrollment to FTE ratios of 80 or more.4
Undoubtedly a major cause of this disparity has been the speed at which the university has been adjusting to changing student demand for classes. Obviously, the university cannot adjust to extremely rapid changes in student interests due to long-term nature of faculty contracts and the possibility that student interests may represent intellectual fads. However, one might expect the university to adjust to very long run global trends. Few would argue that the economic rise of Asia and the increasingly technological nature of our society are trends that are likely to fade away in the foreseeable future. It is therefore not surprising that student demand for courses should shift towards these areas.
But how have faculty resources shifted? To assess this, we plotted the relative Arts and Sciences FTE growth in each department between 1992 and 2007 against the relative growth in non-core Arts and Sciences enrollments over the same period.5 Assuming that the typical junior faculty contract is seven years and that the typical senior faculty member has a career at Columbia of 30 years with tenure, a fifteen year period should allow for full turnover of the set of junior faculty (twice) and turnover of about half of the senior faculty in a department. Thus, this is a period of time that should allow for the administration to adjust faculty resources to long-run changes in student demand. If one believed that FTEs adjusted one-to-one with long-run student demand, one would expect to see the data arrayed along the 45 degree line (i.e., a line with a slope of one). If FTEs were completely unresponsive, one would expect FTE changes to lie along a line with a slope of zero.
Figure 3 indicates that the slope of the line is actually 0.3, which indicates that historically only about one third of student changes in long-run demand for classes has
2 The rise in enrollments in Anthropology may reflect problems that the department had in the 1980s as well as its non-western focus. 3 Enrollments in this figure include the core. Core enrollments account for 42 percent of enrollments in English, 49 percent of enrollments in Art History, and 38 percent of enrollments in Music. 4 An important exception to this pattern is History. This probably reflects that the department uses around 7 FTEs to teach around 20 core classes. If we reduce the History department’s FTEs by this number the enrollment to FTE ratio rises from 52 to 61. 5 As before, relative growth is defined to be the growth in the department less aggregate growth of all departments. The base year of 1992 was chosen because this is the first year in which FTE data is available.
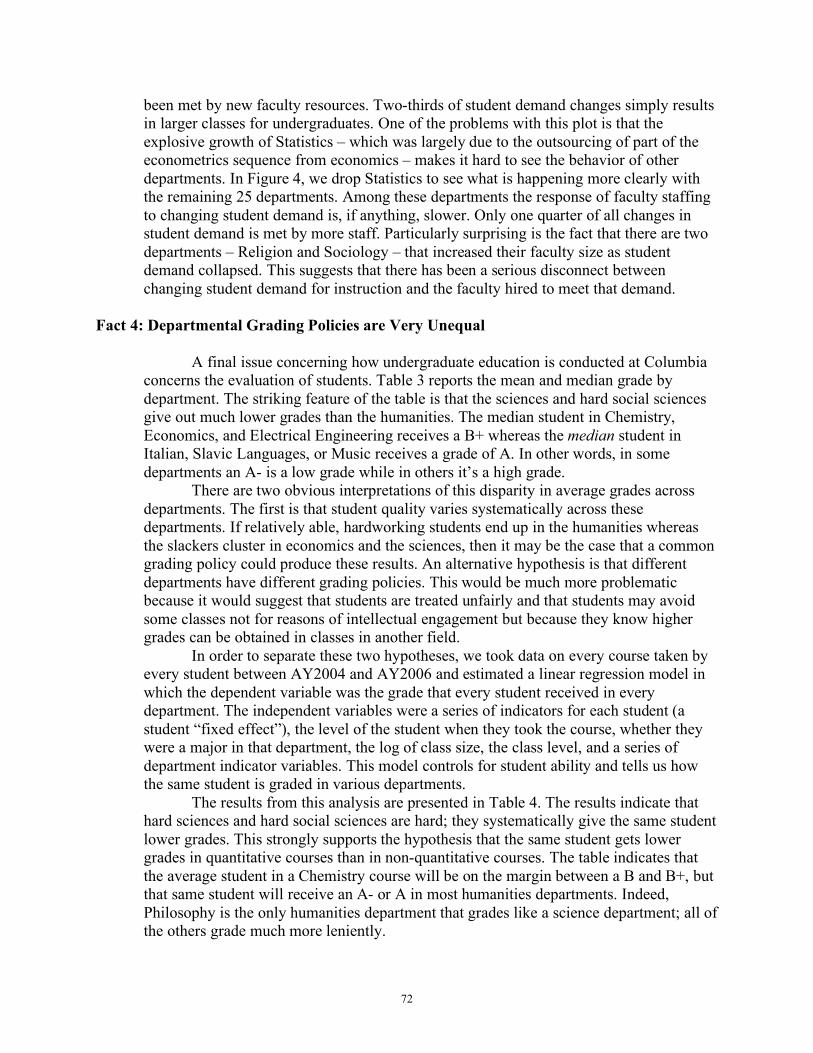
72
been met by new faculty resources. Two-thirds of student demand changes simply results in larger classes for undergraduates. One of the problems with this plot is that the explosive growth of Statistics – which was largely due to the outsourcing of part of the econometrics sequence from economics – makes it hard to see the behavior of other departments. In Figure 4, we drop Statistics to see what is happening more clearly with the remaining 25 departments. Among these departments the response of faculty staffing to changing student demand is, if anything, slower. Only one quarter of all changes in student demand is met by more staff. Particularly surprising is the fact that there are two departments – Religion and Sociology – that increased their faculty size as student demand collapsed. This suggests that there has been a serious disconnect between changing student demand for instruction and the faculty hired to meet that demand.
Fact 4: Departmental Grading Policies are Very Unequal
A final issue concerning how undergraduate education is conducted at Columbia
concerns the evaluation of students. Table 3 reports the mean and median grade by department. The striking feature of the table is that the sciences and hard social sciences give out much lower grades than the humanities. The median student in Chemistry, Economics, and Electrical Engineering receives a B+ whereas the median student in Italian, Slavic Languages, or Music receives a grade of A. In other words, in some departments an A- is a low grade while in others it’s a high grade.
There are two obvious interpretations of this disparity in average grades across departments. The first is that student quality varies systematically across these departments. If relatively able, hardworking students end up in the humanities whereas the slackers cluster in economics and the sciences, then it may be the case that a common grading policy could produce these results. An alternative hypothesis is that different departments have different grading policies. This would be much more problematic because it would suggest that students are treated unfairly and that students may avoid some classes not for reasons of intellectual engagement but because they know higher grades can be obtained in classes in another field.
In order to separate these two hypotheses, we took data on every course taken by every student between AY2004 and AY2006 and estimated a linear regression model in which the dependent variable was the grade that every student received in every department. The independent variables were a series of indicators for each student (a student “fixed effect”), the level of the student when they took the course, whether they were a major in that department, the log of class size, the class level, and a series of department indicator variables. This model controls for student ability and tells us how the same student is graded in various departments.
The results from this analysis are presented in Table 4. The results indicate that hard sciences and hard social sciences are hard; they systematically give the same student lower grades. This strongly supports the hypothesis that the same student gets lower grades in quantitative courses than in non-quantitative courses. The table indicates that the average student in a Chemistry course will be on the margin between a B and B+, but that same student will receive an A- or A in most humanities departments. Indeed, Philosophy is the only humanities department that grades like a science department; all of the others grade much more leniently.
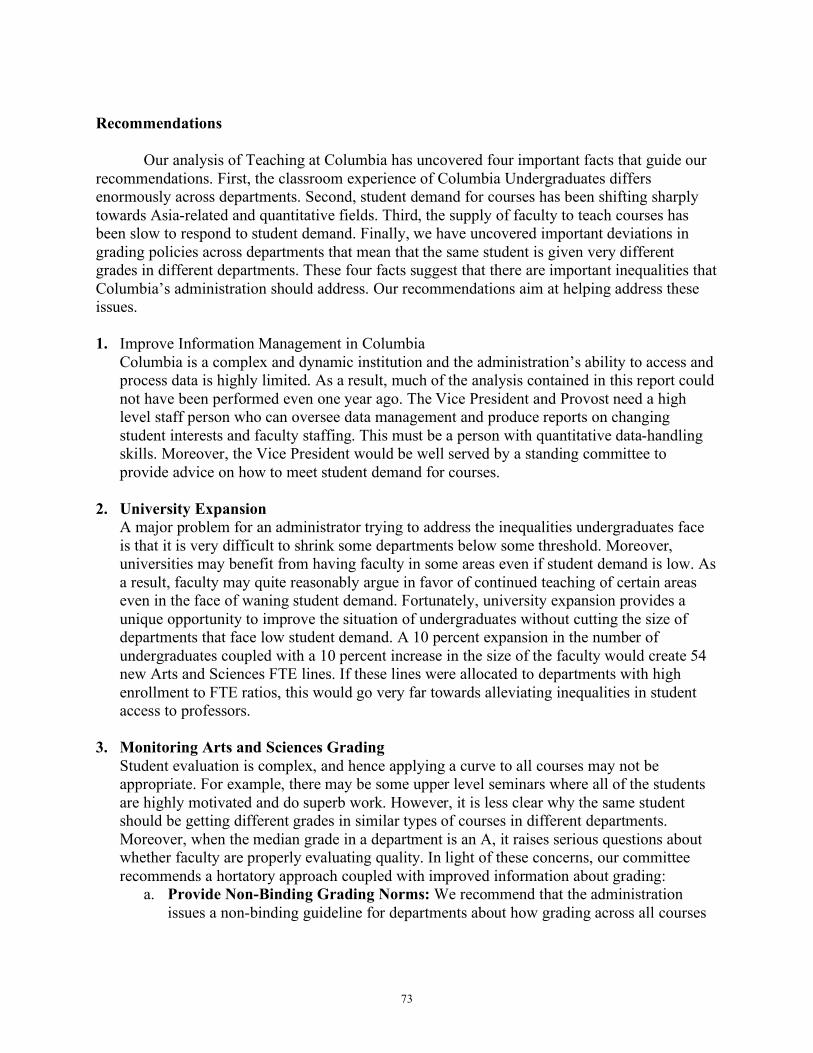
73
Recommendations
Our analysis of Teaching at Columbia has uncovered four important facts that guide our recommendations. First, the classroom experience of Columbia Undergraduates differs enormously across departments. Second, student demand for courses has been shifting sharply towards Asia-related and quantitative fields. Third, the supply of faculty to teach courses has been slow to respond to student demand. Finally, we have uncovered important deviations in grading policies across departments that mean that the same student is given very different grades in different departments. These four facts suggest that there are important inequalities that Columbia’s administration should address. Our recommendations aim at helping address these issues.
1. Improve Information Management in Columbia
Columbia is a complex and dynamic institution and the administration’s ability to access and process data is highly limited. As a result, much of the analysis contained in this report could not have been performed even one year ago. The Vice President and Provost need a high level staff person who can oversee data management and produce reports on changing student interests and faculty staffing. This must be a person with quantitative data-handling skills. Moreover, the Vice President would be well served by a standing committee to provide advice on how to meet student demand for courses.
2. University Expansion A major problem for an administrator trying to address the inequalities undergraduates face is that it is very difficult to shrink some departments below some threshold. Moreover, universities may benefit from having faculty in some areas even if student demand is low. As a result, faculty may quite reasonably argue in favor of continued teaching of certain areas even in the face of waning student demand. Fortunately, university expansion provides a unique opportunity to improve the situation of undergraduates without cutting the size of departments that face low student demand. A 10 percent expansion in the number of undergraduates coupled with a 10 percent increase in the size of the faculty would create 54 new Arts and Sciences FTE lines. If these lines were allocated to departments with high enrollment to FTE ratios, this would go very far towards alleviating inequalities in student access to professors.
3. Monitoring Arts and Sciences Grading Student evaluation is complex, and hence applying a curve to all courses may not be appropriate. For example, there may be some upper level seminars where all of the students are highly motivated and do superb work. However, it is less clear why the same student should be getting different grades in similar types of courses in different departments. Moreover, when the median grade in a department is an A, it raises serious questions about whether faculty are properly evaluating quality. In light of these concerns, our committee recommends a hortatory approach coupled with improved information about grading:
a. Provide Non-Binding Grading Norms: We recommend that the administration issues a non-binding guideline for departments about how grading across all courses
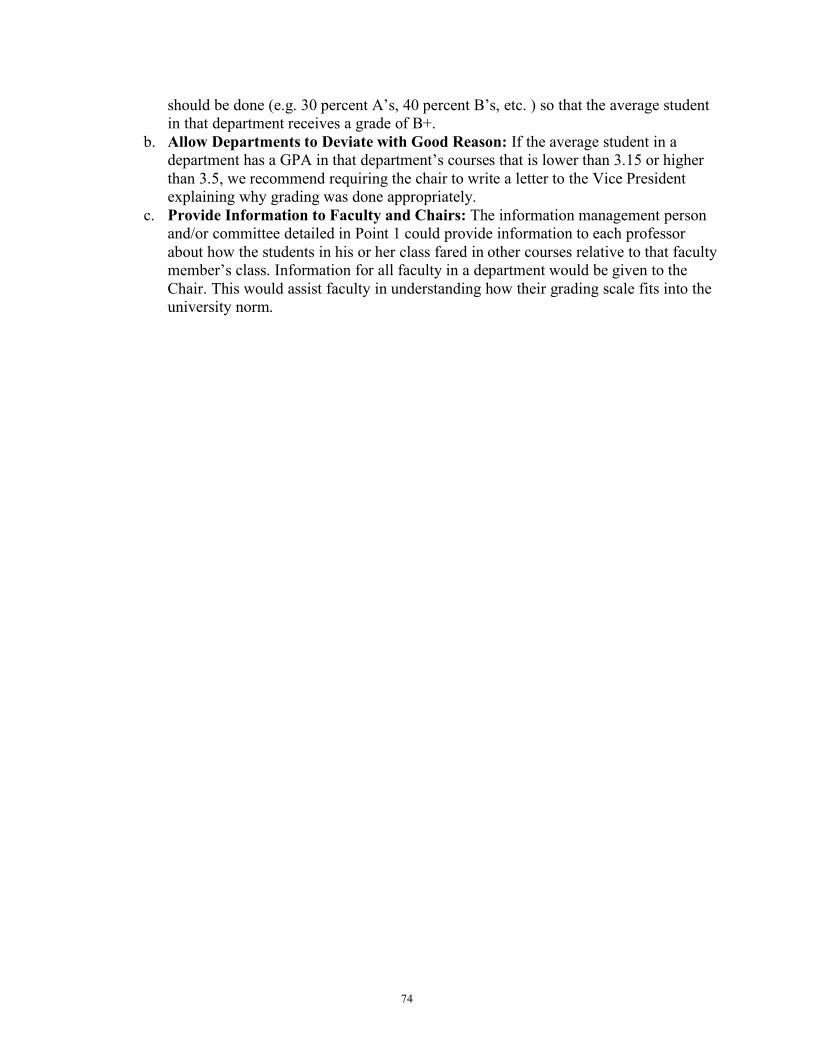
74
should be done (e.g. 30 percent A’s, 40 percent B’s, etc. ) so that the average student in that department receives a grade of B+.
b. Allow Departments to Deviate with Good Reason: If the average student in a department has a GPA in that department’s courses that is lower than 3.15 or higher than 3.5, we recommend requiring the chair to write a letter to the Vice President explaining why grading was done appropriately.
c. Provide Information to Faculty and Chairs: The information management person and/or committee detailed in Point 1 could provide information to each professor about how the students in his or her class fared in other courses relative to that faculty member’s class. Information for all faculty in a department would be given to the Chair. This would assist faculty in understanding how their grading scale fits into the university norm.
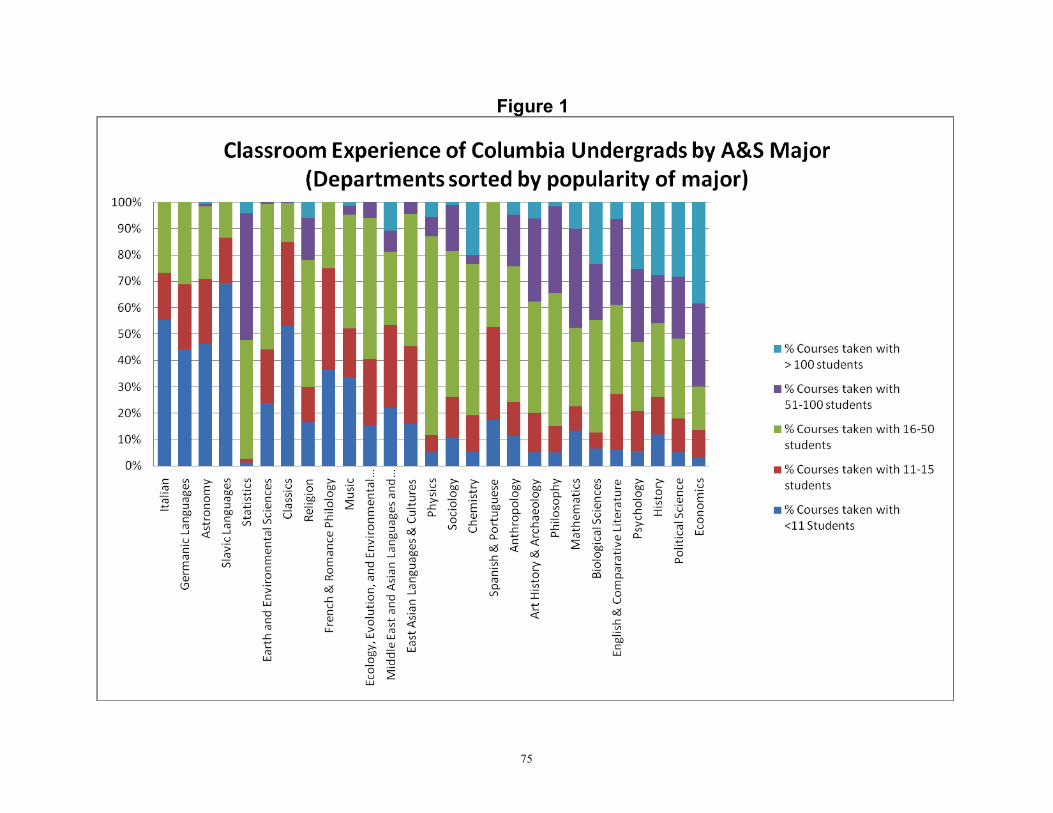
75
Figure 1
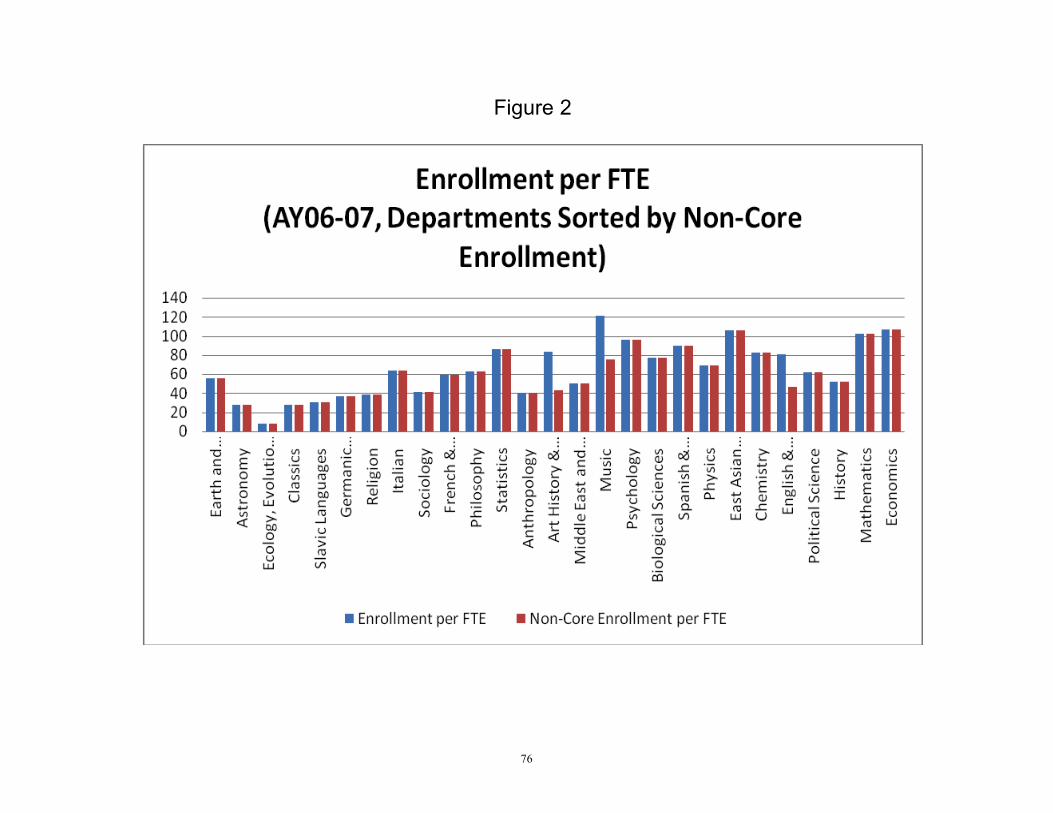
76
Figure 2
77
Figure 3
ANTH
AHAR
ASTR
BIOS
CHEM
CLASEESC
EALC
ECON
ENCLFRRP
GERL
HISTITAL
MATHMELC
MUSI
PHILPHYSPOLSPSYC
RELISLAL
SOCISPPO
STAT
45 degree line
Best Fit
-10
00
10
02
00
30
04
00
Gro
wth
in
Re
lative
FT
Es 1
99
2-2
00
7
-100 0 100 200 300 400
Growth in Relative Non-Core Enrollments 1992-2007
FTE Fitted values
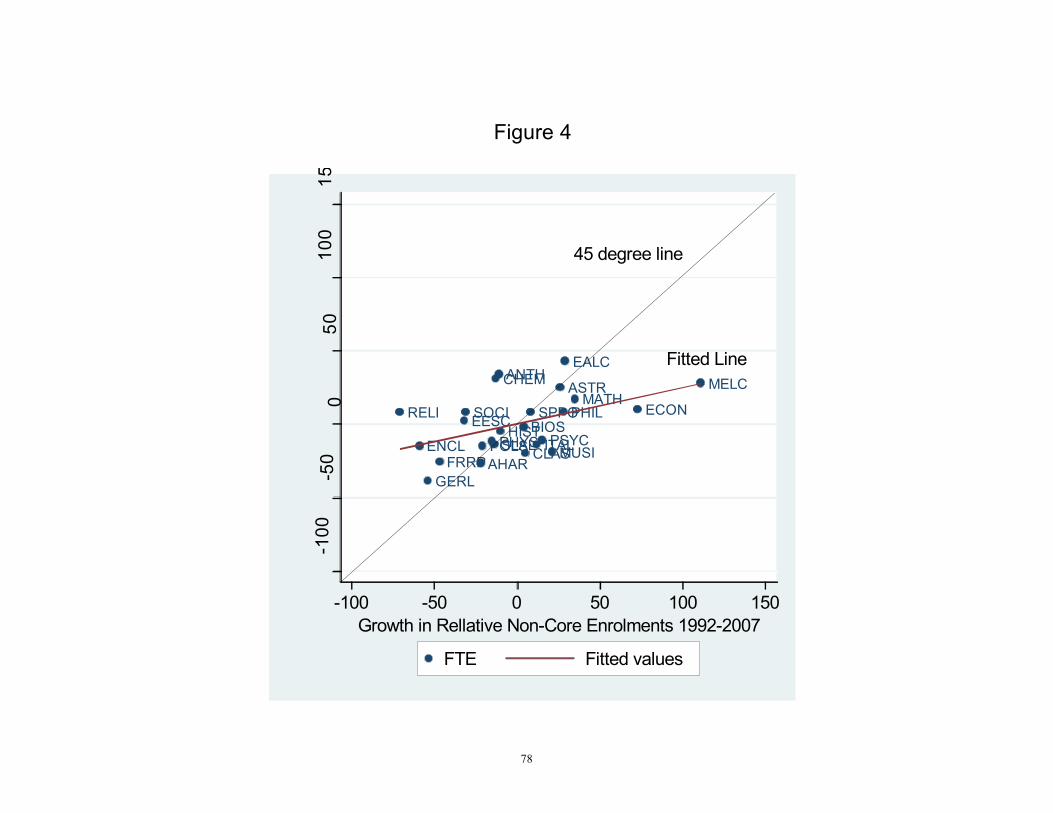
78
Figure 4
ANTH
AHAR
ASTR
BIOS
CHEM
CLAS
EESC
EALC
ECON
ENCLFRRP
GERL
HISTITAL
MATHMELC
MUSI
PHIL
PHYSPOLS PSYC
RELI
SLAL
SOCI SPPO
45 degree line
Fitted Line
-10
0-5
00
50
10
01
50
Gro
wth
in
Re
lative
FT
Es1
99
2-2
00
7
-100 -50 0 50 100 150
Growth in Rellative Non-Core Enrolments 1992-2007
FTE Fitted values
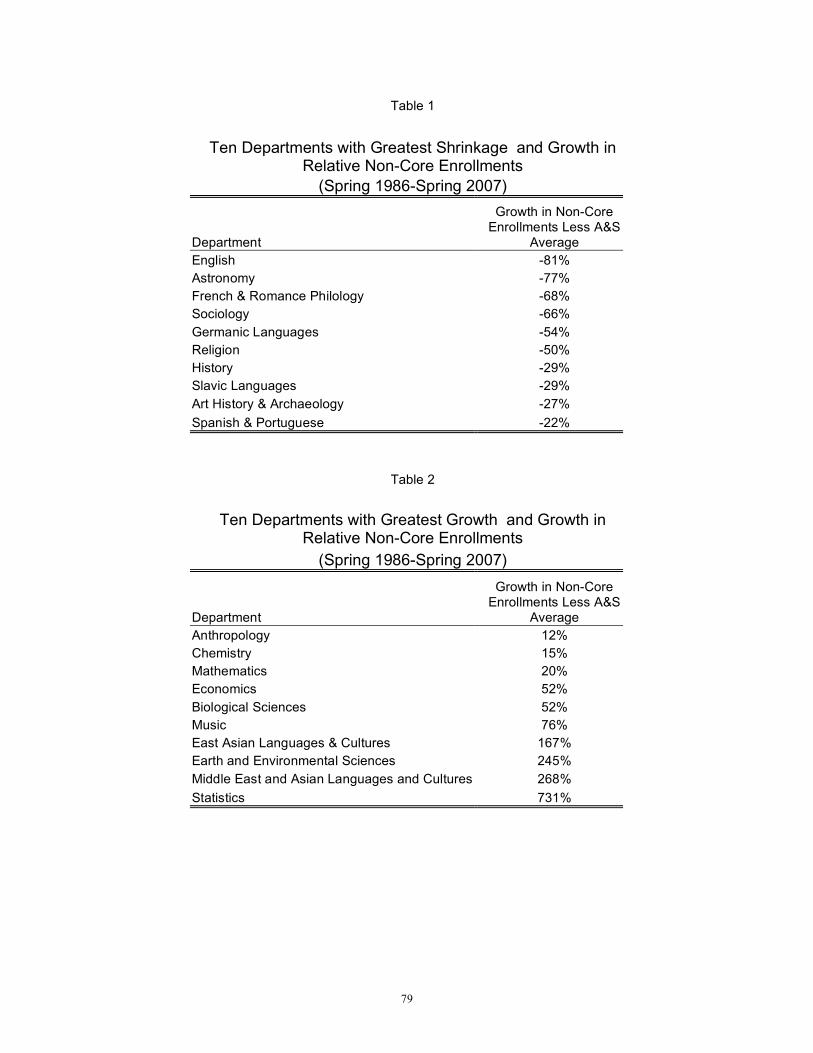
79
Table 1
Ten Departments with Greatest Shrinkage and Growth in Relative Non-Core Enrollments
(Spring 1986-Spring 2007)
Department
Growth in Non-Core Enrollments Less A&S
Average English -81% Astronomy -77% French & Romance Philology -68% Sociology -66% Germanic Languages -54% Religion -50% History -29% Slavic Languages -29% Art History & Archaeology -27% Spanish & Portuguese -22%
Table 2
Ten Departments with Greatest Growth and Growth in Relative Non-Core Enrollments
(Spring 1986-Spring 2007)
Department
Growth in Non-Core Enrollments Less A&S
Average Anthropology 12% Chemistry 15% Mathematics 20% Economics 52% Biological Sciences 52% Music 76% East Asian Languages & Cultures 167% Earth and Environmental Sciences 245% Middle East and Asian Languages and Cultures 268% Statistics 731%
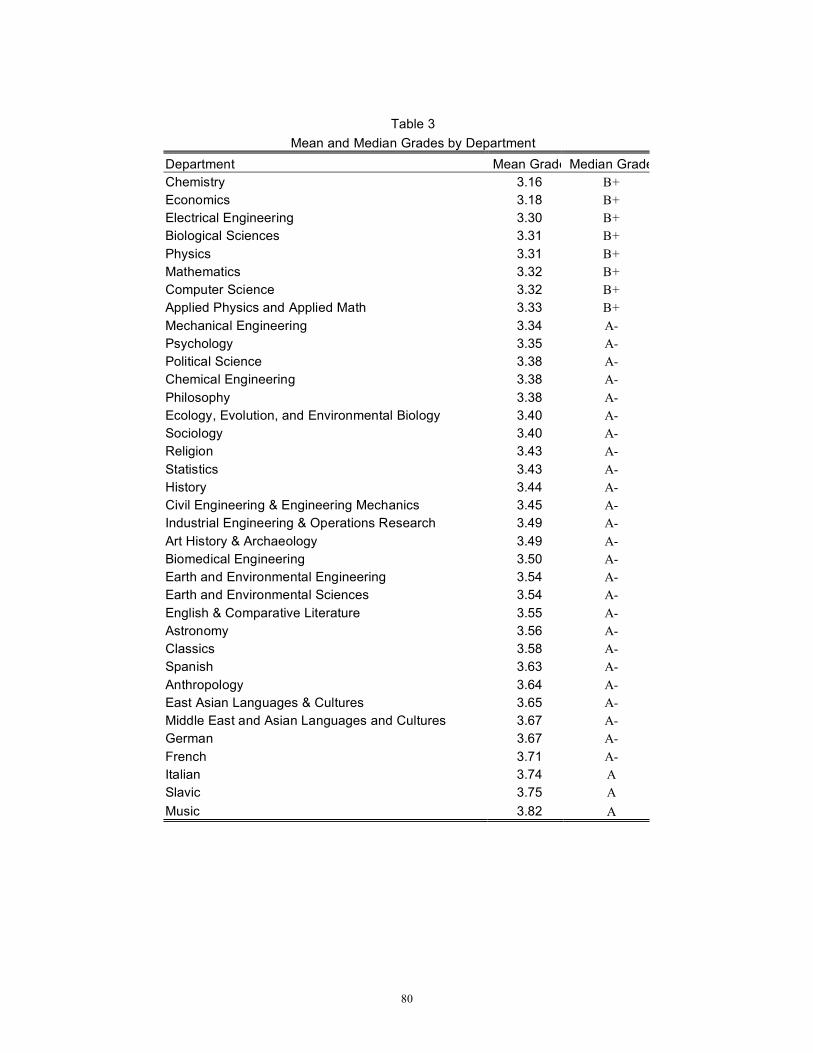
80
Table 3
Mean and Median Grades by Department Department Mean Grade Median Grade Chemistry 3.16 B+ Economics 3.18 B+ Electrical Engineering 3.30 B+ Biological Sciences 3.31 B+ Physics 3.31 B+ Mathematics 3.32 B+ Computer Science 3.32 B+ Applied Physics and Applied Math 3.33 B+ Mechanical Engineering 3.34 A- Psychology 3.35 A- Political Science 3.38 A- Chemical Engineering 3.38 A- Philosophy 3.38 A- Ecology, Evolution, and Environmental Biology 3.40 A- Sociology 3.40 A- Religion 3.43 A- Statistics 3.43 A- History 3.44 A- Civil Engineering & Engineering Mechanics 3.45 A- Industrial Engineering & Operations Research 3.49 A- Art History & Archaeology 3.49 A- Biomedical Engineering 3.50 A- Earth and Environmental Engineering 3.54 A- Earth and Environmental Sciences 3.54 A- English & Comparative Literature 3.55 A- Astronomy 3.56 A- Classics 3.58 A- Spanish 3.63 A- Anthropology 3.64 A- East Asian Languages & Cultures 3.65 A- Middle East and Asian Languages and Cultures 3.67 A- German 3.67 A- French 3.71 A- Italian 3.74 A Slavic 3.75 A Music 3.82 A
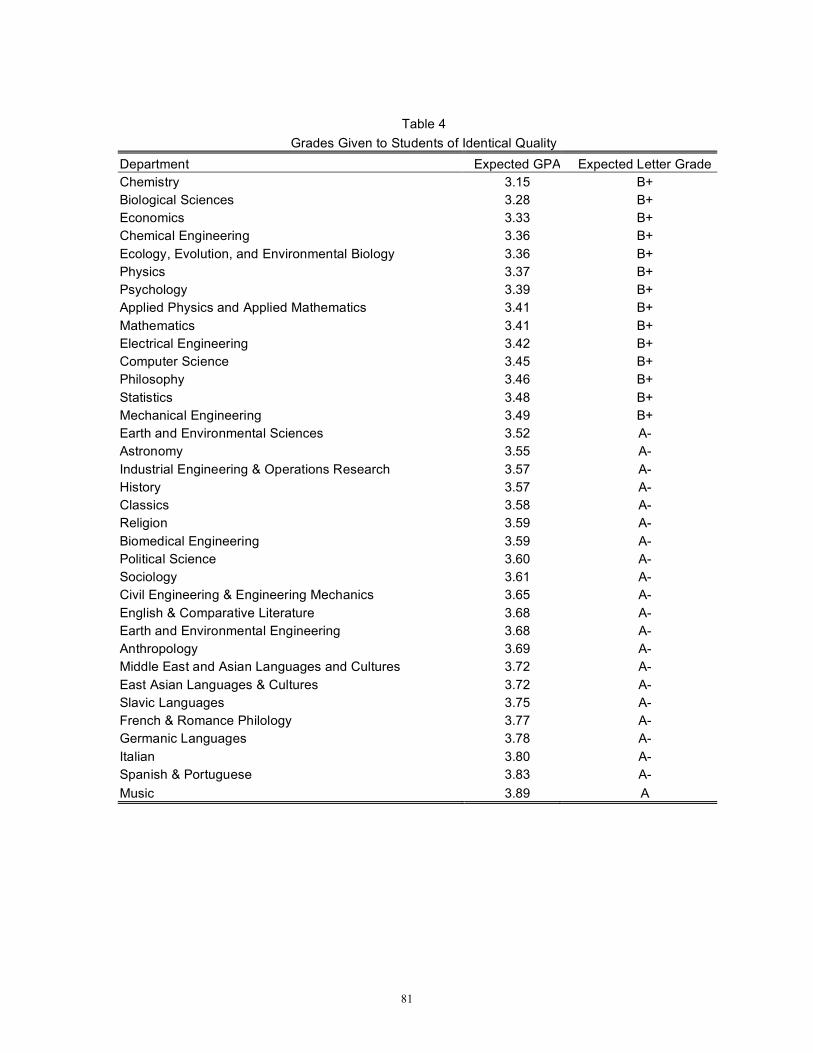
81
Table 4
Grades Given to Students of Identical Quality Department Expected GPA Expected Letter Grade Chemistry 3.15 B+ Biological Sciences 3.28 B+ Economics 3.33 B+ Chemical Engineering 3.36 B+ Ecology, Evolution, and Environmental Biology 3.36 B+ Physics 3.37 B+ Psychology 3.39 B+ Applied Physics and Applied Mathematics 3.41 B+ Mathematics 3.41 B+ Electrical Engineering 3.42 B+ Computer Science 3.45 B+ Philosophy 3.46 B+ Statistics 3.48 B+ Mechanical Engineering 3.49 B+ Earth and Environmental Sciences 3.52 A- Astronomy 3.55 A- Industrial Engineering & Operations Research 3.57 A- History 3.57 A- Classics 3.58 A- Religion 3.59 A- Biomedical Engineering 3.59 A- Political Science 3.60 A- Sociology 3.61 A- Civil Engineering & Engineering Mechanics 3.65 A- English & Comparative Literature 3.68 A- Earth and Environmental Engineering 3.68 A- Anthropology 3.69 A- Middle East and Asian Languages and Cultures 3.72 A- East Asian Languages & Cultures 3.72 A- Slavic Languages 3.75 A- French & Romance Philology 3.77 A- Germanic Languages 3.78 A- Italian 3.80 A- Spanish & Portuguese 3.83 A- Music 3.89 A

82