
An Advanced Investigation on LVRT Strategy in Wind...
17
An Advanced Investigation on LVRT Strategy in Wind Integrated Power Systems Ankit Jotwani and Zakir Rather, IIT Bombay, India 1 st international conference on Large-Scale Grid Integration of Renewable Energy in India September 6-8, 2017
Transcript of An Advanced Investigation on LVRT Strategy in Wind...

An Advanced
Investigation on LVRT
Strategy in Wind
Integrated Power
Systems
Ankit Jotwani and Zakir Rather,IIT Bombay, India
1st international conference on
Large-Scale Grid Integration of Renewable Energy in IndiaSeptember 6-8, 2017
Introduction
1
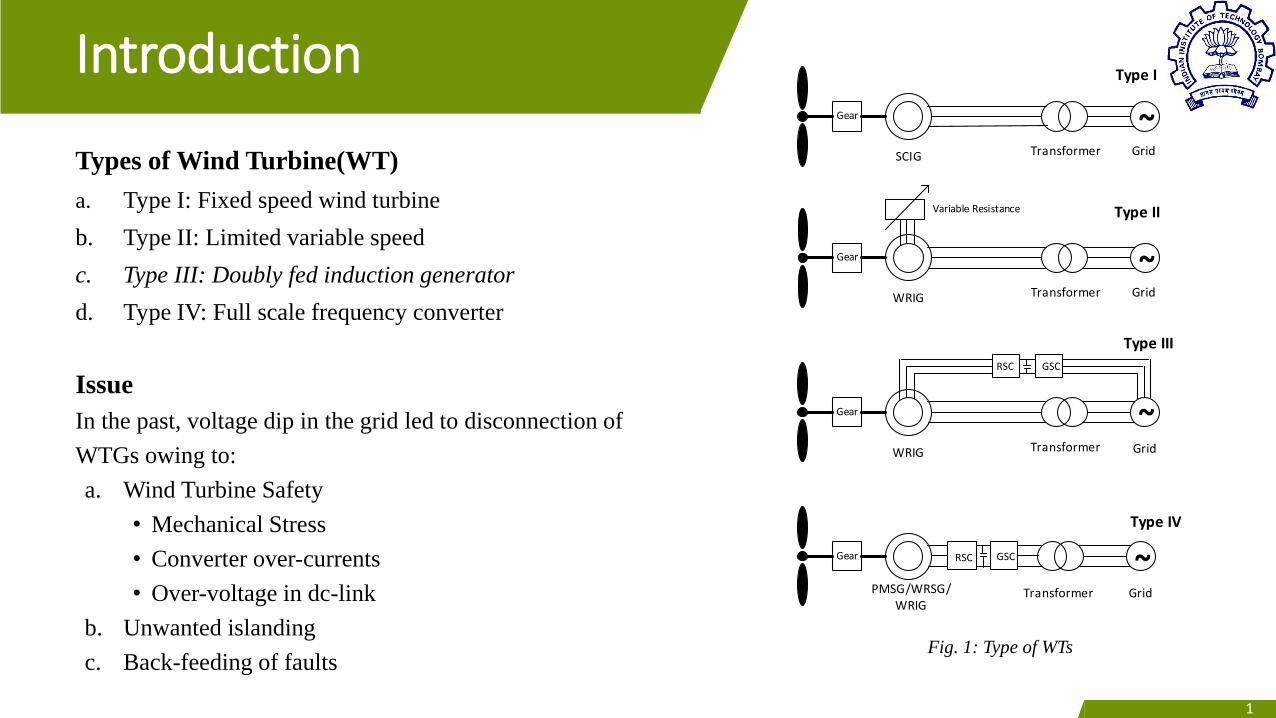
Types of Wind Turbine(WT)
a. Type I: Fixed speed wind turbine
b. Type II: Limited variable speed
c. Type III: Doubly fed induction generator
d. Type IV: Full scale frequency converter
Issue
In the past, voltage dip in the grid led to disconnection of
WTGs owing to:
a. Wind Turbine Safety
• Mechanical Stress
• Converter over-currents
• Over-voltage in dc-link
b. Unwanted islanding
c. Back-feeding of faults
1
Type I
~Gear
SCIG Transformer Grid
~Gear
WRIG Transformer Grid
Variable Resistance
~Gear
WRIG Transformer Grid
~Gear
PMSG/WRSG/WRIG
Transformer Grid
RSC GSC
RSC GSC
Type II
Type III
Type IV
Fig. 1: Type of WTs
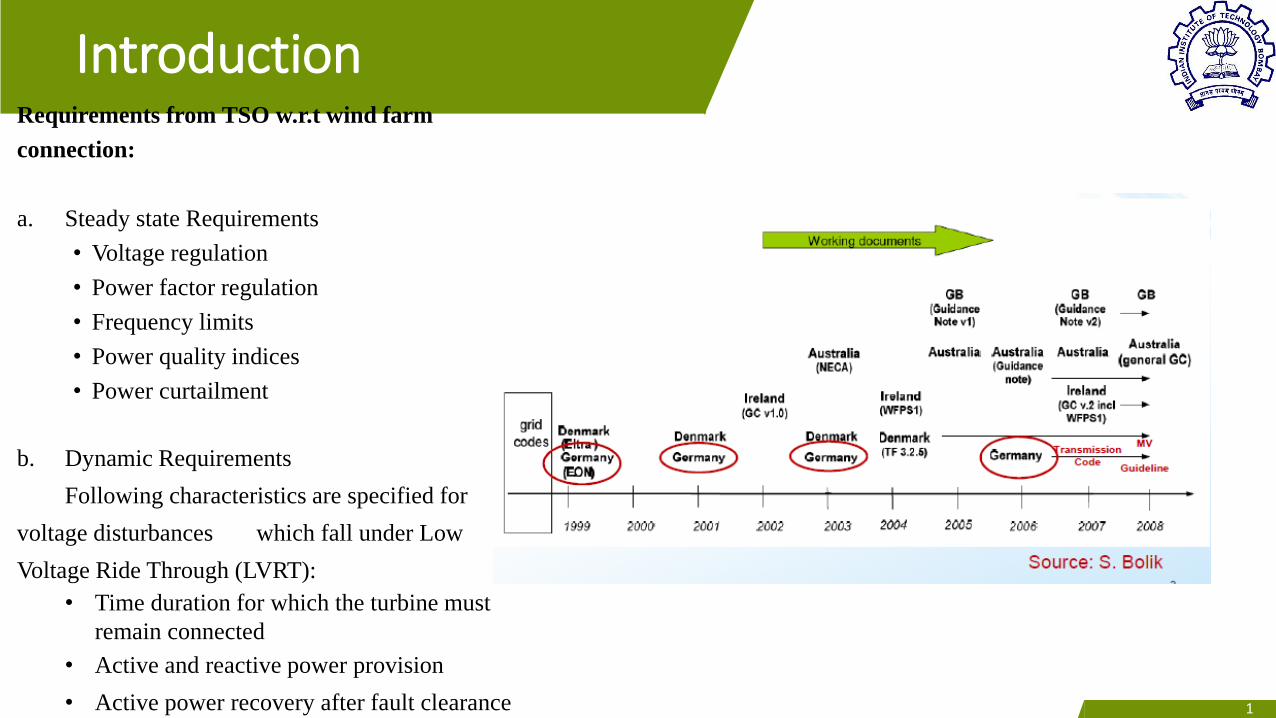
IntroductionRequirements from TSO w.r.t wind farm
connection:
a. Steady state Requirements
• Voltage regulation
• Power factor regulation
• Frequency limits
• Power quality indices
• Power curtailment
b. Dynamic Requirements
Following characteristics are specified for
voltage disturbances which fall under Low
Voltage Ride Through (LVRT):
• Time duration for which the turbine must
remain connected
• Active and reactive power provision
• Active power recovery after fault clearance 11
Low Voltage Ride Through
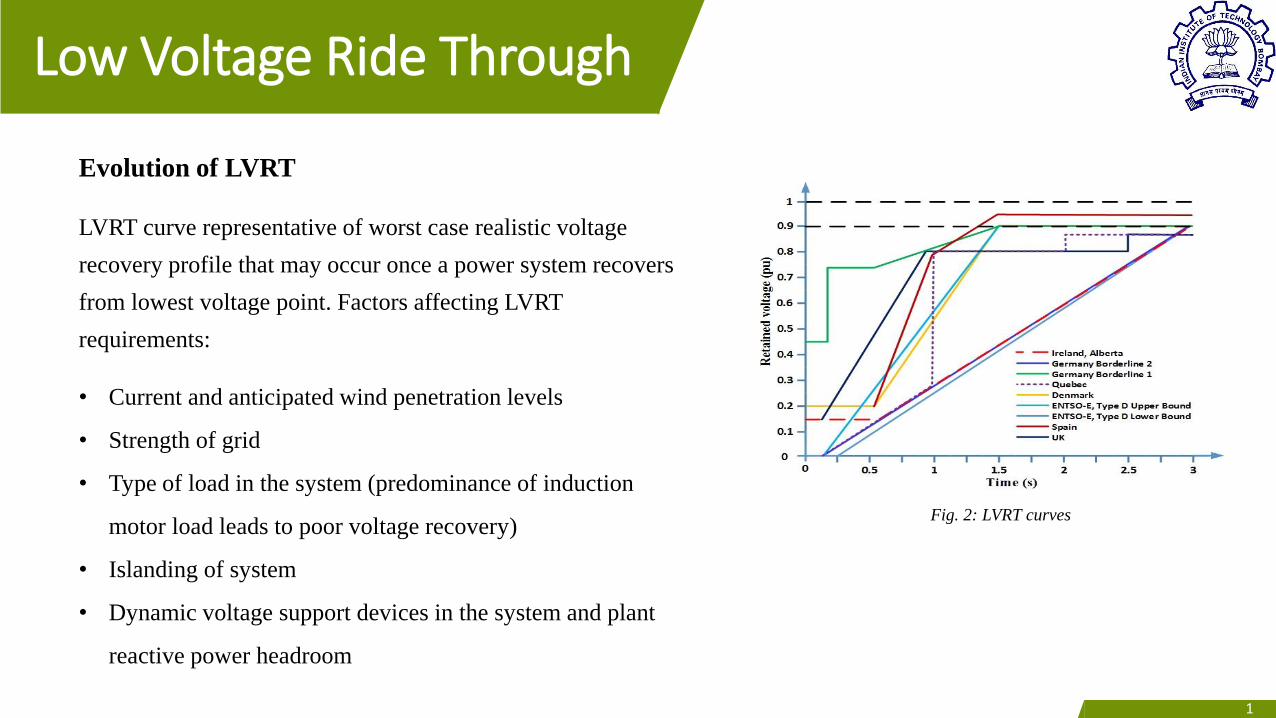
Evolution of LVRT
LVRT curve representative of worst case realistic voltage
recovery profile that may occur once a power system recovers
from lowest voltage point. Factors affecting LVRT
requirements:
• Current and anticipated wind penetration levels
• Strength of grid
• Type of load in the system (predominance of induction
motor load leads to poor voltage recovery)
• Islanding of system
• Dynamic voltage support devices in the system and plant
reactive power headroom
Fig. 2: LVRT curves
11
4LVRT
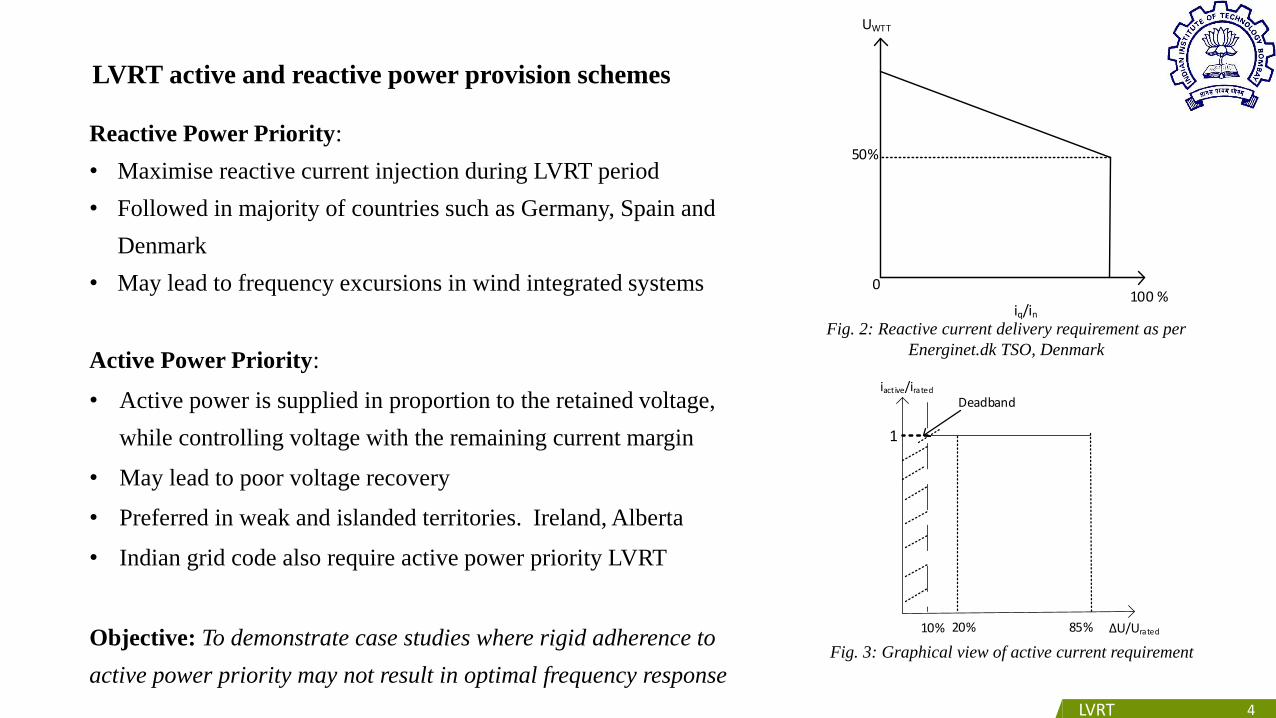
Reactive Power Priority:
• Maximise reactive current injection during LVRT period
• Followed in majority of countries such as Germany, Spain and
Denmark
• May lead to frequency excursions in wind integrated systems
Active Power Priority:
• Active power is supplied in proportion to the retained voltage,
while controlling voltage with the remaining current margin
• May lead to poor voltage recovery
• Preferred in weak and islanded territories. Ireland, Alberta
• Indian grid code also require active power priority LVRT
Objective: To demonstrate case studies where rigid adherence to
active power priority may not result in optimal frequency response
Fig. 2: Reactive current delivery requirement as per
Energinet.dk TSO, Denmark
Fig. 3: Graphical view of active current requirement
100 %0
iq/in
UWTT
50%
10% 20% ΔU/Urated
iactive/irated
Deadband
1
85%
LVRT active and reactive power provision schemes
5LVRT
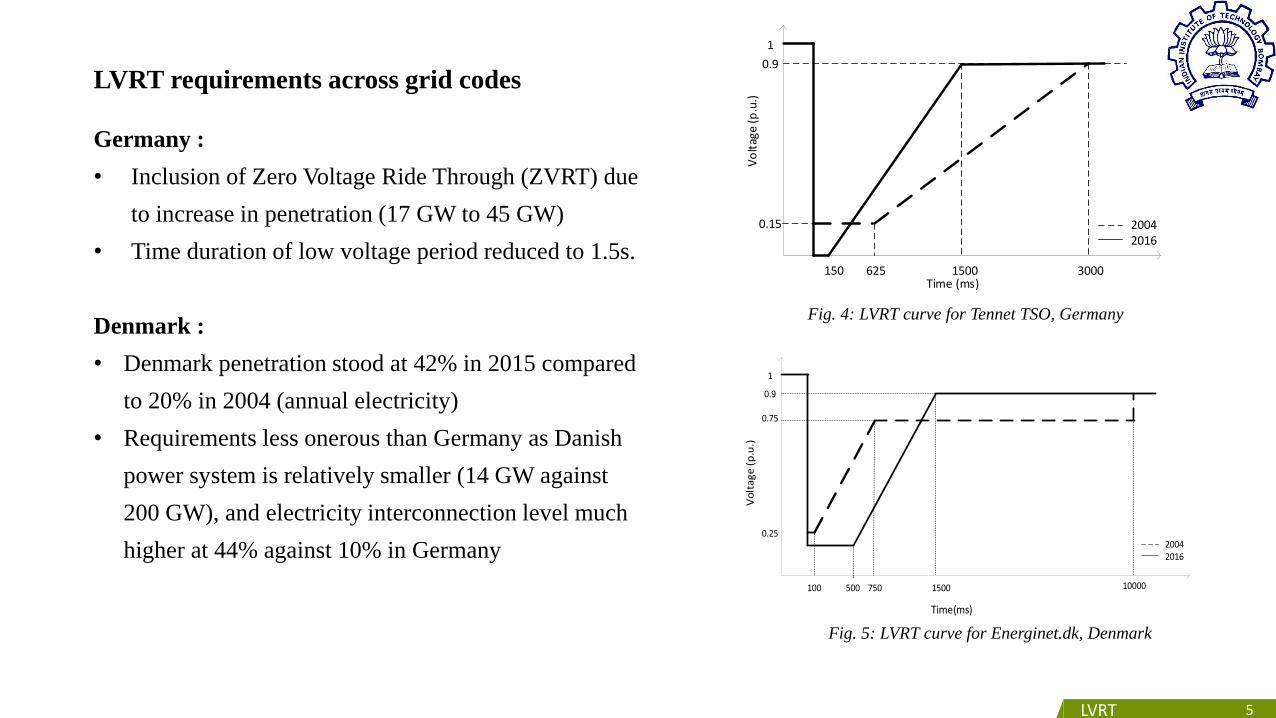
LVRT requirements across grid codes
Germany :
• Inclusion of Zero Voltage Ride Through (ZVRT) due
to increase in penetration (17 GW to 45 GW)
• Time duration of low voltage period reduced to 1.5s.
Denmark :
• Denmark penetration stood at 42% in 2015 compared
to 20% in 2004 (annual electricity)
• Requirements less onerous than Germany as Danish
power system is relatively smaller (14 GW against
200 GW), and electricity interconnection level much
higher at 44% against 10% in Germany
1500100 750
1
0.9
0.25
500 10000
0.75
20042016
Time(ms)
Vo
lta
ge
(p
.u.)
1500 3000150 625
1
0.9
0.15
Vo
ltag
e (p
.u.)
Time (ms)
20042016
Fig. 4: LVRT curve for Tennet TSO, Germany
Fig. 5: LVRT curve for Energinet.dk, Denmark
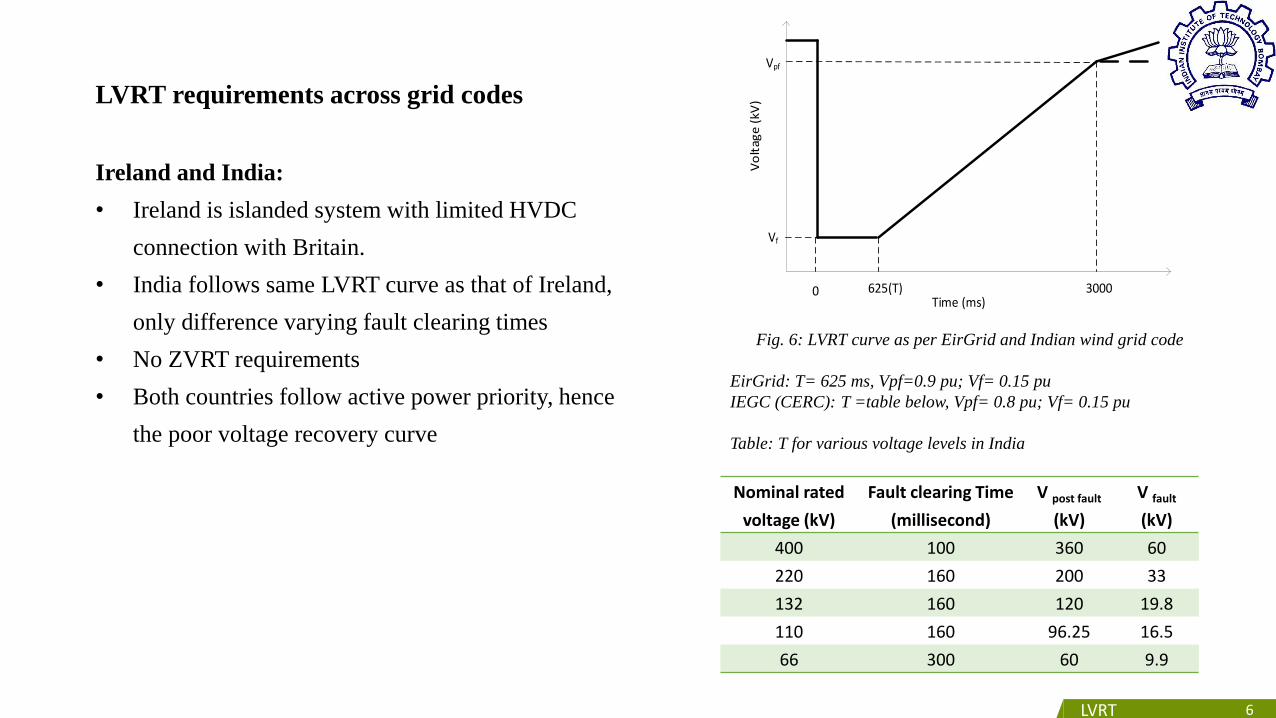
LVRT requirements across grid codes
Ireland and India:
• Ireland is islanded system with limited HVDC
connection with Britain.
• India follows same LVRT curve as that of Ireland,
only difference varying fault clearing times
• No ZVRT requirements
• Both countries follow active power priority, hence
the poor voltage recovery curve
6LVRT
Fig. 6: LVRT curve as per EirGrid and Indian wind grid code
EirGrid: T= 625 ms, Vpf=0.9 pu; Vf= 0.15 pu
IEGC (CERC): T =table below, Vpf= 0.8 pu; Vf= 0.15 pu
Table: T for various voltage levels in India
3000625(T)
Vpf
Vf
Vo
ltag
e (
kV)
Time (ms)0
Nominal rated
voltage (kV)
Fault clearing Time
(millisecond)
V post fault
(kV)
V fault
(kV)
400 100 360 60
220 160 200 33
132 160 120 19.8
110 160 96.25 16.5
66 300 60 9.9
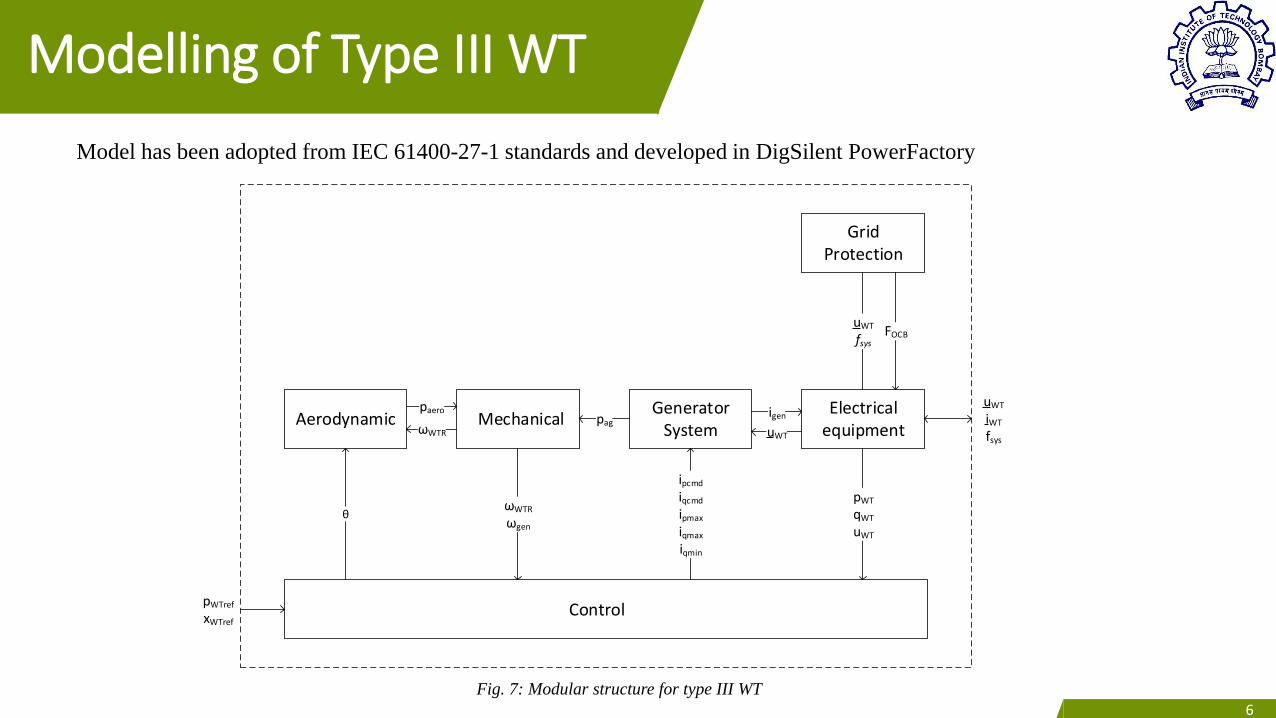
Modelling of Type III WT
Model has been adopted from IEC 61400-27-1 standards and developed in DigSilent PowerFactory
Fig. 7: Modular structure for type III WT
Control
Aerodynamic MechanicalGenerator
SystemElectrical
equipment
Grid Protection
uWT
fsysFOCB
igen
uWT
pag
paero
θ
ipcmd
iqcmd
ipmax
iqmax
iqmin
pWT
qWT
uWT
ωWTR
ωWTR
ωgen
pWTref
xWTref
uWT
iWT
fsys
6
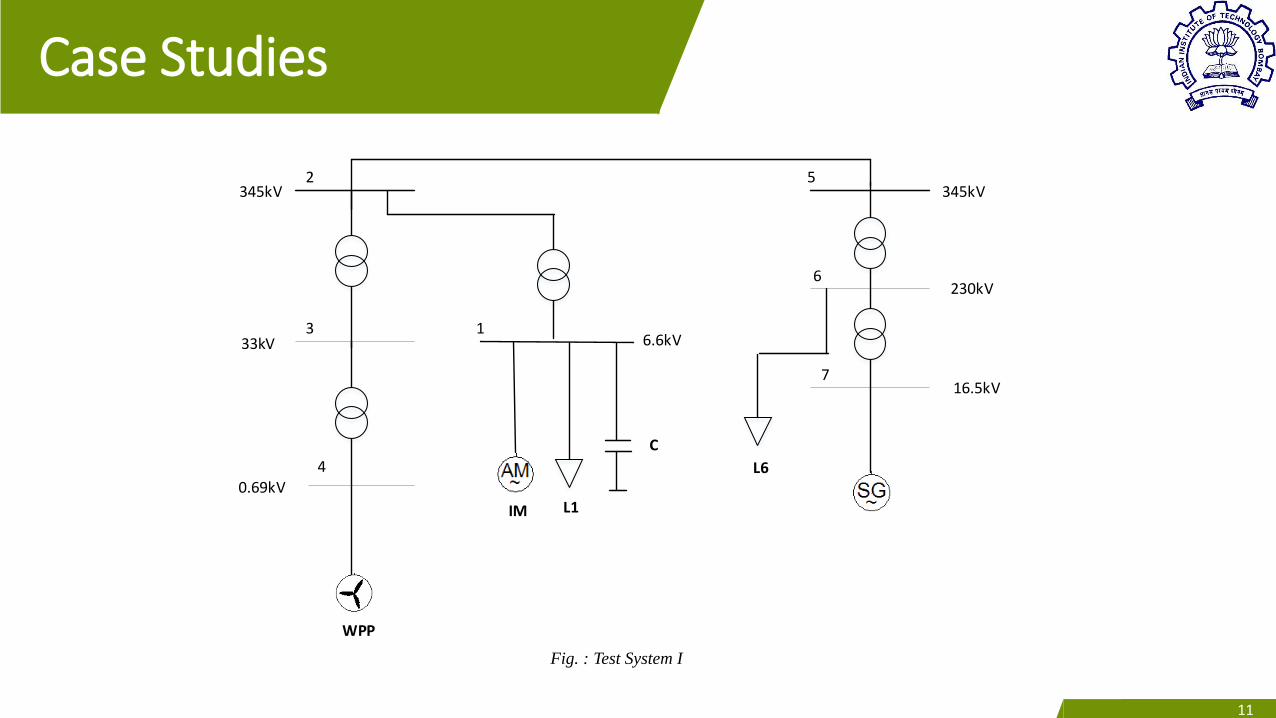
Case Studies
11
Fig. : Test System I
0.69kV
33kV
345kV 345kV
6.6kV
230kV
16.5kV
L1
L6
C
WPP
IM
1
2
3
4
5
6
7
11
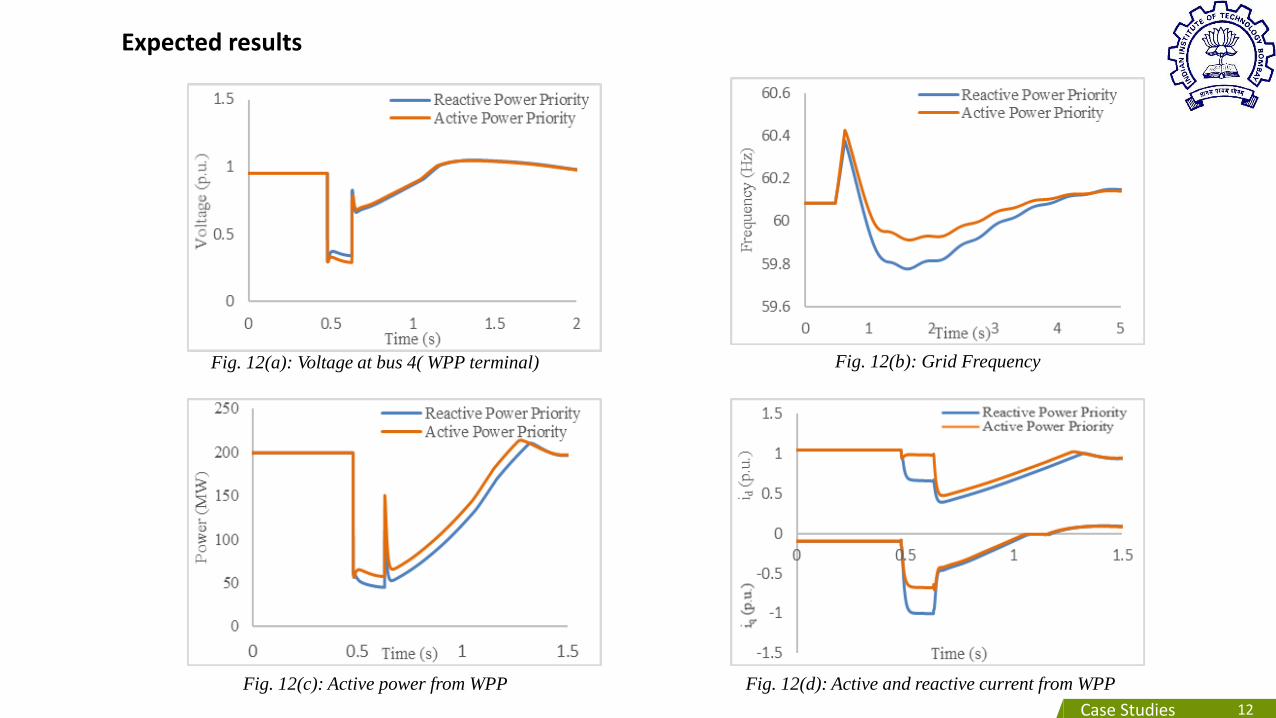
Fig. 12(a): Voltage at bus 4( WPP terminal) Fig. 12(b): Grid Frequency
Fig. 12(c): Active power from WPP Fig. 12(d): Active and reactive current from WPP
Expected results
12Case Studies
13Case Studies
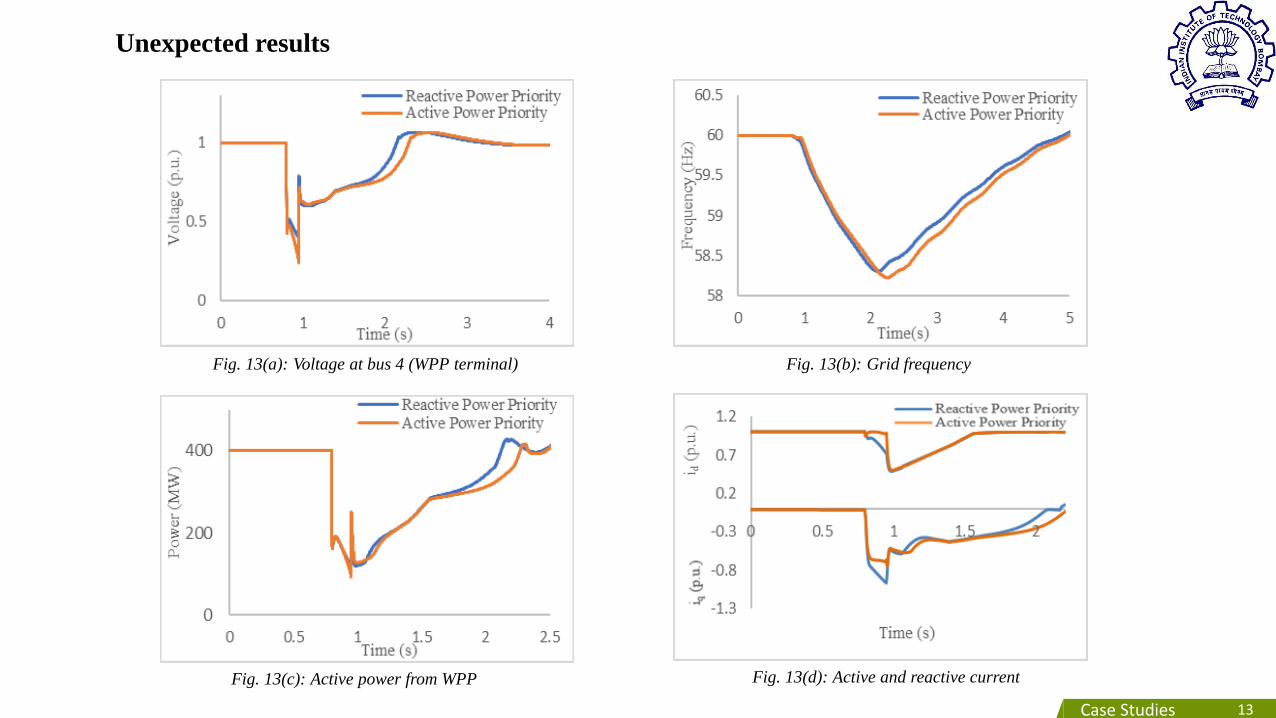
Fig. 13(a): Voltage at bus 4 (WPP terminal)
Fig. 13(c): Active power from WPP
Unexpected results
Fig. 13(b): Grid frequency
Fig. 13(d): Active and reactive current
12
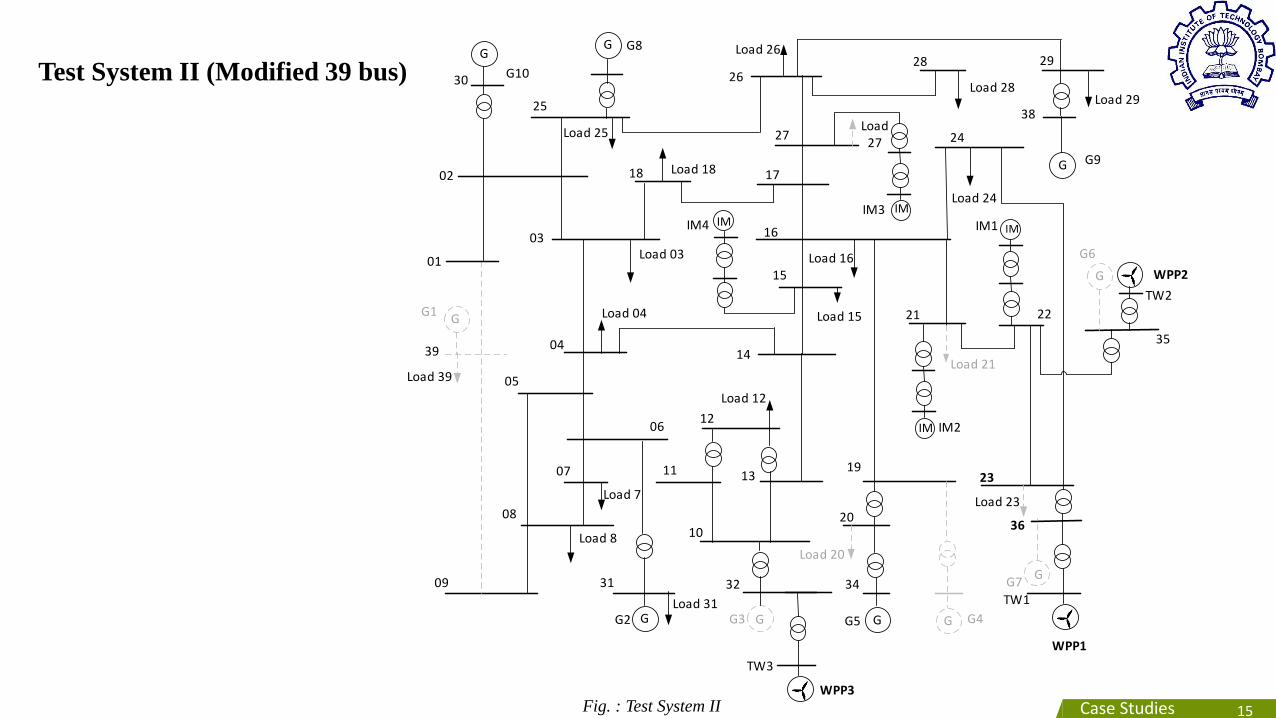
Test System II (Modified 39 bus)
15Case Studies Fig. : Test System II
G G
G
G
G
G G
G
G1
G2 G3
WPP3
WPP1
WPP2
G5 G4
G10
G8
G9
36
23
IM
IM
IMIM
Load 15
Load 16
Load 27
Load 12
Load 28Load 29
Load 25
Load 18
Load 03
Load 7
Load 31
Load 8Load 20
Load 21
Load 23
Load 04
IM1
IM2
IM4IM3
Load 24
Load 26
G
G6
GG7
Load 39
02
25
30
03
39
01
09
08
05
06
07 11
31
10
32
12
13
14
15
16
1718
26
27
28 29
38
24
34
20
19
21 22
3504
TW3
TW1
TW2
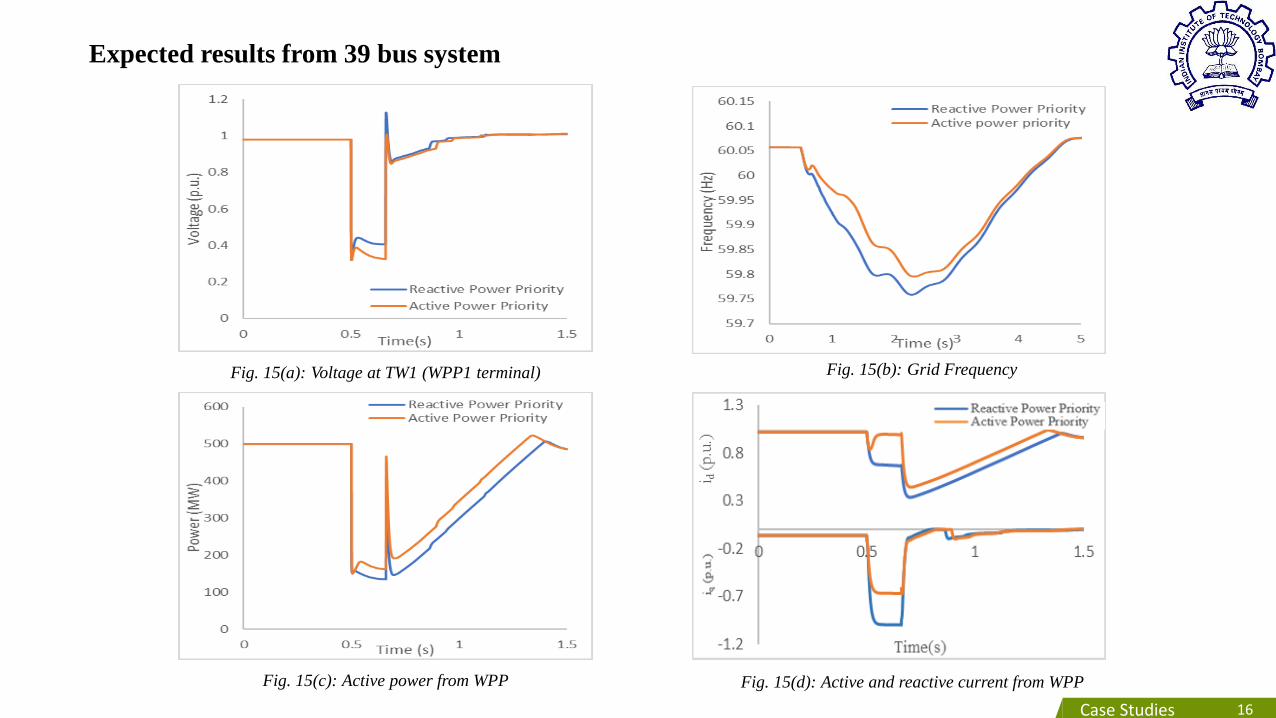
Fig. 15(a): Voltage at TW1 (WPP1 terminal) Fig. 15(b): Grid Frequency
Fig. 15(c): Active power from WPP Fig. 15(d): Active and reactive current from WPP
1216Case Studies
Expected results from 39 bus system
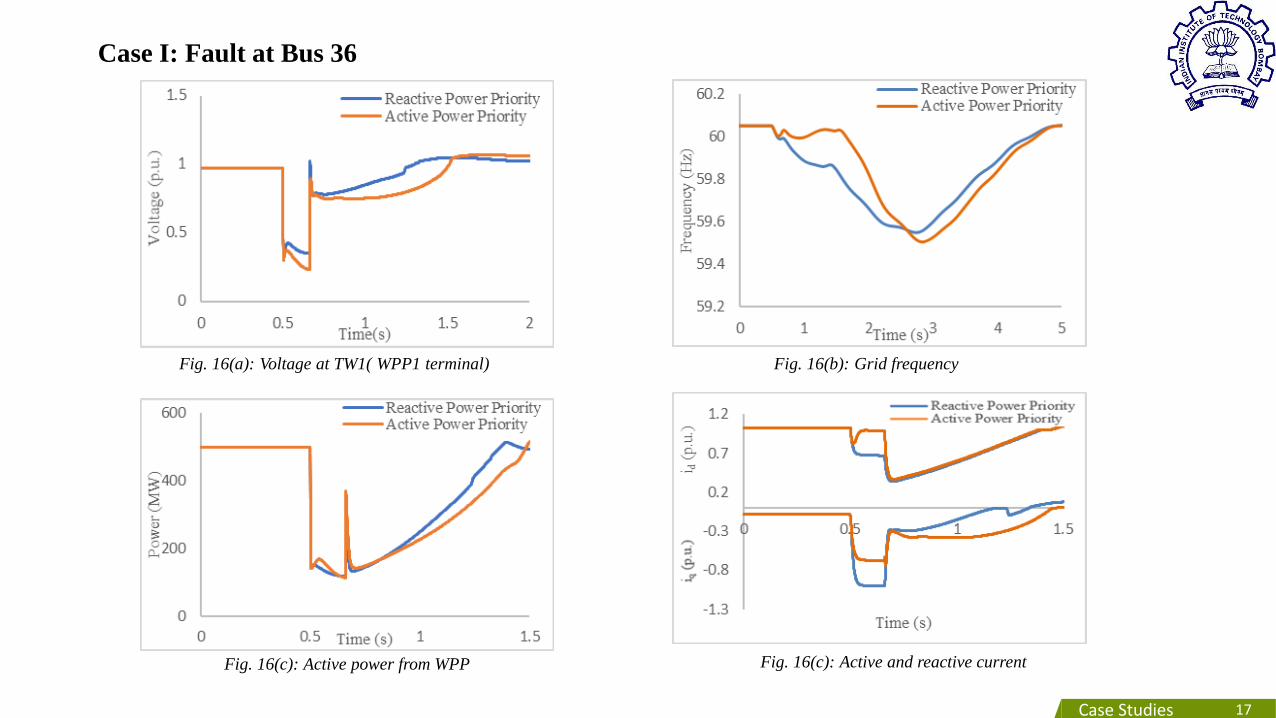
Case I: Fault at Bus 36
17Case Studies
Fig. 16(a): Voltage at TW1( WPP1 terminal) Fig. 16(b): Grid frequency
Fig. 16(c): Active power from WPP Fig. 16(c): Active and reactive current
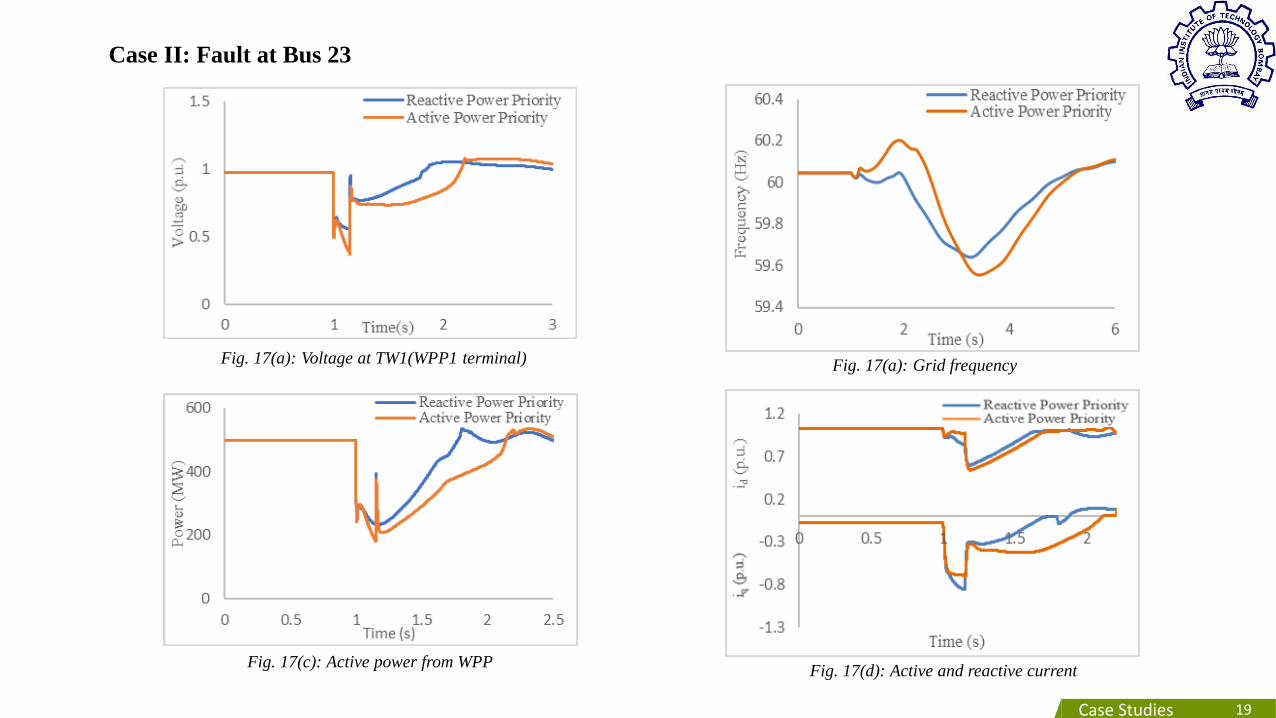
Case II: Fault at Bus 23
19Case Studies
Fig. 17(a): Voltage at TW1(WPP1 terminal)
Fig. 17(c): Active power from WPP
Fig. 17(a): Grid frequency
Fig. 17(d): Active and reactive current
Conclusion
The following conclusions can be drawn from the case studies:
• Active power priority based LVRT requirement may in some cases deteriorate frequency stability
instead of improving it during voltage dip. This reverse impact of LVRT regulation is nowhere reported
so far.
• Same behaviour above certain voltage limit
• Phenomenon of higher active power injection in reactive power priority is observed in systems with
delayed voltage recovery
• Delayed voltage recovery common in systems with lower short circuit capacities at WPP terminal.
Includes systems with: high penetration of wind, with WPPs located far away from synchronous
generators and with high proportion of motor load
• Dynamic reactive power compensation devices aid to the above mentioned phenomenon if installed
near WPP terminal.
19

THANK YOU

![Methodology for the determination of the influence of the ...regridintegrationindia.org/wp-content/uploads/sites/3/2017/09/11A... · current IEC 61400-21 standard [1] ... IEEE 519](https://static.fdocuments.net/doc/165x107/5af0a4cf7f8b9ac57a8edbb4/methodology-for-the-determination-of-the-influence-of-the-re-iec-61400-21-standard.jpg)


