
An Acuris Company 30 October 2017 North America Momentum ... Monitor 30... · 30 October 2017 North...
29
An Acuris Company Debtwire.com 30 October 2017 North America Momentum Monitor
Transcript of An Acuris Company 30 October 2017 North America Momentum ... Monitor 30... · 30 October 2017 North...

An Acuris Company
Debtwire.com Debtwire.com Debtwire.com
30 October 2017
North America Momentum Monitor

30 October 2017
Momentum Monitor
OVERVIEW
The Debtwire Momentum Monitor provides bond pricing information on actively traded bonds that fall
within our coverage universe. By tracking price and volume activity, the weekly report serves as a data tool for
subscribers to anticipate future shifts and identify areas of opportunity. This edition tracks activities for the
period from 23 October through 27 October.
The report classifies trading activity into six bond groups:
1) Top 20 Gainers/Decliners
2) Bonds with Unusual Volume and Large Price Changes
3) Bonds with Reversing Positive Trends
4) Bonds with Reversing Negative Trends
5) Top 20 Bonds with Unusual Volume
6) Distressed Universe Joiners/Quitters
In addition to the PDF file, a comprehensive list of instruments can be found in the Momentum Monitor Excel
spreadsheet. The Excel file also contains tabs that categorize Debtwire NA bond coverage into four universes
based on trading price ranges of <70, 70-80 (excluding 80), 80-90 and >90.
METHODOLOGY *Using data provided by Markit and Capital IQ, the Momentum Monitor includes prices based on the last trade of the most recent trading date, irrespective of the size
of the trade. The most recent trading date is defined as the date on which the most recently available data within the last 30 days was obtained from Markit, ordinarily on the Friday prior to the report-publishing date.
1-Week % Change: % change between the price recorded one day prior to the report publishing date and the price recorded 7 calendar days prior
4-Week % Change: % change between the price recorded one day prior to the report publishing date and the price recorded 28 calendar days prior
12-Week % Change: % change between the price recorded one day prior to the report publishing date and the price recorded 84 calendar days prior
52-Week % Change: % change between the price recorded one day prior to the report publishing date and the price recorded 365 calendar days prio r
Tim Hynes Head of North America Research +1 212 574 7878 [email protected]
Seth Crystall Senior Analyst +1 646 378 3105 [email protected]
Rong Ren Analyst +1 646 412 5318 [email protected]

30 October 2017
Momentum Monitor
WEEKLY COMMENTARY
US corporate earnings are continuing to provide support for higher equity prices, and the promise of a tax overhaul has remained a catalyst for driving stock prices higher. Last week, the US House of Representatives passed a budget, which will allow the Senate to eventually pass tax-reform legislation by a simple majority instead of 60 votes. On Friday, the US Department of Commerce reported that 3Q17 gross domestic product grew at an annual rate of 3%, following the 2Q17 growth rate of 3.1%. GDP increased at a 2.3% annual rate, after eliminating the volatile change in inventory.
The DJIA, the S&P 500 and the NASDAQ all moved higher, rising 0.5%, 0.2% and 1.1%, respectively. The 10-year US treasury yield rose to 2.41% from 2.38% during the prior week. President Trump announced that he is close to naming a new Federal Reserve chairperson, something that has kept bond market investors on edge because the new chair could be a hawk, resulting in an increase in interest rates. In addition, the continued uncertainty in Spain concerning Catalonia’s independence has weakened the euro versus the US dollar. Investors had also awaited a decision by the European Central Bank, which announced on Thursday its plans to extend the length of its quantitative easing, but reduced its monthly asset purchases.
Energy prices saw mixed results last week, with Nymex WTI and Brent crude oil rising 4.9% and 4.7%, respectively, while Nymex natural gas prices fell 5.6%. Oil prices got a boost after the Organization of the Petroleum Exporting Countries said production cuts exceeded agreed levels, and Saudi Arabia’s oil minister reiterated a pledge to bring the crude market into balance. Both Russia and Saudi Arabia hinted at extending production cuts through the end of 2018.
Tempering some of the gains, the US Energy Information Administration (EIA) reported that domestic crude oil inventories rose by 900,000 barrels for the week ended 20 October, a surprise to analysts who expected an inventory decline. US crude production increased 9.5 million barrels per day from 8.41 million barrels a day in the prior week. The EIA offset this bearish report, announcing that gasoline stockpiles fell by 5.5 million barrels, while distillate stockpiles decreased by 5.2 million barrels. Refineries operated at 87.8% of their operable capacity for the week.
The Baker Hughes US oil rig count increased by one to 737, but the natural gas rig count dropped by five to 172 rigs. By comparison, one year ago this week, there were 441 oil rigs and 114 natural gas rigs.
The EIA reported that domestic supplies of natural gas rose by 64 billion cubic feet for the week ended 20 October, which helped lead to the decline in the price of natural gas. Total inventory stands at 3.71 trillion cubic feet, a decrease of 189 billion cubic feet YoY, and 46 billion cubic feet below the five-year average.
For the metals market, the price of copper dropped 2%, ending the week at USD 3.1 per pound, while the price of gold slipped 0.5% to USD 1,274 per ounce. The price of gold declined as the US dollar strengthened, and interest rates moved higher.
In this week’s Momentum Monitor, mortgage banking company Walter Investment Management’s USD 243m 4.5% subordinated convertible notes due 2019 took the top spot on our list of the Top 20 Decliners, as the company announced entering into a restructuring support agreement (RSA) with holders of over 50% of its 7.875% unsecured notes due 2021, and an amended term loan RSA with holders of over 50% of its term loans. The convertible notes plummeted 41.7% on weekly trading volume of USD 11m. Last week, Debtwire published a Credit Report on the company, which outlined the terms of the RSA and initial estimated recovery values. These notes also hit our list of Bonds with Unusual Volume and Large Price Changes, as their weekly volume represented over 3.6 times the 52-week average trading volume.
Taking the No. 2 and No. 3 positions on our list of the Top 20 Decliners are oil and gas exploration and production firm Cobalt International Energy, as its USD 619m 2.625% convertible notes due 2019 and USD 787m 3.125% convertible notes due 2024 dropped 21.2% and 14.5%, respectively, on weekly trading volumes of USD 18.6m and USD 22.2m, respectively. Debtwire editorial reported that bondholders are staking out defensive positions due to liquidity concerns and a potential NYSE delisting. Debtwire’s legal team also published a report discussing the effects of the NYSE delisting notice. These issues hit our list of Bonds with Unusual Volume and Large Price Changes as well, as the weekly volume of the 3.125% converts and 2.625% converts represented almost 3.5 times and 2.2 times, respectively, their 52-week average trading volumes.
Also noteworthy on the list of Top 20 Decliners with multiple issues each are satellite services provider Intelsat, health services company Community Health Systems and satellite-television firm DISH Network.
Intelsat reported 3Q17 earnings, which were generally positive, as noted in a Debtwire Analyst Snapshot, although management expects full-year revenue to be at the lower end of guidance. The two Intelsat Luxembourg notes, the USD 1.4bn 7.75% due 2021 and USD 1bn 8.125% due 2023, dropped 11.7% and 11.5%, respectively, while the Intelsat Jackson USD 2bn 5.5% notes due 2023 fell 3.2%.
Community Health Systems’ USD 3bn 6.875% senior notes due 2022 and its USD 1.2bn 7.125% senior notes due 2020 dropped 3.7% and 3.1%, respectively, on weekly trading volumes of USD 53.6m and USD 15.2m, respectively. Debtwire editorial recently published a story detailing the company’s upcoming maturity wall.

30 October 2017
Momentum Monitor
WEEKLY COMMENTARY
Grabbing the top spot on our list of Top 20 Gainers are newspaper publisher The McClatchy Company’s USD 276m 6.875% notes due 2029, which surged 12.1% on weekly trading volume of USD 20.1m. Last week, the company announced that less than USD 1m of the total 9% senior secured noteholders tendered their bonds for cash, allowing the company to utilize as much as USD 40m for other purposes, including the repurchasing of other secured or unsecured notes in private transactions, reinvestment in the company’s digital transformation or other uses as determined by the board of directors. This issue also topped our list of Bonds with Unusual Volume and Large Price Changes , as its weekly volume represented over 3.7 times its 52-week average trading volume.
Taking the No. 2 spot on our list of Top 20 Gainers is mortgage banking company Walter Investment Management’s USD 539m 7.875% senior unsecured notes due 2021, which rose 8.2% on USD 20.5m of trading volume. As discussed earlier, holders of over 50% of these 7.875% notes entered into an RSA with Walter, potentially resulting in enhanced value to the bondholders.
Other noteworthy issuers on our list of Top 20 Gainers are industrial chemical manufacturer Hexion, which slipped into the third position on this list; electric utilities Talen Energy Supply and Dynegy, each of which placed two issues on the list; and data storage products firm Seagate Technology, which placed four issues on the list.
Last week, The Wall Street Journal reported that Vistra Energy was closing in on a deal to acquire Dynegy. Thus, it was no surprise that two issues of Dynegy made our list of Top 20 Gainers. Today, both companies announced that their respective boards approved a merger between the firms.
Seagate Technology reported higher-than-expected earnings last week, and management also guided higher revenue and earnings for the current quarter. The four bond issues that hit the Top 20 Gainers list rose between 2.2% and 2.6%.
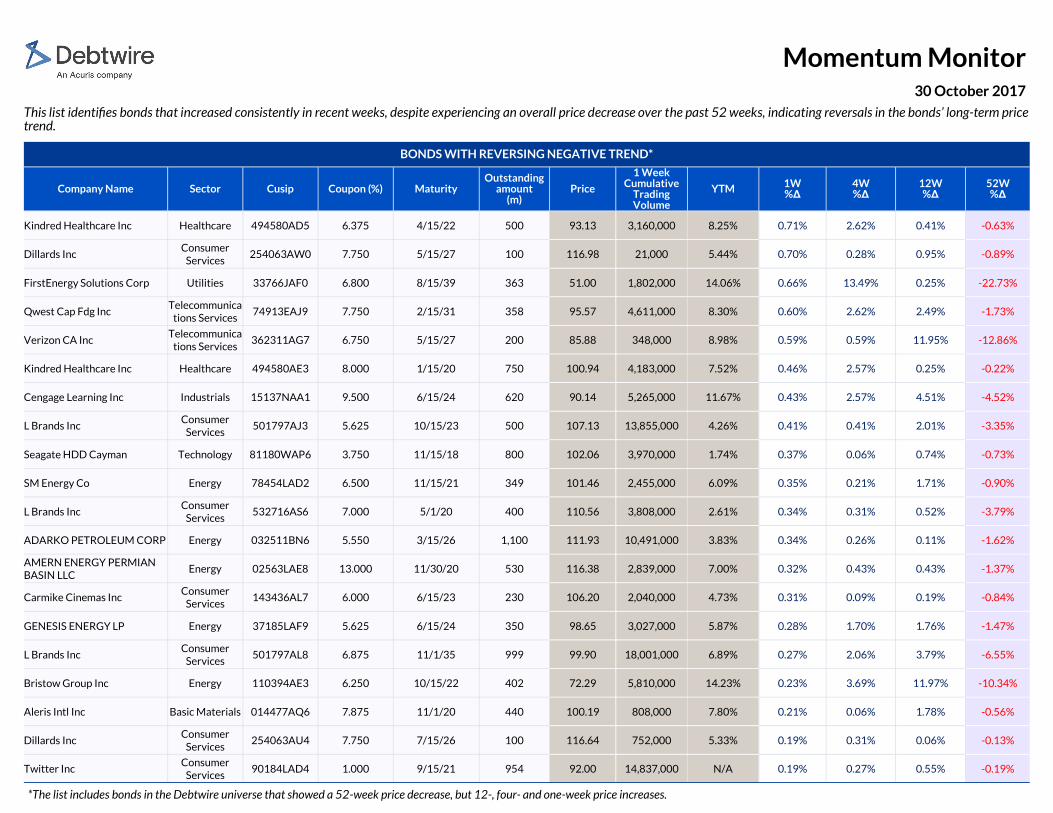
The number of issues on our Bonds with Reversing Negative Trends list this week is 64, a decrease of 24 from 88 during the prior week. Of the issuers on the list, four have three or more entries: retailers Dillard's and L Brands; oil and gas exploration and production company Denbury Resources; and midstream infrastructure and logistics firm Genesis Energy LP.
There are 270 issues on our list of Bonds with Reversing Positive Trends this week, an increase of 148 from 122 in the prior week. Of the issuers on the list,
there were seven with four or more entries: health services companies HCA and Tenet Healthcare; specialty financing firm Navient Corp; cable television operator CSC Holdings LLC; satellite services provider Intelsat; telecommunication services provider Sprint Communications; and oil services company Weatherford International.
For our list of the Top 20 Bonds with Unusual Volume , we highlight retailer Sears Holdings as the company’s USD 625m 8% unsecured notes due 2019 had trading volume of USD 37.9m, which represented over 10 times its 52-week average trading volume. While the notes rose 3.2% last week, they fell from the mid-80s earlier this month, when Sears announced that it had borrowed another USD 100m from ESL Investments. In addition, Bruce Berkowitz, a Sears director whose fund owns a large position in Sears, resigned from the company’s board of directors. Last week, Debtwire issued a Credit Report on Sears.
There are three issues on our list of Distressed Universe Joiners, which features issues in which the price has fallen below USD 80, technically moving them into the distressed universe. The list includes energy-related firms Comstock Resources, Weatherford International and Rowan Companies.
In this week’s list of Distressed Universe Quitters, there are two issues that moved to high-yield from distressed: newspaper publisher The McClatchy Company and food retailer New Albertsons.

30 October 2017
Momentum Monitor
TOP 20 DECLINERS*
Company Name Sector Cusip Coupon (%) Maturity Outstanding
Amount (m)
Price
1 Week Cumulative
Trading Volume
YTM 1W %Δ
(Sorted by)
4W %Δ
12W %Δ
52W %Δ
WALTER INVT MGMT CORP Financials 93317WAA0 4.500 11/1/19 243 10.50 11,000,000 N/A -41.67% -41.67% -42.47% -84.33%
COBALT INTL ENERGY INC Energy 19075FAA4 2.625 12/1/19 619 15.38 18,564,000 N/A -21.15% -36.60% -48.96% -66.80%
COBALT INTL ENERGY INC Energy 19075FAB2 3.125 5/15/24 787 13.25 22,239,000 N/A -14.52% -35.37% -46.73% -60.59%
Advanced Micro Devices Inc Technology 007903BD8 2.125 9/1/26 805 165.12 16,422,000 N/A -13.49% -6.35% -9.06% 45.90%
INTELSAT LUXEMBOURG SA Telecommunications Services
458204AP9 7.750 6/1/21 1,376 63.06 65,707,000 23.57% -11.65% -2.42% -2.32% 87.55%
INTELSAT LUXEMBOURG SA Telecommunications Services
458204AQ7 8.125 6/1/23 1,000 61.15 17,173,000 19.97% -11.53% -2.74% -1.96% 79.20%
iHeartCommunications Inc Consumer
Services 184502BQ4 14.000 2/1/21 1,680 10.14 22,031,530 161.13% -10.89% -28.58% -55.20% -73.65%
Weatherford Itl Ltd Energy 94707VAD2 5.950 4/15/42 368 77.48 20,642,000 8.07% -5.88% -6.02% -7.32% -0.50%
Nabors Inds Inc Energy 62957HAA3 0.750 1/15/24 575 73.89 27,400,000 5.82% -5.86% -9.41% -5.87% N/A
FRESH MARKET INC Consumer
Services 35804HAA4 9.750 5/1/23 800 56.54 25,974,000 24.57% -5.17% -7.71% -30.30% -34.15%
Liberty Media Corp Consumer
Services 530610AD6 1.750 9/30/46 750 109.94 18,185,000 N/A -4.74% -7.26% -10.21% 9.26%
Weatherford Itl Ltd Energy 94707VAC4 4.500 4/15/22 646 90.19 24,406,000 7.11% -3.87% -3.18% -2.62% -0.07%
CHS Cmnty Health Sys Inc Healthcare 12543DAV2 6.875 2/1/22 3,000 72.88 53,609,000 15.88% -3.68% -7.31% -10.99% -4.58%
Micron Tech Inc Technology 595112AY9 3.000 11/15/43 1,025 141.81 22,025,000 N/A -3.66% 3.27% 31.23% 60.01%
Weatherford Itl Ltd Energy 947075AJ6 7.750 6/15/21 750 102.13 21,678,000 7.07% -3.43% -2.21% -1.39% -1.58%
THC ESCROW CORP III Healthcare 87248NAE8 7.000 8/1/25 500 91.42 26,605,000 8.53% -3.32% -2.84% -6.27% N/A
DISH DBS Corp Consumer
Services 25470XAJ4 5.875 7/15/22 1,998 100.06 41,805,000 5.86% -3.20% -6.01% -7.78% -3.74%
Intelsat Jackson Hldgs SA Telecommunications Services
45824TAP0 5.500 8/1/23 2,000 85.25 25,459,000 8.82% -3.19% 0.15% -0.99% 25.60%
CHS Cmnty Health Sys Inc Healthcare 12543DAQ3 7.125 7/15/20 1,200 86.31 15,204,000 13.30% -3.11% -4.50% -7.81% 4.62%
DISH DBS Corp Consumer
Services 25470XAL9 5.000 3/15/23 1,500 96.38 34,152,000 5.79% -3.09% -6.20% -7.11% -3.27%
*Top 20 movers only include bonds with one-week cumulative trading volumes higher than USD 10m and a price of more than 10 cents on the dollar.
The list identifies bond trading levels that declined the most during the past week.

30 October 2017
Momentum Monitor
TOP 20 GAINERS*
Company Name Sector Cusip Coupon (%) Maturity Outstanding
Amount (m)
Price
1 Week Cumulative
Trading Volume
YTM 1W %Δ
(Sorted by)
4W %Δ
12W %Δ
52W %Δ
McClatchy Co Consumer
Services 499040AL7 6.875 3/15/29 276 89.35 20,089,000 8.34% 12.13% 10.23% 17.53% 8.14%
WALTER INVT MGMT CORP Financials 93317WAC6 7.875 12/15/21 539 57.00 20,513,000 25.23% 8.23% 4.35% 7.42% -27.62%
HEXION INC Basic Materials 428303AM3 9.000 11/15/20 574 69.88 15,815,000 23.38% 5.09% 5.07% -3.30% -4.80%
Concordia Healthcare Corp Healthcare 20653PAA0 9.000 4/1/22 350 88.13 24,770,000 12.58% 4.83% 12.89% 17.55% -10.31%
WOK ACQUISITION CORP Consumer
Services 977584AA9 10.250 6/30/20 300 94.18 13,035,000 12.88% 4.79% -1.96% -6.87% -1.64%
MARIPOSA BORROWER INC Consumer
Services 570254AA0 8.000 10/15/21 960 60.29 39,050,000 24.12% 4.29% 15.05% 9.63% -27.63%
Talen Energy Supply LLC Utilities 87422VAA6 6.500 6/1/25 600 85.69 46,804,000 9.16% 3.86% 11.16% 17.82% 4.02%
Sears Hldgs Corp Consumer
Services 812350AF3 8.000 12/15/19 625 62.28 37,913,500 34.44% 3.15% -27.56% -25.64% -32.30%
Dycom Inds Inc Technology 267475AB7 0.750 9/15/21 485 117.53 10,609,000 N/A 3.14% 3.28% 3.23% 9.23%
ON Semiconductor Corp Technology 682189AK1 1.000 12/1/20 690 126.92 19,005,000 N/A 2.87% 6.24% 18.34% 26.76%
Talen Energy Supply LLC Utilities 87422VAB4 9.500 7/15/22 400 102.19 47,890,000 8.90% 2.70% 9.73% 15.18% N/A
Dynegy Fin II Inc Utilities 26817RAP3 7.625 11/1/24 1,250 107.69 47,443,000 6.25% 2.62% 3.80% 6.48% 11.07%
Seagate HDD Cayman Technology 81180WAR2 4.875 6/1/27 700 97.13 45,735,000 5.26% 2.57% 2.78% 4.72% 6.88%
CA RES CORP Energy 13057QAG2 8.000 12/15/22 2,250 65.26 49,981,000 18.86% 2.57% 0.21% 7.20% -6.60%
Dynegy Inc Utilities 26817RAS7 8.000 1/15/25 750 107.63 26,389,000 6.65% 2.50% 3.67% 6.56% 10.67%
Westmoreland Coal Co Energy 960878AB2 8.750 1/1/22 350 60.51 10,650,000 24.33% 2.35% -16.53% -30.71% -23.76%
Seagate HDD Cayman Technology 81180WAN1 5.750 12/1/34 490 96.69 32,262,000 6.06% 2.31% 3.69% 10.66% 12.10%
Seagate HDD Cayman Technology 81180WAL5 4.750 1/1/25 1,000 98.94 21,635,000 4.93% 2.26% 1.47% 5.11% 3.94%
Seagate HDD Cayman Technology 81180WAU5 4.250 3/1/22 750 102.06 13,526,000 3.73% 2.19% 2.38% 5.29% N/A
Navios Maritime Acquisition Corp
Industrials 63938MAD8 8.125 11/15/21 670 87.67 13,440,000 12.07% 2.09% 5.50% 1.50% 14.94%
*Top 20 movers only include bonds with one-week cumulative trading volumes higher than USD 10m and a price of more than 10 cents on the dollar.
The list identifies bond trading levels that Increased the most during the past week.

30 October 2017
Momentum Monitor
BONDS WITH UNUSUAL VOLUME AND LARGE PRICE CHANGES*
Company Name Sector Cusip Coupon (%) Maturity Outstanding
Amount (m)
Price
1 Week Cumulative
Trading Volume
YTM
1W %Δ
(Sorted by)
4W %Δ
12W %Δ
52W %Δ
1 wk vol/
52-wks ave. vol
McClatchy Co Consumer
Services 499040AL7 6.875 3/15/29 276 89.35 20,089,000 8.34% 12.13% 10.23% 17.53% 8.14% 374.78%
WALTER INVT MGMT CORP
Financials 93317WAA0 4.500 11/1/19 243 10.50 11,000,000 N/A -41.67% -41.67% -42.47% -84.33% 362.15%
COBALT INTL ENERGY INC Energy 19075FAB2 3.125 5/15/24 787 13.25 22,239,000 N/A -14.52% -35.37% -46.73% -60.59% 344.58%
iHeartCommunications Inc Consumer
Services 184502BQ4 14.000 2/1/21 1,680 10.14 22,031,530 161.13% -10.89% -28.58% -55.20% -73.65% 285.40%
INTELSAT LUXEMBOURG SA
Telecommunications
Services 458204AP9 7.750 6/1/21 1,376 63.06 65,707,000 23.57% -11.65% -2.42% -2.32% 87.55% 264.27%
COBALT INTL ENERGY INC Energy 19075FAA4 2.625 12/1/19 619 15.38 18,564,000 N/A -21.15% -36.60% -48.96% -66.80% 218.02%
The list identifies bonds in which trading activity over the past week indicates burgeoning momentum. Our criteria ropes in bonds that traded with volumes that were above their 52-week averages. Further, price movement for the week needs to be at least a +/-10% one-week difference.
*The bonds on the list have minimum +/-10% price changes, minimum 100% of one-week volume/52-week average volume, with a price over 10 cents on the dollar and minimum one-week cumulative trading
volume of 10 million.

30 October 2017
Momentum Monitor
*The list includes bonds in the Debtwire universe that showed a 52-week price decrease, but 12-, four- and one-week price increases.
This list identifies bonds that increased consistently in recent weeks, despite experiencing an overall price decrease over the past 52 weeks, indicating reversals in the bonds’ long-term price trend.
BONDS WITH REVERSING NEGATIVE TREND*
Company Name Sector Cusip Coupon (%) Maturity Outstanding
amount (m)
Price
1 Week Cumulative
Trading Volume
YTM 1W %Δ
4W %Δ
12W %Δ
52W %Δ
Noble Group Ltd Basic Materials 65504RAD6 6.750 1/29/20 1,209 42.25 1,700,000 54.11% 11.92% 0.70% 8.68% -49.48%
CA RES CORP Energy 13057QAD9 5.500 9/15/21 149 59.25 1,281,000 21.53% 9.62% 10.17% 12.97% -3.17%
WALTER INVT MGMT CORP Financials 93317WAC6 7.875 12/15/21 539 57.00 20,513,000 25.23% 8.23% 4.35% 7.42% -27.62%
Denbury Res Inc Energy 247916AC3 6.375 8/15/21 215 67.05 4,939,000 18.94% 5.43% 11.52% 13.73% -19.80%
Concordia Healthcare Corp Healthcare 20653PAA0 9.000 4/1/22 350 88.13 24,770,000 12.58% 4.83% 12.89% 17.55% -10.31%
NORTHERN OIL GAS INC Energy 665531AB5 8.000 6/1/20 500 67.00 5,368,000 26.40% 4.48% 7.63% 2.88% -13.69%
MARIPOSA BORROWER INC Consumer
Services 570254AA0 8.000 10/15/21 960 60.29 39,050,000 24.12% 4.29% 15.05% 9.63% -27.63%
MARIPOSA BORROWER INC Financials 570254AB8 8.750 10/15/21 600 54.99 1,000,000 28.40% 3.93% 15.78% 11.00% -30.51%
CA RES CORP Energy 13057QAG2 8.000 12/15/22 2,250 65.26 49,981,000 18.86% 2.57% 0.21% 7.20% -6.60%
Hillshire Brands Co Consumer
Goods 803111AS2 4.100 9/15/20 278 104.91 10,378,000 2.32% 1.91% 0.85% 0.83% -0.44%
HERTZ CORP Consumer
Services 428040BJ7 7.000 1/15/28 28 94.75 169,000 7.75% 1.88% 0.66% 6.61% -7.72%
Ford Mtr Co Consumer
Goods 345370BN9 7.125 11/15/25 209 122.44 2,062,000 3.85% 1.62% 2.32% 2.58% -1.37%
Denbury Res Inc Energy 247916AD1 5.500 5/1/22 773 60.46 18,351,000 18.94% 1.33% 4.93% 12.42% -24.42%
Denbury Res Inc Energy 24823UAH1 4.625 7/15/23 622 55.34 4,406,000 17.22% 1.28% 5.17% 8.85% -24.41%
GTE FL Inc Telecommunica
tions Services 362333AH9 6.860 2/1/28 300 86.50 10,587,000 8.89% 1.17% 2.49% 9.68% -6.50%
GT WESTN PETROLEUM LLC Energy 39143GAA8 9.000 9/30/21 300 102.94 1,025,000 8.11% 0.92% 1.37% 2.43% -0.66%
PDC Energy Inc Energy 69327RAD3 1.125 9/15/21 200 98.25 7,680,000 N/A 0.89% 0.77% 6.07% -6.27%
Mallinckrodt Intl Fin SA Healthcare 561233AB3 4.875 4/15/20 700 100.61 5,010,000 4.61% 0.79% 0.96% 0.88% -0.86%
Ford Mtr Co Consumer
Goods 345370BR0 7.400 11/1/46 398 134.12 1,980,000 5.13% 0.79% 1.17% 2.87% -2.99%
SM Energy Co Energy 78454LAN0 6.750 9/15/26 500 102.25 2,404,000 6.41% 0.72% 1.66% 3.78% -1.15%
30 October 2017
Momentum Monitor
*The list includes bonds in the Debtwire universe that showed a 52-week price decrease, but 12-, four- and one-week price increases.
This list identifies bonds that increased consistently in recent weeks, despite experiencing an overall price decrease over the past 52 weeks, indicating reversals in the bonds’ long-term price trend.
BONDS WITH REVERSING NEGATIVE TREND*
Company Name Sector Cusip Coupon (%) Maturity Outstanding
amount (m)
Price
1 Week Cumulative
Trading Volume
YTM 1W %Δ
4W %Δ
12W %Δ
52W %Δ
Kindred Healthcare Inc Healthcare 494580AD5 6.375 4/15/22 500 93.13 3,160,000 8.25% 0.71% 2.62% 0.41% -0.63%
Dillards Inc Consumer
Services 254063AW0 7.750 5/15/27 100 116.98 21,000 5.44% 0.70% 0.28% 0.95% -0.89%
FirstEnergy Solutions Corp Utilities 33766JAF0 6.800 8/15/39 363 51.00 1,802,000 14.06% 0.66% 13.49% 0.25% -22.73%
Qwest Cap Fdg Inc Telecommunica
tions Services 74913EAJ9 7.750 2/15/31 358 95.57 4,611,000 8.30% 0.60% 2.62% 2.49% -1.73%
Verizon CA Inc Telecommunica
tions Services 362311AG7 6.750 5/15/27 200 85.88 348,000 8.98% 0.59% 0.59% 11.95% -12.86%
Kindred Healthcare Inc Healthcare 494580AE3 8.000 1/15/20 750 100.94 4,183,000 7.52% 0.46% 2.57% 0.25% -0.22%
Cengage Learning Inc Industrials 15137NAA1 9.500 6/15/24 620 90.14 5,265,000 11.67% 0.43% 2.57% 4.51% -4.52%
L Brands Inc Consumer
Services 501797AJ3 5.625 10/15/23 500 107.13 13,855,000 4.26% 0.41% 0.41% 2.01% -3.35%
Seagate HDD Cayman Technology 81180WAP6 3.750 11/15/18 800 102.06 3,970,000 1.74% 0.37% 0.06% 0.74% -0.73%
SM Energy Co Energy 78454LAD2 6.500 11/15/21 349 101.46 2,455,000 6.09% 0.35% 0.21% 1.71% -0.90%
L Brands Inc Consumer
Services 532716AS6 7.000 5/1/20 400 110.56 3,808,000 2.61% 0.34% 0.31% 0.52% -3.79%
ADARKO PETROLEUM CORP Energy 032511BN6 5.550 3/15/26 1,100 111.93 10,491,000 3.83% 0.34% 0.26% 0.11% -1.62%
AMERN ENERGY PERMIAN BASIN LLC
Energy 02563LAE8 13.000 11/30/20 530 116.38 2,839,000 7.00% 0.32% 0.43% 0.43% -1.37%
Carmike Cinemas Inc Consumer
Services 143436AL7 6.000 6/15/23 230 106.20 2,040,000 4.73% 0.31% 0.09% 0.19% -0.84%
GENESIS ENERGY LP Energy 37185LAF9 5.625 6/15/24 350 98.65 3,027,000 5.87% 0.28% 1.70% 1.76% -1.47%
L Brands Inc Consumer
Services 501797AL8 6.875 11/1/35 999 99.90 18,001,000 6.89% 0.27% 2.06% 3.79% -6.55%
Bristow Group Inc Energy 110394AE3 6.250 10/15/22 402 72.29 5,810,000 14.23% 0.23% 3.69% 11.97% -10.34%
Aleris Intl Inc Basic Materials 014477AQ6 7.875 11/1/20 440 100.19 808,000 7.80% 0.21% 0.06% 1.78% -0.56%
Dillards Inc Consumer
Services 254063AU4 7.750 7/15/26 100 116.64 752,000 5.33% 0.19% 0.31% 0.06% -0.13%
Twitter Inc Consumer
Services 90184LAD4 1.000 9/15/21 954 92.00 14,837,000 N/A 0.19% 0.27% 0.55% -0.19%

30 October 2017
Momentum Monitor
*The list includes bonds in the Debtwire universe that showed a 52-week price decrease, but 12-, four- and one-week price increases.
This list identifies bonds that increased consistently in recent weeks, despite experiencing an overall price decrease over the past 52 weeks, indicating reversals in the bonds’ long-term price trend.
BONDS WITH REVERSING NEGATIVE TREND*
Company Name Sector Cusip Coupon (%) Maturity Outstanding
amount (m)
Price
1 Week Cumulative
Trading Volume
YTM 1W %Δ
4W %Δ
12W %Δ
52W %Δ
Sunoco Logistics Partners Operations LP
Energy 86765BAS8 5.950 12/1/25 400 113.76 1,665,000 3.94% 0.18% 0.08% 0.04% -1.85%
Vista Outdoor Inc Consumer
Goods 928377AB6 5.875 10/1/23 350 103.35 916,000 5.21% 0.17% 0.18% 0.59% -1.96%
Dillards Inc Consumer
Services 254067AN1 7.000 12/1/28 150 111.55 77,000 5.59% 0.14% 0.26% 0.49% -1.61%
Gulfport Energy Corp Energy 402635AE6 6.625 5/1/23 350 102.52 224,000 6.08% 0.14% 0.36% 1.25% -2.43%
GENESIS ENERGY LP Energy 37185LAG7 6.000 5/15/23 400 100.63 5,655,000 5.87% 0.12% 1.13% 1.47% -0.84%
McClatchy Co Consumer
Services 579489AG0 9.000 12/15/22 455 104.75 11,689,000 7.85% 0.12% 0.87% 0.71% -0.53%
Ball Corp Industrials 058498AU0 4.375 12/15/20 1,000 105.24 5,798,000 2.62% 0.12% 0.07% 0.20% -1.60%
Gen Mtrs Finl Co Inc Financials 37045XAL0 4.250 5/15/23 749 105.28 2,172,000 3.20% 0.11% 0.70% 0.91% -1.41%
GENESIS ENERGY LP Energy 37185LAH5 6.750 8/1/22 750 103.44 3,751,000 5.91% 0.10% 0.91% 1.50% -0.67%
Devon Engy Corp Energy 25179MAT0 2.250 12/15/18 95 99.94 422,000 2.31% 0.09% 0.38% 0.03% -1.29%
FirstEnergy Solutions Corp Utilities 33766JAD5 6.050 8/15/21 332 51.67 1,763,000 27.28% 0.08% 7.92% 2.82% -33.71%
CERIDIAN HCM HLDG INC Industrials 15677JAB4 11.000 3/15/21 475 106.16 970,000 8.84% 0.08% 0.01% 0.09% -0.32%
ZF North America Cap Inc Industrials 98877DAA3 4.000 4/29/20 1,000 103.38 6,000,000 2.59% 0.07% 0.02% 0.24% -2.06%
1011778 BC UNLIMITED LIABILITY CO
Consumer Services
68245XAB5 4.625 1/15/22 1,250 102.63 3,291,000 3.94% 0.06% 0.23% 0.31% -0.79%
William Carter Co Consumer
Services 96926JAA5 5.250 8/15/21 400 103.00 633,000 4.38% 0.06% 0.07% 0.18% -1.32%
QEP RES INC Energy 74733VAC4 5.250 5/1/23 650 98.56 5,114,000 5.56% 0.06% 1.31% 1.74% -0.91%
Nationstar Mtg LLC Financials 63860UAM2 6.500 8/1/18 475 100.38 5,038,000 5.96% 0.04% 0.05% 0.01% -1.01%
CLEARWATER PAPER CORP Basic Materials 18538RAH6 5.375 2/1/25 300 100.75 1,117,000 5.25% 0.03% 1.25% 1.70% -0.37%
FRONTIER NORTH INC Telecommunica
tions Services 362337AK3 6.730 2/15/28 200 85.22 7,153,000 8.96% 0.02% 4.04% 10.43% -7.62%
L Brands Inc Consumer
Services 501797AM6 6.750 7/1/36 700 98.27 13,738,000 6.92% 0.02% 1.34% 3.20% -7.14%

30 October 2017
Momentum Monitor
*The list includes bonds in the Debtwire universe that showed a 52-week price decrease, but 12-, four- and one-week price increases.
This list identifies bonds that increased consistently in recent weeks, despite experiencing an overall price decrease over the past 52 weeks, indicating reversals in the bonds’ long-term price trend.
BONDS WITH REVERSING NEGATIVE TREND*
Company Name Sector Cusip Coupon (%) Maturity Outstanding
amount (m)
Price
1 Week Cumulative
Trading Volume
YTM 1W %Δ
4W %Δ
12W %Δ
52W %Δ
Natl Cinemedia LLC Consumer
Services 63530QAE9 6.000 4/15/22 400 102.45 6,640,000 5.37% 0.01% 0.06% 0.09% -1.78%
Calpine Corp Utilities 131347CC8 5.875 1/15/24 490 103.55 3,500,000 5.20% 0.01% 0.02% 0.16% -2.11%
Gen Mtrs Finl Co Inc Financials 37045XBF2 4.200 3/1/21 1,500 105.07 13,687,000 2.56% 0.00% 0.05% 0.15% -0.02%
Kinder Morgan Engy Partners L P
Energy 494550BJ4 4.150 3/1/22 375 105.09 19,996,000 2.89% 0.00% 0.19% 0.04% -0.43%

30 October 2017
Momentum Monitor
*The list includes bonds in the Debtwire universe that showed a 52-week price increase, but 12-, four- and one-week price decreases.
This list identifies bonds that decreased consistently in recent weeks, despite experiencing an overall price increase over the past 52 weeks, indicating reversals in the bonds’ long-term price trend.
BONDS WITH REVERSING POSITIVE TREND*
Company Name Sector Cusip Coupon (%) Maturity Outstanding
amount (m)
Price
1 Week Cumulative
Trading Volume
YTM 1W %Δ
4W %Δ
12W %Δ
52W %Δ
Advanced Micro Devices Inc Technology 007903BD8 2.125 9/1/26 805 165.12 16,422,000. N/A -13.49% -6.35% -9.06% 45.90%
Orexigen Therapeutics Inc Healthcare 686164AB0 2.750 12/1/20 30 37.13 4,700,000. N/A -11.87% -19.29% -21.01% 84.47%
INTELSAT LUXEMBOURG SA Telecommunica
tions Services 458204AP9 7.750 6/1/21 1,376 63.06 65,707,000. 23.57% -11.65% -2.42% -2.32% 87.55%
INTELSAT LUXEMBOURG SA Telecommunica
tions Services 458204AQ7 8.125 6/1/23 1,000 61.15 17,173,000. 19.97% -11.53% -2.74% -1.96% 79.20%
Weatherford Itl Ltd Energy 947075AE7 7.000 3/15/38 461 85.72 7,157,000. 8.48% -4.92% -4.14% -4.26% 2.20%
Weatherford Itl Ltd Energy 94707VAB6 6.750 9/15/40 463 83.85 5,360,000. 8.34% -4.83% -5.12% -6.04% 7.38%
Liberty Media Corp Consumer
Services 530610AD6 1.750 9/30/46 750 109.94 18,185,000. N/A -4.74% -7.26% -10.21% 9.26%
Weatherford Itl Ltd Energy 947075AB3 6.500 8/1/36 453 82.81 7,583,000. 8.32% -4.44% -3.71% -5.79% 3.64%
Weatherford Intl LLC Energy 947074AK6 6.800 6/15/37 255 84.24 3,646,000. 8.46% -4.31% -3.85% -5.61% 1.50%
THERAVANCE INC Healthcare 88338TAB0 2.125 1/15/23 288 92.15 6,525,000. N/A -4.14% -5.16% -0.73% 13.22%
Weatherford Itl Ltd Energy 947075AG2 9.875 3/1/39 250 104.46 1,078,000. 9.39% -4.03% -3.73% -5.18% 3.52%
Clovis Oncology Inc Healthcare 189464AB6 2.500 9/15/21 288 143.02 7,763,000. N/A -3.93% -5.83% -3.93% 64.51%
HCA Inc. Healthcare 197679AB9 7.500 12/15/23 150 113.50 126,000. 4.92% -3.20% -3.20% -3.61% 2.02%
CHS Cmnty Health Sys Inc Healthcare 12543DAQ3 7.125 7/15/20 1,200 86.31 15,204,000. 13.30% -3.11% -4.50% -7.81% 4.62%
VRX Escrow Corp Healthcare 91831AAC5 6.125 4/15/25 3,250 83.38 23,803,000. 9.26% -3.05% -5.05% -0.67% 5.14%
Iconix Brand Group Inc Financials 451055AF4 1.500 3/15/18 348 96.75 9,149,000. N/A -2.76% -2.58% -2.03% 14.67%
Tenet Healthcare Corp Healthcare 88033GCN8 6.750 6/15/23 1,898 93.25 64,957,000. 8.27% -2.30% -2.93% -4.97% 1.02%
CHS Cmnty Health Sys Inc Healthcare 12543DAL4 8.000 11/15/19 1,925 95.13 21,397,000. 10.72% -2.18% -2.56% -3.62% 6.68%
VALEANT PHARMACEUTICALS Intl INC
Healthcare 91911KAE2 5.500 3/1/23 1,000 84.24 8,638,000. 9.31% -2.14% -4.21% -0.16% 6.01%
VRX Escrow Corp Healthcare 91831AAB7 5.875 5/15/23 3,250 84.63 30,791,000. 9.51% -2.10% -4.18% -0.34% 7.12%

30 October 2017
Momentum Monitor
*The list includes bonds in the Debtwire universe that showed a 52-week price increase, but 12-, four- and one-week price decreases.
This list identifies bonds that decreased consistently in recent weeks, despite experiencing an overall price increase over the past 52 weeks, indicating reversals in the bonds’ long-term price trend.
BONDS WITH REVERSING POSITIVE TREND*
Company Name Sector Cusip Coupon (%) Maturity Outstanding
amount (m)
Price
1 Week Cumulative
Trading Volume
YTM 1W %Δ
4W %Δ
12W %Δ
52W %Δ
Cortes NP Acquisition Corp Industrials 220517AA4 9.250 10/15/24 750 110.13 14,650,000. 7.36% -2.08% -2.49% -0.68% 5.01%
Intelsat Jackson Hldgs SA Telecommunica
tions Services 45824TAG0 7.500 4/1/21 1,150 94.85 17,066,000. 9.29% -2.03% -0.42% -0.55% 27.10%
Intelsat Jackson Hldgs SA Telecommunica
tions Services 45824TAC9 7.250 10/15/20 2,200 96.28 19,797,000. 8.70% -1.82% -0.37% -0.16% 27.52%
CS GROUP ENTERPRISES LLC Consumer
Services 12467AAD0 5.375 7/15/22 400 97.86 9,691,000. 5.90% -1.81% -1.51% -0.62% 0.05%
Acadia Healthcare Co Inc Healthcare 00404AAJ8 5.625 2/15/23 650 102.88 9,379,000. 5.00% -1.73% -2.10% -1.73% 2.81%
Starwood Ppty Tr Inc Financials 85571BAB1 4.000 1/15/19 341 110.63 2,825,000. N/A -1.67% -0.56% -1.34% 0.09%
Tenet Healthcare Corp Healthcare 88033GCE8 8.125 4/1/22 2,799 99.94 80,044,000. 8.14% -1.51% -1.72% -6.22% 1.59%
Tenet Healthcare Corp Healthcare 88033GAV2 6.875 11/15/31 430 85.29 604,000. 8.71% -1.46% -2.66% -6.18% 4.65%
Rent A Ctr Inc Consumer
Services 76009NAK6 4.750 5/1/21 250 89.41 13,831,000. 8.30% -1.43% -1.23% -3.47% 10.55%
PHH Corp Financials 693320AR4 7.375 9/1/19 98 107.25 2,250,000. 3.27% -1.38% -1.15% -2.17% 2.39%
CSC Hldgs LLC Consumer
Services 126307AQ0 5.500 4/15/27 1,310 103.09 8,325,000. 5.08% -1.35% -0.99% -3.13% 0.54%
Rent A Ctr Inc Consumer
Services 76009NAH3 6.625 11/15/20 293 92.53 6,502,000. 9.51% -1.26% -2.41% -3.12% 1.82%
HCA Inc. Healthcare 197677AG2 7.690 6/15/25 291 114.13 2,530,000. 5.40% -1.25% -1.39% -2.41% 1.59%
ServiceMaster Co LLC Consumer
Services 81760NAB5 7.250 3/1/38 88 102.50 375,000. 7.02% -1.20% -1.44% -0.49% 4.20%
Acadia Healthcare Co Inc Healthcare 00404AAM1 6.500 3/1/24 390 105.81 15,441,000. 5.40% -1.17% -1.77% -2.03% 2.98%
CHENIERE ENERGY INC Energy 16411RAG4 4.250 3/15/45 625 68.63 9,420,000. N/A -1.17% -1.09% -1.20% 10.76%
Nuance Comms Inc Technology 67020YAG5 1.500 11/1/35 264 97.79 3,141,000. N/A -1.10% -1.48% -3.97% 3.75%
US Awys LLC Industrials 023650AH7 7.100 4/2/21 86 108.06 22,191. N/A -1.09% -0.97% -1.09% 0.12%
LifePoint Health Inc Healthcare 53219LAN9 5.875 12/1/23 500 103.44 6,724,000. 5.21% -1.08% -2.23% -2.59% 0.91%
j2 Glob Inc Technology 48123VAC6 3.250 6/15/29 403 123.25 5,027,000. N/A -1.05% -1.26% -4.46% 2.28%

30 October 2017
Momentum Monitor
*The list includes bonds in the Debtwire universe that showed a 52-week price increase, but 12-, four- and one-week price decreases.
This list identifies bonds that decreased consistently in recent weeks, despite experiencing an overall price increase over the past 52 weeks, indicating reversals in the bonds’ long-term price trend.
BONDS WITH REVERSING POSITIVE TREND*
Company Name Sector Cusip Coupon (%) Maturity Outstanding
amount (m)
Price
1 Week Cumulative
Trading Volume
YTM 1W %Δ
4W %Δ
12W %Δ
52W %Δ
Leidos Hldgs Inc Industrials 78390XAC5 5.950 12/1/40 219 100.38 3,262,000. 5.92% -0.96% -0.28% -0.49% 2.98%
HCA Inc. Healthcare 404119BT5 5.250 6/15/26 1,500 106.13 10,415,000. 4.39% -0.95% -1.57% -2.00% 1.19%
Intelsat Jackson Hldgs SA Telecommunica
tions Services 45824TAS4 9.500 9/30/22 490 117.73 11,100,000. 5.35% -0.95% -0.73% -2.43% 5.11%
Wendys Intl LLC Consumer
Services 950590AG4 7.000 12/15/25 100 105.25 80,000. 6.17% -0.94% -0.94% -0.94% 2.93%
Anixter Inc Consumer
Goods 035287AE1 5.125 10/1/21 400 106.75 4,650,000. 3.27% -0.93% -0.79% -0.37% 1.72%
AMC Networks Inc Consumer
Services 00164VAD5 5.000 4/1/24 1,000 102.22 18,472,000. 4.60% -0.88% -1.06% -1.41% 0.34%
Intelsat Jackson Hldgs SA Telecommunica
tions Services 45824TAR6 8.000 2/15/24 1,321 106.50 9,620,000. 6.71% -0.87% -1.04% -1.73% 4.99%
Open Text Corp Technology 683715AB2 5.875 6/1/26 850 108.44 7,479,000. 4.67% -0.83% -1.31% -0.46% 1.46%
HCA Inc. Healthcare 404119BN8 5.000 3/15/24 2,000 105.56 14,738,000. 4.00% -0.83% -1.14% -0.88% 0.66%
CSC Hldgs LLC Consumer
Services 126307AH0 5.250 6/1/24 750 100.25 7,556,000. 5.20% -0.76% -0.93% -4.01% 5.72%
Royal Caribbean Cruises Ltd Consumer
Services 780153AG7 7.500 10/15/27 300 130.29 2,307,000. 3.81% -0.76% -0.65% -1.86% 6.94%
Tenet Healthcare Corp Healthcare 88033GCA6 4.375 10/1/21 1,050 100.49 5,784,000. 4.24% -0.75% -0.94% -1.60% 0.55%
Gray Television Inc Consumer
Services 389375AK2 5.125 10/15/24 525 99.94 3,979,000. 5.14% -0.74% -0.97% -2.04% 1.78%
Sprint Comms Inc Telecommunica
tions Services 852061AR1 7.000 8/15/20 1,500 108.88 12,698,000. 3.62% -0.74% -0.47% -0.57% 4.06%
CHS Cmnty Health Sys Inc Healthcare 12543DAU4 5.125 8/1/21 1,000 97.54 10,192,000. 5.86% -0.72% -1.69% -2.64% 3.21%
Equinix Inc Technology 29444UAQ9 5.875 1/15/26 1,100 108.70 7,125,000. 4.59% -0.71% -1.07% -1.29% 1.67%
Gogo Inc Technology 38046CAB5 3.750 3/1/20 362 88.63 13,604,000. N/A -0.70% -3.41% -6.99% 13.78%
HCA Inc. Healthcare 404119BU2 4.500 2/15/27 1,200 101.17 18,123,000. 4.34% -0.69% -1.05% -1.11% 1.63%
Jabil Inc Industrials 466313AG8 4.700 9/15/22 500 106.34 2,024,000. 3.28% -0.67% -0.44% -0.39% 2.13%
HCA Inc. Healthcare 404119BR9 5.375 2/1/25 2,600 103.69 22,361,000. 4.77% -0.67% -1.81% -2.58% 1.04%

30 October 2017
Momentum Monitor
*The list includes bonds in the Debtwire universe that showed a 52-week price increase, but 12-, four- and one-week price decreases.
This list identifies bonds that decreased consistently in recent weeks, despite experiencing an overall price increase over the past 52 weeks, indicating reversals in the bonds’ long-term price trend.
BONDS WITH REVERSING POSITIVE TREND*
Company Name Sector Cusip Coupon (%) Maturity Outstanding
amount (m)
Price
1 Week Cumulative
Trading Volume
YTM 1W %Δ
4W %Δ
12W %Δ
52W %Δ
HCA Inc. Healthcare 404119BQ1 5.250 4/15/25 1,400 106.73 14,818,000. 4.19% -0.67% -1.40% -1.40% 1.26%
Masco Corp Consumer
Goods 574599AT3 7.750 8/1/29 235 131.69 835,000. 4.29% -0.67% -1.11% -1.98% 9.28%
D R Horton Inc Consumer
Goods 23331ABE8 4.375 9/15/22 350 106.21 130,000. 3.00% -0.66% -0.50% -0.86% 0.37%
HCA Inc. Healthcare 197677AJ6 7.050 12/1/27 150 112.42 50,000. 5.43% -0.66% -0.74% -0.78% 4.45%
EXPEDIA INC Consumer
Services 30212PAJ4 4.500 8/15/24 500 105.58 1,295,000. 3.57% -0.66% -0.66% -1.07% 1.25%
MGM Resorts Intl Consumer
Services 552953CD1 4.625 9/1/26 500 100.38 5,365,000. 4.57% -0.64% -1.19% -1.40% 3.57%
NEXSTAR ESCROW CORP Consumer
Services 65341XAA6 5.625 8/1/24 900 102.66 6,294,000. 5.15% -0.64% -1.23% -1.17% 2.73%
Gogo Inter Hldgs LLC Technology 38046XAC7 12.500 7/1/22 690 113.88 5,150,000. 8.80% -0.62% -0.49% -0.07% 6.49%
Cardtronics Inc Industrials 14161HAJ7 5.125 8/1/22 250 102.63 1,835,000. 4.50% -0.61% -0.57% -0.12% 0.12%
ClevelandCliffs Inc Basic Materials 18683KAC5 6.250 10/1/40 298 83.39 6,056,000. 7.82% -0.58% -0.34% -0.02% 17.65%
Chemours Co LLC Basic Materials 163851AB4 6.625 5/15/23 1,333 106.51 21,126,000. 5.25% -0.57% -0.13% -0.86% 8.70%
Gray Television Inc Consumer
Services 389375AJ5 5.875 7/15/26 700 102.79 8,856,000. 5.47% -0.57% -0.55% -1.41% 2.22%
Sprint Corp Telecommunica
tions Services 85207UAE5 7.250 9/15/21 2,250 110.38 11,831,000. 4.31% -0.56% -0.79% -0.14% 6.66%
Owens Brockway Glass Container Inc
Industrials 69073TAR4 5.875 8/15/23 700 110.50 3,963,000. 3.83% -0.56% -0.34% -0.53% 3.39%
WESTROCK MWV LLC Industrials 583334AB3 6.800 11/15/32 76 121.08 78,000. 4.81% -0.56% -0.56% -0.26% 4.31%
Hughes Satellite Syss Corp Consumer
Services 444454AA0 7.625 6/15/21 900 112.44 1,542,000. 3.91% -0.55% -1.04% -2.44% 3.02%
ServiceMaster Co LLC Consumer
Services 817609AB6 7.450 8/15/27 195 108.50 24,000. 6.27% -0.54% -0.80% -0.84% 1.64%
Sirius XM Radio Inc Consumer
Services 82967NAS7 6.000 7/15/24 1,500 107.11 7,104,000. 4.75% -0.54% -0.65% -0.65% 0.51%
Tenet Healthcare Corp Healthcare 88033GBU3 4.750 6/1/20 500 102.56 3,619,000. 3.70% -0.54% -0.79% -0.79% 0.09%
Felcor Lodging LP Consumer
Services 31430QBE6 5.625 3/1/23 524 103.54 3,186,000. 4.86% -0.53% -0.50% -0.66% 0.09%

30 October 2017
Momentum Monitor
*The list includes bonds in the Debtwire universe that showed a 52-week price increase, but 12-, four- and one-week price decreases.
This list identifies bonds that decreased consistently in recent weeks, despite experiencing an overall price increase over the past 52 weeks, indicating reversals in the bonds’ long-term price trend.
BONDS WITH REVERSING POSITIVE TREND*
Company Name Sector Cusip Coupon (%) Maturity Outstanding
amount (m)
Price
1 Week Cumulative
Trading Volume
YTM 1W %Δ
4W %Δ
12W %Δ
52W %Δ
HCA Inc. Healthcare 404121AG0 5.875 5/1/23 1,250 107.13 15,900,000. 4.40% -0.52% -1.55% -2.28% 0.73%
D R Horton Inc Consumer
Goods 23331ABG3 4.750 2/15/23 300 107.90 120,000. 3.12% -0.52% -0.69% -0.90% 1.17%
SABINE PASS LIQUEFACTION LLC
Energy 785592AH9 6.250 3/15/22 995 112.44 4,760,000. 3.18% -0.49% -0.09% -0.84% 2.19%
Ciena Corp Technology 171779AK7 4.000 12/15/20 188 130.63 60,000. N/A -0.48% -2.15% -8.73% 0.40%
D R Horton Inc Consumer
Goods 23331ABH1 5.750 8/15/23 400 113.23 300,000. 3.23% -0.46% -0.77% -1.04% 1.52%
CSC Hldgs LLC Consumer
Services 64072TAA3 10.875 10/15/25 1,684 123.01 12,485,000. 7.05% -0.46% -0.57% -1.25% 6.44%
ALTICE US FIN II CORP Consumer
Services 02155EAA6 7.750 7/15/25 620 109.88 300,000. 6.12% -0.43% -0.66% -2.01% 1.91%
Rice Energy Inc Energy 762760AD8 7.250 5/1/23 400 107.47 5,586,000. 5.65% -0.43% -0.55% -0.18% 0.22%
CSC Hldgs LLC Consumer
Services 126307AF4 6.750 11/15/21 1,000 110.62 9,793,000. 3.88% -0.43% -0.08% -0.90% 4.83%
SIMMONS FOODS INC Consumer
Goods 828732AB3 7.875 10/1/21 415 106.01 2,000,000. 6.12% -0.43% -0.11% -0.70% 4.80%
Cablevision Sys Corp Consumer
Services 12686CBB4 5.875 9/15/22 649 103.39 13,850,000. 5.08% -0.42% -0.35% -2.35% 11.47%
Sprint Comms Inc Telecommunica
tions Services 852061AQ3 7.000 3/1/20 1,000 109.23 3,466,000. 2.88% -0.42% -0.14% -0.04% 0.09%
ARC Pptys Oper Partnership LP
Financials 03879QAF1 4.600 2/6/24 500 105.02 2,847,000. 3.69% -0.42% -0.24% -0.24% 0.80%
CNO Finl Group Inc Financials 12621EAJ2 4.500 5/30/20 325 103.67 3,225,000. 3.01% -0.42% -0.59% -0.50% 0.43%
Royal Caribbean Cruises Ltd Consumer
Services 780153AU6 5.250 11/15/22 650 110.33 1,682,000. 3.02% -0.41% -0.82% -0.99% 0.98%
APX GROUP INC Industrials 00213MAK0 7.875 12/1/22 900 108.06 6,957,000. 6.01% -0.40% -0.62% -0.75% 2.09%
SOLARCITY CORP Energy 83416TAC4 1.625 11/1/19 566 94.38 8,583,000. N/A -0.40% -0.72% -0.20% 21.58%
HEALTHSOUTH Corp Healthcare 421924BN0 5.125 3/15/23 300 102.38 3,140,000. 4.62% -0.38% -1.18% -0.49% 0.12%
Hillshire Brands Co Consumer
Goods 803111AM5 6.125 11/1/32 152 112.14 499,000. 4.97% -0.37% -0.95% -1.65% 0.02%
Sprint Cap Corp Telecommunica
tions Services 852060AG7 6.900 5/1/19 1,729 105.88 4,715,000. 2.87% -0.36% -0.82% -0.95% 0.18%

30 October 2017
Momentum Monitor
*The list includes bonds in the Debtwire universe that showed a 52-week price increase, but 12-, four- and one-week price decreases.
This list identifies bonds that decreased consistently in recent weeks, despite experiencing an overall price increase over the past 52 weeks, indicating reversals in the bonds’ long-term price trend.
BONDS WITH REVERSING POSITIVE TREND*
Company Name Sector Cusip Coupon (%) Maturity Outstanding
amount (m)
Price
1 Week Cumulative
Trading Volume
YTM 1W %Δ
4W %Δ
12W %Δ
52W %Δ
LSC Comms Inc Industrials 50218PAA5 8.750 10/15/23 450 103.00 922,000. 8.10% -0.36% -0.12% -1.23% 3.78%
Targa Res Partners LP Energy 87612BAY8 6.750 3/15/24 580 107.62 5,129,000. 5.32% -0.36% -0.61% -1.21% 0.47%
Springleaf Fin Corp Financials 85172FAB5 6.000 6/1/20 300 104.00 1,000,000. 4.34% -0.36% -1.42% -1.65% 2.55%
CBS Radio Inc Consumer
Services 124847AC8 7.250 11/1/24 400 105.50 7,900,000. 6.27% -0.35% -1.29% -0.24% 1.08%
Crown Cork & Seal Co Inc Industrials 228255AH8 7.375 12/15/26 350 117.91 241,000. 4.91% -0.35% -0.02% -0.09% 5.16%
Aircastle Ltd Industrials 00928QAP6 5.000 4/1/23 500 106.33 3,683,000. 3.70% -0.34% -0.97% -0.27% 2.55%
Euramax Intl Inc Consumer
Goods 29843XAC1 12.000 8/15/20 385 108.88 25,000. 8.35% -0.34% -0.46% -0.46% 4.19%
MSCI Inc Technology 55354GAA8 5.250 11/15/24 800 106.44 2,180,000. 4.18% -0.34% -0.40% -0.60% 0.15%
MARTIN MIDSTREAM PARTNERS LP
Industrials 573334AD1 7.250 2/15/21 374 102.13 2,763,000. 6.52% -0.33% -0.10% -0.28% 6.24%
Safeway Inc Consumer
Services 786514BU2 4.750 12/1/21 130 97.68 2,248,000. 5.39% -0.33% -0.87% -0.29% 0.29%
Envision Healthcare Crp Healthcare 29414DAA8 5.125 7/1/22 750 102.18 1,213,000. 4.60% -0.33% -1.57% -1.59% 1.80%
BLUE CUBE SPINCO INC Basic Materials 095370AB8 9.750 10/15/23 719 120.30 5,654,000. 5.68% -0.32% -1.16% -1.46% 2.41%
Meritor Inc Consumer
Goods 59001KAB6 6.750 6/15/21 175 103.55 2,316,000. 5.65% -0.32% -0.31% -0.06% 1.22%
NCR Corp Technology 62886EAS7 6.375 12/15/23 700 106.46 6,407,000. 5.13% -0.32% -0.44% -0.81% 0.13%
Rose Rock Midstream LP Utilities 77714PAB5 5.625 7/15/22 400 98.48 2,794,000. 6.00% -0.32% -0.27% -1.34% 0.88%
Reynolds Group Issuer Basic Materials 761735AT6 5.125 7/15/23 1,600 103.87 10,660,000. 4.35% -0.31% -0.59% -0.94% 0.74%
MATCH GROUP INC Consumer
Services 57665RAF3 6.375 6/1/24 399 108.79 2,367,000. 4.80% -0.31% -0.06% -0.42% 0.27%
Westn Gas Partners LP Energy 958254AB0 4.000 7/1/22 670 102.90 675,000. 3.32% -0.31% -0.59% -0.45% 0.25%
Murphy Oil USA Inc Energy 626738AC2 6.000 8/15/23 500 105.31 2,663,000. 4.93% -0.31% -0.54% -0.74% 0.03%
NCR Corp Technology 62886EAJ7 5.000 7/15/22 600 102.44 7,133,000. 4.42% -0.30% -0.25% -0.54% 1.30%

30 October 2017
Momentum Monitor
*The list includes bonds in the Debtwire universe that showed a 52-week price increase, but 12-, four- and one-week price decreases.
This list identifies bonds that decreased consistently in recent weeks, despite experiencing an overall price increase over the past 52 weeks, indicating reversals in the bonds’ long-term price trend.
BONDS WITH REVERSING POSITIVE TREND*
Company Name Sector Cusip Coupon (%) Maturity Outstanding
amount (m)
Price
1 Week Cumulative
Trading Volume
YTM 1W %Δ
4W %Δ
12W %Δ
52W %Δ
Nielsen Fin LLC Consumer
Services 65409QBB7 5.000 4/15/22 2,300 103.25 15,598,000. 4.19% -0.30% -0.48% -0.42% 1.10%
HUB INTL LTD Financials 43414TAA4 7.875 10/1/21 1,230 104.13 2,255,000. 6.66% -0.30% -0.13% -0.52% 1.96%
1st Data Corp Industrials 32008DAB2 5.750 1/15/24 2,200 104.73 7,023,000. 4.86% -0.30% -0.19% -0.79% 2.55%
Allegheny Engy Supp Co LLC Utilities 017363AK8 5.750 10/15/19 156 105.81 2,000,000. 2.68% -0.29% -0.65% -0.81% 7.83%
Orbital ATK Inc Industrials 68557NAC7 5.500 10/1/23 400 106.82 4,438,000. 4.19% -0.29% -0.46% -2.92% 2.59%
Sprint Comms Inc Telecommunica
tions Services 852061AM2 11.500 11/15/21 1,000 126.83 190,000. 4.21% -0.29% -0.41% -0.33% 7.09%
Veritas US Inc Technology 92346LAA1 10.500 2/1/24 828 107.19 8,750,000. 8.97% -0.29% -0.29% -3.71% 14.56%
KerrMcGee Corp Energy 492386AK3 7.125 10/15/27 150 115.08 50,000. 5.17% -0.28% -0.01% -0.99% 2.69%
Choice Hotels Intl Inc Consumer
Services 169905AE6 5.750 7/1/22 400 111.19 1,127,000. 3.15% -0.28% -0.17% -0.36% 1.77%
Tenet Healthcare Corp Healthcare 88033GBY5 4.500 4/1/21 850 101.21 3,713,000. 4.12% -0.28% -0.81% -1.30% 0.71%
Sirius XM Radio Inc Consumer
Services 82967NAL2 4.625 5/15/23 500 102.95 4,250,000. 4.02% -0.28% -0.23% -0.06% 1.52%
CBRE Services Inc Financials 12505BAC4 5.250 3/15/25 425 110.01 2,810,000. 3.69% -0.27% -0.22% -0.54% 3.15%
Kinder Morgan Inc. Energy 28368EAA4 8.050 10/15/30 234 125.04 119,000. 5.35% -0.27% -0.27% -0.94% 6.04%
Nationstar Mtg LLC Financials 63860UAK6 6.500 7/1/21 600 101.95 4,255,000. 5.90% -0.27% -0.19% -0.71% 2.33%
PRISO ACQUISITION CORP Basic Materials 74273XAA0 9.000 5/15/23 275 105.88 2,500,000. 7.68% -0.26% -0.65% -0.59% 8.87%
Ferrellgas LP Utilities 315292AM4 6.500 5/1/21 500 94.88 7,792,000. 8.21% -0.26% -2.44% -1.38% 0.83%
MGM Resorts Intl Consumer
Services 552953CC3 6.000 3/15/23 1,250 109.81 18,284,000. 3.95% -0.26% -0.60% -1.03% 1.27%
Intl Game Tech PLC Consumer
Services 460599AB9 6.250 2/15/22 1,500 110.25 3,662,000. 3.65% -0.26% -0.33% -0.79% 3.52%
Rain CII Carbon LLC Basic Materials 75079QAA8 8.250 1/15/21 386 103.35 290,000. 7.06% -0.25% -0.45% -1.07% 5.73%
W R GRACE COCONN Basic Materials 383909AE8 5.125 10/1/21 700 107.86 2,266,000. 2.98% -0.25% -0.89% -0.71% 0.53%

30 October 2017
Momentum Monitor
*The list includes bonds in the Debtwire universe that showed a 52-week price increase, but 12-, four- and one-week price decreases.
This list identifies bonds that decreased consistently in recent weeks, despite experiencing an overall price increase over the past 52 weeks, indicating reversals in the bonds’ long-term price trend.
BONDS WITH REVERSING POSITIVE TREND*
Company Name Sector Cusip Coupon (%) Maturity Outstanding
amount (m)
Price
1 Week Cumulative
Trading Volume
YTM 1W %Δ
4W %Δ
12W %Δ
52W %Δ
IRON MTN US HLDGS INC Industrials 46289RAA3 5.375 6/1/26 250 104.87 1,929,000. 4.68% -0.25% -0.13% -1.88% 3.19%
STANDARD INDS INC Consumer
Goods 120111BM0 5.375 11/15/24 1,100 105.62 13,698,000. 4.44% -0.25% -0.71% -0.54% 1.58%
Unvl Health Svcs Inc Healthcare 913903AR1 4.750 8/1/22 700 103.33 1,250,000. 3.97% -0.24% -0.29% -0.35% 0.37%
Tenet Healthcare Corp Healthcare 88033GBW9 6.750 2/1/20 300 102.13 5,081,000. 5.72% -0.24% -1.00% -2.67% 4.61%
Zayo Group LLC Telecommunica
tions Services 989194AL9 6.375 5/15/25 900 107.86 7,523,000. 5.10% -0.24% -0.04% -0.65% 2.60%
HCA Inc. Healthcare 197677AH0 7.500 11/15/95 200 102.75 1,224,000. 7.30% -0.24% -0.60% -0.60% 0.74%
Sunoco Logistics Partners Operations LP
Energy 86765BAK5 6.100 2/15/42 300 107.25 171,000. 5.55% -0.24% -0.55% -0.39% 0.20%
Dynegy Inc Utilities 26817RAM0 6.750 11/1/19 850 103.38 2,164,000. 4.96% -0.24% -0.38% -0.47% 1.28%
Carpenter Tech Corp Basic Materials 144285AJ2 5.200 7/15/21 250 104.75 55,000. 3.81% -0.24% -1.18% -0.24% 2.34%
Ashtead Cap Inc Industrials 045054AC7 5.625 10/1/24 500 106.87 9,931,000. 4.46% -0.24% -0.67% -0.67% 1.48%
GEO GROUP IN Financials 36159RAK9 5.875 1/15/22 250 103.60 1,950,000. 4.91% -0.23% -0.38% -0.70% 9.28%
GLP Cap LP Financials 361841AH2 5.375 4/15/26 975 108.38 6,109,000. 4.19% -0.23% -0.86% -0.76% 1.17%
Springleaf Fin Corp Financials 85172FAD1 7.750 10/1/21 650 111.87 4,524,000. 4.41% -0.23% -1.07% -0.67% 6.61%
KRATON Polymers LLC Basic Materials 50077DAC8 10.500 4/15/23 440 114.05 3,120,000. 7.33% -0.23% -0.63% -1.73% 1.61%
CSC Hldgs LLC Consumer
Services 64072TAE5 10.125 1/15/23 1,800 114.50 19,565,000. 6.77% -0.22% -0.81% -1.66% 0.60%
QVC Inc. Consumer
Services 747262AM5 5.950 3/15/43 300 97.92 1,445,000. 6.11% -0.22% -0.04% -0.32% 4.46%
Cablevision Sys Corp Consumer
Services 12686CBA6 8.000 4/15/20 500 110.86 997,000. 3.36% -0.21% -0.19% -1.14% 4.64%
Lee Enterprises Inc Consumer
Services 523768AF6 9.500 3/15/22 400 103.94 5,750,000. 8.40% -0.21% -0.18% -0.06% 0.46%
MPT OPER PARTNERSHIP LP Financials 55342UAG9 5.250 8/1/26 500 104.43 4,990,000. 4.63% -0.21% -0.12% -0.28% 1.31%
Envision Healthcare Crp Healthcare 03232PAD0 5.625 7/15/22 1,099 102.25 10,561,000. 5.08% -0.21% -2.09% -2.01% 0.06%

30 October 2017
Momentum Monitor
*The list includes bonds in the Debtwire universe that showed a 52-week price increase, but 12-, four- and one-week price decreases.
This list identifies bonds that decreased consistently in recent weeks, despite experiencing an overall price increase over the past 52 weeks, indicating reversals in the bonds’ long-term price trend.
BONDS WITH REVERSING POSITIVE TREND*
Company Name Sector Cusip Coupon (%) Maturity Outstanding
amount (m)
Price
1 Week Cumulative
Trading Volume
YTM 1W %Δ
4W %Δ
12W %Δ
52W %Δ
Masco Corp Consumer
Goods 574599BL9 4.375 4/1/26 500 106.42 4,389,000. 3.49% -0.21% -0.07% -0.06% 1.13%
BLUE CUBE SPINCO INC Basic Materials 095370AD4 10.000 10/15/25 500 121.81 6,993,000. 6.45% -0.20% -0.81% -1.74% 1.30%
Interpublic Gp Cos Inc Consumer
Services 460690BH2 4.000 3/15/22 250 104.77 10,600,000. 2.83% -0.20% -0.41% -0.49% 1.53%
Pactiv LLC Industrials 880394AE1 8.375 4/15/27 200 114.46 136,000. 6.32% -0.20% -0.36% -1.01% 2.24%
CHESTER DOWNS & MARINA LLC
Consumer Services
165749AA0 9.250 2/1/20 330 102.00 6,188,000. 8.25% -0.20% -0.17% -0.99% 2.99%
Zayo Group LLC Telecommunica
tions Services 989194AM7 6.000 4/1/23 1,430 105.50 9,061,000. 4.83% -0.20% -0.38% -0.28% 0.24%
1st Data Corp Industrials 32008DAA4 5.000 1/15/24 1,000 104.02 10,713,000. 4.26% -0.20% -0.04% -0.28% 2.68%
SBA Comms Corp Technology 78388JAT3 4.875 7/15/22 750 103.38 2,926,000. 4.08% -0.19% -0.06% -0.40% 0.70%
BMC Software Inc Technology 055921AA8 7.250 6/1/18 200 102.38 1,232,000. 3.10% -0.19% -0.12% -0.92% 1.61%
KB HOME Consumer
Goods 48666KAU3 4.750 5/15/19 400 102.83 3,770,000. 2.86% -0.19% -0.43% -0.20% 0.12%
AMERN BLDRS CONTRACTORS SUPPLY CO INC
Industrials 024747AD9 5.750 12/15/23 350 106.51 3,466,000. 4.52% -0.19% -0.10% -0.19% 1.32%
DCP Midstream LLC Energy 26439XAC7 8.125 8/16/30 300 117.94 400,000. 6.08% -0.18% -0.09% -1.36% 3.50%
Teck Res Ltd Energy 878742AT2 4.500 1/15/21 225 104.77 201,000. 2.93% -0.18% -0.40% -0.31% 4.25%
Camelot Fin SA Consumer
Services 13323AAA8 7.875 10/15/24 500 107.52 5,455,000. 6.51% -0.18% -0.35% -1.25% 4.31%
Cogent Comms Fin Inc Technology 19240BAA3 5.625 4/15/21 189 102.88 750,000. 4.71% -0.18% -0.24% -0.20% 1.99%
Advanced Micro Devices Inc Technology 007903BC0 7.000 7/1/24 350 106.19 5,809,000. 5.86% -0.18% -0.09% -0.82% 7.36%
Equinix Inc Technology 29444UAP1 5.750 1/1/25 500 107.69 2,188,000. 4.48% -0.17% -0.32% -0.58% 1.02%
Svc Corp Intl Consumer
Services 817565BT0 7.500 4/1/27 200 120.29 1,156,000. 4.80% -0.17% -0.07% -0.17% 1.82%
DIAMOND 1 FIN CORP Technology 25272KAW3 7.125 6/15/24 1,625 110.44 21,693,000. 5.24% -0.17% -0.17% -0.85% 0.80%
NRG Yield Oper LLC Utilities 62943WAB5 5.375 8/15/24 500 104.59 3,157,000. 4.58% -0.17% -0.53% -0.44% 1.84%

30 October 2017
Momentum Monitor
*The list includes bonds in the Debtwire universe that showed a 52-week price increase, but 12-, four- and one-week price decreases.
This list identifies bonds that decreased consistently in recent weeks, despite experiencing an overall price increase over the past 52 weeks, indicating reversals in the bonds’ long-term price trend.
BONDS WITH REVERSING POSITIVE TREND*
Company Name Sector Cusip Coupon (%) Maturity Outstanding
amount (m)
Price
1 Week Cumulative
Trading Volume
YTM 1W %Δ
4W %Δ
12W %Δ
52W %Δ
CALUMET SPECIALTY PRODS PARTNERS LP
Energy 131477AR2 11.500 1/15/21 400 115.65 1,990,000. 6.05% -0.17% -0.47% -0.94% 1.91%
Genworth Fin Inc Financials 37247DAN6 7.200 2/15/21 400 95.84 2,531,000. 8.67% -0.17% -1.87% -0.11% 1.53%
FBM FIN INC Industrials 30190QAA7 8.250 8/15/21 575 107.07 285,000. 6.13% -0.17% -0.45% -0.32% 2.22%
Century Cmntys Inc Consumer
Goods 156504AB8 6.875 5/15/22 385 105.48 600,000. 5.49% -0.17% 0.00% -0.02% 3.26%
NOVA Chems Corp Basic Materials 66977WAN9 5.250 8/1/23 500 103.38 9,453,000. 4.57% -0.16% -0.14% -0.12% 0.51%
CIT Gp Inc Financials 125581GS1 3.875 2/19/19 1,000 101.96 4,274,000. 2.33% -0.15% -0.16% -0.49% 0.15%
Eagle Matls Inc Consumer
Goods 26969PAA6 4.500 8/1/26 350 104.36 857,000. 3.91% -0.15% -0.04% -0.35% 3.63%
The AES Corp Utilities 00130HBS3 7.375 7/1/21 690 113.94 3,824,000. 3.30% -0.15% -0.28% -0.40% 0.68%
Tribune Media Co Consumer
Services 896047AH0 5.875 7/15/22 1,100 104.04 11,428,000. 4.90% -0.14% -0.27% -0.95% 3.10%
Tyson Foods Inc Consumer
Goods 902494AZ6 4.875 8/15/34 500 110.57 1,000,000. 4.00% -0.14% -0.29% -0.01% 2.07%
CCO Hldgs LLC Consumer
Services 1248EPBG7 5.375 5/1/25 750 103.75 3,850,000. 4.77% -0.14% -0.01% -0.90% 0.42%
New Gold Inc Basic Materials 644535AF3 6.250 11/15/22 500 103.48 4,131,000. 5.45% -0.14% -0.44% -0.45% 1.23%
HEARTHSIDE GROUP HLDGS LLC
Consumer Goods
42237MAA6 6.500 5/1/22 300 102.59 4,000,000. 5.84% -0.14% -0.03% -0.17% 3.17%
Sealed Air Corp US Industrials 81211KAU4 5.250 4/1/23 425 107.79 2,005,000. 3.65% -0.14% -0.21% -0.06% 1.87%
Energy Transfer Equity LP Energy 29273VAC4 7.500 10/15/20 1,187 112.73 6,167,000. 2.97% -0.13% -0.13% -0.48% 2.27%
APX GROUP INC Industrials 00213MAD6 8.750 12/1/20 930 102.56 4,649,000. 7.79% -0.13% -0.61% -0.45% 5.24%
Antero Res Fin Corp Energy 03674PAL7 5.375 11/1/21 1,000 102.51 8,058,000. 4.68% -0.13% -0.11% -0.41% 0.73%
Enbridge Engy Partners LP Energy 29250RAK2 0.000 10/1/67 400 99.88 4,690,000. N/A -0.12% -0.12% -0.14% 12.69%
Boxer Parent Co Inc Technology 103186AA0 9.000 10/15/19 750 100.19 2,216,000. 8.89% -0.12% -0.06% -0.50% 7.97%
Energen Corp Energy 29265NAS7 4.625 9/1/21 400 101.31 4,313,000. 4.25% -0.12% -0.40% -0.20% 0.14%

30 October 2017
Momentum Monitor
*The list includes bonds in the Debtwire universe that showed a 52-week price increase, but 12-, four- and one-week price decreases.
This list identifies bonds that decreased consistently in recent weeks, despite experiencing an overall price increase over the past 52 weeks, indicating reversals in the bonds’ long-term price trend.
BONDS WITH REVERSING POSITIVE TREND*
Company Name Sector Cusip Coupon (%) Maturity Outstanding
amount (m)
Price
1 Week Cumulative
Trading Volume
YTM 1W %Δ
4W %Δ
12W %Δ
52W %Δ
1st Data Corp Industrials 319963BN3 5.375 8/15/23 1,210 104.36 12,034,000. 4.51% -0.12% -0.28% -0.44% 0.92%
NuStar Logistics LP Energy 67059TAB1 4.800 9/1/20 450 104.00 3,141,000. 3.31% -0.12% -0.12% -0.56% 2.40%
Belden Inc Industrials 077454AG1 5.250 7/15/24 200 104.25 3,940,000. 4.51% -0.12% -0.18% -0.24% 2.25%
LYNX II CORP Consumer
Services 55181XAA0 6.375 4/15/23 530 104.50 3,780,000. 5.41% -0.12% -0.30% -0.78% 1.83%
BMC East LlC Consumer
Services 055604AA0 5.500 10/1/24 350 104.81 1,185,000. 4.68% -0.12% -0.12% -0.57% 2.57%
Cr Accep Corp Financials 225310AK7 7.375 3/15/23 250 105.38 283,000. 6.18% -0.12% -0.32% -1.40% 1.44%
COMMSCOPE TECH FIN LLC Technology 20337YAA5 6.000 6/15/25 1,500 106.38 7,355,000. 4.98% -0.12% -0.82% -0.67% 0.54%
Alliance Data Sys Industrials 018581AJ7 5.875 11/1/21 500 103.86 4,115,000. 4.80% -0.12% -0.25% -0.21% 2.96%
Masco Corp Consumer
Goods 574599BJ4 4.450 4/1/25 500 106.99 2,567,000. 3.38% -0.11% -0.18% -0.76% 1.77%
Svc Corp Intl Consumer
Services 817565BU7 8.000 11/15/21 150 118.26 160,000. 3.15% -0.11% -0.18% -0.33% 0.17%
Platform Specialty Prods Corp Basic Materials 72766QAC9 10.375 5/1/21 500 108.76 3,747,000. 7.48% -0.11% -0.33% -1.60% 0.13%
Kinetic Concepts Inc Healthcare 49461BAH7 12.500 11/1/21 445 111.38 290,000. 9.05% -0.11% -0.22% -0.83% 13.69%
CEC ENTMT INC Consumer
Services 125137AB5 8.000 2/15/22 255 104.00 7,317,000. 6.90% -0.10% -0.46% -1.19% 2.97%
KLX Inc Industrials 482539AA1 5.875 12/1/22 1,200 104.83 7,259,000. 4.79% -0.10% -0.06% -0.40% 2.03%
BMC Software Fin Inc Technology 05578MAA0 8.125 7/15/21 1,625 102.89 5,825,000. 7.22% -0.10% -0.11% -0.73% 11.65%
CoreCivic Inc Industrials 22025YAM2 4.125 4/1/20 325 102.66 434,000. 2.98% -0.10% -0.12% -0.17% 9.44%
Energizer SpinCo Inc Consumer
Goods 29273AAA4 5.500 6/15/25 600 105.46 6,828,000. 4.64% -0.09% -0.47% -0.15% 3.75%
AMERN RLTY CAP PPTYS INC Financials 02917TAA2 3.000 8/1/18 598 100.47 7,315,000. N/A -0.09% -0.22% -0.08% 0.41%
Mercer Intl Inc Basic Materials 588056AR2 7.750 12/1/22 400 106.29 2,080,000. 6.28% -0.09% -0.20% -1.18% 0.15%
Amern Airls Group Inc Industrials 02376RAA0 5.500 10/1/19 750 104.48 1,902,000. 3.08% -0.09% -0.38% -0.73% 0.65%

30 October 2017
Momentum Monitor
*The list includes bonds in the Debtwire universe that showed a 52-week price increase, but 12-, four- and one-week price decreases.
This list identifies bonds that decreased consistently in recent weeks, despite experiencing an overall price increase over the past 52 weeks, indicating reversals in the bonds’ long-term price trend.
BONDS WITH REVERSING POSITIVE TREND*
Company Name Sector Cusip Coupon (%) Maturity Outstanding
amount (m)
Price
1 Week Cumulative
Trading Volume
YTM 1W %Δ
4W %Δ
12W %Δ
52W %Δ
Lundin Mng Corp Basic Materials 550372AB2 7.875 11/1/22 450 108.81 2,106,000. 5.82% -0.09% -0.24% -0.54% 0.46%
HCA Inc. Healthcare 404119AJ8 7.500 11/6/33 250 113.13 2,000,000. 6.20% -0.09% -0.66% -1.50% 4.26%
Mallinckrodt Intl Fin SA Healthcare 561234AD7 3.500 4/15/18 300 100.13 806,000. 3.22% -0.09% -0.08% -0.43% 0.26%
The AES Corp Utilities 00130HBT1 4.875 5/15/23 713 102.63 9,564,000. 4.34% -0.08% -0.48% -0.45% 2.03%
Westn Refng Logistics LP Energy 95931TAB6 7.500 2/15/23 300 107.45 2,145,000. 5.84% -0.08% -0.01% -0.76% 2.64%
HARLAND CLARKE HLDGS CORP
Industrials 412690AD1 6.875 3/1/20 275 103.24 1,470,000. 5.38% -0.07% -0.13% -0.12% 7.68%
Constellation Brands Inc Consumer
Goods 21036PAL2 4.250 5/1/23 1,050 106.86 14,399,000. 2.89% -0.07% -0.47% -0.61% 0.12%
Lennar Corp Consumer
Goods 526057BN3 4.750 11/15/22 575 105.63 5,527,000. 3.52% -0.07% -0.18% -0.73% 1.15%
Leidos Hldgs Inc Industrials 78390XAA9 4.450 12/1/20 450 105.25 2,423,000. 2.66% -0.07% -0.16% -0.06% 2.87%
DriveTime AutoGrpDT Accep Corp
Financials 26209NAK9 8.000 6/1/21 400 100.84 1,350,000. 7.72% -0.07% -0.18% 0.00% 5.12%
Amsted Inds Inc Industrials 032177AE7 5.000 3/15/22 600 103.56 3,143,000. 4.10% -0.07% -0.08% -0.18% 2.93%
Navient Corp Financials 63938CAE8 7.250 9/25/23 500 108.80 5,916,000. 5.48% -0.07% -0.18% -0.46% 9.76%
CROWN AMERICAS LLC Industrials 228189AB2 4.500 1/15/23 1,000 104.62 3,976,000. 3.52% -0.07% -0.70% -1.07% 1.08%
Kratos Defense Sec Solutions Inc
Industrials 50077BAL2 7.000 5/15/19 450 102.06 3,011,000. 5.58% -0.06% -0.43% -0.02% 10.79%
Platform Specialty Prods Corp Basic Materials 72766QAA3 6.500 2/1/22 1,100 103.75 16,026,000. 5.50% -0.06% -0.06% -0.51% 7.17%
PLUM CREEK TIMBERLANDS LP
Basic Materials 72925PAD7 3.250 3/15/23 325 101.54 48,000. 2.94% -0.06% -0.50% -0.29% 1.05%
Navistar Intl Corp Industrials 63934EAM0 8.250 11/1/21 1,450 100.38 14,810,000. 8.14% -0.06% -0.18% -0.92% 1.38%
Masonite Intl Corp Consumer
Goods 575385AA7 5.625 3/15/23 625 104.96 4,901,000. 4.57% -0.06% -0.12% -0.74% 1.05%
UTD RENTS NORTH AMERICA INC
Industrials 911365BB9 5.750 11/15/24 850 106.31 25,501,000. 4.69% -0.06% -0.18% -0.01% 1.61%
MidcontineIONS9986 Consumer
Services 59565XAB6 6.875 8/15/23 550 107.44 566,000. 5.36% -0.06% -0.50% -0.84% 0.60%

30 October 2017
Momentum Monitor
*The list includes bonds in the Debtwire universe that showed a 52-week price increase, but 12-, four- and one-week price decreases.
This list identifies bonds that decreased consistently in recent weeks, despite experiencing an overall price increase over the past 52 weeks, indicating reversals in the bonds’ long-term price trend.
BONDS WITH REVERSING POSITIVE TREND*
Company Name Sector Cusip Coupon (%) Maturity Outstanding
amount (m)
Price
1 Week Cumulative
Trading Volume
YTM 1W %Δ
4W %Δ
12W %Δ
52W %Δ
NISKA GAS STORAGE CANADA ULC
Energy 654677AB9 6.500 4/1/19 575 101.59 255,000. 5.31% -0.06% -0.15% -0.37% 1.98%
Scientific Games Intl Inc Consumer
Services 80874YAU4 10.000 12/1/22 2,198 110.38 5,387,000. 7.50% -0.06% -0.47% -1.18% 17.81%
AMC Networks Inc Consumer
Services 00164VAC7 4.750 12/15/22 600 102.75 7,836,000. 4.15% -0.06% -0.22% -0.36% 0.33%
Tembec Inds Inc Consumer
Goods 87971KAK3 9.000 12/15/19 375 102.64 4,630,000. 7.62% -0.05% -0.26% -0.81% 29.88%
Ally Finl Inc Financials 02005NAW0 3.750 11/18/19 800 102.19 11,820,000. 2.64% -0.05% -0.03% -0.26% 1.38%
Svc Corp Intl Consumer
Services 817565CB8 5.375 5/15/24 850 106.01 4,530,000. 4.31% -0.05% -0.40% -0.52% 0.01%
EnPro Inds Inc Industrials 29355XAD9 5.875 9/15/22 300 104.54 200,000. 4.82% -0.05% -0.02% -0.14% 0.40%
Transocean Inc Energy 893830AK5 7.375 4/15/18 82 102.85 593,000. 1.08% -0.04% -0.14% -0.34% 1.48%
BCD ACQUISITION INC Industrials 05583PAA6 9.625 9/15/23 670 109.58 2,070,000. 7.57% -0.04% -0.66% -0.49% 5.71%
Chesapeake Engy Corp Energy 165167CC9 7.250 12/15/18 64 105.36 310,000. 2.38% -0.04% -0.10% -0.58% 1.70%
COTT BEVERAGES INC Consumer
Goods 221643AH2 5.375 7/1/22 525 104.27 2,458,000. 4.35% -0.04% -0.15% -0.04% 1.41%
Emera Inc Utilities 290876AD3 6.750 6/15/76 1,200 114.44 621,000. 4.69% -0.04% -0.05% -0.81% 3.45%
Owens Brockway Glass Container Inc
Industrials 690872AB2 5.375 1/15/25 300 107.59 3,004,000. 4.15% -0.03% -0.13% -0.11% 3.40%
Navient Corp Financials 78442FET1 6.125 3/25/24 850 103.13 7,456,000. 5.54% -0.03% -0.04% -0.76% 13.17%
ARUBA INVTS INC Basic Materials 04318AAA4 8.750 2/15/23 225 102.35 2,268,000. 8.19% -0.03% -0.25% -0.70% 0.84%
CIT Gp Inc Financials 125581GQ5 5.000 8/15/22 1,150 107.88 6,723,000. 3.21% -0.03% -0.36% -0.46% 0.94%
Covanta Hldg Corp Industrials 22282EAE2 6.375 10/1/22 400 102.94 5,121,000. 5.68% -0.03% -0.01% -0.07% 0.30%
ESH Hospitality Inc Consumer
Services 26907YAA2 5.250 5/1/25 1,300 103.15 10,483,000. 4.75% -0.03% -0.44% -1.47% 3.80%
Utd Continental Hldgs Inc Industrials 910047AG4 6.000 12/1/20 300 108.55 6,421,000. 3.07% -0.02% -0.53% -0.36% 0.27%
Navient Corp Financials 78442FES3 4.875 6/17/19 1,000 102.96 2,325,000. 2.99% -0.02% -0.64% -0.52% 1.44%

30 October 2017
Momentum Monitor
*The list includes bonds in the Debtwire universe that showed a 52-week price increase, but 12-, four- and one-week price decreases.
This list identifies bonds that decreased consistently in recent weeks, despite experiencing an overall price increase over the past 52 weeks, indicating reversals in the bonds’ long-term price trend.
BONDS WITH REVERSING POSITIVE TREND*
Company Name Sector Cusip Coupon (%) Maturity Outstanding
amount (m)
Price
1 Week Cumulative
Trading Volume
YTM 1W %Δ
4W %Δ
12W %Δ
52W %Δ
Springleaf Fin Corp Financials 85172FAG4 5.250 12/15/19 700 103.44 3,020,000. 3.55% -0.02% -0.76% -1.08% 2.34%
TerraForm Glob Oper LLC Utilities 88104UAA1 9.750 8/15/22 810 111.05 325,000. 6.99% -0.01% -0.15% -0.36% 6.54%
Navient Corp Financials 78442FER5 5.500 1/15/19 1,250 103.32 3,013,000. 2.68% -0.01% -0.09% -0.56% 0.25%
AerCap Ireland Cap Ltd Industrials 00772BAQ4 4.625 10/30/20 1,000 106.28 3,760,000. 2.44% -0.01% -0.18% -0.41% 0.80%
KB HOME Consumer
Goods 48666KAQ2 8.000 3/15/20 350 111.94 405,000. 2.76% -0.01% -0.54% -0.47% 0.39%
Ally Finl Inc Financials 02005NBE9 3.250 11/5/18 750 100.92 2,274,000. 2.33% -0.01% -0.20% -0.41% 0.60%
Marathon Oil Corp Energy 565849AK2 2.800 11/1/22 1,000 97.80 1,922,000. 3.28% -0.01% -0.11% -0.22% 2.84%
Iasis Healthcare LLC Healthcare 45072PAD4 8.375 5/15/19 850 100.09 6,660,000. 8.31% 0.00% -0.22% -0.16% 3.96%
ADARKO PETROLEUM CORP Energy 032511AN7 7.200 3/15/29 136 117.50 20,000. 5.15% 0.00% -0.33% -0.89% 4.64%
SUMMIT MATERIALS, LLC Industrials 86614RAG2 6.125 7/15/23 650 103.98 6,944,000. 5.31% 0.00% -1.67% -0.83% 1.32%

30 October 2017
Momentum Monitor
TOP 20 BONDS WITH UNUSUAL VOLUME*
Company Name Sector Cusip Coupon (%) Maturity Outstanding
Amount (m)
Price
1 Week Cumulative
Trading Volume
YTM 1W %Δ
(Sorted by)
4W %Δ
12W %Δ
52W %Δ
1 wk vol/ 52-wks ave.
vol
Vishay Intertechnology Inc Technology 928298AL2 2.250 6/1/42 150 199.04 8,500,000 N/A 2.86% 15.30% 23.10% 54.59% 1,475.74%
Sears Hldgs Corp Consumer
Services 812350AF3 8.000 12/15/19 625 62.28 37,913,500 34.44% 3.15% -27.56% -25.64% -32.30% 1,032.04%
CompuCom Syss Inc Technology 20453NAA7 7.000 5/1/21 225 101.63 5,000,000 6.47% 0.37% 87.15% 98.29% 115.46% 981.47%
Allegheny Engy Supp Co LLC
Utilities 017363AK8 5.750 10/15/19 156 105.81 2,000,000 2.68% -0.29% -0.65% -0.81% 7.83% 894.09%
PRISO ACQUISITION CORP
Basic Materials
74273XAA0 9.000 5/15/23 275 105.88 2,500,000 7.68% -0.26% -0.65% -0.59% 8.87% 872.48%
ENERGY TRANSFER LP Energy 29273RBB4 7.600 2/1/24 277 117.80 5,871,000 4.32% 0.70% -0.26% -1.69% 1.05% 806.56%
Hillshire Brands Co Consumer
Goods 803111AS2 4.100 9/15/20 278 104.91 10,378,000 2.32% 1.91% 0.85% 0.83% -0.44% 720.09%
WOK ACQUISITION CORP Consumer
Services 977584AA9 10.250 6/30/20 300 94.18 13,035,000 12.88% 4.79% -1.96% -6.87% -1.64% 700.03%
Spirit AeroSystems Inc Industrials 85205TAF7 5.250 3/15/22 300 103.89 23,865,000 4.26% -0.21% -0.25% -0.28% -1.06% 651.63%
CEC ENTMT INC Consumer
Services 125137AB5 8.000 2/15/22 255 104.00 7,317,000 6.90% -0.10% -0.46% -1.19% 2.97% 651.52%
Kinder Morgan Engy Partners L P
Energy 494550BS4 4.150 2/1/24 650 104.12 34,813,000 3.41% -0.10% 0.25% 0.41% 1.07% 642.32%
Westmoreland Coal Co Energy 960878AB2 8.750 1/1/22 350 60.51 10,650,000 24.33% 2.35% -16.53% -30.71% -23.76% 621.58%
Kinder Morgan Engy Partners L P
Energy 494550BJ4 4.150 3/1/22 375 105.09 19,996,000 2.89% 0.00% 0.19% 0.04% -0.43% 612.81%
Huntington Ingalls Inds Inc Industrials 446413AH9 5.000 11/15/25 600 108.69 24,045,000 3.74% -0.06% 0.51% 0.77% 3.51% 599.59%
Interpublic Gp Cos Inc Consumer
Services 460690BH2 4.000 3/15/22 250 104.77 10,600,000 2.83% -0.20% -0.41% -0.49% 1.53% 586.10%
Barrick Intl Barbados Corp Basic
Materials 06849AAB5 6.350 10/15/36 600 127.50 3,260,000 4.23% 0.14% 1.14% 4.33% 13.59% 576.58%
Subn Propane Partners LP Utilities 864486AJ4 5.750 3/1/25 250 100.38 8,252,000 5.69% -0.62% 0.51% 1.19% -2.05% 548.75%
Royal Caribbean Cruises Ltd
Consumer Services
780153AJ1 7.250 3/15/18 150 102.04 9,380,000 1.72% -0.24% -0.48% -1.22% -5.10% 545.52%
Anadarko Hldg Co Energy 907834AG0 7.150 5/15/28 235 117.66 1,741,000 4.98% -0.40% 0.34% -0.69% 2.83% 540.13%
BOMBARDIER INC. Industrials 097751BH3 4.750 4/15/19 600 101.97 12,173,000 3.35% -0.45% 0.03% -0.95% 1.85% 537.43%
*Top 20 Bonds with Unusual Volume only includes bonds with outstanding amounts higher than 100 million, one-week cumulative trading volumes higher than one million and a price at over 10 cents on the dollar.
This list identifies bonds that traded at unexpectedly high volumes during the past week compared to previous periods, indicating unusual changes in the bonds’ trading activities.

30 October 2017
Momentum Monitor
DISTRESSED UNIVERSE JOINERS*
Company Name Sector Cusip Coupon (%) Maturity Outstanding
Amount (m)
Last Week Price
This Week Price
1 Week Cumulative
Trading Volume
YTM 1W %Δ
(Sorted by)
4W %Δ
12W %Δ
52W %Δ
Weatherford Itl Ltd Energy 94707VAD2 5.950 4/15/42 368 82.33 77.48 20,642,000 8.07% -5.88% -6.02% -7.32% -0.50%
Comstock Res Inc Energy 205768AH7 7.750 4/1/19 81 80.06 79.48 43,000 25.95% -0.73% -1.74% -2.97% -6.40%
Rowan Cos Inc Energy 779382AS9 5.850 1/15/44 400 80.69 79.25 325,000 7.70% -1.78% -1.30% 3.58% 11.24%
*Distressed Universe Joiners only includes bonds in which this week’s price is equal to or less than 80 cents on the dollar, and last week’s price is greater than 80 cents on the dollar.
The list identifies bonds that traded into the distressed universe during the last week.

30 October 2017
Momentum Monitor
DISTRESSED UNIVERSE QUITTERS*
Company Name Sector Cusip Coupon (%) Maturity Outstanding
Amount (m)
Last Week Price
This Week Price
1 Week Cumulative
Trading Volume
YTM 1W %Δ
(Sorted by)
4W %Δ
12W %Δ
52W %Δ
McClatchy Co Consumer Services 499040AL7 6.875 3/15/29 276 79.69 89.35 20,089,000 8.34% 12.13% 10.23% 17.53% 8.14%
New Albertsons Inc Consumer Services 01310QDB8 6.625 6/1/28 150 79.25 80.83 1,486,000 9.54% 2.00% 4.30% -5.73% -11.17%
*Distressed Universe Quitters only includes bonds in which this week’s price is equal to or greater than 80 cents on the dollar, and last week’s price is less than 80 cents on the dollar.
The list identifies bonds that traded out of the distressed universe during the last week.

An Acuris Company
Debtwire.com Debtwire.com
Debtwire is an Acuris company
Debtwire reports on corporate debt situations before credit ratings are changed. Offering unique insights, credit analysis, debt data, and analytics for distressed debt and leveraged finance markets.
Subscribers choose Debtwire for speed and depth of coverage they can’t get anywhere else. Our reporters talk to an impressive range of contacts every day to bring you valuable early insight into fast evolving situations.
To complement your newsfeed, Debtwire’s credit analysis and research teams provide deep technical details and angles that help you understand situations more clearly.
Follow corporate debt situations as they
unfold
Find mandate opportunities in stressed/
distressed/restructuring situations, ahead of the market
Get real-time news on market-moving
events sent to your mobile or email
Get the full story on restructurings and
the players involved
Understand how regulatory
developments are affecting asset-backed securities
Capture early stage primary
opportunities and stay on top of the leveraged market
EMEA
10 Queen Street Place
London
EC4R 1BE
United Kingdom
+44 203 741 1000
Asia
Suite 1602-6
Grand Millennium Plaza
181 Queen’s Road, Central
Hong Kong
+ 612 9002 3131
Americas
330 Hudson St.
4th Floor
New York,
NY 10013 USA
+1 212 500 7537
Disclaimer
We have obtained the information provided in this report in good faith from sources that we consider to be reliable, but we do not independently verify the information. The information is not intended to provide tax, legal or investment advice. We shall not be liable for any mistakes, errors, inaccuracies or omissions in, or incompleteness of, any information contained in this report. All such liability is excluded to the fullest extent permitted by law. Data has been derived from company reports, press releases, presentations and Debtwire intelligence.