AN ABSTRACT OF THE THESIS OF Chih-Hung Chang
92
Transcript of AN ABSTRACT OF THE THESIS OF Chih-Hung Chang


AN ABSTRACT OF THE THESIS OF
Michele David for the degree of Master of Science in Chemical Engineering presented on
December 6, 2016.
Title: Experimental Study of Nucleate Boiling Bubble Dynamics and Heat Transfer
Enhancement on Printed Bi-functional Surfaces.
Abstract approved: ______________________________________________________
Chih-Hung Chang
Boiling heat transfer is studied for its ability to dissipate high fluxes and achieve
heat transfer coefficients two orders of magnitude greater than single-phase heat transfer
systems. Heater surface enhancement with increased surface area, varied geometry,
wettability contrast and micro/nano-structures can further enhance boiling heat transfer
performance through bubble nucleation augmentation. Bubble nucleation control, growth
and departure dynamics is important in understanding boiling phenomena and enhancing
nucleate boiling heat transfer performance.
Bi-functional surfaces for enhanced boiling heat transfer were fabricated and
studied through investigation of bubble dynamics and pool boiling experiments. For the
fabrication of the surface, hydrophobic polymer dot arrays are first printed on a substrate,
followed by hydrophilic ZnO nanostructure deposition via microreactor-assisted
nanomaterial deposition (MAND) processing. Wettability contrast between the
hydrophobic polymer dot arrays and aqueous ZnO solution allows for the fabrication of
surfaces with distinct wettability regions. Bi-functional surfaces with various
configurations were fabricated and their bubble dynamics were examined at elevated heat
flux, revealing various nucleate boiling phenomena. In particular, aligned and patterned
bubbles with a tunable departure frequency and diameter were demonstrated in a boiling
experiment for the first time.
A pool boiling experimental facility has been designed and built to investigate
nucleate pool boiling in water at atmospheric pressure. Resulting boiling curves of
enhanced surfaces showed up to 3X enhancement in heat transfer coefficients at the same
surface superheat using bi-functional surfaces, compared to a bare stainless steel surface.
The surfaces show promising results for energy savings in two-phase change applications.

©Copyright by Michele David
December 6, 2016
All Rights Reserved

Experimental Study of Nucleate Boiling Bubble Dynamics and Heat Transfer
Enhancement on Printed Bi-functional Surfaces
by
Michele David
A THESIS
submitted to
Oregon State University
in partial fulfillment of
the requirements for the
degree of
Master of Science
Presented December 6, 2016
Commencement June 2017

Master of Science thesis of Michele David presented on December 6, 2016
APPROVED:
Major Professor, representing Chemical Engineering
Head of the School of Chemical, Biological, and Environmental Engineering
Dean of the Graduate School
I understand that my thesis will become part of the permanent collection of Oregon State
University libraries. My signature below authorizes release of my thesis to any reader
upon request.
Michele David, Author

ACKNOWLEDGEMENTS
My study here would not be possible without the support of my advisor, Dr. Chang, and to
him I express sincere gratitude for providing me with the opportunity to join his team,
guidance and all the resources needed to complete research for my Master’s degree.
My co-workers in the group were supportive and I thank them for that and their
camaraderie throughout my time in Oregon: Dr. Choi for training me on the MANDTM
fabrication process and SEM characterizations of bi-functional surfaces shown in Ch. 3 of
this thesis; He Yujuan for many insightful discussions about materials’ chemistry,
synthesis and characterizations, Jenna Gorecki, Mei Han, Dr. Chiu, Gao Zhongwei, Li
Shujie, Pan Changquin, Zhang Yujing, Jing Qun, Fang Zhen, Dr. Kim and Ma Guoheng.
Greyson Termini, School of MIME, provided me with so much of his time and input on
machining many materials, with high quality and precision that I needed for my projects,
and for that I am very appreciative.
Finally, I acknowledge my dear family, parents, brothers Noel and Nigel and dog Pixie, for
their sustained moral support.

TABLE OF CONTENTS
1 Introduction ...................................................................................................................... 1
1.1 Motivation for Study of Enhanced Boiling ............................................................................ 1
1.2 The Boiling Curve and Heterogeneous Bubble Nucleation ....................................................... 2
1.3 Enhancement Using Bi-Functional Surfaces .......................................................................... 7
1.4 Objectives ...................................................................................................................... 8
1.5 References ..................................................................................................................... 8
2 Literature Review........................................................................................................... 10
2.1 Advancements for Enhanced Boiling ................................................................................. 10
2.2 Mixed Wettability and Nucleation Site Control.................................................................... 12
2.3 Summary of Enhanced Surface Performance and Fabrication Techniques ................................. 14
2.4 References ................................................................................................................... 16
3 Fabrication of Printed Bi-Functional Surfaces .............................................................. 19
3.1 Background on ZnO Nanostructure Work ........................................................................... 19
3.2 Overview of Bi-functional Surface Fabrication .................................................................... 21
3.3 Inkjet Printing of Fluorinated Siloxane Dot Arrays ............................................................... 22
3.3.1 Piezoelectric Inkjet Printing Process ............................................................................ 22
3.3.2 Ink Formulation ....................................................................................................... 23
3.3.3 Jetting ................................................................................................................... 24
3.3.4 Configuration Design-Dot and Pitch Variation .............................................................. 26
3.4 Characterization ............................................................................................................ 29
3.5 References ................................................................................................................... 31
4 Bubble Dynamics on Printed Bi-Functional Surfaces ................................................... 32
4.1 Test Procedure .............................................................................................................. 32
4.2 Bubble Dynamics Observations of Bi-functional Surfaces ..................................................... 34
4.2.1 Pitch Variation in Subcooled Water ............................................................................. 34
4.2.2 Pitch Variation in Boiling Water ................................................................................. 36
4.2.3 Size Variation in Subcooled Water .............................................................................. 38
4.2.4 Size Variation in Boiling Water .................................................................................. 40
4.3 Summary of Bubble Dynamics ......................................................................................... 43

TABLE OF CONTENTS (continued)
4.4 Single Bubble Nucleation Site Control ............................................................................... 44
4.5 References ................................................................................................................... 46
5 Pool Boiling System Design .......................................................................................... 48
5.1 Pool Boiling Testing ...................................................................................................... 48
5.2 Design and Setup ........................................................................................................... 49
5.3 Test Procedure .............................................................................................................. 53
5.4 Preliminary Testing ........................................................................................................ 53
5.5 Data Reduction ............................................................................................................. 56
5.6 Error Analysis ............................................................................................................... 59
5.7 References ................................................................................................................... 62
6 Nucleate Boiling Performance of Enhanced Surfaces ................................................... 64
6.1 Characterization of Select Samples from Bubble Dynamics Study ........................................... 64
6.2 Boiling Performance of a Different Bi-functional Matrix Structure .......................................... 65
6.3 Boiling Performance of a Superhydrophobic-ZnO NW Surface .............................................. 68
6.3.1 Fabrication of Superhydrophobic PTFE/PPS ................................................................. 68
6.3.2 Boiling Curves of PTFE/PPS and ZnO Surfaces ............................................................ 71
6.4 Summary of Bi-functional Surfaces Tested ......................................................................... 72
6.5 References ................................................................................................................... 74
7 Conclusions and Future Work ....................................................................................... 75
7.1 Conclusions .................................................................................................................. 75
7.2 Future Work ................................................................................................................. 76

LIST OF FIGURES
Figure Page
Figure 1.1: Typical pool boiling curve with four boiling regimes ...................................... 3
Figure 1.2: Schematic illustrating four regimes of the boiling curve ................................. 4
Figure 1.3: Probability of a fluctuation causing nucleation versus surface wettability ...... 6
Figure 1.4: Enhancement of heat transfer from source to sink with hydrophobic-
hydrophilic surface configuration ....................................................................................... 7
Figure 2.1: Enhanced nucleate boiling curve shape .......................................................... 15
Figure 3.1: Schematic diagram of MANDTM for ZnO seed layer fabrication .................. 19
Figure 3.2: Schematic diagram of MANDTM process to fabricate ZnO nanostructures
(shown inset from the work of Choi and Chang, 2014) .................................................... 20
Figure 3.3: Overview of the printed bi-functional surface fabrication process ................ 22
Figure 3.4: Fujifilm Dimatix DMP 2831 inkjet printer and DMC-11600 cartridge ......... 23
Figure 3.5: Waveform showing PZT voltage profile during fill, print and recover ......... 25
Figure 3.6: Optical images from DropViewer software, 4 optimized nozzles
simultaneously firing during a jetting cycle with, ligament retraction at ideal print height
........................................................................................................................................... 25
Figure 3.7: Example of pattern array design and drop spacing adjustment to compensate
for dot size......................................................................................................................... 27
Figure 3.8: Schematic diagram of inkjet printing for fabricating hydrophobic dot arrays 28
Figure 3.9: Bi-functional surface distinct regions, SEM images of a) Dense ZnO
nanoflower b) 150-500 surface c) plain fluoropolymer dot d) cross-sectional area between
ZnO “forest” and dot “crater” e) static contact angles overlaying micrograph, showcasing
wettability and structural contrast interface. ..................................................................... 30
Figure 3.10. Micrographs of (a) polymer dot arrays on glass and bi-functional surfaces
(b) 75-500 m, (c) 150-500 m, (d) 200-500 m, (e) 300-500 m, (f) 75-250 m, (g) 75-
750 m, and (h) 75-1000 m. (scale bar = 1000 m and 50 m (inset)). ........................ 31
Figure 4.1. Simple boiling test for bubble dynamics observations on bi-functional
surfaces ............................................................................................................................. 33

LIST OF FIGURES (continued)
Figure Page
Figure 4.2: Bubble release frequency of major sites on bi-functional surfaces ................ 34
Figure 4.3: Images of bubble nucleation in subcooled water at 80 °C for a) bare, b) 75-
250 µm c) 75-500 µm d) 75-750 µm and e) 75-1000 µm. Scale bar =1 cm ..................... 35
Figure 4.4: Image of bubble nucleation on a 75-250 µm (smallest dot size and pitch)
surface at water temperature of 100 °C. Scale bar = 1 cm ................................................ 36
Figure 4.5: Images of bubble growth and release on a 75-500 µm surface at water
temperature of 100 °C. Scale bar = 1 cm. ......................................................................... 37
Figure 4.6: Image of controlled bubble array nucleation on a 75-750 µm surface at water
temperature of 100 °C. Scale bar = 1 cm .......................................................................... 37
Figure 4.7: Bubble nucleation at water temperature of 80 °C on varied dot sizes a)75-500
µm, b) 150-500 µm, c) 200-500 µm and d) 300-500 µm. Scale bar = 1 cm .................... 38
Figure 4.8: Images of unique trend for large dot size variation at 100 °C water
temperature on a) 150-500 surface showing large single flattened bubble with relatively
higher release frequency than b) 200-500 surface with 5 major sites and c) 300-500
surface with 7 major sites ................................................................................................. 40
Figure 4.9: Summary of ZnO wicking effect on lateral bubble merging with associated
bubble nucleation dynamics and morphology for (a) ZnO film (b) Printed 150–500 μm
array polymer pattern without ZnO matrix (c) Bi-functional 150–500 μm and (d) Bi-
functional 300–500 μm ..................................................................................................... 42
Figure 4.10 Controlled bubble nucleation site location. (a) Printing patterns (200-750 µm-
left and 1,000-750 µm-right). (b) Single bubble nucleation on patterns in a) at heat flux I
(scale bar = 1cm). (c) Scheme to control single bubble site, stabilized by a four dot
hydrophobic polymer dot array and dense ZnO nanowire matrix .................................... 45
Figure 5.1: Typical conduction experimental boiling test ................................................ 48
Figure 5.2: Typical Joule heating experimental boiling test ............................................. 49
Figure 5.3: Schematic of experimental boiling test system .............................................. 50
Figure 5.4: Virtual instrument for monitoring temperature profiles ................................. 52
Figure 5.5: Temperature profiles in copper tip for bare plate at start, middle and end of a
test run ............................................................................................................................... 55

LIST OF FIGURES (continued)
Figure Page
Figure 5.6: PTFE fixture close-up with test article and equivalent thermal circuit .......... 56
Figure 5.7: Thermal conductivity best-fit relation versus temperature for a) copper and b)
304 stainless steel .............................................................................................................. 58
Figure 5.8: Boiling curve for bare stainless steel, run twice at different ramping ............ 60
Figure 5.9: Uncertainty analysis for wall temperature and flux of a bare surface ............ 62
Figure 6.1: Boiling curves for 4 enhanced surfaces compared to a bare plate ................. 64
Figure 6.2: Boiling curves for enhanced surfaces with a nanowire matrix, compared to a
bare surface ....................................................................................................................... 66
Figure 6.3: HTC comparison for a) Matrix morphology b) Matrix effect on bi-functional
surfaces c) NW bi-functional dot size effect d) Flower bi-functional dot size effect ....... 67
Figure 6.4: Process scheme for superhydrophobic PTFE/PPS material ........................... 70
Figure 6.5: Size of 3 drop-casted superhydrophobic dots and SEM images of PTFE/PPS
micro and nanostructure .................................................................................................... 71
Figure 6.6: Boiling curves for enhanced surfaces with superhydrophobic dots and
nanowire matrix ................................................................................................................ 72

LIST OF TABLES
Table Page
Table 1.1: Typical heat transfer coefficients in heating/cooling ......................................... 2
Table 3.1 Hydrophobic area percentage for different test configurations ........................ 27
Table 5.1 Percentage difference for applied and calculated flux ...................................... 54
Table 5.2: Parameter measurements and uncertainties ..................................................... 61
Table 6.1: HTC enhancement for bi-functional surfaces at 25 °C superheat ................... 73
Table 6.2: Superheat enhancement for bi-functional surfaces at 27 W/cm2 ..................... 73

NOMENCLATURE (listed in order of appearance)
Abbreviations
HTC heat transfer coefficient
ONB Onset of nucleate boiling
CHF critical heat flux
MAND micro reactor-assisted nanomaterial deposition
Symbols
Heat flux (W/cm2)
θ Static contact angle (°)
ρ density (kg/m)
hlg latent heat of vaporization (kJ/kg)
σ surface tension (N/m)
g acceleration due to gravity (m/s)
µ dynamic viscosity (Pa·s)
cpl heat capacity (J/kg-K)
Tw wall temperature (°C)
𝑇𝑆𝑎𝑡 saturation temperature (°C)
Csf liquid-surface constant in Rohsenow correlation
Pr Prandtl number
n empirical constant in Rohsenow correlation for working fluid
∆Ωs surface free energy cost
kB Boltzmann constant
γ interfacial tension
RO bubble radius
A Area (cm)
D Diameter (cm)
t thickness (cm)
M Molar concentration (moles/L)
k Thermal conductivity (W/m-K)

∆T Wall superheat (°C)
T1 Temperature of thermocouple 1 (°C)
T2 Temperature of thermocouple 2 (°C)
T3 Temperature of thermocouple 3 (°C)
T4 Temperature of water in boiling pool (°C)
∆x Spacing between thermocouples in heating block (mm)
∆𝑇𝑙𝑜𝑠𝑠 Temperature drop from T1 to test surface (°C)
𝑇0 Temperature below test surface
h Heat transfer coefficient (W/cm2-K)
ωa Uncertainty of parameter “a”
𝐺𝑏 Average mass velocity of vapor leaving surface (kg-m/s)

1
1 Introduction
1.1 Motivation for Study of Enhanced Boiling
Two-phase convective heat transfer processes have been studied extensively for
their use in various engineering applications where a large thermal load must be removed.
The study of boiling heat transfer found its origins in industrial applications where a hot
solid was quenched in saturated or subcooled liquid 1. Boiling heat transfer processes are
able to achieve relatively large heat transfer coefficients (HTC) when compared to sensible
heat transfer operations due to their utilization of latent heat of vaporization. Further
applications of boiling are found in nuclear power plants (steam turbines), the
microelectronics industry (high power electronics cooling), chemical processing, the steel
industry, flooded tube and shell evaporators, refrigeration, and boiling water in a pot for
cooking 2–5. Currently the requirement for high thermal flux dissipation limits the
increasing advancement of integrated electronics with power densities of 1000 W/cm2 and
thus, boiling heat transfer has been a key focus for thermal management systems 2 .
A heated surface can efficiently transfer heat when submerged in a pool of water,
due to heterogeneous bubble nucleation at the surface, followed by bubble growth,
merging, departure and re-growth-with each subsequent cycle involving the removal of a
tremendous amount of heat. For perspective, Table 1.1 presents various conventional heat
transfer methods. Compared to contemporary air cooling systems, nucleate boiling
achieves the largest maximum fluxes for relatively small temperature gradients and
requires small form factors 6. Compared to sensible heat transfer heat exchangers, the
operation is not pressure drop limited 7. The bubble nucleation mechanisms involved in
nucleate boiling and an introduction to the boiling curve will be covered in section 1.2.

2
Table 1.1: Typical heat transfer coefficients in heating/cooling 8
Heat Transfer Method HTC (W/m2-K)
Free-air (cooling) 5-37
Free-water (cooling) 100-1200
Water tubular (heating) 150-1200
Water-steam tubular (heating) 300-1200
Water nucleate boiling 2000-45000
Water film boiling 100-300
The study of enhanced surfaces for boiling can lead to improved heating surfaces
for energy savings, safer equipment and lower temperature operation. Key performance
parameters of nucleate boiling include onset of nucleate boiling (ONB), critical heat flux
(CHF), and the boiling heat transfer coefficient. CHF represents the point at which
additonal heat flux can no longer be dissipated and so a heater surface temperature rapidly
soars leading to a dangerous condition. The event is usually also termed as “burnout” or
“boiling crisis”. CHF is an upper limit parameter for safe equipment operation involving
the use of nucleate boiling. The history of boiling heat transfer investigations spans decades
with experimental, numerical and theoretical studies of many enhanced surface structures.
However, a fundamental understanding of the phenomenon is still lacking due to its
complex nature involving a highly dynamic process occuring with heat, mass and
momentum transfer in irregular geometeries. Further study of bubble dyanmics on
enhanced surfaces will allow researchers to innovate for the development of highly
enhanced two-phase heat transfer surface materials.
1.2 The Boiling Curve and Heterogeneous Bubble Nucleation
The experimental boiling curve is used to quantify and compare enhanced boiling
surfaces. A typical boiling curve with heat flux dependence on wall superheat, or the
surface temperature above saturation temperature, of a flat surface/wire submerged in a
pool of liquid is shown in Fig 1.1.

3
Figure 1.1: Typical pool boiling curve with four boiling regimes
The procession of heat transfer shown in Figure 1.1 occurs as follows: free
convection occurs when the surface is just above saturation temperature, there is a small
gradient from the heater to the bulk liquid, and evaporation occurs. As heat input is
increased, surface temperature increases and discrete bubble sites form and the ONB is
reached. Soon the heated surface starts generating many isolated bubbles that rise and
either condense or pass through the liquid above. In doing so, each bubble takes away heat
from the surface as it leaves, with liquid replenishing the bubble site. The process continues
until the surface temperature gets to a certain point where bubbles merge laterally and form
vapor columns. This transition was named Gaertner’s first transition and a semi-theoretical
expression developed by Moissis and Berenson in 1963 is shown in equation 1.1, which
relates the heat flux at fully-developed nucleate boiling to contact angle 1.

4
(Equation 1.1)
𝑞" = 0.11√𝜃 𝜌𝑣ℎ𝑙𝑔 [𝜎𝑔
(𝜌𝑙−𝜌𝑣)]
1
4
The large formation of vapor hinders the liquid replenishment and so the vapor
column part of the curve should have a decreasing slope. The dry-out point/CHF is when
vapor mostly insulates the surface and the maximum flux that can be attained. An
illustration of these concepts is shown in Figure 1.2. Quickly thereafter with further heat
input, transition boiling (between nucleate and film boiling) occurs until a minimum heat
flux is reached. After the point of film boiling, the insulating vapor layer covering the
heated surface gets so hot that radiative heat transfer occurs. Since the CHF is the maximum
practical flux and the culmination point of nucleate boiling, most experiments are
conducted from ONB to CHF and reported in literature. It is evident that further increase
past CHF could result in melting of the surface or heater/other components of the test
system.
Figure 1.2: Schematic illustrating four regimes of the boiling curve

5
For the nucleate boiling regime, the most well-known semi-empirical correlation is
the Rohsenow Correlation 1,4,9. It was first proposed in 1962 on the basis of bubble
agitation, or bubble growth and departure movements that cause local forced convection in
the liquid at a surface 9. Rohsenow correlated the bubble forced convective heat transfer to
single-phase forced convection,
(Equation 1.2)
𝑞" = µ𝑙ℎ𝑙𝑣 [𝑔(𝜌𝑙 − 𝜌𝑣)
𝜎]
12
[𝑐𝑝𝑙(𝑇𝑤 − 𝑇𝑆𝑎𝑡)
𝐶𝑠𝑓ℎ𝑙𝑔𝑃𝑟𝑙𝑛 ]
3
Where Csf is an experimental constant dependent on liquid/surface combinations
and n is affected by the working fluid 10.
The start of the nucleate boiling process involves heterogeneous nucleation. Bubble
nuclei typically form at the interface of liquid and vapor, or in pool boiling in areas on the
surface where trapped gas/vapor nuclei exist. This is because phase-change phenomenon
usually occurs at the boundary between two phases 4. In other words, the interfaces are like
catalysts for bubble nucleation and a large number of liquid-vapor interfaces can generate
many bubble nuclei. Since bubbles form in cavities, scratches and defects, roughened
surfaces can have an earlier ONB. For smooth surfaces that are wet by the liquid phase,
the onset is delayed 1. Wettability is typically measured with static contact angle. Static
contact angle is the angle made between the solid-liquid and liquid-vapor interface, through
the liquid phase. The probability of a fluctuation producing a bubble nucleus on a solid
surface is proportional to,
(Equation 1.3)
𝑒−∆Ω𝑠
𝑘𝐵𝑇⁄
The surface free energy cost is related to liquid-vapor interfacial tension, bubble
radius and contact angle by 3 :

6
(Equation 1.4)
∆Ω𝑠 = 𝛾𝜋𝑅02 (1 + 𝑐𝑜𝑠𝜃𝑠) 2 (2 − 𝑐𝑜𝑠𝜃𝑠)
Therefore, on a hydrophobic surface with contact angle greater than 90°, 𝑐𝑜𝑠𝜃𝑠 is
less than zero, and the probability of bubble nucleation is higher than on a hydrophilic
surface, as shown in Fig. 1.3 below.
Figure 1.3: Probability of a fluctuation causing nucleation versus surface wettability
Based on the conceptual understanding of the nucleate boiling regime, it is expected
that optimal boiling surfaces will have early ONB, fast increase in slope after the ONB and
delayed CHF. Combining these characteristics, the best boiling curve would be shifted to
the left and steep, compared to the typical boiling curve in Fig. 1.1. Highly wetting and
wicking surfaces can delay CHF because the vapor columns shown in Fig. 1.2 can be
removed more efficiently with liquid replenishment. To enhance vapor trapping, non-
wetting surfaces can be used to promote early bubble nucleation.
0 30 60 90 120 150 180
Pro
bab
ilit
y o
f N
ucl
eati
on
Static Contact Angle of Surface (°)
Probability of Nucleation on a Solid Surface

7
1.3 Enhancement Using Bi-Functional Surfaces
A focus of the present study involves the fabrication and testing of novel enhanced
surfaces with mixed wettability regions. The enhanced surfaces incorporate hydrophobic
nucleation sites with surrounding hydrophilic and functional capillary wicking structures
to promote bubble nucleation, growth and departure, as well as liquid-rich zones to flood
the nucleating sites. Hydrophilic ZnO nanostructures have already been characterized and
studied extensively for their use in enhanced nucleate boiling 11. Thus, the focus of this
thesis is on the juxtaposition of hydrophobic sites (and their fabrication) within the ZnO
hydrophilic matrix. Fig. 1.4 shows an overview of benefits from a configuration with mixed
hydrophilic matrix surrounding a hydrophobic array. Ch. 2 will go into greater detail about
studies of mixed wettability, with a review from literature.
Figure 1.4: Enhancement of heat transfer from source to sink with hydrophobic-
hydrophilic surface configuration

8
1.4 Objectives
The goal of the study set forth includes 2 main parts:
1. Fabrication and characterization of patterned bi-functional boiling surfaces
with solution-based deposition processes including:
I. Nanostructured ZnO (hydrophilic) with MANDTM and fluorosilane
polymer material (hydrophobic) with piezoelectric inkjet printing
technology on 304 stainless steel substrates (Ch. 3).
II. Evaluation of bubble dynamics on enhanced surfaces (Ch. 4)
2. Design, construction and assembly of a pool boiling testing system, to
evaluate boiling heat transfer performance of enhanced surfaces (Ch. 5).
I. Details of the design work, methodology and baselining for
measuring heat transfer coefficients
II. Characterization of select bi-functional surfaces with the new pool
boiling test system (Ch. 6)
1.5 References
1. Kandlikar, S. G., Shoji, M. & Dhir, V. K. Handbook of Phase Change Boiling and
Condensation. (Taylor & Francis, 1999).
2. Tao, P. et al. Bioinspired engineering of thermal materials. Adv. Mater. 27, 428–
463 (2015).
3. Xu, X. & Qian, T. Single-bubble dynamics in pool boiling of one-component
fluids. 63002, (2014).
4. Carey, V. P. Liquid Vapor Phase Change Phenomena: An Introduction to the
Thermophysics of Vaporization and Condensation Processes in Heat Transfer
Equipment, Third Edition. (CRC Press, 2007).
5. Park, Y., Kim, H., Kim, J. & Kim, H. Measurement of liquid – vapor phase
distribution on nano- and microstructured boiling surfaces. Int. J. Multiph. Flow
81, 67–76 (2016).
6. Jeon, S., Jo, B. & Banerjee, D. ENHANCEMENT OF SATURATION BOILING
OF PF-5060 ON MICROPOROUS SURFACE. in ENHANCEMENT OF
SATURATION BOILING OF PF-5060 ON MICROPOROUS SURFACE (ASME,
2011).
7. Kandlikar, S. G. & Jaikumar, A. Enhanced Pool Boiling using Separate Liquid-
Vapor Pathways for Cooling High Heat Flux Electronics Devices « Electronics
Cooling Magazine – Focused on Thermal Management, TIMs, Fans, Heat Sinks,
CFD Software, LEDs/Lighting. Electronics Cooling (2015).

9
8. Overall Heat Transfer Coefficient Table Charts and Equation. (2016). Available at:
https://www.engineersedge.com/thermodynamics/overall_heat_transfer-table.htm.
(Accessed: 20th September 2016)
9. Bejan, A. & Kraus, A. D. Heat transfer handbook. (J. Wiley, 2003).
10. Journal, I., Transfer, M. & Engineering, M. Experimental evaluation of constants
for the Rohsenow pool boiling correlation.
11. Hendricks, T. J., Krishnan, S., Choi, C., Chang, C.-H. & Paul, B. Enhancement of
pool-boiling heat transfer using nanostructured surfaces on aluminum and copper.
Int. J. Heat Mass Transf. 53, 3357–3365 (2010).

10
2 Literature Review
An analysis of literature shows that nucleate boiling research has focused on the
fabrication of surfaces with varying surface area, thickness, orientation, chemical
composition and surface energy. Early on, surface modifications to increase effective heat
transfer area with fin action were investigated 1. However, in the past decade fabrication
techniques for micro and nanostructures have led to development of innovative enhanced
boiling surfaces.
2.1 Advancements for Enhanced Boiling
Originally, roughened boiling surfaces containing microstructures were studied.
The idea of microstructures increasing CHF was first proposed in 1931 by Jakob 2.
Nanostructured surfaces have recently been investigated for use in nucleate boiling because
they are porous and can trap air. Surfaces containing trapped gases and vapor in cavities
are not completely wetted, and thus contain a greater amount of nucleation sites to promote
boiling incipience while reducing superheat 3,4. According to Li et al., boiling incipience
superheat can be augmented by varying the surface coating’s pore size or thickness 2.
Additionally, during the nucleate boiling process, it has been suggested that strong
convection due to liquid-vapor counter-flow from porous coatings increases the rate of heat
transfer 2,5. Due to the need for vapor-trapping, many groups have focused on creating
porous structures to reduce wall superheat and delay CHF 2. Since hydrophobicity leads to
an earlier activation of nucleation sites but results in poor rewetting, many studies have
examined the role of hydrophilicity and nanoporosity to enhance the CHF 3,6–15. Another
reason for using nanostructures is the reduced size of electronics as technology advances,
with small geometries requiring high effective heat transfer areas 1.

11
Porous surfaces provide a substantial increase in the total number of active
nucleation sites per unit area and consequently shift the boiling curve to the left, indicating
a faster ONB. Hendricks et al. fabricated multiscale ZnO structures on aluminum by a
microreactor solution-based deposition process. The ZnO multiscale structures showed
significant enhancement in both HTC (~4X) and CHF (~10X) compared to bare aluminum
14. Im et al. reported that their CuO nanosized flower petals created a strong capillary force
that was able to augment the rewetting performance of the surface due to the large surface
area-to-volume ratio of these features, leading to 58% increase in CHF 11. This indicates
that porous structures of a nanoscale dimension are required to increase capillary action.
Nano-porous structures also provide smaller dimensions for more active nucleation sites,
which can then combine into larger sites 6. Nam et al. reported that nucleation sites must
occur in the appropriate number and dimension for enhancement 6. Furthermore, for a site
to promote nucleation, there needs to be sufficient enclosure 16. Chu et al. highlighted the
importance of using structures of multiple length scales to enhance boiling heat transfer
performance by using a microstructured superhydrophilic silica-based surface17. They were
able to achieve up to 200 % enhancement in CHF due to roughness increase.
Vertically-aligned carbon nanotube-coated copper surfaces were shown to increase
CHF by 38% compared to a bare copper substrate by Dharmendra et al. Enhancement was
attributed to porosity, fin action and surface roughness. They reported the CNTs to have a
high initial bubble density. The fabrication process was done via hot filament chemical
vapor deposition and increased roughness to create a hierarchical structure with
sandblasting first 1.
Unique hierarchically-structured microchannels with silicon nanowires on
orthogonal surfaces were created with a microfabrication technique and the black silicon
method by Yao et al 18. The authors reported the topological and chemical properties to
play a huge role in rewetting and increasing surface area. 400% CHF enhancement and
42% HTC improvements were demonstrated, compared to bare silicon. Hierarchical
structures’ enhanced surface area and dimensions enhance vapor ventilation and promote
liquid spreading, in addition to increasing surface area 19.

12
Hierarchically-structured surfaces of SiO2 microposts with surrounding nanograss
were fabricated with the DRIE and black silicon methods for each region 20. The study by
Kim et al. showed CHF and HTC were enhanced by 76% and 150%, respectively.
Comparatively, the nanograss surface only showed CHF enhancement by 41%. They also
found that the ONB for a pure microstructured surface was lower than that of a
nanostructured surface. Additionally, through probing the bubble base diameters with
infrared-based detection (Detection of Phase by Infrared Thermometry), they found that
the average dry patch size was smaller on microstructured surfaces and consequently easier
to rewet. The nanostructures would presumably have better rewetting properties, but due
to their density prevented liquid from entering dry areas, leading to larger average bubble
sizes.
Another recent study found that microporous brazed coatings contained reentrant
cavities and a pore connecting structure 21. The microstructures were able to achieve 10X
HTC at ONB with smaller bubble sizes being removed due to propelling out of the pores’
connecting structure as pore temperature rose. Higher HTCs were attributed to smaller
bubble diameters and the resulting smaller local dryout.
McCarthy et al. showed that wickability is the critical parameter dictating CHF on
structured superhydrophilic surfaces 8. The ideal spaces in the nanostructure create
capillary forces to drive liquid into the capillaries and channel it on the heated zones,
leading to 250% CHF enhancement. However, purely superhydrophilic surfaces do not
allow for sufficient initiation of nucleation sites, thus the combined effects of both
hydrophobic and hydrophilic functionalities can moderate instabilities and sustain boiling
22.
2.2 Mixed Wettability and Nucleation Site Control
Mixed wettability has been shown to enhance boiling through two intuitive
mechanisms-localized bubble incipience, and liquid replenishment to delay CHF. Mixed
wettability has its place in nature for enhancing phase-change. Since the discovery of the
phase-change phenomena that was showcased with the Stenocara beetle structure, various

13
efforts have been undertaken to utilize a dual hydrophobic-hydrophilic structured surface
for improving phase-change and liquid channeling for enhanced wickability 23. The
Stenocara beetle of the Namib desert has a hydrophobic-hydrophilic structure on its wings
for drop-wise condensation of water vapor, along with water sliding capabilities to channel
the condensed liquid 24. This same process can be adapted for boiling enhancement.
Prior to the beetle mechanism discovery, Young and Hummel suggested a mixed
wettability surface 52 years ago 25. The use of mixed wettability surfaces, also known as
“heterogeneous”, “interlaced” wettability and “biphilic” allows for the design of enhanced
surfaces including the benefits of both homogeneously hydrophobic or hydrophilic
surfaces 24,26–28,30–33. Hydrophobicity enhances vapor trapping, which serves as a catalyst
for bubble nucleation. Hydrophilicity facilitates liquid water transport that prevents early
dry out, thus enhancing the critical heat flux (CHF) 7. Betz et al. fabricated SiO2-Telfon
coatings with photolithography patterning and demonstrated that the CHF was enhanced
by 65% and the HTC by 100% for their “superbiphilic” surfaces with hydrophobic islands
in a hydrophilic network 22. The enhancement was more than for just “biphilic” surfaces.
Dai et al. used composite surfaces with interlaced wettability to enhance the boiling
performance as well 27. Jung et al. numerically simulated periodic checkerboard patterned
hydrophobic dots and found that an optimized concentration of small dots outside the
center of the heated area resulted in high CHF, with fractional control of dot patterns.
In order to enhance CHF and HTC effectively, spatial control of bubble nucleation
could be a promising approach 28,34. Jo et al. reported the enhancement of boiling heat
transfer by properly controlling bubble nucleation location 28. Xu et al. studied the
dynamics of a single vapor bubble initiated on a hydrophobic dot, as well as on a
hydrophobic dot with a surrounding hydrophilic region via computational hydrodynamic
simulations 35. The key mechanism they identified for site control was from incorporating
mixed wettability to hinder continuous bubble growth by pinning the contact line at the
hydrophobic-hydrophilic intersection. A high contact angle leads to lateral bubble
spreading, longer growth time, larger departure diameters, and stronger bubble base

14
adhesion to the surface 35. The pinning phenomenon lead to a small bubble departure
diameter and consequently prevented transition from nucleate to film boiling.
Single bubble dynamics were reported by Jo et al. on SiO2 (54°) and Teflon (123°),
patterned with a MEMS technique 25. A key mechanism they identified for enhancement
was bubble interface necking which enhanced HTC, without degrading CHF. In this
process, bubble regrowth happens spontaneously due to a small basal portion of each
departing bubble remaining on the hydrophobic region. Their 50 micron-sized hydrophobic
dots outperformed millimeter-sized ones due to contact line pinning and stick-slip
behavior. 2.1X HTC enhancement was achieved with hydrophobic dots, compared to a
bare hydrophilic SiO2 surface. Spatial control of a single steady-state bubble was created
with SiO2-trichlorosilane patterns and a femtosecond laser heating source to understand
single bubble contact lines 36.
Spatial control has not only been achieved with the use of distinct wettability
regions. Recently Cho et al. demonstrated adaptable boiling surfaces through in-situ
control temporally and spatially via electrostatic adsorption and desorption of charged
surfactants to alter surface wettability, contact angle control and nucleation density by
turning bubbles on and off 37. The process occurs by charged surfactant
adsorption/desorption to the solid-liquid interface coupled with the use of electric fields.
Spatially-ordered bubble nucleation was also demonstrated by Rahman et al. with the use
of “bi-conductive” surfaces. They showed how bulk material in-plane variation design,
with periodic segments of thermally conductive (copper) and insulating (epoxy) materials
created wall temperature gradients to promote bubble nucleation on the high temperature
copper segments, while promoting liquid flow on the low-temperature epoxy strips 38.
Spatial control would be beneficial in flow boiling applications where the heat transfer
performance and stability can be highly sensitive to the location of bubble nucleation 37.
2.3 Summary of Enhanced Surface Performance and Fabrication Techniques
Based on the conceptual understanding of the nucleate boiling regime and enhanced
surface review, it is expected that optimal boiling surfaces will have early ONB, both at

15
low flux and wall temperature, fast increase in slope after the ONB and delayed CHF.
Combining these three characteristics, the best boiling curve would appear as follows.
Figure 2.1: Enhanced nucleate boiling curve shape
A key conclusion from the review is that to prevent large surface bubble merging
and adhesion, pinning of the contact triple-line is important. Pinning is best achieved with
mixed wettability regions in an optimized configuration. Spatially-controlled nucleation is
a newly studied area within the field of boiling heat transfer, and can lead to enhanced
HTC. Furthermore, hierarchically-structured surfaces containing both nano and micro
structures can lead to the highest HTC improvements by incorporating capillary wicking,
vapor escape channels and relatively higher increases in surface area, compared to just
micro or nano structures.

16
In the above review, various types of innovative surface structures were described
for enhancing boiling performance. A key factor in implementing the technologies for
widespread usage in energy savings is the manufacturability of the materials. Typical
fabrication processes have involved semiconductor processing steps, with the use of
multiple masking layers, vacuum chambers, high power (etching) and high temperature
systems. Thus, the processing of these surfaces all involve similar techniques, even though
the final structures differ and have unique features. The manufacturing steps limit the
scalability of each coating, for energy savings applications. Consequently, the challenge
set forth is the requirement to develop innovative enhanced surfaces produced with a low-
power usage, scalable process design scheme. In the next chapter, the fabrication of a novel,
scalable technique used to create innovative enahnced bi-functional surfaces is presented.
2.4 References
1. Dharmendra, M., Suresh, S., Kumar, C. S. S. & Yang, Q. Pool boiling heat transfer
enhancement using vertically aligned carbon nanotube coatings on a copper
substrate. Appl. Therm. Eng. 99, 61–71 (2016).
2. Li, C. & Peterson, G. P. Parametric Study of Pool Boiling on Horizontal Highly
Conductive Microporous Coated Surfaces. J. Heat Transfer 129, 1465 (2007).
3. Heitich, L. V., Passos, J. C., Cardoso, E. M., da Silva, M. F. & Klein, A. N.
Nucleate boiling of water using nanostructured surfaces. J. Brazilian Soc. Mech.
Sci. Eng. 36, 181–192 (2014).
4. Kandlikar, S. G., Shoji, M. & Dhir, V. K. Handbook of Phase Change Boiling and
Condensation. (Taylor & Francis, 1999).
5. Kandlikar, S. G. & Jaikumar, A. Enhanced Pool Boiling using Separate Liquid-
Vapor Pathways for Cooling High Heat Flux Electronics Devices « Electronics
Cooling Magazine – Focused on Thermal Management, TIMs, Fans, Heat Sinks,
CFD Software, LEDs/Lighting. Electronics Cooling (2015).
6. Nam, Y. & Ju, Y. S. Bubble nucleation on hydrophobic islands provides evidence
to anomalously high contact angles of nanobubbles. Appl. Phys. Lett. 93, 2006–
2009 (2008).
7. Phan, H. T., Caney, N., Marty, P., Colasson, S. & Gavillet, J. Surface wettability
control by nanocoating: The effects on pool boiling heat transfer and nucleation
mechanism. Int. J. Heat Mass Transf. 52, 5459–5471 (2009).
8. Mccarthy, M. Role of Wickability on the Critical Heat Flux of Structured
Superhydrophilic Surfaces. (2014).
9. Liu, C., Su, F., Liang, J. & Huang, P. Facile fabrication of superhydrophobic
cerium coating with micro-nano flower-like structure and excellent corrosion
resistance. Surf. Coatings Technol. 258, 580–586 (2014).
10. Park, B. K. et al. Synthesis and size control of monodisperse copper nanoparticles

17
by polyol method. J. Colloid Interface Sci. 311, 417–24 (2007).
11. Im, Y., Dietz, C., Lee, S. S. & Joshi, Y. Flower-Like CuO Nanostructures for
Enhanced Boiling. Nanoscale Microscale Thermophys. Eng. 16, 145–153 (2012).
12. Chen, R. et al. Nanowires for enhanced boiling heat transfer. Nano Lett. 9, 548–
553 (2009).
13. Lu, M. C., Chen, R., Srinivasan, V., Carey, V. P. & Majumdar, A. Critical heat
flux of pool boiling on Si nanowire array-coated surfaces. Int. J. Heat Mass
Transf. 54, 5359–5367 (2011).
14. Hendricks, T. J., Krishnan, S., Choi, C., Chang, C.-H. & Paul, B. Enhancement of
pool-boiling heat transfer using nanostructured surfaces on aluminum and copper.
Int. J. Heat Mass Transf. 53, 3357–3365 (2010).
15. Demir, E., Izci, T., Sinan, A., Karabacak, T. & Kos, A. Effect of silicon nanorod
length on horizontal nanostructured plates in pool boiling heat transfer with water.
Int. J. Therm. Sci. 82, (2014).
16. Cooke, D. & Kandlikar, S. G. Pool Boiling Heat Transfer and Bubble Dynamics
Over Plain and Enhanced Microchannels. J. Heat Transfer 133, 52902 (2011).
17. Chu, K.-H., Soo Joung, Y., Enright, R., Buie, C. R. & Wang, E. N. Hierarchically
structured surfaces for boiling critical heat flux enhancement. Appl. Phys. Lett.
102, 151602 (2013).
18. Yao, Z., Lu, Y. & Kandlikar, S. G. Fabrication of nanowires on orthogonal
surfaces of microchannels and their effect on pool boiling. J. Micromechanics
Microengineering 115005, (2012).
19. Tao, P. et al. Bioinspired engineering of thermal materials. Adv. Mater. 27, 428–
463 (2015).
20. Park, Y., Kim, H., Kim, J. & Kim, H. Measurement of liquid – vapor phase
distribution on nano- and microstructured boiling surfaces. Int. J. Multiph. Flow
81, 67–76 (2016).
21. Jun, S., Wi, H., Gurung, A., Amaya, M. & You, S. M. Pool Boiling Heat Transfer
Enhancement of Water Using Brazed Copper Microporous Coatings. J. Heat
Transfer 138, 1–9 (2016).
22. Betz, A. R., Jenkins, J. R., Kim, C. J. & Attinger, D. Significant boiling
enhancement with surfaces combining superhydrophilic and superhydrophobic
patterns. Proc. IEEE Int. Conf. Micro Electro Mech. Syst. 1193–1196 (2011).
doi:10.1109/MEMSYS.2011.5734645
23. Zhai, L. et al. Patterned superhydrophobic surfaces: Toward a synthetic mimic of
the namib desert beetle. Nano Lett. 6, 1213–1217 (2006).
24. Parker, a R. & Lawrence, C. R. Water capture by a desert beetle. Nature 414, 33–
34 (2001).
25. Jo, H., Sun, H. & Hwan, M. Single bubble dynamics on hydrophobic – hydrophilic
mixed surfaces. Int. J. Heat Mass Transf. 93, 554–565 (2016).
26. Betz, A. R., Xu, J., Qiu, H. & Attinger, D. Do surfaces with mixed hydrophilic and
hydrophobic areas enhance pool boiling? Appl. Phys. Lett. 97, 14–16 (2010).
27. Dai, X. et al. Enhanced nucleate boiling on horizontal hydrophobic-hydrophilic
carbon nanotube coatings. Appl. Phys. Lett. 102, (2013).
28. Jo, H., Yu, D. I., Noh, H., Park, H. S. & Kim, M. H. Boiling on spatially controlled

18
heterogeneous surfaces: Wettability patterns on microstructures. Appl. Phys. Lett.
106, 181602 (2015).
29. Hsu, C. C., Chiu, W. C., Kuo, L. S. & Chen, P. H. Reversed boiling curve
phenomenon on surfaces with interlaced wettability. AIP Adv. 4, 107110 (2014).
30. Betz, A. R., Jenkins, J., Kim, C. J. & Attinger, D. Boiling heat transfer on
superhydrophilic, superhydrophobic, and superbiphilic surfaces. Int. J. Heat Mass
Transf. 57, 733–741 (2013).
31. Zupančič, M., Steinbücher, M., Gregorčič, P. & Golobič, I. Enhanced pool-boiling
heat transfer on laser-made hydrophobic/superhydrophilic polydimethylsiloxane-
silica patterned surfaces. Appl. Therm. Eng. 91, 288–297 (2015).
32. Lee, J. S. & Lee, J. S. Critical heat flux enhancement of pool boiling with adaptive
fraction control of patterned wettability. Int. J. Heat Mass Transf. 96, 504–512
(2016).
33. Jo, H., Kim, S., Kim, H., Kim, J. & Kim, M. Nucleate boiling performance on
nano/microstructures with different wetting surfaces. Nanoscale Res. Lett. 7, 242
(2012).
34. Suroto, B. J. et al. Effects of Hydrophobic-Spot Periphery and Subcooling on
Nucleate Pool Boiling from a Mixed-Wettability Surface. J. Therm. Sci. Technol.
8, 294–308 (2013).
35. Xu, X. & Qian, T. Single-bubble dynamics in pool boiling of one-component
fluids. 63002, (2014).
36. Zou, A., Chanana, A., Agrawal, A., Wayner, P. C. & Maroo, S. C. Steady State
Vapor Bubble in Pool Boiling. Nat. Publ. Gr. 1–8 (2016). doi:10.1038/srep20240
37. Cho, H. J., Mizerak, J. P. & Wang, E. N. Turning bubbles on and off during
boiling using charged surfactants. Nat. Commun. 6, 8599 (2015).
38. Mahamudur Rahman, M., Pollack, J. & McCarthy, M. Increasing Boiling Heat
Transfer using Low Conductivity Materials. Sci. Rep. 5, 13145 (2015).

19
3 Fabrication of Printed Bi-Functional Surfaces
A novel, scalable process was developed to fabricate a mixed wettability surface,
utilizing wettability contrast, with two distinct regions. The surface consisted of a
hydrophobic fluoropolymer dot array surrounded by hydrophilic ZnO matrix. For the
fabrication a solution-based deposition and piezoelectric inkjet printing were used. Before
discussing the method used to create the surface, a review of ZnO nanostructure growth
with a micro-reactor nanomaterial deposition (MANDTM) process is presented.
3.1 Background on ZnO Nanostructure Work
ZnO nanostructures including amorphous, nanoflower and nanowire
morphologies were previously studied for their enhancement of CHF for pool boiling
applications 1. Zinc acetate salt precursor and sodium hydroxide reducing agent were
used as reactants in an aqueous solution to form the various nanostructures with the
continuous MANDTM process. The process is unique for its scalability, low temperature
steps and ability to attain various distinct nanoscale morphologies with varied reactor
residence time 2. Seed layer growth was studied to be an important step in the uniform
assembly of various morphologies, and the processing scheme used is shown in Fig. 3.1.
Figure 3.1: Schematic diagram of MANDTM for ZnO seed layer fabrication

20
An amorphous ZnO film was obtained at a flowrate of 28 ml/min (through an
Ismatec pump), while being spin-coated onto a substrate at a temperature of 200 °C. The
reaction occurred from the t-mixer (50µm) through a helical reactor (1.22 mm ID, 130 cm
Tygon tubing). A constant temperature bath was maintained at 70 °C. For the growth of
ZnO nanostructures the process used in Fig. 3.2 was used.
Figure 3.2: Schematic diagram of MANDTM process to fabricate ZnO
nanostructures (shown inset from the work of Choi and Chang, 2014)
The difference between the seed layer and subsequent growth step is the flowrate,
substrate temperature and stationary substrate deposition (not spin-coated). The flowrate is
reduced to allow nuclei to grow and assemble, and is controlled between 6.8-14.7 ml/min
to form different morphologies. Thin film thickness can be controlled with varying
deposition time.
Important variables governing the nanostructure morphology and growth
characteristics include deposition temperature, reactor residence time, pH, reactant
concentrations and deposition time. All variables were studied, optimized and results were
characterized in the work of Choi and Chang, and the interested reader is referred to this
publication 3. The processing variables and setup used in the above scheme are not a focus

21
of the present work. Nevertheless, a background was necessary to facilitate an
understanding of the ZnO nanoflower film, which was used as the hydrophilic wicking
region of the printed bi-functional surface.
3.2 Overview of Bi-functional Surface Fabrication
In order to create the bi-functional surface, a 5-step experiment was conducted. The
steps include 1) hydrophilic surface treatment, 2) seed layer growth, 3) inkjet printing of
hydrophobic material, 4) curing of solvent in the deposited ink and 5) ZnO nanoflower
growth. The process is unique because of the utilization of wettability contrast to deposit
hydrophobic dot arrays and nanoflowers. Subsequent deposition of the aqueous solution-
based reactants prevents the hydrophobic array regions from being deposited on. While
being deposited, the aqueous solution flows around individual dots in the array and the
nanoflower film can only grow where dots are not patterned. Such a novel technique
utilizes the previous printing step and avoids multiple masking layers or lithography
patterning that are typically used for patterning mixed wettability surfaces. The wettability
contrast technique is also what allows for the formation of 2 distinct regions in the thin
film, as opposed to a sandwich-type film.
Chemicals used in ZnO growth included .005 M zinc acetate Zn(CH3COO)2·6H2O
(Sigma Aldrich), .025 M ammonium acetate CH3COONH4 (Mallinckrodt Chemicals) and
0.1 M NaOH (Mallinckrodt Chemicals). For the hydrophobic region, Fluorolink S10
(Solvay Solexis) perfluoropolyether (PFPE) with ethoxysilane terminal groups was used.
The printing solvent was propylene glycol monomethyl ether
acetate- CH3CO2CH(CH3)CH2OCH3 (PGMEA) tradename SU-8 Developer (Microchem).
304 stainless steel plates (2 x 2 cm) were used as substrates. Stainless steel is
inexpensive and widely used in many industrial applications, so it was selected for an
enhanced surface coating for boiling applications. Plates were first thoroughly cleaned with
soap and water, rinsed with deionized (D.I) water and pretreated. A hydrophilic treatment
was required for the aqueous solution-based deposition to growth ZnO. Substrates were

22
placed in a 1 M NaOH solution for 30 min under ultra-sonication, followed by cleaning
with acetone, methanol, D.I water and drying with nitrogen gas.
An overview of the process to make the coating is shown in Fig. 3.3. The inkjet-
printed dots were cured (details in 3.3) followed by the wicking layer deposition. The
solution deposition time to grow ZnO nanoflowers was 3 minutes at a flowrate of 14.7
ml/min.
Figure 3.3: Overview of the printed bi-functional surface fabrication process
3.3 Inkjet Printing of Fluorinated Siloxane Dot Arrays
3.3.1 Piezoelectric Inkjet Printing Process
Inkjet printing technology has been expanding into digital fabrication and industrial
printing due to its scalability and ability to deposit picoliter droplets. With the ability to
pattern high resolution features, researchers are incorporating inkjet printing into thin film
fabrication to replace masking steps. Inkjet printing is also a cost-efficient approach for

23
deposition of a variety of materials without wastage (small quantity of ink used) and
reproducible results.
The DMP is a lab-scale system from Fujifilm for developing and testing ink
applications. Fig. 3.4 shows the Dimatix DMP with cartridge (inset). The system capability
allows for 10 pL droplet ejection. The cartridge head contains micofluidic channels
controlled with a piezolectric transducer (PZT) that allows jetting by pulsing fluid from the
reservoir.
Figure 3.4: Fujifilm Dimatix DMP 2831 inkjet printer and DMC-11600 cartridge
The cartridge fluid reservoir can hold up to 2 ml, which is the quantity loaded during
experiments. Built-in software allows the user to create various patterns and the direct-
writing capability allows for implementation of any designed feature.
The maximum resolution of ejected fluid depends on the ink and on cartridge
properties. The nozzle plate (SiO2 plate coated with a non-stick epoxy) contains 16 orifices,
each 21.5 µm and spaced 254 µm. Micro-scale control of array patterns has been achieved
with this technology, through ink formulation and printer parameter setup.
3.3.2 Ink Formulation
Fluorinated materials are already used in anti-stick cookware coatings and
corrosion-resistant bearings 4. They are printable due to their size and inertness 4. For pool

24
boiling heat transfer applications, the S10 fluoropolymer was selected due to its capability
to bond to a variety of commonly used metals (including stainless steel) and metal oxides.
Additionally, it is stable up to 300 °C and can be cured at relatively low temperatures (<
200 °C) relatively quickly, or at room temperature over 24 hours.
The first focus of inkjet printing of S10 was the ink formulation. To be a qualifying
candidate for piezoelectric inkjet printing, inks must be within a pH range of 4-9, viscosity
of 10-12 cPs for optimal jetting, specific gravity above 1, surface tension between 28-33
dynes/cm, and not contain solids larger than 0.2 µm, according to the manufacturer.
Additionally, the ink must possess a spherical drop jetting profile before hitting the
substrate it is meant to deposit on. The ink was optimized via a diluent that was compatible
with cartridge interior materials and is co-soluble with the fluorinated polymer chemistry.
The solvent was mixed in a vial with S10 followed by 10 min ultra-sonication to remove
air bubbles. It was found that air bubbles inhibit ink ejection by blocking the microfluidic
channels. After degassing, the ink was filtered with a syringe and loaded into the fluid
reservoir.
The 15 wt % S10 formulation was used to prevent clogging, sustain the cartridge
and produce a thin dot pattern. The solvent’s boiling point of 125 °C made it suitable for
printing. Low volatility solvents with boiling points below 100 °C are not suitable because
they evaporate too quickly, can increase nozzle clogging and result in the notorious
“coffee-stain” effect (non-uniform deposit). In order to produce stable jetting onto the
stainless steel, the waveform and firing voltage were adjusted.
3.3.3 Jetting
Ink stability and profiles were optimized during a run by controlling the waveform
and firing voltage. Another factor to form a stable deposit was the height of deposition. For
this, the print head is set to a height 500 µm above the substrate. The drops were ejected in
11.5 s and 24 V pulse at a frequency of 20 kHz. Fig. 3.5 shows the waveform used to set
these values. The waveform also controls the drop shape.

25
Figure 3.5: Waveform showing PZT voltage profile during fill, print and recover
Before a printing run, ink was loaded into the fluid reservoir and drop ejection
profiles were monitored with a video camera built into the printer. To better control drop
shape, firing voltage was adjusted prior to each run. Due to viscoelastic extension of the
polymer when undergoing shear stress from firing, a ligament is present when each drop is
ejected. This ligament characteristic is common and expected for polymeric inks 4. Fig. 3.6
shows the optimized jetting profile of the S10 ink.
Figure 3.6: Optical images from DropViewer software, 4 optimized nozzles
simultaneously firing during a jetting cycle with, ligament retraction at ideal print
height
Voltage adjustment prevented drop ligament formation below the print height
(1200 µm in this example). Without ligament retraction before hitting the test surface,
satellite droplet formation becomes a problem when splattering on the surface. Due to the
hydrophobic nature of the print head and ink formulation, wetting of the aperture occurs.

26
Wetting posed a significant problem in sustaining the cartridge, so a purging cycle cleaning
recipe was run between profile checks to stabilize the print head and prevent nozzle
clogging. At the start of and between print cycles the purge recipe automatically runs. The
printing process took place at room temperature to avoid solvent evaporation while
printing.
3.3.4 Configuration Design-Dot and Pitch Variation
Hydrophobic dot arrays were created with the stable droplet setup discussed above
and the Pattern Generator software. The scalability of pattern creation is made possible
with a drop-on-demand printing software. Since the aim was to produce the best boiling
surface, the ratio of hydrophobic to hydrophilic needed variation. In order to study the
effect of dot size and arrangement on bubble nucleation, growth and departure, various
configurations were designed with the printer software. An initial test of setting drop size
to 50 µm resulted in a final polymer dot size of 75 µm (confirmed with SEM). This was
due to the ink spreading when hitting the substrate surface, resulting in a larger dot
diameter.
The configuration design summary is shown in Table 3.1. It was hypothesized that
bubble dynamics could be tailored with dot size and dot center-to-center spacing (pitch).
Test surfaces contain variation of dot size and pitch. For the duration of the study the test
surfaces will be referred to as 75-250, 75-500, 75-750, 75-1000, 150-500, 200-500, 300-
500 to indicate dot size value-pitch value. Parameters were set by creating a simple 4-dot
array then repeating the pattern in the x and y print direction for the length and width of
the substrate. Due to nozzle size and spacing, for larger dot sizes, drop-spacing and print
head angle needed to be adjusted to complete the array (Fig. 3.7). Two layers of printing
were completed for each test.

27
Table 3.1 Hydrophobic area percentage for different test configurations
Figure 3.7: Example of pattern array design and drop spacing adjustment to
compensate for dot size
Fig. 3.8 shows an overview of the hydrophobic patterned dot array, summarizing
the topics in the preceding four sections.
Dot size (µm) Pitch (µm)
Hydrophobic
Surface Area
(%)
75 500 1.8
150 500 7.1
200 500 12.6
300 500 28.3
75 250 7.07
75 750 0.79
75 1000 0.44

28
Figure 3.8: Schematic diagram of inkjet printing for fabricating hydrophobic dot arrays

29
3.4 Characterization
Test surfaces were characterized with static contact angle measurement-sessile
drop method (FTA 137) and scanning electron microscopy. 2 µl drops were used to
measure contact angle with an average of 5 different areas of the surface tested. Wettability
contrast was about 90 °. The contact angles of each region are determined by their chemical
and physical properties.
The morphology of bi-functional surfaces was characterized by scanning electron
microscope (SEM, Quanta 600 FEI). Fig. 3.9 shows SEM images of the 150-500 surface
with ZnO nanoflower structure and polymer dot hole that remained, due to wettability
contrast when depositing the aqueous solution.
Figure 3.9d) shows the surface resembles a small crater surrounded by a forest of
ZnO. Thus the name “crater-forest” structure was given to the new type of surface. Its
structure suggested that since the hydrophobic “crater” is at a lower level than the
hydrophilic wicking “forest”, these surfaces would enhance pool boiling more than just a
hydrophobic-hydrophilic surface with each region at the same level. Due to the level and
structure difference, “downhill” pumping through capillary wicking action should occur
and provide heightened rewetting compared to just a ZnO nanoflower surface, with no
designated nucleation site.

30
Figure 3.9: Bi-functional surface distinct regions, SEM images of a) Dense ZnO
nanoflower b) 150-500 surface c) plain fluoropolymer dot d) cross-sectional area
between ZnO “forest” and dot “crater” e) static contact angles overlaying
micrograph, showcasing wettability and structural contrast interface.
SEM micrographs for the 7 test surfaces are shown in Fig. 3.10 with dot close-up
inset for b)-h). The dots patterned on bare glass appear spherical, uniform across the
measured area and well-formed. Slight horizontal lines can be seen on the test surfaces of
stainless steel. These lapping lines are inherent in the starting surface and have an effect on
ink spreading prior to the curing step (Fig. 3.8). Thus, the dots are somewhat distorted for
some regions and some of the surfaces have more distortion than others.

31
Figure 3.10. Micrographs of (a) polymer dot arrays on glass and bi-functional
surfaces (b) 75-500 m, (c) 150-500 m, (d) 200-500 m, (e) 300-500 m, (f) 75-250
m, (g) 75-750 m, and (h) 75-1000 m. (scale bar = 1000 m and 50 m (inset)).
3.5 References
1. Hendricks, T. J., Krishnan, S., Choi, C., Chang, C.-H. & Paul, B. Enhancement of
pool-boiling heat transfer using nanostructured surfaces on aluminum and copper.
Int. J. Heat Mass Transf. 53, 3357–3365 (2010).
2. Choi, C.-H., Su, Y.-W. & Chang, C. Effects of fluid flow on the growth and
assembly of ZnO nanocrystals in a continuous flow microreactor. CrystEngComm
15, 3326 (2013).
3. Choi, C.-H. & Chang, C. Aqueous Synthesis of Tailored ZnO Nanocrystals,
Nanocrystal Assemblies, and Nanostructured Films by Physical Means Enabled by
a Continuous Flow Microreactor. Cryst. Growth Des. 14, 4759–4767 (2014).
4. Newby, C., Lee, J.-K. & Ober, C. K. Inkjet printing of fluorinated materials and
their application to patterning organic semiconductors. J. Mater. Chem. C 1, 5647
(2013).

32
4 Bubble Dynamics on Printed Bi-Functional Surfaces
Bubble nucleation control, growth and departure dynamics are important in
understanding boiling phenomena. Preliminary studies with one 75-500 µm bi-functional
surface showed controlled bubble nucleation potential. Utilizing knowledge of mixed
wettability surfaces, seven surfaces discussed in the previous chapter were designed and
fabricated. The study discussed works towards an understanding of nucleate boiling bubble
dynamics on bi-functional “crater-forest” surfaces.
A well-designed configuration can allow for an ideal amount of bubble nucleation,
growth, release and vapor-liquid boundary-layer mixing. Dot sizes were varied from 75
m to 300 m in diameter with a constant pitch value of 500 m. Pitches were varied from
250 m to 1000 m, with a constant dot size of 75 m diameter (see Ch. 3). The surface
configurations were designed so that sufficient vapor traps were present to initiate
nucleation in the polymer “craters”. The craters are at a lower level than the field of
hydrophilic ZnO nanostructures (or forest). The porous ZnO nanostructure provides the
channeling power to amplify capillary action 1.
The uniqueness of this design lies in the fact that the vapor-generation site is at a
lower level than the hydrophilic structures, so wicking is enhanced more than in a
configuration with a hydrophobic site at the same level as the wicking structures. In
addition, the volume of replenished fluid can be increased in the crater-forest configuration,
increasing the magnitude of the capillary wicking force. In this study, the performance of
the crater-forest configuration in a simple boiling test was demonstrated to significantly
alter bubble merging at a heated surface.
4.1 Test Procedure
To visually evaluate the bubble nucleation and dynamics, simple boiling tests were
conducted. Each surface was secured onto a glass container by pasting a high temperature
silicone rubber sealant around the surfaces. D.I. water was used as a working fluid and was

33
degassed by boiling the water for 2 hours. The degassed water was poured inside the glass
container and the container was placed on a hot plate, shown in Fig. 4.1.
Figure 4.1. Simple boiling test for bubble dynamics observations on bi-functional
surfaces
The heat flux supplied to the boiling surface was controlled by a hot plate and
measured with a thermocouple touching the bottom of the glass beaker. Video recordings
and observations were made at thermocouple readings of 80 °C (heat flux I), 90 °C (heat
flux II) and 100 °C (heat flux III). The boiling processes from bubble nucleation to bringing
the whole beaker to a boil were captured by a HD video camera.
The approach taken to analyze bubble dynamics involved quantification of the
frequency of bubble release from viewing the boiling videos. Thus far, a study showcasing
individual site control along with associated release frequency has not been reported.
Quantification of each site’s release can also allow one to make a more accurate
comparison with the dot and pitch affects. An analysis was conducted to record the time
from observable nucleation to lift-off on areas of the surface that represented the general
dynamics well. Some of the tested surfaces showed obvious irregular nucleation and

34
hydrodynamics, so the best representative area was analyzed and is mentioned in the
figures below. Frame-by-frame analysis was done in Windows Live Movie Maker so that
time stamps of formation and departure could be obtained by viewing individual bubbles.
The time of departure was subtracted from the time of observable formation to obtain the
frequency of release in bubbles/s (or Hz). The analysis was done on different coordinates
of the boiling surface in order to determine average and standard deviation for each surface.
Qualitative accounts of relative merging could also be made from the visualization test.
4.2 Bubble Dynamics Observations of Bi-functional Surfaces
The results of the release frequency at water temperatures of 100 °C are shown in
Fig. 4.2, with the highest release frequency occurring on 75-750 µm. The following
discussion serves to explain the quantitative and qualitative observations.
Figure 4.2: Bubble release frequency of major sites on bi-functional surfaces
4.2.1 Pitch Variation in Subcooled Water
Bubble dynamics studies can provide valuable insight into two-phase convective
heat transfer at the vapor-liquid-surface interface. Bi-functional surfaces showed
significant bubble nucleation and discernible bubble dynamic differences due to the
changing interface. Fig. 4.3 shows the results from the pitch variation. For the surface of

35
250 µm and 1000 m pitch (b and e), irregular bubbles formed in random locations on each
surface. The formation of the irregular bubbles originated from ZnO nanostructures with
dual micro and nanopores that trap air inside its surface1. On the contrary, the 500 and 750
µm surfaces were covered with dense bubble arrays formed in a uniform and regular
distribution (c and d). These results also indicate that nucleated bubble size can be tailored
by varying the pitch value with a given dot size and that all enhanced surface show an
improvement compared to a bare surface (a).
Assuming that the bubble nucleation originates from the interface between the
polymer dot and the ZnO nanostructures, the pitch should affect the bubble growth and
consequently the size of the formed bubble 1,2. Based on the results of bubble dynamics at
heat flux I, it was concluded that the ratio of surface tension should be optimized in order
to induce uniformly-distributed and isolated bubble nucleation. Nam et al. reported that
nucleation sites must occur in the appropriate number and dimension for hydrophobic
islands 3. If one function dominates the other, the formation of the regular bubble
nucleation would cease to occur.
Figure 4.3: Images of bubble nucleation in subcooled water at 80 °C for a) bare, b)
75-250 µm c) 75-500 µm d) 75-750 µm and e) 75-1000 µm. Scale bar =1 cm

36
4.2.2 Pitch Variation in Boiling Water
Higher heat flux (heat flux III) was continually supplied to boiling surfaces to
examine boiling bubble dynamics. It turned out that the surfaces of 250 and 1000 m create
a few bubbles with irregular bubble release frequency even at the saturation temperature.
The 1000 m pitch showed nearly no nucleation due to surface flooding caused by
hydrophilic overload. The result from 75-250 is shown in Fig. 4.4. Circled sites were used
to measure release.
.
Figure 4.4: Image of bubble nucleation on a 75-250 µm (smallest dot size and pitch)
surface at water temperature of 100 °C. Scale bar = 1 cm
Fig. 4.5 displays the bubble dynamics of the 500 µm surface, which showed regular
and isolated bubble nucleation at heat flux I. Fig. 4.6 shows the result from the 750 µm
pitch. Both these surfaces exhibited similar morphologies and dynamics in subcooled water
(Fig. 4.3c) and d)). The boiling bubble dynamics for these surfaces at the elevated heat flux
are obviously different. The 500 µm pitch surface exhibited uneven bubble dynamics over
the surface.

37
Figure 4.5: Images of bubble growth and release on a 75-500 µm surface at water
temperature of 100 °C. Scale bar = 1 cm.
The size evolution progresses from observable nucleation (yellow box) to massive
bubbles, followed by lift-off. The bubble diameter also varied across the surface.
Furthermore, bubble merging took place as the bubbles grew larger, and the merging
pattern varied across the surface.
Figure 4.6: Image of controlled bubble array nucleation on a 75-750 µm surface at
water temperature of 100 °C. Scale bar = 1 cm
The 750 µm pitch surface appeared to have uniform bubble nucleation and bubble
diameter as well even at the elevated heat flux. A noteworthy difference was the larger
bubble size and much faster rate of release, as expected at higher temperature. The lift-off
rate was estimated to be around 4.5 Hz which is two times faster than that of 500 µm pitch,
most likely due to their low density and high capillary action from the supporting forest
structures. The different boiling dynamics between 500 and 750 µm pitch surfaces
indicates the pitch effect on the bubble coalescence. At the smaller pitch of 500 µm, the

38
bubbles nucleated at low superheat have a higher chance to combine with the neighboring
bubbles as the nucleated bubbles grow at increased super heat. At the 750 µm pitch, on the
other hand, the pitch is distant enough so that the bubbles do not contact the neighboring
bubbles, resulting in separate bubbles forming even at the high superheat 4. The key
observation noted from the pitch variation test was that the 75-750 µm surface provided
the best control of bubble size with relatively less merging than other configurations, and
relatively faster rate of release per site.
4.2.3 Size Variation in Subcooled Water
Polymer dot diameter variation also led to fascinating results. It was expected that
larger hydrophobic craters should lead to larger bubble diameters 5,6. This is evidenced
from the observation of bubble nucleation shown in Fig. 4.7 b)-d).
Figure 4.7: Bubble nucleation at water temperature of 80 °C on varied dot sizes
a)75-500 µm, b) 150-500 µm, c) 200-500 µm and d) 300-500 µm. Scale bar = 1 cm

39
For the dot sizes of 75 µm and 150 µm, the nucleation of smaller bubbles was
observed at heat flux I while larger bubbles were nucleated at heat flux II for 200 µm and
300 µm dot size. It was found that as bubble size becomes larger upon the dot size, the
bubble nucleation is delayed and requires higher heat flux. This is due to the fact that a
higher superheat is required to activate nucleation of the larger hydrophobic area, compared
to smaller ones. An advancing liquid front would not wet the hydrophobic crater so the
liquid would travel over the crater, thereby trapping the gas within the crater (vapor
entrapment) to create a liquid-gas interface 6. Therefore, when larger crater sizes are used,
the liquid-gas interfacial area increases. The enlarged interfacial area requires more
superheat for activation, thereby resulting in observable bubble nucleation at heat flux II
instead of I, for the larger crater configurations. Once nucleation is initiated and the contact
line is activated, the larger interfacial area causes larger bubbles to be formed, as shown in
the Fig. 4.7. Similar results were reported from the correlation between cavity size and
bubble diameter reported by Vafaei and Wen, who observed an increasing bubble volume
with increase in radius of curvature 5.
One might expect larger hydrophobic areas to have more trapped air, larger radii of
curvature, and hence nucleate bubbles at earlier times. The best defense for the result
requiring higher superheats is that the lower superheat argument is valid for a pure
hydrophobic surface. On a hydrophobic surface a large amount of bubbles would be
generated at relatively lower superheats than a bare surface. The results do not show a large
amount of small bubbles, but larger bubble sizes that apparently took more heat to nucleate.
The phenomenon might be unique for this type of bi-functional surface, where the
surrounding hydrophilic area plays a role in bubble formation. The interface formed on a
dot requires a large stable bubble, about the size of the dot, to be formed. The relatively
fewer and larger bubbles that were witnessed as dot size was increased is in accordance
with boiling theory regarding radii of curvature increase.

40
4.2.4 Size Variation in Boiling Water
At heat flux III, the 150-500 µm surface configuration promoted growth of a single
major bubble (Fig. 4.8a), with the highest observable diameter seen in the current study,
and a relatively high release frequency (Fig. 4.2). It appears that nucleation and growth
occurred instantaneously (<0.1 s) once the bubble departed, and is unobservable to the
naked eye. From the frame-by-frame analysis, a few flattened bubbles and extreme
merging phenomena are observed. The flattened bubble shape is caused by the merging of
many active sites, and is much different than the bubble morphologies shown from other
configurations with larger dot sizes.
Figure 4.8: Images of unique trend for large dot size variation at 100 °C water
temperature on a) 150-500 surface showing large single flattened bubble with
relatively higher release frequency than b) 200-500 surface with 5 major sites and c)
300-500 surface with 7 major sites
It was found that the massive merging and flattened bubble shape only took place on the
150-500 µm surface. This massive merging spectacle did not occur as the dot size was
increased further to 200 µm.

41
The 200 µm dot size configuration had 5 major bubble sites (Fig. 4.8b) and the sites
stayed separate without merging into one giant bubble as seen in Fig. 4.8a. A further
increase in the hydrophobic dot size to 300 µm increased the number of major bubble sites
from the 200 µm dot case (Fig. 4.8c). The number of major sites increased to more than 6,
from 5 major sites seen with 200 µm. Potential explanations regarding the gigantic single
bubble formation on the 150-500 µm surface are proposed.
Once higher heat flux is supplied to the wall, all the cavities are activated generating
bubbles, and subsequently bubbles begin to merge. The merging motion is driven by the
surface energy difference acting on bubbles and resulting hot and cold spots of vapor and
liquid regions. The bubbles sitting on the hydrophilic areas tend to move toward the
hydrophobic areas, which have a lower surface energy, thereby resulting in the larger
bubble formation. In their investigation of copper nanopores, Li et al. determined that
nanobubble percolation through an interconnected network of nanopores led to the stable
nucleation of larger bubbles 7. Hsu et al. also observed the bubble migration driven by the
surface energy difference from a boiling surface with interlaced wettability8. In addition to
surface energy driven merging, it is postulated that lateral merging would be promoted
from the wicking action that could transport the nucleated bubbles during the
replenishment of liquid. The capillary wicking also plays an important role in releasing the
single large bubble with relatively high frequency by forming an interconnected network
to replenish liquid.
Observations suggest a network promptly channels liquid to remove the vapor on
the localized growth site, as well as plays a role in the merging of many bubbles. The
replenishment allows for even more liquid that arrives on the major site to undergo phase
change to vapor. A similar network formation was discussed in Gong et al., who stated that
a network channeled liquid under the coalesced bubble to replenish the liquid layer beneath
it 9,10. These combined effects could explain why the merging and growth occurred so
quickly. It is also conjectured that this interconnected network is formed from the optimal
pitch and dot size configuration of the 150-500 µm surface. The phenomenon is also
supported by the difference in bubble dynamics seen on a surface with only polymer dots

42
printed with the 150-500 µm configuration, compared to a bi-functional 150-500 µm
configuration surface shown in Fig. 4.9 b and c. The surface with only the polymer printing
pattern shows separate sites, whereas the bi-functional structure shows the single relatively
large bubble.
Figure 4.9: Summary of ZnO wicking effect on lateral bubble merging with
associated bubble nucleation dynamics and morphology for (a) ZnO film (b) Printed
150–500 μm array polymer pattern without ZnO matrix (c) Bi-functional 150–
500 μm and (d) Bi-functional 300–500 μm
For the crater configurations higher than 150 m dot size, the widespread network
channeling did not appear due to a decrease in mixing action. The binding force threshold
must be overcome to move each bubble sitting in a crater from increased motion through
the hydrophilic wicking structure. As the crater size is increased, it is expected that larger
bubbles with associated larger vapor pressure require a higher force to move them for
mixing. Consequently, the liquid flow is insufficient to flush the area and cause the bubbles

43
to merge as efficiently in cases with 200 µm dot size and above. Accordingly, a decline in
merging was observed as the crater size was increased (Fig. 4.8 b and c). In addition, the
decreased release frequency of larger crater sizes also evidences the weakened wicking
force with an increase of the crater size. A similar result was reported by Nimkar et al.,
who observed that their surface with the highest number of cavities for nucleation
performed worse than even a plain surface due to the prevention of boundary layer
mixing11. The interfacial contact between each functional region impacts the boundary
layer mixing and therefore impacts the bubble diameter and frequency. Bi et al. stated that
stronger bubble motion would promote faster coalescence and quicker departure 4. It is
strongly believed that the crater-forest downhill flow configuration would significantly
alter the bubble mixing action.
In order to highlight the important role of a proper hydrophilic and hydrophobic
combination for the controlled bubble dynamics, boiling surfaces with 150-500 µm
polymer dots and hydrophilic ZnO nanostructured surfaces were tested (Fig. 4.8).
The polymer dot-alone configuration had less merging, smaller bubble diameters,
and considerably noticeable slower rate of release at the elevated heat flux, indicating the
critical role of capillary wicking provided from the hydrophilic ZnO nanostructures.
Insufficient wickability of the surface hinders bubble coalescence and leads to irreversible
dry patches that lower the CHF12. Therefore, good wicking structures can make the flushing
process more reversible even when a massive bubble site is formed so that a denser bubble
can be released faster. For the hydrophilic ZnO nanostructured surface, only a few bubbles
were activated at the saturation temperature, clearly indicating that hydrophobic dots serve
as major bubble nucleation sites.
4.3 Summary of Bubble Dynamics
As mentioned above, bubble release frequency results from viewing the boiling
videos is represented in Fig. 4.2 for the dot size variation at constant pitch, and for the pitch
variation at constant dot size. Bubble release frequency is known to be directly related to
the efficiency of capillary pumping, or wickability 13,14. This is due to the enhanced lift-off

44
effect of bubbles when water is pumped to the active site, thereby re-wetting it promptly.
To prevent vapor dry-out and increase the CHF, re-wetting properties (releasing bubbles
faster) are desirable. Faster release also means that relatively more phase change occurs,
so the HTC should also increase due to increased energy transfer from the latent heat of
vaporization. The denser bubble from the 150 µm dot size test had a higher release than
the less dense bubbles formed from the 200 and 300 µm dot size tests. Overall, the largest
bubble morphology also had the second highest release frequency, which is unique to the
bi-functional surface. Such a result contradicts the result by Phan et al., who reported
higher emission frequency occurring at lower departure diameters 15.
The largest recorded rate of release was 4.5 Hz, for the 75-750 µm surface. It was
also noted above that this configuration had the best control of bubble diameter and
uniformity across the surface at both heat flux I and III. The lowest rate occurred on the
75-1000 µm surface at 0 Hz because nearly no nucleation was observed. This is because
for almost perfectly wetting surfaces, there is a delay in incipience of vapor bubble 16. It
appears that for such a configuration the liquid spreads too quickly and floods the polymer
craters. The flooding movement of liquid throughout the forest structure impeded and
hindered nucleation potential. For a site to promote nucleation, there needs to be sufficient
enclosure17. This implies that the dot size of 75 µm is too small for a crater to provide
sufficient enclosure when juxtaposed with a dominant hydrophilic wicking forest. Thus,
for an overly hydrophilic surface, the crater enclosure needs to be larger (larger dot size)
to yield better nucleation performance.
4.4 Single Bubble Nucleation Site Control
In the preceding discussion regular bubble nucleation across a surface with an array
pattern has been demonstrated. To demonstrate exact location control of single bubble
nucleation with this process, two surfaces were fabricated with four-dot array patterns (200
µm-750 µm and 1000 µm-750 µm) to promote single bubble generation on each site, while
inhibiting nucleation on adjacent surface areas. To control single site bubble formation,
nucleation in surrounding areas must be suppressed. The porous ZnO structure is expected

45
to trap air, thereby promoting nucleation. To achieve limitation of air-trapping in
surrounding areas and force nucleation to a single site, a dense ZnO nanowire matrix was
grown around the hydrophobic array, according to the method previously reported by Choi
and Chang 18. Furthermore, a four dot array was required to stabilize a single bubble, along
with a second printing step following the ZnO deposition. The ZnO nanowire growth uses
the exact same processing steps discussed in Ch. 3, but with a reduction in flowrate to 6.8
ml/min instead of 14.6 ml/min, resulting in longer residence time The second printing step
was conducted to ensure that any minor amount of ZnO deposited on the dots, due to longer
deposition time, did not reduce the hydrophobicity of the site. Fig. 4.10a) shows the two
sites’ different printing patterns, b) shows the bubble nucleation at heat flux I, which differs
for each site due to dot size and c) depicts the scheme required for controlling a single
bubble location.
Figure 4.10 Controlled bubble nucleation site location. (a) Printing patterns (200-
750 µm-left and 1,000-750 µm-right). (b) Single bubble nucleation on patterns in a)
at heat flux I (scale bar = 1cm). (c) Scheme to control single bubble site, stabilized
by a four dot hydrophobic polymer dot array and dense ZnO nanowire matrix
At the elevated heat flux, each bubble’s base was roughly the size of the respective
four dot array, with an overall larger bubble size than the array pattern. These results
indicate that for controlling a single bubble on a large area surface, four printed dots are
needed for stabilization, a dense hydrophilic matrix helps suppress nucleation in the
surrounding region and a second printing step increases the hydrophobicity of the dot after
a longer ZnO deposition.

46
4.5 References
1. Hendricks, T. J., Krishnan, S., Choi, C., Chang, C.-H. & Paul, B. Enhancement of
pool-boiling heat transfer using nanostructured surfaces on aluminum and copper.
Int. J. Heat Mass Transf. 53, 3357–3365 (2010).
2. Mahamudur Rahman, M., Pollack, J. & McCarthy, M. Increasing Boiling Heat
Transfer using Low Conductivity Materials. Sci. Rep. 5, 13145 (2015).
3. Nam, Y. & Ju, Y. S. Bubble nucleation on hydrophobic islands provides evidence
to anomalously high contact angles of nanobubbles. Appl. Phys. Lett. 93, 2006–
2009 (2008).
4. Bi, J., Christopher, D. M., Lin, X. & Li, X. Effects of nucleation site arrangement
and spacing on bubble coalescence characteristics. Exp. Therm. Fluid Sci. 52, 116–
127 (2014).
5. Vafaei, S. & Wen, D. Spreading of triple line and dynamics of bubble growth
inside nanoparticle dispersions on top of a substrate plate. J. Colloid Interface Sci.
362, 285–291 (2011).
6. Carey, V. P. Liquid Vapor Phase Change Phenomena: An Introduction to the
Thermophysics of Vaporization and Condensation Processes in Heat Transfer
Equipment, Third Edition. (CRC Press, 2007).
7. Li, C. et al. Nanostructured copper interfaces for enhanced boiling. Small 4, 1084–
1088 (2008).
8. Hsu, C.-C., Su, T.-W. & Chen, P.-H. Pool boiling of nanoparticle-modified surface
with interlaced wettability. Nanoscale Res. Lett. 7, 259 (2012).
9. Gong, S., Ma, W. & Dinh, T. N. An experimental study of rupture dynamics of
evaporating liquid films on different heater surfaces. Int. J. Heat Mass Transf. 54,
1538–1547 (2011).
10. Gong, S., Ma, W. & Dinh, T. N. Simulation and validation of the dynamics of
liquid films evaporating on horizontal heater surfaces. Appl. Therm. Eng. 48, 486–
494 (2012).
11. Nimkar, N. D., Bhavnani, S. H. & Jaeger, R. C. Effect of nucleation site spacing
on the pool boiling characteristics of a structured surface. Int. J. Heat Mass Transf.
49, 2829–2839 (2006).
12. Chu, I. C., No, H. C. & Song, C. H. Visualization of boiling structure and critical
heat flux phenomenon for a narrow heating surface in a horizontal pool of
saturated water. Int. J. Heat Mass Transf. 62, 142–152 (2013).
13. Mccarthy, M. Role of Wickability on the Critical Heat Flux of Structured
Superhydrophilic Surfaces. (2014).
14. Jo, H., Kim, S., Kim, H., Kim, J. & Kim, M. Nucleate boiling performance on
nano/microstructures with different wetting surfaces. Nanoscale Res. Lett. 7, 242
(2012).
15. Phan, H. T., Caney, N., Marty, P., Colasson, S. & Gavillet, J. Surface wettability
control by nanocoating: The effects on pool boiling heat transfer and nucleation
mechanism. Int. J. Heat Mass Transf. 52, 5459–5471 (2009).
16. Shojaeian, M. & Koşar, A. Pool boiling and flow boiling on micro- and
nanostructured surfaces. Exp. Therm. Fluid Sci. 63, 45–73 (2015).
17. Cooke, D. & Kandlikar, S. G. Pool Boiling Heat Transfer and Bubble Dynamics

47
Over Plain and Enhanced Microchannels. J. Heat Transfer 133, 52902 (2011).
18. Choi, C.-H. & Chang, C. Aqueous Synthesis of Tailored ZnO Nanocrystals,
Nanocrystal Assemblies, and Nanostructured Films by Physical Means Enabled by
a Continuous Flow Microreactor. Cryst. Growth Des. 14, 4759–4767 (2014).

48
5 Pool Boiling System Design
Pool boiling tests are central to studying boiling heat transfer. Parameters needed
to construct boiling curves include flux and wall (or surface) temperature. Standardized
experimental testing is done with a stagnant pool of the test fluid, at its saturation
temperature, is in contact with a heated surface.
5.1 Pool Boiling Testing
The two methods utilized for testing surfaces include conduction and Joule heating.
In the conduction method a test boiling surface is secured between a copper heating block
and a pool of water. The copper block contains electrical heaters to introduce a high flux
to a surface. The flux is usually estimated with probing the temperatures at two or more
locations in the vertical direction of the copper tip, just beneath the surface to obtain the
temperature gradient. A permanent bonding or curing step at the heater-surface interface is
not required.
Figure 5.1: Typical conduction experimental boiling test
Alternatively, in the Joule heating method resistive heaters are bonded, usually by
soldering, to the backside of the metal test surface and the heat is directly input from a
power supply so that power input to the surface is accurately measured. Known power
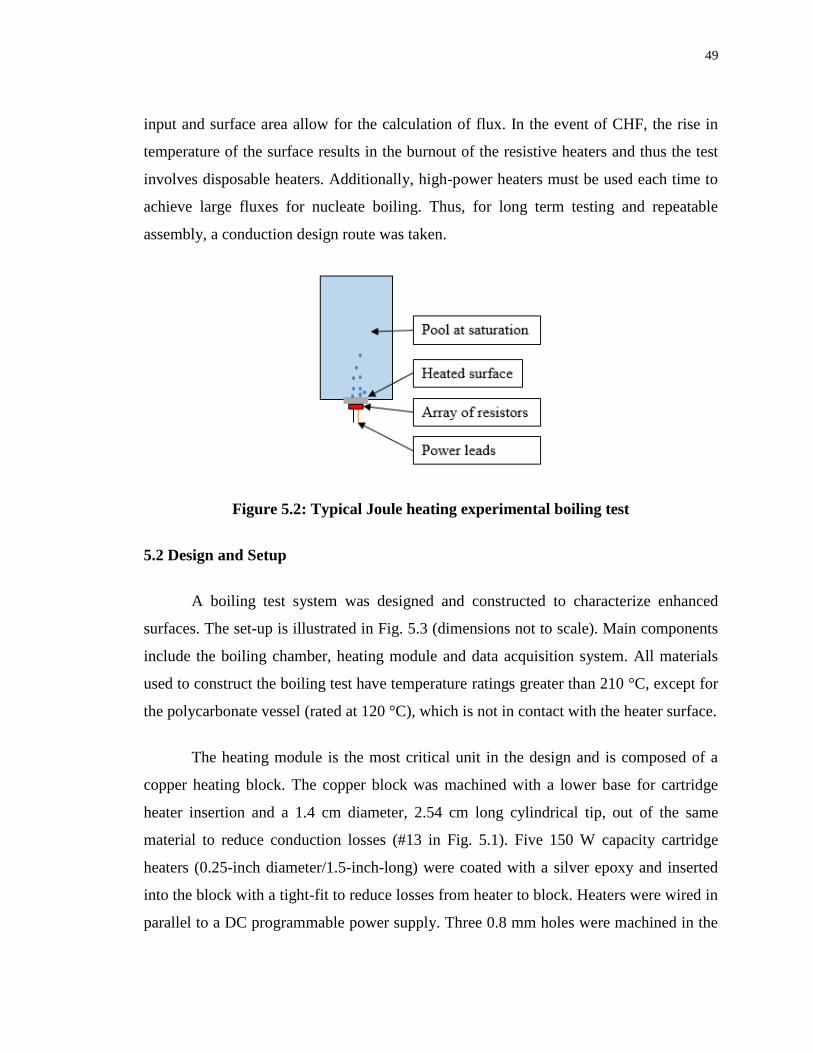
49
input and surface area allow for the calculation of flux. In the event of CHF, the rise in
temperature of the surface results in the burnout of the resistive heaters and thus the test
involves disposable heaters. Additionally, high-power heaters must be used each time to
achieve large fluxes for nucleate boiling. Thus, for long term testing and repeatable
assembly, a conduction design route was taken.
Figure 5.2: Typical Joule heating experimental boiling test
5.2 Design and Setup
A boiling test system was designed and constructed to characterize enhanced
surfaces. The set-up is illustrated in Fig. 5.3 (dimensions not to scale). Main components
include the boiling chamber, heating module and data acquisition system. All materials
used to construct the boiling test have temperature ratings greater than 210 °C, except for
the polycarbonate vessel (rated at 120 °C), which is not in contact with the heater surface.
The heating module is the most critical unit in the design and is composed of a
copper heating block. The copper block was machined with a lower base for cartridge
heater insertion and a 1.4 cm diameter, 2.54 cm long cylindrical tip, out of the same
material to reduce conduction losses (#13 in Fig. 5.1). Five 150 W capacity cartridge
heaters (0.25-inch diameter/1.5-inch-long) were coated with a silver epoxy and inserted
into the block with a tight-fit to reduce losses from heater to block. Heaters were wired in
parallel to a DC programmable power supply. Three 0.8 mm holes were machined in the

50
copper tip for inserting T-type thermocouples. T-type TCs were for their high sensitivity
to temperature measurements. It is worth noting that a close TC hole diameter (0.81 mm)
was required to accurately probe the temperature in the tip without introducing radial
losses. The TCs were coated with a thin layer of silver epoxy and permanently inserted so
that each TC tip met the center of the block. The three TCs- T1, T2 and T3 were equally
spaced 8 mm apart, with T1 located just 1 mm below the top of the copper tip (# 11 in Fig.
3.1).
Figure 5.3: Schematic of experimental boiling test system

51
Insulation material included packed mineral wool surrounding the copper block,
with a heater base plate made of ultra-high temperature PTFE (260 °C rating).
The setup was designed to allow for easy assembly and repeatable testing without
the need for bonding and curing test surfaces to the heater for sealing. A high temperature
PTFE test fixture (#7) was made to secure the test article to the copper heating block and
seal the test article with the boiling chamber. Permanent sealing was avoided with this type
of design. Another key design aspect was ensuring minimal thermal resistances were
present between the test surface (#8) and the heater. Insufficient interfacial sealing would
prevent all the heat from the copper tip to enter the surface and boiling pool and could
significantly skew results.
From the start of designing and testing, it was apparent that the surface would have
to be held down onto the heater with force. The upper test fixture was designed with four
stainless steel bolts inserted half-way into the material to be secured and tightened through
the bottom PTFE plate with winged nuts. The same tightening force is required for every
assembly to prevent variable contact resistance between tests. A thermally-conductive heat
paste compound (Antec Formula 7, k = 8.3 W/m-k) was used at the interface of heater to
test article, to ensure the interface has minimal losses.
A key contributor to assembly-related error is the contact resistance of the surface
to the copper block. To remedy this source of error, the same amount of thermal paste was
carefully applied evenly for each run. Since the stainless steel test object was sandwiched
and compressed between the PTFE fixture and the copper block, applying pressure
downwards on the fixture and variable forceful tightening of the seal bolts (# 10) can result
in bowing. If the test surface is not flat, the contact interface could have an air gap which
would significantly skew results due to the low thermal conductivity of air. Thus, only the
force of gravity was used when applying the fixture, and the bolts were tightened to the
same height for every run.
To seal the test surfaces to the boiling chamber, surfaces larger than the heating tip
were required. An extended surface is used to prevent edge nucleation at the o-ring seal.

52
Edge nucleation can skew boiling results 1. Additionally, extended surfaces ensure the
Viton o-ring doesn’t contact the heated tip. Test surfaces were 2.6 cm squares, 0.7 mm
thick 304 stainless steel square plates. Thinner plates result in bowing at high temperature
and warping with tightening onto the heater.
Water was used as the working fluid for its widespread usage in pool boiling studies
and safety. An overhead immersion cartridge heater was submerged into the boiling
chamber to keep the fluid at its saturation temperature throughout testing and for degassing
the system before the start of a test run. A K-type thermocouple (T4- # 4 in Fig. 5.3)
monitored bulk water temperature.
All TC and power input data was fed to a NI DAQ device, configured for logging
at a sampling rate of 1 sample/4 s. The rate was determined by trial-and-error to ensure
sufficient data for each flux input was taken. The total duration of testing was 2-3 hours. A
virtual instrument was created in LabView to visualize real-time data (shown in Fig. 5.4).
All data was logged in an Excel spreadsheet for subsequent data reduction and calculation
of flux.
Figure 5.4: Virtual instrument for monitoring temperature profiles

53
5.3 Test Procedure
Before commencing experiments, the water was degassed by boiling vigorously
while stirring for two hours, in a sealed bottle on a hot plate. Degassing is required for
boiling tests to ensure non-condensable gases in the working fluid do not affect bubble
nucleation and boiling heat transfer. The degassed water was then poured into the boiling
chamber after assembly of the test surface onto the heating block.
The whole system was enclosed in an insulation jacket to minimize losses from the
chamber and heating module. After the water reached 100 °C, the copper block heaters
were switched on to a low power setting to bring the block up to 100 °C. Once the whole
system was at 100 °C, it was left for 30 minutes to degas the walls of the chamber and
upper test fixture. At the start of the experiment, noticeable bubbles from trapped air in the
wall and fixture surfaces are present.
The top polycarbonate plate through which the overhead immersion heater was
placed, had several holes drilled into it to prevent pressure buildup and ensure the boiling
took place at atmospheric pressure. Additionally, it only covered half of the top of the
boiling chamber to allow vapor to escape.
Once the whole system is at thermal equilibrium for 30 minutes, the experiment is
started with applying a power input to the 5 embedded cartridge heaters. The system is left
to ramp up to steady-state temperature readings and then higher power is applied. The
process is repeated until CHF is reached. The CHF phenomenon is accompanied by a
sudden increase in temperature. When CHF is reached the main heater is switched off.
5.4 Preliminary Testing
A preliminary study was done to solidify the testing procedure and analyze losses
from the cartridge heaters to the test surface. A bare stainless steel plate (2.6 cm x 2.6 cm,
0.7 mm thick) was tested in a saturated boiling experiment and at low powers (8-10 W),
the percentage difference between applied and calculated flux (from temperature gradient)

54
are significant. Table 5.1 shows that calculated fluxes from the measured temperature
gradient varies as flux is increased. The theoretical flux reported is the power supply
reading normalized to the copper tip area
Table 5.1 Percentage difference for applied and calculated flux
Power
(W) Theoretical Flux (kW/m2)
Calculated Flux
(kW/m2) % Difference
8.4 54.57 19.72 63.87
12 77.95 51.55 33.87
15.3 99.39 74.47 25.07
31.2 20.27 19.75 2.56
A reason for the percentage difference between theoretical and calculated flux is
that stainless steel has a relatively low thermal conductivity (16.5 W/m-K compared to 400
W/m-K for copper). For higher thermally-conductive materials, the heat transfer
performance due to conduction at low fluxes improves. Another reason is that the lowest
applied fluxes are during the natural convection region and start of nucleate boiling. Once
partial nucleate boiling starts, boiling heat transfer is two orders of magnitude larger than
conduction and convection losses to the environment and upper test fixture, so it becomes
the dominant mode of heat transfer. The losses are still present but relatively small
compared to boiling heat transfer.
Another part of the preliminary study was to assess whether the heat transfer in the
copper tip is in fact 1D and unidirectional from cartridge heaters to the boiling pool. The
goal of the test is to quantify flux with Fourier’s Law, which assumes 1D unidirectional
heat transfer at steady-state. If the condition is met, then the slope of the temperature profile
using T1, T2 and T3 can be used to calculate the temperature gradient. 1D heat transfer can
be assumed because the copper block is packed with 76 mm of insulation. Due to the low
thermal conductivity of surrounding radial materials (0.3 W/m-K for mineral wool) and
relatively high thermal conductivity of copper (four orders of magnitude higher than
surrounding), radial losses can be neglected. Losses out of the backside of the heaters and
through the upper PTFE fixture could affect the heat transfer. Temperature profiles for a
bare stainless steel plate test run are shown in Fig. 5.5, with T3 at a position of 0 mm.

55
Figure 5.5: Temperature profiles in copper tip for bare plate at start, middle and
end of a test run
The first observation to note is that as flux is increased from the start to end of a
run, the profile becomes more linear. At the start of the boiling test, the pool is held at
saturation temperature and until the heater surface is above 100 °C, the net flow of heat in
the vertical axial direction will not occur. When the first steady-state condition is achieved
at low flux, it can be seen that T2 reads a value closer to T3, rather than a value directly in
the middle of T1 and T3 (R² = 0.9695 < .99). This is evidence that the 1D heat flow is not
locally unidirectional at low flux. However, there is a net flow of unidirectional heat flow
from T1 to T3, so only these two readings will be used to calculate the net gradient to the
surface.
The work by Cooke and Kandlikar and Gheitaghy et al. was conducted in a similar
manner but with copper chip experiments 2,3. These authors reported linear (R² > 0.999)
profiles even at the start of testing. Thus, the main reason for localized backflow of heat to
the cartridge heaters is due to the relatively low thermal conductivity of stainless steel
substrates, compared to copper chips. The plates may be acting as an insulator to the copper
tip at the start of the experiment thereby preventing some heat leaving the cartridge heaters
R² = 0.9695
R² = 0.9965
R² = 0.9985
110
120
130
140
150
0 5 10 15
Tem
per
atu
re (
°C)
Thermocouple Position (mm)
Start
Middle
End

56
from entering the boiling pool. In another study, only two positions in the block were
probed to measure flux 4. The three-position probing is a more robust design and future
work will be carried out with conductive chips (such as copper substrates) to test heat loss
to the boiling pool. This will confirm if the test substrate’s thermal conductivity affects the
heat flow at the start of the run.
Another condition assessed in the preliminary study was the steady-state condition.
Due to long ramping periods, steady-state was assumed when the variation in temperature
readings was less than 0.1 °C/min (their uncertainty). Once the temperatures stopped
increasing by more than 0.1 °C over a period of one minute, the next highest flux was
applied.
5.5 Data Reduction
The experimental parameters of heat flux, wall temperature and heat transfer
coefficient were calculated using the two thermocouple readings (T1 and T3) when the
system reached steady-state. An average of the steady-state temperature readings was taken
and post-processed to construct boiling curves. The data reduction is as follows:
(Equation 5.1)
𝑞" = 𝑘 ×𝑇3 − 𝑇1
2∆𝑥
Spacing, ∆𝑥 was previously defined as 8 mm. Next, a close-up of the heater-test
article assembly is shown in Fig. 5.6, along with the 1D heat transfer thermal analogy.
Figure 5.6: PTFE fixture close-up with test article and equivalent thermal circuit

57
A thermally-conductive heat sink paste was applied consistently for each test to
secure each test article to the copper block. The paste is stable within the operating range
of tests < 150 °C at the interface. The closest thermocouple reading to the test surface is
T1, and using an assumption of 1D conduction the temperature drop from T1 to the boiling
surface can be calculated with the resistances across the tip of the copper block, thermal
paste and substrate thickness. The losses can be described from equation 5.2.
(Equation 5.2)
∆𝑇𝑙𝑜𝑠𝑠 = −𝑞" × 𝑡𝐶𝑢 𝑡𝑖𝑝
𝑘𝐶𝑢−
𝑞" × 𝑡𝑆𝑢𝑏
𝑘𝑆𝑢𝑏.−
𝑞" × 𝑡𝑖𝑛𝑡𝑒𝑟𝑓𝑎𝑐𝑒
𝑘𝑃𝑎𝑠𝑡𝑒
However, the thermal conductivities of copper and stainless steel vary with
temperature over the operating range of experiment. Copper block temperatures start at
100 °C and get as high as 200 °C. Thus, equation 5.2 should be modified to first calculate
the thermal conductivity of the copper tip. Fig. 5.7 shows the variation of thermal
conductivity with temperature for copper and 304 stainless steel. The values were found in
lookup tables and ASME standards.
The best-fit equation in Fig. 5.7-a was used to calculate the value of 𝑘𝐶𝑢 from the
average of T1-T3.
(Equation 5.3)
∆𝑇𝑙𝑜𝑠𝑠1 = −𝑞" × 𝑡𝐶𝑢 𝑡𝑖𝑝
(−5 × 10)−5 × (𝑇1 + 𝑇2 + 𝑇3
3 )2 − .0025 × (𝑇1 + 𝑇2 + 𝑇3
3 ) + 401.09

58
Figure 5.7: Thermal conductivity best-fit relation versus temperature for a) copper
and b) 304 stainless steel
The temperature drop across the thermal paste could then be calculated from:
(Equation 5.4)
∆𝑇𝑙𝑜𝑠𝑠2 = 𝑇1 − ∆𝑇𝑙𝑜𝑠𝑠1 − 𝑞" × 𝑡𝑖𝑛𝑡𝑒𝑟𝑓𝑎𝑐𝑒
𝑘𝑃𝑎𝑠𝑡𝑒
Next the temperature below the stainless steel plate, T0, was found from equation
5.5:
(Equation 5.5)
𝑇0 = 𝑇1 − ∆𝑇𝑙𝑜𝑠𝑠1 − ∆𝑇𝑙𝑜𝑠𝑠2

59
Finally,
(Equation 5.6)
∆𝑇𝑙𝑜𝑠𝑠3 =𝑞" × 𝑡𝑆𝑢𝑏
. 0133 × (𝑇0) + 14.875
Accounting for the thermal losses, the wall temperature was found from equation
5.7.
(Equation 5.7)
𝑇𝑤 = 𝑇1 − ∆𝑇𝑙𝑜𝑠𝑠1 − ∆𝑇𝑙𝑜𝑠𝑠2 − ∆𝑇𝑙𝑜𝑠𝑠3
In the experimental test of coated surfaces, enhanced surface coatings should not
affect wall temperature calculations due to their micron-scale thickness. The wall superheat
and heat transfer coefficient were calculated from equations 5.8 and 5.9.
Equation (5.8)
∆𝑇 = 𝑇𝑤−𝑇𝑆𝑎𝑡
Using Newton’s Law of Cooling,
Equation (5.9)
ℎ =𝑞"
∆𝑇
5.6 Error Analysis
The goal of conducting an error analysis is to quantify the uncertainty of the
experimental results of flux and wall temperature over the range of operating temperatures
in the experiment. From the analysis, the percentage error of the final value can be deemed
significant or not.

60
In the experiment there are two types of errors- systematic and random. Systematic
errors are due to setup and assembly variations between runs. Preliminary testing revealed
that systematic errors were minimal when the same bare stainless steel plate was run.
Consistent assembly each time limits the variation between runs. A key contributor to
assembly-related error is the contact resistance of the surface to the copper block. The
contact resistance is also estimated for calculations with an assumed thermal paste interface
thickness. Its value can be more accurately measured with a customized test plate
containing a TC hole machined to the center, in order to see the actual temperature
difference between T1 and the test plate.
A bare surface was tested and the following boiling curves were obtained for two
runs with different ramping schemes (Fig. 5.8). Results show that the test is robust to
ramping increments, since run 2 had bigger jumps in incremental flux and fewer data
points, but the same trend, which overlaps run 1 nicely. The bare surface had a CHF of
25.6 W/cm2; a further increase in flux led to temperature ramping in the block.
Figure 5.8: Boiling curve for bare stainless steel, run twice at different ramping
0
5
10
15
20
25
30
0 5 10 15 20 25 30
Hea
t Fl
ux
(W/c
m2)
Wall Superheat [ΔT ( °C)]
Run 1
Run 2

61
Random errors are unavoidable due to the uncertainty of primary measurements
used in calculations. The major source of uncertainty comes from thermocouple readings,
because they are used to calculate both flux and wall temperature. For the gradient
calculation T1 and T3 values are used. Other sources with uncertainty are the position of
TCs, which depended on the machining precision, and thickness of the substrate (tolerance
from the parts’ manufacturer). Table 5.2 shows all sources and their associated uncertainty.
Table 5.2: Parameter measurements and uncertainties
Parameter Uncertainty
Temperature Measurements, T (°C)
T1 ± 0.1
T2 ± 0.1
T3 ± 0.1
Lengths (mm)
Δx ± 0.0254
tSub ± 0.035
Even though the resolution of the values is small, errors become propagated
throughout calculations. The method of Kline and McClintock, 1953, is commonly used
for uncertainty analyses 5. For this method, it is assumed that each variable is independent
and normally distributed. The general form is as follows for any measured parameter “a”.
(Equation 5.10)
𝜔𝑎 = √∑ ( 𝜕𝑎
𝜕𝑧𝑖× 𝜔𝑧𝑖
)2𝑚
𝑖=1
Taking the partial derivatives of equation 5.1, the uncertainty can be calculated
from equation 5.11.

62
(Equation 5.11)
𝜔𝑞" = √(𝑘(𝑇3 − 𝑇1)
4∆𝑥2𝜔∆𝑥)
2
+ (𝑘
2∆𝑥𝜔𝑇3
)2
+ (𝑘
2∆𝑥𝜔𝑇1
)2
Taking the partial derivatives of equation 5.2, the wall temperature uncertainty is
given by,
𝜔𝑇𝑤 = √((𝑡𝐶𝑢
𝑘𝐶𝑢+
𝑡𝑆𝑢𝑏
𝑘𝑆𝑢𝑏+
𝑡𝐼𝑛𝑡
𝑘𝑝𝑎𝑠𝑡𝑒) 𝜔𝑞")
2
+ (𝑞"
𝑘𝐶𝑢 𝜔𝑡𝐶𝑢
)2
+ (𝑞"
𝑘𝑆𝑢𝑏 𝜔𝑡𝑆𝑢𝑏
)2
+ ( 𝜔𝑇1)
2
Results for uncertainty at low and high flux are shown in Fig. 5.9. For the major
part of the nucleate boiling regime, uncertainty in flux remains below 10%.
Figure 5.9: Uncertainty analysis for wall temperature and flux of a bare surface
5.7 References
1. Ahn, H. S., Kim, J. & Kim, M. H. Investigation of Pool Boiling Critical Heat Flux
Enhancement on a Modified Surface Through the Dynamic Wetting of Water

63
Droplets. J. Heat Transfer 134, 71504 (2012).
2. Cooke, D. Experimental study of pool boiling heat transfer enhancement over
microchanneled surfaces. (Rochester Institute of Technology, 2011).
3. Gheitaghy, A. M., Saffari, H. & Mohebbi, M. Investigation pool boiling heat
transfer in U-shaped mesochannel with electrodeposited porous coating. Exp.
Therm. Fluid Sci. 76, 87–97 (2016).
4. Dharmendra, M., Suresh, S., Kumar, C. S. S. & Yang, Q. Pool boiling heat transfer
enhancement using vertically aligned carbon nanotube coatings on a copper
substrate. Appl. Therm. Eng. 99, 61–71 (2016).
5. Kline, S. . & McClintock, F. . Describing Uncertainties in Single-Sample
Experiments. Mech. Eng. 75, 3–8 (1953).

64
6 Nucleate Boiling Performance of Enhanced Surfaces
Using the newly-built system described in Ch.5, pool boiling experiments were
conducted on selected printed bi-functional surfaces. Surfaces were fabricated according
to the methods discussed in Ch. 3 on 2.6 cm x 2.6 cm, 0.7 mm thick 304 stainless steel
plates, which the pool boiling system was baselined for. For the enhanced surfaces tested
in Ch. 6, the coatings were applied to the center heated portion of the plate to compare
results. CHF was not reached for any of the enhanced surface tested. Only the bare stainless
steel surface reached CHF, as mentioned in Ch. 5. The lowest temperature (T3) reached
200 °C, which was a stopping criteria for the pool boiling experiment if CHF was not
reached. All surfaces enhanced the boiling performance and it is presumed that they were
about to reach CHF, from the shape of the HTC curves shown throughout 6.1-6.3.
6.1 Characterization of Select Samples from Bubble Dynamics Study
Since the 75-500 and 150-500 surfaces achieved the largest bubble sizes, along with
relatively high release frequencies, as quantified in Ch. 4, they were selected along with a
75-500 dot printing only, ZnO nanoflower and bare surface. Results of the 5 surfaces are
shown in Fig. 6.1.
Figure 6.1: Boiling curves for 4 enhanced surfaces compared to a bare plate

65
The bi-functional results were expected to enhance the ONB more than is shown.
An explanation for this could be that the 30-minute degassing procedure removed a
significant amount of the nucleation that was seen on bi-functional surfaces in Ch. 4 with
subcooled water. Additionally, the stainless steel plates used in this test differed from those
used previously. The one used in the subcooled study had a polished-finish. The surface
finish of the thicker plates was a glass-bead type, which could skew the trends between the
bi-functional surfaces. The enhancement generally takes off for all surfaces at a superheat
of 15 °C and it was expected that this phenomenon would occur at lower superheat.
Bi-functional surfaces enhanced HTC more than each individual region by itself.
In relation to the individual site release frequency, this data is best explained by the fact
that more liquid mass left the surface as vapor on the 75-500 surface. The 150-500 surface
had a single large observable bubble site with higher frequency of release than the sites
measured for 75-500. However, the data shown in Fig. 6.1 suggest that the total mass of
vapor leaving the surface on the 75-500 surface was more than on the 150-500, with
relatively slower release per major site. The average mass velocity of vapor leaving a
surface is given by equation 6.1, which is directly proportional to heat flux.
(Equation 6.1)
𝐺𝑏 =𝑞/𝐴
𝜌𝑣ℎ𝑙𝑔𝜌𝑙
6.2 Boiling Performance of a Different Bi-functional Matrix Structure
Utilizing knowledge gained throughout the study, a secondary effort was taken to
fabricate bi-functional surfaces with a different wicking structure. The bi-functional
surfaces’ fluropolymer dots have been proved to greatly enhance bubble nucleation and
diameters. To further enhance boiling performance, a second set of printed patterns was
fabricated but with ZnO nanowire wicking structures. Nanowires were used in the bubble
dynamics study to achieve exact nucleation control of a single dot by lowering the flowrate
in the MAND deposition process, to increase residence time. The use was further extended

66
to compare the wicking structures’ effect on printed bi-functional performance. Fig. 6.2
shows the experimental results for nanoflower/nanowire matrix comparison.
Figure 6.2: Boiling curves for enhanced surfaces with a nanowire matrix, compared
to a bare surface
Results show that the combination of dots with the ZnO nanowire matrix led to
worse performance and a combined effect of the two constituent boiling curves. This result
was not expected and differs from the enhancement offered by the nanoflower matrix. The
150-500 bi-functional surface had the most enhancement, but performance declined above
60 W/cm2, compared to both plain dot array and plain ZnO nanowire surfaces. This means
that the printed dots’ incorporation into a nanowire matrix only improves bubble generation
and departure during the partially-developed boiling region. What is surprising is that the
75-500 surface flux and HTC values fall right between the nanowire and dot only results,
but only until a superheat of 23 °C, followed by performance which is worse than the plain
dot array. It is postulated that since the nanowires are dense, and at low flux barely nucleate
(as evidenced by their poor performance in the partially-developed region) the dot addition
provides additional nucleation sites. However, as the nanowires’ cavities activate, too
many bubbles are generated from both the polymer dots and wires’ cavities and not enough
cool regions are present to create a surface temperature gradient.

67
In general, the analysis in 6.3 of matrix morphology modification of the bi-
functional surface has shown that the shape of the boiling curve for bi-functional surfaces
varies with the matrix wicking structure.
Figure 6.3: HTC comparison for a) Matrix morphology b) Matrix effect on bi-
functional surfaces c) NW bi-functional dot size effect d) Flower bi-functional dot
size effect
Fig. 6.3 shows that region of enhancement differs for the two different wicking
structures. The nanowire curve has a unique shape, showing steep slope from superheats
of 20-30. Bi-functional nanowire surfaces have an asymptotic shape, like the polymer dots.
The overall effect is enhancement in the partial nucleate boiling region and degraded
performance in the fully-developed region (which occurs at surface temperatures of 123-
135 °C).
68
Another observation is that bi-functionality enhances the flower-like structure
throughout most of the nucleate boiling regime, after superheats of 15 °C, and increasing
with even more enhancement as flux is increased into the fully-developed boiling regime.
However, both flower-like bi-functional surfaces have roughly the same enhancement from
printed dots. The size of printed dots has a much greater effect on enhancement when the
matrix is a nanowire structure, with the smaller dots enhancing the nanowire performance
in a smaller range of the nucleate boiling regime (Fig. 6.3 b).
Based on Fig. 6.3, the dot size increase has a more pronounced effect when the
wicking structure used is nanowires. This means that the printed dot size needs to be large
enough to overcome the low boiling performance of the nanowires in the partially-
developed boiling region. The general conclusion drawn from the test is that the flower-
like bi-functional surface has an additive effect (the bi-functionality increases HTC more
than the base printed dots and flower structure). Alternatively, the NW bi-functional
surface provides a combined effect of taking on the shape of the hydrophobic dot pattern
in the partially-developed region and not exhibiting the performance of the NW structure
in the fully-developed region.
6.3 Boiling Performance of a Superhydrophobic-ZnO NW Surface
With the ability to quantify HTCs for enhanced surfaces, another effort was
undertaken. A minor study of a superhydrophobic material to replace the hydrophobic dots
was conducted and is discussed below. The hydrophobic/hydrophilic surface has shown
enhanced boiling performance, and it is well-known that the superwetting states can further
enhance performance, as discussed in Ch. 2 with a review of superbiphilic surfaces 1–3.
6.3.1 Fabrication of Superhydrophobic PTFE/PPS
A superwetting state can only be achieved with a combination of physical structure
and surface tension, such as the much sought-after lotus-leaf structure occurring in nature
4. Additionally, hierarchically-structured surfaces containing nanostructures within
microstructures can further increase the absolute value of the wetting state. Fluorinated

69
polymers such as the S10 used throughout the study, as well as PTFE can only achieve
contact angles as high as 120 °C. However, if the fluorine groups are on nano and/or
microstructures, the angle can be further increased past 120 °C and a superhydrophobic
state (contact angle > 150 °C) can be achieved 5–8. Superhydrophobic surfaces are widely
studied for their anti-fogging, water-harvesting, water-propelling, energy-harvesting and
self-cleaning properties 8–13. A review of literature has shown that a lithography fabrication
scheme is used to create a physical structure, followed by conformal PTFE-coating.
The goal was to replace the hydrophobic dots in the bi-functional surface with
superhydrophobic dots via a solution-based route. However, since the superhydrophobic
state requires a physical structure, the S10 surface could not be rendered superhydrophobic.
PTFE was required to create superhydrophobic surfaces. Another challenge encountered
was bonding the PTFE to stainless steel, as the film delaminates if it is simply deposited
and cured.
A report by Luo et al. showed that polyphenylene sulfide (PPS) could bind PTFE
to a roughened stainless steel surface through 350-400°C temperature curing 5. The authors
reported that the sulfide groups in PPS chains migrate to the stainless steel surface and
bond, while cross-linking with PTFE chains that migrate to the top of coating. Thus,
fluorine groups are concentrated at the top of the coating, the whole coating is bonded to
the stainless steel, and the addition of a non-ionic surfactant aids in the cross-linking of
chains of both polymer constituents to create a binary/hierarchal structure.
Utilizing a method similar to Luo et al. a superhydrophobic material was prepared.
Materials used included poly(1,4-phenylene sulfide) average Mn ~10,000, powder,
polytetrafluoroethylene 60 wt % dispersion in H2O, polyethylene glycol sorbitan
monolaurate (TWEEN® 20) and sorbitan laurate (Span® 20), all purchased from Sigma-
Aldrich. The solvent was commercially-available food-grade polypropylene glycol, which
led to a stable suspension.
The emulsion was optimized to reduce solid-liquid separation and contained 2.57
wt. % Tween 20, 0.8 wt. % Span 20, 31 wt. % PTFE and 0.7 wt. % PPS binder. The

70
hydrophile-lipophile balance of the emulsion was 15.08. Mixing was conducted between
addition of each chemical.
Since the precursor to the superhydrophobic film was a solids suspension, inkjet
printing could not be used to deposit the material (particle size > 0.45 µm), so the solution
was simply drop-casted. The stainless steel surface was prepared differently than for the
printed bi-functional surfaces. The plate was sanded with 500 grit sandpaper followed by
1000 grit sanding, then cleaned with acetone in an ultrasonic bath for 10 minutes and dried
with nitrogen. Sanding was necessary to facilitate binding of the polymers into surface
microscratches. The suspension was drop-casted onto the surface and baked at two
temperatures in a furnace (see Fig. 6.4). The contact angle was measured by carefully
ejecting a droplet of water onto the coated area. However, due to the superhydrophobicity
and porous nature of the material the water droplet mostly slid off or migrated to a region
of the coating where coverage was less. It is speculated that the contact angle is actually
higher than the measured value of 146.29 °C.
Figure 6.4: Process scheme for superhydrophobic PTFE/PPS material

71
The hierarchical structure from the resulting material was characterized with SEM.
For high resolution images (>1 µm), a Helios 650 Ultra Resolution Dual Beam FEI SEM
was used. As expected, the surfactant-aided crosslinking and temperature curing
augmented the material into a physically-structured micropapillae texture, with nanoscale
texture as well. Due to the solids’ size, a thin film less than 1 mm thickness and diameter
could not be achieved after curing. The three-dot pattern had dots spaced approximately
0.5 cm apart after curing, at 3 apexes of a triangle. Fig. 6.5 reveals the hierarchical structure.
Figure 6.5: Size of 3 drop-casted superhydrophobic dots and SEM images of
PTFE/PPS micro and nanostructure
6.3.2 Boiling Curves of PTFE/PPS and ZnO Surfaces
Results from the 3 dot-patterned superhydrophobic surface compared to a bi-
functional surface are shown in Fig. 6.6.

72
Figure 6.6: Boiling curves for enhanced surfaces with superhydrophobic dots and
nanowire matrix
The superhydrophobic surfaces are not comparable to bi-functional surfaces
discussed in 6.1 and 6.2 because the size, pitch and film thickness are vastly different. The
analysis was done purely to see the enhancement resulting from superhydrophobicity in
the array region of a bi-functional surface. The trend shown in Fig. 6.6 is different from
how the hydrophobic dot printing pattern enhanced the ZnO NW matrix. In the case with
large superhydrophobic dots, the HTC is enhanced in the fully-developed nucleate boiling
regime, compared to just partially-developed boiling enhancement. Another interesting
feature of the curve shape is the HTC trend and values take on that of each constituent
region. This trend and shape differs from both the flower and NW matrix coupled with
printed patterns shown in Fig. 6.3 c) and d). Thus, superhydrophobic bi-functional surfaces
can increase the boiling performance of the whole nucleate boiling regime.
6.4 Summary of Bi-functional Surfaces Tested
Since CHF was not reached for any enhanced surfaces, CHF enhancement could
not be quantified. Overall the steepest slope in the nucleate boiling regime was achieved
with 75-500 and 150-500 bi-functional flower surfaces. The lowest ONB superheat was
achieved on the 75-500 polymer dot pattern, but overall reduction in superheat occurred on
75-500 and 150-500 bi-functional flower surfaces. The ZnO flower hydrophilic matrix

73
morphology was found to increase bi-functional performance for the whole nucleate
boiling regime, whereas the nanowire matrix coupled with printed dots resulted in only
partially-developed regime enhancement. Superhydrophobicity was found to improve the
performance of the full nucleate boiling regime, with a ZnO nanowire matrix.
Enhancement factors at a superheat of 25 °C (temperature at CHF of the bare
surface) for all bi-functional surfaces are shown in Table 6.1, with a max enhancement of
2.9X.
Table 6.1: HTC enhancement for bi-functional surfaces at 25 °C superheat Sample Design HTC (kW/m2-K) Enhancement Factor
1 Bare 10.61 -
2 75-500 flower 30.80 2.90
3 150-500 flower 30.36 2.86
4 75-500 NW 16.53 1.56
5 150-500 NW 22.13 2.09
6 S.H & NW 22.92 2.16
Another overview comparison can be made between all bi-functional surfaces’
superheats at a flux of 27 W/cm2 (CHF for bare). Reduction in superheats of 3.97-9.33 °C
were achieved.
Table 6.2: Superheat enhancement for bi-functional surfaces at 27 W/cm2
Sample Design Superheat (°C) Enhancement (°C)
1 Bare 25.60 -
2 75-500 flower 16.27 9.33
3 150-500 flower 17.59 8.02
4 75-500 NW 21.63 3.97
5 150-500 NW 17.59 8.02
6 S.H & NW 21.63 3.97

74
6.5 References
1. Betz, A. R., Jenkins, J., Kim, C. J. & Attinger, D. Boiling heat transfer on
superhydrophilic, superhydrophobic, and superbiphilic surfaces. Int. J. Heat Mass
Transf. 57, 733–741 (2013).
2. Zupančič, M., Steinbücher, M., Gregorčič, P. & Golobič, I. Enhanced pool-boiling
heat transfer on laser-made hydrophobic/superhydrophilic polydimethylsiloxane-
silica patterned surfaces. Appl. Therm. Eng. 91, 288–297 (2015).
3. McCarthy, M. et al. Biotemplated hierarchical surfaces and the role of dual length
scales on the repellency of impacting droplets. Appl. Phys. Lett. 100, 1–6 (2012).
4. Tao, P. et al. Bioinspired engineering of thermal materials. Adv. Mater. 27, 428–
463 (2015).
5. Luo, Z., Zhang, Z., Wang, W., Liu, W. & Xue, Q. Various curing conditions for
controlling PTFE micro/nano-fiber texture of a bionic superhydrophobic coating
surface. Mater. Chem. Phys. 119, 40–47 (2010).
6. Basu, B. J. & Dinesh Kumar, V. Fabrication of Superhydrophobic Nanocomposite
Coatings Using Polytetrafluoroethylene and Silica Nanoparticles. ISRN
Nanotechnol. 2011, 1–6 (2011).
7. Elsharkawy, M., Schutzius, T. M. & Megaridis, C. M. Inkjet patterned
superhydrophobic paper for open-air surface microfluidic devices. Lab Chip 14,
1168–75 (2014).
8. Hays, R., Maynes, D. & Crockett, J. Thermal transport to droplets on heated
superhydrophobic substrates. Int. J. Heat Mass Transf. 98, 70–80 (2016).
9. Nakajima, a., Hashimoto, K. & Watanabe, T. Recent studies on super-
hydrophobic films. Monatshefte fur Chemie 132, 31–41 (2001).
10. Enright, R., Miljkovic, N., Al-Obeidi, A., Thompson, C. V & Wang, E. N.
Condensation on superhydrophobic surfaces: the role of local energy barriers and
structure length scale. Langmuir 28, 14424–32 (2012).
11. Boreyko, J. B. & Chen, C.-H. Self-Propelled Dropwise Condensate on
Superhydrophobic Surfaces. Phys. Rev. Lett. 103, 184501 (2009).
12. Sun, Z. et al. Fly-eye inspired superhydrophobic anti-fogging inorganic
nanostructures. Small 10, 3001–3006 (2014).
13. Miljkovic, N., Preston, D. J., Enright, R. & Wang, E. N. Jumping-droplet
electrostatic energy harvesting. Appl. Phys. Lett. 105, 13111 (2014).

75
7 Conclusions and Future Work
7.1 Conclusions
Novel bi-functional surfaces having hydrophobic polymer dot arrays and
hydrophilic ZnO nanostructures were prepared by integrating the MAND process and
inkjet printing, along with the utilization of wettability contrast between hydrophobic dot
arrays and hydrophilic ZnO solution. In the first part of the study, printing patterns were
designed to fabricate different types of bi-functional surfaces.
In another study the surfaces were tested in a simple subcooled boiling test to
understand the effect of configuration on bubble dynamics. Patterned array control was
achieved on one particular surface with relatively small bubble diameters. Surface
structures supplied an efficient capillary wicking force from hydrophilic ZnO
nanostructures to facilitate departure of bubbles that nucleated at hydrophobic polymer
dots. Different surface configurations resulted in various bubble dynamics as governed by
interfacial interaction between hydrophilic and hydrophobic regions. The surfaces’ printing
pattern augmentation also demonstrated the ability to tailor bubble nucleation site location.
Next, an experimental pool boiling facility was designed and built to characterize
saturated boiling performance of enhanced surfaces. The system was baselined and a
method for standardized testing enabled quantifiable comparisons of bi-functional surfaces
with a bare surface. Trends revealed by the boiling curves included a different enhancement
mechanism for bi-functional surfaces when the hydrophilic matrix changed from a flower-
like to nanowire morphology.
Additionally, a bi-functional surface incorporating superhydrophobic sites rather
than hydrophobic revealed that the superwetting state was able to enhance the full nucleate
boiling regime when coupled with a ZnO nanowire matrix. This result differed from the
trend seen with hydrophobic coupled with ZnO nanowire matrix.

76
The tested bi-functional surfaces showed significant enhancement in nucleate boiling heat
transfer with 3X HTC enhancement at the same wall superheat. All surfaces showed a vast
improvement in HTC after the burnout point for a bare stainless steel surface and reduction
in superheat.
7.2 Future Work
The pool boiling facility designed for this study can be used to run experiments in
future work for various boiling applications using water. The current study was initially
done using stainless steel plates for their widespread usage. However, stainless steel is not
an ideal starting material for two-phase heat transfer applications. Therefore, the exact
application should be decided upon, such as electronics immersion cooling or integration
into heat pipe technology. Immersion cooling involves refrigerants so the upper assembly
of the chamber would need modification of construction materials and the addition of a
condenser and pressure transducer.
In the case of incorporating the bi-functional surface into heat pipe technology, it
is recommended that copper plates be used. Another application is in steam generation in
industrial boiling, which occurs on steel surfaces.
A recommendation for future work with the pool boiling system is to modify the
lower assembly of the boiling chamber with quartz glass, for recording bubble dynamics
during the experiment. It is also recommended that a high-speed camera be used to more
accurately capture nucleation onset, bubble size and departure morphology.
Finally, the last recommendation that should be done next is to validate the test
system with either copper or silicon. The majority of pool boiling research is conducted on
coatings that enhance both these metals’ surfaces and to reasonably compare developed
coatings, the system should be validated with other studies and/or the Rohsenow
correlation.