An absence of attentional bias: Statistics anxiety is ... · 94 Journal of Articles in Support of...
22
An absence of attentional bias: Statistics anxiety is unique among anxieties The purpose of the study was to examine the role of attentional bias in statistics anxiety in two experiments. Participants were 99 (68% females) and 104 (67% females) psychology undergraduates at James Cook University, respectively. These participants had either never taken a statistics course before but will enroll in one in the future, were currently enrolled in a statistics course, or had successfully completed at least one statistics course but were not currently enrolled in a statistics course. Participants completed the emotional Stroop task and the dot probe task, the Statistical Anxiety Rating Scale, Social Desirability Scale, and State- Trait Anxiety Inventory. Across the experiments, participants high in statistics anxiety had the same levels of attentional bias as their low-anxious counterparts, indicating an absence of attentional bias in statistics anxiety. Implications include a reconsideration of the cognitive mechanisms underlying statistics anxiety. Specifically, individuals with statistics anxiety might be interpreting danger based on the absence of safety indicators instead of the presence of danger indicators. Alternatively, another form of cognitive bias, such as an interpretation bias might underlie statistics anxiety. Future research should be conducted to compare the plausibility of these two explanations. Keywords: statistics anxiety; attentional bias; emotional Stroop task; dot probe task Peter K. H. Chew 1 Anne Swinbourne 2 Denise B. Dillon 1 1 James Cook University, 149 Sims Drive, Singapore 387380 2 James Cook University, Townsville, QLD 4811, Australia Journal of Articles in Support of the Null Hypothesis Vol. 13, No. 2 Copyright 2017 by Reysen Group. 1539-8714 www.jasnh.com Corresponding author: Peter K. H. Chew, Tel.: +65 6709 3747; Fax: +65 6709 3889; e-mail: [email protected]
Transcript of An absence of attentional bias: Statistics anxiety is ... · 94 Journal of Articles in Support of...

91Statistics anxiety
An absence of attentional bias: Statistics anxiety is unique among anxieties
The purpose of the study was to examine the role of attentional bias in statistics anxiety in two experiments. Participants were 99 (68% females) and 104 (67% females) psychology undergraduates at James Cook University, respectively. These participants had either never taken a statistics course before but will enroll in one in the future, were currently enrolled in a statistics course, or had successfully completed at least one statistics course but were not currently enrolled in a statistics course. Participants completed the emotional Stroop task and the dot probe task, the Statistical Anxiety Rating Scale, Social Desirability Scale, and State- Trait Anxiety Inventory. Across the experiments, participants high in statistics anxiety had the same levels of attentional bias as their low-anxious counterparts, indicating an absence of attentional bias in statistics anxiety. Implications include a reconsideration of the cognitive mechanisms underlying statistics anxiety. Specifically, individuals with statistics anxiety might be interpreting danger based on the absence of safety indicators instead of the presence of danger indicators. Alternatively, another form of cognitive bias, such as an interpretation bias might underlie statistics anxiety. Future research should be conducted to compare the plausibility of these two explanations.
Keywords: statistics anxiety; attentional bias; emotional Stroop task; dot probe task
Peter K. H. Chew1
Anne Swinbourne2
Denise B. Dillon1
1 James Cook University, 149 Sims Drive, Singapore 3873802 James Cook University, Townsville, QLD 4811, Australia
Journal of Articles in Support of the Null HypothesisVol. 13, No. 2Copyright 2017 by Reysen Group. 1539-8714www.jasnh.com
Corresponding author:Peter K. H. Chew, Tel.: +65 6709 3747; Fax: +65 6709 3889; e-mail: [email protected]

Journal of Articles in Support of the Null Hypothesis. JASNH, 2017, Vol. 13, No. 292
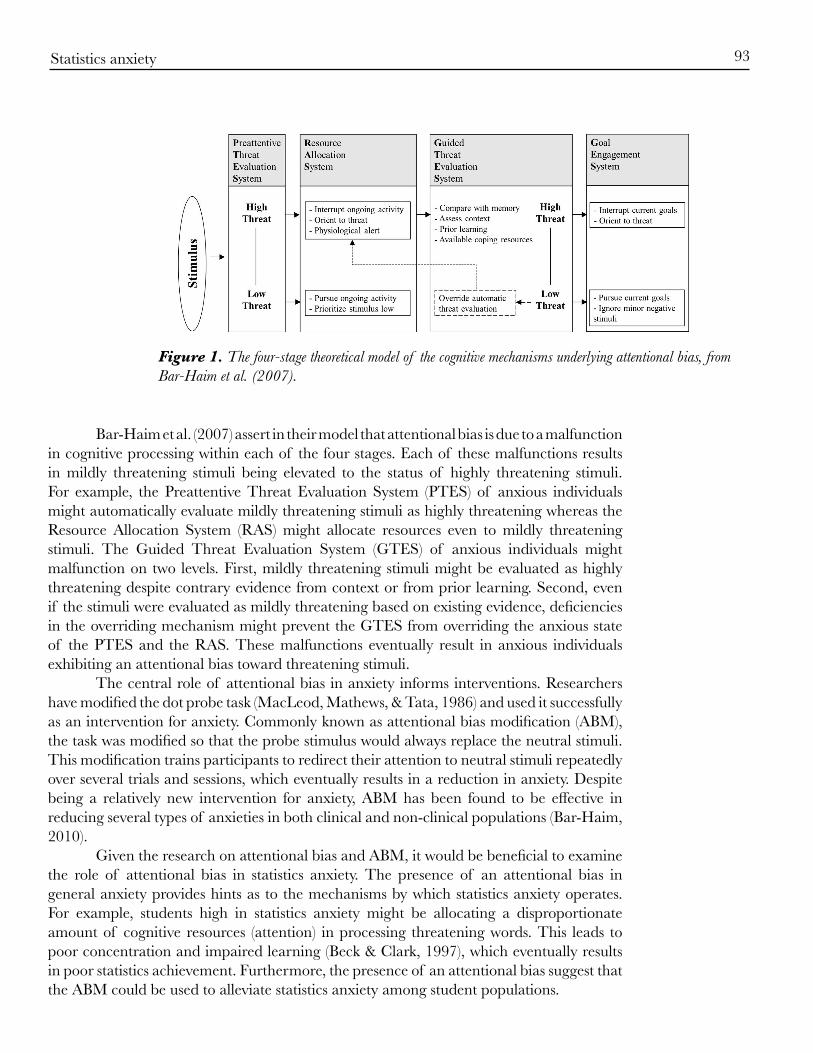
Statistics anxiety is defined as “a negative state of emotional arousal experienced by individuals as a result of encountering statistics in any form and at any level; this emotionalstate is preceded by negative attitudes toward statistics and is related to but distinct from mathematics anxiety” (Chew & Dillon, 2014b, p. 199). Statistics anxiety is conceptualized as a multidimensional construct consisting of three factors: (a) Interpretation Anxiety, (b) Test and Class Anxiety, and (c) Fear of Asking for Help (Papousek et al., 2012). Interpretation Anxiety refers to the feelings of anxiety encountered when interpreting statistical data. Test and Class Anxiety concerns the anxiety involved in attending a statistics class or when taking a statistics test. Lastly, Fear of Asking for Help relates to the anxiety experienced when seeking help. The antecedents of, effects of, and interventions for statistics anxiety have been well documented. Firstly, some reported antecedents of statistics anxiety include procrastination (Onwuegbuzie, 2004) and the Big Five personality factors (Chew & Dillon, 2014a). Secondly, statistics anxiety has often been conceptualized as a debilitative construct. A consistent negative relationship has been found between statistics anxiety and statistics achievement in a number of studies (e.g., Hanna & Dempster, 2009; Onwuegbuzie & Seaman, 1995). Lastly, given the effects of statistics anxiety, a number of studies have been conducted to investigate the effects of interventions designed to reduce statistics anxiety among students. For example, instructors can use humor in class (Wilson, 1999), provide coping strategies to students (Pan & Tang, 2004), or increase their immediacy behaviors (e.g., addressing students by name) (Williams, 2010) to reduce students’ levels of statistics anxiety. However, despite the large number of investigations of statistics anxiety, the mechanisms by which this form of anxiety operates remain unclear. Since 1990, a large number of studies have examined the role of cognitive biases in anxiety. There are three types of cognitive bias: attentional bias, interpretation bias, and memory bias (see Beard, 2011; Hertel & Mathews, 2011; MacLeod & Mathews, 2012 for reviews). Among these biases, attentional bias has received the most research attention. Studies of attentional bias have primarily been motivated by Beck’s schema theory (Beck & Clark, 1988, 1997; Beck, 1976) and Bower’s network theory (1981, 1987). According to these theories, anxious individuals tend to direct their attention towards threatening stimuli related to their anxiety, relative to neutral stimuli (Cisler & Koster, 2010). In other words, anxious individuals show an attentional bias toward threat. In turn, this bias causes and maintains anxiety (MacLeod, Rutherford, Campbell, Ebsworthy, & Holker, 2002; Mathews & MacLeod, 2002; See, MacLeod, & Bridle, 2009). Overall, evidence for attentional bias has been documented among many types of anxieties in both clinical and non-clinical populations (Bar-Haim, Lamy, Pergamin, Bakermans-Kranenburg, & Van IJzendoorn, 2007). Many models have been proposed to explain the cognitive mechanisms underlying attentional bias (Mathews & Mackintosh, 1998; Mogg & Bradley, 1998; Wells & Matthews, 1994; Willams, Watts, MacLeod, & Mathews, 1988). However, taken separately these models do not explain the range of findings obtained from a meta-analysis of 172 studies (Bar-Haim et al., 2007). Based on the results of the meta-analysis, Bar-Haim et al. (2007) proposed a four-stage theoretical model that integrates key aspects of previous models and is presented here in Figure 1.
93Statistics anxiety
Bar-Haim et al. (2007) assert in their model that attentional bias is due to a malfunction in cognitive processing within each of the four stages. Each of these malfunctions results in mildly threatening stimuli being elevated to the status of highly threatening stimuli. For example, the Preattentive Threat Evaluation System (PTES) of anxious individuals might automatically evaluate mildly threatening stimuli as highly threatening whereas the Resource Allocation System (RAS) might allocate resources even to mildly threatening stimuli. The Guided Threat Evaluation System (GTES) of anxious individuals might malfunction on two levels. First, mildly threatening stimuli might be evaluated as highly threatening despite contrary evidence from context or from prior learning. Second, even if the stimuli were evaluated as mildly threatening based on existing evidence, deficiencies in the overriding mechanism might prevent the GTES from overriding the anxious state of the PTES and the RAS. These malfunctions eventually result in anxious individuals exhibiting an attentional bias toward threatening stimuli. The central role of attentional bias in anxiety informs interventions. Researchers have modified the dot probe task (MacLeod, Mathews, & Tata, 1986) and used it successfully as an intervention for anxiety. Commonly known as attentional bias modification (ABM), the task was modified so that the probe stimulus would always replace the neutral stimuli. This modification trains participants to redirect their attention to neutral stimuli repeatedly over several trials and sessions, which eventually results in a reduction in anxiety. Despite being a relatively new intervention for anxiety, ABM has been found to be effective in reducing several types of anxieties in both clinical and non-clinical populations (Bar-Haim, 2010). Given the research on attentional bias and ABM, it would be beneficial to examine the role of attentional bias in statistics anxiety. The presence of an attentional bias in general anxiety provides hints as to the mechanisms by which statistics anxiety operates. For example, students high in statistics anxiety might be allocating a disproportionate amount of cognitive resources (attention) in processing threatening words. This leads to poor concentration and impaired learning (Beck & Clark, 1997), which eventually results in poor statistics achievement. Furthermore, the presence of an attentional bias suggest that the ABM could be used to alleviate statistics anxiety among student populations.
STATISTICS ANXIETY 5
Figure 1. The four-stage theoretical model of the cognitive mechanisms underlying attentional bias, from Bar-Haim et al. (2007).
Bar-Haim et al. (2007) assert in their model that attentional bias is due to a
malfunction in cognitive processing within each of the four stages. Each of these
malfunctions results in mildly threatening stimuli being elevated to the status of highly
threatening stimuli. For example, the Preattentive Threat Evaluation System (PTES) of
anxious individuals might automatically evaluate mildly threatening stimuli as highly
threatening whereas the Resource Allocation System (RAS) might allocate resources even to
mildly threatening stimuli. The Guided Threat Evaluation System (GTES) of anxious
individuals might malfunction on two levels. First, mildly threatening stimuli might be
evaluated as highly threatening despite contrary evidence from context or from prior learning.
Second, even if the stimuli were evaluated as mildly threatening based on existing evidence,
deficiencies in the overriding mechanism might prevent the GTES from overriding the
anxious state of the PTES and the RAS. These malfunctions eventually result in anxious
individuals exhibiting an attentional bias toward threatening stimuli.
The central role of attentional bias in anxiety informs interventions. Researchers have
modified the dot probe task (MacLeod, Mathews, & Tata, 1986) and used it successfully as
an intervention for anxiety. Commonly known as attentional bias modification (ABM), the
task was modified so that the probe stimulus would always replace the neutral stimuli. This
Figure 1. The four-stage theoretical model of the cognitive mechanisms underlying attentional bias, from Bar-Haim et al. (2007).

Journal of Articles in Support of the Null Hypothesis. JASNH, 2017, Vol. 13, No. 294
Although a previous study found no evidence of attentional bias in statistics anxiety, the study consisted of two methodological limitations (Chew, Swinbourne, & Dillon, 2014). First, the study was conducted online while most attentional bias studies were conducted in a laboratory (Bar-Haim et al., 2007). Participants might be distracted by stimuli in their own environments, affecting the results of the study. Second, the study did not account for the suppression effect. Research has shown that attentional bias is suppressed when anxious participants expect a threatening event (Amir et al., 1996; Constans, McCloskey, Vasterling, Brailey, & Mathews, 2004; Helfinstein, White, Bar-Haim, & Fox, 2008). Most participants of the study were students who were currently enrolled in a statistics course (86.8%). Enrolment in a statistics course might result in these students expecting an encounter with statistics-related threatening events (e.g., lectures, assignments, etc.) after the experiment, resulting in a suppression of attentional bias. These limitations are addressed in Experiment 1 of the current study.
The Current Study
The purpose of the current study was to examine the role of attentional bias in statistics anxiety. As recommended by De Ruiter and Brosschot (1994), the current study employed both the emotional Stroop task and the dot probe task. Two hypotheses were specified for the current study. Firstly, it is hypothesized that participants with higher statistics anxiety will be slower to name the color of a threatening stimuli on the emotional Stroop task than their low-anxious counterparts (interference hypothesis). Secondly, it is hypothesized that participants with higher statistics anxiety will be faster in responding to a probe stimulus that replaces a threatening stimuli on the dot probe task than their low-anxious counterparts (facilitation hypothesis). These hypotheses were tested in a laboratory experiment that included participants who had never taken a statistics course before but will enroll in one in the future (Experiment 1), and a laboratory experiment using stimuli relevant to each of the three factors of statistics anxiety (Experiment 2).
Experiment 1
Experiment 1 addresses the limitations of the previous study (Chew et al., 2014) by replicating the study in a laboratory and by considering the suppression effect. The previous study’s definition of statistics anxiety appears to be too narrow. In this experiment, we expanded the definition to include students who had never taken a statistics course before but would be enrolling in one in the future. Specifically, the definition was expanded to refer to “the feelings of anxiety encountered when taking a statistics course or doing statistical analyses” (Cruise, Cash, & Bolton, 1985, p. 92), or when anticipating either of the two events. Anecdotal evidence suggests that students experience statistics anxiety before enrolling in a statistics course. Often, these students receive information about the anxiety involved in statistics courses from their seniors. Alternatively, students might associate statistics with mathematics and develop anxiety based on prior negative experience with mathematics. Indeed, some of these students delay enrolling in statistics courses until the last semester of their program (Roberts & Bilderback, 1980). Hence, the recruitment criteria were expanded to include this group of students. Since these students were not currently enrolled in a statistics course, recruiting them circumvents the suppression effect because
95Statistics anxiety
they would not expect any statistics-related threatening events (e.g., lectures, assignments, etc.) after the experiment. If the suppression effect was responsible for the nonsignificant results in the previous study (Chew et al., 2014), attentional bias should be present among this group of students but absent among students currently enrolled in a statistics course.
Method
Participants
Participants were 105 undergraduates at James Cook University. Data from six participants (6%) were removed due to errors in task completion, missing data, or being color blind. The final sample consisted of 99 participants (68% females) enrolled in the psychology (97%) or business (3%) degree program from the James Cook University Singapore (79%) and Australia campuses (21%). Their ages ranged from 16 to 49 years (M = 22.16, SD = 5.03). Participants were divided into three groups based on their experience with statistics courses: 38 participants had never taken a statistics course before but will enroll in one in the future (NeverTakenStats), 31 participants were currently enrolled in a statistics course (TakingStats), and 30 participants had successfully completed at least one statistics course but were not currently enrolled in a statistics course (TakenStats). All participants had normal or corrected-to-normal eyesight and were not color blind. Participants were either granted extra course credit or were given a movie voucher for their participation in the experiment. A sample size of 99 exceeds the recommended sample size for multiple regression (i.e., N >= 50 + 8(3 predictors) = 74). Post hoc power analysis revealed an obtained power of .90 (alpha = .05) and .74 (alpha = .01) (Faul, Erdfelder, Buchner, & Lang, 2009).
Stimuli
The stimuli used in the current experiment were adapted from the previous study (Chew et al., 2014; see Appendix A). A total of 36 pairs of words (e.g., statistics vs. furniture) and 12 pairs of symbols (e.g., y vs. %) were used. Statistics-related threatening words were matched on average length and frequency with the neutral words whereas statistics-related threatening symbols were matched with neutral symbols found on a standard QWERTY keyboard.
Tasks
Both the emotional Stroop task and the dot probe task (MacLeod et al., 1986) were administered using INQUISIT 4.0 (2015), which measures reaction time with millisecond accuracy (De Clercq, Crombez, Buysse, & Roeyers, 2003). Emotional Stroop task. Participants saw a fixation point (+) in the center of the screen for 500 milliseconds followed by a stimulus (word or symbol) that remained on the screen until a response was made. There was a 500 millisecond interval between each trial. Each stimulus was randomly presented in one of four colors and participants responded using response keys which corresponded to the color of the stimulus. A reminder was present at the bottom of the screen for each trial (i.e., ‘D’ = red, ‘F’ = green, ‘J’ = blue, and ‘K’ = yellow). The keyboard response was used instead of a vocal response to increase

Journal of Articles in Support of the Null Hypothesis. JASNH, 2017, Vol. 13, No. 296
similarity in response modes between the emotional Stroop task and the dot probe task (Egloff & Hock, 2003). Participants completed 20 practice trials to familiarize themselves with the task before completing 96 experimental trials (72 words and 24 symbols). An error message (a red ‘X’) was provided in practice trials but not in experimental trials. Dot probe task. Participants saw a fixation point (+) in the center of the screen for 500 milliseconds followed by a pair of stimuli randomly presented one above the other for 500 milliseconds which were then followed by a probe stimulus (either ‘F’ or ‘J’) randomly presented in either the top or bottom location. The probe stimulus remained on the screen until a response was made. There was a 500 millisecond interval between each trial. Participants responded using response keys which corresponded to the type of probe stimulus (either ‘F’ or ‘J’). The probe stimulus replaced the threatening stimuli in congruent trials and the neutral stimuli in incongruent trials. Participants completed 10 practice trials to familiarize themselves with the task before completing 96 experimental trials (36 pairs of words and 12 pairs of symbols). An error message (a red ‘X’) was provided in practice trials but not in experimental trials.
Instruments
Statistical Anxiety Rating Scale (STARS). The STARS is a two-part, 51-item instrument designed to assess six factors of statistics anxiety (Cruise et al., 1985). Recent research suggested that part 1 of the STARS (the first three factors) assesses statistics anxiety whereas part 2 of the STARS (the last three factors) assesses attitudes toward statistics (Papousek et al., 2012). Hence, only part 1 of the STARS was used in the current study. Part 1 consists of 23 items which assess statistics anxiety associated with situations where students have contact with statistics and it includes the following factors: (a) Interpretation Anxiety (e.g., figuring out whether to reject or retain the null hypothesis), (b) Test and Class Anxiety (e.g., doing the final examination in a statistics course), and (c) Fear of Asking for Help (e.g., asking a fellow student for help in understanding a printout). Participants respond on a five-point Likert scale that ranges from 1 = no anxiety to 5 = strong anxiety. Appropriate item scores are summed for each factor, with higher scores indicating higher levels of statistics anxiety. The three factors consist of 11 items, 8 items, and 4 items, and have potential scores that range from 11 to 55, 8 to 40, and 4 to 20, respectively. Cruise et al. (1985) reported internal consistencies that ranged from .85 to .91 (n = 1150) and five- week test-retest reliabilities that ranged from .72 to .83 (n = 161) for the three factors. More recently, Papousek et al. (2012) reported internal consistencies that ranged from .86 to .88 (n = 400) and five-months test retest reliabilities that ranged from .49 to .76 (n = 89) for the three factors. The current experiment found internal consistencies that ranged from .84 to .89. Marlowe-Crowne Social Desirability Scale. The Marlowe-Crowne Social Desirability Scale is a unidimensional, 33-item instrument designed to assess social desirability or defensiveness (e.g., I am always courteous, even to people who are disagreeable) (Crowne & Marlowe, 1960). Responses are made on a true/false scale. Negative items are reverse scored and the items are summed to produce a single score, with higher scores indicating higher levels of socially desirable responding. The instrument has a potential score that ranges from 0 to 33. The scale was administered as a “Personal Reaction Inventory” to mask the true purpose of the instrument. Crowne and Marlowe (1960) reported an internal consistency of .88 (n = 39) and a four-week test-retest reliability of .89 (n = 31) for the scale.

97Statistics anxiety
More recently, Loo and Loewen (2004) reported an internal consistency of .75 (n = 663) for the scale. The scale has been used to discriminate repressors from participants who are truly low anxious (Ioannou, Mogg, & Bradley, 2004; Mogg et al., 2000; Newman & McKinney, 2002). The current experiment found an internal consistency of .74 for the scale. Procedure
Participants completed the emotional Stroop task and the dot probe task (MacLeod et al., 1986) using INQUISIT 4.0 (2015) on a computer in a laboratory. Each task took about 15 minutes to complete. Subsequently, participants completed the Background Information Form, the Statistical Anxiety Rating Scale (Cruise et al., 1985), and the Marlowe-Crowne Social Desirability Scale (Crowne & Marlowe, 1960) on SurveyGizmo (2015). Each instrument took about 10 minutes to complete. Except for the Background Information Form, all instruments and tasks were counterbalanced to control for order effects. Informed consent was implied when participants click on the ‘Next’ button to proceed with the tasks. This procedure was approved by the James Cook University Human Research Ethics Committee.
Results
All results were analyzed using SPSS version 21. Alpha was set at .01 to reduce the chance of Type 1 errors due to multiple comparisons. Incorrect responses were removed from the RT data. The number of incorrect responses ranged from 0 to 12 (Median = 3.00, M = 3.73, SD = 2.95) for words and ranged from 0 to 17 (Median = 1.00, M = 1.66, SD = 2.48) for symbols on the emotional Stroop task. The number of incorrect responses ranged from 0 to 16 (Median = 4.00, M = 4.63, SD = 3.78) for words and ranged from 0 to 8 (Median = 1.00, M =1.55, SD = 1.64) for symbols on the dot probe task. Incorrect responses accounted for 6.0% of the data. Visual inspection of the histograms suggests that the RT data were positively skewed. Hence, RT data were transformed by applying a logarithmic transformation to normalize the distribution and reduce the impact of outliers (Ratcliff, 1993). Subsequently, Threat Bias Indices (TBI) were calculated for each stimuli type (i.e., words and symbols). In the emotional Stroop task, TBI = mean ln(RT) for threatening stimuli minus mean ln(RT) for neutral stimuli. In the dot probe task, TBI = mean ln(RT) for incongruent trials minus mean ln(RT) for congruent trials. In both tasks, a positive TBI indicates an attentional bias towards threat. Preliminary analysis indicated that scores on the social desirability scale was not significantly correlated with the TBI. Hence, social desirability was not included in further analyses. The means and standard deviations of the STARS (Cruise et al., 1985) and the TBI for each group are presented in Table 1. A one-way between-subjects MANOVA was conducted with group as the independent variable (NeverTakenStats vs. TakingStats, vs. TakenStats), and the first three factors of the STARS and the four TBI as dependent variables to examine differences between groups. No statistically significant differences were found, F (12, 182) = 1.59, p = .97; Wilks’ Lambda =.82. Hence, results were collapsed across groups. The descriptive statistics are presented in Table 2. The median percentile rank equivalent scores (MPRES) for the STARS ranges from 68 to 83, suggesting that the current sample is a group high on statistics anxiety.

Journal of Articles in Support of the Null Hypothesis. JASNH, 2017, Vol. 13, No. 298
A series of four multiple regressions was used to examine the ability of the three factors of statistics anxiety (Interpretation Anxiety, Test and Class Anxiety, and Fear of Asking for Help) to predict each of the four TBI. Assumption tests were conducted to ensure no violation of multicollinearity, normality, linearity, homoscedasticity, and independence of residuals. The three factors of statistics anxiety did not significantly predict each of the four TBI. The results are presented in Table 3.
Table 2. Means and Standard Deviations of the STARS and the TBI (Collapsed Across Groups)
Note. Untransformed data (i.e., mean RT in millisecond) are reported in this table for the TBI. Multiple regression analyses were conducted on transformed data (i.e., ln RT).
Note. Untransformed data (i.e., mean RT in millisecond) are reported in this table for the TBI. Multiple regression analyses were conducted on transformed data (i.e., ln RT). MPRES = median percentile rank equivalent scores. The MPRES were obtained by comparing median anxiety scores to the percentile rank norms pertaining to undergraduate students reported by Cruise et al. (1985).
Table 1. Means (Standard Deviations) of the STARS and the TBI for each Group
STATISTICS ANXIETY 13
conducted with group as the independent variable (NeverTakenStats vs. TakingStats, vs.
TakenStats), and the first three factors of the STARS and the four TBI as dependent variables
to examine differences between groups. No statistically significant differences were found, F
(12, 182) = 1.59, p = .97; Wilks’ Lambda =.82. Hence, results were collapsed across groups.
The descriptive statistics are presented in Table 2. The median percentile rank equivalent
scores (MPRES) for the STARS ranges from 68 to 83, suggesting that the current sample is a
group high on statistics anxiety.
Table 1 Means (Standard Deviations) of the STARS and the TBI for each Group
NeverTakenStats TakingStats TakenStats
Statistics Anxiety
Interpretation Anxiety
Test and Class Anxiety
Fear of Asking for Help
30.8
26.9
11.0
(7.2)
(6.0)
(3.5)
28.1
25.1
9.4
(8.3)
(6.5)
(3.1)
28.4
27.3
10.2
(9.2)
(5.7)
(4.1)
Emotional Stroop task
TBI for words
TBI for symbols
17.4
-17.0
(60.1)
(207.8)
30.6
53.1
(71.8)
(162.6)
.1
-15.7
(66.2)
(196.0)
Dot probe task
TBI for words
TBI for symbols
9.0
-25.6
(26.6)
(66.6)
3.8
-4.0
(21.6)
(53.5)
-2.2
4.6
(26.9)
(43.0)
Note. Untransformed data (i.e., mean RT in millisecond) are reported in this table for the TBI. Multiple regression analyses were conducted on transformed data (i.e., ln RT).
STATISTICS ANXIETY 14
Table 2 Means and Standard Deviations of the STARS and the TBI (Collapsed Across Groups)
RT Tasks M SD
Emotional Stroop task
TBI for words
TBI for symbols
16.3
5.3
66.2
191.9
Dot probe task
TBI for words
TBI for symbols
4.0
-9.7
25.4
57.2
Statistics Anxiety M SD Median MPRES
Interpretation Anxiety
Test and Class Anxiety
Fear of Asking for Help
29.2
26.5
10.2
8.2
6.1
3.6
30
27
11
77
68
83
Note. Untransformed data (i.e., mean RT in millisecond) are reported in this table for the TBI. Multiple regression analyses were conducted on transformed data (i.e., ln RT). MPRES = median percentile rank equivalent scores. The MPRES were obtained by comparing median anxiety scores to the percentile rank norms pertaining to undergraduate students reported by Cruise et al. (1985).
A series of four multiple regressions was used to examine the ability of the three
factors of statistics anxiety (Interpretation Anxiety, Test and Class Anxiety, and Fear of
Asking for Help) to predict each of the four TBI. Assumption tests were conducted to ensure
no violation of multicollinearity, normality, linearity, homoscedasticity, and independence of
residuals. The three factors of statistics anxiety did not significantly predict each of the four
TBI. The results are presented in Table 3.
Table 3 Four Standard Multiple Regressions Predicting Each of the Four TBI
Emotional Stroop task Dot probe task TBI Words TBI Symbols TBI Words TBI Symbols Variables β β β β Interpretation Anxiety Test and Class Anxiety Fear of Asking for Help R2
.03 -.13 .21 .04
.09 -.20 .18 .04
.08 -.07 .03 .01
.05
.05 -.08 .01

99Statistics anxiety
Discussion
The results provide no support for either the interference hypothesis or the facilitation hypothesis. No evidence of attentional bias in statistics anxiety was found for either the emotional Stroop task or the dot probe task. These results are consistent with a previous study (Chew et al., 2014) but inconsistent with the attentional bias literature, where attentional bias was documented among many types of anxieties in both clinical and non-clinical populations (Bar-Haim et al., 2007). Conducting the experiment in a laboratory yielded marginal benefits. Consistent with a previous study (Chew et al., 2014), no evidence of attentional bias was found in the current experiment. These results suggest that there was no difference to participants in terms of attentional bias in completing the experiment online or in a laboratory. Currently, only a handful of attention bias studies are conducted online (e.g., MacLeod, Soong, Rutherford, & Campbell, 2007), with most studies conducted in a laboratory. Our results suggest that future research could be conducted online to improve ecological validity and ease of administration. Participants from all three groups (NeverTakenStats vs. TakingStats, vs. TakenStats) had similar levels of statistics anxiety and TBI. This result supports our expanded definition of statistics anxiety and our observation that students experience statistics anxiety before enrolling in a statistics course. An in-depth discussion of the implications is beyond the scope of the current research agenda. However, future research could examine the causes of this form of anticipatory anxiety and implement interventions to reduce it. Finally, the absence of attentional bias among the NeverTakenStats group suggests that the suppression effect was not responsible for the nonsignificant results in the previous study (Chew et al., 2014). Studies that investigated attentional bias in OCD might explain the nonsignificant results in statistics anxiety. A review suggested that OCD is partially unique as a heterogeneous disorder; attentional bias was consistently demonstrated only among participants with contamination concerns (Summerfeldt & Endler, 1998). Indeed, subsequent research found no evidence of attentional bias among OCD patients with checking concerns (Harkness, Harris, Jones, & Vaccaro, 2009; Moritz & von Mühlenen, 2008). Similarly, the nonsignificant results obtained so far could be due to the incorrect conceptualization of statistics anxiety
Table 3. Means (Standard Deviations) of the STARS and the TBI for each Group
Note. No statistically significant results were found.
STATISTICS ANXIETY 15
Table 3 Four Standard Multiple Regressions Predicting Each of the Four TBI
Emotional Stroop task Dot probe task
TBI Words TBI Symbols TBI Words TBI Symbols
Variables β β β β
Interpretation Anxiety
Test and Class Anxiety
Fear of Asking for Help
R2
F (3, 98)
p
.03
-.13
.21
.04
1.30
.28
.09
-.20
.18
.04
1.28
.29
.08
-.07
.03
.01
.15
.93
.05
.05
-.08
.01
.19
.90
Note. No statistically significant results were found.
Discussion
The results provide no support for either the interference hypothesis or the facilitation
hypothesis. No evidence of attentional bias in statistics anxiety was found for either the
emotional Stroop task or the dot probe task. These results are consistent with a previous study
(Chew et al., 2014) but inconsistent with the attentional bias literature, where attentional bias
was documented among many types of anxieties in both clinical and non-clinical populations
(Bar-Haim et al., 2007).
Conducting the experiment in a laboratory yielded marginal benefits. Consistent with
a previous study (Chew et al., 2014), no evidence of attentional bias was found in the current
experiment. These results suggest that there was no difference to participants in terms of
attentional bias in completing the experiment online or in a laboratory. Currently, only a
handful of attention bias studies are conducted online (e.g., MacLeod, Soong, Rutherford, &
Campbell, 2007), with most studies conducted in a laboratory. Our results suggest that future
research could be conducted online to improve ecological validity and ease of administration.
R2
Journal of Articles in Support of the Null Hypothesis. JASNH, 2017, Vol. 13, No. 2100
as a homogeneous construct. This conceptualization led to the selection of statistics-related words and symbols as stimuli for the tasks. Although these stimuli were rated more negatively than their neutral counterparts (Chew et al., 2014), the nonsignificant results indicate that these stimuli might not be relevant to the concerns of students high in statistics anxiety. The three factors of statistics anxiety are often taken as indicators of a global, homogeneous construct (i.e., statistics anxiety). However, each of those factors assesses anxiety in different situations and are associated with different student concerns. Hence, more relevant stimuli could be used by considering each factor individually. For example, students high in Fear of Asking for Help might share similar concerns with individuals high in social anxiety. These students should exhibit attentional bias toward words associated with social anxiety (Mathews, Mogg, May, & Eysenck, 1989). This conjecture is examined in Experiment 2.
Experiment 2
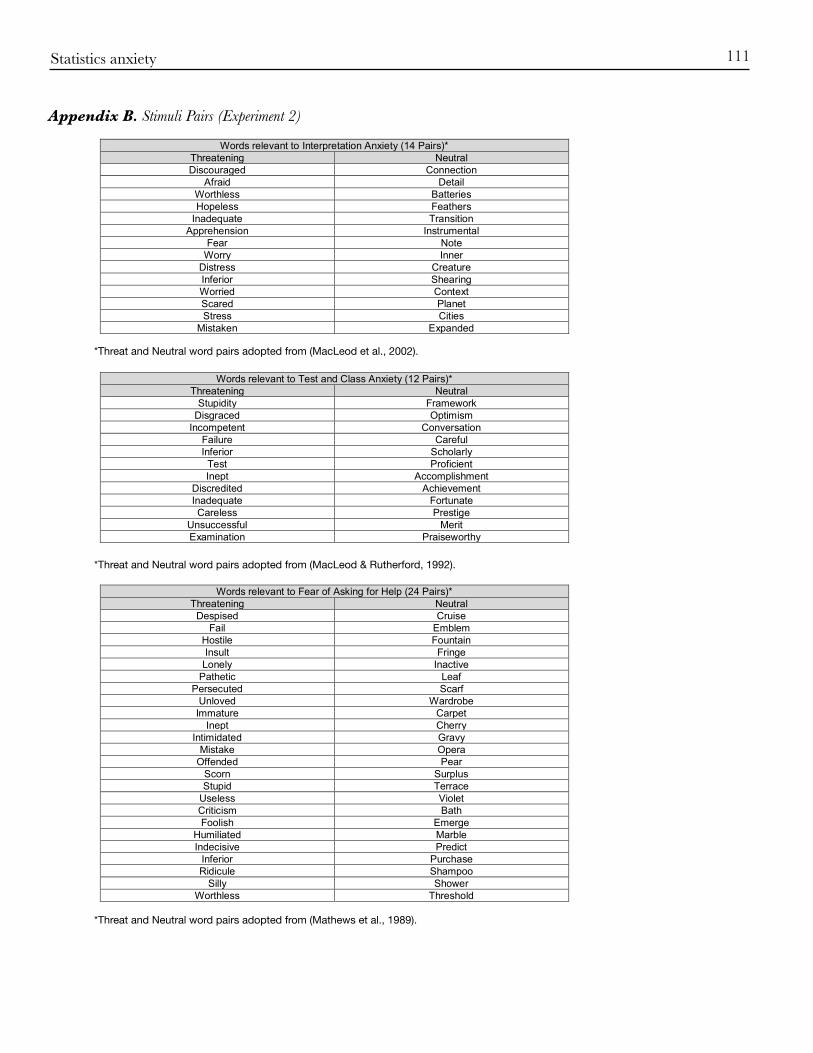
Experiment 2 examined the conjecture that students high in each factor of statistics anxiety would exhibit attentional bias toward stimuli relevant to their concerns. The three factors of statistics anxiety were considered individually and relevant stimuli were adapted from other studies. Specifically, ego-threat words (e.g., inferior) were used for Interpretation Anxiety (MacLeod et al., 2002), exam-related threat words (e.g., stupidity) for Test and Class Anxiety (MacLeod & Rutherford, 1992), and social anxiety threat words (e.g., ridicule) for Fear of Asking for Help (Mathews et al., 1989). In each of these studies, participants with high scores on the trait scale of the State-Trait Anxiety Inventory (STAI) showed an attentional bias toward the threat words. Hence, the STAI was administered to control for the effects of general anxiety.
Method
Participants
Participants were 110 psychology undergraduates at James Cook University. Data from six participants (5%) were removed due to missing data. The final sample consisted of 104 participants (67% females) from the James Cook University Singapore campus. Their ages ranged from 17 to 44 years (M = 22.13, SD = 3.42). Participants were divided into three groups based on their experience with statistics courses: 37 participants had never taken a statistics course before but will enroll in one in the future (NeverTakenStats), 30 participants were currently enrolled in a statistics course (TakingStats), and 37 participants had successfully completed at least one statistics course but were not currently enrolled in a statistics course (TakenStats). All participants had normal or corrected-to-normal eyesight and were not color blind. Participants were either granted extra course credit or were given a movie voucher for their participation in the experiment. Post hoc power analysis revealed an obtained power of .97 (alpha = .05) and .90 (alpha = .01) (Faul et al., 2009).
Stimuli
The stimuli are presented in Appendix B. A total of 50 pairs of words was used:

101Statistics anxiety
14 pairs of words were used for Interpretation Anxiety (MacLeod et al., 2002), 12 pairs of words for Test and Class Anxiety (MacLeod & Rutherford, 1992), and 24 pairs of words for Fear of Asking for Help (Mathews et al., 1989). The threat words were matched on average length and frequency with the neutral words. Some words were repeated because they are relevant to more than one factor of statistics anxiety. For example, the word ‘inadequate’ is relevant to both Interpretation Anxiety and Test and Class Anxiety.
Tasks
The tasks were similar to those for Experiment 1. However, participants completed a different number of trials due to a different set of stimuli. For the emotional Stroop task, participants completed 20 practice trials to familiarize with the task before completing 100 experimental trials (50 threat words and 50 neutral words). For the dot probe task, participants completed 10 practice trials to familiarize with the task before completing 100 experimental trials (50 pairs of words).
Instruments
STAI. Form Y of the STAI is a two-part, 40-item instrument designed to assess the two factors of general anxiety (Spielberger, Gorsuch, & Lushene, 1970). Part 1 consists of 20 items which assess state anxiety (STAI-S; e.g., I am tense). Participants respond on a 4-point Likert scale that ranges from 1 = not at all to 4 = very much So. Appropriate item scores are summed, with higher scores indicating higher levels of state anxiety. Part 2 consists of 20 items which assess trait anxiety (STAI-T; e.g., I am content). Participants respond on a four- point Likert scale that ranges from 1 = almost never to 4 = almost always. Appropriate item scores are summed, with higher scores indicating higher levels of trait anxiety. Each factor has potential scores that range from 20 to 80. Spielberger et al. (1970) reported internal consistencies that ranged from .86 to .95 and two-month test-retest reliabilities that ranged from .65 to .75 for the two factors. The current experiment found an internal consistency of .93 for each of the two factors.
Procedure
As mentioned, a different set of stimuli was used in the current experiment, resulting in minor changes to the tasks (i.e., different number of trials). Furthermore, participants completed the STAI (Spielberger et al., 1970) in addition to the instruments used in Experiment 1. The remaining procedure was identical to Experiment 1.
Results
All results were analyzed using SPSS version 21. Alpha was set at .01 to reduce the chance of Type 1 errors due to multiple comparisons. Incorrect responses were removed from the RT data. The descriptives of incorrect responses for each stimuli type are presented in Table 4. Incorrect responses accounted for 5.9% of the data. Similar to Experiment 1, the data were prepared by applying a logarithmic transformation to normalize the distribution (Ratcliff, 1993) and calculating TBI for each stimuli type.

Journal of Articles in Support of the Null Hypothesis. JASNH, 2017, Vol. 13, No. 2102
Preliminary analysis indicated that scores on the social desirability, trait anxiety, and state anxiety scales were not significantly correlated with the TBI. Hence, these variables were not included in further analyses. The means and standard deviations of the STARS (Cruise et al., 1985) and the TBI for each group are presented in Table 5. A one-way between-subjects MANOVA was conducted with groups as the independent variable (NeverTakenStats vs. TakingStats, vs. TakenStats), and the first three factors of the STARS and the six TBI as dependent variables to examine differences between groups. No statistically significant difference was found, F(18, 186) = 0.66, p = .85; Wilks’ Lambda = .88. Hence, results were collapsed across groups. The descriptive statistics are presented in Table 6. The median percentile rank equivalent scores (MPRES) for the STARS ranges from 68 to 83, suggesting that the current sample is a group high on statistics anxiety.
STATISTICS ANXIETY 20
Range
Stimuli Median M SD Minimum Maximum
Emotional Stroop task
Ego-threat words
Exam-related words
Social Anxiety words
1.00
1.00
2.00
1.49
1.35
2.50
1.71
1.40
2.23
0
0
0
8
5
12
Dot probe task
Ego-threat words
Exam-related words
Social Anxiety words
1.50
1.00
2.00
1.80
1.48
3.19
1.57
2.02
3.05
0
0
0
6
17
13
Preliminary analysis indicated that scores on the social desirability, trait anxiety, and
state anxiety scales were not significantly correlated with the TBI. Hence, these variables
were not included in further analyses. The means and standard deviations of the STARS
(Cruise et al., 1985) and the TBI for each group are presented in Table 5. A one-way
between-subjects MANOVA was conducted with groups as the independent variable
(NeverTakenStats vs. TakingStats, vs. TakenStats), and the first three factors of the STARS
and the six TBI as dependent variables to examine differences between groups. No
statistically significant difference was found, F(18, 186) = 0.66, p = .85; Wilks’ Lambda
=.88. Hence, results were collapsed across groups. The descriptive statistics are presented in
Table 6. The median percentile rank equivalent scores (MPRES) for the STARS ranges from
68 to 83, suggesting that the current sample is a group high on statistics anxiety.
Table 5 Means (Standard Deviations) of the STARS and the TBI for each Group
NeverTakenStats TakingStats TakenStats Statistics Anxiety Interpretation Anxiety Test and Class Anxiety Fear of Asking for Help
31.4 26.1 10.1
(8.8) (7.9) (4.0)
29.9 26.1 9.9
(10.6) (8.5) (4.8)
32.5 27.6 11.1
(8.3) (6.4) (4.0)
Emotional Stroop task TBI for Ego-threat words
-3.2
(119.9)
16.0
(130.3)
-10.1
(194.8)
Table 4. Descriptives of Incorrect Responses for each Stimuli Type
Table 5. Means (Standard Deviations) of the STARS and the TBI for each Group
Note. Untransformed data (i.e., mean RT in millisecond) are reported in this table for the TBI. Correlations and simple regression analyses were conducted on transformed data (i.e., ln RT).
STATISTICS ANXIETY 22
Table 5 Means (Standard Deviations) of the STARS and the TBI for each Group
NeverTakenStats TakingStats TakenStats
Statistics Anxiety
Interpretation Anxiety
Test and Class Anxiety
Fear of Asking for Help
31.4
26.1
10.1
(8.8)
(7.9)
(4.0)
29.9
26.1
9.9
(10.6)
(8.5)
(4.8)
32.5
27.6
11.1
(8.3)
(6.4)
(4.0)
Emotional Stroop task
TBI for Ego-threat words
TBI for Exam-related words
TBI for Social Anxiety words
-3.2
26.1
-7.2
(119.9)
(405.8)
(103.2)
16.0
-16.8
-.9
(130.3)
(15.0)
(85.8)
-10.1
-.1
5.9
(194.8)
(131.7)
(118.0)
Dot probe task
TBI for Ego-threat words
TBI for Exam-related words
TBI for Social Anxiety words
.6
-3.5
63.4
(39.4)
(37.3)
(282.6)
-19.9
-2.2
3.41
(85.9)
(41.6)
(38.8)
.6
16.5
-3.6
(47.6)
(113.6)
(28.8)
Note. Untransformed data (i.e., mean RT in millisecond) are reported in this table for the TBI. Correlations and simple regression analyses were conducted on transformed data (i.e., ln RT). Table 6 Means and Standard Deviations of the STARS and the TBI (Collapsed Across Groups)
RT Tasks M SD
Emotional Stroop task
TBI for Ego-threat words
TBI for Exam-related words
TBI for Social Anxiety words
-.1
4.4
-.7
152.3
271.2
103.4
Dot probe task
TBI for Ego-threat words
TBI for Exam-related words
TBI for Social Anxiety words
-5.3
4.0
22.3
59.2
74.6
172.6
Statistics Anxiety M SD Median MPRES
Interpretation Anxiety
Test and Class Anxiety
Fear of Asking for Help
31.4
26.7
10.4
8.8
7.6
4.2
32
27
10
83
68
77
Note. Untransformed data (i.e., mean RT in millisecond) are reported in this table for the TBI. Correlations and simple regression analyses were conducted on transformed data (i.e.,

103Statistics anxiety
A series of six simple linear regressions was used to examine the ability of the three factors of statistics anxiety (Interpretation Anxiety, Test and Class Anxiety, and Fear of Asking for Help) to predict the TBI of their relevant stimuli. Assumption tests were conducted to ensure no violation of linearity, homoscedasticity, and independence of residuals. The results are presented in Table 7. The three factors of statistics anxiety did not significantly predict the TBI.
Table 6. Means and Standard Deviations of the STARS and the TBI (Collapsed Across Groups)
Table 7. Six Simple Regression Outcomes with the Three Factors of Statistics Anxiety as Predictors and the Six TBI as Criteria
Note. No statistically significant results were found.
Note. Untransformed data (i.e., mean RT in millisecond) are reported in this table for the TBI. Correlations and simple regression analyses were conducted on transformed data (i.e., ln RT). MPRES = median percentile rank equivalent scores. The MPRES were obtained by comparing median anxiety scores to the percentile rank norms pertaining to undergraduate students reported by Cruise et al. (1985).
STATISTICS ANXIETY 22
Table 5 Means (Standard Deviations) of the STARS and the TBI for each Group
NeverTakenStats TakingStats TakenStats
Statistics Anxiety
Interpretation Anxiety
Test and Class Anxiety
Fear of Asking for Help
31.4
26.1
10.1
(8.8)
(7.9)
(4.0)
29.9
26.1
9.9
(10.6)
(8.5)
(4.8)
32.5
27.6
11.1
(8.3)
(6.4)
(4.0)
Emotional Stroop task
TBI for Ego-threat words
TBI for Exam-related words
TBI for Social Anxiety words
-3.2
26.1
-7.2
(119.9)
(405.8)
(103.2)
16.0
-16.8
-.9
(130.3)
(15.0)
(85.8)
-10.1
-.1
5.9
(194.8)
(131.7)
(118.0)
Dot probe task
TBI for Ego-threat words
TBI for Exam-related words
TBI for Social Anxiety words
.6
-3.5
63.4
(39.4)
(37.3)
(282.6)
-19.9
-2.2
3.41
(85.9)
(41.6)
(38.8)
.6
16.5
-3.6
(47.6)
(113.6)
(28.8)
Note. Untransformed data (i.e., mean RT in millisecond) are reported in this table for the TBI. Correlations and simple regression analyses were conducted on transformed data (i.e., ln RT). Table 6 Means and Standard Deviations of the STARS and the TBI (Collapsed Across Groups)
RT Tasks M SD
Emotional Stroop task
TBI for Ego-threat words
TBI for Exam-related words
TBI for Social Anxiety words
-.1
4.4
-.7
152.3
271.2
103.4
Dot probe task
TBI for Ego-threat words
TBI for Exam-related words
TBI for Social Anxiety words
-5.3
4.0
22.3
59.2
74.6
172.6
Statistics Anxiety M SD Median MPRES
Interpretation Anxiety
Test and Class Anxiety
Fear of Asking for Help
31.4
26.7
10.4
8.8
7.6
4.2
32
27
10
83
68
77
Note. Untransformed data (i.e., mean RT in millisecond) are reported in this table for the TBI. Correlations and simple regression analyses were conducted on transformed data (i.e.,
STATISTICS ANXIETY 23
ln RT). MPRES = median percentile rank equivalent scores. The MPRES were obtained by comparing median anxiety scores to the percentile rank norms pertaining to undergraduate students reported by Cruise et al. (1985).
A series of six simple linear regressions was used to examine the ability of the three
factors of statistics anxiety (Interpretation Anxiety, Test and Class Anxiety, and Fear of
Asking for Help) to predict the TBI of their relevant stimuli. Assumption tests were
conducted to ensure no violation of linearity, homoscedasticity, and independence of
residuals. The results are presented in Table 7. The three factors of statistics anxiety did not
significantly predict the TBI.
Table 7 Six Simple Regression Outcomes with the Three Factors of Statistics Anxiety as Predictors and the Six TBI as Criteria
Predictors Criteria β R2 F (1, 103) p
Interpretation Anxiety
Test and Class Anxiety
Fear of Asking for Help
Emotional Stroop task
TBI for Ego-threat words
TBI for Exam-related words
TBI for Social Anxiety words
.21
-.11
-.02
.05
.01
.00
4.89
1.23
.06
.03
.27
.81
Interpretation Anxiety
Test and Class Anxiety
Fear of Asking for Help
Dot probe task
TBI for Ego-threat words
TBI for Exam-related words
TBI for Social Anxiety words
.11
.01
-.02
.01
.00
.00
1.26
.00
.04
.27
.95
.85
Note. No statistically significant results were found.
Discussion
The results provide no support for either the interference hypothesis or the facilitation
hypothesis. No evidence of attentional bias in statistics anxiety was found for either the
emotional Stroop task or the dot probe task. These results are consistent with a previous study
(Chew et al., 2014) and Experiment 1, but inconsistent with the attentional bias literature,
R2

Journal of Articles in Support of the Null Hypothesis. JASNH, 2017, Vol. 13, No. 2104
Discussion
The results provide no support for either the interference hypothesis or the facilitation hypothesis. No evidence of attentional bias in statistics anxiety was found for either the emotional Stroop task or the dot probe task. These results are consistent with a previous study (Chew et al., 2014) and Experiment 1, but inconsistent with the attentional bias literature, where attentional bias was documented among many types of anxieties in both clinical and non-clinical populations (Bar-Haim et al., 2007). Individuals high in each factor of statistics anxiety did not exhibit attentional bias toward threatening stimuli relevant to their concerns. These results suggested no differences in conceptualizing statistics anxiety as a homogeneous construct (Chew et al., 2014 and Experiment 1) or as a multidimensional construct consisting of three factors (Experiment 2) since attentional bias was absent in both conceptualizations. This finding differentiates statistics anxiety from OCD. OCD is partially unique because attentional bias was found only among participants with contamination concerns (Summerfeldt & Endler, 1998) and not with checking concerns (Harkness et al., 2009; Moritz & von Mühlenen, 2008). In contrast, statistics anxiety is unique due to the complete absence of attentional bias on both a global level (Chew et al., 2014 and Experiment 1) and on the individual factors level (Experiment 2).
General Discussion
The purpose of the current study was to examine the role of attentional bias in statistics anxiety. The results of the two experiments provide no support for either the interference hypothesis or the facilitation hypothesis. The findings eliminate some alternative explanations (perceived limitations) for the nonsignificant results: (a) conducting the study online, (b) suppression of attentional bias, and (c) conceptualizing statistics anxiety as a global, homogeneous construct. These eliminations support Chew et al. (2014)’s initial explanation for their nonsignificant results: the cognitive processes that underlie statistics anxiety might be different from that of other anxieties. Attentional bias is a central feature of anxieties (Bar-Haim et al., 2007). Yet, no evidence of attentional bias was found in statistics anxiety, suggesting that this form of anxiety is unique among anxieties. The four-stage theoretical model proposed by Bar-Haim et al. (2007) does not explain the results of the current study. For example, the absence of attentional bias could be due to the Guided Threat Evaluation System (GTES) overriding the anxious state of the Resource Allocation System (RAS). However, this explanation is unlikely for two reasons. First, it is unclear why the GTES would malfunction for other anxieties but not for statistics anxiety. Second, an override is only possible with contrary evidence from context, memory, or from prior learning. Our study showed that students report high levels of statistics anxiety regardless of their experience with statistics courses. These results suggest that the context (for students who were TakingStats), memory and prior learning (for students who have TakenStats) of these individuals would provide supporting, instead of contrary, evidence for the anxious state of the RAS. The lack of an override would eventually facilitate the development of an attentional bias. The four-stage theoretical model (Bar-Haim et al., 2007) was modified by adding an Exception to accommodate the results of the current study (see Figure 2). Since threatening

105Statistics anxiety
stimuli were rated more negatively than neutral stimuli, the Preattentive Threat Evaluation System (PTES) should consider the stimuli as high threat. However, instead of proceeding directly to the RAS, an Exception occurs where individuals with statistics anxiety allocate a low priority to the highly threatening stimuli in the RAS. This process eventually result in an absence of attentional bias. Given that attentional bias was not found among OCD checkers (Harkness et al., 2009; Moritz & von Mühlenen, 2008), future research should investigate if this form of anxiety could be classified with statistics anxiety because it might explain why the Exception occurs. Harkness et al. (2009) postulated that the absence of attentional bias among OCD checkers could be due to these individuals interpreting danger “based on the absence of disconfirming evidence rather than the presence of danger signals, that is, OCD checkers may preferentially seek indicators of safety [instead of being] vigilant for indicators of danger.” (p. 441). Hence, an Exception occurs because these individuals are not vigilant for threatening stimuli in the environment. Accordingly, when confronted with such stimuli, these individuals will assign a low priority to the stimuli and continue to pursue ongoing activity. Statistics anxiety might operate in a similar manner. For example, students with Fear of Asking for Help would be vigilant for indicators of safety, such as the presence of a friendly instructor, in a statistics course. In the absence of such indicators, the high anxiety levels of these students will probably be maintained. Conversely, in the presence of such indicators, the anxiety levels of these students might possibly be reduced. While speculative, this account offers an explanation for the effectiveness of some interventions for statistics anxiety. Research has shown that instructors can reduce students’ levels of statistics anxiety by using humor in class (Wilson, 1999) or increasing their use of immediacy
STATISTICS ANXIETY 23
instead of contrary, evidence for the anxious state of the RAS. The lack of an override would
eventually facilitate the development of an attentional bias.
The four-stage theoretical model (Bar-Haim et al., 2007) was modified by adding an
Exception to accommodate the results of the current study (see Figure 2). Since threatening
stimuli were rated more negatively than neutral stimuli, the Preattentive Threat Evaluation
System (PTES) should consider the stimuli as high threat. However, instead of proceeding
directly to the RAS, an Exception occurs where individuals with statistics anxiety allocate a
low priority to the highly threatening stimuli in the RAS. This process eventually result in an
absence of attentional bias.
Figure 2. The addition of an Exception as a modification to the four-stage theoretical model (Bar-Haim et al., 2007).
Given that attentional bias was not found among OCD checkers (Harkness et al.,
2009; Moritz & von Mühlenen, 2008), future research should investigate if this form of
anxiety could be classified with statistics anxiety because it might explain why the Exception
occurs. Harkness et al. (2009) postulated that the absence of attentional bias among OCD
checkers could be due to these individuals interpreting danger “based on the absence of
disconfirming evidence rather than the presence of danger signals, that is, OCD checkers may
Figure 2. The addition of an Exception as a modification to the four-stage theoretical model (Bar-Haim et al., 2007).

Journal of Articles in Support of the Null Hypothesis. JASNH, 2017, Vol. 13, No. 2106
behaviors (Williams, 2010). However, these interventions do not modify the threat. Instead, by using these interventions, the instructor will be perceived as approachable and friendly by students. Consequently, the instructor serves as an indicator of safety, resulting in a reduction in students’ levels of anxiety. Alternatively, the absence of attentional bias could be due to the nature of statistics anxiety. Given that statistics anxiety is only experienced when learning or using statistics (i.e., a situation-specific anxiety; Cruise et al., 1985; Onwuegbuzie et al., 1997; Zeidner, 1991), the inclusion of context might be necessary to elicit a cognitive bias. In other words, statistics-related words and symbols (Chew et al., 2014 and Experiment 1 of the current study) and general words (Experiment 2) might be insufficient to elicit a cognitive bias when presented alone to the participants. Accordingly, future research should investigate the role of interpretation bias in statistics anxiety. Individuals high in statistics anxiety might interpret ambiguous events in a threatening manner, effectively reinforcing their anxiety. This form of bias is often examined through the use of incomplete sentences which provides a context to the situation (Beard, 2011; Hertel & Mathews, 2011; MacLeod & Mathews, 2012). For example, in response to an ambiguous incomplete sentence: ‘the lecturer is ... confident that I will do well in the statistics examination,’ anxious individuals might be faster in responding to the word ‘not’ (resolving the ambiguity negatively) than the word ‘very’ (resolving the ambiguity positively). Future research should investigate which of the two cognitive mechanisms (i.e., vigilant for safety indicators vs. interpretation bias) underlie statistics anxiety. Subsequently, relevant interventions can be developed (i.e., inclusion of safety indicators in classrooms vs. interpretation training) to reduce statistics anxiety. Limitations of the study should be noted. First, the stimuli used in Experiment 2 were not rated by participants for negativity (cf. Experiment 1). However, once attentional bias has been found using a set of stimuli, it is common for subsequent studies to adopt the stimuli without re-evaluating them for negativity. For example, the same set of stimuli from a previous study (MacLeod et al., 2002) was used in subsequent studies (Amir, Beard, Burns, & Bomyea, 2009; MacLeod et al., 2007). Hence, although this limitation could be controlled for in future research by having participants rate the stimuli in a pilot study, it is unlikely that this procedure would have an effect on the results. Second, although trait anxiety was related to attentional bias in previous studies that used the same stimuli (e.g., MacLeod & Rutherford, 1992), no such correlations were found in Experiment 2, indicating a failure to replicate the attentional bias effect for general anxiety. This finding has the potential to reduce the validity of the experiment. Specifically, are the nonsignificant results for statistics anxiety indicative of a different underlying cognitive mechanism or were the methods inadequate to produce the attentional bias effect? The latter explanation seems unlikely given that Experiment 2 had sufficient power to detect significant differences, and uses the same stimuli and type of participants (i.e., nonclinical student population) as previous studies (e.g., MacLeod & Rutherford, 1992). Nevertheless, the lack of correlations between trait anxiety and attentional bias in Experiment 2 warrants future investigations. Limitations notwithstanding, the current study provides first evidence for a form of anxiety without attentional bias. The current study addressed perceived limitations of the methods and showed that statistics anxiety is unique among anxieties due to the complete absence of attentional bias on both a global level and on the individual factors level. Given the well-documented negative effects of statistics anxiety (e.g., Hanna & Dempster, 2009; Onwuegbuzie & Seaman, 1995), there is a pressing need to identify the cognitive

107Statistics anxiety
mechanism underlying this form of anxiety to inform the development of effective, theory-based interventions.
References
Amir, N., Beard, C., Burns, M., & Bomyea, J. (2009). Attention modification program in individuals with generalized anxiety disorder. Journal of Abnormal Psychology, 118(1), 28–33. http://doi.org/10.1037/a0012589
Amir, N., Mcnally, R. J., Riemann, B. C., Burns, J., Lorenz, M., & Mullen, J. T. (1996). Suppression of the emotional Stroop effect by increased anxiety in patients with social phobia. Behaviour Research and Therapy, 34(11–12), 945–948. http://doi.org/10.1016/S0005-7967(96)00054-X
Bar-Haim, Y. (2010). Research review: Attention bias modification (ABM): A novel treatment for anxiety disorders. Journal of Child Psychology and Psychiatry, 51(8), 859–870.
Bar-Haim, Y., Lamy, D., Pergamin, L., Bakermans-Kranenburg, M. J., & Van IJzendoorn, M. H. (2007). Threat-related attentional bias in anxious and nonanxious individuals: A meta-analytic study. Psychological Bulletin, 133(1), 1–24.
Beard, C. (2011). Cognitive bias modification for anxiety: Current evidence and future directions. Expert Review of Neurotherapeutics, 11(2), 299–311. http://doi.org/10.1586/ern.10.194
Beck, A. T. (1976). Cognitive therapy and the emotional disorders. New York, NY: International Universities Press.Beck, A. T., & Clark, D. A. (1988). Anxiety and depression: An information processing perspective. Anxiety
Research, 1(1), 23–36. http://doi.org/10.1080/10615808808248218Beck, A. T., & Clark, D. A. (1997). An information processing model of anxiety: Automatic and strategic
processes. Behaviour Research and Therapy, 35(1), 49–58. http://doi.org/10.1016/S0005-7967(96)00069-1Bower, G. H. (1981). Mood and memory. American Psychologist, 36(2), 129–148.Bower, G. H. (1987). Commentary on mood and memory. Behaviour Research and Therapy, 25(6), 443–455.Chew, P. K. H., & Dillon, D. B. (2014a). Statistics anxiety and the Big Five personality factors. Procedia - Social
and Behavioral Sciences, 112, 1177–1186. http://doi.org/10.1016/j.sbspro.2014.01.1282Chew, P. K. H., & Dillon, D. B. (2014b). Statistics anxiety update: Refining the construct and recom-
mendations for a new research agenda. Perspectives on Psychological Science, 9(2), 196–208. http://doi.org/10.1177/1745691613518077
Chew, P. K. H., Swinbourne, A., & Dillon, D. B. (2014). No evidence of attentional bias in statistics anxiety. The European Journal of Social & Behavioural Sciences, 10(3), 1451–1465. http://doi.org/10.15405/ejsbs.131
Cisler, J. M., & Koster, E. H. (2010). Mechanisms of attentional biases towards threat in anxiety disorders: An integrative review. Clinical Psychology Review, 30(2), 203–216.
Constans, J. I., McCloskey, M. S., Vasterling, J. J., Brailey, K., & Mathews, A. (2004). Suppression of attentional bias in PTSD. Journal of Abnormal Psychology, 113(2), 315–323. http://dx.doi.org.elibrary.jcu.edu.au/10.1037/0021-843X.113.2.315
Crowne, D. P., & Marlowe, D. (1960). A new scale of social desirability independent of psychopathology. Journal of Consulting Psychology, 24(4), 349–354.
Cruise, R. J., Cash, R. W., & Bolton, D. L. (1985, August). Development and validation of an instrument to measure statistical anxiety. Paper presented at the annual meeting of the Statistical Education Section, Chicago, IL.
Davies, M., & Gardner, D. (2010). A frequency dictionary of contemporary American English: Word sketches, collocates, and thematic lists. New York: Routledge.
De Clercq, A., Crombez, G., Buysse, A., & Roeyers, H. (2003). A simple and sensitive method to measure timing accuracy. Behavior Research Methods, 35(1), 109–115.
De Ruiter, C., & Brosschot, J. F. (1994). The emotional Stroop interference effect in anxiety: Attentional bias or cognitive avoidance? Behaviour Research and Therapy, 32(3), 315–319.
Journal of Articles in Support of the Null Hypothesis. JASNH, 2017, Vol. 13, No. 2108
Egloff, B., & Hock, M. (2003). Assessing attention allocation toward threat-related stimuli: A comparison of the emotional Stroop task and the attentional probe task. Personality and Individual Differences, 35(2), 475–483. http://doi.org/10.1016/S0191-8869(02)00265-9
Faul, F., Erdfelder, E., Buchner, A., & Lang, A.-G. (2009). Statistical power analyses using G*Power 3.1: Tests for correlation and regression analyses. Behavior Research Methods, 41(4), 1149–1160. http://doi.org/10.3758/BRM.41.4.1149
Hanna, D., & Dempster, M. (2009). The effect of statistics anxiety on students’ predicted and actual test scores. The Irish Journal of Psychology, 30(3-4), 201–209. http://doi.org/10.1080/03033910.2009.10446310
Harkness, E. L., Harris, L. M., Jones, M. K., & Vaccaro, L. (2009). No evidence of attentional bias in obsessive compulsive checking on the dot probe paradigm. Behaviour Research and Therapy, 47(5), 437–443. http://doi.org/10.1016/j.brat.2009.02.004
Helfinstein, S. M., White, L. K., Bar-Haim, Y., & Fox, N. A. (2008). Affective primes suppress attention bias to threat in socially anxious individuals. Behaviour Research and Therapy, 46(7), 799–810. http://doi.org/10.1016/j.brat.2008.03.011
Hertel, P. T., & Mathews, A. (2011). Cognitive bias modification: Past perspectives, current findings, and future applications. Perspectives on Psychological Science, 6(6), 521–536. http://doi.org/10.1177/1745691611421205
Inquisit 4.0 [Computer software]. (2015). Seattle, WA: Millisecond Software.Ioannou, M. C., Mogg, K., & Bradley, B. P. (2004). Vigilance for threat: Effects of anxiety and defensiveness.
Personality and Individual Differences, 36(8), 1879–1891.Loo, R., & Loewen, P. (2004). Confirmatory factor analyses of scores from full and short versions of the
Marlowe–Crowne Social Desirability Scale. Journal of Applied Social Psychology, 34(11), 2343–2352. http://doi.org/10.1111/j.1559-1816.2004.tb01980.x
MacLeod, C., & Mathews, A. (2012). Cognitive bias modification approaches to anxiety. Annual Review of Clinical Psychology, 8(1), 189–217. http://doi.org/10.1146/annurev-clinpsy-032511-143052
MacLeod, C., Mathews, A., & Tata, P. (1986). Attentional bias in emotional disorders. Journal of Abnormal Psychology, 95(1), 15–20.
MacLeod, C., & Rutherford, E. M. (1992). Anxiety and the selective processing of emotional information: Mediating roles of awareness, trait and state variables, and personal relevance of stimulus materials. Behaviour Research and Therapy, 30(5), 479–491.
MacLeod, C., Rutherford, E. M., Campbell, L., Ebsworthy, G., & Holker, L. (2002). Selective attention and emotional vulnerability: Assessing the causal basis of their association through the experimental manipulation of attentional bias. The Journal of Abnormal Psychology, 111(1), 107–123. http://dx.doi.org.elibrary.jcu.edu.au/10.1037/0021-843X.111.1.107
MacLeod, C., Soong, L. Y., Rutherford, E. M., & Campbell, L. (2007). Internet-delivered assessment and manipulation of anxiety-linked attentional bias: Validation of a free-access attentional probe software package. Behavior Research Methods, 39(3), 533–538.
Mathews, A., & Mackintosh, B. (1998). A cognitive model of selective processing in anxiety. Cognitive Therapy and Research, 22(6), 539–560.
Mathews, A., & MacLeod, C. (2002). Induced processing biases have causal effects on anxiety. Cognition & Emotion, 16(3), 331–354. http://doi.org/10.1080/02699930143000518
Mathews, A., Mogg, K., May, J., & Eysenck, M. (1989). Implicit and explicit memory bias in anxiety. The Journal of Abnormal Psychology, 98(3), 236–240. http://doi.org/10.1037/0021-843X.98.3.236
Mogg, K., & Bradley, B. P. (1998). A cognitive-motivational analysis of anxiety. Behaviour Research and Therapy, 36(9), 809–848.
Mogg, K., Bradley, B. P., Dixon, C., Fisher, S., Twelftree, H., & McWilliams, A. (2000). Trait anxiety, defensiveness and selective processing of threat: An investigation using two measures of attentional bias. Personality and Individual Differences, 28(6), 1063–1077. http://doi.org/10.1016/S0191-8869(99)00157-9
Moritz, S., & von Mühlenen, A. (2008). Investigation of an attentional bias for fear-related material in obsessive-compulsive checkers. Depression and Anxiety, 25(3), 225–229. http://doi.org/10.1002/da.20294
Newman, L. S., & McKinney, L. C. (2002). Repressive coping and threat-avoidance: An idiographic stroop study. Personality and Social Psychology Bulletin, 28(3), 409–422. http://doi.org/10.1177/0146167202286011
Onwuegbuzie, A. J. (2004). Academic procrastination and statistics anxiety. Assessment & Evaluation in Higher Education, 29(1), 1–19. http://doi.org/10.1080/0260293042000160384

109Statistics anxiety
Onwuegbuzie, A. J., Da Ros, D., & Ryan, J. M. (1997). The components of statistics anxiety: A phenomenological study. Focus on Learning Problems in Mathematics, 19(4), 11–35.
Onwuegbuzie, A. J., & Seaman, M. A. (1995). The effect of time constraints and statistics test anxiety on test performance in a statistics course. Journal of Experimental Education, 63(2), 115–124.
Pan, W., & Tang, M. (2004). Examining the effectiveness of innovative instructional methods on reducing statistics anxiety for graduate students in the social sciences. Journal of Instructional Psychology, 31(2), 149–159.
Papousek, I., Ruggeri, K., Macher, D., Paechter, M., Heene, M., Weiss, E. M., … Freudenthaler, H. H. (2012). Psychometric evaluation and experimental validation of the statistics anxiety rating scale. Journal of Personality Assessment, 94(1), 82–91. http://doi.org/10.1080/00223891.2011.627959
Ratcliff, R. (1993). Methods for dealing with reaction time outliers. Psychological Bulletin, 114(3), 510–532. http://dx.doi.org.elibrary.jcu.edu.au/10.1037/0033-2909.114.3.510
Roberts, D. M., & Bilderback, E. W. (1980). Reliability and validity of a statistics attitude survey. Educational and Psychological Measurement, 40(1), 235–238. http://doi.org/10.1177/001316448004000138
See, J., MacLeod, C., & Bridle, R. (2009). The reduction of anxiety vulnerability through the modification of attentional bias: A real-world study using a home-based cognitive bias modification procedure. Journal of Abnormal Psychology, 118(1), 65–75.
Spielberger, C. D., Gorsuch, R. L., & Lushene, R. E. (1970). Manual for the state-trait anxiety inventory. Palo Alto, CA: Consulting Psychologists Press.
Summerfeldt, L. J., & Endler, N. S. (1998). Examining the evidence for anxiety-related cognitive biases in obsessive-compulsive disorder. Journal of Anxiety Disorders, 12(6), 579–598.
SurveyGizmo [Computer Software]. (2015). Boulder, CO: SurveyGizmo.Wells, A., & Matthews, G. (1994). Attention and emotion: A clinical perspective. Hillsdale, NJ: Lawrence Erlbaum
Associates.Willams, J. M., Watts, F. N., MacLeod, C., & Mathews, A. (1988). Cognitive psychology and emotional disorders.
Chichester: Wiley.Williams, A. S. (2010). Statistics anxiety and instructor immediacy. Journal of Statistics Education, 18(2).
Retrieved from http://www.amstat.org/publications/jse/v18n2/williams.pdfWilson, V. A. (1999, April). Student response to a systematic program of anxiety-reducing strategies in a graduate-level
introductory educational research course. Paper presented at the annual meeting of the American Educational Research Association, Montreal, Quebec, Canada.
Zeidner, M. (1991). Statistics and mathematics anxiety in social science students: Some interesting parallels. The British Journal of Educational Psychology, 61(3), 319–328.

Journal of Articles in Support of the Null Hypothesis. JASNH, 2017, Vol. 13, No. 2110 STATISTICS ANXIETY 34
Appendix A
Stimuli Pairs (Experiment 1)
Words (36 Pairs) Symbols (12 Pairs) Statistics-Related
(Threatening) Neutral Statistics-Related (Threatening) Neutral
Statistics Furniture 𝑦𝑦� % Error Brief 𝜎𝜎 *
Variable Initial θ ) Statistical Preliminary H0 _
Factor Beyond H1 ‘ Estimate Telephone 𝑠𝑠�� {
Calculation Astronomer 𝐷𝐷� ] Analysis Character SS } Analyze Jacket df \
*Parameter Mythology p / Quasi Filed 𝑦𝑦� :
Histogram Signature R2 = Skewness Textured Kurtosis Fetching Median League
Variance Feathers z-score t-shirt
Probability Connections Alpha Inner Beta Note
Power Check t-test e-mail
Matched Bridges Estimation Transition
ANOVA AFAIK F-ratio X-factor
Posthoc Keyhole Pairwise Shearing Tukey Confer
Factorial Decanting Coefficient Centerpiece Regression Everything
Residual Hallmark Chi-square Pre-school
SPSS ASAP p-value g-shock
*Statistics-related words listed from here onwards are not found in the frequency dictionary (Davies & Gardner, 2010). Hence, most of the neutral words for these words are adopted from (MacLeod et al., 2002) and matched for length instead.
Appendix A. Stimuli Pairs (Experiment 1)
*Statistics-related words listed from here onwards are not found in the frequency dictionary (Davies & Gardner, 2010). Hence, most of the neutral words for these words are adopted from (MacLeod et al., 2002) and matched for length instead.
111Statistics anxietySTATISTICS ANXIETY 29
Appendix B
Stimuli Pairs (Experiment 2)
Words relevant to Interpretation Anxiety (14 Pairs)* Threatening Neutral Discouraged Connection
Afraid Detail Worthless Batteries Hopeless Feathers
Inadequate Transition Apprehension Instrumental
Fear Note Worry Inner
Distress Creature Inferior Shearing Worried Context Scared Planet Stress Cities
Mistaken Expanded *Threat and Neutral word pairs adopted from (MacLeod et al., 2002).
Words relevant to Test and Class Anxiety (12 Pairs)* Threatening Neutral
Stupidity Framework Disgraced Optimism
Incompetent Conversation Failure Careful Inferior Scholarly
Test Proficient Inept Accomplishment
Discredited Achievement Inadequate Fortunate Careless Prestige
Unsuccessful Merit Examination Praiseworthy
*Threat and Neutral word pairs adopted from (MacLeod & Rutherford, 1992).
Words relevant to Fear of Asking for Help (24 Pairs)* Threatening Neutral
Despised Cruise Fail Emblem
Hostile Fountain Insult Fringe Lonely Inactive
Pathetic Leaf Persecuted Scarf
Unloved Wardrobe Immature Carpet
Inept Cherry Intimidated Gravy
Mistake Opera Offended Pear
Scorn Surplus Stupid Terrace
Useless Violet Criticism Bath Foolish Emerge
Humiliated Marble Indecisive Predict
Inferior Purchase Ridicule Shampoo
Silly Shower Worthless Threshold
*Threat and Neutral word pairs adopted from (Mathews et al., 1989).
STATISTICS ANXIETY 29
Appendix B
Stimuli Pairs (Experiment 2)
Words relevant to Interpretation Anxiety (14 Pairs)* Threatening Neutral Discouraged Connection
Afraid Detail Worthless Batteries Hopeless Feathers
Inadequate Transition Apprehension Instrumental
Fear Note Worry Inner
Distress Creature Inferior Shearing Worried Context Scared Planet Stress Cities
Mistaken Expanded *Threat and Neutral word pairs adopted from (MacLeod et al., 2002).
Words relevant to Test and Class Anxiety (12 Pairs)* Threatening Neutral
Stupidity Framework Disgraced Optimism
Incompetent Conversation Failure Careful Inferior Scholarly
Test Proficient Inept Accomplishment
Discredited Achievement Inadequate Fortunate Careless Prestige
Unsuccessful Merit Examination Praiseworthy
*Threat and Neutral word pairs adopted from (MacLeod & Rutherford, 1992).
Words relevant to Fear of Asking for Help (24 Pairs)* Threatening Neutral
Despised Cruise Fail Emblem
Hostile Fountain Insult Fringe Lonely Inactive
Pathetic Leaf Persecuted Scarf
Unloved Wardrobe Immature Carpet
Inept Cherry Intimidated Gravy
Mistake Opera Offended Pear
Scorn Surplus Stupid Terrace
Useless Violet Criticism Bath Foolish Emerge
Humiliated Marble Indecisive Predict
Inferior Purchase Ridicule Shampoo
Silly Shower Worthless Threshold
*Threat and Neutral word pairs adopted from (Mathews et al., 1989).
Appendix B. Stimuli Pairs (Experiment 2)
*Threat and Neutral word pairs adopted from (MacLeod et al., 2002).
*Threat and Neutral word pairs adopted from (MacLeod & Rutherford, 1992).
*Threat and Neutral word pairs adopted from (Mathews et al., 1989).

Journal of Articles in Support of the Null Hypothesis. JASNH, 2017, Vol. 13, No. 2112
Received: 8.23.2016Revised: 12.8.2016Accepted: 12.8.2016