Amplification Dynamics: Predicting the Effect of HIV on ... · Tuberculosis Outbreaks ... HIV...
8
Amplification Dynamics: Predicting the Effect of HIV on Tuberculosis Outbreaks *Travis C. Porco, †Peter M. Small, and ‡Sally M. Blower *San Francisco Department of Public Health, San Francisco; †Department of Medicine, Stanford University Medical Center, Stanford; and ‡Department of Biomathematics and UCLA AIDS Institute, University of California Los Angeles School of Medicine, Los Angeles, California, U.S.A. Summary: HIV affects the pathogenesis and the transmission of Mycobacterium tuberculosis. We used a discrete event simulation model to predict the potential impact of HIV on increasing the probability and the expected severity of tuberculosis out- breaks. Our predictions reveal that an HIV epidemic can significantly increase the frequency and severity of tuberculosis outbreaks, but that this amplification effect of HIV on tuberculosis outbreaks is very sensitive to the tuberculosis treatment rate. At moderate or low treatment rates, even a moderate HIV epidemic can cause the average size of tuberculosis outbreaks to almost double in comparison with the expected outbreak size when HIV is absent. However, we determined that the amplification effect of HIV can be substantially reduced if the treatment rate of tuberculosis is very high. We discuss the significant implications of these results for the global control of tuberculosis. Our results also reveal that occasionally a “normal-virulence” strain of M. tuberculosis can be expected to generate a large outbreak. We discuss the implications of these results in understanding the virulence of M. tuberculosis and in the planned elimination of tuberculosis in the United States. Key Words: Disease outbreaks— Tuberculosis—Therapy—HIV—Prevention and control. The size of tuberculosis outbreaks can be determined by using molecular epidemiologic data to identify which clusters of cases are infected with the same strain of M. tuberculosis (1–8). Analyses of typical datasets reveal that most cases of tuberculosis generate very small out- breaks and that only a few cases generate large outbreaks (Fig. 1). In fact, often the index case may not transmit the infection to any other susceptible individuals, and hence the entire “outbreak” consists of only one person (Fig. 1). The emergence of HIV has changed the epidemiology of tuberculosis, because HIV infection affects both the pathogenesis and transmission of M. tuberculosis (9–12). Large outbreaks of tuberculosis have arisen among people infected with HIV (3,13); hence, it has been sug- gested that HIV has significantly increased the incidence of tuberculosis in certain locations (14–19). To quantify this potential impact of HIV, we developed a discrete event simulation model of HIV-tuberculosis epidemic amplification dynamics. We use our model to predict the effect of HIV epidemic on increasing the probability and severity of tuberculosis outbreaks. We discuss the impli- cations of our findings for the understanding of virulence of M. tuberculosis, for elimination of tuberculosis in the United States and for global control of this disease. Previously, we (20–25) and other researchers (18,19,26–30) modeled the effects of different control strategies on tuberculosis epidemics based on both che- moprophylaxis and treatment. Here, we extend our pre- vious deterministic mathematical models of tuberculosis transmission dynamics (20–25,31,32) by including the effects of HIV on the pathogenesis and transmission of M. tuberculosis and stochastic effects. We used a multi- variate “birth-and-death” process (33,34) that we imple- mented as a discrete event simulation model. This sto- Address correspondence and reprint requests to Sally M. Blower, Department of Biomathematics and UCLA AIDS Institute, Univer- sity of California Los Angeles School of Medicine, 10833 Le Conte Ave., Los Angeles, CA 90095 U.S.A.; e-mail [email protected]. edu Manuscript received May 23, 2001; accepted September 6, 2001. JAIDS Journal of Acquired Immune Deficiency Syndromes 28:437–444 © 2001 Lippincott Williams & Wilkins, Inc., Philadelphia 437
Transcript of Amplification Dynamics: Predicting the Effect of HIV on ... · Tuberculosis Outbreaks ... HIV...
Amplification Dynamics: Predicting the Effect of HIV onTuberculosis Outbreaks
*Travis C. Porco, †Peter M. Small, and ‡Sally M. Blower
*San Francisco Department of Public Health, San Francisco; †Department of Medicine, Stanford University Medical Center,Stanford; and ‡Department of Biomathematics and UCLA AIDS Institute, University of California Los Angeles School of
Medicine, Los Angeles, California, U.S.A.
Summary: HIV affects the pathogenesis and the transmission of Mycobacteriumtuberculosis. We used a discrete event simulation model to predict the potential impactof HIV on increasing the probability and the expected severity of tuberculosis out-breaks. Our predictions reveal that an HIV epidemic can significantly increase thefrequency and severity of tuberculosis outbreaks, but that this amplification effect ofHIV on tuberculosis outbreaks is very sensitive to the tuberculosis treatment rate. Atmoderate or low treatment rates, even a moderate HIV epidemic can cause the averagesize of tuberculosis outbreaks to almost double in comparison with the expectedoutbreak size when HIV is absent. However, we determined that the amplificationeffect of HIV can be substantially reduced if the treatment rate of tuberculosis is veryhigh. We discuss the significant implications of these results for the global control oftuberculosis. Our results also reveal that occasionally a “normal-virulence” strain of M.tuberculosis can be expected to generate a large outbreak. We discuss the implicationsof these results in understanding the virulence of M. tuberculosis and in the plannedelimination of tuberculosis in the United States. Key Words: Disease outbreaks—Tuberculosis—Therapy—HIV—Prevention and control.
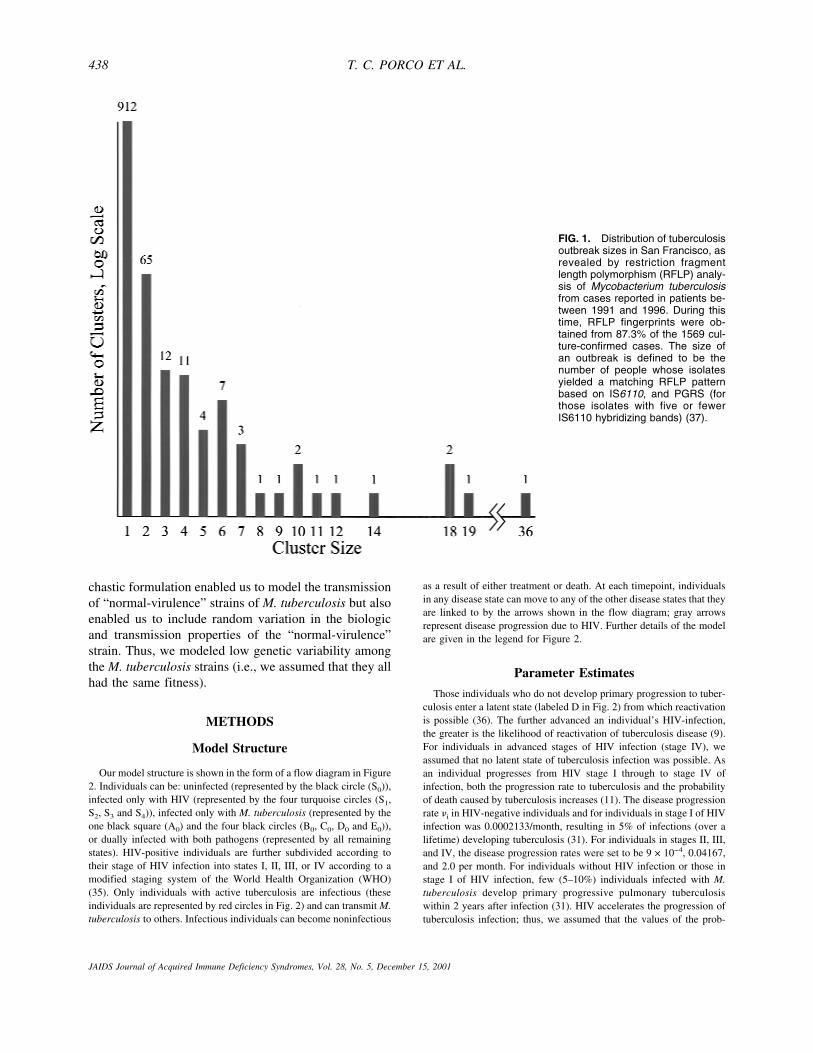
The size of tuberculosis outbreaks can be determinedby using molecular epidemiologic data to identify whichclusters of cases are infected with the same strain of M.tuberculosis (1–8). Analyses of typical datasets revealthat most cases of tuberculosis generate very small out-breaks and that only a few cases generate large outbreaks(Fig. 1). In fact, often the index case may not transmit theinfection to any other susceptible individuals, and hencethe entire “outbreak” consists of only one person (Fig. 1).The emergence of HIV has changed the epidemiology oftuberculosis, because HIV infection affects both thepathogenesis and transmission of M. tuberculosis (9–12).Large outbreaks of tuberculosis have arisen amongpeople infected with HIV (3,13); hence, it has been sug-
gested that HIV has significantly increased the incidenceof tuberculosis in certain locations (14–19). To quantifythis potential impact of HIV, we developed a discreteevent simulation model of HIV-tuberculosis epidemicamplification dynamics. We use our model to predict theeffect of HIV epidemic on increasing the probability andseverity of tuberculosis outbreaks. We discuss the impli-cations of our findings for the understanding of virulenceof M. tuberculosis, for elimination of tuberculosis in theUnited States and for global control of this disease.
Previously, we (20–25) and other researchers(18,19,26–30) modeled the effects of different controlstrategies on tuberculosis epidemics based on both che-moprophylaxis and treatment. Here, we extend our pre-vious deterministic mathematical models of tuberculosistransmission dynamics (20–25,31,32) by including theeffects of HIV on the pathogenesis and transmission ofM. tuberculosis and stochastic effects. We used a multi-variate “birth-and-death” process (33,34) that we imple-mented as a discrete event simulation model. This sto-
Address correspondence and reprint requests to Sally M. Blower,Department of Biomathematics and UCLA AIDS Institute, Univer-sity of California Los Angeles School of Medicine, 10833 Le ConteAve., Los Angeles, CA 90095 U.S.A.; e-mail [email protected]
Manuscript received May 23, 2001; accepted September 6, 2001.
JAIDS Journal of Acquired Immune Deficiency Syndromes28:437–444 © 2001 Lippincott Williams & Wilkins, Inc., Philadelphia
437
chastic formulation enabled us to model the transmissionof “normal-virulence” strains of M. tuberculosis but alsoenabled us to include random variation in the biologicand transmission properties of the “normal-virulence”strain. Thus, we modeled low genetic variability amongthe M. tuberculosis strains (i.e., we assumed that they allhad the same fitness).
METHODS
Model Structure
Our model structure is shown in the form of a flow diagram in Figure2. Individuals can be: uninfected (represented by the black circle (S0)),infected only with HIV (represented by the four turquoise circles (S1,S2, S3 and S4)), infected only with M. tuberculosis (represented by theone black square (A0) and the four black circles (B0, C0, D0 and E0)),or dually infected with both pathogens (represented by all remainingstates). HIV-positive individuals are further subdivided according totheir stage of HIV infection into states I, II, III, or IV according to amodified staging system of the World Health Organization (WHO)(35). Only individuals with active tuberculosis are infectious (theseindividuals are represented by red circles in Fig. 2) and can transmit M.tuberculosis to others. Infectious individuals can become noninfectious
as a result of either treatment or death. At each timepoint, individualsin any disease state can move to any of the other disease states that theyare linked to by the arrows shown in the flow diagram; gray arrowsrepresent disease progression due to HIV. Further details of the modelare given in the legend for Figure 2.
Parameter Estimates
Those individuals who do not develop primary progression to tuber-culosis enter a latent state (labeled D in Fig. 2) from which reactivationis possible (36). The further advanced an individual’s HIV-infection,the greater is the likelihood of reactivation of tuberculosis disease (9).For individuals in advanced stages of HIV infection (stage IV), weassumed that no latent state of tuberculosis infection was possible. Asan individual progresses from HIV stage I through to stage IV ofinfection, both the progression rate to tuberculosis and the probabilityof death caused by tuberculosis increases (11). The disease progressionrate �i in HIV-negative individuals and for individuals in stage I of HIVinfection was 0.0002133/month, resulting in 5% of infections (over alifetime) developing tuberculosis (31). For individuals in stages II, III,and IV, the disease progression rates were set to be 9 × 10⁻⁴, 0.04167,and 2.0 per month. For individuals without HIV infection or those instage I of HIV infection, few (5–10%) individuals infected with M.tuberculosis develop primary progressive pulmonary tuberculosiswithin 2 years after infection (31). HIV accelerates the progression oftuberculosis infection; thus, we assumed that the values of the prob-
FIG. 1. Distribution of tuberculosisoutbreak sizes in San Francisco, asrevealed by restriction fragmentlength polymorphism (RFLP) analy-sis of Mycobacterium tuberculosisfrom cases reported in patients be-tween 1991 and 1996. During thistime, RFLP fingerprints were ob-tained from 87.3% of the 1569 cul-ture-confirmed cases. The size ofan outbreak is defined to be thenumber of people whose isolatesyielded a matching RFLP patternbased on IS6110, and PGRS (forthose isolates with five or fewerIS6110 hybridizing bands) (37).
T. C. PORCO ET AL.438
JAIDS Journal of Acquired Immune Deficiency Syndromes, Vol. 28, No. 5, December 15, 2001
ability of primary progressive tuberculosis in stages II, III, and IV ofHIV infection to be 20%, 80% and 100%, respectively.
Nosocomial outbreaks of tuberculosis among severely immunocom-promised patients indicate that there is a minimum incubation period(i.e., time from infection to disease) of approximately 1 month (3,11).In individuals uninfected with HIV, the minimum incubation period hasbeen shown to be 1 to 3 months (37). To model the minimum incuba-tion state we included a delay state; this delay state ensured that diseaseprogression was delayed for 3 months in HIV-uninfected individuals,HIV-infected stage I or II individuals, and also for 2 months for HIV-infected stage III individuals. We modeled the rate of fast progressionby the parameters �i (Fig. 2). We assumed, for the expected time toprimary tuberculosis: 6 months for those uninfected with HIV and forHIV-infected individuals in stages I and II, 4 months for HIV-infected
individuals in stage III, and 2 months for HIV-infected individuals instage IV (3). After individuals developed infectious tuberculosis, weassumed that each case of tuberculosis could give rise to 7 new infec-tions per year (31).
In patients uninfected by HIV, we assumed that the mortality ratecaused by tuberculosis was 13% per year (31). For individuals withadvanced HIV, we used an untreated survival time with tuberculosis of1 month (3). Intermediate values of tuberculosis mortality were usedfor HIV-infected stages II and III. Excess mortality resulting fromuntreated tuberculosis was set at 0.0116 per month for HIV-negative orHIV-positive individuals in stage I (for a mean untreated lifetime of 7.2years neglecting HIV progression) (20). For HIV stage II individuals,the mean lifetime (neglecting HIV progression) was 3.6 years, for HIVstage III, the mean lifetime was assumed to be 2.5 months.
FIG. 2. Flow diagram of the stochastic model of HIV and tuberculosis amplification dynamics. Squares and circles denote states (delayand Markov, respectively) of an individual; arrows denote transitions between states. Turquoise denotes HIV-infection, black denotesuninfected with HIV, and a red circle denotes active (infectious) tuberculosis disease. Tuberculosis states are indicated alphabetically(A–newly infected, B–first intermediate state during development of primary progressive tuberculosis, C–intermediate state of infectionbefore development of active disease, D–latent state of TB infection, and E–active TB). Subscripts denote HIV states (0 denotes patientsuninfected with HIV; 1–4 denote the modified WHO stages of HIV-infection [35]). All states are subject to a background mortality rate µ.An individual in HIV-state i, having been infected, enters the delay state Ai; pI denotes the probability of primary progressive tuberculosis’developing. For example, an individual in state A0 is subject to seroconversion rate � and background mortality µ; if neither serocon-version nor death occur, then after the minimum incubation period T0 has elapsed, the patient enters state B0 with probability p0 or stateD0 with probability 1-p0. If seroconversion occurs at time t0<T0, the patient enters state A1 and will subsequently enter B1 or D1 after T0-t0more time has elapsed, if no further transitions occur. The rate of progression through primary progressive tuberculosis states is �i, sothat the mean incubation period (given a fixed HIV stage) is Ti + 2/�i. The latent breakdown rate is vi, the rate of diagnosis is �i, and theexcess mortality rate due to TB is µi
T. Transitions between HIV states occur at rates �I. Finally, Eji is the effective contact rate ofsusceptibles in state j for cases in state i.
AMPLIFICATION DYNAMICS: PREDICTING THE EFFECT OF HIV ON TB OUTBREAKS 439
JAIDS Journal of Acquired Immune Deficiency Syndromes, Vol. 28, No. 5, December 15, 2001
Generating Predictions
We used our model to predict the probability and average expectedoutbreak size that would be generated in a 2-year period from a singleindex case of infectious tuberculosis. Only untreated infectious indi-viduals can generate outbreaks. Thus, the population-level treatmentrate of tuberculosis (defined as the fraction of infectious cases that aretreated per unit of time) is obviously an important factor in determiningthe probability and the severity of outbreaks. We varied the population-level treatment rate of tuberculosis from 0% to 100% of cases. We alsoindependently varied both HIV prevalence (no HIV prevalence [0%],moderate HIV prevalence [9%], and high HIV prevalence [20%]) aswell as the intersection dynamics (“mixing patterns”) between the HIVand the tuberculosis epidemics. We investigated two extreme mixingpatterns: positive assortative (i.e., “like with like”) and proportional(i.e., “random”).
Positive assortative mixing occurs if HIV-positive cases with tuber-culosis mix only with HIV-positive individuals and HIV-negative in-dividuals with tuberculosis mix only with HIV-negative individuals(38,39). Proportional mixing occurs if people with tuberculosis mixrandomly with HIV-infected individuals; hence the degree to whichHIV-infected individuals are encountered is simply in proportion to theprevalence of HIV (38,39). We varied HIV prevalence from 0% to 20%and evaluated the effects of HIV on outbreaks at both moderate (70%)and high (95%) treatment rates. To conduct these analyses we carriedout over 1.2 million stochastic simulations, for reasons of space wepresent in Figures 3 and 4 only 707,700 of these simulations (the resultsfor the remaining 500,00 simulations were in complete agreement withthe results shown in Figs. 3 and 4).
RESULTS
Tuberculosis outbreaks were generated for Figure 3Aunder the assumption that the HIV prevalence was 0%.Outbreaks were generated for Figure 3 and 3C under theassumption that a moderate HIV epidemic (9% preva-lence) was intersecting with the tuberculosis epidemic; in3B we assumed proportional mixing, and in 3C we as-sumed positive assortative mixing. Results in Figure 3are shown in terms of the average outbreak size, definedas the average number of tuberculosis cases that are gen-erated in a 2-year period from a single index case (resultsin red), and also the probability that the index case wouldgenerate a tuberculosis outbreak of any specified size(results are shown in terms of a color-coded frequencydistribution). The height of the colored regions indicatesthe probability that the index case would generate a tu-berculosis outbreak of size X over a 2-year time period;see Figure Legend 3.
If HIV is not present and treatment rates of tubercu-losis are moderate to low then the average (mean) ex-pected outbreak size (in the 2-year period) from a singleindex case is approximately 0.5 (red data in Fig. 3A).Under these conditions, most index cases do not transmitM. tuberculosis; the probability that an index case gen-erates at least 1 additional case is approximately 0.4(dark blue data); and it is possible (although the prob-
ability is low) that an index case can generate a largeoutbreak (yellow data) (Fig. 3A). When a large fractionof cases receives treatment both the average outbreaksize and the probability of large outbreaks drasticallydecrease (Fig. 3A). The presence of HIV dramaticallychanges the short-term dynamics of tuberculosis (Fig. 3).The presence of HIV both increases the average outbreaksize (red data) and increases the probability of a largeoutbreak (orange data), except at extremely high treat-ment rates (Fig. 3). At moderate or low treatment rates,even a moderate HIV epidemic (Fig. 3B,C) causes theaverage size of tuberculosis outbreaks (red data) to al-most double in comparison with the expected outbreaksize when HIV is absent (Fig. 3A). The amplificationeffect of HIV is influenced by the intersection dynamicsbetween the two epidemics, if tuberculosis treatmentrates are low (Fig. 3). Under these conditions, propor-tional mixing (Fig. 3B) leads to fewer large outbreaks butto a slightly higher average outbreak size than positiveassortative mixing (Fig. 3C). However, even in the pres-ence of moderate levels of HIV (and either “mixing pat-tern”) there is a high probability (dark blue data) that anindex case will not transmit M. tuberculosis; hence many“outbreaks” of size one can be expected (Fig. 3B,C).
The effect of HIV prevalence (ranging from 0 to 20%)on the probability and severity of tuberculosis outbreaksis shown for two treatment rates: a very high treatmentrate (assuming that 95% of tuberculosis cases are treated)(Fig. 4A,B) and a moderate treatment rate (assuming thatonly 70% of tuberculosis cases are treated) (Fig. 4C,D).As previously, our predictions are shown in terms of theaverage outbreak size (red data) and of the probabilitythat an outbreak of any specified size would occur (re-sults shown in terms of a color-coded frequency distri-bution). In Figure 4A and C, mixing is proportional, andin Figure 4B and D, mixing is positive assortative. As wefound previously, the tuberculosis treatment rate is ex-tremely important in determining the effect of HIV onincreasing both the probability of outbreaks and the av-erage outbreak size (Fig. 4). Under either mixing pattern,if treatment rates are extremely high then even fairlysevere HIV epidemics (with prevalence levels up to20%) have little effect on increasing either the averageoutbreak size or the probability that a large outbreak willoccur (Fig. 4A,B). Large outbreaks of tuberculosis canoccur but are unlikely, and the average outbreak sizeremains low (Fig. 4A,B). However, when only a moder-ate number of tuberculosis cases are treated, the HIVepidemic can then significantly amplify the tuberculosisepidemic; both the average outbreak size and the prob-ability of a large outbreak substantially increase with
T. C. PORCO ET AL.440
JAIDS Journal of Acquired Immune Deficiency Syndromes, Vol. 28, No. 5, December 15, 2001
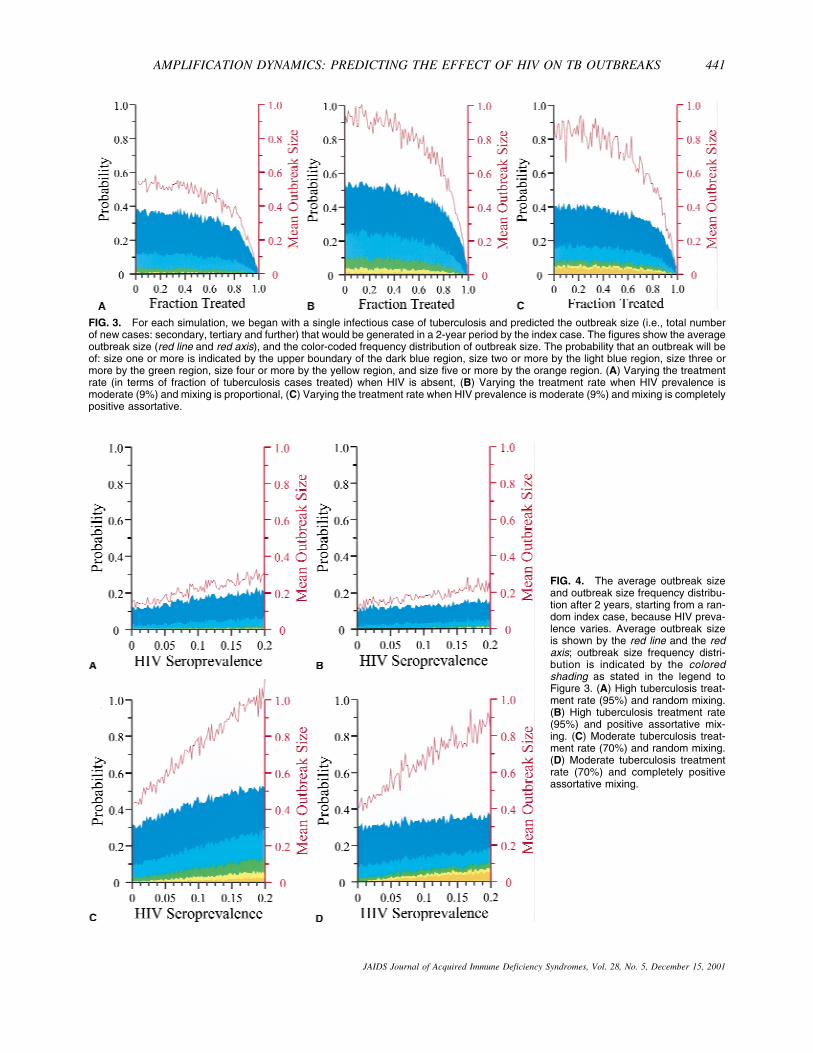
FIG. 3. For each simulation, we began with a single infectious case of tuberculosis and predicted the outbreak size (i.e., total numberof new cases: secondary, tertiary and further) that would be generated in a 2-year period by the index case. The figures show the averageoutbreak size (red line and red axis), and the color-coded frequency distribution of outbreak size. The probability that an outbreak will beof: size one or more is indicated by the upper boundary of the dark blue region, size two or more by the light blue region, size three ormore by the green region, size four or more by the yellow region, and size five or more by the orange region. (A) Varying the treatmentrate (in terms of fraction of tuberculosis cases treated) when HIV is absent, (B) Varying the treatment rate when HIV prevalence ismoderate (9%) and mixing is proportional, (C) Varying the treatment rate when HIV prevalence is moderate (9%) and mixing is completelypositive assortative.
FIG. 4. The average outbreak sizeand outbreak size frequency distribu-tion after 2 years, starting from a ran-dom index case, because HIV preva-lence varies. Average outbreak sizeis shown by the red line and the redaxis; outbreak size frequency distri-bution is indicated by the coloredshading as stated in the legend toFigure 3. (A) High tuberculosis treat-ment rate (95%) and random mixing.(B) High tuberculosis treatment rate(95%) and positive assortative mix-ing. (C) Moderate tuberculosis treat-ment rate (70%) and random mixing.(D) Moderate tuberculosis treatmentrate (70%) and completely positiveassortative mixing.
AMPLIFICATION DYNAMICS: PREDICTING THE EFFECT OF HIV ON TB OUTBREAKS 441
JAIDS Journal of Acquired Immune Deficiency Syndromes, Vol. 28, No. 5, December 15, 2001
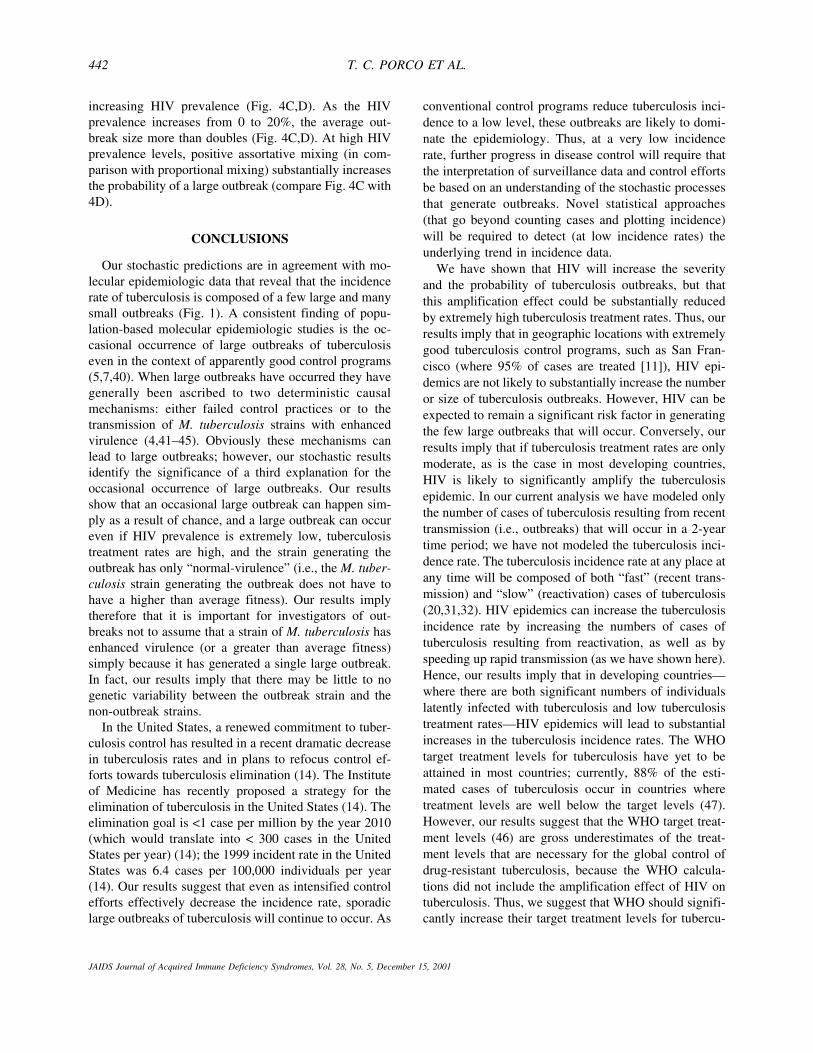
increasing HIV prevalence (Fig. 4C,D). As the HIVprevalence increases from 0 to 20%, the average out-break size more than doubles (Fig. 4C,D). At high HIVprevalence levels, positive assortative mixing (in com-parison with proportional mixing) substantially increasesthe probability of a large outbreak (compare Fig. 4C with4D).
CONCLUSIONS
Our stochastic predictions are in agreement with mo-lecular epidemiologic data that reveal that the incidencerate of tuberculosis is composed of a few large and manysmall outbreaks (Fig. 1). A consistent finding of popu-lation-based molecular epidemiologic studies is the oc-casional occurrence of large outbreaks of tuberculosiseven in the context of apparently good control programs(5,7,40). When large outbreaks have occurred they havegenerally been ascribed to two deterministic causalmechanisms: either failed control practices or to thetransmission of M. tuberculosis strains with enhancedvirulence (4,41–45). Obviously these mechanisms canlead to large outbreaks; however, our stochastic resultsidentify the significance of a third explanation for theoccasional occurrence of large outbreaks. Our resultsshow that an occasional large outbreak can happen sim-ply as a result of chance, and a large outbreak can occureven if HIV prevalence is extremely low, tuberculosistreatment rates are high, and the strain generating theoutbreak has only “normal-virulence” (i.e., the M. tuber-culosis strain generating the outbreak does not have tohave a higher than average fitness). Our results implytherefore that it is important for investigators of out-breaks not to assume that a strain of M. tuberculosis hasenhanced virulence (or a greater than average fitness)simply because it has generated a single large outbreak.In fact, our results imply that there may be little to nogenetic variability between the outbreak strain and thenon-outbreak strains.
In the United States, a renewed commitment to tuber-culosis control has resulted in a recent dramatic decreasein tuberculosis rates and in plans to refocus control ef-forts towards tuberculosis elimination (14). The Instituteof Medicine has recently proposed a strategy for theelimination of tuberculosis in the United States (14). Theelimination goal is <1 case per million by the year 2010(which would translate into < 300 cases in the UnitedStates per year) (14); the 1999 incident rate in the UnitedStates was 6.4 cases per 100,000 individuals per year(14). Our results suggest that even as intensified controlefforts effectively decrease the incidence rate, sporadiclarge outbreaks of tuberculosis will continue to occur. As
conventional control programs reduce tuberculosis inci-dence to a low level, these outbreaks are likely to domi-nate the epidemiology. Thus, at a very low incidencerate, further progress in disease control will require thatthe interpretation of surveillance data and control effortsbe based on an understanding of the stochastic processesthat generate outbreaks. Novel statistical approaches(that go beyond counting cases and plotting incidence)will be required to detect (at low incidence rates) theunderlying trend in incidence data.
We have shown that HIV will increase the severityand the probability of tuberculosis outbreaks, but thatthis amplification effect could be substantially reducedby extremely high tuberculosis treatment rates. Thus, ourresults imply that in geographic locations with extremelygood tuberculosis control programs, such as San Fran-cisco (where 95% of cases are treated [11]), HIV epi-demics are not likely to substantially increase the numberor size of tuberculosis outbreaks. However, HIV can beexpected to remain a significant risk factor in generatingthe few large outbreaks that will occur. Conversely, ourresults imply that if tuberculosis treatment rates are onlymoderate, as is the case in most developing countries,HIV is likely to significantly amplify the tuberculosisepidemic. In our current analysis we have modeled onlythe number of cases of tuberculosis resulting from recenttransmission (i.e., outbreaks) that will occur in a 2-yeartime period; we have not modeled the tuberculosis inci-dence rate. The tuberculosis incidence rate at any place atany time will be composed of both “fast” (recent trans-mission) and “slow” (reactivation) cases of tuberculosis(20,31,32). HIV epidemics can increase the tuberculosisincidence rate by increasing the numbers of cases oftuberculosis resulting from reactivation, as well as byspeeding up rapid transmission (as we have shown here).Hence, our results imply that in developing countries—where there are both significant numbers of individualslatently infected with tuberculosis and low tuberculosistreatment rates—HIV epidemics will lead to substantialincreases in the tuberculosis incidence rates. The WHOtarget treatment levels for tuberculosis have yet to beattained in most countries; currently, 88% of the esti-mated cases of tuberculosis occur in countries wheretreatment levels are well below the target levels (47).However, our results suggest that the WHO target treat-ment levels (46) are gross underestimates of the treat-ment levels that are necessary for the global control ofdrug-resistant tuberculosis, because the WHO calcula-tions did not include the amplification effect of HIV ontuberculosis. Thus, we suggest that WHO should signifi-cantly increase their target treatment levels for tubercu-
T. C. PORCO ET AL.442
JAIDS Journal of Acquired Immune Deficiency Syndromes, Vol. 28, No. 5, December 15, 2001
losis in countries that are heavily burdened by both tu-berculosis and HIV.
In developing countries that have a severe HIV epi-demic there are two approaches for controlling tubercu-losis epidemics: the tuberculosis epidemic can be con-trolled directly (by chemoprophylaxis and treatment);and the tuberculosis epidemic can be controlled indi-rectly by treating the HIV epidemic. We strongly advo-cate that both approaches be deployed. Previously, wehave shown that widespread usage of combination anti-retroviral therapies would generate an epidemic of drug-resistant HIV (48), but such use would be extremelyeffective in decreasing HIV transmission rates (48,49)(as well as AIDS-related death rates (49)). As we haveshown in this current analysis, decreasing the prevalenceof HIV would also decrease the incidence of tuberculo-sis. Consequently, we advocate the expanded use ofcombination antiretroviral therapies in developing coun-tries both for the beneficial direct effects on the HIVepidemic, as well as for the beneficial indirect effects onthe tuberculosis epidemic. We also stress that the tuber-culosis epidemic should be directly controlled by sub-stantially increasing the rates of chemoprophylaxis (oflatently-infected individuals) (24) as well as treatmentrates (of active cases). Methodologies for the cost-effective provision of basic anti-tuberculosis therapy arewell established. Our results clearly imply that tubercu-losis epidemics in developing countries could be signifi-cantly reduced—even in the presence of HIV epidem-ics—simply by substantially increasing tuberculosistreatment rates. Clearly, it is now a necessity in manydeveloping countries to try to simultaneously controlboth epidemics.
Acknowledgments: The authors gratefully acknowledge thefinancial support of NIH/NIAID grant AI41935 (Dr. Blower),AI35969 (Dr. Small) and NIH/NIDA DA10135 (Dr. Porco).We thank Chuck Daley, Phil Hopewell, Tom Lietman, TonyPaz, Masae Kawamura, Mitch Katz, and Elad Ziv for sugges-tions and useful comments. The authors thank Jeanne Rhee fordoing the analysis of the RFLP data for Figure 1 and NickAschenbach for editorial assistance.
REFERENCES
1. Alland D, Kalkut GE, Moss AR, et al. Transmission of tuberculosisin New York City. An analysis by DNA fingerprinting and con-ventional epidemiologic methods. N Engl J Med 1994;330:1710–16.
2. Bishai WR, Graham NM, Harrington S, et al. Molecular and geo-graphic patterns of tuberculosis transmission after 15 years of di-rectly observed therapy. JAMA 1998;280:1679–84.
3. Daley CL, Small PM, Schecter GF, et al. An outbreak of tubercu-losis with accelerated progression among persons infected with theHuman Immunodeficiency Virus. N Engl J Med 1992;326:231–5.
4. Kline SE, Hedemark LL, Davies SF. Outbreak of tuberculosis
among regular patrons of a neighborhood bar. N Engl J Med 1995;333:222–7.
5. Small PM, Hopewell PC, Singh SP, et al. The epidemiology oftuberculosis in San Francisco: a population-based study using con-ventional and molecular methods. N Engl J Med 1994;330:1703–9.
6. Kulaga S, Behr MA, Schwartzman K. Genetic fingerprinting in thestudy of tuberculosis transmission. Can Med Assoc J 1999;161:1165–9.
7. van Deutekom H, Gerritsen JJ, van Soolingen D, et al. A molecularepidemiological approach to studying the transmission of tubercu-losis in Amsterdam. Clin Infect Dis 1997;25:1071–7.
8. Glynn J, Vynnycky E, Fine PE. Influence of sampling on estimatesof clustering and recent transmission of Mycobacterium tubercu-losis derived from DNA fingerprinting techniques. Am J Epidemiol1999;149:366–71.
9. Selwyn PA, Hartel D, Lewis VA, et al. A prospective study of therisk of tuberculosis among intravenous drug users with HumanImmunodeficiency Virus infection. N Engl J Med 1989;320:545–50.
10. Selwyn PA, Sckell BM, Alcabes P, et al. High risk of activetuberculosis in HIV-infected drug users with cutaneous anergy.JAMA 1992;268:504–9.
11. Havlir DV, Barnes PF. Tuberculosis in patients with human im-munodeficiency virus infection. N Engl J Med 1999;340:367–73.
12. Cauthen GM, Dooley SW, Onorato IM, et al. Transmission ofMycobacterium tuberculosis from M. tuberculosis patients withHIV infection or AIDS. Am J Epidemiol 1996;144:69–77.
13. Angarano G, Carbonara S, Costa D, et al. Drug-resistant tubercu-losis in human immunodeficiency virus infected persons in Italy.The Italian Drug-Resistant Tuberculosis Study Group. Int J TubercLung Dis 1998;2:303–11.
14. Geiter L, ed. Ending neglect: the elimination of tuberculosis in theUnited States. Washington, DC: National Academy Press, 2000.
15. Brudney K, Dobkin J. Resurgent tuberculosis in New York City.Human immunodeficiency virus, homelessness, and the decline oftuberculosis control programs. Am Rev Respir Dis 1991;144:745–9.
16. Frieden TR, Sherman LF, Maw KL, et al. A multi-institutionaloutbreak of highly drug-resistant tuberculosis: epidemiology andclinical outcomes. JAMA 276, 1996;1229–35.
17. Zolopa AR, Hahn JA, Gorter R, et al. HIV and tuberculosis infec-tion in San Francisco’s homeless adults. JAMA 1994;272:455–61.
18. Massad E, Burattini MN, Coutinho FA, et al. Modeling the inter-action between AIDS and tuberculosis. Math Comput Modeling1993;17:7–21.
19. Schulzer M, Radhamani MP, Grzybowski S, et al. A mathematicalmodel for the prediction of the impact of HIV infection on tuber-culosis. Int J Epidemiol 1994;23:400–7.
20. Blower SM, Small PM, Hopewell PC. Control strategies for tu-berculosis epidemics: new models for old problems. Science 1996;273:497–500.
21. Blower S, Porco T, Lietman T. Tuberculosis: the evolution ofantibiotic resistance and the design of epidemic control strategies.In Horn MA, Simonett G, Webb GF, eds. Mathematical models inmedical and health science. Nashville, TN: Vanderbilt UniversityPress, 1998:51–72.
22. Blower S, Gerberding J. Understanding, predicting, and control-ling the emergence of drug-resistant tuberculosis: a theoreticalframework. J Mol Med 1998;76:634–6.
23. Lietman T, Blower S. The potential impact of tuberculosis vac-cines as epidemic control agents. Clin Infect Dis 2000;30:S316–22.
24. Ziv E, Daley C, Blower S. Early therapy for latent tuberculosisinfection. Am J Epidemiol 2001;153:381–5.
25. Porco TC, Blower SM. The evolution of MDR tuberculosis: indi-vidual-level versus population-level perversity, in press.
26. Heymann S.J. Modeling the efficacy of prophylactic and curativetherapies for preventing the spread of tuberculosis in Africa. TransR Soc Trop Med Hygiene 1993;87:406–11.
27. Debanne SM, Bielefeld RA, Cauthen GM, et al. Multi-variate
AMPLIFICATION DYNAMICS: PREDICTING THE EFFECT OF HIV ON TB OUTBREAKS 443
JAIDS Journal of Acquired Immune Deficiency Syndromes, Vol. 28, No. 5, December 15, 2001
markovian modeling of tuberculosis: forecasts for the unitedStates. Emerg Infect Dis 2000;6:148–157.
28. Brewer TF, Heymann SJ, Colditz GA, et al. Evaluation of tuber-culosis control policies using computer simulation. JAMA 1996;276:1898–1903.
29. Dye C, Garnett GP, Sleeman K, et al. Prospects for worldwidetuberculosis control under the WHO DOTS strategy. Lancet 1998;352:1886–91.
30. Castillo-Chavez C, Feng Z. To treat or not to treat: the case oftuberculosis. J Math Biol 1997;35:629–56.
31. Blower SM, McLean AR, Porco TC, et al. The intrinsic transmis-sion dynamics of tuberculosis epidemics. Nat Med 1995;1:815–21.
32. Porco TC, Blower SM. Quantifying the intrinsic transmission dy-namics of tuberculosis. Theor Popul Biol 1998;54:117–32.
33. Griffiths D. Multivariate birth-and-death processes as approxima-tions to epidemic processes. J Appl Prob 1973;10:15–26.
34. Krivy I, Kundler E. A branching process model in simulating smallepidemics. Trans Assoc SIMULA Users; 1997.
35. Schechter MT, Le N, Craib KJ, et al. Use of the Markov model toestimate the waiting times in a modified WHO staging system forHIV infection. J Acquir Immune Defic Syndr Hum Retrovirol1995;8:474–9.
36. Nardell EA. Pathogenesis of tuberculosis. In Reichman LJ, Her-shfield ES, eds. Tuberculosis: a comprehensive international ap-proach. New York: Marcel Dekker, 1993:103–122.
37. Rhee JT, Tanaka MM, Behr MA, et al. Use of multiple markers inpopulation-based molecular epidemiologic studies of tuberculosis.Int J Tuberc Lung Dis 2001, 2000;4:1111–9.
38. Blower SM, McLean AR. Mixing ecology and epidemiology. ProcR Soc Lond B 1991;245:187–92.
39. Blythe SP, Castillo-Chavez C. Like-with-like preference and sex-ual mixing models. Math Biosci 1989;96:221–38.
40. Hermans PW, Messadi F, Guebrexabher H, et al. Analysis of thepopulation structure of Mycobacterium tuberculosis in Ethiopia,Tunisia, and the Netherlands: usefulness of DNA typing for globaltuberculosis epidemiology. J Infect Dis 1995;171:1504–13.
41. Rhee JT, Piatek AS, Small PM, et al. Molecular epidemiologicevaluation of transmissibility and virulence of Mycobacterium tu-berculosis. J Clin Microbiol 1999;37:1764–70.
42. Chin DP, Crane CM, Diul MY, et al. Spread of Mycobacteriumtuberculosis in a community implementing recommended ele-ments of tuberculosis control. JAMA 2000;283:2968–74.
43. Braden CR, Templeton GL, Cave MD, et al. Interpretation ofrestriction fragment length polymorphism analysis of Mycobacte-rium tuberculosis isolates from a state with a large rural popula-tion. J Infect Dis 1997;175:1446–52.
44. Zhang M, Gong J, Yang Z, et al. Enhanced capacity of a wide-spread strain of Mycobacterium tuberculosis to grow in humanmacrophages. J Infect Dis 1999;179:1213–17.
45. Valway SE, Sanchez MP, Shinnick TF, et al. An outbreak involv-ing extensive transmission of a virulent strain of Mycobacteriumtuberculosis. N Engl J Med 1998;338:633–9.
46. Dye C, Williams BG. Criteria for the control of drug-resistanttuberculosis. Proc Natl Acad Sci USA 2000;97:8180–5.
47. World Health Organization. Global Tuberculosis Control. WHOReport 2001 (WHO/CDS/TB/2001.287) . Geneva, Switzerland:WHO, 2001.
48. Blower SM, Aschenbach AN, Gershengorn H, et al. Predicting theunpredictable: transmission of drug-resistant HIV. Nat Med 2001,7:1016–20.
49. Blower S, Gershengorn H, Grant R. A tale of two futures: HIV andantiretroviral therapy in San Francisco. Science 2000;287:650–4.
T. C. PORCO ET AL.444
JAIDS Journal of Acquired Immune Deficiency Syndromes, Vol. 28, No. 5, December 15, 2001