
AMP for the Benning Road Power Plant Demolition Website...
112
Prepared for: Prepared by: Potomac Electric Power Company AECOM Washington, D.C. Chelmsford, MA and 60309564 Pepco Energy Services Arlington, Virginia Environment Air Monitoring Plan (AMP) for the Benning Road Power Plant Demolition, Washington D.C.
Transcript of AMP for the Benning Road Power Plant Demolition Website...

Prepared for: Prepared by: Potomac Electric Power Company AECOM Washington, D.C. Chelmsford, MA and 60309564 Pepco Energy Services Arlington, Virginia
Environment
Air Monitoring Plan (AMP) for the Benning Road Power Plant Demolition, Washington D.C.
AECOM Environment
Benning Road Power Plant Demolition, Air Monitoring Plan
Air Monitoring Plan (AMP) for the Benning Road Power Plant Demolition, Washington D.C. Site: Benning Road Facility 3400 Benning Road, NE Washington, DC 20019 Prepared by: AECOM Chelmsford, MA May 2014 AECOM Project No. 60309564
_________________________________ Prepared By Matthew Arvanites
_________________________________ Reviewed By Frank Tringale

AECOM Environment
Benning Road Power Plant Demolition, Air Monitoring Plan
i
Contents
1.0 Introduction ...................................................................................................................... 1-1
2.0 Alert and Action Levels and Acceptable Ambient Concentrations .......................... 2-1
2.1 Alert and Action Levels ........................................................................................................ 2-1
2.2 Acceptable Ambient Concentrations (AACs) ...................................................................... 2-2
3.0 Air Monitoring and Sampling Procedures ................................................................... 3-1
3.1 Air Monitoring and Sampling Approaches .......................................................................... 3-2
3.1.1 Real-Time Air Monitoring ...................................................................................... 3-2
3.1.2 Hand-Held Measurements and Observational Monitoring .................................. 3-4
3.1.3 Central Computer System and Interactive Display .............................................. 3-5
3.2 Integrated Time-Averaged Sampling and Analysis ............................................................ 3-5
3.2.1 Metals (Lead, Arsenic, Cadmium and Chromium) .............................................. 3-6
3.2.2 Polycyclic Aromatic Hydrocarbons ....................................................................... 3-6
3.2.3 Polychlorinated Biphenyls .................................................................................... 3-7
3.2.4 Asbestos ................................................................................................................ 3-7
3.2.5 Chain of Custody Documentation and Procedures ............................................. 3-7
3.3 Pre-Demolition Air Monitoring and Sampling Activities ...................................................... 3-7
3.3.1 Real-time Air Monitoring ....................................................................................... 3-7
3.3.2 Integrated Time-Averaged Air Monitoring ............................................................ 3-8
4.0 Quality Assurance / Quality Control ............................................................................. 4-1
4.1 Monitoring, Sampling and Analysis ..................................................................................... 4-1
4.1.1 Instrument Calibration ........................................................................................... 4-1
4.1.2 Field Quality Control Samples .............................................................................. 4-3
4.1.3 Data Validation ...................................................................................................... 4-3
5.0 Alert and Action Level Response Plan ......................................................................... 5-5
5.1 Site Conditions ..................................................................................................................... 5-5
5.2 Alert and Action Level Response Plan ................................................................................ 5-5
5.3 Documentation ..................................................................................................................... 5-6
5.4 Control and Mitigation Measures ........................................................................................ 5-6
6.0 Reporting .......................................................................................................................... 6-1
6.1 Weekly Data Summaries ..................................................................................................... 6-1
6.2 Final Air Monitoring Summary Report ................................................................................. 6-1
7.0 References ....................................................................................................................... 7-2

AECOM Environment
Benning Road Power Plant Demolition, Air Monitoring Plan
ii
List of Appendices
Appendix A AMP Amendment Form
Appendix B Development of the Site-Specific Acceptable Ambient Concentrations and the Action Levels
Appendix C Field Documentation Forms
Appendix D Field Sample Methods
List of Tables
Table 2-1: Alert and Action Levels ...................................................................................................... 2-2
Table 3-1: Ambient Air Monitoring and Sampling Approach .............................................................. 3-1
Table 5-1: Site Conditions ................................................................................................................... 5-5
Table 5-2: Site Conditions and Corrective Actions ............................................................................. 5-7
Table 5-3: Site Contacts and Key Personnel ...................................................................................... 5-8
List of Figures
Figure 1-1: Benning Road Site Map ..................................................................................................... 1-1
Figure 3-1: AECOM Portable Air Monitoring Station ........................................................................... 3-3

AECOM Environment
Benning Road Power Plant Demolition, Air Monitoring Plan
iii
List of Acronyms
AAC – Acceptable Ambient Concentration
AMP – Air Monitoring Plan
AMS – Air Monitoring Station
COC – Chain of Custody
COI – Constituents of Interest
GC/MS – Gas chromatography/mass spectrometry
ICAL – Initial Calibration
IS – Internal Standard
L – Liter
LCS – Laboratory Control Sample
LPM – Liters per minute
mm - millimeters
NIOSH - National Institute for Occupational Safety and Health
NIST – National Institute of Standards and Technology
OSHA - Occupational Safety and Health Administration
Pb – Lead
PAH – Polycyclic Aromatic Hydrocarbons
PAM – Portable Air Monitoring
PCB – Polychlorobiphenyls
Pepco – Potomac Electric Power Company
PES – Pepco Energy Services
PVC – Polyvinyl Chloride
PM10 – Particulate matter ≤ 10 microns.
QA/QC – Quality Assurance / Quality Control
RPD – Relative Percent Difference
f/cc – Asbestos fibers per cubic centimeter of air
SOP – Standard Operating Procedure
TAS – Tactical Air Sampler
USEPA – Untied States Environmental Protection Agency
VOC –Volatile Organic Compounds

AECOM Environment
Benning Road Power Plant Demolition, Air Monitoring Plan
1-1
1.0 Introduction
This Air Monitoring Plan (AMP) has been developed for Potomac Electric Power Company (Pepco) and Pepco Energy Services, Inc. (PES) to provide specific procedures for measuring, documenting, and responding to potential airborne impacts during the demolition activities at the Benning Road Power Plant (the Project). The air monitoring program set out in this AMP is not a regulatory requirement. Pepco and PES are undertaking this monitoring program voluntarily to help ensure that the demolition activities do not result in any adverse exposures to airborne contaminants. The power plant was owned and operated by Pepco from 1906 to 2000. PES acquired the power plant from Pepco in 2000 and ceased plant operations in June 2012. Pepco and PES are in the process of decommissioning and demolishing the power plant. The power plant is located at the Benning Road facility in Washington D.C. owned by Potomac Electric Company (Pepco). The power plant and associated structures occupy less than 20% of the land area in the western portion of the Benning Road facility. The rest of the facility is a Service Center that will remain in operation to support Pepco’s operation of its electric transmission and distribution system. For the purposes of this document the “Site” refers to the entire Benning Road facility while the Project refers to the demolition activities that will occur only within the area of the Site where the power plant buildings and facilities are located. If future amendments of the AMP are required, they will be documented using the Amendment Form presented in Appendix A. The Site is located at 3400 Benning Road, Northeast Washington D.C. The Site is located in a mixed industrial/residential/commercial area and is bordered to the north by the D.C. Solid Waste Transfer Station, the Kenilworth Maintenance Yard (part of the National Park Service) to the northwest, the Anacostia River and wetlands associated with the river to the west, Benning Road and commercial development to the south and residential areas to the east. An aerial view of the Site is presented in Figure 1-1. Demolition of the power plant structures has the potential to generate fugitive emissions. Pepco and PES have incorporated an air monitoring and emissions control component into the Project to minimize the potential impact of these emissions on nearby human receptors (both residential and commercial) and the environment. Constituents such as Polycyclic Aromatic Hydrocarbons (PAHs) and Polychlorinated Biphenyls (PCBs) are present in the soil surrounding the power plant structures, while metals (i.e. lead) and asbestos are present in the power plant building materials. It should be noted that asbestos will have been removed from the power plant buildings before demolition commences. These constituents (including asbestos) are considered constituents of interest (COI) for air monitoring purposes during the demolition activities. Perimeter air monitoring will be conducted by an experienced AECOM project team throughout the demolition activities to: evaluate Site conditions; ensure that the measures used to control potential fugitive emissions are effective; and document ambient air quality/conditions at the perimeter of the Site. In addition, air monitoring will also be conducted prior to the start of demolition activities to assess baseline conditions at the Site.

AECOM Environment
Benning Road Power Plant Demolition, Air Monitoring Plan
1-2
The ambient air measurements and sampling approach consists of the following components:
Continuous Air Monitoring, Meteorological Measurements and Integrated Sampling for the COI – These measurement and sampling techniques will be conducted using both (i) real-time air monitoring instrumentation and (ii) integrated (or time-averaged) sampling and analytical methods appropriate for the various COIs;
Quality Assurance / Quality Control (QA/QC) – These are specific procedures performed to ensure the validity of the data regarding Site conditions;
Alert and Action Level Response Plan – These are specific dust mitigation procedures to be implemented if measured concentrations of particulate matter (PM10) exceed established Alert and Action Levels. Particulate matter will be used as a surrogate for COIs because there are no practical methods for real-time measurement of the project COIs other than for particulates; and
Reporting – There will be routine weekly progress reports/data summaries prepared throughout the air monitoring program. A final air monitoring summary report will be prepared and submitted to Pepco and PES following completion of the Project.
This AMP describes the air quality monitoring activities to be implemented and conducted during the Project. The document is organized in the following manner: The Alert and Action Levels specifically developed for this Project are presented and described in Section 2; the methods for real-time air monitoring and integrated time-average sampling and analysis are detailed in Section 3; procedures for evaluating results and ensuring that the data is appropriate to accurately characterize ambient air quality are presented in Section 4; a response plan and appropriate emission controls in the event that the Alert/Action Level is approached and/or exceeded are presented in Section 5; and activities for reporting the results from the Project are outlined in Section 6. Appendix A presents the AMP amendment form that will be used if changes to the AMP are needed. Appendix B and Appendix C provide supporting information related to Site-specific Action Levels and field QA/QC documentation.

AECOM Environment
Benning Road Power Plant Demolition, Air Monitoring Plan
1-1
Figure 1-1: Benning Road Site Map

AECOM Environment
Benning Road Power Plant Demolition, Air Monitoring Plan
2-1
2.0 Alert and Action Levels and Acceptable Ambient Concentrations
The Site-specific Alert Level, Action Level and Acceptable Ambient Concentrations were derived from the risk analysis for the Constituents of Interest (COI). The results of the risk-based analysis are presented in Appendix B and are summarized in the sections below.
2.1 Alert and Action Levels
The Site-specific Alert and Action Levels are show in Table 2-1. The PM10 Action Level was derived in accordance with the procedures outlined in Appendix B to be used as a real-time screening tool to manage demolition activities to minimize the potential for off-site emissions that could pose a human health risk. The noise Action Level is based on the 1-hour average District of Columbia Noise Control Act of 1977 for construction related noise.
The Site-specific Alert Levels shown in Table 2-1 were developed to provide a tiered approach and provide initial notification to site management personnel (according to the Action Level Response Plan, described in Section 5) when there is a potential for concentrations to be elevated. An Alert Level is a measured PM10 concentration, observation of visible dust or elevated noise level that triggers contingent measures described in Section 5. For example, if particulates are seen to be leaving the Site or migrating to the active areas of the Benning Service Center, contingent measures such as water spray suppression may be used to mitigate fugitive emissions.
An Action Level is a measured PM10 concentration, observation of visible dust or excessive noise level that requires a response action as described in Section 5 to prevent adverse impacts to air quality beyond the Site fenceline (or within the active areas of the Service Center). In the event that an Action Level is reached, the District Department of the Environment (DDOE) will be notified by the PES Construction Manager. Action Levels will be periodically reviewed, evaluated, and adjusted if needed, based on the periodic integrated sampling results as described in Section 3.2.

AECOM Environment
Benning Road Power Plant Demolition, Air Monitoring Plan
2-2
Table 2-1: Alert and Action Levels
Target Compounds
Alert Levels Action Levels
PM10 > 100 µg/m3 (15-minute average concentration)1
> 150 µg/m3 (15-minute average concentration)1
Noise2 Noise levels approaching 80dB Noise levels > 80 dB
Visible Dust3
Dust observation in the Project area related to Project activities
Dust observation within the active area of the Service Center or moving off-Site related to Project activities
µg/m3 – micrograms per cubic meter dB – Decibel 1 In order to maintain a conservative approach, the Alert and Action Levels are defined as the absolute value of the measured concentration, before any adjustment is made to account for background conditions. However, background conditions will be considered in determining an appropriate response to a measured concentration above the Alert or Action Levels, as described in Section 5.
2 Action Level obtained from the District of Columbia Noise Control Act 1977. 3 Visible dust (subjective assessment) verified related to Project activities.
2.2 Acceptable Ambient Concentrations (AACs)
The AACs for the COIs are derived in Appendix B and shown in Table B-1. At the conclusion of the Project, the average concentration of each COI measured during the integrated sampling events over the duration of the demolition activities will be compared to the AACs as part of the final air monitoring report. In addition, project-to-date concentrations will be calculated after each integrated sampling event during the Project and communicated to Project management. This data will be maintained as part of the air monitoring database. Project-to-date average COI concentrations will be compared to AACs during the course of the Project to evaluate the program’s effectiveness.

AECOM Environment
Benning Road Power Plant Demolition, Air Monitoring Plan
3-1
3.0 Air Monitoring and Sampling Procedures
Air monitoring and sampling activities will be conducted throughout the Project in order to: document ambient air quality/conditions at the Site; alert the NCM Group, the demolition contractor, and the construction manager as to potential for emissions to be elevated; evaluate conditions at the property boundary (fenceline) and interior monitoring location HH-7 to ensure that the measures used to control potential fugitive emissions are effective; and guide the need for implementing additional mitigation measures. The monitoring and sampling program will consist of the following components:
Real-time monitoring – to promptly identify potential air emission issues to allow the appropriate engineering/emission controls to be implemented, and to ensure that the emission levels are protective of the adjacent communities, Benning Service Center employees and the environment; and
Integrated, time-averaged sampling and laboratory analysis – to verify that the real-time monitoring process and associated controls are effective to protect the community, Benning Service Center employees, and the environment.
An overview of the monitoring approach is provided in Table 3-1.
AECOM Environment
Benning Road Power Plant Demolition, Air Monitoring Plan
3-1
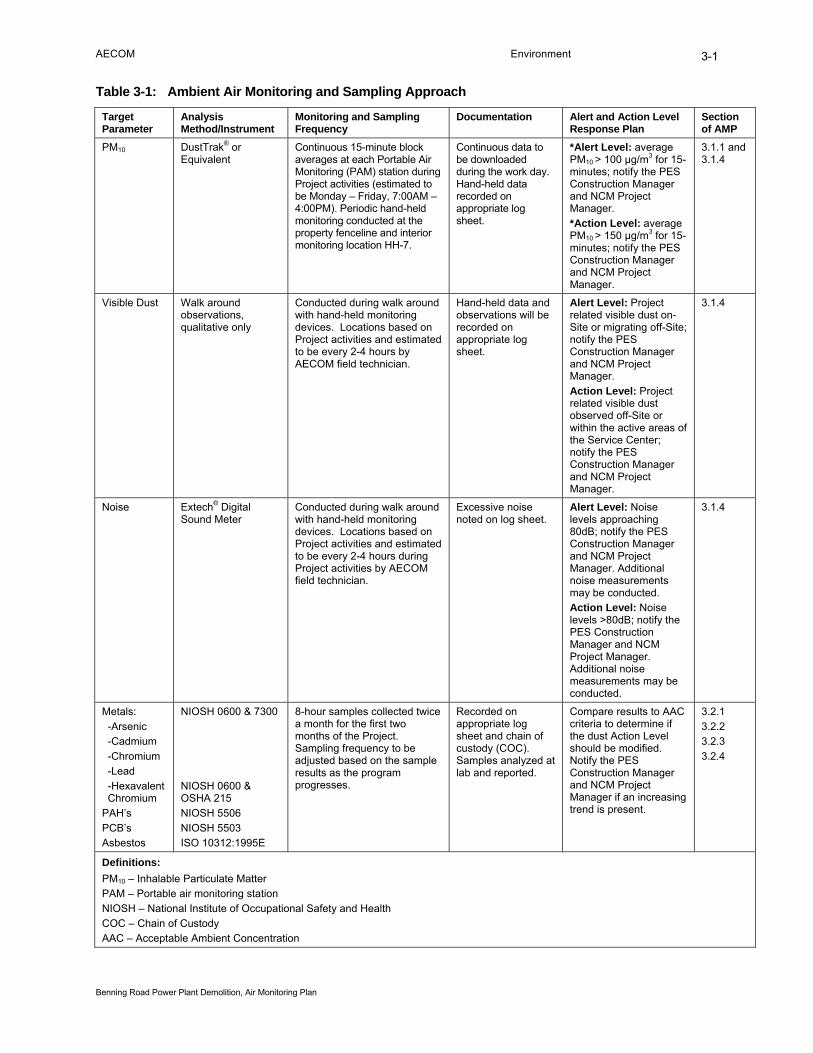
Table 3-1: Ambient Air Monitoring and Sampling Approach
Target Parameter
Analysis Method/Instrument
Monitoring and Sampling Frequency
Documentation Alert and Action Level Response Plan
Section of AMP
PM10 DustTrak® or Equivalent
Continuous 15-minute block averages at each Portable Air Monitoring (PAM) station during Project activities (estimated to be Monday – Friday, 7:00AM – 4:00PM). Periodic hand-held monitoring conducted at the property fenceline and interior monitoring location HH-7.
Continuous data to be downloaded during the work day. Hand-held data recorded on appropriate log sheet.
*Alert Level: average PM10 > 100 µg/m3 for 15-minutes; notify the PES Construction Manager and NCM Project Manager.
*Action Level: average PM10 > 150 µg/m3 for 15-minutes; notify the PES Construction Manager and NCM Project Manager.
3.1.1 and 3.1.4
Visible Dust
Walk around observations, qualitative only
Conducted during walk around with hand-held monitoring devices. Locations based on Project activities and estimated to be every 2-4 hours by AECOM field technician.
Hand-held data and observations will be recorded on appropriate log sheet.
Alert Level: Project related visible dust on-Site or migrating off-Site; notify the PES Construction Manager and NCM Project Manager.
Action Level: Project related visible dust observed off-Site or within the active areas of the Service Center; notify the PES Construction Manager and NCM Project Manager.
3.1.4
Noise Extech® Digital Sound Meter
Conducted during walk around with hand-held monitoring devices. Locations based on Project activities and estimated to be every 2-4 hours during Project activities by AECOM field technician.
Excessive noise noted on log sheet.
Alert Level: Noise levels approaching 80dB; notify the PES Construction Manager and NCM Project Manager. Additional noise measurements may be conducted.
Action Level: Noise levels >80dB; notify the PES Construction Manager and NCM Project Manager. Additional noise measurements may be conducted.
3.1.4
Metals:
-Arsenic
-Cadmium
-Chromium
-Lead
-Hexavalent Chromium
PAH’s
PCB’s
Asbestos
NIOSH 0600 & 7300
NIOSH 0600 & OSHA 215
NIOSH 5506
NIOSH 5503
ISO 10312:1995E
8-hour samples collected twice a month for the first two months of the Project. Sampling frequency to be adjusted based on the sample results as the program progresses.
Recorded on appropriate log sheet and chain of custody (COC). Samples analyzed at lab and reported.
Compare results to AAC criteria to determine if the dust Action Level should be modified. Notify the PES Construction Manager and NCM Project Manager if an increasing trend is present.
3.2.1
3.2.2
3.2.3
3.2.4
Definitions:
PM10 – Inhalable Particulate Matter
PAM – Portable air monitoring station
NIOSH – National Institute of Occupational Safety and Health
COC – Chain of Custody
AAC – Acceptable Ambient Concentration

AECOM Environment
Benning Road Power Plant Demolition, Air Monitoring Plan
3-2
3.1 Air Monitoring and Sampling Approaches
The real-time air monitoring and sampling system consists of six (6) Portable Air Monitoring (PAM) stations equipped with continuous dust measuring instruments that have a size selective inlet to measure PM10. The PAM network is supplemented with hand-held PM10 measurements and observational monitoring; and one (1) meteorological tower. The integrated monitoring system consists of time-averaged sampling conducted at the six (6) fenceline locations and the interior monitoring location (see Figure 1-1) and includes sampling for metals, PAHs, PCBs and asbestos. Sample frequency and location may change based on sample results as the program progresses. Each program component is discussed in the following sections.
3.1.1 Real-Time Air Monitoring
Continuous real-time data will be collected for particulate matter ten micrometers or less in diameter (PM10). Periodic hand-held monitoring will be conducted at the property fenceline and interior monitoring location HH-7. The results from these measurements will be compared to Site-specific “Action Levels”, the concentration/level at which additional sampling and/or control measures are required to ensure that Project activities will not pose a potential risk to receptors beyond the Site fenceline or at the interior monitoring location HH-7.
3.1.1.1 Portable Air Monitoring (PAM) Stations
An automated, perimeter air monitoring network will be installed at the Site boundary (see Figure 1-1) to monitor potential fugitive emissions from demolition activities on a real-time basis during work hours. The network will consist of six (6) PAM stations set up along the fenceline. Spare monitoring equipment will be stored at the Site as appropriate.
Each PAM station includes the following items (see Figure 3-1):
Station tripod;
Weather resistant enclosure;
Particulate monitor (such as the DustTrak®);
Size selective sampler inlet for PM10;
Personal sampling pumps;
Data logger; and
Radio telemetry hardware.

AECOM Environment
Benning Road Power Plant Demolition, Air Monitoring Plan
3-3
Figure 3-1: AECOM Portable Air Monitoring Station
The PAM units will be used to collect and analyze data at the six (6) locations during active work periods throughout the duration of the Project (estimated to be 7:00AM to 4:00PM, Monday through Friday). At the discretion of Project personnel the PAM stations may also be left in operation during extended work periods (after normal working hours) based on Site status and anticipated weather conditions.
The following monitoring equipment will be used at each measurement station:
Particulate matter – dust monitor (manufactured by DusTrak®), or equivalent, will be used to continuously monitor PM10 concentrations during the workday; and
Integrated sampling equipment for PAHs, PCBs and asbestos.
The monitoring equipment will be housed in weather tight enclosures, with the monitoring inlet located in the breathing zone (approximately 1.5 meters above the ground) up to the height of the top rail of the perimeter fence (1.5 to 3 meters above the ground). The initial, recommended positions of the monitoring locations are illustrated in Figure 1-1. Locations of sample stations may change to reflect specific Project activities, wind conditions, and/or accessibility. The locations will be evaluated as the Project progresses. The dust monitors at each PAM station will be set up to calculate 15-minute block averages and the central computer will have the capability to compare the measurements to the Alert and Action Levels, respectively, as well as provide notification to field staff of elevated values. This tiered approach allows Project management

AECOM Environment
Benning Road Power Plant Demolition, Air Monitoring Plan
3-4
ample time to respond to elevated concentrations greater than the Alert Level, before an Action Level is reached.
During routine operations data will be transmitted in real-time to the central computer using a radio transmitter telemetry system. An automated interactive computer display in the central office trailer will inform field staff of Site conditions at the fenceline.
3.1.1.2 Meteorological Monitoring
A meteorological tower (mast) will be erected and secured to the central trailer location at the Site following installation guidelines established by the USEPA for meteorological monitoring systems. See Figure 1-1 for the proposed location of the central office trailer and meteorological system. The meteorological mast will be equipped with sensors located approximately 7-8 meters above ground level to measure wind speed and direction, wind variability (calculated), temperature, relative humidity and precipitation. The meteorological parameters will be measured on a continuous basis, 24-hours a day and 7 days a week for the duration of the Project. The on-Site meteorological system will continuously collect data and log the results as 15-minute block averages. The data from both the fenceline monitoring instruments and the meteorological system will be transmitted in real-time to the central computer system.
A Campbell Scientific™ (or equivalent) data logger included with the meteorological system also calculates the standard deviation of the wind, which is also known as sigma theta. Sigma theta is a parameter that will be observed during Project activity, so that the potential for fugitive emissions to change direction during varying wind periods can be assessed and documented. AECOM will provide the meteorological tower and sensors from its own equipment inventory.
3.1.2 Hand-Held Measurements and Observational Monitoring
During active work periods, measurements from the automated monitoring systems will be supplemented with data collected by the AECOM field technician at the Site fenceline immediately downwind from the work areas and at the interior monitoring location HH-7 (see Figure 1-1) using hand-held measurement devices. Hand-held measurements for PM10 and noise will be conducted routinely, approximately every 2- to 4-hours throughout active work periods. Resulting data will be evaluated using the Alert and Action Levels described in Section 2.1. In the event that off-Site activity, unrelated to the Project, is creating excessive noise levels, measurements will not be taken at that time and a note will be made in the field logs. In addition to PM10 measurements the field staff will also make routine observations of visible dust during the walk around hand-held monitoring. If visible dust related to demolition is observed then the AECOM field technician will conduct additional measurements using the handheld device. This will provide a way to further quantify dust levels. The following monitors and/or observations will be used by the AECOM field technicians during their walk around monitoring:
Particulate matter – a DustTrak® dust monitor;
Visible dust – subjective assessment by the AECOM field technicians; and
Noise levels – EXTECH Digital Sound Level Meter.
The location of the hand-held monitoring points will be correlated to daily Project operations, as required, throughout the program to evaluate potential emissions from specific Project activities/areas. Field notes from these activities will be documented in project field logs. Monitoring data, including field log sheets and field notebooks, will be filed and secured in the central office trailer, with copies
AECOM Environment
Benning Road Power Plant Demolition, Air Monitoring Plan
3-5
transferred to the office project files at AECOM. Examples of the field data sheets for the hand-held monitoring are included in Appendix C.
A hand-held monitoring station will be located between the demolition area of the Site and the active Benning Service Center area. This monitoring location (“HH-7” in Figure 1-1) will be used to document Site conditions outside of the immediate demolition-work area within the western portion of the Site and into the eastern side of the Site where the Benning Service Center employees are principally located. Periodic hand-held PM10 data will be collected in accordance with the procedures/schedule detailed above in Section 3.1.2. In addition, integrated samples will be collected from monitoring location “HH-7” and analyzed for the project-specific Constituents of Interest (COI) to assess any potential exposure of the Benning Service Center employees. This hand-held monitoring location may be subject to change based on meteorological conditions at the time of data collection (i.e. predominant wind direction) and the progress of demolition work.
The Project hand-held monitoring conducted at this location is not related to the measurement of air quality experienced by the demolition workers. The health and safety issues of the demolition personnel are covered in a separate Health and Safety Plan (HASP) developed by the NCM Group.
3.1.3 Central Computer System and Interactive Display
Data collected at the individual PAM stations will be transmitted in real-time to a central data logger and computer system. The data logger at the central computer will be programmed to compare the particulate results (15-minute average concentrations) to the PM10 Alert and Action Levels, respectively and will initiate an alarm (both visual and telephone pager) in the event an elevated concentration is measured with the expectation that the Alert Level Alarm will allow time for mitigation measures to be taken before an Action Level is reached. At this time, the AECOM field technician will evaluate the concentrations and Site conditions to determine if the elevated concentration is due to Project activities. If so, the AECOM field technician will inform the Construction Manager so appropriate actions can be taken.
3.2 Integrated Time-Averaged Sampling and Analysis
Integrated time-averaged sampling and analysis will be conducted for the principal COIs to provide quantification of COIs in ambient air, document the appropriateness of the Alert and Action Levels, and document the effectiveness of the emission controls used at the Site. During Project field activities, composite samples will be collected over an 8-hour period at the six (6) fenceline PAM stations and the interior monitoring location HH-7. Integrated sampling will include one (1) routine field blank sample for each sampling method. The initial recommended locations of the integrated time-averaged samples are identified in Figure 1-1; however, the sampling locations are subject to change based on Project activities, accessibility, and/or weather conditions.
Results of the integrated time-averaged sampling will be compiled to calculate arithmetic program average concentrations which will be compared to the long-term AACs for each COI at each sampling location. Project-to-date averages will be calculated after each integrated sampling event to evaluate the effectiveness of the program mitigation controls. The program average concentrations will incorporate both detected and non-detected laboratory concentrations of each COI. The non-detected concentrations will be represented by using an estimated value of ½ the minimum reporting level, as is the accepted, conservative approach when dealing with “non- detected values”.
Integrated samples will be collected and analyzed for metals (specifically: lead [Pb], arsenic [As], cadmium [Cd] total chromium [Cr] and hexavalent chromium [CrVI]), PAHs, PCBs, and asbestos. For

AECOM Environment
Benning Road Power Plant Demolition, Air Monitoring Plan
3-6
the first two months of the Project, samples will be collected over an 8-hour period twice per month at each of the six (6) PAM stations as well as the interior monitoring location HH-7 in order to provide a sufficient amount of data for the purpose of documenting Site conditions and validating the accuracy of using PM10 sampling as a surrogate for the COI’s. The results of the first two months of sampling will then be reviewed to determine if a less vigorous sampling approach may be used for the remainder of the Project (i.e. once per month and/or using a subset of monitoring locations). The initial sampling locations are shown in Figure 1-1. Sampling for each of the COI will be conducted simultaneously using multiple collocated sampling pumps, techniques, and subsequent laboratory analysis. The separate sampling procedures and laboratory analysis are detailed in the following sections.
3.2.1 Metals (Lead, Arsenic, Cadmium and Chromium)
Integrated ambient particulate samples will be collected according to procedures detailed in National Institute for Occupational Safety and Health (NIOSH) Method 0600: Particulates Not Otherwise Regulated and NIOSH Method 7300: Elements by ICP (Nitric/Perchloric Acid Ashing), respectively. The integrated ambient samples will be collected using the AirMetrics™ Tactile Air Sampler (TAS), or equivalent. The TAS will be configured to draw air at approximately 5 liters per minute (LPM) through a 10 micron particle size separator (impactor). Samples will be collected on a 47 millimeter (mm) polyvinyl chloride (PVC) type filter. Following sample collection, the filters will be shipped to Galson Laboratories under the project specific chain-of-custody (COC) procedures.
3.2.1.1 Hexavalent Chromium (CrVI) Sampling
In addition to the metals listed above, separate ambient particulate samples will be analyzed for CrVI for comparison to the chromium AAC presented in Appendix B (which conservatively assumes that chromium is 100% CrVI). Samples will be collected according to the procedures detailed in National Institute for Occupational Safety and Health (NIOSH) Method 0600: Particulates Not Otherwise Regulated, and will be analyzed for CrVI using OSHA Method 215: Hexavalent Chromium in Workplace Atmospheres. The samples will be collected using the AirMetrics® Tactile Air Sampler (TAS), or equivalent. The TAS will be configured to draw air at approximately 5 liters per minute (LPM). Samples will be collected on a 47 millimeter (mm) polyvinyl chloride (PVC) type filter and shipped to Galson Laboratories under the project specific chain-of-custody (COC) procedures.
3.2.2 Polycyclic Aromatic Hydrocarbons
Integrated PAH samples will be collected using the procedures detailed in NIOSH Method 5506: Polynuclear Aromatic Hydrocarbons by HPLC. This low volume sampling method will be used to collect samples using a personal sampling pump. This method was selected over the traditional USEPA Method TO-13A because of the limited availability of electricity at the Site perimeter and at interior monitoring location HH-7. The use of low volume sampling pumps will enable the use of battery operated devices. The sampling pumps will be configured to draw air at approximately 2 LPM. Particulate-bound PAHs will be collected on a 37 mm filter, while the gaseous fraction of PAHs will be collected in a cartridge packed with polyurethane foam and XAD-2 resin. Following sample collection, the cartridge will be kept cold (on ice) and wrapped in the pre-cleaned aluminum foil that it was delivered in to prevent decomposition of photo-sensitive PAHs. The samples will be returned to Galson Laboratories for analysis under project specific COC documentation.

AECOM Environment
Benning Road Power Plant Demolition, Air Monitoring Plan
3-7
3.2.3 Polychlorinated Biphenyls
Integrated PCB samples will be collected using the procedures detailed in NIOSH Method 5503: Polychlorobiphenyls. This low volume sampling method will be used to collect samples using a personal sampling pump. The sampling pumps will be configured to draw air at approximately 0.7 to 1.0 LPM. Particulate-bound PCBs will be collected on a 13 mm glass fiber filter, while the gaseous fraction of PCBs will be collected using solid sorbent Florisil cartridges. Following sample collection, the filters will be transferred to a sample container and returned to Galson Laboratories for analysis under project specific COC documentation.
3.2.4 Asbestos
Asbestos sampling will be conducted under a separate program by Sussex Environmental Health Consultants, LLC (or similar certified company). Samples will be collected and analyzed using ISO Method 10312:1995E: Ambient Air – Determination of Asbestos Fibers – Direct Transfer Transmission Electron Microscopy Method. Samples will be collected at a flow rate suitable to achieve a detection limit at or below 0.006 asbestos fibers per cubic centimeters of air (s/cc). Samples will be returned to International Asbestos Testing Laboratories (IATL), a certified asbestos laboratory, for analysis under project specific COC documentation.
3.2.5 Chain of Custody Documentation and Procedures
Integrated samples collected in the field will be labeled and kept in a secure location until ready for shipment back to the laboratory. Prior to shipping air samples, a COC form will be completed for each batch of samples. The COC form will include information such as project name, project number, sampler’s name, sampling date, reporting address, sample contact, laboratory and contact information, sample identifications, sample matrix, analysis required, and special instructions or comments. The completed COC will be signed and timed/dated before the samples are shipped. A copy of the COC will be retained for the project file. The samples will be shipped to the laboratory via overnight or second-day courier services.
Laboratory personnel will sign and date the COC form in acknowledgement of receipt and comment, as necessary to document the sample conditions upon receiving each batch of samples. The laboratory will also assign a case number or unique sample identification number to each sample, and will retain one (1) copy of the completed COC for their records.
3.3 Pre-Demolition Air Monitoring and Sampling Activities
Real-time monitoring and integrated time-averaged sampling will be conducted prior to the start of the Project to establish the baseline air quality conditions for the Site. Monitoring and sampling during the pre-demolition or baseline period will be performed in accordance with the procedures previously outlined for the Project.
3.3.1 Real-time Air Monitoring
Pre- demolition real-time air monitoring (PAM, hand-held, and meteorological) will be conducted prior to the start of Project demolition activities. Real-time air monitoring for particulates will be conducted over an approximate 2-day period at six (6) PAM stations to establish baseline concentrations of PM10 for the Site. In addition, hand-held monitoring for PM10 and noise as well as observational monitoring for visible dust will be conducted along the Site perimeter and at interior monitoring location HH-7. A portable meteorological station will be setup on a tripod to be used for the baseline sampling period before demolition activities begin. A Climatronics™ wind sensor system (or equivalent) will be used for meteorological measurements.

AECOM Environment
Benning Road Power Plant Demolition, Air Monitoring Plan
3-8
3.3.2 Integrated Time-Averaged Air Monitoring
Integrated time-averaged air sampling will be conducted prior to the start of the Project. Sampling will be conducted at four (4) of the PAM stations for a period of 8-hours to establish baseline concentrations for the Site. Pre-demolition integrated sampling will include sampling for metals, PAHs, PCBs and asbestos.
AECOM Environment
Benning Road Power Plant Demolition, Air Monitoring Plan
4-1
4.0 Quality Assurance / Quality Control
The AMP will include several Quality Assurance and Quality Control (QA/QC) activities designed to ensure the accuracy and quality of the sampling data.
4.1 Monitoring, Sampling and Analysis
A field log book and sensor calibration field forms (Appendix C), along with data listings, will be maintained by AECOM throughout the monitoring and sampling effort. Information to be recorded by AECOM will include:
Description of demolition activities conducted during elevated data values;
Site maps showing the locations of the PAM stations and hand-held monitoring locations;
Description of demolition activities occurring during periods of elevated real-time air monitoring concentrations, and the associated response actions (such as shut-downs, covering stockpiles, reduced work pace, etc.);
Integrated time-averaged sample media receipt dates, conditions, and numbers;
Copies of the COC forms;
Sampling equipment installation, operation, and removal dates;
Sampling equipment calibration dates and results;
General field weather conditions on sampling days;
Any unusual situations which may affect samples or sampling;
Sample dates; and
Start and stop times.
General QA/QC procedures related to the monitoring, sampling and analysis of the representative air quality conditions at the Site are discussed in the following sections.
4.1.1 Instrument Calibration
Instrument calibrations will be performed according to the AECOM Standard Operating Procedures (SOP) and manufacturers recommendations. The following sections detail the specific calibration frequencies for each type of monitoring.
4.1.1.1 Real-Time Air Monitoring
Instrumentation associated with PAM and hand-held PM10 monitoring activities will be calibrated on a daily basis in accordance with AECOM’s direction and the manufacturers’ instructions using either

AECOM Environment
Benning Road Power Plant Demolition, Air Monitoring Plan
4-2
commercially available standards, or internal calibration points. Specific calibration checks will be conducted at the start of daily demolition activities. In certain circumstances similar calibration checks will be conducted at the conclusion of the measurement day. For example: A calibration check will be conducted if a device is suspected to not be functioning properly. There may also be circumstances where a calibration check is conducted in conjunction with a period of elevated concentrations to verify or validate the device measurements. This check could be conducted just after the period of elevated concentrations or in certain circumstances during the period of elevated concentrations. Routine frequency of calibration checks is as follows:
Particulate monitors will be zeroed each day in addition to an upscale check performed once a week on each unit.
Hand-held instrumentation will be calibrated each day before use.
The meteorological instrumentation will be calibrated during the setup and take down as well as every 6 months to document the condition of the equipment and assure the quality of the recorded meteorological data.
The noise monitor will be checked and calibrated at the same time as the meteorological system (every 6 months) using a certified calibration device. Daily checks will also be conducted using a separate calibration check device before the start of monitoring and in the event that any elevated noise levels are measured.
4.1.1.2 Integrated Time-Average Sampling
The integrated sampling pumps and inlets will be supplied with an initial startup calibration. Routine field checks will be performed to ensure the samplers are working properly, as needed. The following calibration and field checks will be performed on the TAS samplers and the personal sampling pumps:
TAS Systems - TAS will be calibrated in accordance with manufacturers’ instructions and the requirements of the method. A multipoint calibration of each TAS sampler will be performed during the program startup against a National Institute of Standards and Technology (NIST) traceable flow standard. The calibration will be conducted with a “dummy” filter in place to emulate the load against the sampler pump. The calibration of the flow controllers in the sampler is necessary to establish flow traceability of the field measurement to a primary flow standard. A field flow transfer Model DC-1 manufactured by BIOS International or a laminar NIST traceable orifice will be used to calibrate the flow controller. A minimum of five calibration points should be established, evenly divided throughout the operation range of the flow controller and equivalent to the designated sampling flow rate.
A periodic leak check followed by a single point flow check at the set point will be performed against the flow standard. The flow will be documented at the start and end of each sampling event and at least one periodic check of the samplers will be performed during each sampling event.
Personal Monitoring Pumps - Sample pumps will be calibrated in accordance with manufacturers’ instructions and the requirements of the method. The flow rate of the sample pumps will be checked daily prior to each sample run. Sample pump calibration checks may also be performed at the end of a sample event if the flow rate or function of the sample pump is suspect.
In the event that the post-sampling measurements differ from the initial calibrations by more than 10%, the lower of the measured flow rates will be used in determining the total sample volume, as this will result in a more conservative concentration result. In these instances, the pump will then be removed from service and repaired. If the flow drop is more than 30% of the target flow rate the

AECOM Environment
Benning Road Power Plant Demolition, Air Monitoring Plan
4-3
sample may be discarded and the field log noted appropriately as determined by the project manager and technical support staff.
4.1.2 Field Quality Control Samples
The following field QA/QC sample will be used to facilitate the evaluation of the precision and accuracy of the results from the laboratory samples:
Field Blanks – Field blanks will be collected for each of the NIOSH methods at the frequency of one (1) per sampling campaign for each method. The result of the blank sample analysis will provide data to determine if the field operations are being carried out properly or if there are other issues to explore. The blank results may also determine if there is a need to adjust the analytical results to compensate for the blank results, although this would typically not be recommended.
4.1.3 Data Validation
Real-time data (PM10, meteorological and noise) and integrated time-average data (laboratory analysis) will be validated prior to reporting. The frequency and validation procedures are discussed in the following sections.
4.1.3.1 Real-Time Data Review and Validation
Real-time PM10, noise and meteorological data will be reviewed and validated by a quality control air measurements data processing staff. This person will review the real-time and meteorological results in conjunction with the QA/QC documentation to ensure that supporting information is complete to confirm that the results are valid. Periods of invalid data will be accompanied by validation notes as part of the electronic AMP database.
4.1.3.2 Integrated Time-Average Data Review and Validation
Laboratory generated analytical data will be reviewed to ensure that the data are of sufficient quality to support Project decisions. The first two (2) data packages for metals, PAHs and PCBs will be validated by AECOM against the requirements provided in the published analytical method using the validation actions provided in USEPA Contract Laboratory Program National Functional Guidelines for Superfund Organic Methods Data Review (June 2008). AECOM’s approach will use a limited data review for subsequent results packages in an effort to ensure the quality of data generated under this program while minimizing costs. The data review procedures are described below.
Validation includes review of the following items:
COC and sample condition will be reviewed by the laboratory upon receipt to verify that they are signed and included in the data package;
Samples reported, sample IDs, dates of analysis etc. in the report will be verified against the COC;
Sample preparation and analyses dates will be checked to verify that method-specified holding times were met; and
Laboratory summary forms (not raw data) will be reviewed for the following elements, where applicable to the method:

AECOM Environment
Benning Road Power Plant Demolition, Air Monitoring Plan
4-4
- Surrogate recoveries meet applicable acceptance limits;
- Blanks are run at the required frequency and contain target compounds that are below the reporting limit;
- Laboratory control samples (LCSs) meet recovery and frequency requirements;
- Laboratory duplicate samples meet precision and frequency requirements;
- Gas chromatography/mass spectrometry (GC/MS) tuning meets ion abundance and analytical frequency requirements;
- Initial calibrations (ICALs) meet linearity requirements;
- Continuing calibration verification (CCV) standards meet percent difference (%D) and frequency requirements;
- Internal standards (ISs) meet recovery and retention time criteria;
- Project required reporting limits are met for undiluted samples; and
- Field duplicate precision will be calculated and assessed against project requirements.
Results of the validation will be summarized in a data validation memorandum. Any necessary qualifiers will be appended to a copy of the laboratory results and included as an attachment to the memorandum. Qualifiers will be consistent with those described in the USEPA Contract Laboratory Program’s data validation guidance document.
It is important to the success of the air monitoring program that serious or systematic errors be identified as early in the project as possible. This allows corrective action measures to be implemented in a timely fashion minimizing impacts to schedule and budget. Therefore, validation consistent with the USEPA guidance document will be performed on the samples collected from the first two (2) sampling events. If the results of the validation suggest that there are no serious or systematic errors, AECOM will proceed with limited validation.
In the event the initial validation efforts reveal serious laboratory errors, AECOM will notify the laboratory and the laboratory will be required to provide appropriate corrective action. AECOM may then seek authorization from Pepco and PES to increase the percentage of data subjected to full validation until such time that AECOM determines the laboratory is performing at an acceptable level of quality.

AECOM Environment
Benning Road Power Plant Demolition, Air Monitoring Plan
5-5
5.0 Alert and Action Level Response Plan
AECOM has developed a tiered approach to evaluating Site conditions according to the Alert and Action Levels presented in Section 2.0. This tiered approach is consistent with the Site conditions and control responses presented in the Emissions Control Plan (Section 5.4). The following sections describe the Site conditions and the air monitoring Alert and Action Level Response Plan.
5.1 Site Conditions
Real-time air monitoring data measured on Site will be used to evaluate the Site conditions on a real-time basis to allow the demolition contractor the opportunity to adequately, and in a timely manner, respond to any instances of elevated concentrations. Table 5-1 presents the designated “Site Condition” associated with the measured values for each of the real-time monitoring parameters.
Table 5-1: Site Conditions
Target Compound
Operational Condition Site Condition 1 Site Condition 2
PM10 15-minute PM10 ≤ Alert Level
15-minute PM10 > Alert Level
15-minute PM10 > Action Level
Visible Dust
No visible dust observed on Site
Visible dust (generated by Project activities) observed
on Site
Visible dust (generated by Project activities) observed
migrating off Site or to active areas of the Service
Center.
Noise Noise levels < 80dB Noise levels approaching 80dB
Noise levels > 80dB
*Alert and Action Levels are defined in Section 2.0.
5.2 Alert and Action Level Response Plan
In the event of a PM10 concentration greater than the Alert and/or Action Level, the automatic alarm notification system will activate a visual and auditory alarm at the central computer located in the on-Site central trailer. The alarm notification will remain active until the alarm is acknowledged by the AECOM field technician. An automatic cell phone text or email notification will also be generated for periods when the AECOM field technician is not in the central office trailer. The following actions will be taken in response to an alarm notification:
1. The AECOM field technician will first verify the monitoring device is operating correctly and within calibration standards;
2. The AECOM field technician will verify that the Site condition and elevated concentrations are real and related to demolition activities (taking into account background conditions);

AECOM Environment
Benning Road Power Plant Demolition, Air Monitoring Plan
5-6
3. The AECOM field technician will notify the PES Construction Manager and NCM Project Manager of periods of elevated concentrations related to demolition activities;
4. The AECOM field technician will work with the PES Construction Manager and NCM Project Manager to determine the appropriate control and mitigation measures to be taken in response (as described in Section 5.4 below);
5. The PES Construction Manager will implement the control and mitigation measures;
6. The PES Construction Manager will evaluate the performance of the control and mitigation measures;
7. The PES Construction Manager will notify Pepco and PES of changes in the Site Condition;
8. The PES Construction Manager will notify Pepco and PES of any modifications to the control response based on real-time air monitoring results; and
9. The PES Construction Manager will notify DDOE in the event that an Action Level is reached.
5.3 Documentation
Each period of elevated PM10 concentrations, noise levels or visible dust greater than the Alert and/or Action Levels will be documented by the AECOM field technician in the field log notebook. Information recorded during periods of elevated concentrations will include, at a minimum, the following:
Time of elevated concentration;
Location of elevated concentration;
Cause for elevated concentration;
Relevant meteorological conditions;
Background concentrations;
Relevant demolition activities; and
Documented response actions and their effectiveness.
The AECOM field technician will provide an initial oral notification to the PES Construction Manager and the NCM Project Manager for each period of elevated concentrations and will provide a written summary as part of the weekly data summary reports.
5.4 Control and Mitigation Measures
Real-time data generated by the PM10 monitoring, hand-held monitoring, visible dust observations, and meteorological monitoring will be evaluated together in order to make appropriate decisions concerning Site Conditions (as described in Table 5-1) and potential control measures. Possible corrective actions based on Site conditions are listed in Table 5-2. Site contacts and key personnel are listed in Table 5-3.

AECOM Environment
Benning Road Power Plant Demolition, Air Monitoring Plan
5-7
Table 5-2: Site Conditions and Corrective Actions
Site Condition Corrective Action
Operational Condition Normal Site operations – No Response Action Required.
Continue air monitoring.
Site Condition 1 Establish trend of data and determine if evaluation and/or a waiting period is warranted;
Notify NCM Project Manager and PES Construction Manager;
Slow the pace of work activities;
Temporarily stop work;
Temporarily relocate work to an area with potentially lower emission levels;
Reschedule work activities;
Apply water to area of activity or haul roads to minimize PM10 concentrations;
Change work process or equipment that minimizes air emissions;
Evaluate Project activities as they relate to PM10 concentrations;
Continue air monitoring.
Site Condition 2 Notify NCM Project Manager and PES Construction Manager;
Implement controls associated with Site Condition 1;
Assess work activity modifications;
Cease work activities; and/or
Re-evaluate AMP; and
Continue Air Monitoring.
PES notifies DDOE.
Notes: The bulleted response actions specified under each Site condition can be implemented in any order or combination that is most appropriate under the existing site conditions.

AECOM Environment
Benning Road Power Plant Demolition, Air Monitoring Plan
5-8
Table 5-3: Site Contacts and Key Personnel
District Department of the Environment (DDOE)
Manuel Olivia DDOE Manager
Ed Harris Environmental Protection Specialist
Pepco Energy Services
Mike Williams Site Manager
Dan Stevens Construction Manager
Jim McNulty Senior Project Manager
Heather Brinkerhoff Health and Safety Manager
Potomac Electric Power Company (Pepco): Facility RI/FS
Fariba Mahvi Project Manager
NCM Group
Robert Resuriz Sr. Project Manager
Nick Bucci Assistant Project Manager
AECOM
Frank Tringale Project Manager
Ravi Damera Project Director
David Smith Air Monitoring Technician
Sharon Drummond Alternate Air Monitoring Technician
Matthew Arvanites Database Manager
Note: For questions please call the Benning Demolition voice messaging system at (202) 730-1199.

AECOM Environment
Benning Road Power Plant Demolition, Air Monitoring Plan
6-1
6.0 Reporting
The air monitoring results from the program will be documented with weekly data summaries to facilitate communication with Pepco and PES on an on-going basis. A final air monitoring report will be prepared following the conclusion of the Demolition project.
6.1 Weekly Data Summaries
AECOM will provide weekly written summaries of the air monitoring data in addition to updates at the weekly Project meetings to facilitate communication with Pepco and PES. The written summaries will include a tabular presentation of real-time and integrated sampling results as well as a graphical presentation of trends in the meteorological data. The summaries will be supplemented with notations of elevated concentrations measured above the Alert or Action Levels, as well as associated control responses that include an assessment of the Alert and Action Levels and their effectiveness in meeting the AACs at the Site fenceline and interior monitoring location HH-7.
6.2 Final Air Monitoring Summary Report
Following the conclusion of the Project, AECOM will prepare a summary of the real-time and integrated time-averaged results. The report will include the following:
• Tabulated summaries of continuous air monitoring, periodic hand held air monitoring and 8-hour integrated sampling results;
• Summary of Alert Level events identifying the locations of the elevated concentrations and mitigation controls implemented by the Demolition Contractor
• Summary of Action Level events identifying the locations of the elevated concentrations and mitigation controls implemented by the Demolition Contractor;
• Summaries of the meteorological data in the form of time series plots and a wind rose;
• Assessment of the AAC analytical data with respect to any Alert or Action Level events;
• Assessment of the effectiveness of the selected Alert or Action Levels to effectively meet AACs at the fenceline and at interior monitoring location HH-7;
• Conclusion as to the overall effectiveness of the air monitoring program;
• Appendices providing field data logs and raw laboratory analytical data reports; and
• Electronic file containing a complete record of the data collected for the Site.
Copies of the analytical data and QA/QC documentation will be provided on a compact disk as part of the final air monitoring summary report. The air monitoring portion of the final report will be submitted to Pepco, PES, and DDOE for review within 90-days of the Project completion.

AECOM Environment
Benning Road Power Plant Demolition, Air Monitoring Plan
7-2
7.0 References
AECOM, December 2011. Interim Remedial Measures Work Plan.
American National Standards Institute (ANSI), August 2007. ISO Method 10312:1995E – Ambient Air – Determination of Asbestos Fibers – Direct Transfer Transmission Electron Microscopy Method.
D.C. Law 2-53, 24 DCR 5293, 5308, December 1977. District of Columbia Noise Control Act 011977.
NCM Group, November 2013. Dust Monitoring and Control Plan, Pepco Energy Services, Benning Road Demolition, 3400 Benning Road NE, Washington, D.C.
NIOSH Manual of Analytical Methods (NMAM), Fourth Edition, August 1994. Method 5503: Polychlorobiphenyls.
NIOSH Manual of Analytical Methods (NMAM), Fourth Edition, August 1994. Method 5506: Polynuclear Aromatic Hydrocarbons by HPLC.
NIOSH Manual of Analytical Methods (NMAM), Fourth Edition, August 1994. Method 0600: Particulates Not Otherwise Regulated, Respirable.
NIOSH Manual of Analytical Methods (NMAM), Fourth Edition, August 1994. Method 7300: Elements by ICP (Nitric/Perchloric Acid Ashing).
Tetra Tech EM Inc., June 2009. Final Site Inspection Report for the Pepco Benning Road Site Washington D.C.
United States Environmental Protection Agency, January 2010. Contract Laboratory Program National Functional Guidelines for Inorganic Superfund Data Review, OSWER 9240.1-51, EPA 540-R-10-011.
United States Environmental Protection Agency, June 2008. Contract Laboratory Program National Functional Guidelines for Superfund Organic Methods Data Review, EPA-540-R-08-01.

AECOM Environment
Benning Road Power Plant Demolition, Air Monitoring Plan
Appendix A AMP Amendment Form

AECOM 978.905.2100 tel 250 Apollo Drive 978.905.2101 fax Chelmsford, Massachusetts
Air Monitoring Plan Amendment
Amendment No.: 01
Client: PEPCO Energy Services AECOM Project Number: 60309564
Location: Northeast Washington D.C. Date:
AECOM Project Manager: Frank Tringale PES Site Manager:
Amendment Description:
Reason for Amendment:
Signature for AECOM
Date:
Signature for PES
Date:

AECOM Environment
Benning Road Power Plant Demolition, Air Monitoring Plan
Appendix B Development of the Site-Specific Acceptable Ambient Concentrations and the Action Levels

AECOM Environment
Benning Road Power Plant Demolition, Air Monitoring Plan
1.0 Derivation of Acceptable Ambient Concentrations and Action Levels for Particulates
1.1 Acceptable Ambient Concentrations
Acceptable Ambient Concentrations (AACs) for the Project were derived for compounds that were suspected and/or detected in soil at the Site that may become airborne during anticipated earth moving activities, and compounds detected in concrete, painted surfaces, concrete and other building materials that may be disturbed during plant decommissioning activities.
The AACs were calculated assuming that a nearby human receptor is present at their residence or workplace over the duration of the planned demolition and earth moving activities. In general, the AACs were based on the carcinogenic and non-carcinogenic properties of the specific compounds detected in soil, concrete, paint and other building materials, and the assumed likely duration of the planned demolition/earth moving activities. The AACs were used to develop Action Levels for use in the air monitoring program at the site. A conservative approach was taken in that the final Action Levels for particulates did not consider the potential for changes in intermittent emission rates and meteorological conditions as fugitive dust migrates off-site toward nearby receptors.
Once exposure and toxicity information were collected for the most frequently detected compounds, AACs were calculated following United State Environmental Protection Agency (USEPA) risk assessment guidelines (USEPA, 1989). AACs and the Action Levels were calculated assuming the receptors are present at the fenceline where the air monitoring stations are located. For polycyclic aromatic hydrocarbons (PAHs), metals and polychlorinated biphenyls (PCBs), the air Action Level is expressed as particulate levels in air based on the concentrations of individual compounds in soil, concrete and/or paint chips (lead, only).
The air monitoring plan includes the following assumptions regarding the duration and length of the planned demolition and earth moving activities. The risk-based AACs incorporate this exposure frequency and duration.
Total demolition and earth moving activities expected to be 5 days/week for 26 weeks (130 days).
Demolition and earth moving activities will occur approximately 8 hours per day.
1.1.1 AACs for PAHs, Metals and PCBs
The USEPA’s guidance regarding the hierarchy of sources of human health dose-response values in risk assessment was followed (EPA, 2003). Sources of the published dose-response values in this risk assessment include:
Tier 1: EPA’s Integrated Risk Information System (IRIS) (USEPA, 2013a).
Tier 2: EPA’s Provisional Peer-Reviewed Toxicity Values (PPRTVs) (USEPA, 2013b).
Tier 3: Additional EPA and non-EPA sources of toxicity information.
The primary (Tier 1) USEPA source of dose-response values is IRIS, an on-line computer database of toxicological information (EPA, 2013a). The IRIS database is updated monthly to provide the most current USEPA verified dose-response values. As defined by the USEPA (1997), a dose-response value is “Work

AECOM Environment
Benning Road Power Plant Demolition, Air Monitoring Plan
Group-Verified” if all available information on the value has been examined by an Agency Work Group, the value has been calculated using current Work Group methodology, a unanimous consensus has been reached on the value by the Work Group, and the value appears on IRIS.
When a dose-response value was not available from IRIS, the Second Tier Source was PPRTV, an on-line computer database of toxicological information established for the USEPA Office of Remediation and Technology Innovation (Tier 2). A PPRTV Derivation Support Document for the value is generally provided. Where Tier 1 and Tier 2 values are not available, Tier 3 sources, including the USEPA Regional Screening Levels (RSLs) (USEPA, 2013c), California EPA (CalEPA) Office of Environmental Health and Hazard Assessment (OEHHA) (CalEPA, 2013), the Agency for Toxic Substances and Disease Registry (ATSDR, 2013), and USEPA’s Health Effects Assessment Summary Tables (HEAST) (EPA, 1997) were used.
Table B-1 summarizes AACs based on carcinogenic and non-carcinogenic target risk levels for compounds excluding asbestos. The AAC for a specific chemical was selected as the lower of the two sets of calculations.

Table B-1: Acceptable Ambient Concentrations (AACs)
Carcinogenic Non-Carcinogenic AACCompound Inhalation Unit Risk CSFi RfC Chronic RfDo Chronic RfDi (Cair-c) (Cair-nc) (b)
[(ug/m3)-1] Source [(mg/kg-d)-1] Source (mg/m3) Source (mg/kg-d) Source (mg/kg-d) Source (mg/m3) (mg/m3) (mg/m3)
PAHsAcenaphthene 6.00E-02 IRIS 6.00E-02 IRIS 1.07E+00 1.07E+00Acenaphthylene 6.00E-02 (a) Acenaphthene 6.00E-02 (a) Acenaphthene 1.07E+00 1.07E+00Anthracene 3.00E-01 IRIS 3.00E-01 IRIS 5.33E+00 5.33E+00Benzo(a)anthracene 1.10E-04 CalEPA 3.85E-01 CalEPA (d) 3.00E-02 (a) Pyrene 3.00E-02 (a) Pyrene 3.23E-03 5.33E-01 3.23E-03Benzo(a)pyrene 1.10E-03 CalEPA 3.85E+00 CalEPA (d) 3.00E-02 (a) Pyrene 3.00E-02 (a) Pyrene 3.23E-04 5.33E-01 3.23E-04Benzo(b)fluoranthene 1.10E-04 CalEPA 3.85E-01 CalEPA (d) 3.00E-02 (a) Pyrene 3.00E-02 (a) Pyrene 3.23E-03 5.33E-01 3.23E-03Benzo(g,h,i)perylene 3.00E-02 (a) Pyrene 3.00E-02 (a) Pyrene 5.33E-01 5.33E-01Benzo(k)fluoranthene 1.10E-04 CalEPA 3.85E-01 CalEPA (d) 3.00E-02 (a) Pyrene 3.00E-02 (a) Pyrene 3.23E-03 5.33E-01 3.23E-03Chrysene 1.10E-05 CalEPA 3.85E-02 CalEPA (d) 3.00E-02 (a) Pyrene 3.00E-02 (a) Pyrene 3.23E-02 5.33E-01 3.23E-02Dibenzo(a,h)anthrancene 1.17E-03 CalEPA 4.10E+00 CalEPA (d) 3.00E-02 (a) Pyrene 3.00E-02 (a) Pyrene 3.04E-04 5.33E-01 3.04E-04Fluoranthene 4.00E-02 IRIS 4.00E-02 IRIS 7.11E-01 7.11E-01Fluorene 4.00E-02 IRIS 4.00E-02 IRIS 7.11E-01 7.11E-01Indeno(1,2,3,-cd)pyrene 1.10E-04 CalEPA 3.85E-01 CalEPA (d) 3.00E-02 (a) Pyrene 3.00E-02 (a) Pyrene 3.23E-03 5.33E-01 3.23E-032-Methylnaphthalene 4.00E-03 IRIS 4.00E-03 IRIS 7.11E-02 7.11E-02Naphthalene 3.40E-02 CalEPA 1.19E-01 CalEPA (d) 3.00E-03 IRIS 2.00E-02 IRIS 8.57E-04 IRIS 1.05E-02 1.52E-02 1.05E-02Phenanthrene 3.00E-01 (a) Anthracene 3.00E-01 (a) Anthracene 5.33E+00 5.33E+00Pyrene 3.00E-02 IRIS 3.00E-02 IRIS 5.33E-01 5.33E-01
MetalsArsenic 4.30E-03 IRIS 1.51E+01 IRIS (d) 1.50E-05 CalEPA 3.00E-04 IRIS 4.29E-06 IRIS (d) 8.27E-05 7.62E-05 7.62E-05Beryllium 2.40E-03 IRIS 8.40E+00 IRIS (d) 2.00E-05 IRIS 2.00E-03 IRIS 5.71E-06 IRIS (d) 1.48E-04 1.02E-04 1.02E-04Cadmium 1.80E-03 IRIS 6.30E+00 IRIS (d) 1.00E-05 ATSDR 1.00E-03 IRIS 2.86E-06 IRIS (d) 1.98E-04 5.08E-05 5.08E-05Chromium (assume CrVI) 1.20E-02 IRIS 4.20E+01 IRIS (d) 1.00E-04 IRIS 3.00E-03 IRIS (diet) 2.86E-05 IRIS (d) 2.96E-05 5.08E-04 2.96E-05Cobalt 9.00E-03 PPRTV 3.15E+01 PPRTV (d) 6.00E-06 PPRTV 3.00E-04 PPRTV 1.71E-06 PPRTV (d) 3.95E-05 3.05E-05 3.05E-05Lead 1.20E-05 CalEPA 4.20E-02 CalEPA (d) 2.96E-02 2.96E-02Mercury 3.00E-04 RSL 3.00E-04 IRIS 8.57E-05 IRIS (d) 1.52E-03 1.52E-03Nickel 2.40E-04 IRIS 8.40E-01 IRIS (d) 1.40E-05 CalEPA 1.10E-02 CalEPA 4.00E-06 CalEPA (d) 1.48E-03 7.11E-05 7.11E-05Vanadium 1.00E-04 ATSDR 5.00E-03 RSL 2.86E-05 RSL (d) 5.08E-04 5.08E-04Zinc 3.00E-01 IRIS 3.00E-01 IRIS 5.33E+00 5.33E+00
PCBsAroclor 1242 5.70E-04 RSL 2.00E+00 RSL (d) 2.00E-05 (a) Aroclor 1254 2.00E-05 (a) Aroclor 1254 6.24E-04 3.56E-04 3.56E-04Aroclor 1254 5.70E-04 RSL 2.00E+00 RSL (d) 2.00E-05 IRIS 2.00E-05 IRIS 6.24E-04 3.56E-04 3.56E-04Aroclor 1260 5.70E-04 RSL 2.00E+00 RSL (d) 2.00E-05 (a) Aroclor 1254 2.00E-05 (a) Aroclor 1254 6.24E-04 3.56E-04 3.56E-04
Cair-nc = (THI x RfDi x BW x ATnc) / (IR x EF x ED x FD)Assumptions: UnitsBody weight (BW) kg 11.4 (b) Cair-c = (TR x BW x ATc) / (SFi x IR x EF x ED x FD)Inhalation rate (IRair) m3/day 5.4 (c) Averaging time (ATC) years 70
days 25550Averaging time (ATnc) days 365Fraction of day (FD) unitless 0.33 (e)Exposure frequency (EF) day/yr 130Exposure duration (ED) yr 1Target Risk Level (TR) 1.00E-06Target Hazard Index (THI) 1
Notes:AAC - Acceptable Air Concentration. = lower of carcinogenic or non carcinogenic values. The risk-based value for noncarcinogens is the C air-nc value. The risk-based value for carcinogens is the C air-c value.ATSDR - Agency for Toxic Substances and Disease Registry. Chronic inhalation Minimimal Risk Level (MRL). July 2013. [URL: http://www.atsdr.cdc.gov/mrls/index.asp].CSFi - Inhalation Cancer Slope Factor.RfDi - Inhalation Reference Dose. Extrapolated directly from RfDo, unless otherwise indicated.RfDo - Oral Reference Dose.RSL - Regional Screening Level. USEPA, Region 3. May 2013. [URL: http://www.epa.gov/reg3hwmd/risk/human/rb-concentration_table/index.htm].IRIS - Integrated Risk Information System Database. October 2013. [URL: http://www.epa.gov/IRIS/].CalEPA - California EPA. October 2013. [URL: http://www.oehha.ca.gov/risk/ChemicalDB/index.asp].PPRTV - Provisional Peer Reviewed Toxicity Value. USEPA. October 2013. [URL: http://hhpprtv.ornl.gov/].(a) - No value available. Therefore, value for listed constituent is used, based on structural similarity.(b) - Mean body weight for 1-2 year old child. USEPA Exposure Factors Handbook. September 2011. EPA/600/R-090/052F.(c) - Mean inhalation rate for 1-2 year old child. USEPA Exposure Factors Handbook. September 2011. EPA/600/R-090/052F.(d) - Calculated from inhalation unit risk or RfCi, assuming a 70 kg individual inhales 20 m3/day.(e) - Assumed intrusive soil activities (e.g., excavation) occurs 8 hours per 24 hour day.
Calculated Concentration

AECOM Environment
Benning Road Power Plant Demolition, Air Monitoring Plan
1.1.2 AAC for Lead
Lead has been detected in soil, concrete and paint present at the Benning Road Power Plant. As discussed above and as presented in Table B-1, an AAC for lead of 29.6 micrograms per cubic meter of air (µg/m3) (or 0.0296 milligrams per cubic meter of air - mg/m3) was developed based on the carcinogenic effects. However, the USEPA has stated that the current knowledge of lead pharmacokinetics indicates that risk values derived by standard risk assessment procedures (i.e., a reference dose (RfD) or cancer potency approach) would not truly indicate the potential risk from lead, because of the difficulty in accounting for pre-existing body burdens of lead (USEPA, 2013a). It is felt that the health effects due to lead exposures are better represented by blood lead levels. The USEPA's and the Center for Disease Control’s (CDC) level of concern for blood lead levels are currently 10 micrograms per deciliter (μg/dl) and 5 µg/dl, respectively.
The USEPA has developed a computer model for exposure to lead in the environment. This model is referred to as the Integrated Exposure, Uptake, and Biokinetic Model (IEUBK). The IEUBK model utilizes a partially compartmentalized physiologic-based pharmacokinetic model that estimates potential bodily uptakes and resultant blood lead levels in children due to exposure to environmental lead. This model has been validated at several Superfund Sites. The IEUBK model predicts blood lead concentrations in young children exposed to lead from several sources and by several routes. The model incorporates a four step process that links environmental lead exposure to blood lead concentrations for children from 0 months to 84 months (7 years) of age. Using the IEUBK model (Ver. 1.1), AECOM evaluated potential health risks due to lead in ambient air and determined that a risk-based AAC of 25 µg/m3 will not result in blood lead levels in children greater than the CDC’s 5 µg/dl level of concern.
The risk-based AAC for lead can also be derived from the USEPA’s National Ambient Air Quality Standard (NAAQS) for lead (3-month average concentration) of 0.15 µg/m3, with consideration to the fact that demolition activities will not be continuous (i.e., 24 hours/day, 7 days/week) and are expected to be performed 8 hours/day, 5 days/week, as follows:
A conservative approach was taken in that the lowest of the AACs for lead calculated using either: 1) the cancer potency approach; 2) the IEUBK model; or 3) based on the NAAQS, was selected as the AAC for lead at the Benning Road Site. As such, the AAC for lead will be 0.63 µg/m3.
1.1.3 AAC for Asbestos
Asbestos is present in building materials at the Benning Road Power Plant. Although the toxicity (and AACs) for PAHs, metals and PCBs in air is related to particulates in air and is expressed in the units of µg/m3 of air, the toxicity for asbestos is not related to particulates in air and is expressed in the units of fibers/cubic centimeter (f/cc) of air. In addition, unlike other potential carcinogenic compounds detected in soil or other media at the facility, inhaled asbestos is carcinogenic at the point of entry into the body (i.e., the respiratory system – lung cancer, mesotheliomas). The AAC for asbestos was, therefore, calculated following USEPA asbestos risk assessment guidelines detailed in Office of Solid Waste and Emergency Response (OSWER) Directive #9200.0-68 entitled Framework for Investigating Asbestos-Contaminated Superfund Sites (the “Framework”).
3ug/m
dy 7
dy 5
hr 24
hr 8
ug/m 0.15ononcentratiirAcceptable
3
63.0
*
CA

AECOM Environment
Benning Road Power Plant Demolition, Air Monitoring Plan
In accordance with the Framework, the probability that an individual will develop asbestos-related cancer as a result of inhaling asbestos fibers is calculated as follows:
EPC x TWF x IUR = Cancer Risk (unitless)
Where:
EPC = Exposure Point Concentration in fibers per cubic centimeter of air (f/cc) TWF = Time Weighting Factor = Exposure Time (hr/day) x Exposure Frequency (days/year) 24 hr/day 365 days/year IUR adj = Inhalation Unit Risk in (f/cc)-1 adjusted for age of first exposure and duration
An inhalation unit risk (IUR) value is available on the USEPA’s IRIS database for asbestos fibers. As discussed in the Framework, the concentration-response function on which the asbestos IUR is based varies as a function of time since first exposure. Consequently, estimates of cancer risk depend not only on exposure frequency and duration, but also on age at first exposure. Therefore, it is essential to use an IUR value that matches the exposure period of interest (exposure duration and age of first exposure). A table of IURs adjusted based on age of first exposure and duration of exposure is provided in Table E-4 of the Framework. Exposure to a nearby resident is assumed to occur from birth and the duration was conservatively assumed to be 1 year (expected 6 month demolition/earth moving project duration). Accordingly, from Table E-4 of the Framework, the applicable IUR is 1.0E-02 (f/cc)-1.
For the purposes of deriving an AAC for asbestos for use during the planned demolition activities, a Target Cancer Risk level of 1E-05 was assumed since this represents the mid-point of the USEPA’s acceptable risk range [i.e., 1E-06 (1 in 1,000,000) to 1E-04 (1 in 10,000)], the carcinogenic endpoint for inhaled asbestos is unique (i.e., at the point of entry into the body) and the cancer risk due to background levels of asbestos in air can be above 1E-05. The above equation can then be re-arranged to calculate an AAC (the EPC in the above equation) for inhaled asbestos fibers, as follows:
1.2 Site-Specific Action Levels
Site-specific Action Levels are intended to provide general guidance for identifying periods/conditions when additional controls should be implemented. The calculations used to derive the Action Levels are extremely conservative in that they assume that the short-term concentrations that would meet/exceed the value are constant over the duration of the Project, rather than intermittent in nature, and that exposures occur at the fenceline. A more detailed discussion of the derivation of the Action Levels is provided below.
1.2.1 Particulate-Related Constituents
A particulate matter Action Level of 0.15 mg/m3 is proposed for use at the Benning Road Site. The particulate Action Level is consistent with the USEPA’s NAAQS for respirable particulates (i.e.,
f/cc 0.008
dy/yr 365
dy/yr 130
hr/day 24
hr/day 8
05-1EononcentratiirAcceptable
1-(f/cc) 01.0**
CA

AECOM Environment
Benning Road Power Plant Demolition, Air Monitoring Plan
particles less than 10 microns in diameter – PM10) for a 24-hour averaging time, and therefore is considered to be protective for this Project. The value will also be used as a surrogate Action Level for those dust-related constituents, such as PAHs, PCBs and metals, which cannot be readily measured on a real-time basis. Its applicability for this purpose can be demonstrated using calculations to estimate the maximum potential ambient concentration of a compound at the proposed Action Level, and by comparing that value to the applicable health risk-based AACs.
In the example provided below, the Action Level (0.15 mg/m3) is multiplied by the 95% Upper Confidence Limit (UCL) concentration of benzo(a)pyrene in soil (0.598 mg/kg) to calculate the 95% UCL potential concentration of benzo(a)pyrene in ambient air at the Benning Road Site. A factor of 10-6 is used to convert the units of measurement for the soil concentration (kg) to the appropriate units for dust in air (mg).
Example
C air = (Action Level dust x C Soil ) x (10 –6 kg/mg)
Where:
C air = 95% UCL predicted constituent concentration in air (mg/m3)
Action Level dust = maximum particulate concentration in air (mg/m3)
C Soil = 95% UCL constituent concentration in soil (mg/kg)
C air = (0.15 mg/m3 x 0.598 mg/kg) x (10 -6 kg/mg)
= 0.00000009 mg/m3
The 95% UCL estimated ambient concentration of benzo(a)pyrene at a PM10 concentration of 0.15 mg/m3 is less than the associated AAC of 0.0003 mg/m3 (refer to Table B-1). Therefore, Project activities are not likely to pose a risk from the soil compound-specific effect of the dust.
A summary of the results from calculations for each of the compounds is presented in Table B-2. The results indicate that the estimated ambient air concentrations of compounds detected in soil are less than the associated AACs in all cases, and demonstrate that the respirable dust Action Level of 0.15 mg/m3 is protective of human health with respect to these constituents.
As discussed previously, surveys of building materials at the Benning Road Facility identified lead paint on building surfaces and PCBs in concrete. Therefore, the predicted ambient air concentrations of lead due to particulates from lead paint and PCBs due to particulates from concrete during the demolition activities were also estimated (as discussed above for compounds in soil) using the 95% UCL concentrations in paint (lead) and concrete (PCBs) and at a PM10 concentration of 0.15 mg/m3, and compared to the respective AACs. As shown in Table B-2, the estimated ambient air concentrations of lead from paint and PCBs from concrete dust are less than the respective AACs. This further demonstrates that the respirable dust Action Level of 0.15 mg/m3 is protective of human health with respect to these constituents.

AECOM Environment
Benning Road Power Plant Demolition, Air Monitoring Plan
Table B-2 – Maximum Predicted Air Concentrations
95% UCL Maximum Soil Air Residential
Concentration Concentration AAC3 Compound 1 (mg/kg) (mg/m3) 2 (mg/m3)
PAHs Acenaphthene 0.718 1.08E-07 1.07E+00 Acenaphthylene 0.0441 6.62E-09 1.07E+00 Anthracene 1.456 2.18E-07 5.33E+00 Benzo(a)anthracene 0.622 9.33E-08 3.23E-03 Benzo(a)pyrene 0.598 8.97E-08 3.23E-04 Benzo(b)fluoranthene 0.54 8.10E-08 3.23E-03 Benzo(g,h,i)perylene 0.4 6.00E-08 5.33E-01 Benzo(k)fluoranthene 0.233 3.50E-08 3.23E-03 Chrysene 0.644 9.66E-08 3.23E-02 Dibenzo(a,h)anthrancene 0.107 1.61E-08 3.04E-04 Fluoranthene 1.249 1.87E-07 7.11E-01 Fluorene 0.553 8.30E-08 7.11E-01 Indeno(1,2,3,-cd)pyrene 0.315 4.73E-08 3.23E-03 2-Methylnaphthalene 0.0794 1.19E-08 7.11E-02 Naphthalene 0.0966 1.45E-08 1.05E-02 Phenanthrene 4.391 6.59E-07 5.33E+00 Pyrene 1.221 1.83E-07 5.33E-01 Metals Arsenic 14.73 2.21E-06 7.62E-05 Beryllium 0.482 7.23E-08 1.02E-04 Cadmium 1.134 1.70E-07 5.08E-05
Chromium (assumes CrVI)4 31.94 4.79E-06 2.96E-05 Cobalt 32.73 4.91E-06 3.05E-05 Lead (Soil) 170 2.55E-05 6.30E-04
Lead (Paint)5 3450.0 5.18E-04 6.30E-04 Mercury 0.188 2.82E-08 1.52E-03 Nickel 610 9.15E-05 7.11E-05 Vanadium 1700 2.55E-04 5.08E-04 Zinc 242.7 3.64E-05 5.33E+00 PCBs Total PCBs (Soil) 2.11 3.17E-07 3.56E-04
Total PCBs (Concrete)5 152.8 2.29E-05 3.56E-04
Notes: UCL – Upper confidence limit on the mean. 1 Compound having published health-based criteria. 2 Based on a PM10 Action Level of 0.15 mg/m3. 3 Based on the values developed in Appendix B. 4 Assumes 100% CrVI for conservative purposes. 5 95% UCL concentration shown is for compound in paint (Lead) or concrete (Total PCBs). For lead, it assumes that 10% of PM10 is paint dust.

AECOM Environment
Benning Road Power Plant Demolition, Air Monitoring Plan
References
ATSDR. 2013. Agency for Toxic Substances and Disease Registry. Minimal Risk Levels (MRLs). July 2013. http://www.atsdr.cdc.gov/mrls/index.asp.
CalEPA. 2013. OEHHA Toxicity Criteria Database. Office of Environmental Health Hazard Assessment. http://www.oehha.ca.gov/risk/ChemicalDB/index.asp. Accessed October 2013.
USEPA. 2013a. Integrated Risk Information System (IRIS). Environmental Criteria and Assessment Office. U.S. Environmental Protection Agency, Cincinnati, OH. http://www.epa.gov/iris/index.html. Accessed October 2013.
USEPA. 2013b. USEPA Provisional Peer Review Toxicity Values (PPRTV) for Superfund. Accessed in October 2013. http://hhpprtv.ornl.gov/index.html .
USEPA. 2013c. Regional Screening Levels. USEPA, Region 3. May 2013. [URL: http://www.epa.gov/reg3hwmd/risk/human/rb-concentration_table/index.htm].
USEPA. 2003. Human Health Toxicity Values in Superfund Risk Assessments. Office of Superfund Remediation and Technology Innovation. OSWER Directive 9285.7-53. December 5, 2003.
USEPA. 1997. Health Effects Assessment Summary Tables (HEAST). EPA 540-R-94-020. Office of Research and Development. U.S. Environmental Protection Agency, Washington, D.C.
USEPA. 1989. Risk Assessment Guidance for Superfund. Volume I. Human Health Evaluation Manual (Part A). Interim Final. Office of Emergency and Remedial Response, Washington, D.C. December 1989. EPA/540/1-89/002.

AECOM Environment
Benning Road Power Plant Demolition, Air Monitoring Plan
Appendix C Field Documentation Forms

AECOM 978.905.2100 tel 250 Apollo Drive 978.905.2101 fax Chelmsford, MA 01824
J:\Air_Tox\Project Files\PEPCO Benning Road Oct 2013\500-Deliverables\501-AMP\Appendix C Field Documentation Forms\Daily Field Report.docx
Benning Road Power Plant - Daily Air Monitoring Report for ThisDate: _____________________
This daily air monitoring report is a summary of the ambient air-quality data collected in accordance with the project’s Ambient Air Monitoring Plan (AMP) at the Benning Road Power Plant Site in Northeast Washington D.C.
Calibration Summary Yes / No Comment
Instrumentation within Calibration Specifications:
Instrumentation measuring PM10 are calibrated at the start of each work day. The results of these calibrations are documented and stored onsite.
Daily Average PM10 Concentrations Perimeter
Average Perimeter Maximum
Location of Maximum Comments
PM10 (µg/m3)
* Daily average concentrations are estimated from the 15-minute real-time PAM data. ** The information included in this daily summary is based on non-validated data. Similar information based the validated data will be
included in the weekly ambient air monitoring summary reports.
Daily Average Noise Levels Perimeter
Average Perimeter Maximum
Location of Maximum Comments
Noise (dB)
* Daily maximum concentrations are estimated from the hand-held instrument data. ** The information included in this daily summary is based on non-validated data. Similar information based the validated data will be
included in the weekly ambient air monitoring summary reports.
Daily Weather Conditions Summary Wind Direction
(Degrees) Wind Speed
(mph) Temperature
(°F)
Relative Humidity
(%)
Precipitation (Yes / No)
Daily Conditions
Elevated Concentration Summary Alert Level Action Level
Conc. Yes No Location/Comment Conc. Yes No Location/Comment
PM10 100 µg/m3 150 µg/m3
Noise Approaching 80 dB
80 dB
Alert Level – Technician verbally notifies Demolition Manager of the potential to exceed the Action Level. Action Level – Technician verbally notifies Demolition Manager that the concentration exceeded the Action Level. AECOM will produce an
Event Documentation Report (EDR) summarizing the elevated concentrations and response actions.
Submitted By: Date:

AECOM 978.905.2100 tel 250 Apollo Drive 978.905.2101 fax Chelmsford, MA 01824
Event Documentation.docx
Benning Road Power Plant Event Documentation – Based on non-validated data unless signed and dated below. Technician: Date Completed: Date of Event: Time of Event:
Location of Event:
Type:
Elevated Concentration:
Background Concentration: Calculated Concentration:
Instrument within Calibration Specifications:
Weather Conditions:
Wind Direction: Relative Humidity:
Wind Speed: Cloud Cover:
Temperature: Precipitation:
People Contacted:
Observations:
List Response Actions and their Effectiveness:
Comments:
Reviewed for Reasonability: Name Date

AECOM 978.905.2100 tel 250 Apollo Drive 978.905.2101 fax Chelmsford, Massachusetts 01824
Field Station Log
J:\Air_Tox\Project Files\PEPCO Benning Road Oct 2013\500-Deliverables\501-AMP\Appendix C Field Documentation Forms\FIELD STATION LOG.doc
Site: Benning Road Power Plant Project Number: 60309564 DATE TIME COMMENTS INITIALS EMPL #

AECOM 978.905.2100 tel 250 Apollo Drive 978.905.2101 fax Chelmsford, MA 01824
Benning Road Power Plant Hand-Held Perimeter Monitoring Page __ of __
Action Limits: PM10= 150 ug/m3; Noise= 80dB J:\Air_Tox\Project Files\PEPCO Benning Road Oct 2013\500-Deliverables\501-AMP\Appendix C Field Documentation Forms\Hand-held AM Form.docx
Date: Technician: Comments:
Time Location Wind Conditions (Speed and Direction)
PM10 (µg/m3)
Noise Level (dB)
Visible Dust (Yes/No)
Comments

AECOM 978.589.3000 tel 250 Apollo Drive 978.589.3100 fax Chelmsford, Massachusetts 01824
Routine Operations Check List Main Shelter
J:\Air_Tox\Project Files\PEPCO Benning Road Oct 2013\500-Deliverables\501-AMP\Appendix C Field Documentation Forms\Main site checklist.docx
Week of (Monday date): Site: Benning Road Power Plant
Activity Technician’s Results Comments Start of Day Mon Tue Wed Thu Fri Sat Sun 1. Check overnight data. 2. Check voice mail messages. 3. Verify data is collecting. 4. Verify central computer/data logger has correct timestamp. 5. Verify each PAM data logger has correct timestamp. 6. Verify meteorological data is reasonable. 7. Check PAM station battery voltages. Replace as necessary. After Monitor Start-Up 1. Check email for messages. 2. Prepare (TAS) filter inlets for next sample date (metals) 3. Prepare filters and sorbent tubes for next sample day (PAHs
and PCBs).
End of Day 1. Fill out daily data report and send to AECOM Chelmsford. 2. Fill out Chain of Custody (COC) forms (if applicable). 3. Pack and ship integrated samples to Galson (if applicable). End of Week 1. Ship QC documentation to AECOM Chelmsford. 2. Check to make sure the trailer is clean and organized
(swept, trash removed, paperwork filed, and etc.).
Comments:

AECOM 978.905.2100 tel 250 Apollo Drive 978.905.2101 fax Chelmsford, Massachusetts 01824
Routine Operations Check List Hand-Held Instruments
J:\Air_Tox\Project Files\PEPCO Benning Road Oct 2013\500-Deliverables\501-AMP\Appendix C Field Documentation Forms\Hand-held checklist.docx
Week of (Monday date): Site: Benning Road Power Plant
Activity Technician’s Results Comments
Daily Start-Up Mon Tue Wed Thu Fri Sat Sun
1. Record Time of calibration.
2. Technician’s initials.
3. Perform zero check of DustTrak. Record results. (Re-zero if > +/- 1.0 ug/m3)
4. Perform flow check of DustTrak. Record results. (Acceptable flow 1.5 – 1.9 L/m)
5. Check and charge batteries as needed.
Weekly
1. Create site map with the locations of the hand-held measurements
Monthly
1. Perform an upscale response check of DustTrak particulate monitor, using a smoke generator. Record upscale response and time of check.
Comments:

AECOM 978.905.2100 tel 250 Apollo Drive 978.905.2101 fax Chelmsford, MA 01824
Routine Operations Check List Portable Air Monitoring Stations
J:\Air_Tox\Project Files\PEPCO Benning Road Oct 2013\500-Deliverables\Project Notebook\Field Documentation Forms\Portable Monitor checklist.docx
Week of (Monday date): Station: Site: Benning Road Power Plant
Activity Technician’s Results Comments
Daily Start-Up Mon Tue Wed Thu Fri Sat Sun 1. Time of Calibration 2. Technician’s Initials 3. Perform zero check of DustTrak. Record initial results.
(Re-zero if > +/- 1.0 ug/m3)
4. Perform flow check of DustTrak. Record initial results. (#8520 Acceptable flow 1.5 – 1.9 lpm) (#8530 Acceptable flow 2.9 – 3.3 lpm)
5. Record combined battery voltage. Change as necessary. 6. Record top battery voltage. Change as necessary. 7. Check water drop out jar and empty as necessary.
Weekly 1. Check DustTrak filter following rain events for moisture. If
filter is wet, then replace with new filter.
2. Check battery connections for corrosion and clean if necessary.
3. Perform an upscale response check of DustTrak particulate monitor, using a smoke generator. Record upscale response and time of check.
Comments: Reviewed By: _____________ Date: ___________

AECOM 978.905.2100 tel 250 Apollo Drive 978.905.2101 fax Chelmsford, Massachusetts 01824
Integrated Metals Sampling (TAS) Page __ of __ Benning Road Power Plant
J:\Air_Tox\Project Files\PEPCO Benning Road Oct 2013\500-Deliverables\Project Notebook\Field Documentation Forms\Metals Sampling Checklist (TAS).docx
Sampling Date: Technician:
Sampler ID: Sampler ID:
Filter Number: Filter Number:
TAS Certification Date: TAS Certification Date:
Sample Batch ID #: Sample Batch ID #:
Sample Location: Sample Location:
Sample Identification: i.e., Loc-YYMMDD-PM10
Sample Identification: i.e., Loc-YYMMDD-PM10
Start Temperature (°F): Start Temperature (°F):
End Temperature (°F): End Temperature (°F):
Sample Start Time: Sample Start Time:
Sample End Time: Sample End Time:
Sample Duration (minutes): Sample Duration (minutes):
Measured Start Flow (L/m): Target Flow = 5 L/m +0.5 L/m
Measured Start Flow (L/m): Target Flow = 5 L/m +0.5 L/m
Flow Check (L/m) and Time: Flow Check (L/m) and Time:
Flow Check (L/m) and Time: Flow Check (L/m) and Time:
Flow Check (L/m) and Time: Flow Check (L/m) and Time:
Measured End Flow (L/m): Measured End Flow (L/m):
Is End Flow within +10% (Yes/No): Is End Flow within +10% (Yes/No):
Average Flow (L/m): Average Flow (L/m):
Net Sample Volume (L): Net Sample Volume (L):
Comments:
Comments:
Comments: Net sample volume (L) = Average Flow * Sample Duration (min). If end flow is </> 10% of target flow, use lowest flow instead of the average flow in net sample volume calculation.
Reviewed By: _____________ Date: ___________

AECOM 978.905.2100 tel 250 Apollo Drive 978.905.2101 fax Chelmsford, Massachusetts 01824
Hexavalent Chromium Sampling Page __ of __ Benning Road Power Plant
J:\Air_Tox\Project Files\PEPCO Benning Road Oct 2013\500-Deliverables\Project Notebook\Field Documentation Forms\Cr6 Sampling Checklist.docx
Sampling Date: Technician:
Sampler ID: Sampler ID:
Filter Number: Filter Number:
SKC Certification Date: SKC Certification Date:
Sample Batch ID #: Sample Batch ID #:
Sample Location: Sample Location:
Sample Identification: i.e., Loc-YYMMDD-PM10
Sample Identification: i.e., Loc-YYMMDD-PM10
Start Temperature (°F): Start Temperature (°F):
End Temperature (°F): End Temperature (°F):
Sample Start Time: Sample Start Time:
Sample End Time: Sample End Time:
Sample Duration (minutes): Sample Duration (minutes):
Measured Start Flow (L/m): Target Flow = 5 L/m +0.5 L/m
Measured Start Flow (L/m): Target Flow = 5 L/m +0.5 L/m
Flow Check (L/m) and Time: Flow Check (L/m) and Time:
Flow Check (L/m) and Time: Flow Check (L/m) and Time:
Flow Check (L/m) and Time: Flow Check (L/m) and Time:
Measured End Flow (L/m): Measured End Flow (L/m):
Is End Flow within +10% (Yes/No): Is End Flow within +10% (Yes/No):
Average Flow (L/m): Average Flow (L/m):
Net Sample Volume (L): Net Sample Volume (L):
Comments:
Comments:
Comments: Net sample volume (L) = Average Flow * Sample Duration (min). If end flow is </> 10% of target flow, use lowest flow instead of the average flow in net sample volume calculation.
Reviewed By: _____________ Date: ___________

AECOM 978.905.2100 tel 250 Apollo Drive 978.905.2101 fax Chelmsford, Massachusetts 01824
Benning Road Power Plant PAH NIOSH Sampling Checklist
J:\Air_Tox\Project Files\PEPCO Benning Road Oct 2013\500-Deliverables\Project Notebook\Field Documentation Forms\NIOSH PAH Sampling Checklist.docx
Date: Technician:
PS S/N: PS S/N:
Analysis: PAH Analysis: PAH
Date Last Calibrated: Date Last Calibrated:
Sample Batch ID #: Sample Batch ID #:
Sample Location: Sample Location:
Sample Identification: i.e., Loc-YYMMDD-PAH
Sample Identification: i.e., Loc-YYMMDD-PAH
Start Temperature (°F): Start Temperature (°F):
End Temperature (°F): End Temperature (°F):
Sample Start Time: Sample Start Time:
Sample End Time: Sample End Time:
Sample Duration (minutes): Sample Duration (minutes):
Measured Start Flow (L/m): Target Flow = 2 L/m +0.2 L/m
Measured Start Flow (L/m): Target Flow = 2 L/m +0.2 L/m
Flow Check (L/m) and Time: Flow Check (L/m) and Time:
Flow Check (L/m) and Time: Flow Check (L/m) and Time:
Flow Check (L/m) and Time: Flow Check (L/m) and Time:
Measured End Flow (L/m): Measured End Flow (L/m):
Is End Flow within +10% (Yes/No): Is End Flow within +10% (Yes/No):
Average Flow (L/m): Average Flow (L/m):
Net Sample Volume (L): Net Sample Volume (L):
Comments:
Comments:
Comments: Net sample volume (L) = Average Flow * Sample Duration (min). If end flow is </> 10% of target flow, use
lowest flow instead of the average flow in net sample volume calculation.
Reviewed By: _____________ Date: ___________

AECOM 978.905.2100 tel 250 Apollo Drive 978.905.2101 fax Chelmsford, Massachusetts 01824
Benning Road Power Plant PCB NIOSH Sampling Checklist
J:\Air_Tox\Project Files\PEPCO Benning Road Oct 2013\500-Deliverables\Project Notebook\Field Documentation Forms\NIOSH PCB Sampling Checklist.docx
Date: Technician:
PS S/N: PS S/N:
Analysis: PCB Analysis: PCB
Date Last Calibrated: Date Last Calibrated:
Sample Batch ID #: Sample Batch ID #:
Sample Location: Sample Location:
Sample Identification: i.e., Loc-YYMMDD-PCB
Sample Identification: i.e., Loc-YYMMDD-PCB
Start Temperature (°F): Start Temperature (°F):
End Temperature (°F): End Temperature (°F):
Sample Start Time: Sample Start Time:
Sample End Time: Sample End Time:
Sample Duration (minutes): Sample Duration (minutes):
Measured Start Flow (L/m): Target Flow = 1 L/m +0.1 L/m
Measured Start Flow (L/m): Target Flow = 1L/m +0.1 L/m
Flow Check (L/m) and Time: Flow Check (L/m) and Time:
Flow Check (L/m) and Time: Flow Check (L/m) and Time:
Flow Check (L/m) and Time: Flow Check (L/m) and Time:
Measured End Flow (L/m): Measured End Flow (L/m):
Is End Flow within +10% (Yes/No): Is End Flow within +10% (Yes/No):
Average Flow (L/m): Average Flow (L/m):
Net Sample Volume (L): Net Sample Volume (L):
Comments:
Comments:
Comments: Net sample volume (L) = Average Flow * Sample Duration (min). If end flow is </> 10% of target flow, use
lowest flow instead of the average flow in net sample volume calculation.
Reviewed By: _____________ Date: ___________

AECOM Environment
Benning Road Power Plant Demolition, Air Monitoring Plan
Appendix D Field Sample Methods

NIOSH Manual of Analytical Methods (NMAM), Fourth Edition
PARTICULATES NOT OTHERWISE REGULATED, RESPIRABLE 0600
DEFINITION: aerosol collected by sampler with 4-μm median cut point
CAS: None RTECS: None
METHOD: 0600, Issue 3 EVALUATION: FULL Issue 1: 15 February 1984
Issue 3: 15 January 1998
OSHA: 5 mg/m³NIOSH: no RELACGIH: 3 mg/m³
PROPERTIES: contains no asbestos and quartz less than 1%; penetrates non-ciliated portions of respira-tory system
SYNONYMS: nuisance dusts; particulates not otherwise classified
SAMPLING
SAMPLER: CYCLONE + FILTER (10-mm nylon cyclone, Higgins-Dewell [HD] cyclone, or aluminum cyclone + tared 5-μm PVC membrane)
FLOW RATE: nylon cyclone: 1.7 L/min HD cyclone: 2.2 L/min Al cyclone: 2.5 L/min
VOL-MIN: 20 L @ 5 mg/m³-MAX: 400 L
SHIPMENT: routine
SAMPLE
STABILITY: stable
BLANKS: 2 to 10 field blanks per set
ACCURACY
RANGE STUDIED: 0.5 to 10 mg/m³ (lab and field)
BIAS: dependent on dust size distribution [1]
OVERALL
PRECISION ( ): dependent on size distribution [1,2]
ACCURACY: dependent on size distribution [1]
MEASUREMENT
TECHNIQUE: GRAVIMETRIC (FILTER WEIGHT)
ANALYTE: mass of respirable dust fraction
BALANCE: 0.001 mg sensitivity; use same balance before and after sample collection
CALIBRATION: National Institute of Standards and Technology Class S-1.1 or ASTM Class 1 weights
RANGE: 0.1 to 2 mg per sample
ESTIMATED LOD: 0.03 mg per sample
PRECISION: <10 μg with 0.001 mg sensitivity balance; <70 μg with 0.01 mg sensitivity balance [3]
APPLICABILITY: The working range is 0.5 to 10 mg/m³ for a 200-L air sample. The method measures the mass concentration of any non-volatile respirable dust. In addition to inert dusts [4], the method has been recommended for respirable coal dust. The method is biased in light of the recently adopted international definition of respirable dust, e.g., ≈ +7% bias for non-diesel, coal mine dust [5].
INTERFERENCES: Larger than respirable particles (over 10 μm) have been found in some cases by microscopic analysis of cyclone filters. Over-sized particles in samples are known to be caused by inverting the cyclone assembly. Heavy dust loadings, fibers, and water-saturated dusts also interfere with the cyclone’s size-selective properties. The use of conductive samplers is recommended to minimize particle charge effects.
OTHER METHODS: This method is based on and replaces Sampling Data Sheet #29.02 [6].

NIOSH Manual of Analytical Methods (NMAM), Fourth Edition
PARTICULATES NOT OTHERWISE REGULATED, RESPIRABLE: METHOD 0600, Issue 3, dated 15 January 1998 - Page 2 of 6
EQUIPMENT:
1. Sampler:a. Filter: 5.0-μm pore size, polyvinyl chloride filter or equivalent hydrophobic membrane filter
supported by a cassette filter holder (preferably conductive).b. Cyclone: 10-mm nylon (Mine Safety Appliance Co., Instrument Division, P. O. Box 427, Pittsburgh,
PA 15230), Higgins-Dewell (BGI Inc., 58 Guinan St., Waltham, MA 02154) [7], aluminum cyclone (SKC Inc., 863 Valley View Road, Eighty Four, PA 15330), or equivalent.
2. Personal sampling pump, 1.7 L/min ± 5% for nylon cyclone, 2.2 L/min ± 5% for HD cyclone, or 2.5 L/min ± 5% for the Al cyclone with flexible connecting tubing.NOTE: Pulsation in the pump flow must be within ± 20% of the mean flow.
3. Balance, analytical, with sensitivity of 0.001 mg.4. Weights, NIST Class S-1.1, or ASTM Class 1.5. Static neutralizer, e.g., Po-210; replace nine months after the production date.6. Forceps (preferably nylon).7. Environmental chamber or room for balance, e.g., 20 °C ± 1 °C and 50% ± 5% RH.
SPECIAL PRECAUTIONS: None.
PREPARATION OF SAMPLERS BEFORE SAMPLING:
1. Equilibrate the filters in an environmentally controlled weighing area or chamber for at least 2 h.2. Weigh the filters in an environmentally controlled area or chamber. Record the filter tare weight,
(mg).a. Zero the balance before each weighing.b. Handle the filter with forceps (nylon forceps if further analyses will be done).c. Pass the filter over an anti-static radiation source. Repeat this step if filter does not release easily
from the forceps or if filter attracts balance pan. Static electricity can cause erroneous weight readings.
3. Assemble the filters in the filter cassettes and close firmly so that leakage around the filter will not occur. Place a plug in each opening of the filter cassette.
4. Remove the cyclone’s grit cap before use and inspect the cyclone interior. If the inside is visibly scored, discard this cyclone since the dust separation characteristics of the cyclone may be altered. Clean the interior of the cyclone to prevent reentrainment of large particles.
5. Assemble the sampler head. Check alignment of filter holder and cyclone in the sampling head to prevent leakage.
SAMPLING:
6. Calibrate each personal sampling pump to the appropriate flow rate with a representative sampler in line.NOTE 1: Because of their inlet designs, nylon and aluminum cyclones are calibrated within a large
vessel with inlet and outlet ports. The inlet is connected to a calibrator (e.g., a bubble meter). The cyclone outlet is connected to the outlet port within the vessel, and the vessel outlet is attached to the pump. See APPENDIX for alternate calibration procedure. (The calibrator can be connected directly to the HD cyclone.)
NOTE 2: Even if the flow rate shifts by a known amount between calibration and use, the nominal flow rates are used for concentration calculation because of a self-correction feature of the cyclones.
7. Sample 45 min to 8 h. Do not exceed 2 mg dust loading on the filter. Take 2 to 4 replicate samples for each batch of field samples for quality assurance on the sampling procedure (see Step 10).

NIOSH Manual of Analytical Methods (NMAM), Fourth Edition
PARTICULATES NOT OTHERWISE REGULATED, RESPIRABLE: METHOD 0600, Issue 3, dated 15 January 1998 - Page 3 of 6
NOTE : Do not allow the sampler assembly to be inverted at any time. Turning the cyclone to anything more than a horizontal orientation may deposit oversized material from the cyclone body onto the filter.
SAMPLE PREPARATION:
8. Remove the top and bottom plugs from the filter cassette. Equilibrate for at least 2 h in an environmentally controlled area or chamber.
CALIBRATION AND QUALITY CONTROL:
9. Zero the microbalance before all weighings. Use the same microbalance for weighing filters before and after sample collection. Calibrate the balance with National Institute of Standards and Technology Class S-1.1 or ASTM Class 1 weights.
10. The set of replicate field samples should be exposed to the same dust environment, either in a laboratory dust chamber [8] or in the field [9]. The quality control samples must be taken with the same equipment, procedures, and personnel used in the routine field samples. Calculate precision from these replicates and record relative standard deviation ( ) on control charts. Take corrective action when the precision is out of control [8].
MEASUREMENT:
11. Weigh each filter, including field blanks. Record this post-sampling weight, (mg), beside its corresponding tare weight. Record anything remarkable about a filter (e.g., visible particles, overloading, leakage, wet, torn, etc.).
CALCULATIONS:
12. Calculate the concentration of respirable particulate, (mg/m³), in the air volume sampled, (L):
, mg/m³,
where: = tare weight of filter before sampling (mg), = post-sampling weight of sample-containing filter (mg),
= mean tare weight of blank filters (mg), = mean post-sampling weight of blank filters (mg), = volume as sampled at the nominal flow rate (i.e., 1.7 L/min or 2.2 L/min).
EVALUATION OF METHOD:
1. Bias: In respirable dust measurements, the bias in a sample is calculated relative to the appropriate respirable dust convention. The theory for calculating bias was developed by Bartley and Breuer [10]. For this method, the bias, therefore, depends on the international convention for respirable dust, the cyclones’ penetration curves, and the size distribution of the ambient dust. Based on measured penetration curves for non-pulsating flow [1], the bias in this method is shown in Figure 1.
For dust size distributions in the shaded region, the bias in this method lies within the ± 0.10 criterion established by NIOSH for method validation. Bias larger than ± 0.10 would, therefore, be expected for some workplace aerosols. However, bias within ± 0.20 would be expected for dusts with geometric standard deviations greater than 2.0, which is the case in most workplaces.

NIOSH Manual of Analytical Methods (NMAM), Fourth Edition
PARTICULATES NOT OTHERWISE REGULATED, RESPIRABLE: METHOD 0600, Issue 3, dated 15 January 1998 - Page 4 of 6
Bias can also be caused in a cyclone by the pulsation of the personal sampling pump. Bartley, et al. [12] showed that cyclone samples with pulsating flow can have negative bias as large as −0.22 relative to samples with steady flow. The magnitude of the bias depends on the amplitude of the pulsation at the cyclone aperture and the dust size distribution. For pumps with instantaneous flow rates within 20% of the mean, the pulsation bias magnitude is less than 0.02 for most dust size distributions encountered in the workplace.
Electric charges on the dust and the cyclone will also cause bias. Briant and Moss [13] have found electrostatic biases as large as −50%, and show that cyclones made with graphite-filled nylon eliminate the problem. Use of conductive samplers and filter cassettes (Omega Specialty Instrument Co., 4 Kidder Road, Chelmsford, MA 01824) is recommended.
2. Precision: The figure 0.068 mg quoted above for the precision is based on a study [3] of weighing procedures employed in the past by the Mine Safety and Health Administration (MSHA) in which filters are pre-weighed by the filter manufacturer and post-weighed by MSHA using balances readable to 0.010 mg. MSHA [14] has recently completed a study using a 0.001 mg balance for the post-weighing, indicating imprecision equal to 0.006 mg.
Imprecision equal to 0.010 mg was used for estimating the LOD and is based on specific suggestions [8] regarding filter weighing using a single 0.001 mg balance. This value is consistent with another study [15] of repeat filter weighings, although the actual attainable precision may depend strongly on the specific environment to which the filters are exposed between the two weighings.
REFERENCES:
[1] Bartley DL, Chen CC, Song R, Fischbach TJ [1994]. Respirable aerosol sampler performance testing. Am Ind Hyg Assoc J, 55(11): 1036–1046.
[2] Bowman JD, Bartley DL, Breuer GM, Shulman SA [1985]. The precision of coal mine dust sampling. Cincinnati, OH: National Institute for Occupational Safety and Health, DHEW (NIOSH) Pub. No. 85-220721.
[3] Parobeck P, Tomb TF, Ku H, Cameron J [1981]. Measurement assurance program for the weighings of respirable coal mine dust samples. J Qual Tech 13:157.
[4] ACGIH [1996]. 1996 Threshold limit values (TLVs™) for chemical substances and physical agents and biological exposure indices (BEIs™). Cincinnati, OH: American Conference of Governmental Industrial Hygienists.
[5] American Conference of Governmental Industrial Hygienists [1991]. Notice of intended change—appendix D—particle size-selective sampling criteria for airborne particulate matter. Appl Occup Env Hyg 6(9): 817–818.
[6] NIOSH [1977]. NIOSH Manual of sampling data sheets. Cincinnati, OH: National Institute for Occupational Safety and Health, DHEW (NIOSH) Publication No. 77-159.
[7] Higgins RI, Dewell P [1967]. A gravimetric size selecting personal dust sampler. In: Davies CN, Ed. Inhaled particles and vapors II. Oxford: Pergammon Press, pp. 575–586.
[8] Bowman JD, Bartley DL, Breuer GM, Doemeny LJ, Murdock DJ [1984]. Accuracy criteria recommended for the certification of gravimetric coal mine dust personal samplers. NTIS Pub. No. PB 85-222446 (1984).
[9] Breslin, JA, Page SJ, Jankowski RA [1983]. Precision of personal sampling of respirable dust in coal mines. U.S. Bureau of Mines Report of Investigations #8740.
[10] Bartley DL, Breuer GM [1982]. Analysis and optimization of the performance of the 10-mm cyclone. Am Ind Hyg Assoc J 43: 520–528.
[11] Caplan KJ, Doemeny LJ, Sorenson S [1973]. Evaluation of coal mine dust personal sampler performance, Final Report. NIOSH Contract No. PH CPE-r-70-0036.

NIOSH Manual of Analytical Methods (NMAM), Fourth Edition
PARTICULATES NOT OTHERWISE REGULATED, RESPIRABLE: METHOD 0600, Issue 3, dated 15 January 1998 - Page 5 of 6
[12] Bartley DL, Breuer GM, Baron PA, Bowman JD [1984]. Pump fluctuations and their effect on cyclone performance. Am Ind Hyg Assoc J 45(1): 10–18.
[13] Briant JK, Moss OR [1983]. The influence of electrostatic charge on the performance of 10-mm nylon cyclones. Unpublished paper presented at the American Industrial Hygiene Conference, Philadelphia, PA, May 1983.
[14] Koqut J [1994]. Private Communication from MSHA, May 12, 1994.[15] Vaughn NP, Chalmers CP, Botham [1990]. Field comparison of personal samplers for inhalable dust.
Ann Occup Hyg 34: 553–573.
METHOD REVISED BY:
David L. Bartley, Ph.D., NIOSH/DPSE/ARDB and Ray Feldman, OSHA.
Figure 1. Bias of three cyclone types relative to the international respirable dust sampling convention.
Aluminum cyclone at 2.5 L/min
Mass median diameter (μm)Mass median diameter (μm)
Higgins-Dewell cyclone at 2.2 L/min
Ge
om
etr
icst
an
da
rdd
ev
iati
on
Mass median diameter (μm)
10-mm Nylon cyclone at 1.7 L/min
APPENDIX: Jarless Method for Calibration of Cyclone Assemblies
This procedure may be used in the field to calibrate an air sampling pump and a cyclone assembly without using the one-liter “calibration jar”.
1. Connect the pump to a pressure gauge or water manometer and a light load (adjustable valve or 5-μm filter) equal to 2” to 5” H2O with a “TEE” connector and flexible tubing. Connect other end of valve to an electronic bubble meter or standard bubble tube with flexible tubing (See Fig. 2.1).NOTE: A light load can be a 5-μm filter and/or an adjustable valve. A heavy load can be several 0.8-
μm filters and/or adjustable valve.2. Adjust the pump to 1.7 L/min, as indicated on the bubble meter/tube, under the light load
conditions (2” to 5” H2O) as indicated on the pressure gauge or manometer.3. Increase the load until the pressure gauge or water manometer indicates between 25” and 35” H2O.
Check the flow rate of the pump again. The flow rate should remain at 1.7 L/min ± 5%.4. Replace the pressure gauge or water manometer and the electronic bubble meter or standard
bubble tube with the cyclone having a clean filter installed (Fig. 2.2). If the loading caused by the cyclone assembly is between 2” and 5” H2O, the calibration is complete and the pump and cyclone are ready for sampling.

NIOSH Manual of Analytical Methods (NMAM), Fourth Edition
PARTICULATES NOT OTHERWISE REGULATED, RESPIRABLE: METHOD 0600, Issue 3, dated 15 January 1998 - Page 6 of 6
Figure 2.1. Block diagram of pump/load/flow meter set-up.
Pressure
gauge
Tee
Air sampling pump
Valve
and/or
filter load
Air flow
Flow meter
Figure 2.2. Block diagram with cyclone as the test load.
Pressure
gauge
Tee Cyclone filter
Cyclone
Air sampling pump

NIOSH Manual of Analytical Methods (NMAM), Fourth Edition
ELEMENTS by ICP 7300
(Nitric/Perchloric Acid Ashing)
MW: Table 1 CAS: Table 2 RTECS: Table 2
METHOD: 7300, Issue 3 EVALUATION: PARTIAL Issue 1: 15 August 1990
Issue 3: 15 March 2003
OSHA: Table 2
NIOSH: Table 2
ACGIH: Table 2
PROPERTIES: Table 1
ELEMENTS: aluminum* calcium lanthanum nickel strontium tungsten*antimony* chromium* lithium* potassium tellurium vanadium*arsenic cobalt* magnesium phosphorus tin yittriumbarium copper manganese* selenium thallium zincberyllium* iron molybdenum* silver titanium zirconium*cadmium lead**Some compounds of these elements require special sample treatment.
SAMPLING MEASUREMENT
SAMPLER: FILTER(0.8-μm, cellulose ester membrane, or5.0-μm, polyvinyl chloride membrane)
FLOWRATE: 1 to 4 L/min
VOL-MIN: Table 1
-MAX: Table 1
SHIPMENT: routine
SAMPLE
STABILITY: stable
BLANKS: 2 to 10 field blanks per set
TECHNIQUE: INDUCTIVELY COUPLED ARGONPLASMA, ATOMIC EMISSIONSPECTROSCOPY (ICP-AES)
ANALYTE: elements above
ASHING
REAGENTS: conc. HNO3/ conc. HClO4 (4:1), 5 mL;2mL increments added as needed
CONDITIONS: room temperature, 30 min; 150 °C to neardryness
FINAL
SOLUTION: 4% HNO3, 1% HClO4, 25 mL
WAVELENGTH: depends upon element; Table 3
BACKGROUND
CORRECTION: spectral wavelength shift
CALIBRATION: elements in 4% HNO3, 1% HClO4
RANGE: varies with element [1]
ESTIMATED LOD: Tables 3 and 4
PRECISION (�): Tables 3 and 4
ACCURACY
RANGE STUDIED: not determined
BIAS: not determined
OVERALL PRECISION (�rT): not determined
ACCURACY: not determined
APPLICABILITY: The working range of this method is 0.005 to 2.0 mg/m3 for each element in a 500-L air sample. This issimultaneous elemental analysis, not compound specific. Verify that the types of compounds in the samples are soluble withthe ashing procedure selected.
INTERFERENCES: Spectral interferences are the primary interferences encountered in ICP-AES analysis. These areminimized by judicious wavelength selection, interelement correction factors and background correction [1-4].
OTHER METHODS: This issue updates issues 1 and 2 of Method 7300, which replaced P&CAM 351 [3] for trace elements. Flame atomic absorption spectroscopy (e.g., Methods 70XX) is an alternate analytical technique for many of these elements. Graphite furnace AAS (e.g., 7102 for Be, 7105 for Pb) is more sensitive.
Esta página en Español

ELEMENTS (ICP): METHOD 7300, Issue 3, dated 15 March 2003 - Page 2 of 8
NIOSH Manual of Analytical Methods (NMAM), Fourth Edition
REAGENTS:
1. Nitric acid (HNO3), conc., ultra pure.
2. Perchloric acid (HClO4), conc., ultra pure.*
3. Ashing acid: 4:1 (v/v) HNO3:HClO4. Mix 4
volumes conc. HNO3 with 1 volume conc.
HClO4.
4. Calibration stock solutions, 1000 μg/m L.
Commercially available, or prepared per
instrument manufacturer's recomm endation
(see step 12).
5. Dilution acid, 4% HNO3, 1% HClO4. Add 50
mL ashing acid to 600 mL water; dilute to 1 L.
6. Argon.
7. Distilled,deionized water.
* See SPECIAL PRECAUTIONS.
EQUIPMENT:
1. Sam pler: cellulose ester membrane filter,
0.8-μm pore size; or polyvinyl chloride
membrane, 5.0-μm pore size; 37-mm
diameter, in cassette filter holder.
2. Personal sampling pump, 1 to 4 L/m in, with
flexible connecting tubing.
3. Inductively coupled plasma-atomic emission
spectrometer, equipped as specified by the
manufacturer for analysis of elements of
interest.
4. Regulator, two-stage, for argon.
5. Beakers, Phillips, 125-mL, or Griffin, 50-mL,
with watchglass covers.**
6. Volum etric flasks, 10-, 25-,100-mL., and 1-L**
7. Assorted volumetric pipets as needed.**
8. Hotplate, surface temperature 150 °C.
** Clean all glassware with conc. nitr ic acid
and rinse thoroughly in distilled water
before use.
SPECIAL PRECAUTIONS: All perchloric acid digestions are required to be done in a perchloric acid
hood. When working with concentrated acids, wear protective clothing and gloves.
SAMPLING:
1. Calibrate each personal sampling pump with a representative sampler in line.
2. Sample at an accurately known flow rate between 1 and 4 L/min for a total sample size of 200 to 2000
L (see Table 1) for TW A m easurem ents. Do not exceed a filter loading of approx imately 2 m g total dust.
SAMPLE PREPARATION:
3. Open the cassette filter holders and transfer the samples and blanks to clean beakers.
4. Add 5 mL ashing acid. Cover with a watchglass. Let stand 30 min at room temperature.
NOTE: Start a reagent blank at this step.
5. Heat on hotplate (120 °C) until ca. 0.5 mL remains.
NOTE 1: Recovery of lead from som e paint matrices may require other d igestion techniques. See
Method 7082 (Lead by Flame AAS) for an alternative hotplate digestion procedure or Method
7302 for a microwave digestion procedure.
NOTE 2: Some species of Al, Be, Co, Cr, Li, Mn, Mo, V, and Zr will not be completely solubilized by this
procedure. Alternative solubilization techniques for most of these elements can be found
elsewhere [5-10]. For example, aqua regia m ay be needed for Mn [6,12].
6. Add 2 m L ashing acid and repeat step 5. Repeat this step until the solution is clear.
7. Rem ove watchglass and rinse into the beaker with distilled water.
8. Increase the tem perature to 150 °C and take the sample to near dryness (ca. 0.5 mL).
9. Dissolve the residue in 2 to 3 mL dilution acid.
10. Transfer the solutions quantitatively to 25-mL volumetric flasks.
11. Dilute to volume with dilution acid.
NOTE: If more sensitivity is required, the final sample volume m ay be held to 10 mL.

ELEMENTS (ICP): METHOD 7300, Issue 3, dated 15 March 2003 - Page 3 of 8
NIOSH Manual of Analytical Methods (NMAM), Fourth Edition
CALIBRATION AND QUALITY CONTROL:
12. Calibrate the spectrometer according to the manufacturers recomm endations.
NOTE: Typically, an acid blank and 1.0 μg/m L multielement work ing standards are used. The following
multielement combinations are chemically compatible in 4% HNO3/1% HClO4:
a. Al, As, Ba, Be, Ca, Cd, Co, Cr, Cu, Fe, La, In, Na
b. Ag, K, Li, Mg, Mn, Ni, P, Pb, Se, Sr, Tl, V, Y, Zn, Sc
c. Mo, Sb, Sn, Te, Ti, W , Zr
d. Acid blank
13. Analyze a standard for every ten samples.
14. Check recoveries with at least two spiked blank filters per ten samples.
MEASUREMENT:
15. Set spectrometer to conditions specified by manufacturer.
16. Analyze standards and samples.
NOTE: If the values for the sam ples are above the range of the standards, dilute the solutions with
dilution acid, reanalyze and apply the appropriate dilution factor in the calculations.
CALCULATIONS:
17. Obtain the solution concentrations for the sam ple, Cs (μg/mL), and the average media blank , Cb (μg/mL),
from the instrum ent.
18. Using the solution volum es of sam ple, Vs (mL), and media blank , Vb (mL), calculate the concentration,
C (m g/m 3), of each element in the air volume sam pled, V (L):
NOTE: μg/L � mg/m 3
EVALUATION OF METHOD:
Issues 1 and 2
Method, 7300 was originally evaluated in 1981 [2,3]. The precision and recovery data were determined at 2.5
and 1000 μg of each element per sample on spiked filters. The measurements used for the method evaluation
in Issues 1 and 2 were determined with a Jarrell-Ash Model 1160 Inductively Coupled Plasma Spectrometer
operated according to manufacturer's instructions.
Issue 3
In this update of NIOSH Method 7300, the precision and recovery data were determined at approximately 3x
and 10x the instrumental detection limits on comm ercially prepared spiked filters [12] using 25.0 mL as the
final sample volume. Tables 3 and 4 list the precision and recovery data, instrumental detection limits, and
analytical wavelengths for m ixed cellulose ester (MCE) and polyvinyl chloride (PVC) filters. PVC Filters which
can be used for total dust measurements and then digested for metals m easurem ents were tested and found
to give good results. The values in Tables 3 and 4 were determined with a Spectro Analytical Instruments
Model End On Plasma (EOP)(axial) operated according to manufacturer’s instructions.

ELEMENTS (ICP): METHOD 7300, Issue 3, dated 15 March 2003 - Page 4 of 8
NIOSH Manual of Analytical Methods (NMAM), Fourth Edition
REFERENCES:
[1] Millson M, Andrews R [2002]. Backup data report, Method 7300, unpublished report, NIOSH/DART.
[2] Hull RD [1981]. Multielement Analysis of Industrial Hygiene Sam ples, NIOSH Internal Report, presented
at the American Industrial Hygiene Conference, Portland, Oregon.
[3] NIOSH [1982]. NIOSH Manual of Analytical Methods, 2nd ed., V. 7, P&CAM 351 (Elements by ICP),
U.S. Department of Health and Human Services, Publ. (NIOSH) 82-100.
[4] NIOSH [1994]. Elements by ICP: Method 7300, Issue 2. In: Eller PM, Cassinelli ME, eds., NIOSH
Manual of Analytical Methods, 4 th ed. Cincinnati, OH: U.S. Department of Health and Human Services,
Centers for Disease Control and Prevention, National Institute for Occupational Safety and Health, DHHS
(NIOSH) Publication No. 94-113.
[5] NIOSH [1994]. Lead by FAAS: Method 7082. In: Eller PM, Cassinelli ME, eds., NIOSH Manual of
Analytical Methods, 4th ed. Cincinnati, OH: U.S. Department of Health and Human Services, Centers
for Disease Control and Prevention, National Institute for Occupational Safety and Health, DHHS
(NIOSH) Publication No. 94-113.
[6] NIOSH [1977]. NIOSH Manual of Analytical Methods, 2nd ed., V. 2, S5 (Manganese), U.S. Department
of Health, Education, and W elfare, Publ. (NIOSH) 77-157-B.
[7] NIOSH [1994]. Tungsten, soluble/insoluble: Method 7074. In: Eller PM, Cassinelli ME, eds., NIOSH
Manual of Analytical Methods, 4 th ed. Cincinnati, OH: U.S. Department of Health and Human Services,
Centers for Disease Control and Prevention, National Institute for Occupational Safety and Health, DHHS
(NIOSH) Publication No. 94-113.
[8] NIOSH [1979]. NIOSH Manual of Analytical Methods, 2nd ed., V. 5, P&CAM 173 (Metals by Atomic
Absorption), U.S. Department of Health, Education, and Welfare, Publ. (NIOSH) 79-141.
[9] NIOSH [1977]. NIOSH Manual of Analytical Methods, 2nd ed., V. 3, S183 (Tin), S185 (Zirconium), and
S376 (Molybdenum), U.S. Department of Health, Education, and W elfare, Publ. (NIOSH) 77-157-C.
[10] ISO [2001]. Workplace air - Determination of metals and metalloids in airborne particulate matter by
inductively coupled plasma atomic emission spectrometry - Part 2: Sample preparation. International
Organization for Standardization. ISO 15202-2:2001(E).
[11] ASTM [1985]. 1985 Annual Book of ASTM Standards, Vol. 11.01; Standard Specification for Reagent
W ater; ASTM, Philadelphia, PA, D1193-77 (1985).
[12] Certification Inorganic Ventures for spikes.
METHOD REVISED BY:
Mark Millson and Ronnee Andrews, NIOSH/DART.
Method originally written by Mark Millson, NIOSH/DART, and R. DeLon Hull, Ph.D., NIOSH/DSHEFS, James
B. Perkins, David L. W heeler, and Keith Nicholson, DataChem Labortories, Salt Lake City, UT.

ELEMENTS (ICP): METHOD 7300, Issue 3, dated 15 March 2003 - Page 5 of 8
NIOSH Manual of Analytical Methods (NMAM), Fourth Edition
TABLE 1. PROPERTIES AND SAMPLING VOLUM ES
Element
(Symbol)
Properties
Atomic
W eight MP, °C
Air Volume, L @ OSHA PEL
MIN MAX
Silver (Ag)
Aluminum (Al)
Arsenic (As)
Barium (Ba)
Beryllium (Be)
Calcium (Ca)
Cadmium (Cd)
Cobalt (Co)
Chrom ium (Cr)
Copper (Cu)
Iron (Fe)
Potassium (K)
Lanthanum
Lith ium (Li)
Magnesium (Mg)
Manganese (Mn)
Molybdenum (Mo)
Nickel (N i)
Phosphorus (P)
Lead (Pb)
Antimony (Sb)
Selenium (Se)
Tin (Sn)
Strontium (Sr)
Tellurium (Te)
Titanium (Ti)
Thallium (Tl)
Vanadium (V)
Tungsten (W )
Yttrium (Y)
Zinc (Zn)
Zirconium (Zr)
107.87
26.98
74.92
137.34
9.01
40.08
112.40
58.93
52.00
63.54
55.85
39.10
138.91
6.94
24.31
54.94
95.94
58.71
30.97
207.19
121.75
78.96
118.69
87.62
127.60
47.90
204.37
50.94
183.85
88.91
65.37
91.22
961
660
817
710
1278
842
321
1495
1890
1083
1535
63.65
920
179
651
1244
651
1453
44
328
630.5
217
231.9
769
450
1675
304
1890
3410
1495
419
1852
250
5
5
50
1250
5
13
25
5
5
5
5
5
100
5
5
5
5
25
50
50
13
5
10
25
5
25
5
5
5
5
5
2000
100
2000
2000
2000
200
2000
2000
1000
1000
100
1000
1000
2000
67
200
67
1000
2000
2000
2000
2000
1000
1000
2000
100
2000
2000
1000
1000
200
200

ELEMENTS (ICP): METHOD 7300, Issue 3, dated 15 March 2003 - Page 6 of 8
NIOSH Manual of Analytical Methods (NMAM), Fourth Edition
TABLE 2. EXPOSURE LIMITS, CAS #, RTECS
Element(Symbol) CAS # RTECS
Exposure Limits, mg/m3 (Ca = carcinogen) OSHA NIOSH ACGIH
Silver (Ag) 7440-22-4 VW3500000 0.01 (dust, fume, metal) 0.01 (metal, soluble) 0.1 (metal)0.01 (soluble)
Aluminum (Al) 7429-90-5 BD0330000 15 (total dust) 5 (respirable)
10 (total dust)5 (respirable fume)2 (salts, alkyls)
10 (dust)5 (powders, fume)2 (salts, alkyls)
Arsenic (As) 7440-38-2 CG0525000 varies C 0.002, Ca 0.01, Ca
Barium (Ba) 7440-39-3 CQ8370000 0.5 0.5 0.5
Beryllium (Be) 7440-41-7 DS1750000 0.002, C 0.005 0.0005, Ca 0.002, Ca
Calcium (Ca) 7440-70-2 -- varies varies varies
Cadmium (Cd) 7440-43-9 EU9800000 0.005 lowest feasible, Ca 0.01 (total), Ca0.002 (respir.), Ca
Cobalt (Co) 7440-48-4 GF8750000 0.1 0.05 (dust, fume) 0.02 (dust, fume)
Chromium (Cr) 7440-47-3 GB4200000 0.5 0.5 0.5
Copper (Cu) 7440-50-8 GL5325000 1 (dust, mists)0.1 (fume)
1 (dust)0.1 (fume)
1 (dust, mists)0.2 (fume)
Iron (Fe) 7439-89-6 NO4565500 10 (dust, fume) 5 (dust, fume) 5 (fume)
Potassium (K) 7440-09-7 TS6460000 -- -- --
Lanthanum 7439-91-0 -- – – --
Lithium (Li) 7439-93-2 -- -- -- --
Magnesium (Mg) 7439-95-4 OM2100000 15 (dust) as oxide5 (respirable)
10 (fume) as oxide 10 (fume) as oxide
Manganese (Mn) 7439-96-5 OO9275000 C 5 1; STEL 3 5 (dust)1; STEL 3 (fume)
Molybdenum (Mo) 7439-98-7 QA4680000 5 (soluble)15 (total insoluble)
5 (soluble)10 (insoluble)
5 (soluble)10 (insoluble)
Nickel (Ni) 7440-02-0 QR5950000 1 0.015, Ca 0.1 (soluble)1 (insoluble, metal)
Phosphorus (P) 7723-14-0 TH3500000 0.1 0.1 0.1
Lead (Pb) 7439-92-1 OF7525000 0.05 0.05 0.05
Antimony (Sb) 7440-36-0 CC4025000 0.5 0.5 0.5
Selenium (Se) 7782-49-2 VS7700000 0.2 0.2 0.2
Tin (Sn) 7440-31-5 XP7320000 2 2 2
Strontium (Sr) 7440-24-6 – – – --
Tellurium (Te) 13494-80-9 WY2625000 0.1 0.1 0.1
Titanium (Ti) 7440-32-6 XR1700000 -- -- --
Thallium (Tl) 7440-28-0 XG3425000 0.1 (skin) (soluble) 0.1 (skin) (soluble) 0.1 (skin)
Vanadium (V) 7440-62-2 YW240000 -- C 0.05 --
Tungsten 7440-33-7 – 5 510 (STEL)
510 (STEL)
Yttrium (Y) 7440-65-5 ZG2980000 1 N/A 1
Zinc (Zn) 7440-66-6 ZG8600000 – -- --
Zirconium (Zr) 7440-67-7 ZH7070000 5 5, STEL 10 5, STEL 10

ELEMENTS (ICP): METHOD 7300, Issue 3, dated 15 March 2003 - Page 7 of 8
NIOSH Manual of Analytical Methods (NMAM), Fourth Edition
TABLE 3. MEASUREM ENT PROCEDURES AND DATA [1].
Mixed Cellulose Ester Filters (0.45 μm)
Element
(a)
wavelength
nm
Est. LOD
μg/
Filter
LOD
ng/m L
Certified
3x LOD
(b)
% Recovery
(c)
Percent
RSD
(N=25)
Certified
10x LOD
(b)
%
Recovery
(c)
Percent
RSD
(N=25)
Ag 328 0.042 1.7 0.77 102.9 2.64 3.21 98.3 1.53
Al 167 0.115 4.6 1.54 105.4 11.5 6.40 101.5 1.98
As 189 0.140 5.6 3.08 94.9 2.28 12.9 93.9 1.30
Ba 455 0.005 0.2 0.31 101.8 1.72 1.29 97.7 0.69
Be 313 0.005 0.2 0.31 100.0 1.44 1.29 98.4 0.75
Ca 317 0.908 36.3 15.4 98.7 6.65 64.0 100.2 1.30
Cd 226 0.0075 0.3 0.31 99.8 1.99 1.29 97.5 0.88
Co 228 0.012 0.5 0.31 100.8 1.97 1.29 98.4 0.90
Cr 267 0.020 0.8 0.31 93.4 16.3 1.29 101.2 2.79
Cu 324 0.068 2.7 1.54 102.8 1.47 6.40 100.6 0.92
Fe 259 0.095 3.8 1.54 103.3 5.46 6.40 98.0 0.95
K 766 1.73 69.3 23.0 90.8 1.51 96.4 97.6 0.80
La 408 0.048 1.9 0.77 102.8 2.23 3.21 100.1 0.92
Li 670 0.010 0.4 0.31 110.0 1.91 1.29 97.7 0.81
Mg 279 0.098 3.9 1.54 101.1 8.35 6.40 98.0 1.53
Mn 257 0.005 0.2 0.31 101.0 1.77 1.29 94.7 0.73
Mo 202 0.020 0.8 0.31 105.3 2.47 1.29 98.6 1.09
Ni 231 0.020 0.8 0.31 109.6 3.54 1.29 101.2 1.38
P 178 0.092 3.7 1.54 84.4 6.19 6.40 82.5 4.75
Pb 168 0.062 2.5 1.54 109.4 2.41 6.40 101.7 0.88
Sb 206 0.192 7.7 3.08 90.2 11.4 12.9 41.3 32.58
Se 196 0.135 5.4 2.3 87.6 11.6 9.64 84.9 4.78
Sn 189 0.040 1.6 0.77 90.2 18.0 3.21 49 21.79
Sr 407 0.005 0.2 0.31 101.0 1.55 1.29 97.3 0.65
Te 214 0.078 3.1 1.54 102.0 2.67 6.40 97.4 1.24
Ti 334 0.050 2.0 0.77 98.4 2.04 3.21 93.4 1.08
Tl 190 0.092 3.7 1.54 100.9 2.48 6.40 99.1 0.80
V 292 0.028 1.1 0.77 103.2 1.92 3.21 98.3 0.84
W 207 0.075 3.0 1.54 72.2 10.1 6.40 57.6 14.72
Y 371 0.012 0.5 0.31 100.5 1.80 1.29 97.4 0.75
Zn 213 0.310 12.4 4.60 102.2 1.87 19.3 95.3 0.90
Zr 339 0.022 0.9 0.31 88.0 19.4 1.29 25 57.87
(a) Bold values are qualitative only because of low recovery.
(b) Values are certified by Inorganic Ventures INC. at 3x and 10x the approximate instrumental LOD
(c) Values reported were obtained with a Spectro Analytical Instruments EOP ICP; perform ance may vary with
instrument and should be independently verified.

ELEMENTS (ICP): METHOD 7300, Issue 3, dated 15 March 2003 - Page 8 of 8
NIOSH Manual of Analytical Methods (NMAM), Fourth Edition
TABLE 4. MEASUREM ENT PROCEDURES AND DATA [1].
Polyvinyl Chloride Filter (5.0 �m)
Element
(c)
wavelength
nm
Est. LOD
�g per
filter
LOD
ng/m L
Certified
3x LOD
(b)
%
Recovery
(a)
Percent
RSD
(N=25)
Certified17
10x LOD
(b)
%
Recovery
(a)
Percent
RSD
(N=25)
Ag 328 0.042 1.7 0.78 104.2 8.20 3.18 81.8 18.9
Al 167 0.115 4.6 1.56 77.4 115.24 6.40 92.9 20.9
As 189 0.140 5.6 3.10 100.7 5.13 12.70 96.9 3.2
Ba 455 0.005 0.2 0.31 102.4 3.89 1.270 99.8 2.0
Be 313 0.005 0.2 0.31 106.8 3.53 1.270 102.8 2.1
Ca 317 0.908 36.3 15.6 68.1 12.66 64.00 96.8 5.3
Cd 226 0.0075 0.3 0.31 105.2 5.57 1.27 101.9 2.8
Co 228 0.012 0.5 0.31 109.3 4.67 1.27 102.8 2.8
Cr 267 0.020 0.8 0.31 109.4 5.31 1.27 103.4 4.1
Cu 324 0.068 2.7 1.56 104.9 5.18 6.40 101.8 2.4
Fe 259 0.095 3.8 1.56 88.7 46.82 6.40 99.1 9.7
K 766 1.73 69.3 23.4 96.4 4.70 95.00 99.2 2.2
La 408 0.048 1.9 0.78 45.5 4.19 3.18 98.8 2.6
Li 670 0.010 0.4 0.31 107.7 4.80 1.27 110.4 2.7
Mg 279 0.098 3.9 1.56 54.8 20.59 6.40 64.5 5.7
Mn 257 0.005 0.2 0.31 101.9 4.18 1.27 99.3 2.4
Mo 202 0.020 0.8 0.31 106.6 5.82 1.27 98.1 3.8
Ni 231 0.020 0.8 0.31 111.0 5.89 1.27 103.6 3.2
P 178 0.092 3.7 1.56 101.9 17.82 6.40 86.5 10.4
Pb 168 0.062 2.5 1.56 109.6 6.12 6.40 103.2 2.9
Sb 206 0.192 7.7 3.10 64.6 22.54 12.70 38.1 30.5
Se 196 0.135 5.4 2.30 83.1 26.23 9.50 76.0 17.2
Sn 189 0.040 1.6 0.78 85.7 27.29 3.18 52.0 29.4
Sr 407 0.005 0.2 0.31 71.8 4.09 1.27 81.2 2.7
Te 214 0.078 3.1 1.56 109.6 7.49 6.40 97.3 3.8
Ti 334 0.050 2.0 0.78 101.0 9.46 3.18 92.4 5.5
Tl 190 0.092 3.7 1.56 110.3 4.04 6.40 101.9 2.0
V 292 0.028 1.1 0.78 108.3 3.94 3.18 102.5 2.6
W 207 0.075 3.0 1.56 74.9 15.79 6.40 44.7 19.6
Y 371 0.012 0.5 0.31 101.5 3.63 1.27 101.4 2.5
Zn 213 0.310 12.4 4.70 91.0 68.69 19.1 101.0 9.6
Zr 339 0.022 0.9 0.31 70.7 54.20 1.27 40.4 42.1
(a) Values reported were obtained with a Spectro Analytical Instruments EOP ICP; perform ance may vary with
instrument and should be independently verified.
(b) Values are certified by Inorganic Ventures INC. at 3x and 10x the approximate instrum ental LOD [12].
(c) Bold values are qualitative only because of low recovery. Other digestion techniques may be more
appropriate for these elements and their compounds.

NIOSH Manual of Analytical Methods (NMAM), Fourth Edition
POLYNUCLEAR AROMATIC HYDROCARBONS by HPLC 5506
Formulae: Table 1 MW: Table 1 CAS: Table 2 RTECS: Table 2
METHOD: 5506, Issue 3 EVALUATION: PARTIAL Issue 1: 15 May 1985Issue 3: 15 January 1998
OSHA : Table 3NIOSH: Table 3ACGIH: Table 3
PROPERTIES: Table 1
Compounds acenaphthene benzo[ghi]perylene fluoreneacenaphthylene benzo[a]pyrene indeno[1,2,3-cd]pyreneanthracene benzo[e]pyrene naphthalenebenz[a]anthracene chrysene phenanthrenebenzo[b]fluoranthene dibenz[a,h]anthracene pyrenebenzo[k]fluoranthene fluoranthene
NAMES & SYNONYMS: Polycyclic aromatic hydrocarbons, PAHs; also see Table 2.
SAMPLING MEASUREMENT
SAMPLER: FILTER + SORBENT TUBE(37-mm, 2-μm, PTFE + washed XAD-2, 100mg/50 mg)
FLOW RATE: 2 L/min
VOL-MIN: 200 L -MAX: 1000 L
SHIPMENT: transfer filters to culture tubes; wrap sorbentand culture tubes in Al foil; ship @ 0 C
SAMPLESTABILITY: unknown; protect from heat and UV light
FIELD BLANKS: 3 to 10 field blanks per setMEDIA BLANKS: 6 to 10 media blanks per set
TECHNIQUE: HPLC, FLUORESCENCE/UVDETECTION
ANALYTE: compounds listed above
EXTRACTION: 5 mL acetonitrile; ultrasonic bath, 30 to 60minutes
INJECTIONVOLUME: 10 to 50 μL
MOBILE PHASE: acetonitrile/water gradient @ ambienttemperature, 1 mL/min
COLUMN: 250 x 4.6-mm, reversed-phase, 5-μm C18
DETECTOR: UV @ 254 nm; fluorescence @ 340 nm(excitation), 425 nm (emission)
CALIBRATION: standards in acetonitrile
RANGE: see EVALUATION OF METHOD
ESTIMATED LOD: see EVALUATION OF METHOD
PRECISION ( r): see EVALUATION OF METHOD
ACCURACY
RANGE STUDIED: not determined
BIAS: not determined
OVERALLPRECISION ( rT): not determined
ACCURACY: not determined
APPLICABILITY: This method is applicable to samples that can be extracted with acetonitrile. This method is not applicable to samplesthat require a different extraction solvent or contain large amounts of highly adsorptive particulate matter, e.g., fly ash or diesel soot; also,this method is not applicable to asphalt fume samples.
INTERFERENCES: Any compound that elutes at the same HPLC retention time may interfere. Heat, ozone, NO2, or UV light may causesample degradation.
OTHER METHODS: This revises P&CAM 206 and 251 [1]. Method 5515 uses the same sampling technique, with gas chromatographicmeasurement [2]. Method 5800 uses the same sampling technique, and a flow-injection method to determine total polycyclic aromaticcompounds at two different sets of fluorescent wavelengths [3].

POLYNUCLEAR AROMATIC HYDROCARBONS by HPLC: METHOD 5506, Issue 3, dated 15 January 1998 - Page 2 of 9
NIOSH Manual of Analytical Methods (NMAM), Fourth Edition
REAGENTS:
1. Water, distilled, deionized, degassed.2. Acetonitrile, HPLC grade, degassed.3. PAH test mixture,* a liquid standard containing
the PAHs except benzo[e]pyrene (EPA 610Polynuclear Aromatic Hydrocarbons, Supelco,Cat. No. 4-8743; or equivalent).
4. Benzo[e]pyrene,* solid (Supelco, Cat. No. 44-2475; or equivalent).
* See SPECIAL PRECAUTIONS
EQUIPMENT:
1. Sampler:a. Filter. 37-mm, 2-μm pore size, PTFE
membrane filter laminated to PTFE,(Zefluor, Pall Gelman Sciences, Cat. No.P5PJ037; SKC Inc., Cat. No. 225-17-07; orequivalent filter), cellulose spacer ring,37-mm OD, 32-mm ID, (SKC Inc., Cat. No.225-23; or equivalent) in a 37-mm cassettefilter holder.NOTE: If sampling is to be done in bright
sunlight, use opaque orfoil-wrapped cassettes to preventsample degradation.
b. Sorbent tube, washed XAD-2 resin (front =100 mg; back = 50 mg) (ORBO 43,Supelco, Cat. No. 2-0258; or equivalent),connected to filter with minimum length ofPVC tubing. Plastic caps are required aftersampling.NOTE: If pressure drop is excessive or
pump fails, use a larger diametersorbent tube with XAD-2 resin(ORBO 42 Large, Supelco, Cat.No. 2-0264U; or equivalent).
2. Personal sampling pump capable ofoperating for 8 h at 2 L/min, with flexibleconnecting tubing.
3. Aluminum foil. 4. Refrigerant, bagged. 5. Culture tubes, PTFE-lined screw cap, 13-mm
x 100-mm. 6. Forceps. 7. Syringe filters, 0.45-μm, 25-mm, PTFE
(Acrodisc-CR, Pall Gelman Sciences, Cat.No. 4219; or equivalent).
8. Pipet, 5-mL. 9. Syringe or micropipets, 1- to 100-μL.10. Ultrasonic bath.11. HPLC, with gradient capability, fluorescence
(excitation @ 340 nm, emission @ 425 nm)and UV (254 nm) detectors in series,electronic integrator, and a 250 x 4.6-mm C18column (Vydac 201TP, The SeparationsGroup, Hesperia, CA, Cat. No. 201TP54; orequivalent).
12. Volumetric flasks, 10- and 100-mL.13. Recommendation: lighting in laboratory
should be incandescent or UV-shieldedfluorescent.
SPECIAL PRECAUTIONS: Treat all polynuclear aromatic hydrocarbons as carcinogens. Samples andunused standards are considered toxic waste. Dispose of in an appropriate manner. Counter tops andequipment should be checked regularly with a "black light" for fluorescence as an indicator ofcontamination by PAHs.
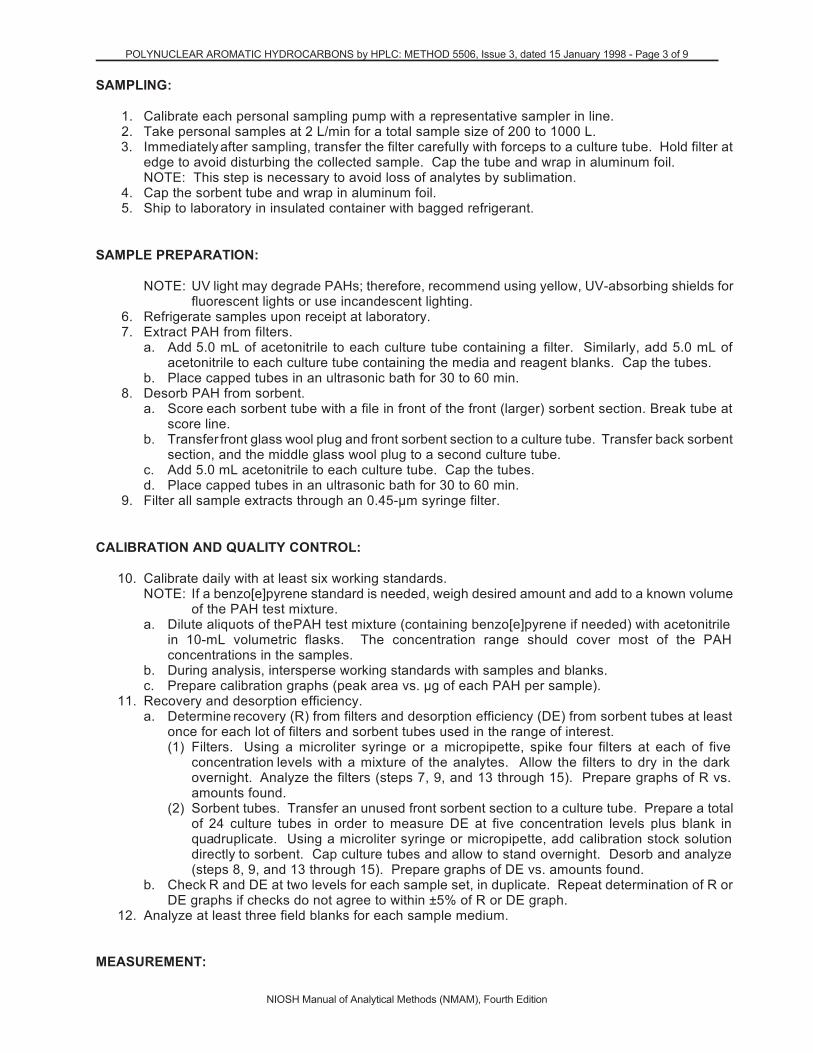
POLYNUCLEAR AROMATIC HYDROCARBONS by HPLC: METHOD 5506, Issue 3, dated 15 January 1998 - Page 3 of 9
NIOSH Manual of Analytical Methods (NMAM), Fourth Edition
SAMPLING:
1. Calibrate each personal sampling pump with a representative sampler in line. 2. Take personal samples at 2 L/min for a total sample size of 200 to 1000 L. 3. Immediately after sampling, transfer the filter carefully with forceps to a culture tube. Hold filter at
edge to avoid disturbing the collected sample. Cap the tube and wrap in aluminum foil.NOTE: This step is necessary to avoid loss of analytes by sublimation.
4. Cap the sorbent tube and wrap in aluminum foil. 5. Ship to laboratory in insulated container with bagged refrigerant.
SAMPLE PREPARATION:
NOTE: UV light may degrade PAHs; therefore, recommend using yellow, UV-absorbing shields forfluorescent lights or use incandescent lighting.
6. Refrigerate samples upon receipt at laboratory. 7. Extract PAH from filters.
a. Add 5.0 mL of acetonitrile to each culture tube containing a filter. Similarly, add 5.0 mL ofacetonitrile to each culture tube containing the media and reagent blanks. Cap the tubes.
b. Place capped tubes in an ultrasonic bath for 30 to 60 min. 8. Desorb PAH from sorbent.
a. Score each sorbent tube with a file in front of the front (larger) sorbent section. Break tube atscore line.
b. Transfer front glass wool plug and front sorbent section to a culture tube. Transfer back sorbentsection, and the middle glass wool plug to a second culture tube.
c. Add 5.0 mL acetonitrile to each culture tube. Cap the tubes.d. Place capped tubes in an ultrasonic bath for 30 to 60 min.
9. Filter all sample extracts through an 0.45-μm syringe filter.
CALIBRATION AND QUALITY CONTROL:
10. Calibrate daily with at least six working standards.NOTE: If a benzo[e]pyrene standard is needed, weigh desired amount and add to a known volume
of the PAH test mixture.a. Dilute aliquots of the PAH test mixture (containing benzo[e]pyrene if needed) with acetonitrile
in 10-mL volumetric flasks. The concentration range should cover most of the PAHconcentrations in the samples.
b. During analysis, intersperse working standards with samples and blanks.c. Prepare calibration graphs (peak area vs. μg of each PAH per sample).
11. Recovery and desorption efficiency.a. Determine recovery (R) from filters and desorption efficiency (DE) from sorbent tubes at least
once for each lot of filters and sorbent tubes used in the range of interest.(1) Filters. Using a microliter syringe or a micropipette, spike four filters at each of five
concentration levels with a mixture of the analytes. Allow the filters to dry in the darkovernight. Analyze the filters (steps 7, 9, and 13 through 15). Prepare graphs of R vs.amounts found.
(2) Sorbent tubes. Transfer an unused front sorbent section to a culture tube. Prepare a totalof 24 culture tubes in order to measure DE at five concentration levels plus blank inquadruplicate. Using a microliter syringe or micropipette, add calibration stock solutiondirectly to sorbent. Cap culture tubes and allow to stand overnight. Desorb and analyze(steps 8, 9, and 13 through 15). Prepare graphs of DE vs. amounts found.
b. Check R and DE at two levels for each sample set, in duplicate. Repeat determination of R orDE graphs if checks do not agree to within ±5% of R or DE graph.
12. Analyze at least three field blanks for each sample medium.
MEASUREMENT:

POLYNUCLEAR AROMATIC HYDROCARBONS by HPLC: METHOD 5506, Issue 3, dated 15 January 1998 - Page 4 of 9
NIOSH Manual of Analytical Methods (NMAM), Fourth Edition
CW Wf Wb B Bf Bb
V, mg/m 3
13. Set HPLC according to manufacturer’s instructions, conditions on page 5506-1, and steps 14 and15.
14. Inject sample aliquot (10 to 50 μL). Start mobile phase gradient:a. Linear gradient from 60% acetonitrile/40% deionized water to 100% acetonitrile at 1 mL/min
over 20 min.b. Hold at 100% acetonitrile for 20 min.c. Linear gradient to initial condition, 5 min.
15. Measure peak areas for each analyte using the appropriate detector as specified in Table 1.NOTE 1: The order of elution for the PAHs appears in Table 4.NOTE 2: If peak area is above the calibration range, dilute with acetonitrile, reanalyze, and apply
dilution factor in calculations.NOTE 3: If sample has many interferences, additional sample cleanup may be necessary.
CALCULATIONS:
16. Read the mass, μg (corrected for R or DE) of each analyte found on the filter (W) and front sorbent(Wf) and back sorbent (Wb) sections, and on the average media blank filter (B) and front sorbent (Bf)and back sorbent (Bb) sections from the calibration graphs.
17. Calculate concentration, C (mg/m3), as the sum of the particulate concentration and the vaporconcentration in the actual air volume sampled, V (L).
NOTE 1: μg/mL mg/m3
NOTE 2: Wf and Wb include analyte originally collected on the filter as particulate, then volatilizedduring sampling. This can be a significant fraction for many PAHs (e.g., anthracene,fluoranthene, fluorene, naphthalene, phenanthrene).
EVALUATION OF METHOD:
The UV detector is used to analyze for some PAHs (see Table 1), and the remaining PAHs are analyzed bya fluorescent detector, which gave better sensitivity for some PAHs. The ranges of the limit of detection(LOD) and the limit of quantitation (LOQ) values for the 17 PAHs are reported in Table 4 [4]. The LOD andLOQ values varied because of differences in the detectors used and the concentrations of the standards.Therefore, it is important that the LOD and LOQ values be determined for each set of samples. The LOQsare the lower end of the analytical ranges. The upper end of the analytical ranges were not determined.
This method was evaluated by means of a user check [5]. An independent laboratory prepared spiked filtersand sorbent tubes for a recovery and desorption efficiency study (see Table 4). For the filters, exceptnaphthalene, the recovery results were greater than or equal to 75%. Since naphthalene is fairly volatileunder ambient conditions, this may account for the poor recovery results. For the sorbent tubes, only fourof the 17 analytes had desorption efficiencies that were greater than or equal to 75%. During the user check,the sorbent tubes were extracted by adding 5 mL acetonitrile and were allowed to stand for 30 minutes withoccasional swirling. In more recent quality control experiments, the desorption efficiencies were often betterfor some analytes (see Table 4) [4]. These results were achieved using an ultrasonic bath for 30 to 60minutes. The results indicated the importance of preparing media spikes for recovery and desorptionefficiency studies for each set of samples; moreover, the results reenforce this need when using new lotsof media.
REFERENCES:

POLYNUCLEAR AROMATIC HYDROCARBONS by HPLC: METHOD 5506, Issue 3, dated 15 January 1998 - Page 5 of 9
NIOSH Manual of Analytical Methods (NMAM), Fourth Edition
[1] NIOSH [1977]. Total particulate aromatic hydrocarbons: Method P&CAM 206. NIOSH Manual ofAnalytical Methods, 2nd ed., Vol. 1. Cincinnati, OH: National Institute for Occupational Safety andHealth, DHEW (NIOSH) Publication No. 77-157-A.
[2] NIOSH [1994]. Polynuclear aromatic hydrocarbons by GC: Method 5515. In: Eller PM, Cassinelli ME,eds. NIOSH Manual of Analytical Methods (NMAM®), 4th ed. Cincinnati, OH: National Institute forOccupational Safety and Health, DHHS (NIOSH) Publication No. 94-113.
[3] NIOSH [1998]. Polycyclic aromatic compounds: Method 5800. In: Eller PM, Cassinelli ME, eds.NIOSH Manual of Analytical Methods (NMAM®), 4th ed., 2nd Supplement. Cincinnati, OH: NationalInstitute for Occupational Safety and Health, DHHS (NIOSH) Publication No. 98-119.
[4] NIOSH unpublished data. [5] User Check Report for Method 5506, Analytical Report for NIOSH Sequence 4170 (NIOSH, DPSE,
MRSB, unpublished, March 16, 1984). [6] Handbook of Chemistry and Physics, 78th ed. [1997], Boca Raton, FL: CRC Press. [7] IARC [1983]. IARC monographs on the evaluation of the carcinogenic risk of chemicals to humans:
polynuclear aromatic compounds, Part 1, chemical, environmental and experimental data. Vol. 32.Lyon, France: World Health Organization, International Agency for Research on Cancer.
[8] Lenga RE, Votoupal KL, eds. [1993]. The Sigma-Aldrich library of regulatory and safety data, Volume1. Sigma-Aldrich Company.
[9] NIOSH [1998]. Registry of toxic effects of chemical substances data base. Cincinnati, OH: NationalInstitute for Occupational Safety and Health. Unpublished data base.
[10] NIOSH [1997]. NIOSH pocket guide to chemical hazards. Cincinnati, OH: National Institute forOccupational Safety and Health, DHHS (NIOSH) Publication No. 97-140.
[11] ACGIH [1997]. 1997 TLVs® and BEIs®, Threshold limit values for chemical substances and physicalagents, Biological exposure Indices. Cincinnati, OH: American Conference of Governmental IndustrialHygienists (ACGIH).
[12] NIOSH [1992]. NIOSH recommendations for occupational safety and health, compendium of policydocuments and statements. Cincinnati, OH: National Institute for Occupational Safety and Health,DHHS (NIOSH) Publication No. 92-100.
METHOD REVISED BY:
L. D. Olsen, B. R. Belinky, C. E. Neumeister, L. B. Jaycox, and D. D. Dollberg, NIOSH/DPSE.

POLYNUCLEAR AROMATIC HYDROCARBONS by HPLC: METHOD 5506, Issue 3, dated 15 January 1998 - Page 6 of 9
NIOSH Manual of Analytical Methods (NMAM), Fourth Edition
TABLE 1. FORMULAS AND PHYSICAL PROPERTIES.
COMPOUND (by M.W.) FORMULA WEIGHT DETECTOR
MELTINGPOINT( C)
BOILINGPOINT( C) REFERENCE
1. NAPHTHALENE C10H8 128.17 UV 80.2 218 [6]
2. ACENAPHTHYLENE C12H8 152.20 UV 92.5 280 [6]
3. ACENAPHTHENE C12H10 154.21 UV 93.4 279 [6]
4. FLUORENE C13H10 166.22 UV 115 295 [6]
5. ANTHRACENE C14H10 178.23 UV 215 340 [6]
6. PHENANTHRENE C14H10 178.23 UV 99.2 340 [6
7. FLUORANTHENE C16H10 202.26 FL 108 384 [6]
8. PYRENE C16H10 202.26 FL 151 404 [6]
9. BENZ[a]ANTHRACENE C18H12 228.29 FL 167 435 [7]
10. CHRYSENE C18H12 228.29 UV 258 448 [6]
11. BENZO[b]FLUORANTHENE C20H12 252.32 FL 168 -- [7]
12. BENZO[k]FLUORANTHENE C20H12 252.32 FL 217 480 [6]
13. BENZO[a]PYRENE C20H12 252.32 FL 177 495 [6, 8]
14. BENZO[e]PYRENE C20H12 252.32 FL 178 311 [6]
15. BENZO[ghi]PERYLENE C22H12 276.34 FL 278 -- [7]
16. INDENO[1,2,3-cd]PYRENE C22H12 276.34 FL 164 -- [7]
17. DIBENZ[a,h]ANTHRACENE C22H14 278.35 FL 270 524 [7, 8]

POLYNUCLEAR AROMATIC HYDROCARBONS by HPLC: METHOD 5506, Issue 3, dated 15 January 1998 - Page 7 of 9
NIOSH Manual of Analytical Methods (NMAM), Fourth Edition
TABLE 2. SYNONYMS, CAS AND RTECS NUMBERS.
COMPOUND (alphabetically) SYNONYMS, CAS and RTECS Numbers*
1. ACENAPHTHENE CAS # 83-32-9; RTECS # AB1000000
2. ACENAPHTHYLENE acenaphthalene; CAS # 208-96-8; RTECS # AB1254000
3. ANTHRACENE CAS # 120-12-7; RTECS # CA9350000
4. BENZ[a]ANTHRACENE 1,2-benzanthracene; benzo[b]phenanthrene; 2,3-benzophenanthrene; tetraphene; CAS #56-55-3; RTECS # CV9275000
5. BENZO[b]FLUORANTHENE 3,4-benzofluoranthene; 2,3-benzofluoranthene; benz[e]acephenanthrylene; B(b)F; CAS #205-99-2; RTECS # CU1400000
6. BENZO[k]FLUORANTHENE 11,12-benzofluoranthene; CAS # 207-08-9; RTECS # DF6350000
7. BENZO[ghi]PERYLENE 1,12-benzoperylene; CAS # 191-24-2; RTECS # DI6200500
8. BENZO[a]PYRENE 3,4-benzopyrene; 6,7-benzopyrene; B(a)P; BP; CAS # 50-32-8;RTECS # DJ3675000
9. BENZO[e]PYRENE 1,2-benzopyrene; 4,5-benzopyrene; B(e)P; CAS # 192-97-2; RTECS # DJ4200000
10. CHRYSENE 1,2-benzophenanthrene; benzo[a]phenanthrene; CAS # 218-01-9;RTECS # GC0700000
11. DIBENZ[a,h]ANTHRACENE 1,2,5,6-dibenzanthracene; CAS # 53-70-3; RTECS # HN2625000
12. FLUORANTHENE benzo[jk]fluorene; CAS # 206-44-0; RTECS # LL4025000
13. FLUORENE CAS # 86-73-7; RTECS # LL5670000
14. INDENO[1,2,3-cd]PYRENE 2,3-phenylenepyrene; CAS # 193-39-5; RTECS # NK9300000
15. NAPHTHALENE naphthene; CAS # 91-20-3; RTECS # QJ0525000
16. PHENANTHRENE CAS # 85-01-8; RTECS # SF7175000
17. PYRENE benzo[def]phenanthrene; CAS # 129-00-0; RTECS # UR2450000* Data from [6, 8, and 9].
TABLE 3. EXPOSURE LIMITS.*
COMPOUND OSHA† NIOSH† ACGIH‡
1. ANTHRACENE 0.2 mg/m3 --
2. BENZ[a]ANTHRACENE -- -- suspect human carcinogen
3. BENZO[b]FLUORANTHENE -- -- suspect human carcinogen
4. BENZO[a]PYRENE 0.2 mg/m3 -- suspect human carcinogen
5. CHRYSENE 0.2 mg/m3 potential occupational carcinogen§ animal carcinogen
6. NAPHTHALENE 10 ppm; STEL 15ppm
10 ppm; STEL 15 ppm 10 ppm; STEL 15 ppm
7. PHENANTHRENE 0.2 mg/m3 -- --
8. PYRENE 0.2 mg/m3 -- -- * This table only includes the compounds with established exposure limit values.
† Information from [10].‡ Information from [11].§ Information from [12].

POLYNUCLEAR AROMATIC HYDROCARBONS by HPLC: METHOD 5506, Issue 3, dated 15 January 1998 - Page 8 of 9
NIOSH Manual of Analytical Methods (NMAM), Fourth Edition
TABLE 4. LOD AND LOQ VALUES, AND RECOVERY DATA.
COMPOUND (by elution order)
Range of values* Recoveries (%)†
LOD(μg per sample)
LOQ(μg per sample) Filters Sorbent tubes
1. NAPHTHALENE 0.20 - 0.80 0.39 - 2.6 49.6 68.5
2. ACENAPHTHYLENE 0.090 - 2.0 0.28 - 6.6 98.2 98.2
3. ACENAPHTHENE 0.20 - 5.0 0.58 - 16. -- --
4. FLUORENE 0.030 - 0.30 0.099 - 0.26 95.0 95.0
5. PHENANTHRENE 0.0070 - 0.060 0.023 - 0.19 99.0, 90.4* 84.0, 92.5*, 82.6*
6. ANTHRACENE 0.0010 - 0.090 0.023 - 0.30 81.8, 94.4* 72.8, 96.2*, 72.9*
7. FLUORANTHENE 0.0020 - 0.090 0.0066 - 0.30 94.9, 90.4* 73.0, 93.5*, 81.7*
8. PYRENE 0.0010 - 0.30 0.0036 - 0.99 94.4, 76.1* 84.9, 77.0*, 75.9*
9. BENZ[a]ANTHRACENE 0.0010 - 0.090 0.0042 - 0.30 86.6, 92.7* 62.4, 95.0*, 72.3*
10. CHRYSENE 0.0070 - 0.20 0.023 - 0.37 94.6, 89.9* 62.7, 89.8*, 74.0*
11. BENZO[e]PYRENE 0.0060 - 0.80 0.020 - 2.6 110 48.3
12. BENZO[b]FLUORANTHENE 0.0030 - 0.20 0.011 - 0.66 94.8 64.2
13. BENZO[k]FLUORANTHENE 0.0020 - 0.040 0.0054 - 0.13 103 53.2
14. BENZO[a]PYRENE 0.0020 - 0.10 0.0051 - 0.33 101, 88.1* 50.4, 91.6*, 68.4*
15. DIBENZ[a,h]ANTHRACENE 0.0040 - 0.60 0.014 - 2.0 76.5 61.0
16. BENZO[ghi]PERYLENE 0.0030 - 0.50 0.011 - 1.7 76.5 61.0
17. INDENO[1,2,3-cd]PYRENE 0.0090 - 0.20 0.027 - 0.66 91.6 36.5 * Data from [4].† Data from [5]

POLYNUCLEAR AROMATIC HYDROCARBONS by HPLC: METHOD 5506, Issue 3, dated 15 January 1998 - Page 9 of 9
NIOSH Manual of Analytical Methods (NMAM), Fourth Edition
ACENAPHTHENE ACENAPHTHYLENE ANTHRACENE
BENZ[a]ANTHRACENE BENZO[b]FLUORANTHENE BENZO[k]FLUORANTHENE
BENZO[g h i]PERYLENE BENZO[a]PYRENE BENZO[e]PYRENE
CHRYSENE DIBENZ[a,h]ANTHRACENE FLUORANTHENE
FLUORENE INDENO[1,2,3-c d]PYRENE NAPHTHALENE
PHENANTHRENE PYRENEFigure
1. Structure of the PAHs.

POLYCHLOROBIPHENYLS 5503
mixture: C12H10-xClx MW: ca. 258 (42% Cl ; C12H7Cl3); CAS: Table 1 RTECS: Table 1 [where x = 1 to 10] ca. 326 (54% Cl ; C12H5Cl5)
METHOD: 5503, Issue 2 EVALUATION: PARTIAL Issue 1: 15 February 1984Revision #1: 15 August 1987Issue 2: 15 August 1994
OSHA : 1 mg/m3 (42% Cl);0.5 mg/m3 (54% Cl)
NIOSH: 0.001 mg/m3/10 h (carcinogen)ACGIH: 1 mg/m3 (42% Cl) (skin)
0.5 mg/m3 (54% Cl) (skin)
PROPERTIES: 42% Cl: BP 325 to 366 °C; MP -19 °C; d 1.38 g/mL @ 25 °C; VP 0.01 Pa (8 x 10⁻⁵ mm Hg; 1 mg/m3) @ 20 °C
54% Cl: BP 365 to 390 °C; MP 10 °C; d 1.54 g/mL @ 25 °C; VP 0.0004 Pa (3 x 10⁻⁶ mm Hg; 0.05 mg/m3) @ 20 °C
SYNONYMS: PCB; 1,1'-biphenyl chloro; chlorodiphenyl, 42% Cl (Aroclor 1242); and 54% Cl (Aroclor 1254)
SAMPLING
SAMPLER: FILTER + SOLID SORBENT(13-mm glass fiber + Florisil,100 mg/50 mg)
FLOW RATE: 0.05 to 0.2 L/min or less
VOL-MIN: 1 L @ 0.5 mg/m3
-MAX: 50 L
SHIPMENT: transfer filters to glass vials after sampling
SAMPLESTABILITY: unknown for filters;
2 months for Florisil tubes [1]
BLANKS: 2 to 10 field blanks per set
MEASUREMENT
TECHNIQUE: GAS CHROMATOGRAPHY, ECD (6 3Ni)
ANALYTE: polychlorobiphenyls
DESORPTION: filter + front section, 5 mL hexane; backsection, 2 mL hexane
INJECTIONVOLUME: 4-μL with 1-μL backflush
TEMPERATURE-INJECTION: 250 to 300 °C-DETECTOR: 300 to 325 °C
-COLUMN: 180 °C
CARRIER GAS: N2, 40 mL/min
COLUMN: glass, 1.8 m x 2-mm ID, 1.5% OV-17/1.95%QF-1 on 80/100 mesh Chromosorb WHP
CALIBRATION: standard PCB mixture in hexane
RANGE: 0.4 to 4 μg per sample [2]
ESTIMATED LOD: 0.03 μg per sample [2]
PRECISION (Sr): 0.044 [1]
ACCURACY
RANGE STUDIED: not studied
BIAS: none identified
OVERALL PRECISION (SrT): not evaluated
ACCURACY: not determined
APPLICABILITY: The working range is 0.01 to 10 mg/m3 for a 40-L air sample [1]. With modifications, surface wipe samplesmay be analyzed [3,4].
INTERFERENCES: Chlorinated pesticides, such as DDT and DDE, may interfere with quantification of PCB. Sulfur-containingcompounds in petroleum products also interfere [5].
OTHER METHODS: This method revises methods S120 [6] and P&CAM 244 [1]. Methods S121 [7] and P&CAM 253 [8] for PCBhave not been revised.
NIOSH Manual of Analytical Methods (NMAM), Fourth Edition, 8/15/94

POLYCHLOROBIPHENYLS: METHOD 5503, Issue 2, dated 15 August 1994 - Page 2 of 5
SAMPLING:
REAGENTS:
1. Hexane, pesticide quality.2. Florisil, 30/48 mesh sieved from 30/60 mesh.
After sieving, dry at 105 °C for 45 min. Mixthe cooled Florisil with 3% (w/w) distilledwater.
3. Nitrogen, purified.4. Stock standard solution of the PCB in
methanol or isooctane (commerciallyavailable).*
* See SPECIAL PRECAUTIONS.
EQUIPMENT:
1. Sampler: 13-mm glass fiber filter withoutbinders in a Swinnex cassette (Cat. No. SX0001300, Millipore Corp.) followed by a glasstube, 7 cm long, 6-mm OD, 4-mm IDcontaining two sections of 30/48 meshdeactivated Florisil. The front section ispreceded by glass wool and contains 100 mgand the backup section contains 50 mg;urethane foam between sections and behindthe backup section. (SKC 226-39, SupelcoORBO-60, or equivalent) Join the cassetteand Florisil tube with PVC tubing, 3/8" L x9/32" OD x 5/32" ID, on the outlet of thecassette and with another piece of PVCtubing, 3/4" L x 5/16" OD x 3/16" ID, completethe union.
2. Personal sampling pump, 0.05 to 0.2 L/min,with flexible connecting tubing.
3. Tweezers. 4. Vials, glass, 4- and 7-mL, with aluminum or
PTFE-lined caps 5. Gas chromatograph, electron capture
detection (63Ni), integrator and column (page5503-1).
6. Volumetric flasks, 10-mL and other convenientsizes for preparing standards.
7. Syringe, 10-μL.
SPECIAL PRECAUTIONS: Avoid prolonged or repeated contact of skin with PCB and prolonged orrepeated breathing of the vapor [9-11].
1. Calibrate each personal sampling pump with a representative sampler in line.2. Break the ends of the Florisil tube immediately before sampling. Connect Florisil tube to
Swinnex cassette and attach sampler to personal sampling pump with flexible tubing.3. Sample at an accurately known flow rate between 0.05 and 0.2 L/min for a total sample size of
1 to 50 L.NOTE: At low PCB concentrations, the sampler was found to be efficient when operated at flow
rates up to 1 L/min, for 24 hours [4]. Under these conditions, the limit of detection was0.02 μg/m3.
4. Transfer the glass fiber filters to 7-mL vials. Cap the Florisil tubes with plastic (not rubber) capsand pack securely for shipment.
SAMPLE PREPARATION:
5. Place the glass wool and 100-mg Florisil bed in the same 7-mL vial in which the filter wasstored. Add 5.0 mL hexane.
6. In a 4-mL vial, place the 50-mg Florisil bed including the two urethane plugs. Add 2.0 mLhexane.
7. Allow to stand 20 min with occasional agitation.
NIOSH Manual of Analytical Methods (NMAM), Fourth Edition, 8/15/94

POLYCHLOROBIPHENYLS: METHOD 5503, Issue 2, dated 15 August 1994 - Page 3 of 5
CALIBRATION AND QUALITY CONTROL:
8. Calibrate daily with at least six working standards over the range 10 to 500 ng/mL PCB.a. Add known amounts of stock standard solution to hexane in 10-mL volumetric flasks and
dilute to the mark.b. Analyze together with samples and blanks (steps 11 and 12).c. Prepare calibration graph (sum of areas of selected peaks vs. ng PCB per sample).
9. Determine desorption efficiency (DE) at least once for each lot of glass fiber filters and Florisilused for sampling in the calibration range (step 8). Prepare three tubes at each of five levelsplus three media blanks.a. Remove and discard back sorbent section of a media blank Florisil tube.b. Inject known amounts of stock standard solution directly onto front sorbent section and onto
a media blank filter with a microliter syringe.c. Cap the tube. Allow to stand overnight.d. Desorb (steps 5 through 7) and analyze together with working standards (steps 11 and 12).e. Prepare a graph of DE vs. μg PCB recovered.
10. Analyze three quality control blind spikes and three analyst spikes to ensure that the calibrationgraph and DE graph are in control.
MEASUREMENT:
11. Set gas chromatograph according to manufacturer's recommendations and to conditions givenon page 5503-1. Inject sample aliquot manually using solvent flush technique or withautosampler.NOTE 1: Where individual identification of PCB is needed, a procedure using a capillary
column may be used [12].NOTE 2: If peak area is above the linear range of the working standards, dilute with hexane,
reanalyze and apply the appropriate dilution factor in calculations.12. Sum the areas for five or more selected peaks.
CALCULATIONS:
13. Determine the mass, μg (corrected for DE) of PCB found on the glass fiber filter (W) and in theFlorisil front (W f) and back (W b) sorbent sections, and in the average media blank filter (B) andfront (Bf) and back (B b) sorbent sections.NOTE: If Wb > Wf/10, report breakthrough and possible sample loss.
14. Calculate concentration, C, of PCB in the air volume sampled, V (L):
EVALUATION OF METHOD:
This method uses 13-mm glass fiber filters which have not been evaluated for collecting PCB. InMethod S120, however, Aroclor 1242 was completely recovered from 37-mm glass fiber filters using 15mL isooctane [8,13,14]. With 5 mL of hexane, Aroclor 1016 was also completely recovered from 100-mg Florisil beds after one-day storage [1]. Thus, with no adsorption effect likely on glass fiber filters forPCB, 5 mL hexane should be adequate to completely extract PCB from combined filters and frontsorbent sections. Sample stability on glass fiber filters has not been investigated. Breakthrough volumewas >48 L for the Florisil tube at 75% RH in an atmosphere containing 10 mg/m 3 Aroclor 1016 [1].
NIOSH Manual of Analytical Methods (NMAM), Fourth Edition, 8/15/94

POLYCHLOROBIPHENYLS: METHOD 5503, Issue 2, dated 15 August 1994 - Page 4 of 5
REFERENCES:
[1] NIOSH Manual of Analytical Methods, 2nd ed., V. 1, P&CAM 244, U.S. Department of health,Education, and Welfare, Publ. (NIOSH) 77-157-A (1977).
[2] User check, Southern Research Institute, NIOSH Sequence #4121-U (unpublished, January 25,1984).
[3] Kominsky, J. Applied Ind. Hyg. 1 (4), R-6 (1986).[4] NIOSH Health Hazard Evaluation Report, HETA 85-289-1738 (unpublished, 1986).[5] Hofstader, R. A., C. A. Bache, and D. J. Lisk. Bull, Environ. Contam. Toxicol., 11, 136 (1974).[6] NIOSH Manual of Analytical Methods, 2nd ed., V. 4, S120, U.S. Department of Health,
Education, and Welfare, Publ. (NIOSH) 78-175 (1978).[7] Ibid, V. 2, S121, U.S. Department of Health, Education, and Welfare, Publ. (NIOSH) 77-157-B
(1977).[8] Ibid, Vol. 1, P&CAM 253[9] Criteria for a Recommended Standard . . . Occupational Exposure to Polychlorinated Biphenyls,
U.S. Department of Health, Education, and Welfare, Publ. (NIOSH) 77-225 (1977).[10] Current Intelligence Bulletin 7, Polychlorinated Biphenyls (PCBs), U.S. Department of Health
and Human Services, Publ. (NIOSH) 78-127 (1975).[11] Occupational Diseases, A Guide to Their Recognition, revised ed., 255-256, U.S. Department of
Health, Education, and Welfare, Publ. (NIOSH) 77-181 (1978).[12] Dunker, J. C. and M. T. J. Hillebrand. Characterization of PCB Components in Clophen
Formulations by Capillary GC-MS and GC-ECD Techniques, Environ. Sci. Technol., 17 (8), 449-456 (1983).
[13] Backup Data Report for S120, prepared under NIOSH Contract 210-76-0123, available as "TenNIOSH Analytical Methods, Set 2," Order No. Pb 271-464 from NTIS, Springfield, VA 22161.
[14] NIOSH Research Report-Development and Validation of Methods for Sampling and Analysis ofWorkplace Toxic Substances, U.S. Department of Health and Human Services, Publ. (NIOSH)80-133 (1980).
[15] Hutzinger, O., S. Safe, and V. Zitko. The Chemistry of PCBs, CRC Press, Inc., Cleveland, OH(1974).
METHOD REVISED BY:
James E. Arnold, NIOSH/DPSE; S120 originally validated under NIOSH Contract 210-76-0123.
Table 1. General Information.
Compound CAS RTECS
Polychlorinated Biphenyls 1336-36-3 TQ1350000Chlorobiphenyl 27323-18-8 DV2063000Aroclor 1016 (41% Cl) 12674-11-2 TQ1351000Aroclor 1242 (42% Cl) 53469-21-9 TQ1356000Aroclor 1254 (54% Cl) 11097-69-1 TQ1360000
NIOSH Manual of Analytical Methods (NMAM), Fourth Edition, 8/15/94

POLYCHLOROBIPHENYLS: METHOD 5503, Issue 2, dated 15 August 1994 - Page 5 of 5
Table 2. Composition of some Aroclors [15].
Major Components Aroclor 1016 Aroclor 1242 Aroclor 1254
Biphenyl 0.1% <0.1% <0.1%Monochlorobiphenyls 1 1 <0.1Dichlorobiphenyls 20 16 0.5Trichlorobiphenyls 57 49 1Tetrachlorobiphenyls 21 25 21Pentachlorobiphenyls 1 8 48Hexachlorobiphenyls <0.1 1 23Heptachlorobiphenyls none detected <0.1 6Octachlorobiphenyls none detected none detected none detected
NIOSH Manual of Analytical Methods (NMAM), Fourth Edition, 8/15/94

T-ID215-FV-01-9806-M1 of 31
HEXAVALENT CHROMIUM IN WORKPLACE ATMOSPHERES
OSHA Method Number: ID-215 (This method supersedes ID-103)
Matrix: Air
OSHA Permissible Exposure Limit (proposed)Hexavalent Chromium [Cr(VI)] Time Weighted Average (TWA): 0.50 µg/m3
Action Level (AL): 0.25 µg/m3
Collection Device: An air sample is collected using a 37-mm diameter polyvinyl chloride
(PVC) filter (5-µm pore size) contained in a polystyrene cassette. Acalibrated sampling pump is used to draw a representative air samplefrom the breathing zone of an employee through the cassette andcollect particulate on the filter.
Recommended Sampling Rate: 2 liters per minute (L/min)
Recommended Air Volume:TWA and AL: 960 L (2 L/min for 480 min) Analytical Procedure: The hexavalent chromium, Cr(VI), is extracted from the PVC filter using
an aqueous solution containing 10% sodium carbonate (Na2CO3)/ 2%sodium bicarbonate (NaHCO3) and the mixture of phosphatebuffer/magnesium sulfate [-10 mg as Mg (II)]. After dilution, an aliquotof this solution is analyzed for Cr(VI) by an ion chromatograph equippedwith a UV-vis detector at 540-nm wavelength. A post-columnderivatization of the Cr(VI) with 1,5-diphenyl carbazide is performedprior to detection.
Detection LimitQualitative: 1.0 × 10⁻³ µg/m3 as Cr(VI) (960-L air sample)Quantitative: 3.0 × 10⁻³ µg/m3 as Cr(VI) (960-L air sample)
Precision and Accuracy (Soluble and Insoluble) Validation Range: 0.12 to 0.42 µg/m3 (960-L air sample)CV1(pooled): 0.059Bias: - 0.004Overall Error: ±12.9%
Method Classification: Validated Method
Chemists: James C. Ku, Mary Eide
Date: June, 1998
Commercial manufacturers and products mentioned in this method are for descriptive use only and do notconstitute endorsements by USDOL-OSHA. Similar products from other sources can be substituted.
Branch of Inorganic Methods DevelopmentOSHA Salt Lake Technical Center
Salt Lake City, Utah

T-ID215-FV-01-9806-M2 of 31
1. Introduction
This method describes the sample collection and analysis of airborne hexavalent chromium, Cr(VI). Thismethod should be used by industrial hygienists experienced in monitoring for exposures and analystsexperienced in the use of ion chromatography and the interpretation of ion chromatograms. Samples aretaken in the breathing zone of workplace personnel, and analysis is performed with an ion chromatograph(IC) equipped with a UV-vis detector and a postcolumn reagent delivery system. Hexavalent chromiummost commonly exists in the workplace as a metal (M) chromate (MCrO4), such as lead chromate, or alsoas chromium trioxide (CrO3). Common interferences noted in past methods, such as Cr (III) and Fe(II) arekept to a minimum.
1.1 History
To sample for Cr(VI) in the workplace, a 37-mm diameter, 5-µm pore size polyvinyl chloride (PVC)filter is normally used as the sampling medium. The classical method of Cr(VI) analysis forindustrial hygiene use was colorimetry using 1,5-diphenylcarbazide (DPC) for color developmentafter acid extraction of the Cr(VI) from the sample (5.1, 5.2). This method was consideredinadequate due to the insolubility of certain chromate compounds (5.3) and interferences from manyheavy metals (5.2). In addition, reducing agents, such as Fe(II), could convert the Cr(VI) to Cr(III)in the acidic extraction medium used (5.4). To avoid reduction of Cr(VI) in acidic media, alternativeswere researched. The extraction of Cr(VI) in basic solution, acidification, and subsequent analysisby colorimetry using DPC has been reported in the literature (5.3). This method took advantage ofthe fact that all soluble chromates and many of the insoluble chromates can be extracted in a basicsolution (5.3, 5.7). However, the potential still existed for positive interferences. Also, Cr(VI) couldbe converted to Cr(III) by a reducing agent such as Fe(II) in the basic medium. To minimize theseproblems, a differential pulse polarographic (DPP) method was developed (5.8) at the OSHA SaltLake Technical Center (SLTC). The buffer used for sample extraction in the DPP method, 10%Na2CO3 and 2% NaHCO3 was a modification of that suggested in Reference 5.3. This buffer wasalso used as the supporting electrolyte during analysis.
Recently, a reduction in the Permissible Exposure Limit (PEL) for Cr(VI) has been proposed byOSHA, with 0.50 µg/m3 for the Time Weighted Average (TWA) and 0.25 µg/m3 for the Action Level(AL). The differential pulse polarographic method was not sufficiently sensitive to quantitate at theproposed levels, and a new method was developed using an IC equipped with a UV-vis detector anda postcolumn reagent delivery module. To prevent interferences, the Cr(VI) ion is separated fromother analytes using an ion chromatographic column. The Cr(VI) then reacts with the DPC to forma colored derivative which is measured by the UV-vis detector at 540 nm. A significant increase insensitivity for Cr(VI) is noted when compared to previous methods. Initial studies, performed usingonly a hot 10% sodium carbonate 2% sodium bicarbonate solution for extraction, still demonstrateda negative interference from Fe(II) and some conversion of Cr (III) to Cr(VI). Next we evaluated themodification presented by Vitale et al. and Zatka to inhibit the oxidation of Cr(III) to Cr(VI), wherebymagnesium hydroxide was freshly precipitated in the carbonate buffer by the addition of amagnesium chloride solution (5.5, 5.6). The studies in this method showed that the addition persample of -10 mg Mg(II) in a phosphate buffer to the 10% sodium carbonate 2% sodiumbicarbonate solution greatly decreased the negative interference of the Fe(II) and positiveinterference of the Cr(III).
1.2 PrincipleHexavalent chromium is collected on a 37-mm diameter PVC filter. Any compound existing in theCr(VI) valence state is extracted from the PVC filter using a hot aqueous solution containing 10%sodium carbonate (Na2CO3), 2% sodium bicarbonate (NaHCO3), and the phosphatebuffer/magnesium sulfate mixture. The reaction between any chromate species and carbonate isillustrated by the following equation (5.3):
MCrO4 + CO32- ———› MCO3 + CrO4
2-
Where M = metals (e.g., lead, zinc, cadmium, sodium, potassium, calcium, etc.)In the presence of a large excess of carbonate, the equilibrium is shifted quantitatively to the right.Any chromate compounds (soluble and insoluble) contained in the sample are converted to theircorresponding soluble carbonates. Interferences are minimized by the addition of the magnesium.

T-ID215-FV-01-9806-M3 of 31
After dilution, an aliquot of this extract is analyzed for Cr(VI) with an IC equipped with a postcolumnreagent delivery module and a UV-vis detector at 540-nm wavelength. Any Cr(VI) in a spray-paintsample on the filter is extracted additionally with a hot 5% NaOH/7.5% Na2CO3 extraction solutionwith the mixture of phosphate buffer/Mg(II) (see Section 3.5.7). Using a well-buffered ammoniumsulfate [(NH4)2SO4] and ammonium hydroxide (NH4OH) eluent, Cr(VI) is chromatographed as theyellow divalent CrO4
2- anion on the separator column. After the separation, Cr(VI) reacts with thereagent DPC to form a colored complex ion. The reaction is apparently the simultaneous oxidationof DPC to diphenylcarbazone and reduction of Cr(VI) to Cr(III). The actual structure of the chelateis not known, but the reaction is quantitative and the visible absorbance can be detected using aphotometric detector at 540 nm (5.12). Although DPC, as previously stated, has the potentialproblem of reacting with other species, the addition of the chromatographic separation stepminimizes any potential for interferences.
1.3 Advantages and Disadvantages
1.3.1 This method has adequate sensitivity for determining compliance with the proposed OSHATWA and AL PELs for Cr(VI) exposure.
1.3.2 The method is simple, rapid, and easily automated.
1.3.3 The method is specific and can determine Cr(VI) in the presence of Cr(III). Most heavymetals, such as vanadium, copper, iron (III), and molybdenum, do not significantlyinterfere. Fe(II) appears to cause a negative interference during sampling and storage (seeSections 1.5 and 4.4 for further information).
1.3.4 By using alkaline extraction conditions (pH = 10 to 11) in which Cr(VI) is more stable,sample recovery is improved by preventing Cr(VI) losses which may occur in a more acidicextraction media. Both water soluble and insoluble Cr(VI) compounds are soluble in thealkaline (carbonate/ bicarbonate/Mg(II)/phosphate) buffer. The extraction mediumspecified in this method minimizes the possible interferences.
1.3.5 Extraction and preparation of samples for analyses involve simple procedures andequipment.
1.3.6 If necessary, the amount of Cr(VI) can also be analyzed and confirmed by differential pulsepolarography (DPP), provided samples and standards are matrix-matched. This DPPtechnique is described in reference 5.8.
1.3.7. A disadvantage is the extraction solution and sulfuric acid used are very caustic. Theextraction solution may also limit the column life and type of instrumentation used. Themodule used in this method is equipped with a reagent reservoir, a mixing tee/reaction coilsystem, and a post-column pneumatic controller. A Dionex membrane reactor was usedduring early stages of validation of this method. The mixing tee and reaction coil used insubsequent studies was found more suitable because the Dionex membrane reactorrequired: a) frequent maintenance; b) additional dilution of sample standards to minimizematrix effects from the extraction solution (resulting in a corresponding decrease insensitivity); and c) greater expense. The mixing tee and reaction coil only require a 1:1dilution prior to analysis.
1.4 Method Performance
A synopsis of the method performance is presented below. Further information can be found inSection 4.
1.4.1 This method was validated using soluble and insoluble chromate compounds. Thecompounds used were potassium dichromate and lead chromate for soluble and insolublechromate, respectively. The significant availability and industrial use of potassiumdichromate indicated it was a good choice to represent the chemical characteristics of the

T-ID215-FV-01-9806-M4 of 31
soluble chromates for this evaluation. Solubility product values indicated that leadchromate was the least soluble of the chromate compounds commonly found in industry,therefore it was chosen to represent the insoluble chromate. Filter samples were spikedwith about 0.11 to 0.40 µg [as Cr(VI)]. Using an 960-L air volume, these spiked sampleswould give an approximate concentration range of 0.115 to 0.417 µg/m3 as Cr(VI). Thismethod has the sensitivity necessary to determine compliance with the proposed regulatorylimits.
1.4.2 The qualitative detection limit was 0.001 µg as Cr(VI) when using a 10-mL solution volume.This corresponds to 1.0 × 10⁻³ µg/m3 as Cr(VI) for a 960-L air volume.
1.4.3 The quantitative detection limit was 0.003 µg as Cr(VI) when using a 10-mL solutionvolume. This corresponds to 3.0 × 10⁻³ µg/m3 as Cr(VI) for a 960-L air volume. A 100-µLsample loop and a detector setting of 0.5 absorbance unit (AU) full-scale output were usedfor both qualitative and quantitative detection limits.
1.4.4 The sensitivity of the analytical method, when using the instrumental parameters listed inSection 3.6., was calculated from the slope of a linear working range curve [0.5 to 1,000ng/mL Cr(VI)]. The sensitivity was 2.47 × 10⁴ area units per 1 ng/mL, when using a DionexSeries 4500i ion chromatograph with AI450 computer software (Dionex, Sunnyvale, CA).The sensitivity was 1.57 × 10⁴ area units per 1 ng/mL, when using a Dionex DX500 ionchromatograph with a 10 mm cell and a 150 µL sample loop (Dionex, Sunnyvale, CA).The sensitivity of this method was significantly better than OSHA Method No. ID-103 forCr(VI) (5.8).
1.4.5 The total pooled coefficients of variation (CV1), bias, and total overall error (OE) are asfollows:
For soluble chromate: CV1 (pooled) = 0.054; bias = + 0.007; OET = ±11.5%
For insoluble chromate: CV1 (pooled) = 0.064; bias = - 0.014; OET = ±14.2%
For both types of chromate compounds (pooled soluble and insoluble):CV1 (pooled) = 0.059; bias = - 0.004; OET = ±12.9%
1.4.6 The collection efficiency of 0.945 ± 0.035 has been previous determined for chromic acidmist collected on PVC filters (5.11).
1.4.7 Quality control (QC) samples were prepared as single blind samples by spiking aqueoussolutions of potassium dichromate on PVC filters. Amounts spiked ranged from 10 to 20µg. Results of samples analyzed from 1982-89 using the DPP technique, and samplesanalyzed using this method (IC/UV-vis) are shown below. All samples were analyzed alongwith other field (compliance) samples. The following results were obtained:
Method UsedDPP* IC/UV-vis
Samples (N): 282 57Average recovery: 94.1% 94.8%CV1(pooled): 0.10 0.054*DPP data obtained from reference 5.12.
1.4.8 Samples can be stored at ambient (20 to 25 °C) temperature on a lab bench for a periodof at least 30 days. The mean sample recovery after 30 days of storage was within ±5%of the recovery at Day 0.

T-ID215-FV-01-9806-M5 of 31
1.5 Interferences
1.5.1 Reducing species such as Cr(III), V(III), and Cu(I), etc. in ten-fold excess over Cr(VI) didnot produce a significant interference with this method. However, when Fe(II) was addedin a slightly acidic environment, and the samples were extracted with the BE solution, thefollowing losses occurred: 10% for a loading of Fe(II):Cr(VI) of 1:1, 30% when 5:1, 70%when 10:1, and 3% for 10:1 with the addition of the Mg(II) and phosphate buffer beforeextraction with BE solution. The effects of this negative interference are further detailedin Section 4.4. The samples were extracted with the buffer extraction (BE) solution only.These losses were significantly reduced by the addition of magnesium sulfate -10 mg/mLas Mg (II), in a phosphate buffer to the BE solution, such that a 1:10 ratio of Cr(VI):Fe(II)had an average recovery of 96.6% (see Section 4.4.6). Loss in basic solutions appearedto be independent of Cr(VI)/Fe(II) ratio.
1.5.2 A positive interference can be any substance that has the same retention time as Cr(VI),and absorbs light at 540 nm wavelength when using the ion chromatographic operatingconditions described in this method. Changing the chromatographic separation conditions(detector settings, column, eluent flow rate, and strength, etc.) may minimize theinterference. None of the more common metallic species coexisting with Cr(VI) in theworkplace and potentially soluble in the extraction solution were found to positively interferewhen using the analytical conditions described in this method. A positive interference fromCr (III) can occur when extracted with BE or a more strongly basic extraction solution forspray paint samples (SPE) alone; however, the addition of the phosphate buffer/Mg(II)solution to the extraction process minimizes this positive interference. For samples havingCr(III) levels of 1 µg/mL, the positive interference changed from <1% for BE to <0.02% forBE with phosphate buffer/Mg(II). For SPE samples containing 10 µg/mL Cr(III), the positiveinterference changed from <0.2% for SPE to <0.03% for SPE with phosphate buffer/Mg(II)(see Sections 4.4.1, 4.4.3, and 4.4.4).
1.6 Uses
The principal commercial Cr(VI) compounds are chromium trioxide (chromic acid anhydride), andthe chromates and dichromates of sodium, potassium, ammonium, calcium, barium, zinc, strontium,and lead. They are used as oxidizing agents in tanning, photography, dyeing, and electroplating,and as rust inhibitors and pigments.
1.7 Physical and Chemical Properties of Certain Chromates (5.15)

T-ID215-FV-01-9806-M6 of 31
Chromium (VI)trioxide
Potassiumchromate
Lead chromate Zinc chromate Potassiumdichromate
CAS No. 1333-82-0 7789-00-6 7758-97-6 13530-65-9 7778-50-9
Synonyms
Chromic acid,chromic
anhydride;Chromia; Chromic
trioxide
Chromic acid,dipotassium salt;
Dipotassiummonochromate
Chromic acid, leadsalt; Crocoite;
Phoenicochroite;Plumbouschromate
Chromic acid, zincsalt; Zinc
tetraoxychromate;Zinc chromium
oxide
Potassiumbichromate; red
potassiumchromate
DescriptionDark, purple-red
crystalsRhombic, yellow
crystalsYellow crystals Lemon-yellow
prismsYellow-red
crystals
Formula CrO3 K2CrO4 PbCrO4 ZnCrO4* K2Cr2O7
Constants and
Solubility
Mol wt: 100.01mp: 196°C
d: 2.70Very sol in water
(625 g/L at 20°C), insol in
alcohol.
Mol wt: 194.20 mp: 971°C
d: 2.732 at 18°CSol in water(1,020 g/L at
100°C), insol inalcohol.
Mol wt: 323.22 mp:844°C
bp: decomposes d: 6.3
Very slightly sol inwater (0.058 mg/L
at 25°C), sol instrong acids and
alkalies.
Mol wt: 181.4mp: not available
d: 3.40Slightly sol in
water, sol in acids.
Mol wt:294.2 mp:396°C
decomposition pt:500°C
d: 2.676Sol in water(1.020g/L @
100°C) insol inalcohol
Fire andexplosion
hazard
Dangerous: avery powerfuloxidizing agent. Incontact withorganic matter orreducing agentsin general it cancause violentreactions. Uponintimate contactwith powerfulreducing agents itcan cause violentexplosions.
Moderate, bychemical reaction;a powerful oxidizer.
Moderate, bychemical reaction.
Moderate, bychemical reaction.
Moderate, bychemical reaction
*Molecular formula was 4ZnOACrO 3A3H 2O, and confirmed in-house by X-ray diffraction.
1.8 Toxicology (5.16)
Information listed within this section is a synopsis of current knowledge of the physiological effects of chromicacid and chromates and is not intended to be used as a basis for OSHA policy.
1.8.1 Chromic acid and its salts have a corrosive action on the skin and mucous membranes.The characteristic lesion is a deep, penetrating ulcer, which, for the most part, does nottend to suppurate, and is slow in healing. Lesions are confined to the exposed area, andthe skin of the nasal septum is a common site.
1.8.2 Breathing in high levels (greater than 2 µg/m3) of Cr(VI) can cause irritation to the nasalpassage, such as runny nose, sneezing, itching, nosebleeds, ulcers, and holes in the nasalseptum. These effects have primarily occurred in factory workers who have produced orused Cr(VI) for several months to many years. Long-term exposure to Cr(VI) has beenassociated with lung cancer in workers exposed to high levels of Cr(VI) in workplace air.
1.8.3 Workers handling liquids or solids containing Cr(VI) compounds have developed skinulcers.
1.8.4 Certain Cr(VI) compounds (calcium chromate, chromium trioxide, lead chromate, sodiumdichromate, strontium chromate, and zinc chromate) are known animal and/or humancarcinogens. The International Agency for Research on Cancer (IARC) has determinedthat Cr(VI) is carcinogenic to humans (Group 1), based on sufficient evidence in humans

T-ID215-FV-01-9806-M7 of 31
for the carcinogenicity of Cr(VI) compounds as found in chromate production, chromatepigment production, and chromium plating industries (5.17). IARC's determination is alsobased on sufficient evidence in experimental animals for the carcinogenicity of calciumchromate, zinc chromate, strontium chromate, and lead chromate; and limited evidencein experimental animals for the carcinogenicity of chromic acid and sodium dichromate.
2. Sampling (See Interferences, Section 1.5 before sampling.)
Note: Bulk samples can be collected and analyzed. Filters or wipe samples collected on cellulose orcellulose esters are unacceptable due to the instability of Cr(VI) on these media.
Filter media used to validate this chromate method and to prepare QC samples are the PVC filtersmanufactured by MSA Inc. and Omega Special Instrument Co. as specified below. The GelmanGLA-5000 was also evaluated for extraction and storage and found acceptable. If a PVC filter froma different manufacturer is used, it will be necessary to at least evaluate the extraction efficiency andthe storage, as it has been reported that there are interferences on some types of PVC filters whichgreatly reduce the hexavalent chromium to trivalent chromium.
2.1 Equipment
2.1.1 Calibrated personal sampling pumps capable of sampling within ±5% of the recommendedflow rate of 2 L/min.
2.1.2 Tygon or other flexible tubing for connecting to pumps.
2.1.3 Plastic end plugs.
2.1.4 Sample assembly:a) Filter holder consisting of a two-piece polystyrene cassette, 37-mm diameter.b) Backup pad, 37-mm, cellulose.c) Membrane filter, PVC, 37-mm, 5-µm pore size [part no. 625413, Mine Safety
Appliances (MSA), Pittsburgh, PA; or cat. no. P-503700, Omega Specialty InstrumentCo., Chelmsford, MA].
d) Gel bands (Omega Specialty Instrument Co., Chelmsford, MA) for sealing cassettes.e) Forceps, Teflon coated.
2.1.5 Stopwatch and bubble tube or meter for pump calibration.
2.1.6 Scintillation vials (for wipe or bulk samples), 20-mL, part no. 74515 or 58515, (Kimble, Div.of Owen-Illinois Inc., Toledo, OH) with polypropylene or Teflon cap liners.
2.2 Sampling Procedure - Air Samples
2.2.1 Place a PVC filter and a cellulose backup pad in each two-piece cassette. Compress thecassette and then seal each cassette with a gel band. The atmosphere being sampledshould pass through the PVC filter first.
2.2.2 Calibrate each personal sampling pump with a prepared cassette in-line to approximately2 L/min flow rate.
2.2.3 Attach prepared cassettes to calibrated sampling pumps (the backup pad should face thepump) using appropriate lengths of tubing. Place each cassette within the breathing zoneon each employee as appropriate. If possible, collect each sample for a full work shift(approximately 960-L air volume).

T-ID215-FV-01-9806-M8 of 31
2.2.4 If the filter becomes overloaded while sampling, consecutive samples using shortersampling periods should be taken.
2.2.5 After sampling, place plastic end caps tightly on both ends of the cassette and apply OSHAForm 21 seals in such a way as to secure the end caps. Record the sampling conditionssuch as sampling time, air volume, etc. on the OSHA 91A form. (Note: It is veryimportant to record the operation sampled (i.e., spray paint, chrome plating, welding,etc.).) When other compounds are known or suspected to be present in the air, recordsuch information and transmit with the samples.
2.2.6 Use the same lots of filters and backup pads for blanks and collected samples. Handle theblank cassettes in exactly the same manner as the sample cassettes except that no air isdrawn through them. Submit at least one blank cassette for each batch of ten samples.
2.3 Sampling Procedure - Wipe Samples
Wipe samples can be taken using PVC filters as the wipe media. Wear clean, impervious,disposable gloves when taking each wipe sample. If possible, carefully wipe a surface areacovering 100 cm2. Carefully fold the wipe sample with the exposed side in and then transfer intoa 20-mL scintillation vial.
2.4 Sampling Procedure - Bulk Samples
If bulk samples are necessary, collect the bulk samples using a grab sampling technique suitablefor the particular material(s) in use. If possible, transfer any bulk samples into 20-mL scintillationvials.
2.5 Shipment
2.5.1 Immediately send the samples to the laboratory with the OSHA 91A paperwork requestinghexavalent chromium [Cr(VI)] analysis.
2.5.2 Ship any bulk samples separately from air samples. Enclose Material Safety Data Sheetsif available. Check current shipping restrictions and ship to the laboratory by theappropriate method and proper labeling.
3. Analysis
3.1 Safety Precautions
3.1.1 Refer to appropriate IC instrument manuals, UV-vis detector maintenance manual, and anyStandard Operating Procedures (SOP) for proper instrument operation (5.19).
3.1.2 Observe laboratory safety regulations and practices.
3.1.3 Certain chromate compounds have been identified as carcinogens (5.16, 5.17). Careshould be exercised when handling these compounds.
3.1.4 Some chemicals are corrosive. Use appropriate personal protective equipment such assafety glasses, goggles, face shields, gloves, and lab coat when handling corrosivechemicals.
3.1.5 The buffer/extraction (BE) and spray-paint extraction (SPE) solutions are basic andsomewhat corrosive. Clean up any spills immediately. Store these solutions inpolyethylene bottles. If the solutions are stored in glass, precipitated salts readily form overtime from evaporation and will cause glass stoppers to seize. The strongly basic solutionswill also attack the glass walls of the containers. Samples placed in glass volumetric flasks

T-ID215-FV-01-9806-M9 of 31
should be analyzed, properly disposed of, and the flasks rinsed and washed as soon aspossible after analysis is completed and results are reported.
3.2 Equipment
3.2.1 Ion chromatograph (Model 4000i, 4500i, or DX500 Dionex, Sunnyvale, CA) equipped witha UV/vis detector and a postcolumn reagent delivery system containing a pressurizedreagent reservoir with a 1-L polyethylene bottle, a post column pneumatic controller, anda mixing tee and reaction coil (Note: A membrane reactor module can be used in place ofa mixing tee and reaction coil; however, extra maintenance is required, and depending onthe module, additional dilution of the sample prior to analysis may be necessary.).
3.2.2 Hot plate and exhaust hood.
3.2.3 For extraction of air samples, use Phillips beakers, borosilicate, 125-mL, with watch glasscovers, or Erlenmeyer flasks, 50-mL. It is recommended that the beakers or flasks usedfor extraction of bulks be of a larger size (250 mL has been used) than the beakers orflasks used for air samples, to help prevent contamination of air samples from improperlycleaned glassware which may have contained high levels of Cr (VI). Glassware whichshould not be used for sample analysis of chromate compounds are those:
1) previously cleaned with chromic acid cleaning solution,2) previously used for storage of Cr(VI) stock standard solutions, and3) previously used for storage of bulks containing high concentrations of Cr(VI).
3.2.4 Teflon-coated magnetic stirring bar and stirrer, or ultrasonicator.
3.2.5 Micro-analytical balance (0.01 mg).
3.2.6 Polyethylene bottles, 100-mL to 1-L size with caps with plastic liners.
3.2.7 Calibrated micro-pipettes or pipets, volumetric flasks, beakers, and general laboratoryglassware. The calibration on the micro-pipettes should be checked before each use.Alternately serial dilutions may be made using volumetric pipets.
3.2.8 Automatic sampler (Dionex Model AS-1) and sample vials (0.5 mL) with filter caps.
3.2.9 Laboratory automation system: Ion chromatograph interfaced with a data reduction system(AI450, Dionex).
3.2.10 Separator and guard columns, anion (Model IonPac-AS7 and IonPac-NG1, Dionex).
3.2.11 Syringe prefilters, 0.5-µm pore size (part no. SLSR 025 NS, Millipore Corp., Bedford, MA).
Note: Some syringe prefilters are not cation- or anion-free. Tests should be performed with blank solutionsfirst to determine contamination and suitability with the analyte.
3.2.12 Scintillation vials, glass, 20-mL.
3.2.13 Equipment for eluent degassing (vacuum pump, ultrasonic bath).
3.2.14 Optional: Centrifuge for spinning down precipitate in samples.
3.3 Reagents - All chemicals should be at least reagent grade. Consult latest material safety datasheets (MSDS) for cautions and proper handling.

T-ID215-FV-01-9806-M10 of 31
3.3.1 Principal reagents:
Sodium carbonate (Na2CO3), 99%Sodium bicarbonate (NaHCO3), 99%Potassium dichromate (K2Cr2O7), 99.9% or Potassium chromate (K2CrO4), 99.9%Magnesium sulfate, anhydrous (MgSO4), 99%Ammonium sulfate [(NH4)2SO4], 99+%Ammonium hydroxide (NH4OH), 29%1,5-Diphenylcarbazide (DPC) - C6H5NHNHCONHNHC6H5, 99%Methanol (CH3OH), HPLC gradeSulfuric acid (H2SO4), concentrated (98%)Nitric acid (HNO3), concentrated ( 69 - 71%)Deionized water (DI H2O)
The initial studies were performed using magnesium chloride as the source of magnesium,but this formed a very fine precipitate of magnesium hydroxide. The source of magnesiumwas switched to magnesium sulfate, because the magnesium sulfate formed a larger sizedprecipitate which was easier to separate.
3.3.2 Nitric acid, 10% (v/v):
Carefully add 100 mL of concentrated HNO3 to about 500-mL DI H2O contained in a 1.0-Lvolumetric flask and dilute to the mark with DI H2O.
3.3.3 Buffer/extraction (BE) solution (10% Na2CO3 + 2% NaHCO3):
Dissolve 100 g Na2CO3 and 20 g NaHCO3 in about 500 mL DI H2O contained in a 1.0-Lvolumetric flask. A Teflon-coated magnetic stirring bar and stirrer will facilitate dissolution.Remove and rinse the stirring bar, adding the rinses to the volumetric flask, and then diluteto the mark with DI H2O. Alternately, a sonicator can be used instead of a stirring bar andstirrer. Transfer and store this solution in a tightly capped polyethylene bottle. Preparemonthly.
3.3.4 Spray-paint extraction (SPE) solution (5% NaOH + 7.5% Na2CO3):
Dissolve 50 g NaOH and 75 g Na2CO3 in about 500 mL DI H2O contained in a 1.0-Lvolumetric flask. A Teflon-coated magnetic stirring bar and stirrer will facilitate dissolution.Remove and rinse the stirring bar, adding the rinses to the volumetric flask, allow thesolution to cool to room temperature, and then dilute to the mark with DI H2O. Alternately,a sonicator can be used instead of a stirring bar and stirrer. Transfer and store thissolution in a tightly capped polyethylene bottle. Use this solution only for extraction ofsamples taken to assess exposure during spray-paint operations. Prepare monthly.
3.3.5 Magnesium sulfate solution [-10 mg/mL as Mg(II)]:
Dissolve 9.90 g of anhydrous MgSO4 in 100-mL volumetric flask containing 50 mL DI H2O.Mix well and dilute to the mark with DI H2O. Prepare monthly.
3.3.6 Phosphate buffer (0.5 M KH2PO4/0.5 M K2HPO4@ 3H2O):
Dissolve 6.80 g of KH2PO4 and 11.41 g of K2HPO4@ 3H2O in 100-mL volumetric flaskcontaining 50 mL DI H2O. Mix well and dilute to the mark with DI H2O. Prepare monthly.
3.3.7 Phosphate buffer/Mg(II) (PBM) solution:
Pipette 25 mL of the magnesium sulfate solution (Section 3.3.5) into a 100-mL beakercontaining 50 mL of phosphate buffer (Section 3.3.6). Mix well (Note: Do not dilute with DIH2O). Prepare just before each analysis.

T-ID215-FV-01-9806-M11 of 31
3.3.8 Dilute Buffer Extraction/Phosphate buffer/Mg(II) or DBE/PBM solution [for working standardpreparation (Section 3.4)]:
Pipette 50 mL of the BE solution (Section 3.3.3) into a 100-mL volumetric flask containing15 mL of PBM solution (Section 3.3.7). Mix well and dilute to the mark with DI H2O.Magnesium hydroxide will form and precipitate out of solution. Allow the precipitation tosettle for at least 60 min., or place in a centrifuge at 3,200 rpm for 10 min. Transfer the“clear” solution to a beaker. Prepare this solution just before working standard preparation.
3.3.9 Eluent [250 mM (NH4)2SO4 + 100 mM NH4OH]:
Dissolve 33 g of (NH4)2SO4 in about 500 mL of DI H2O. Add 6.5 mL of 29% NH4OH. Mixwell and dilute with DI H2O to 1.0 L in a volumetric flask. Sonicate this solution and degasunder vacuum for 5 min. Transfer the solution to the eluent container.
3.3.10 Postcolumn derivatization reagent (2.0 mM DPC + 10% CH3OH + 1N H2SO4):
1) First dissolve 0.5 g of DPC in 100 mL of HPLC grade CH3OH. 2) Add 28 mL of 98%H2SO4 to about 500 mL of DI H2O (CAUTION !!! Make additions very, very slowly, withmixing, and allow to cool.) 3) Mix solutions 1) and 2) carefully and dilute, with stirring,in an 1-L volumetric flask with DI H2O. Cool solution to room temperature (Caution: thereaction of the DPC with Cr(VI) will be incomplete if this solution is warm.) Transferthe solution to the 1-L polyethylene bottle located in the pressurized reagent reservoir. Thesolution is stable for up to 3 days but should only be prepared as it is used, 1.0 L at a time.The sensitivity of the method is dependent on the freshness of the DPC solution.
3.3.11 Cr(VI) stock standard (100 µg/mL):
Dissolve and dilute 0.2828 g of K2Cr2O7 or 0.3735 g of K2CrO4 to 1.0 L with DI H2O.Prepare this solution every three months.
3.3.12 Cr(VI) standards (10.0 and 1.0 µg/mL):
To prepare 10.0 and 1.0 µg/mL Cr(VI) standards: 1) Pipette 12.5-mL BE solution into two25-mL volumetric flasks. 2) Using a calibrated micropipette, pipette 2.5 and 0.25 mL of the100 µg/mL Cr(VI) stock standard into each of the flasks. 3) Then dilute each flask to themark with DI H2O. Prepare these solutions weekly. Alternately, volumetric pipets and 10-mL volumetric flasks may be used to prepare standards through serial dilutions.
Note: The laboratory should have an effective, independent quality control (QC) program in place and QCsamples of the analyte should be routinely analyzed along with field samples. Depending on the capabilitiesof the program, QC samples can either be generated using the collection media and chromate compoundsunder controlled conditions, or media can be spiked with the analyte (such as K2CrO4 or K2Cr2O7). If QCsamples cannot be routinely prepared and analyzed, two different standard stock solutions should always beprepared and these solutions should routinely be compared to each other. Always prepare the stocks fromtwo different sources or, as last resort, from different lots.
3.4 Working Standard Preparation - Prepare weekly.
Prepare Cr(VI) working standards in “clear” DBE/PBM solution. A suggested scheme for preparinga series of working standards using 10-mL final solution volumes and a calibrated micro-pipette isshown below, (the calibration on the micropipette should be checked on a monthly basis):

T-ID215-FV-01-9806-M12 of 31
Working Std Std Solution Aliquot DBE/PBM Added(ng/mL) (µg/mL) (µL) (mL)1.0 1.0 10.0 9.995.0 1.0 50.0 9.9510.0 1.0 100.0 9.9020.0 10.0 20.0 9.9850.0 10.0 50.0 9.95100.0 10.0 100.0 9.90200.0 100.0 20.0 9.98500.0 100.0 50.0 9.951000.0 100.0 100.0 9.90
Serial dilutions with volumetric pipets and volumetric flasks may be used instead of a micropipette.
3.5 Sample Preparation
3.5.1 Wash all glassware in hot water with detergent and rinse with tap water, 10% HNO3, andDI H2O (in that order). Caution: Under no circumstances should chromic acidcleaning solutions be used.
3.5.2 Adjust the hot plate to a temperature below the boiling point of the BE solution. A platesurface temperature near 135°C is adequate for extraction. If the hotplate cannot beadjusted to 135°C, use a hot water bath.
3.5.3 If bulk samples are submitted, weigh out a representative aliquot of each bulk on separatePVC blank filters. The bulk and PVC filters are placed in a beaker or flask. To preventpotential future contamination, a beaker or flask of larger size than the air samples shouldbe used.
3.5.4 Carefully remove each PVC filter from their cassettes or balance, place them face-downin separate 125-mL Phillips beakers (or 50-mL Erlenmeyer flask or other size of heat-resistant glassware used), add 1.5 mL of PBM solution, mix well, and finally add 5 mL ofBE solution.
Note: Always add PBM solution before adding the extraction solution. The freshly precipitated magnesiumhydroxide [10 mg of Mg(II)] formed suppresses the oxidation of dissolved Cr(III) to Cr(VI) (see Section 4.4.for details).
Swirl the beaker slowly until the white precipitate occurs. Cover the beaker with a watchglass and very slowly heat the solution on the hot plate (surface temperature near 135 °C),with occasional swirling for 60 to 90 min. Allow extra extraction time for heavily loadedsamples taken from spray-paint operations (See section 3.5.7). DO NOT ALLOW ANYSOLUTIONS TO BOIL OR EVAPORATE TO DRYNESS. Conversion of Cr(VI) to Cr(III)can occur from excess heat (5.4) causing loss of sample.
3.5.5 Allow the solutions to cool to room temperature. Quantitatively transfer each solution to a10-mL volumetric flask using DI H2O. Dilute to volume with DI H2O.
3.5.6. If the solution is cloudy and/or other metal analyses are desired, filter the solution througha syringe prefilter. Alternately, cloudy samples may be centrifuged at 3,200 rpm for 10 min.to precipitate the MgOH. Avoid transferring any of the precipitate to the autosampler vials,as it will clog the IC autosampler, tubing, and/or column frits.
3.5.7. FOR SAMPLES TAKEN FROM SPRAY-PAINTING OPERATIONS ONLY, PERFORM ANADDITIONAL EXTRACTION OF EACH FILTER CONTAINING THE PAINT RESIDUEACCORDING TO THE FOLLOWING PROCEDURE:

T-ID215-FV-01-9806-M13 of 31
Note: Evidence indicates stronger base extractions are capable of recovering Cr(VI) in specific paint matrices(5.4). Due to the resistant properties of some industrial paints, an additional extraction is used for samplescollected during spray-painting to assure complete recovery of all Cr(VI).
1) After the initial extraction with BE and PBM, the solutions are transferred to 10-mLvolumetric flasks. Place the sample beakers containing the remaining paintresidue/filters and any blanks in an exhaust hood.
2) Add 1.5 mL of PBM solution and then 5 mL of SPE solution (Section 3.3.4) to eachbeaker containing the filters. Swirl the beaker slowly until a white precipitate occurs.Cover the beaker with a watch glass and very slowly heat the solution on the hot plateat 135°C, with occasional swirling for 60 to 90 min. Allow extra extraction time forheavily loaded samples. DO NOT ALLOW ANY SOLUTIONS TO BOIL OREVAPORATE TO DRYNESS. Sample loss from the conversion of Cr(VI) to Cr(III) canoccur from excess heat (5.4). Potential conversion of Cr(III) to Cr(VI) using a stronghydroxide extraction solution has also been noted (5.4). However, the freshlyprecipitated magnesium hydroxide [10 mg of Mg(II)] formed suppresses the oxidationof dissolved Cr(III) to Cr(VI) (see Section 4.4 for details).
3) Allow the solutions to cool to room temperature. Transfer each solution to a 25-mLvolumetric flask. Dilute to volume with DI H2O. Allow the precipitate to settle, orcentrifuge to segregate the precipitate to the bottom of the sample. Alternately, cloudysamples may be filtered through a syringe prefilter. It is important that none of theprecipitate is transferred into the autosampler vials, as it can clog the IC autosampler,tubing, and/or column frits.
3.6 Analysis
3.6.1 Pipette a 0.5- to 0.6-mL “clear” portion of each standard or sample solution into separateautomatic sampler vials (Note: Be careful not to transfer any of the milky-white magnesiumhydroxide precipitate into the vials). Place a filtercap into each vial. The large filter portionof the cap should face the solution.
3.6.2 Load the automatic sampler with labeled samples, standards, and blanks.
3.6.3 Set up the ion chromatograph in accordance with the Standard Operating Procedure (SOP)(5.19). A diagram of the system flow path (adapted from Reference 5.12) is shown inFigure 1. Typical operating conditions for a Dionex 4000i, 4500i, or DX500 with a UV-visdetector and an automated sampler are listed below:
Note: An SOP is a written procedure for a specific instrument. It is suggested that SOPs be prepared foreach type of instrument used in a lab to enhance safe and effective operation.
Ion ChromatographEluent: 250 mM (NH4)2SO4 /100 mM NH4OHPostcolumn reagent: 2 mM DPC/10% CH3OH/1 N H2SO4
Column temperature: ambientAnion precolumn: IonPac NG1 Anion separator column: IonPac AS7 Output range: 0.5 absorbance unit full scale (AUFS)Detection wavelength: 540 nmSample injection loop: 100 µL (a 150 µL loop was used on the DX-500)
PumpPumppressure: -950 psiEluent flow rate: 0.7 mL/min

T-ID215-FV-01-9806-M14 of 31
A chromatogram of 100 ng/mL Cr(VI).
Postcolumn reagentflow rate: -0.34 mL/minChromatogram:
The CO2 peak is from the reaction of the bicarbonate and carbonate ions with the sulfuricacid in the post column derivatization mixture. The size of the CO2 peak can be changedor eliminated by the amount of back pressure on the waste line coming from the detector.
Run time: 11 minPeak retention time: -8 min for Cr(VI) (Please note that peak retention times are
highly dependent on and individualized to the instrument in useand the age of the column.)

T-ID215-FV-01-9806-M15 of 31
Figure 1. A diagram of the system flow path.
3.6.4 Follow the SOP for further instructions regarding analysis (5.19).
3.6.5 If any sample has a Cr(VI) concentration larger than the highest standard, dilute the sampleby taking an appropriate aliquot and add an appropriate amount of DBE/PBM solution tobring the sample concentration within the range of the standards. A dilution factor (DF) as

T-ID215-FV-01-9806-M16 of 31
Figure 2. A plot of the standard curve of the above standards.
calculated from the aliquot volume and diluent volume is used in final calculations (e.g., ifa 2 mL aliquot is taken and 8 mL of DBE/PBM is added, then a DF of 5 is used.)
3.7 Calculations
3.7.1 After the analysis is completed, retrieve the peak areas or heights. Obtain hard copies ofchromatograms from a printer.
3.7.2 Prepare a concentration-response curve by plotting the peak areas or peak heights versusthe concentration of the Cr(VI) standards in ng/mL. Peak areas are preferred. Typicalinstrumental response for working standards from 10 to 1000 ng/mL range using a DionexModel DX500 equipped with an AD20 Absorbance Detector and GP40 Gradient Pump asfollows:
LevelConcentration
ng/mLPeak Height
(× 104)Peak Area
(× 106)
1 0.500 0.005 0.015
2 1.000 0.010 0.031
3 5.000 0.051 0.152
4 10.00 0.095 0.279
5 20.00 0.190 0.545
6 50.00 0.491 1.422
7 100.0 0.980 2.803
8 200.0 1.858 5.245
9 500.0 4.522 12.363
10 1,000 9.628 24.736
3.7.3 Perform a blank correction for each PVC filter result. Subtract the ng/mL Cr(VI) blankvalue (if any) from each sample reading if blank and sample solution volumes are thesame. If a different solution volume is used, subtract the total ng blank value from eachtotal ng sample value.

T-ID215-FV-01-9806-M17 of 31
%(w / w) Cr(VI) =(A) (D) (100%)
(SW) (1000 g / mg)µ
µg / m3 A
AV====
Then calculate the air concentration of Cr(VI) (in µg/m3) for each air sample:
Where: Ab = Total ng Cr(VI) in blankAs = Total ng Cr(VI) in sampleA = ng Cr(VI) after blank correction[ng/mL Cr(VI)]b = Amount found (from calibration curve) in blank[ng/mL Cr(VI)]s = Amount found (from calibration curve) in sample(Sol Vol)b = Blank solution volume (mL) from Section 3.5.5 (normally 10 mL*)(Sol Vol)s = Sample solution volume (mL) from Section 3.5.5 (normally 10 mL*)AV = Air volume (L)DF = Dilution factor (if any, see Section 3.6.5)
= (mL Diluent + mL Aliquot)/mL Aliquot*The solution volume for each SPE sample is normally 25 mL.
3.7.4 For bulk samples, calculate the total composition (in %) of Cr(VI) in each sample using:
Where:A = µg Cr(VI) after blank correctionD = Dilution factor (if any)SW = Aliquot (in mg) of bulk taken in Section 3.5.3
3.8 Reporting Results
3.8.1 For spray-paint samples, add results obtained from the SPE residue extraction, if any, tothe initial extraction result.
3.8.2 Report air sample results to the industrial hygienist as µg/m3 Cr(VI).
3.8.3 Report wipe sample results to the industrial hygienist as total micrograms or milligrams.
3.8.4 Report bulk sample results to the industrial hygienist as approximate per cent Cr(VI).
4. Backup Data
This method has been validated using a full shift sample of 480-min taken at a flow rate of 2 L/min for a960-L air volume. The method validation was conducted near the proposed OSHA TWA PEL of 0.5 µg/m3
as Cr(VI). The sampling media used during the validation consisted of a two-section polystyrene cassettecontaining a 37-mm PVC filter and a cellulose backup pad. The 37-mm, 5-µm pore size PVC filters werepurchased from Mine Safety Appliances (MSA) (part no. 625413, Pittsburgh, PA) and from OmegaSpeciality Instrument Co. (cat. no. P-503700, Chelmsford, MA). The analytical method has been validatedusing soluble (K2Cr2O7) and insoluble (PbCrO4) chromate compounds.
The validation consisted of the following experiments and discussion:

T-ID215-FV-01-9806-M18 of 31
1) An analysis of 18 spiked (soluble chromate) samples - This set consists of 6 samples each at 0.25×,0.5×, and 1× the proposed OSHA TWA-PEL assuming 960-L air volumes, to determine bias,precision, and overall error (OE) (Note: One sample at 1× PEL was lost during analysis).
2) An analysis of 18 spiked (insoluble chromate) samples - This set consists of 6 samples each at0.25×, 0.5×, and 1× the proposed OSHA TWA-PEL assuming 960-L air volumes, to determine bias,precision, and OE.
3) An evaluation of storage stability at room temperatures (20 to 25 °C) for 24 spiked samples.
4) A determination of the qualitative and quantitative detection limits for Cr(VI).
5) An interference study using varied amounts of reducing substances and addition of Mg (II) toprevent oxidation of Cr(III) to Cr(VI).
6) A comparison of BE dilutions using concentration ratios (v:v) of 1:10, 1:8, 1:5 and 1:2.
7) An analysis of 3 sets of Cr(VI) quality control (QC) samples.
8) An evaluation of a strong extraction solution for spray-paint samples.
9) An analysis of Cr(VI) field samples using both DPP and IC/UV-vis methods.
10) A summary.
An aerosol generation system to determine sampler efficiency was unavailable; however, this method(OSHA ID-215) uses the sampling device historically used for chromate collection, which was examinedpreviously by NIOSH (5.13). All samples were analyzed using a Dionex model 4000, 4500i, or DX500 ICequipped with a postcolumn reagent delivery system and a UV-vis detector. A 100 µL sample loop wasused on the Dionex 4000 and 4500i IC, and a 150 µL loop was used on the DX500 IC. The larger 150 µLsample loop on the DX500 increased the sensitivity slightly, allowing for the lower detection limits. Allsample results were calculated from concentration-response curves and statistically examined for outliers.In addition, the analyses results were tested for homogeneity of variance. Possible outliers weredetermined using the Treatment of Outliers Test (5.21). Homogeneity of variance was determined usingBartlett's test (5.22). Statistical evaluation was conducted according to the Inorganic Methods EvaluationProtocol (5.23). The overall error (OE) (5.22) was calculated using the equation:
OEi% = ±(*biasi* + 2CVi) × 100% (at the 95% confidence level)
Where i is the respective sample pool being examined.
4.1 Spiked Sample Analysis
Samples were prepared by adding known amounts of K2Cr2O7 and PbCrO4 stock solutions to PVCfilters (also see Section 4.2 for preparation) to determine bias, precision, and OE for the analyticalportion of the method. Samples were prepared with and without the addition of phosphatebuffer/Mg(II) to evaluate any difference in recoveries. The lower concentration, 0.25× and 0.5×TWA PEL were used for this comparison.
4.1.1 Procedure: The PVC filters were spiked using a 25-µL syringe (HamiltonMicroliter/Gastight Syringe, Hamilton Co., Reno, NV). Spikes (both K2Cr2O7 and PbCrO4)were 0.11, 0.20, and 0.40 µg as Cr(VI). These levels correspond approximately to 0.25,0.5, and 1× the proposed OSHA TWA PEL for a 960-L air sample collected at a 2-L/minflow rate.
4.1.2 Results: Recoveries are presented in Tables 1a, 1b, and 1c. As shown, including additionof phosphate buffer/Mg(II) in Table 1c, the mean recovery for all levels tested is very close

T-ID215-FV-01-9806-M19 of 31
to 1.0 for both soluble and insoluble chromate compounds. No DE corrections arenecessary for Cr(VI) collection using PVC filters.
Table 1aCr(VI) Analysis
Analytical Recovery Using K2Cr2O7 Spikes
Level N MeanRecovery
SD CV OET
±%
0.25 × PEL 6 1.047 0.061 0.058 16.3
0.5 × PEL 6 1.002 0.061 0.061 12.4
1 × PEL 5* 0.966 0.035 0.037 10.9
All Levels 17 1.007 0.054 11.5
*One sample was lost in analysis.
Table 1bCr(VI) Analysis
Analytical Recovery Using PbCrO4 Spikes
Level N Mean Recovery SD CV OET
±%
0.25 × PEL 6 1.019 0.079 0.078 17.5
0.5 × PEL 6 0.970 0.021 0.021 7.2
1 × PEL 6 0.969 0.074 0.076 18.3
All Levels 18 0.986 0.064** 14.2
**= CV1 (pooled)
Table 1cCr(VI) Analysis
Analytical Recovery Using K2Cr2O7 Spikes After adding Phosphate Buffer/Mg(II)
Level N Mean Recovery SD CV OET
±%
0.25 × PEL 6 1.000 0.112 0.112 22.4
0.5 × PEL 7 0.985 0.007 0.008 3.1
WhereN = Number of Samples; SD = Standard DerivationCV = Coef. of Variation; OET = Overall Error (Total)
4.2. Storage Stability
Procedure: Twenty-four samples were spiked to evaluate stability prior to sample analysis. APbCrO4 stock solution was used to spike samples near 0.5 × the proposed OSHA TWA PEL [asCr(VI)] for a 960-L sample and to demonstrate stability for insoluble chromates. Data from theSLTC Quality Control Division indicates that spiked samples prepared using soluble potassiumdichromate at concentrations specified in Section 1.4.7 were stable at least one month after spiking. Solubility product values indicated that lead chromate was the least soluble of the chromatecompounds commonly found in industry. However, data was not available for insoluble samplesprepared in the extraction media. The PbCrO4 was weighed out, extracted into solution using BEand then spiked onto PVC filters. After spiking, all samples (sealed cassettes containing PVCfilters) were stored under normal laboratory conditions (20 to 25°C) in a lab drawer. Six sampleswere initially extracted and analyzed, then six samples were extracted and analyzed after variousperiods of storage (5, 15, and 30 days).
Another storage experiment was also conducted using prepared extraction solutions with DBE andphosphate buffer/Mg(II). This experiment was performed separately to evaluate storage after thesamples were prepared. Six samples were spiked using the soluble K2Cr2O7 stock solution at 0.25×the proposed OSHA TWA PEL [as Cr(VI)] for a 960-L sample. These separate samples wereinitially extracted and analyzed, and then the same samples were analyzed after 30 days.

T-ID215-FV-01-9806-M20 of 31
Results: As shown in Tables 2a and 2b, the results of both tests conducted at room temperatureshow the mean recovery from filter and extracted samples analyzed after 30 days was within ±5%of the recovery value at Day 0.
Table 2aStorage Stability Using Insoluble PbCrO4
0.5× PEL
Day N Mean, µg SD CV Recovery (%)
0 6 0.197 0.004 0.021 97.0
5 6 0.190 0.005 0.026 93.6
15 6 0.200 0.018 0.088 98.7
30 6 0.190 0.008 0.040 93.7
Table 2bStorage Stability Using Soluble K2Cr7O4 + DBE + Phosphate Buffer/Mg(II)
0.25× PEL
Day N Mean, µg SD CV Recovery (%)
0 6 0.120 0.013 0.11 100
30 6 0.126 0.010 0.08 105
4.3 Qualitative and Quantitative Detection Limit Study
A modification of the National Institute for Occupational Safety and Health (NIOSH) detection limitcalculation procedure (5.24, 5.25) was used to calculate detection limits.
Procedure: Ten different concentrations were used by spiking six separate PBM/DBE solutions(Section 3.3.8) with aliquots of aqueous standards prepared from K2Cr2O7 (Section 3.3.11). Allsamples were analyzed using a 100-µL sample injection loop and a UV-vis detector setting of 0.5AUFS.
Results: The spiked sample results are shown in Table 3 for qualitative and quantitative detectionlimits, respectively. The qualitative detection limit was 1 ng [as Cr(VI)] when using a 10-mL solutionvolume. This corresponds to 1.0 × 10⁻³ µg/m3 as Cr(VI) for a 960-L air volume. The quantitativedetection limit was 3 ng [as Cr(VI)] when using a 10-mL solution volume. This corresponds to 3.0× 10⁻³ µg/m3 as Cr(VI) for an 960-L air volume.
Table 3Qualitative and Quantitative Detection Limits
Cr(VI) Level (as ng/mL)
SampleNumber
0.1PA
0.2PA
0.3PA
0.4PA
0.5PA
0.6PA
0.7PA
0.8PA
0.9PA
1.0PA
123456
164417261774174214361748
478649114933499948624902
729272647319748670177039
111361114311575115761155311675
152521577215510148591453015404
176121718817412168501752816978
199701997819725213842165821638
235832319023444236672351923680
291162995629348292372928930207
313243141431402316973090831968
PA = Integrated Peak Area The blank integrated peak areas and their standard deviations (std dev) were all equal to zero.

T-ID215-FV-01-9806-M21 of 31
Figure 3. A plot of the standards to determine the detection limit.
The response of the low-level calibration samples were plotted to obtain the linear regression equation (Y= mX + b), and the predicted responses (ìi) at each X.
Using the equations: Sy = [3(ìi - Yi)2/(N - 2)]½
Q1 = (3Sy )/mQ2 = 3.33 Q1
Where: Yi = the measured responsem = analytical sensitivity or slope as calculated by linear regression Sy = the standard error of the regressionN = the number of data pointsQ1 = qualitative detection limitQ2 = quantitative detection limit
Therefore, Q1 = (3Sy )/m = 0.1 ng/mL as Cr(VI)| 1.0 ng as Cr(VI) (10-mL sample volume)| 1.0 × 10⁻³ µg/m3 as Cr(VI) (960-L air volume)
Q2 = 3.33 Q1| 3.0 × 10⁻³ µg/m3 as Cr(VI) (960-L air volume)

T-ID215-FV-01-9806-M22 of 31
Figure 4. A chromatogram of the quantitative detection limit of 0.3 ng/mLCr(VI).
It is interesting to note that the addition of phosphate buffer/Mg(II) to the solutions significantlyincreased detection limits. The qualitative and quantitative limits without addition of the Cr(III)conversion suppressor were approximately six times less than the limits stated above. In standardsabove 50 ng/mL this difference was not noted. In standards less than 50 ng/mL the differencebetween standards prepared with only BE and those with the addition of phosphate buffer/Mg(II)increases as the concentration of the standards decreases, such that the lower end of thecalibration curve becomes quadratic.
4.4 Interference Study
Six experiments to test potential interferences from various amounts of Cr(III), Fe(II), Fe(III), V(V),Mo(VI), Cu(I), and Mn(II) were conducted. These substances may coexist with Cr(VI) compoundsin some workplace atmospheres and may also interfere with the analysis of Cr(VI) (5.3). Thefollowing chemicals were used for preparing the solution spikes for this study:
Potassium dichromate, K2Cr2O7, for Cr(VI); Chromium nitrate, Cr(NO3)3@ 9H2O, for Cr(III); Ferroussulfate, FeSO4, for Fe(II); Ferric nitrate, Fe(NO3)3, for Fe(III); Vanadium pentoxide, V2O5, for V(V);Molybdenum trioxide, MoO3, for Mo(VI); Cuprous chloride, Cu2Cl2, for Cu(I); Manganous chloride,MnCl2@ 4H2O, for Mn(II); and Magnesium chloride, MgCl2, or Magnesium sulfate, MgSO4, for Mg(II).
All Cr(III) solutions were used to test how much, if any, Cr(III) converts to Cr(VI) on PVC filters orin solution. Mixtures using Mg(II) were used to determine its ability to suppress potentialinterferences. Early experiments were conducted using magnesium chloride to provide themagnesium needed to form the magnesium hydroxide precipitate with any Cr (III) present.Magnesium sulfate was also used in a comparison between the two salts in an extraction study.Both the chloride and the sulfate of magnesium gave comparable results. Magnesium sulfate isrecommended in this method because of the better, larger precipitate formation. A significantdifference between the two salts was not noted in terms of recovery, peak characteristics, orretention times. A difference was noted in that the magnesium chloride gave a precipitate that wasmore difficult to decant.
The six experiments are detailed in Sections 4.4.1 through 4.4.6 below.
4.4.1 Differing amounts of Cr(VI) and each of the interfering substances were mixed in the samevolumetric flasks and then spiked onto individual PVC filters. The concentrations of thespikes varied from 0 to 10 times the Cr(VI) concentration.
Procedure: Fifteen different potential interference mixture combinations and six samplesof each combination were prepared, extracted with BE, and analyzed after 1:1 dilution. Alarge amount (887.6 and 872 ng/mL) of Cr(VI) was used for the spikes in this Experiment(and also Experiment 3) so that any significant effect would be analytically obvious.

T-ID215-FV-01-9806-M23 of 31
Results: The recoveries for Cr(VI) with varied amounts of reducing substances are shownin Table 4a.
Table 4a - Experiment 1Interference Study - 1:1 dilution BE
Known Amount of Cr(VI) = 887.6 ng/mL
No.Mixture
CompositionRatio N
Mean,ng/mL
SD CVRecovery, %
As Cr(VI)
1 Cr(VI) only 1:0 6 887.6 26.0 0.029 100
2 Cr(VI):Cr(III) 1:10 6 911.5 23.5 0.026 103
3 Cr(VI):Fe(II) 1:10 6 258.9 8.79 0.034 29.2
4 Cr(VI):Fe(III) 1:10 6 918.5 19.5 0.021 103
5 Cr(VI):V(V) 1:10 5 915.8 29.7 0.032 103
6 Cr(VI):Mo(VI) 1:10 6 874.5 16.6 0.019 98.5
7 Cr(VI):Cu(I) 1:10 6 898.0 76.4 0.085 101
8 Cr(VI):Mn(II) 1:10 6 838.0 33.9 0.040 94.4
9 Cr(VI):Fe(II) 1:1 6 811.1 18.1 0.022 91.4
10 Cr(VI):Fe(II) 1:5 6 643.8 12.5 0.019 72.5
11 Cr(VI):Cr(III):Fe(II) 1:1:1 6 848.5 17.5 0.021 95.6
12 Cr(VI):Cr(III):Fe(II) 1:5:5 6 566.3 15.9 0.028 63.8
13 Cr(VI):Cr(III):Fe(II) 1:10:10 6 291.5 10.0 0.034 32.8
14Cr(VI):Cr(III):Fe(II):Fe(III):V(V):Mo(VI)
1:1:1:1:1:1
6 841.5 11.8 0.014 94.8
15Cr(VI):Cr(III):Fe(II):Fe(III):V(V):Mo(VI)
1:10:10:10:10:10
6 761.6 30.8 0.040 85.8
As shown above, except for the solution containing large amounts of Fe(II) over Cr(VI), therecovery range is very close to 100%. When Cr(III) was added to Fe(II) and Cr(VI) therecovery is 91%, as shown in samples in set no. 9. Cr(III) added to 1:5 Cr(VI):Fe(II) hada recovery of 64%, as shown in samples in set no. 12. Cr(III) added to 1:10 Cr(VI):Fe(II)had recovery of 33%, as shown in samples in set no. 13. These losses occurred in aslightly acidic environment [both analytes were prepared in DI H2O (pH.5.5) and containedin the same volumetric flask].
4.4.2 Once the Fe(II) interference was identified in Experiment 1, a smaller amount of Cr(VI) andFe(II) were used for Experiment 2. An additional test was performed to determineconversion of Cr(III) to Cr(VI).
Procedure: Cr(VI) was spiked onto PVC filters first, dried, and then differing amounts ofFe(II) or Cr(III) were spiked on the Cr(VI) spot, dried, and then extracted with BE, andanalyzed after 1:1 dilution.
Results: Table 4b shows the recoveries for Cr(VI) are close to 70% for 1:1, 1:5, and 1:10Cr(VI) : Fe(II). This approximately 30% loss apparently occurred while both spikes wereresiding on the filter. A very small amount of Cr(III) converting to Cr(VI) is noted in Table4b (0.71 ng/mL).

T-ID215-FV-01-9806-M24 of 31
Table 4b - Experiment 2Interference Study - 1:1 dilution BE
Known Amount of Cr(VI) =101.5 ng/mL
No.Mixture
CompositionRatio or Amount N
Mean,ng/mL
SD CVRecovery, %
As Cr(VI)
1 Cr(VI) only 101.5 ng/mL Cr(VI) 6 101.5 3.72 0.037 100
2 Cr(III) only 1.0 µg/mL Cr(III) 6 0.71* 0.36 0.50 <1*
3 Cr(VI):Fe(II) 1:1 5 72.0 4.41 0.061 70.9
4 Cr(VI):Fe(II) 1:5 5 69.2 6.66 0.096 68.2
5 Cr(VI):Fe(II) 1:10 6 69.0 5.24 0.076 68.0
*Cr(III) converted to Cr(VI)
4.4.3 The SPE solution, which contained 5% NaOH and 7.5% Na2CO3, was used as anextraction solution in Experiment 3 to evaluate the ease of converting Cr(III) to Cr(VI) in a
stronger base. The experiment was also conducted to test whether or notmagnesium (Mg) can prevent conversion of Cr(III) to Cr(VI) in SPE solutions. Thisconversion was noted in the literature (5.6) when using a NaOH/Na2CO3 extractionsimilar to SPE, but was not noted in earlier work using BE solutions (5.8), primarilybecause of the significantly higher PEL and spiking concentrations used.
Procedure: Cr(VI) was spiked onto PVC filters first, dried, and then Cr(III) was spiked onthe Cr(VI) spot, dried, and then extracted with SPE, and analyzed after 1:1 dilution.
Results: Table 4c shows adding 1 mg of Mg(II) can prevent Cr(III) converting toCr(VI). This was the same conclusion presented in Reference 5.6.
Table 4c - Experiment 3Interference Study - 1:1 dilution SPEKnown Amount of Cr(VI) =872 ng/mL
No.Mixture
CompositionRatio or Amount N
Mean,ng/mL
SD CVCr(III) Converted
to Cr(VI), %
1 Cr(VI) only 872 ng/mL Cr(VI) 4 872 16 0.018 -
2 Cr(III) only 10 µg/mL Cr(III) 4 18* 1.3 0.069 <0.2
3 Cr(VI):Cr(III) 1:10 4 880 12 0.013 <0.1
4 Cr(III) + 1 mg Mg(II) 10 µg/mL Cr(III) 4 ND - - -
5 Cr(VI):Cr(III)+ 1 mg Mg(II)
1:10 4 1055 10 0.012 <0.03
*Cr(III) converted to Cr(VI)Note: ND = 0.251 ng/mL as Cr(VI)
4.4.4 Experiment 4 was conducted to further test the effectiveness of Mg(II) with largeproportions of Cr(III) to Cr(VI) in both BE and SPE solutions. Because Cr(VI) is significantlymore toxic than Cr(III) [Note: The TWA PELs for Cr(VI) and Cr(III) are 0.50 µg/m3
(proposed) and 1 mg/m3, respectively], the concentration ratio of Cr(VI) and Cr(III) inExperiment 4 was: Cr(VI) : Cr(III) = 250 ng: 5 mg = 1: 20,000.
Procedure: Experiment 4 included 10 tests. The first 5 tests were conducted using BEsolution and the last 5 tests were conducted using SPE solution. Each sample was spikedwith 250 ng of Cr(VI) or 5 mg of Cr(III) while contained in a 50-mL Erlenmeyer flask, 10 or20 mg Mg(II), and then 5 mL BE (sample sets A through D) or SPE (sample sets A’ throughE’) solution were added. Each sample was slowly extracted for 60 min, and finally dilutedwith DI H2O to the mark of a 10-mL volumetric flask for BE and 25 mL for SPE. Thefollowing are designated set numbers for Experiment 4 (Mg added as MgSO4.):

T-ID215-FV-01-9806-M25 of 31
A: 250 ng of Cr(VI) (control samples);B: 5 mg of Cr(III) [check for conversion to Cr(VI) during extraction];C: 250 ng of Cr(VI) + 5 mg of Cr(III);D: C + 10 mg Mg(II);E: C + 20 mg Mg (II);A’: 250 ng of Cr(VI) (control samples);B’: 500 mg of Cr(III) [check for conversion to Cr(VI) during extraction];C’: 250 ng of Cr(VI) + 5 mg of Cr(III);D’: C’ + 10 mg Mg(II);E’: C’ + 20 mg Mg(II);
Results: Table 4d data suggests that the oxidation of Cr(III) occurred during the alkalineextraction process. When alkalinity was increased by using 5% NaOH, more Cr(III) wasoxidized to Cr(VI) (as shown in SPE, Samples A’ to E’). Although the conversion is smallas percentage of Cr(III), it is very significant in terms of the proposed PEL. A previous workconducted by the author (5.8) did not note the conversion in BE solutions; however, thelarger detection limit and lack of significance (the PEL of 0.05 mg/m3 was used in the pastwork) were contributing factors. The net conversion of Cr(III) to Cr(IV) is consideredextremely minor when comparing amounts to the PEL of 0.05 mg/m3. In the presence offreshly precipitated magnesium hydroxide (10 or 20 mg of Mg) the oxidation of dissolvedCr(III) was suppressed to insignificantly low levels. As shown in Table 4d, the approachwith Mg(II) is also applicable in the more strongly basic solution of SPE (5% NaOH/7.5%Na2CO3). It should be noted that the SPE extraction is performed after the BE extraction,and little, if any, soluble Cr(III) should still be present. It is important to note, for maximumeffectiveness, the magnesium salt/phosphate buffer solution is added to the sample beforeBE or SPE solutions.
Table 4d - Experiment 4 Interference Study - 1:1 dilution BE (A to D) and SPE (A’ to E’)
Known Amount of Cr(VI) = 250 ng; Cr(III) = 5 mg
Set # N ng Cr(VI) foundtheoretical = 250 ng
SD CV Cr(III) converted toCr(VI)(%)
A 6 249.57 3.98 0.016 -
B 6 128.03 7.93 0.062 0.00256
C 6 373.19* 7.74 0.021 0.00246
D 6 250.07* 5.27 0.021 -
E 6 237.82* 2.97 0.013 -
A’ 6 253.06 3.60 0.014 -
B’ 6 226.45 8.23 0.036 0.0045
C’ 6 484.79* 13.07 0.027 0.0047
D’ 6 281.43* 5.12 0.018 0.00063
E’ 6 268.18* 6.17 0.023 0.00036
*Cr(III) converted to Cr(VI) plus 250 ng Cr(VI) spike
4.4.5 Experiment 5 was conducted to repeat certain aspects of Experiment 4 and to determine theamount of Mg(II) needed to prevent Cr(III) conversion to Cr(VI) during the extraction process.
Procedure: Experiment 5 repeated the design of Experiment 4, except that Cr(VI) : Cr(III) = 500ng:5 mg = 1:10,000. The following sets used in this experiment are (Mg(II) is as MgSO4):
F: 500 ng of Cr(VI) + 5 mg of Cr(III) + 5 mg Mg(II) with BE;G: 500 ng of Cr(VI) + 5 mg of Cr(III) + 10 mg Mg(II) with BE;H: 500 ng of Cr(VI) + 5 mg of Cr(III) + 15 mg Mg(II) with BE;G’: 500 ng of Cr(VI) + 5 mg of Cr(III) + 10 mg Mg(II) with SPE;
Results: Table 4e shows that, in BE solution, the addition of 5, 10, or 15 mg of Mg(II) to a mixtureof Cr(III) and Cr(IV) gave comparable results. The slight decrease in recovery as Mg(II) increased

T-ID215-FV-01-9806-M26 of 31
appears more so as noise resulting from analyzing a very small amount (500 ng) of Cr(VI). It wasnoted that the addition of Mg(II) produces a significant precipitate of magnesium hydroxide in theextraction solution and that the more added, the larger the precipitate. This precipitate must becarefully handled when transferring solutions for analysis to prevent injection into the ionchromatograph.
Table 4e - Experiment 5 Interference Study - 1:1 dilution BE (F to H) and SPE (G’)
Known Amount of Cr(VI) = 500 ng; Cr(III) = 5 mg
Set # NMean ng as Cr(VI)
Theory=500ngSD CV
Cr(III) converted to Cr(VI), %
F 6 507.55* 2.88 0.0057 <0.01
G 6 496.59* 3.67 0.0074 -
H 6 497.35* 5.82 0.0096 -
G’ 6 508.48* 4.86 0.0096 <0.01
*Cr(III) converted to Cr(VI) plus 500 ng Cr(VI) spike.
4.4.6 Experiment 6 was performed to test whether or not adding Mg(II) or phosphate buffer (0.5M KH2PO4/0.5 M K2HPO4)/Mg(II) can also prevent the negative Fe(II) interference on Cr(VI)analysis. The phosphate buffer is thought to aid in complexing the Cr(III) (5.5).
Procedure: Experiment 6 included 2 tests. The first test was conducted using only Mg(II)spiking on Fe(II); the second test was performed using the mixture of phosphatebuffer/Mg(II) on the Fe(II). A known amount of Cr(VI) was spiked on one side of each PVCfilter and the Fe(II) spiked on the other side of each filter. The filters were allowed to dryovernight and then Mg(II) or the mixture of phosphate buffer/Mg(II) was added prior toextraction with BE solution. The following sets were used for this experiment:
I: 100 ng/mL of Cr(VI) + 1.0 µg/mL of Fe(II) + 10 mg Mg(II)(as MgCl2)J: 100 ng/mL of Cr(VI) + 1.0 µg/mL of Fe(II) + 10 mg Mg(II)(as MgCl2 mixed with
phosphate buffer).K: 100 ng/mL of Cr(VI) + 1.0 µg/mL of Fe(II) + 10 mg Mg(II) (as MgSO4 mixed with
phosphate buffer).
Results: Table 4f shows a significant increase in recovery of Cr(VI) as compared toExperiment 2 is noted when adding Mg(II) or phosphate buffer/Mg(II) mixture.
Table 4f - Experiment 6Interference Study - 1:1 dilution BE
Known Amount of Cr(VI) = 100 ng/mL
Set #Mixture
CompositionRatio N Mean, ng/mL SD CV
Recovery, %As Cr(VI)
I Cr(VI):Fe(II) 1:10 6 92.7 4.29 0.046 92.7
J Cr(VI):Fe(II) 1:10 6 96.6 3.41 0.035 96.6
K Cr(VI):Fe(II) 1:10 6 95.8 1.59 0.026 95.8
4.5 Comparison of Different DBE Solutions
Due to the strongly basic nature of the BE solution, a dilution with DI H2O needs to be performedprior to analysis. To determine the most effective dilution, the following experiment was performed.
Procedure: In order to compare the performance of this method and to potentially increase theanalytical sensitivity, different DBE solutions were used for testing. Four DBE solutions wereprepared from the original BE solution: 1) 1 to 10 dilution of original BE solution; 2) 1 to 8 dilution;3) 1 to 5 dilution; and 4) 1 to 1 dilution. A spike of 80 ng/mL Cr(VI) was added to each dilution.
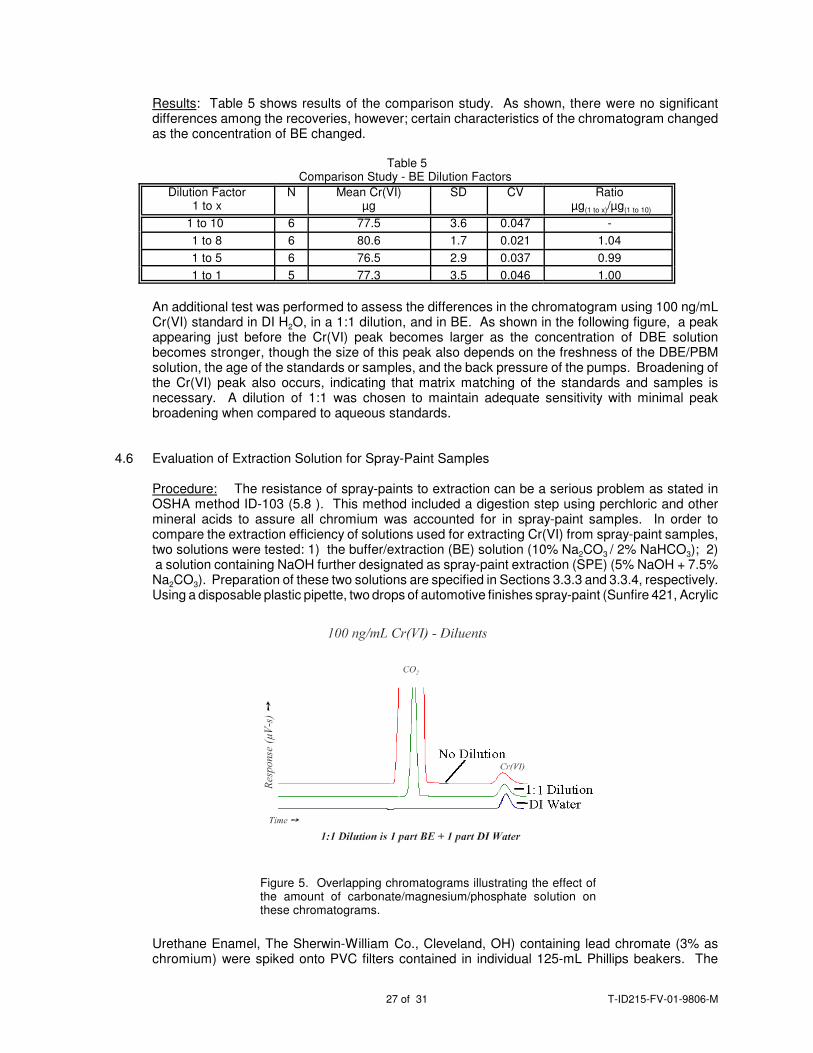
T-ID215-FV-01-9806-M27 of 31
Figure 5. Overlapping chromatograms illustrating the effect ofthe amount of carbonate/magnesium/phosphate solution onthese chromatograms.
Results: Table 5 shows results of the comparison study. As shown, there were no significantdifferences among the recoveries, however; certain characteristics of the chromatogram changedas the concentration of BE changed.
Table 5Comparison Study - BE Dilution Factors
Dilution Factor1 to x
N Mean Cr(VI) µg
SD CV Ratio µg(1 to x)/µg(1 to 10)
1 to 10 6 77.5 3.6 0.047 -
1 to 8 6 80.6 1.7 0.021 1.04
1 to 5 6 76.5 2.9 0.037 0.99
1 to 1 5 77.3 3.5 0.046 1.00
An additional test was performed to assess the differences in the chromatogram using 100 ng/mLCr(VI) standard in DI H2O, in a 1:1 dilution, and in BE. As shown in the following figure, a peakappearing just before the Cr(VI) peak becomes larger as the concentration of DBE solutionbecomes stronger, though the size of this peak also depends on the freshness of the DBE/PBMsolution, the age of the standards or samples, and the back pressure of the pumps. Broadening ofthe Cr(VI) peak also occurs, indicating that matrix matching of the standards and samples isnecessary. A dilution of 1:1 was chosen to maintain adequate sensitivity with minimal peakbroadening when compared to aqueous standards.
4.6 Evaluation of Extraction Solution for Spray-Paint Samples
Procedure: The resistance of spray-paints to extraction can be a serious problem as stated inOSHA method ID-103 (5.8 ). This method included a digestion step using perchloric and othermineral acids to assure all chromium was accounted for in spray-paint samples. In order tocompare the extraction efficiency of solutions used for extracting Cr(VI) from spray-paint samples,two solutions were tested: 1) the buffer/extraction (BE) solution (10% Na2CO3 / 2% NaHCO3); 2) a solution containing NaOH further designated as spray-paint extraction (SPE) (5% NaOH + 7.5%Na2CO3). Preparation of these two solutions are specified in Sections 3.3.3 and 3.3.4, respectively.Using a disposable plastic pipette, two drops of automotive finishes spray-paint (Sunfire 421, Acrylic
Urethane Enamel, The Sherwin-William Co., Cleveland, OH) containing lead chromate (3% aschromium) were spiked onto PVC filters contained in individual 125-mL Phillips beakers. The

T-ID215-FV-01-9806-M28 of 31
analyses followed the procedure described in Sections 3.5.1. through 3.5.7., however, due to thepossible high content of Cr(VI), 5 mL of extraction solution (BE or SPE) was added to each sample,and then after extraction, diluted to 50 mL with DI H2O. One mL of this solution was then taken anddiluted to 10 mL with DI H2O.
Results: Table 6 shows the results of a comparison of the effectiveness of these two extractionsolutions. As shown, the SPE solution is superior to the BE solution for extraction of Cr(VI) inpotentially resistant spray-paint samples.
Table 6Comparison Study - BE Solution vs. SPE Solution
ExtractionSolution
N Mean, µg SD CV Ratio, SPE/BE
BE 5 142 9.9 0.069 -
SPE 5 211 33 0.16 1.49
4.7 Comparison of Extraction with MgCl2 and MgSO4
Procedure: PVC filters were spiked with 1 µg Cr(VI) and extracted with a solution of 10 mg/mL Mg(II), in the form of either MgCl2 or MgSO4, in the phosphate buffer, and then BE solution was added.
Results: Table 7 shows that there was little difference in the extraction efficiency between the twodifferent salts of magnesium.
Table 7Comparison Study - MgCl2 vs MgSO4
Type of Mg N Mean ng Cr(VI) SD CV Recovery, %
MgCl2 6 1000 2.31 .063 100
MgSO4 6 991 1.46 .042 99.1
4.8. Analysis of Cr(VI) Quality Control (QC) Samples
Procedure: Three sets of Cr(VI) QC samples were prepared by an independent source by spiking10 to 20 µg Cr(VI) on the PVC filters. Samples were analyzed using the conditions stated in Section3 of this method.
Results: Table 8 shows the results of the QC samples, which have amounts typical of those nearor over the PEL of 0.05 mg/m3 Cr(VI). Samples with higher concentrations can be analyzed usingthis method provided higher standards are prepared to bracket the samples, or the appropriatealiquot/dilution is performed.
Table 8 Cr(VI) QC Samples
Set N Mean, F/T* SD CV Recovery, %
I 4 0.949 0.019 0.020 94.9
II 4 0.978 0.050 0.051 97.8
III 4 0.940 0.049 0.053 94.0
0.044** 95.6 ave.
*F/T = Found/Theoretical (Recovery)**CV (pooled)
4.9 Analysis of Cr(VI) Field Samples
Procedure: In order to compare the new IC/UV-vis method to the previous method, Cr(VI) samplescollected during field surveys were used. These samples had been previously analyzed by a SLTCchemist using the DPP method (OSHA method no. ID-103).

T-ID215-FV-01-9806-M29 of 31
Results: Table 9 shows the Cr(VI) results in mg/m3. The DPP results are in parenthesis forcomparison purposes. As shown, both methods are in good agreement except for a few very lowconcentrations in which the DPP method gave "none detected"results. However, for those DPP-NDsamples, the IC/UV-vis method detected the presence of Cr(VI) and was able to quantitate amounts.
Table 9 - Analysis Cr(VI) Field Samples
Sample No. Air Volume, L ng/mL, Cr(VI) µg, Cr(VI) mg/m3, Cr(VI)
01 512.0 ND ND ND (ND)
02 632.0 ND ND ND (ND)
03 602.0 ND ND ND (ND)
04 (Bl) 0 ND ND ND (ND)
05 42.5 62.9 6.29 0.1480 (0.1838)
06 (Bl) 0 ND ND ND (ND)
07 876.0 8.98 2.25 0.0026 (0.0019)
08 588.0 6.81 1.70 0.0029 (0.0017)
09 802.0 9.82 2.46 0.0031 (0.0023)
10 0 ND ND ND (ND)
11 799.2 13.3 3.33 0.0042 (0.0039)
12 797.0 8.85 2.21 0.0028 (0.0020)
13 869.5 13.9 3.49 0.0040 (0.0041)
14 827.5 19.1 4.79 0.0058 (0.0059)
15 945.6 6.84 1.71 0.0018 (0.0011)
16 930.0 4.48 1.12 0.0013 (ND)
17 882.0 17.4 4.35 0.0049 (0.0050)
18 884.1 7.84 1.96 0.0022 (0.0016)
19 887.3 6.07 1.52 0.0017 (ND)
20 276.0 ND ND ND (ND)
21 392.0 5.37 1.34 0.0034 (ND)
22 (Bl) 0 ND ND ND (ND)
23 (Wipe) 0 5.09 1.27 µg 1.27 µg (1.06 µg)
24 64.3 15.4 1.54 0.0239 (0.0247)
25 52.0 ND ND ND (ND)
26 181.7 ND ND ND (ND)
27 (Wipe) 0 6.00 1.50 µg 1.50 µg (0.85 µg)
28 (Bl) 0 ND ND ND (ND)
29 63.0 4.72 0.47 0.0075 (ND)
30 74.1 ND ND ND (ND)
31 (Bl) 0 ND ND ND (ND)
32 566.0 ND ND ND (ND)
33 658.0 ND ND ND (ND)
Note: For IC/UV-vis, ND=2.51 ng as Cr(VI). For DPP, ND=100 ng as Cr(VI) (5.6.). Both NDs are based on 10-mLsolution volume.
4.10. Summary
This analytical method has been shown to be precise and accurate when analyzing soluble andinsoluble chromate compounds (as potassium dichromate and lead chromate, respectively)commonly found in the workplace. The validation results indicate the method meets the OSHAcriteria for accuracy and precision (5.23). Performance during storage stability tests is adequate.Detection limits [as Cr(VI)] are very low when samples are taken for 8 h at 2 L/min. No significantinterferences were found from various amounts of reducing substances except for samplescontaining Fe(II). Results indicate that not only does the addition of magnesium sulfate or

T-ID215-FV-01-9806-M30 of 31
magnesium chloride prevent the conversion of Cr(III) to Cr(VI), but also can minimize the Fe(II)effect on Cr(VI) analysis.
A 1:1 dilution was used for optimal sensitivity. A peak prior to the Cr(VI) peak is noted, and slightpeak broadening occurs with this dilution; however, as long as matrix matching of standards andsamples occur, significant problems are not noted. The method demonstrates good performancein analyzing Cr(VI) QC samples and is not only in good agreement with the DPP technique (OSHAMethod No. ID-103) when analyzing Cr(VI) field samples, but is more sensitive. A new spray-paintextraction solution was also developed for better extracting Cr(VI) from spray-paint samples.
5. References
5.1 National Institute for Occupational Safety and Health: Method No. P&CAM 169, in NIOSH Manual
of Analytical Methods. 2nd ed., Vol. 1 (DHEW/NIOSH Pub. No. 77-157-A). Cincinnati, OH: NationalInstitute for Occupational Safety and Health, 1977.
5.2 National Institute for Occupational Safety and Health: Method No. S317, in NIOSH Manual of
Analytical Methods. 2nd ed., Vol. 3 (DHEW/NIOSH Pub. No. 77-157-C). Cincinnati, OH: NationalInstitute for Occupational Safety and Health, 1977.
5.3 Thomsen, E. and R.M. Stern: A Simple Analytical Technique for the Determination of HexavalentChromium in Welding Fumes and Other Complex Matrices. Scand. J. of Work, Environ. and Health5:386-403 (1979).
5.4 Molina, D. and M.T. Abell: An Ion Chromatographic Method for Insoluble Chromates in PaintAerosol. Am. Ind. Hyg. Assoc. J. 48:830-835 (1987).
5.5 Vitale, R.J., G.R. Mussoline, J.C. Petura, and B.R. James : Hexavalent Chromium Extractionfrom Soils. J. Environ. Qual. 23: 1249-1256 (1994).
5.6 Zatka,V.J.: Speciation of Hexavalent Chromium in Welding Fumes Interference by Air Oxidationof Chromium. Am. Ind. Hyg. Assoc. J. 46:327-331 (1985).
5.7 National Institute for Occupational Safety and Health: Method No. 7600, in NIOSH Manual of
Analytical Methods. 3rd ed. (DHHS/NIOSH Pub. No. 84-100). Cincinnati, OH: National Institute forOccupational Safety and Health, 1984.
5.8 Occupational Safety and Health Administration Salt Lake Technical Center: HexavalentChromium (USDOL/OSHA Method No. ID-103). Salt Lake City, UT, 1982, revised, 1990.
5.9 Abell, M.T. and J.R. Carlberg: A Simple Reliable Method for the Determination of AirborneHexavalent Chromium. Am. Ind. Hyg. Assoc. J. 35:229-233 (1974).
5.10 Occupational Safety and Health Administration Salt Lake Technical Center: HexavalentChromium Backup Data Report by J.C. Ku (USDOL/OSHA-SLCAL Method No. ID-103). Salt LakeCity, UT, 1982, revised 1989.
5.11 Dutkiewicz, R., J. Konczalik, and M. Przechera: Assessment of the Colorimetric Methods ofDetermination of Chromium in Air and Urine by Means of Radioisotope Techniques. Acta Pol.Pharm. 26:168-176 (1969).
5.12 Dionex Corporation: Determination of Cr(VI) in Water, Wastewater, and Solid Waste Extracts,
Technical Note 26. Sunnyvale, CA, 1990.
5.13 National Institute for Occupational Safety and Health: Backup Data Report, Chromic Acid andChromates, No. S317, in Documentation of the NIOSH Validation Tests by D. Taylor, R. Kupel, and J.

T-ID215-FV-01-9806-M31 of 31
Bryant (DHEW/NIOSH Pub. No. 77-185, NIOSH Contract CDC-99-74-45). Cincinnati, OH: NationalInstitute for Occupational Safety and Health, 1977.
5.14 Occupational Safety and Health Administration Salt Lake Technical Center: Quality ControlData - Chromate Analysis by B. Babcock. Salt Lake City, UT, 1982 - 1989.
5.15 Manufacturing Chemists Association: Properties and Essential Information for Safe Handling and Use
of Chromic Acid and Chromates. (Chemical Safety Data Sheet SD-44).Washington, D.C.: ManufacturingChemists Association, 1952.
5.16 U.S. Department of Health and Human Services: Update Toxicological Profile for Chromium TP-92/08 U.S. Dept. of Health and Human Services, Public Health Service, Agency for ToxicSubstances and Disease Registry. April, 1993.
5.17 IARC Monographs on the Evaluation of Carcinogenic Risks to Humans, Chromium, Nickeland Welding: Volume 49, International agency for Research on Cancer, Secrtariat of the WorldHealth Organization: UK, 1990, ISBN 92 832 1249 5.
5.18 Harper, M.: SKC Inc., Information regarding using the GLA-5000 filters to collect chromatesamples, personal communication, 1995.
5.19 Occupational Safety and Health Administration Salt Lake Technical Center: Ion Chromatography
Standard Operating Procedure (Ion Chromatographic Committee). Salt Lake City, UT. In progress.
5.20 National Institute for Occupational Safety and Health: Criteria for a Recommended Standard -Occupational Exposure to Cr(VI) (DHEW/NIOSH Pub. No. 76-129). Cincinnati, OH: NationalInstitute for Occupational Safety and Health, 1975.
5.21 Mandel, J.: Accuracy and Precision, Evaluation and Interpretation of Analytical Results, TheTreatment of Outliers. In Treatise On Analytical Chemistry. 2nd ed., Vol. 1, edited by I. M. Kolthoffand P. J. Elving. New York: John Wiley and Sons, 1978. pp. 282-285.
5.22 National Institute for Occupational Safety and Health: Documentation of the NIOSH ValidationTests by D. Taylor, R. Kupel, and J. Bryant (DHEW/NIOSH Pub. No. 77-185, NIOSH Contract CDC-99-74-45). Cincinnati, OH: National Institute for Occupational Safety and Health, 1977. pp. 1-12.
5.23 Occupational Safety and Health Administration Salt Lake Technical Center: EvaluationGuidelines of the Inorganic Methods Branch. In OSHA Analytical Methods Manual. 2nd ed. Cincinnati,OH: American Conference of Governmental Industrial Hygienists, 1991. pp. 1-18.
5.24 Burkart, J.A.: General Procedures for Limit of Detection Calculations in the Industrial HygieneChemistry Laboratory. Appl. Ind. Hyg. 1:153-155 (1986).
5.25 National Institute for Occupational Safety and Health: Standard Operating Procedures forIndustrial Hygiene Sampling and Chemical Analysis (SOP 018) Cincinnati, OH: National Institutefor Occupational Safety and Health, Revised Sept., 1992.


![WELCOME [atthebelvedere.co.uk] · Road ant Road ant Road Civic Centre Crescent Road Holy Tinity r Church Calverley Grounds Rail Station West aerial view - prior to demolition](https://static.fdocuments.net/doc/165x107/5ac474b97f8b9ae06c8d3f31/welcome-road-ant-road-ant-road-civic-centre-crescent-road-holy-tinity-r-church.jpg)


