
Amoxicillin duration and dose for community-acquired ...
104
Journals Library DOI 10.3310/hta25600 Amoxicillin duration and dose for community-acquired pneumonia in children: the CAP-IT factorial non-inferiority RCT Sam Barratt, Julia A Bielicki, David Dunn, Saul N Faust, Adam Finn, Lynda Harper, Pauline Jackson, Mark D Lyttle, Colin VE Powell, Louise Rogers, Damian Roland, Wolfgang Stöhr, Kate Sturgeon, Elia Vitale, Mandy Wan, Diana M Gibb and Mike Sharland on behalf of the CAP-IT Trial Team and the PERUKI and GAPRUKI Networks Health Technology Assessment Volume 25 • Issue 60 • November 2021 ISSN 1366-5278
Transcript of Amoxicillin duration and dose for community-acquired ...

Journals Library
DOI 10.3310/hta25600
Amoxicillin duration and dose for community-acquired pneumonia in children: the CAP-IT factorial non-inferiority RCT Sam Barratt, Julia A Bielicki, David Dunn, Saul N Faust, Adam Finn, Lynda Harper, Pauline Jackson, Mark D Lyttle, Colin VE Powell, Louise Rogers, Damian Roland, Wolfgang Stöhr, Kate Sturgeon, Elia Vitale, Mandy Wan, Diana M Gibb and Mike Sharland on behalf of the CAP-IT Trial Team and the PERUKI and GAPRUKI Networks
Health Technology AssessmentVolume 25 • Issue 60 • November 2021
ISSN 1366-5278

Amoxicillin duration and dose for community-acquired pneumonia in children: the CAP-ITfactorial non-inferiority RCT
Sam Barratt ,1 Julia A Bielicki ,2 David Dunn ,1
Saul N Faust ,3 Adam Finn ,4 Lynda Harper ,1†
Pauline Jackson ,5 Mark D Lyttle ,5,6
Colin VE Powell ,7,8 Louise Rogers ,9
Damian Roland ,10,11 Wolfgang Stöhr ,1
Kate Sturgeon ,1 Elia Vitale ,2 Mandy Wan ,12
Diana M Gibb 1 and Mike Sharland 2* on behalfof the CAP-IT Trial Team and the PERUKI andGAPRUKI Networks
1MRC Clinical Trials Unit, University College London, London, UK2Paediatric Infectious Diseases Research Group, Institute for Infection and Immunity,St George’s University of London, London, UK
3NIHR Southampton Clinical Research Facility and Biomedical Research Centre,University of Southampton, University Hospital Southampton NHS FoundationTrust, Southampton, UK
4Bristol Children’s Vaccine Centre, School of Population Health Sciences/School ofCellular and Molecular Medicine, University of Bristol, Bristol, UK
5Emergency Department, Bristol Royal Hospital for Children, Bristol, UK6Faculty of Health and Applied Sciences, University of the West of England, Bristol, UK7Paediatric Emergency Medicine Department, Sidra Medicine, Doha, The State of Qatar8School of Medicine, Cardiff University, Cardiff, UK9Research and Development Nursing Team, Birmingham Women’s and Children’sNHS Foundation Trust, Birmingham, UK
10Paediatric Emergency Medicine Leicester Academic (PEMLA) Group, UniversityHospitals of Leicester NHS Trust, Leicester, UK
11SAPPHIRE Group, Health Sciences, Leicester University, Leicester, UK12Evelina Pharmacy, Guy’s and St Thomas’ NHS Foundation Trust, London, UK
*Corresponding author†In memoriam
Declared competing interests of authors: David Dunn reports grants from the National Institute forHealth Research during the conduct of the study (RP-PG-1212-20006). Saul N Faust reports personalfees or grants from AstraZeneca plc (Cambridge, UK)/Medimmune (Gaithersburg, MA, USA), Sanofi SA(Paris, France), Pfizer Inc. (New York, NY, USA), Seqirus UK Ltd (Maidenhead, UK), Sandoz (Holzkirchen,Germany), Merck KGAA (Darmstadt, Germany), GlaxoSmithKline plc (Brentford, UK) and Johnson & Johnson


(Brunswick, NJ, USA) outside the submitted work. In addition, Saul N Faust received grants for contractcommercial clinical trials, which were paid to Saul N Faust’s institution (with no personal payment of anykind). Last, Saul N Faust is a member of the Health Technology Assessment Commissioning Committee(2017–22). Adam Finn reports grants from GlaxoSmithKline plc, Pfizer Inc., Novavax (Gaithersburg, MA,USA), Sanofi Pasteur (Lyon, France), VBI Vaccines Inc. (Cambridge, MA, USA), Janssen Pharmaceuticals(Beerse, Belgium), Valneva SE (Saint-Herblain, France) and JITSUVAX outside the submitted work.
Published November 2021DOI: 10.3310/hta25600
This report should be referenced as follows:
Barratt S, Bielicki JA, Dunn D, Faust SN, Finn A, Harper L, et al. Amoxicillin duration and dose
for community-acquired pneumonia in children: the CAP-IT factorial non-inferiority RCT.
Health Technol Assess 2021;25(60).
Health Technology Assessment is indexed and abstracted in Index Medicus/MEDLINE, Excerpta
Medica/EMBASE, Science Citation Index Expanded (SciSearch®) and Current Contents®/
Clinical Medicine.


Health Technology Assessment
ISSN 1366-5278 (Print)
ISSN 2046-4924 (Online)
Impact factor: 4.014
Health Technology Assessment is indexed in MEDLINE, CINAHL, EMBASE, the Cochrane Library and Clarivate AnalyticsScience Citation Index.
This journal is a member of and subscribes to the principles of the Committee on Publication Ethics (COPE)(www.publicationethics.org/).
Editorial contact: [email protected]
The full HTA archive is freely available to view online at www.journalslibrary.nihr.ac.uk/hta. Print-on-demand copies can bepurchased from the report pages of the NIHR Journals Library website: www.journalslibrary.nihr.ac.uk
Criteria for inclusion in the Health Technology Assessment journalReports are published in Health Technology Assessment (HTA) if (1) they have resulted from work for the HTA programme,and (2) they are of a sufficiently high scientific quality as assessed by the reviewers and editors.
Reviews in Health Technology Assessment are termed ‘systematic’ when the account of the search appraisal and synthesismethods (to minimise biases and random errors) would, in theory, permit the replication of the review by others.
HTA programmeHealth Technology Assessment (HTA) research is undertaken where some evidence already exists to show that a technology canbe effective and this needs to be compared to the current standard intervention to see which works best. Research can evaluateany intervention used in the treatment, prevention or diagnosis of disease, provided the study outcomes lead to findings thathave the potential to be of direct benefit to NHS patients. Technologies in this context mean any method used to promotehealth; prevent and treat disease; and improve rehabilitation or long-term care. They are not confined to new drugs and includeany intervention used in the treatment, prevention or diagnosis of disease.
The journal is indexed in NHS Evidence via its abstracts included in MEDLINE and its Technology Assessment Reports informNational Institute for Health and Care Excellence (NICE) guidance. HTA research is also an important source of evidence forNational Screening Committee (NSC) policy decisions.
This reportThe research reported in this issue of the journal was funded by the HTA programme as project number 13/88/11. Thecontractual start date was in March 2016. The draft report began editorial review in October 2020 and was accepted forpublication in June 2021. The authors have been wholly responsible for all data collection, analysis and interpretation, and forwriting up their work. The HTA editors and publisher have tried to ensure the accuracy of the authors’ report and would like tothank the reviewers for their constructive comments on the draft document. However, they do not accept liability for damagesor losses arising from material published in this report.
This report presents independent research funded by the National Institute for Health Research (NIHR). The views and opinionsexpressed by authors in this publication are those of the authors and do not necessarily reflect those of the NHS, the NIHR,NETSCC, the HTA programme or the Department of Health and Social Care. If there are verbatim quotations included in thispublication the views and opinions expressed by the interviewees are those of the interviewees and do not necessarily reflectthose of the authors, those of the NHS, the NIHR, NETSCC, the HTA programme or the Department of Health and Social Care.
Copyright © 2021 Barratt et al. This work was produced by Barratt et al. under the terms of a commissioning contract issuedby the Secretary of State for Health and Social Care. This is an Open Access publication distributed under the terms of theCreative Commons Attribution CC BY 4.0 licence, which permits unrestricted use, distribution, reproduction and adaption inany medium and for any purpose provided that it is properly attributed. See: https://creativecommons.org/licenses/by/4.0/.For attribution the title, original author(s), the publication source – NIHR Journals Library, and the DOI of the publication mustbe cited.
Published by the NIHR Journals Library (www.journalslibrary.nihr.ac.uk), produced by Prepress Projects Ltd, Perth, Scotland(www.prepress-projects.co.uk).
NIHR Journals Library Editor-in-Chief
NIHR Journals Library Editors
Professor Ken Stein Professor of Public Health, University of Exeter Medical School, UK
Professor John Powell Chair of HTA and EME Editorial Board and Editor-in-Chief of HTA and EME journals.Consultant Clinical Adviser, National Institute for Health and Care Excellence (NICE), UK, and Professor of Digital Health Care, Nuffield Department of Primary Care Health Sciences, University of Oxford, UK
Professor Andrée Le May Chair of NIHR Journals Library Editorial Group (HS&DR, PGfAR, PHR journals) and Editor-in-Chief of HS&DR, PGfAR, PHR journals
Professor Matthias Beck Professor of Management, Cork University Business School, Department of Managementand Marketing, University College Cork, Ireland
Dr Tessa Crilly Director, Crystal Blue Consulting Ltd, UK
Dr Eugenia Cronin Senior Scientific Advisor, Wessex Institute, UK
Dr Peter Davidson Consultant Advisor, Wessex Institute, University of Southampton, UK
Ms Tara Lamont Senior Scientific Adviser (Evidence Use), Wessex Institute, University of Southampton, UK
Dr Catriona McDaid Senior Research Fellow, York Trials Unit, Department of Health Sciences, University of York, UK
Professor William McGuire Professor of Child Health, Hull York Medical School, University of York, UK
Professor Geoffrey Meads Emeritus Professor of Wellbeing Research, University of Winchester, UK
Professor James Raftery Professor of Health Technology Assessment, Wessex Institute, Faculty of Medicine, University of Southampton, UK
Dr Rob Riemsma Reviews Manager, Kleijnen Systematic Reviews Ltd, UK
Professor Helen Roberts Professor of Child Health Research, UCL Great Ormond Street Institute of Child Health, UK
Professor Jonathan Ross Professor of Sexual Health and HIV, University Hospital Birmingham, UK
Professor Helen Snooks Professor of Health Services Research, Institute of Life Science, College of Medicine, Swansea University, UK
Professor Ken Stein Professor of Public Health, University of Exeter Medical School, UK
Professor Jim Thornton Professor of Obstetrics and Gynaecology, Faculty of Medicine and Health Sciences, University of Nottingham, UK
Please visit the website for a list of editors: www.journalslibrary.nihr.ac.uk/about/editors
Editorial contact: [email protected]
NIHR Journals Library www.journalslibrary.nihr.ac.uk

Abstract
Amoxicillin duration and dose for community-acquiredpneumonia in children: the CAP-IT factorialnon-inferiority RCT
Sam Barratt ,1 Julia A Bielicki ,2 David Dunn ,1 Saul N Faust ,3
Adam Finn ,4 Lynda Harper ,1† Pauline Jackson ,5 Mark D Lyttle ,5,6
Colin VE Powell ,7,8 Louise Rogers ,9 Damian Roland ,10,11
Wolfgang Stöhr ,1 Kate Sturgeon ,1 Elia Vitale ,2 Mandy Wan ,12
Diana M Gibb 1 and Mike Sharland 2* on behalf of the CAP-IT TrialTeam and the PERUKI and GAPRUKI Networks
1MRC Clinical Trials Unit, University College London, London, UK2Paediatric Infectious Diseases Research Group, Institute for Infection and Immunity, St George’sUniversity of London, London, UK
3NIHR Southampton Clinical Research Facility and Biomedical Research Centre, University ofSouthampton, University Hospital Southampton NHS Foundation Trust, Southampton, UK
4Bristol Children’s Vaccine Centre, School of Population Health Sciences/School of Cellular andMolecular Medicine, University of Bristol, Bristol, UK
5Emergency Department, Bristol Royal Hospital for Children, Bristol, UK6Faculty of Health and Applied Sciences, University of the West of England, Bristol, UK7Paediatric Emergency Medicine Department, Sidra Medicine, Doha, The State of Qatar8School of Medicine, Cardiff University, Cardiff, UK9Research and Development Nursing Team, Birmingham Women’s and Children’s NHS FoundationTrust, Birmingham, UK
10Paediatric Emergency Medicine Leicester Academic (PEMLA) Group, University Hospitals of LeicesterNHS Trust, Leicester, UK
11SAPPHIRE Group, Health Sciences, Leicester University, Leicester, UK12Evelina Pharmacy, Guy’s and St Thomas’ NHS Foundation Trust, London, UK
*Corresponding author [email protected]†In memoriam
Background: Data are limited regarding the optimal dose and duration of amoxicillin treatment forcommunity-acquired pneumonia in children.
Objectives: To determine the efficacy, safety and impact on antimicrobial resistance of shorter (3-day)and longer (7-day) treatment with amoxicillin at both a lower and a higher dose at hospital discharge inchildren with uncomplicated community-acquired pneumonia.
Design: A multicentre randomised double-blind 2 × 2 factorial non-inferiority trial in secondary care inthe UK and Ireland.
Setting: Paediatric emergency departments, paediatric assessment/observation units and inpatient wards.
Participants: Children aged > 6 months, weighing 6–24 kg, with a clinical diagnosis of community-acquiredpneumonia, in whom treatment with amoxicillin as the sole antibiotic was planned on discharge.
DOI: 10.3310/hta25600 Health Technology Assessment 2021 Vol. 25 No. 60
Copyright © 2021 Barratt et al. This work was produced by Barratt et al. under the terms of a commissioning contract issued by the Secretary of State for Health and SocialCare. This is an Open Access publication distributed under the terms of the Creative Commons Attribution CC BY 4.0 licence, which permits unrestricted use, distribution,reproduction and adaption in any medium and for any purpose provided that it is properly attributed. See: https://creativecommons.org/licenses/by/4.0/. For attribution thetitle, original author(s), the publication source – NIHR Journals Library, and the DOI of the publication must be cited.
vii

Interventions: Oral amoxicillin syrup at a dose of 35–50 mg/kg/day compared with a dose of70–90 mg/kg/day, and 3 compared with 7 days’ duration. Children were randomised simultaneouslyto each of the two factorial arms in a 1 : 1 ratio.
Main outcome measures: The primary outcome was clinically indicated systemic antibacterial treatmentprescribed for respiratory tract infection (including community-acquired pneumonia), other than trialmedication, up to 28 days after randomisation. Secondary outcomes included severity and duration ofparent/guardian-reported community-acquired pneumonia symptoms, drug-related adverse events(including thrush, skin rashes and diarrhoea), antimicrobial resistance and adherence to trial medication.
Results: A total of 824 children were recruited from 29 hospitals. Ten participants received no trialmedication and were excluded. Participants [median age 2.5 (interquartile range 1.6–2.7) years; 52%male] were randomised to either 3 (n = 413) or 7 days (n = 401) of trial medication at either lower(n = 410) or higher (n = 404) doses. There were 51 (12.5%) and 49 (12.5%) primary end points in the3- and 7-day arms, respectively (difference 0.1%, 90% confidence interval –3.8% to 3.9%) and 51 (12.6%)and 49 (12.4%) primary end points in the low- and high-dose arms, respectively (difference 0.2%, 90%confidence interval –3.7% to 4.0%), both demonstrating non-inferiority. Resolution of cough was fasterin the 7-day arm than in the 3-day arm for cough (10 days vs. 12 days) (p = 0.040), with no differencein time to resolution of other symptoms. The type and frequency of adverse events and rate ofcolonisation by penicillin-non-susceptible pneumococci were comparable between arms.
Limitations: End-of-treatment swabs were not taken, and 28-day swabs were collected in only 53% ofchildren.We focused on phenotypic penicillin resistance testing in pneumococci in the nasopharynx, whichdoes not describe the global impact on the microflora. Although 21% of children did not attend the final28-day visit, we obtained data from general practitioners for the primary end point on all but 3% of children.
Conclusions: Antibiotic retreatment, adverse events and nasopharyngeal colonisation by penicillin-non-susceptible pneumococci were similar with the higher and lower amoxicillin doses and the 3- and 7-daytreatments. Time to resolution of cough and sleep disturbance was slightly longer in children taking3 days’ amoxicillin, but time to resolution of all other symptoms was similar in both arms.
Future work: Antimicrobial resistance genotypic studies are ongoing, including whole-genomesequencing and shotgun metagenomics, to fully characterise the effect of amoxicillin dose and durationon antimicrobial resistance. The analysis of a randomised substudy comparing parental electronic andpaper diary entry is also ongoing.
Trial registration: Current Controlled Trials ISRCTN76888927, EudraCT 2016-000809-36 andCTA 00316/0246/001-0006.
Funding: This project was funded by the National Institute for Health Research (NIHR) HealthTechnology Assessment programme and will be published in full in Health Technology Assessment;Vol. 25, No. 60. See the NIHR Journals Library website for further project information.
ABSTRACT
NIHR Journals Library www.journalslibrary.nihr.ac.uk
viii

Contents
List of tables xiii
List of figures xv
List of boxes xvii
List of abbreviations xix
Plain English summary xxi
Scientific summary xxiii
Chapter 1 Introduction 1Background 1What are the current challenges in the management of childhood community-acquired pneumonia? 1What are the current management recommendations for childhood community-acquired pneumonia? 2
What are the current dose recommendations? 2What are the current duration recommendations? 2
What is the impact of antimicrobial resistance in childhood community-acquiredpneumonia? 3Trial rationale 3Objectives 4
Chapter 2 Methods 5Trial design 5Trial setting 6Participants 6
Recruitment pathways 7Inclusion criteria 7Exclusion criteria 7Changes to selection criteria 7
Interventions 8Drug substitutions and discontinuations of trial treatment 9
Trial assessments and follow-up 9Enrolment and randomisation 9Follow-up 11Data collection and handling 11
Randomisation 11Blinding 12Outcomes 12
Primary outcome 12Secondary outcomes 13
Sample size 14Statistical methods 14
Analysis principles 14Primary outcome 15
DOI: 10.3310/hta25600 Health Technology Assessment 2021 Vol. 25 No. 60
Copyright © 2021 Barratt et al. This work was produced by Barratt et al. under the terms of a commissioning contract issued by the Secretary of State for Health and SocialCare. This is an Open Access publication distributed under the terms of the Creative Commons Attribution CC BY 4.0 licence, which permits unrestricted use, distribution,reproduction and adaption in any medium and for any purpose provided that it is properly attributed. See: https://creativecommons.org/licenses/by/4.0/. For attribution thetitle, original author(s), the publication source – NIHR Journals Library, and the DOI of the publication must be cited.
ix

Sensitivity analyses 15Subgroup analyses 15Community-acquired pneumonia symptoms 15Clinical adverse events 16Antimicrobial resistance 16
Interim analyses 16Patient and public involvement 16Protocol amendments 17
Chapter 3 Results 19Participant flow 19Baseline 21
Patient characteristics 21Medical history 21Vital parameters and clinical signs 21Chest examination 23Parent/guardian-reported community-acquired pneumonia symptoms 24Clinical investigations 25Prior antibiotic exposure 26Other medical interventions in exposed group 26
Follow-up 27Adherence 29Primary outcome 31
End-Point Review Committee results 31Analysis of primary end point 33Interaction effects 33
Primary end-point sensitivity analyses 34All systemic antibacterial treatments 34Treatment events for community-acquired pneumonia/chest infection 36All treatment events for community-acquired pneumonia/chest infection 36Only treatment events started after the first 3 days (duration randomisation) 37
On-treatment analyses 37Subgroup analyses 37
Participants with severe community-acquired pneumonia 37Seasonal effect 38
Streptococcus pneumoniae carriage and resistance 39Availability of nasopharyngeal culture results 39Streptococcus pneumoniae carriage 39Streptococcus pneumoniae penicillin non-susceptibility 39Streptococcus pneumoniae amoxicillin resistance/non-susceptibility 40
Community-acquired pneumonia symptoms 40Time to resolution of community-acquired pneumonia symptoms: overall 42Time to resolution of community-acquired pneumonia symptoms: dose randomisation 42Time to resolution of community-acquired pneumonia symptoms: duration randomisation 42Sensitivity analysis for duration randomisation 43
Adverse events 43Serious adverse events 43Specified clinical adverse events (diarrhoea, thrush and skin rash) 45
Health-care services 47Daily activities and child care 48
Chapter 4 Discussion 49Limitations 49
CONTENTS
NIHR Journals Library www.journalslibrary.nihr.ac.uk
x
Generalisability 49Interpretation 50Implications 51
Chapter 5 Conclusions 53
Acknowledgements 55
References 59
Appendix 1 Details of main protocol amendment: joint analysis of paediatricemergency department and ward groups 67
Appendix 2 Community-acquired pneumonia symptoms at trial entry by strata 69
Appendix 3 On-treatment analysis of the primary end point 71
DOI: 10.3310/hta25600 Health Technology Assessment 2021 Vol. 25 No. 60
Copyright © 2021 Barratt et al. This work was produced by Barratt et al. under the terms of a commissioning contract issued by the Secretary of State for Health and SocialCare. This is an Open Access publication distributed under the terms of the Creative Commons Attribution CC BY 4.0 licence, which permits unrestricted use, distribution,reproduction and adaption in any medium and for any purpose provided that it is properly attributed. See: https://creativecommons.org/licenses/by/4.0/. For attribution thetitle, original author(s), the publication source – NIHR Journals Library, and the DOI of the publication must be cited.
xi

List of tables
TABLE 1 Weight bands used for dosing of CAP-IT IMP 8
TABLE 2 The CAP-IT assessment schedule 10
TABLE 3 Ineligible patients 19
TABLE 4 Randomisation outcomes: analysis population 20
TABLE 5 Patient characteristics 21
TABLE 6 Medical history 22
TABLE 7 Vital parameters and clinical signs at presentation by randomisation status 22
TABLE 8 Chest examination at presentation by randomisation status 23
TABLE 9 Baseline radiographic findings in participants who had chestradiography performed 25
TABLE 10 Baseline respiratory sample virology assessment results 26
TABLE 11 Prior exposure with antibiotics 27
TABLE 12 Final visit and follow-up data completeness 28
TABLE 13 Participant follow-up rate 28
TABLE 14 Parent/guardian diary completion rate 29
TABLE 15 Adherence to trial medication by randomisation arm 30
TABLE 16 Reasons for starting non-trial systemic antibacterials, as adjudicated bythe ERC 31
TABLE 17 End-Point Review Committee primary end-point adjudication results 32
TABLE 18 Abnormalities at presentation considered for subgroup analysis forsevere CAP 37
TABLE 19 Availability of nasopharyngeal culture results 39
TABLE 20 Streptococcus pneumoniae carriage 40
TABLE 21 Penicillin and amoxicillin resistance/non-susceptibility in all participantswith a culture result, either negative or positive for S. pneumoniae 41
TABLE 22 Summary of SAEs 43
TABLE 23 Serious adverse event details 44
DOI: 10.3310/hta25600 Health Technology Assessment 2021 Vol. 25 No. 60
Copyright © 2021 Barratt et al. This work was produced by Barratt et al. under the terms of a commissioning contract issued by the Secretary of State for Health and SocialCare. This is an Open Access publication distributed under the terms of the Creative Commons Attribution CC BY 4.0 licence, which permits unrestricted use, distribution,reproduction and adaption in any medium and for any purpose provided that it is properly attributed. See: https://creativecommons.org/licenses/by/4.0/. For attribution thetitle, original author(s), the publication source – NIHR Journals Library, and the DOI of the publication must be cited.
xiii

TABLE 24 Prevalence of diarrhoea, oral thrush and skin rash after baseline 46
TABLE 25 Health-care service utilisation 47
TABLE 26 Daily activities and child care 48
TABLE 27 Community-acquired pneumonia symptoms at trial entry by stratum 69
LIST OF TABLES
NIHR Journals Library www.journalslibrary.nihr.ac.uk
xiv
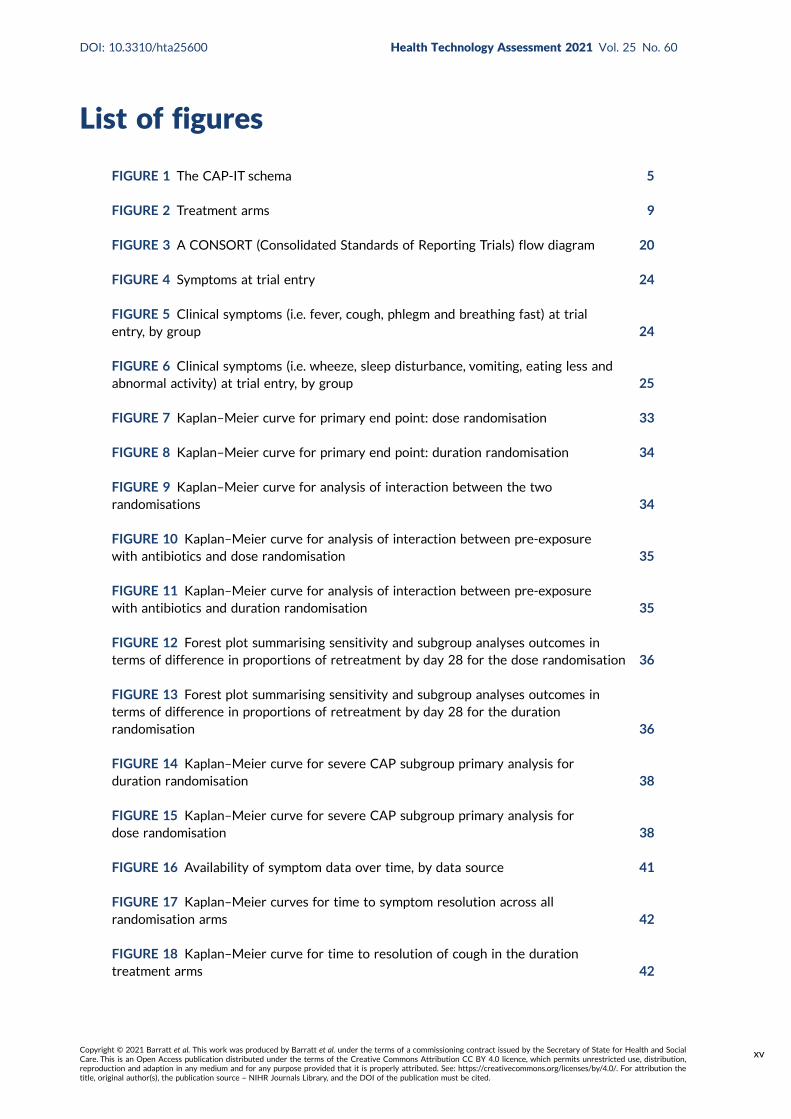
List of figures
FIGURE 1 The CAP-IT schema 5
FIGURE 2 Treatment arms 9
FIGURE 3 A CONSORT (Consolidated Standards of Reporting Trials) flow diagram 20
FIGURE 4 Symptoms at trial entry 24
FIGURE 5 Clinical symptoms (i.e. fever, cough, phlegm and breathing fast) at trialentry, by group 24
FIGURE 6 Clinical symptoms (i.e. wheeze, sleep disturbance, vomiting, eating less andabnormal activity) at trial entry, by group 25
FIGURE 7 Kaplan–Meier curve for primary end point: dose randomisation 33
FIGURE 8 Kaplan–Meier curve for primary end point: duration randomisation 34
FIGURE 9 Kaplan–Meier curve for analysis of interaction between the tworandomisations 34
FIGURE 10 Kaplan–Meier curve for analysis of interaction between pre-exposurewith antibiotics and dose randomisation 35
FIGURE 11 Kaplan–Meier curve for analysis of interaction between pre-exposurewith antibiotics and duration randomisation 35
FIGURE 12 Forest plot summarising sensitivity and subgroup analyses outcomes interms of difference in proportions of retreatment by day 28 for the dose randomisation 36
FIGURE 13 Forest plot summarising sensitivity and subgroup analyses outcomes interms of difference in proportions of retreatment by day 28 for the durationrandomisation 36
FIGURE 14 Kaplan–Meier curve for severe CAP subgroup primary analysis forduration randomisation 38
FIGURE 15 Kaplan–Meier curve for severe CAP subgroup primary analysis fordose randomisation 38
FIGURE 16 Availability of symptom data over time, by data source 41
FIGURE 17 Kaplan–Meier curves for time to symptom resolution across allrandomisation arms 42
FIGURE 18 Kaplan–Meier curve for time to resolution of cough in the durationtreatment arms 42
DOI: 10.3310/hta25600 Health Technology Assessment 2021 Vol. 25 No. 60
Copyright © 2021 Barratt et al. This work was produced by Barratt et al. under the terms of a commissioning contract issued by the Secretary of State for Health and SocialCare. This is an Open Access publication distributed under the terms of the Creative Commons Attribution CC BY 4.0 licence, which permits unrestricted use, distribution,reproduction and adaption in any medium and for any purpose provided that it is properly attributed. See: https://creativecommons.org/licenses/by/4.0/. For attribution thetitle, original author(s), the publication source – NIHR Journals Library, and the DOI of the publication must be cited.
xv

FIGURE 19 Kaplan–Meier curve for time to resolution of sleep disturbed by cough inthe duration treatment arms 43
FIGURE 20 Skin rash severity during treatment period: duration randomisation 47
FIGURE 21 Dose randomisation: participants who took at least 80% of all trialmedication, including placebo 71
FIGURE 22 Dose randomisation: participants who took at least 80% of activetrial drug 71
FIGURE 23 Duration randomisation: participants who took at least 80% of all trialmedication, including placebo 72
FIGURE 24 Duration randomisation: participants who took at least 80% of activetrial drug 72
LIST OF FIGURES
NIHR Journals Library www.journalslibrary.nihr.ac.uk
xvi
List of boxes
BOX 1 Definition of clinical diagnosis of CAP 7
DOI: 10.3310/hta25600 Health Technology Assessment 2021 Vol. 25 No. 60
Copyright © 2021 Barratt et al. This work was produced by Barratt et al. under the terms of a commissioning contract issued by the Secretary of State for Health and SocialCare. This is an Open Access publication distributed under the terms of the Creative Commons Attribution CC BY 4.0 licence, which permits unrestricted use, distribution,reproduction and adaption in any medium and for any purpose provided that it is properly attributed. See: https://creativecommons.org/licenses/by/4.0/. For attribution thetitle, original author(s), the publication source – NIHR Journals Library, and the DOI of the publication must be cited.
xvii

List of abbreviations
AE adverse event
BNFc British National Formulary forChildren
BTS British Thoracic Society
CAP community-acquired pneumonia
CAP-IT Community-Acquired Pneumonia:a protocol for a randomIsedcontrolled Trial
CI confidence interval
ED emergency department
ERC End-Point Review Committee
GP general practitioner
ID identification
IDMC Independent Data MonitoringCommittee
IMP investigational medicinal product
IQR interquartile range
ITT intention to treat
MIC minimal inhibitory concentration
PCV pneumococcal conjugate vaccine
PED paediatric emergency department
PPI patient and public involvement
RCT randomised controlled trial
SAE serious adverse event
SAP statistical analysis plan
SAR serious adverse reaction
T >MIC time spent above the minimuminhibitory concentration
TSC Trial Steering Committee
WHO World Health Organization
DOI: 10.3310/hta25600 Health Technology Assessment 2021 Vol. 25 No. 60
Copyright © 2021 Barratt et al. This work was produced by Barratt et al. under the terms of a commissioning contract issued by the Secretary of State for Health and SocialCare. This is an Open Access publication distributed under the terms of the Creative Commons Attribution CC BY 4.0 licence, which permits unrestricted use, distribution,reproduction and adaption in any medium and for any purpose provided that it is properly attributed. See: https://creativecommons.org/licenses/by/4.0/. For attribution thetitle, original author(s), the publication source – NIHR Journals Library, and the DOI of the publication must be cited.
xix


Plain English summary
Pneumonia (an acute lung infection) is a common diagnosis in young children worldwide. To curethis, some children are given antibiotics, but we do not currently know the best amount (dose) to
give and the ideal number of days (duration) of treatment.
Taking antibiotics causes changes in bacteria, making them more resistant to treatment. This may beaffected by the dose and duration, and is important because resistant bacteria are harder to treat andcould spread to other people.
Amoxicillin is the most common antibiotic treatment for children with pneumonia. CAP-IT (Community-Acquired Pneumonia: a protocol for a randomIsed controlled Trial) tested if lower doses and shorterdurations of amoxicillin are as good as higher doses and longer durations, and whether or not theseaffect the presence of resistant bacteria.
In total, 824 children in the UK and Ireland with pneumonia participated. They received either high- orlow-dose amoxicillin for 3 or 7 days following discharge from hospital. To ensure that neither doctorsnor parents were influenced by knowing which group a child was in, we included dummy drugs (placebo).
We measured how often children were given more antibiotics for respiratory infections in the 4 weeksafter starting the trial medicine. To check for resistant bacteria, a nose swab was collected beforestarting treatment and again after 4 weeks.
One in every eight participating children was given additional antibiotics. We found no importantdifference in this proportion between 3 days and 7 days of amoxicillin treatment, or between loweror higher doses. Although children’s coughs took slightly longer to go away when they received only3 days of antibiotics, rash was reported slightly more often in children taking 7 days of antibiotics.There was no effect of dose of amoxicillin on any of the symptom measurements. No effect of durationof treatment or dose was observed for antibiotic resistance in bacteria living in the nose and throat.
DOI: 10.3310/hta25600 Health Technology Assessment 2021 Vol. 25 No. 60
Copyright © 2021 Barratt et al. This work was produced by Barratt et al. under the terms of a commissioning contract issued by the Secretary of State for Health and SocialCare. This is an Open Access publication distributed under the terms of the Creative Commons Attribution CC BY 4.0 licence, which permits unrestricted use, distribution,reproduction and adaption in any medium and for any purpose provided that it is properly attributed. See: https://creativecommons.org/licenses/by/4.0/. For attribution thetitle, original author(s), the publication source – NIHR Journals Library, and the DOI of the publication must be cited.
xxi


Scientific summary
Background
Antibiotics are among the most frequently prescribed medicines for children worldwide, and the mostcommon indication is acute respiratory tract infection. Community-acquired pneumonia (CAP) accountsfor a substantial proportion. Although the majority of pneumonia deaths occur in low- and middle-incomecountries, CAP is a major cause of morbidity in Europe and North America.
According to current guidance, including guidance from the British National Formulary for Children(BNFc) and the British Thoracic Society (BTS) in the UK, amoxicillin is the recommended treatmentfor childhood CAP. Twice-daily dosing is widely recommended internationally, but the BNFc currentlyrecommends amoxicillin (250 mg) three times daily for children aged 1–5 years, with a total dailydose similar to countries using twice-daily dosing. Owing to this age-banded dose selection, thereis considerable variability in the effective total daily dose for treated children in the UK. In termsof duration, the 2019 National Institute for Health and Care Excellence treatment guidelines forchildhood pneumonia recommend a 5-day course be prescribed, European and World HealthOrganization guidance has suggested that a 3- to 5-day course be prescribed and the BTS recognisesthat there are no robust data to inform duration. Overall, there is insufficient evidence to informoptimal amoxicillin dose or duration for childhood CAP.
Streptococcus pneumoniae is the bacterial pathogen most commonly associated with childhood CAP. Thepneumococcal conjugate vaccination (PCV13) covers 13 serotypes of S. pneumoniae and was introducedin the UK in 2010, with an uptake of nearly 95%. Despite this, there has not been a significant reductionin CAP-related hospital admissions in young children. S. pneumoniae resistance to penicillin in the UK isrelatively rare and generally low level, reported to be identified in approximately 15% of respiratoryisolates and 4–6% of blood culture isolates. To the best of our knowledge, there are virtually no data onthe impact of duration and dose of antibiotic treatment on colonisation with resistant bacteria in children,but the relationship is likely to be dynamic and highly complex.
Although there is clear agreement that amoxicillin should be used as the first-line agent in childrenrequiring antibiotic treatment, there are insufficient data on the impact of amoxicillin dose and durationon clinical cure, drug toxicity and resistance to key bacteria, including S. pneumoniae.
Objectives
The main objective CAP-IT (Community-Acquired Pneumonia: a protocol for a randomIsed controlledTrial) was to determine the following for young children with uncomplicated CAP treated afterdischarge from hospital if:
l a 3-day course of amoxicillin is non-inferior to a 7-day course, determined by receipt of a clinicallyindicated systemic antibiotic other than trial medication for respiratory tract infection (including CAP)in the 4 weeks after randomisation up to day 28
l lower-dose amoxicillin is non-inferior to higher-dose amoxicillin under the same conditions.
Secondary objectives were to evaluate the impact of lower-dose and shorter-duration amoxicillin onantimicrobial resistance, severity and duration of parent/guardian-reported CAP symptoms andspecified clinical adverse events (AEs) (i.e. rash and diarrhoea).
DOI: 10.3310/hta25600 Health Technology Assessment 2021 Vol. 25 No. 60
Copyright © 2021 Barratt et al. This work was produced by Barratt et al. under the terms of a commissioning contract issued by the Secretary of State for Health and SocialCare. This is an Open Access publication distributed under the terms of the Creative Commons Attribution CC BY 4.0 licence, which permits unrestricted use, distribution,reproduction and adaption in any medium and for any purpose provided that it is properly attributed. See: https://creativecommons.org/licenses/by/4.0/. For attribution thetitle, original author(s), the publication source – NIHR Journals Library, and the DOI of the publication must be cited.
xxiii

Methods
Trial designCAP-IT was a multicentre clinical trial with a target sample size of 800 participants conducted inhospitals in the UK and Ireland. It was a randomised, double-blind, placebo-controlled, 2 × 2 factorial,non-inferiority trial that evaluated amoxicillin dose and duration in young children with CAP.
Eligibility and recruitmentPatients presenting to 28 UK NHS hospitals and one children’s hospital in Ireland were recruited inemergency departments (EDs), assessment/observation units and inpatient wards.
ParticipantsChildren were eligible if they had a diagnosis of uncomplicated CAP, were aged > 6 months, weighed6–24 kg and treatment with amoxicillin as the sole antibiotic was planned on discharge. CAP diagnosiswas defined as cough within the previous 96 hours, fever (≥ 38 °C) in the previous 48 hours and respiratorydistress and/or focal chest signs. Children could have received either no antibiotics or < 48 hours ofbeta-lactam antibiotics prior to randomisation.
Children were excluded for any severe underlying chronic disease with an increased risk of complicatedCAP (including sickle cell anaemia, immunodeficiency, chronic lung disease and cystic fibrosis), documentedpenicillin allergy or other contraindication to amoxicillin, diagnosis of complicated pneumonia (i.e. shock,hypotension, altered mental state, ventilatory support, empyema, pneumothorax or pulmonary abscess)or bilateral wheezing without focal chest signs.
InterventionsAmoxicillin suspension was orally administered by parents/guardians twice daily. All children wereweighed during eligibility screening to determine dose volume according to seven weight bands.Children were randomised to receive either a lower (35–50 mg/kg/day) or a higher (70–90 mg/kg/day)dose, and to receive either 3 or 7 days of amoxicillin at the point of discharge from hospital.
Randomisation and blindingPatients underwent two simultaneous factorial 1 : 1 randomisations (dose and duration), resulting intheir allocation to one of the four amoxicillin regimens (low dose, short duration; low dose, longduration; high dose, short duration; or high dose, long duration) using computer-generated randompermuted blocks of size eight, stratified according to whether or not they had received non-trialantibiotics in hospital before being enrolled. Initially, stratification was by paediatric ED or ward group,reflecting whether participants were admitted to inpatient wards or observation units or dischargeddirectly from the ED. Following an amendment for the joint analysis of these groups, stratificationwas effectively based on whether or not participants had received in-hospital antibiotics prior torandomisation. Blinded investigational medicinal product (IMP) labels were applied to each treatment packand participants were randomised by dispensing the next sequentially numbered pack in the active block.
All treating clinicians, parents/guardians and outcome assessors were blinded to the allocated treatment.Dose blinding was achieved by using otherwise identical amoxicillin products of two different strengths(125 mg/5 ml and 250 mg/5 ml). A placebo manufactured to match oral amoxicillin suspension was usedto blind the duration. One brand of amoxicillin was used for the first 3 days, followed by either a secondbrand of amoxicillin or placebo for days 4–7. Parents were informed to expect a taste change betweenbottles, but they did not know whether this was because of placebo or alternative amoxicillin.
OutcomesThe primary outcome for CAP-ITwas defined as any clinically indicated systemic antibacterial treatmentprescribed for respiratory tract infection (including CAP) other than trial medication within 4 weeks ofrandomisation (including if prescribed at the final follow-up visit at day 28). An expert clinician End-PointReview Committee (ERC) adjudicated the main clinical indication for all reported primary outcomes.
SCIENTIFIC SUMMARY
NIHR Journals Library www.journalslibrary.nihr.ac.uk
xxiv
Secondary outcomes included phenotypic resistance to penicillin at day 28 measured in nasopharyngealS. pneumoniae isolates, severity and duration of parent/guardian-reported CAP symptoms (including fever,cough, phlegm, fast breathing, wheeze, disturbed sleep, eating/drinking less, interference with normalactivity and vomiting), adherence to trial medication, the occurrence of specified clinical AEs (includingskin rash, thrush and diarrhoea) and serious adverse events (SAEs).
Data collectionData on primary and secondary end points were collected on paper case report forms by site staff attrial entry, via telephone contact at days 3, 7, 14 and 21 and at a final face-to-face visit on day 28.In the case of children who did not attend the final face-to-face visit, consent was obtained for the trialteam to contact their general practitioner (GP) to ascertain whether or not they had received a furthercourse of antibiotics for any respiratory illness. In addition, parents/guardians completed a daily diaryfrom day 1 to day 14.
Sample sizeThe sample size was calculated assuming a 15% event rate, an 8% non-inferiority margin (on a riskdifference scale) assessed against a two-sided 90% confidence interval (CI), 90% power and 15% lossto follow-up, resulting in a sample size of 800 children.
Statistical methodsStatistical analyses were performed according to a modified intention-to-treat (ITT) principle, includingall patients enrolled and analysed according to the group to which they were randomised. The onemodification to the strict ITT principle was the exclusion of randomised patients who did not take anyIMP from all statistical analyses.
The primary outcome was compared between the randomised groups using time-to-event methods,analysing time from enrolment to the first occurrence of the primary end point. Participants withincomplete primary outcome data were censored at the time of their last contact (including contactwith their GP). Kaplan–Meier estimates were used to derive the risk difference between the randomisedgroups for the primary end point at day 28.
Four predefined sensitivity analyses for the primary outcome were performed: (1) including all systemicantibacterial treatments regardless of reason or indication; (2) limiting to end points where either CAPor chest infection (rather than respiratory tract infection generally) was adjudicated as the reason fortreatment; (3) as the second analysis, but also including end points where the clinical indication was judgedas ‘unlikely’ by the ERC; and (4) for the duration comparison only, disregarding prescriptions occurringwithin 3 days of randomisation because these cannot, by definition, be related to this randomisation.
Two predefined subgroup/stratified analyses were performed: (1) including participants at the higherend of the severity spectrum only, defined as two or more abnormalities at presentation [i.e. a raisedrespiratory rate (> 37 breaths/minute for children aged 1–2 years; > 28 breaths/minute for childrenaged 3–5 years), oxygen saturation < 92% in room air, presence of chest retractions]; and (2) astratification by calendar time, based on Public Health England reports of circulating viruses/bacteriain the winter seasons spanned by CAP-IT.
Results
Primary end pointOf 814 participants in the analysis population, 100 (12.5%, 90% CI 10.7% to 14.6%) met the primaryend point [51 (12.6%) participants in the lower-dose arm and 49 (12.4%) participants in the higher-dose arm (difference 0.2%, 90% CI –3.7% to 4.0%); 51 (12.5%) participants in the shorter-durationarm and 49 (12.5%) participants in the longer-duration arm (difference 0.1%, 90% CI –3.8% to 3.9%)].
DOI: 10.3310/hta25600 Health Technology Assessment 2021 Vol. 25 No. 60
Copyright © 2021 Barratt et al. This work was produced by Barratt et al. under the terms of a commissioning contract issued by the Secretary of State for Health and SocialCare. This is an Open Access publication distributed under the terms of the Creative Commons Attribution CC BY 4.0 licence, which permits unrestricted use, distribution,reproduction and adaption in any medium and for any purpose provided that it is properly attributed. See: https://creativecommons.org/licenses/by/4.0/. For attribution thetitle, original author(s), the publication source – NIHR Journals Library, and the DOI of the publication must be cited.
xxv

For both comparisons, the upper 90% confidence limit was less than the non-inferiority margin of 8%,indicating non-inferiority of lower to higher dose and shorter to longer duration. There was no evidenceof an interaction between the two randomisation arms or between the individual randomisation arms andpre-treatment with antibiotics.
All four of the sensitivity analyses supported the primary analysis, demonstrating non-inferiority forthe dose and duration comparisons.
Community-acquired pneumonia symptomsThere was no evidence for a difference between the lower- and higher-dose groups in time to resolutionof any of the nine parent/guardian-reported symptoms (p > 0.05).
There was evidence of a faster time to resolution of cough in the longer-duration group (median10 days) than in the shorter-duration group (median 12 days) (p = 0.040). A similar difference wasalso observed for sleep disturbed by cough (p = 0.026). There was no significant difference betweenthe duration groups in time to resolution of the other seven symptoms (p > 0.05).
Adverse eventsA SAE was experienced by 43 of 814 (5.3%) participants. One participant (0.1%) experienced a seriousadverse reaction and no participants experienced a suspected unexpected adverse reaction. The proportionof participants who experienced a SAE was similar in the different dose and duration groups.
There was no difference in the time to onset or severity of diarrhoea or thrush for either the doseor duration randomisation. The proportion of participants who reported skin rash after baselinewas slightly higher in the longer-duration arm (106/387, 27.4%) than in the shorter-duration arm(87/404, 21.5%; p = 0.055).
Limitations
Limitations of the trial were that end-of-treatment swabs were not taken and 28-day swabs werecollected in only 53% of children. In addition, we focused on phenotypic penicillin resistance testing inpneumococci in the nasopharynx, which does not describe the global affect on the microflora. Although21% of children did not attend the final 28-day visit, we obtained data from general practitioners forthe primary end point on all but 3% of children.
Conclusions
In summary, we found a 3-day treatment course of amoxicillin to be non-inferior to a 7-day course ofamoxicillin, and a lower daily dose of amoxicillin to be non-inferior to a higher daily dose of amoxicillin,in terms of antibiotic retreatment for respiratory tract infection within 28 days. Time to resolutionof parent/guardian-reported symptoms was similar in randomisation arms, except that mild coughlasted, on average, 2 days longer in participants in the shorter-duration arm than in participants in thelonger-duration arm. AE rates and health-care services use within the 28-day follow-up period andpenicillin non-susceptible pneumococcal colonisation rates at 28 days were similar in all dose andduration randomisation groups. No penicillin-resistant pneumococci were identified in samples fromCAP-IT participants. Based on these findings, 3 days could be considered for the duration of amoxicillintreatment for children with uncomplicated pneumonia treated in the ambulatory setting. CurrentBNFc age-banded dosing in the UK results in a wide range of total daily doses, spanning both thelower and higher doses investigated in CAP-IT.
SCIENTIFIC SUMMARY
NIHR Journals Library www.journalslibrary.nihr.ac.uk
xxvi
Future workAntimicrobial resistance genotypic studies are ongoing, including whole-genome sequencing and shotgunmetagenomics, to fully characterise the effect of amoxicillin dose and duration on antimicrobial resistance.The analysis of a randomised substudy comparing parental electronic and paper diary entry is also ongoing.
Trial registration
This trial is registered as ISRCTN76888927, EudraCT 2016-000809-36 and CTA 00316/0246/001-0006.
Funding
This project was funded by the National Institute for Health Research (NIHR) Health TechnologyAssessment programme and will be published in full in Health Technology Assessment; Vol. 25, No. 60.See the NIHR Journals Library website for further project information.
DOI: 10.3310/hta25600 Health Technology Assessment 2021 Vol. 25 No. 60
Copyright © 2021 Barratt et al. This work was produced by Barratt et al. under the terms of a commissioning contract issued by the Secretary of State for Health and SocialCare. This is an Open Access publication distributed under the terms of the Creative Commons Attribution CC BY 4.0 licence, which permits unrestricted use, distribution,reproduction and adaption in any medium and for any purpose provided that it is properly attributed. See: https://creativecommons.org/licenses/by/4.0/. For attribution thetitle, original author(s), the publication source – NIHR Journals Library, and the DOI of the publication must be cited.
xxvii


Chapter 1 Introduction
This chapter includes material that has been adapted from the trial protocol, which has beenpublished in BMJ Open.1 This is an Open Access article distributed in accordance with the terms
of the Creative Commons Attribution (CC BY 4.0) license, which permits others to distribute, remix,adapt and build upon this work, for commercial use, provided the original work is properly cited.See: https://creativecommons.org/licenses/by/4.0/. The text below includes minor additions and formattingchanges to the original text.
Background
Antibiotics are among the most frequently prescribed medicines for children worldwide.2,3 In the UK,Italy and the Netherlands, almost 50% of children have received antibiotics by their second birthday.Annually, it is estimated that 30% of children aged 2–11 years receive antibiotics.3
Of the possible indications in children aged < 5 years, the most common are acute respiratory tractinfections, including community-acquired pneumonia (CAP).4–6 CAP is one of the most common seriousbacterial childhood infections. Although the majority of pneumonia deaths occur in low- and middle-income countries, CAP is a major cause of morbidity in Europe and North America.5,7 In the UK, 62%of all antibiotics prescribed for community-acquired infections are for CAP.8 In the USA, respiratorysymptoms, fever or cough are responsible for one-third of all childhood medical visits, and 7–15% ofthese children will be diagnosed with CAP.9,10
Emergency department (ED) attendances and hospital admissions of children with respiratory complaintshave increased in recent decades, mostly in preschool children.9,11,12 According to Hospital EpisodeStatistics,13 children aged 0–4 years accounted for around 2.11 million ED attendances in 2017–18.More than 11,000 children aged < 15 years were admitted to hospitals in England with a diagnosisof bacterial pneumonia in 2008, and 9000 1- to 4-year-old inpatients with non-influenza pneumoniawere recorded in 2012/13.13,14
The bacterial pathogen most commonly associated with childhood CAP is Streptococcus pneumoniae,including in countries where pneumococcal conjugate vaccine (PCV) is routinely administered.7,15–17
In 2010, PCV13 (which covers 13 S. pneumoniae serotypes) was introduced in the UK, with almost95% uptake in young children.18,19 However, despite an observed impact on invasive pneumococcaldisease, a decrease in CAP-related hospital admissions in young children has not been observed.11,14,20,21
What are the current challenges in the management of childhoodcommunity-acquired pneumonia?
There is no test capable of accurately distinguishing between bacterial and viral CAP.22 Interobserveragreement for chest radigoraphic findings is poor, casting doubt on the usefulness of chest radiographsfor identifying bacterial CAP, and culturing of microbiological samples, such as sputum, has low diagnosticvalue and samples are often difficult to take from young children.23–25 Diagnosis of bacterial CAP presentsa challenge for treating clinicians, who rely largely on clinical criteria.22 Children presenting with fever,raised respiratory rate, focal chest signs and other respiratory signs and symptoms (such as cough) arecommonly ascribed a diagnosis of bacterial CAP,10,26–28 whereas wheezing is associated with the absenceof radiographic pneumonia and failure to detect bacteria in clinical samples.26,29 If bacterial CAP isconsidered the likely diagnosis, treatment with antibiotics is instituted.10,30 This diagnostic challenge isparticularly problematic in secondary care, where the proportion of children presenting with seriousbacterial infections is higher than in primary practice.31,32
DOI: 10.3310/hta25600 Health Technology Assessment 2021 Vol. 25 No. 60
Copyright © 2021 Barratt et al. This work was produced by Barratt et al. under the terms of a commissioning contract issued by the Secretary of State for Health and SocialCare. This is an Open Access publication distributed under the terms of the Creative Commons Attribution CC BY 4.0 licence, which permits unrestricted use, distribution,reproduction and adaption in any medium and for any purpose provided that it is properly attributed. See: https://creativecommons.org/licenses/by/4.0/. For attribution thetitle, original author(s), the publication source – NIHR Journals Library, and the DOI of the publication must be cited.
1

A further challenge for clinicians is severity assessment. Available validated predictive scoring systemsfor CAP severity include the Pneumonia Severity Index and the CURB-65 (confusion, urea, respiratoryrate, blood pressure, and 65 years of age or older) score, but these are not applicable to children.33,34
Pneumonia mortality risk scores for children have been developed in low-resource settings, but donot differentiate between viral and bacterial pneumonia.35,36 Low oxygen saturation in room air isincluded as one component in these risk scores, and is an important factor for differentiating betweennon-severe and severe pneumonia.37–39
Finally, assessing the efficacy of childhood CAP treatment is complex. Key measures in studies assessingefficacy early in the treatment course include lack of improvement or worsening of clinical symptomsand signs, such as respiratory rate and oxygen saturation.40 According to British Thoracic Society (BTS)guidance, such criteria should trigger clinical review of children treated with oral antibiotics for CAP,22
including where the following features are present at 48 hours: (1) persistent high fever, (2) increasing orpersistently increased effort of breathing and (3) persistent or increasing oxygen requirement to maintainsaturations ≥ 92%.22 Approximately 15% of children with CAP receive further antibiotics within 28 daysof starting treatment because of symptoms that concern parents.41–44 However, only half of childrenshow recovery from symptoms of acute respiratory illness by day 9 or 10, and 90% of children recoverby 3.5 weeks after symptom onset.45–47
What are the current management recommendations for childhoodcommunity-acquired pneumonia?
Amoxicillin is the drug of choice for the treatment of childhood CAP according to the British NationalFormulary for Children (BNFc) and BTS and National Institute for Health and Care Excellence guidelines,as well as several international guidelines,22,48–51 as it can effectively target and treat S. pneumoniaein the absence of high-level penicillin resistance. As a result, amoxicillin accounts for a very highproportion of overall oral antibiotic use among young children in many settings. Despite this, there isinsufficient evidence to inform optimal treatment dose or duration.
What are the current dose recommendations?Antibiotic dose selection should be driven by pharmacokinetic/pharmacodynamic considerations. The keypharmacokinetic/pharmacodynamic parameter for beta-lactams (including amoxicillin) is time spent abovethe minimum inhibitory concentration (T>MIC) (mainly focused here on pneumococcus).The recommendedT>MIC is 40–50% of the dosing interval; however, the exact relationship between blood pharmacokineticsand concentrations of amoxicillin in the lungs is unclear.48,52 The half-life of oral amoxicillin is about1.0–1.5 hours and, on this basis, a three times daily regimen has been widely recommended.53 However,there are few data to inform whether or not three times daily dosing is likely to achieve pharmacokinetic/pharmacodynamic parameters better than twice-daily dosing. The available data suggest that, in the caseof total amoxicillin doses of 25–50 mg/kg/day, twice-daily dosing should be sufficient to achieve adequateT >MIC53 and a Brazilian group recently demonstrated non-inferiority of twice-daily dosing comparedwith thrice-daily dosing in childhood CAP.54 Together with a likely improvement in adherence to lessfrequent administration, twice-daily dosing is, therefore, widely recommended.48–50,52 Currently, the BNFcrecommends amoxicillin (250mg) thrice daily for children aged 1–5 years with CAP, resulting in highlyvariable dosing, between approximately 40 mg/kg/day and 80mg/kg/day, depending on the weight of thechild.55 Therefore, alternative strategies, such as weight-banded dosing, may be more appropriate.56
Furthermore, much higher daily doses of amoxicillin, up to 200mg/kg/day, are recommended for thetreatment of severe infections.55
What are the current duration recommendations?Several large randomised controlled trials (RCTs) have found shorter treatment courses in childhoodCAP to be effective in low- and middle-income settings in terms of clinical cure, treatment failure andrelapse rate.57,58 However, these trials enrolled children with symptoms indicative of a viral infectionnot requiring antibiotics, and generalisability to the UK has, therefore, been questioned.22
INTRODUCTION
NIHR Journals Library www.journalslibrary.nihr.ac.uk
2

The BTS recognises that there are no robust data to inform guidance on duration of antibiotic treatmentin childhood CAP.22 The BNFc guidance relevant at the start of this trial recommended a 7-day course,whereas European and World Health Organization (WHO) guidance suggests a 3- to 5-day course.48,55
In 2019, the National Institute for Health and Care Excellence published guidance recommending stoppingamoxicillin treatment after 5 days (250 mg thrice daily) for children aged 1–4 years, unless microbiologicalresults suggest that a longer course length is needed or the patient is not clinically stable.51
What is the impact of antimicrobial resistance in childhood community-acquired pneumonia?
In the UK, the rates of penicillin non-susceptibility of S. pneumoniae are relatively low, at approximately15% for respiratory samples (mainly from adults) and 4–6% for blood culture isolates.59 Penicillinresistance [i.e. minimal inhibitory concentration (MIC) > 2 μg/ml] has not been observed in bloodculture isolates and has been found in < 1% of respiratory S. pneumoniae isolates in the UK since2010.59 However, some worrying trends are observed in resistance of gut bacteria, and this situationwill be exacerbated in a setting where antibiotics are used injudiciously.60
The relationship between MIC (an in vitro phenomenon) and clinical outcome in CAP is complex,and data on the level of S. pneumoniae antimicrobial resistance that reduces amoxicillin effectivenessare limited. Harmonisation of European breakpoints (i.e. the MIC at which an isolate is consideredsusceptible, intermediate or resistant) attempts to provide a link between clinical impact and in vitroobservation of resistance.61 Clinical breakpoints are determined based on a variety of data, in additionto efficacy studies. This includes pharmacokinetic/pharmacodynamic data, which for penicillin usuallytake T >MIC of 40% as the key exposure measure.
Children have high rates of bacterial colonisation, which often represents an increased level of carriageof resistant organisms62,63 These may be passed on to others in the community, especially within child-care settings.64,65 Interventions to maintain a low level of antimicrobial resistance among colonisingbacteria may, therefore, have population implications.
The limited existing data on the specific impact of duration and dose of antibiotic treatment onsubsequent colonisation with resistant bacteria in vivo suggest a complex and dynamic relationship.62–73
Experimental models suggest that insufficiently high dosing could promote selection of resistantpathogens. In addition, although most of the effect on bacterial load is achieved early during antibioticexposure, resistant isolates emerge after 4 or 5 days.74–78 RCTs assessing the effect of antibioticduration and dose have been called for, as they will probably provide the strongest evidence for therelationship between antibiotic exposure and colonisation with resistant bacteria.79 One such RCTfound that higher-dose shorter-duration amoxicillin therapy for childhood CAP led to less colonisationwith resistant bacteria after 4 weeks, and was associated with better treatment adherence.72 However,mathematical modelling indicates that this may come at the price of selecting isolates with higherlevels of resistance, and clinical efficacy was not addressed in the trial.72,78
Trial rationale
Despite the reduction in incidence of invasive pneumococcal disease since the introduction of theconjugate vaccine,20 CAP remains one of the most commonly identified and treated childhoodinfections in the UK. Although there is clear agreement that amoxicillin should be the first-linetreatment, there are insufficient data to inform selection of dose and duration, and the impact thatdifferent regimens have on antimicrobial resistance is unknown.
DOI: 10.3310/hta25600 Health Technology Assessment 2021 Vol. 25 No. 60
Copyright © 2021 Barratt et al. This work was produced by Barratt et al. under the terms of a commissioning contract issued by the Secretary of State for Health and SocialCare. This is an Open Access publication distributed under the terms of the Creative Commons Attribution CC BY 4.0 licence, which permits unrestricted use, distribution,reproduction and adaption in any medium and for any purpose provided that it is properly attributed. See: https://creativecommons.org/licenses/by/4.0/. For attribution thetitle, original author(s), the publication source – NIHR Journals Library, and the DOI of the publication must be cited.
3

Effectiveness and resistance-outcome data pertaining to dose and duration of amoxicillin could informantimicrobial stewardship strategies in the large group of children with a high likelihood of bacterialCAP targeted by CAP-IT (Community-Acquired Pneumonia: a protocol for a randomIsed controlledTrial). A better understanding of the relationship between dose and duration of antibiotic treatment,and the impact on clinical outcomes and antimicrobial resistance, would make it possible to formulateimproved evidence-based treatment recommendations for childhood CAP.
Objectives
The main objective of CAP-IT was to determine the following for young children with uncomplicatedCAP treated after discharge from hospital if:
l a 3-day course of amoxicillin is non-inferior to a 7-day course, determined by receipt of a clinicallyindicated systemic antibiotic other than trial medication for respiratory tract infection (including CAP)in the 4 weeks after randomisation up to day 28
l lower-dose amoxicillin is non-inferior to higher-dose amoxicillin under the same conditions.
Secondary objectives were to evaluate the impact of lower-dose and shorter-duration amoxicillin onantimicrobial resistance, severity and duration of parent/guardian-reported CAP symptoms andspecified clinical adverse events (AEs).
INTRODUCTION
NIHR Journals Library www.journalslibrary.nihr.ac.uk
4
Chapter 2 Methods
Trial design
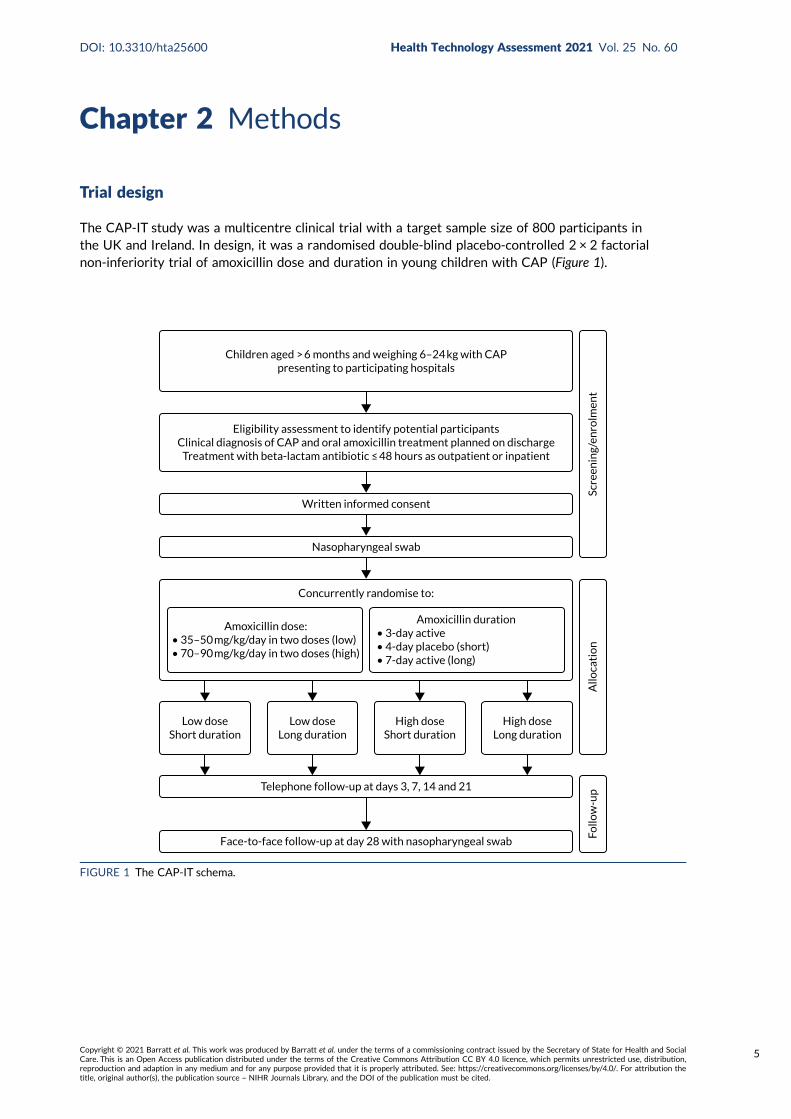
The CAP-IT study was a multicentre clinical trial with a target sample size of 800 participants inthe UK and Ireland. In design, it was a randomised double-blind placebo-controlled 2 × 2 factorialnon-inferiority trial of amoxicillin dose and duration in young children with CAP (Figure 1).
Children aged > 6 months and weighing 6–24 kg with CAPpresenting to participating hospitals
Eligibility assessment to identify potential participantsClinical diagnosis of CAP and oral amoxicillin treatment planned on discharge
Treatment with beta-lactam antibiotic ≤ 48 hours as outpatient or inpatient
Written informed consent
Nasopharyngeal swab
Concurrently randomise to:
Face-to-face follow-up at day 28 with nasopharyngeal swab
Telephone follow-up at days 3, 7, 14 and 21
Amoxicillin dose:• 35–50 mg/kg/day in two doses (low)• 70–90 mg/kg/day in two doses (high)
Amoxicillin duration• 3-day active• 4-day placebo (short)• 7-day active (long)
Low doseShort duration
Low doseLong duration
High doseShort duration
High doseLong duration
Follo
w-u
pA
lloca
tio
nSc
reen
ing/
enro
lmen
t
FIGURE 1 The CAP-IT schema.
DOI: 10.3310/hta25600 Health Technology Assessment 2021 Vol. 25 No. 60
Copyright © 2021 Barratt et al. This work was produced by Barratt et al. under the terms of a commissioning contract issued by the Secretary of State for Health and SocialCare. This is an Open Access publication distributed under the terms of the Creative Commons Attribution CC BY 4.0 licence, which permits unrestricted use, distribution,reproduction and adaption in any medium and for any purpose provided that it is properly attributed. See: https://creativecommons.org/licenses/by/4.0/. For attribution thetitle, original author(s), the publication source – NIHR Journals Library, and the DOI of the publication must be cited.
5
Trial setting
Participants were recruited from 28 UK NHS hospitals and one children’s hospital in Ireland:
1. Alder Hey Children’s Hospital NHS Foundation Trust (Liverpool, UK)2. Barts Health NHS Trust (London, UK)3. Birmingham Women’s and Children’s NHS Foundation Trust (Birmingham, UK)4. Brighton and Sussex University Hospitals NHS Trust (Brighton, UK)5. Chelsea and Westminster Hospital NHS Foundation Trust (London, UK)6. Children’s Health Ireland (Dublin, Ireland)7. City Hospitals Sunderland NHS Foundation Trust (Sunderland, UK)8. Countess of Chester Hospital NHS Foundation Trust (Chester, UK)9. County Durham and Darlington NHS Foundation Trust (Darlington, UK)
10. Guy’s and St Thomas’ NHS Foundation Trust (London, UK)11. Hull and East Yorkshire Teaching Hospitals NHS Trust (Hull, UK)12. Imperial College Healthcare NHS Trust (London, UK)13. King’s College Hospital NHS Foundation Trust (London, UK)14. The Leeds Teaching Hospitals NHS Trust (Leeds, UK)15. Manchester University NHS Foundation Trust (Manchester, UK)16. Nottingham University Hospitals NHS Trust (Nottingham, UK)17. Oxford University Hospitals NHS Foundation Trust (Oxford, UK)18. Southport and Ormskirk Hospital NHS Trust (Southport, UK)19. Royal Hospital for Children (Glasgow, UK)20. Sheffield Children’s NHS Foundation Trust (Sheffield, UK)21. South Tees Hospitals NHS Foundation Trust (Middlesbrough, UK)22. St George’s University Hospitals NHS Foundation Trust (London, UK)23. University Hospitals Bristol and Weston NHS Foundation Trust (Bristol, UK)24. University Hospitals of Derby and Burton NHS Foundation Trust (Derby, UK)25. University Hospitals of Leicester NHS Trust (Leicester, UK)26. University Hospitals Lewisham (London, UK)27. University Hospital Southampton NHS Foundation Trust (Southampton, UK)28. University Hospital of Wales (Cardiff, UK).
Participating sites were tertiary or secondary hospitals with paediatric emergency departments (PEDs)and inpatient facilities, and were selected in collaboration with Paediatric Emergency Research in theUK & Ireland80 on the basis of clinical and research infrastructure, experience in clinical research andlikely eligible population size.
Participants
Patients presenting to participating hospitals were identified in PEDs, assessment/observation units orinpatient wards. Potential participants were screened as early as possible during the initial clinicalassessment. Informed consent was sought from a parent/guardian once eligibility had been confirmed,but only after full explanation of the trial aims, methods and potential risks and benefits. Discussionsregarding the trial took place between families and clinical teams when the child’s clinical conditionwas stable, to minimise distress. Extensive information and recruitment materials were available forrecruiting sites, including printed and video materials [accessible at URL: www.capitstudy.org.uk(accessed 29 July 2021)]. CAP-IT information film was designed to assist research teams in therecruitment process and provided information to parents/guardians about the purpose of the trial, theuse of placebo and trial procedures. Parents/guardians could watch the film in their own time while inhospital, and research teams reported that the film was a useful tool during the recruitment process.
METHODS
NIHR Journals Library www.journalslibrary.nihr.ac.uk
6
The film was made with input from the trial patient and public involvement (PPI) representative andfeatured a site principal investigator and research nurse, as well as graphics to aid explanation of trialprocedures. [It can be viewed at https://vimeo.com/217849985 (accessed 29 July 2021).] Families wereable to decline participation in the trial at any time without providing a reason and without incurringany penalty or affecting clinical management.
Recruitment pathwaysChildren were recruited through two different pathways based on whether they received any inpatientantibiotic treatment (ward group) or not (PED group). Children in either group may have had up to48 hours of oral or parenteral beta-lactam treatment before enrolment. The PED group containedchildren who had not received any in-hospital antibiotic treatment (but may have had up to 48 hoursof beta-lactam antibiotics in the community), whereas the ward group contained children who receivedany in-hospital oral or intravenous beta-lactam therapy prior to randomisation. Children in the lattergroup may have received beta-lactam treatment in the community first and subsequently in hospital,without interruption, for a total of < 48 hours.
Inclusion criteriaChildren were eligible if they had a clinical diagnosis of uncomplicated CAP, were aged > 6 monthsand weighed 6–24 kg, and treatment with amoxicillin as the sole antibiotic was planned on discharge.Box 1 shows the clinical criteria required for a diagnosis of CAP in CAP-IT.
Exclusion criteriaChildren were excluded if they had received ≥ 48 hours of beta-lactam antibiotics or any non-beta-lactam agents, or if they had severe underlying chronic disease with increased risk of complicated CAP(including sickle cell anaemia, immunodeficiency, chronic lung disease and cystic fibrosis), documentedpenicillin allergy or other contraindication to amoxicillin, complicated pneumonia (including shock,hypotension, altered mental state, ventilatory support, empyema, pneumothorax and pulmonary abscess)or bilateral wheezing without focal chest signs.
Changes to selection criteriaDuring the trial enrolment period, eligibility criteria were modified based on emerging data to betterreflect clinical management and facilitate inclusion of all children to whom the results of the trial maybe of relevance.
Age and weight criteria were amended from ‘age from 1 to 5 years (up to their 6th birthday)’ inprotocol v2.0 to ‘greater than 6 months and weighing 6–24 kg’ in protocol v3.0. Children recruited toprotocol v2.0 were excluded if they were receiving systemic antibiotic treatment at presentation.This was modified in protocol v3.0 for the PED group and in protocol v4.0 for the ward group, suchthat children were eligible if they had received ≤ 48 hours’ systemic antibiotic treatment at trial entry,as per section 2.3 of the protocol.
BOX 1 Definition of clinical diagnosis of CAP
Clinical diagnosis of CAP is defined as:
l cough (reported by parents/guardians within 96 hours before presentation)
l temperature ≥ 38 °C measured by any method or likely fever within 48 hours before presentationl signs of laboured/difficult breathing or focal chest signs (i.e. one or more of nasal flaring, chest
retractions, abdominal breathing, focal dullness to percussion, focal reduced breath sounds, crackles
with asymmetry or lobar pneumonia on chest radiograph).
DOI: 10.3310/hta25600 Health Technology Assessment 2021 Vol. 25 No. 60
Copyright © 2021 Barratt et al. This work was produced by Barratt et al. under the terms of a commissioning contract issued by the Secretary of State for Health and SocialCare. This is an Open Access publication distributed under the terms of the Creative Commons Attribution CC BY 4.0 licence, which permits unrestricted use, distribution,reproduction and adaption in any medium and for any purpose provided that it is properly attributed. See: https://creativecommons.org/licenses/by/4.0/. For attribution thetitle, original author(s), the publication source – NIHR Journals Library, and the DOI of the publication must be cited.
7

Children in the ward group were excluded in protocol v2.0 if they had ‘current oxygen requirement’ or‘current age-specific tachypnoea’; however, these criteria were removed in protocol v3.0 and replacedwith the inclusion criterion ‘child is considered fit for discharge at randomisation’.
The CAP diagnostic criterion relating to fever changed from ‘temperature ≥ 38 °C measured by anymethod OR history of fever in last 24 hours reported by parents/guardians’ in protocol v2.0 to‘temperature ≥ 38 °C measured by any method OR likely fever in last 48 hours’ in protocol v3.0 toaccount for the accompanying parent/guardian not measuring temperature in the preceding 24 hours.
Interventions
The investigational medicinal product (IMP) for treatment at home was provided as a powder to besuspended on the day of randomisation. Children received oral amoxicillin suspension twice daily,commencing on the day of randomisation. All children were weighed during eligibility screening andwas used to determine dose volume according to seven weight bands (Table 1).
Participants were randomised to receive either a lower (35–50mg/kg/day) or a higher (70–90mg/kg/day)dose, concealment of which was achieved by using amoxicillin products of two different strengths(125 mg/5 ml and 250 mg/5 ml). Therefore, children in each dose arm in the same weight band wereadministered the same volume of suspension .
Participants were simultaneously randomised to receive either 3 or 7 days of amoxicillin treatment athome. A placebo manufactured to match the characteristics of oral amoxicillin suspension was usedto blind parents/guardians and clinical staff to the duration allocation. Both active drug and placeboformed a yellow-coloured similar-tasting suspension. However, because of difficulties in exactly taste-matching the placebo suspension to amoxicillin, one brand of amoxicillin was used for the first 3 daysof treatment followed by a second brand for days 4–7 when duration of treatment was 7 days. Parentswere instructed to expect a taste change between bottles, but they did not know whether this wasdue to moving to placebo or to a new brand of amoxicillin. Allocated treatment duration to be givenafter discharge from hospital was fixed at 3 or 7 days independently of any antibiotics received beforerandomisation, with up to 48 hours of oral or parenteral beta-lactam treatment permitted before enrolment.
This resulted in four treatment arms, as shown in Figure 2.
The hypothesis is that higher doses of amoxicillin given for a longer duration are non-inferior to lowerdoses of amoxicillin given for a shorter duration for the treatment of children attending hospital withCAP in terms of antibiotic retreatment.
TABLE 1 Weight bands used for dosing of CAP-IT IMP
Weight range (kg) Dosing intructions
≤ 6.4 4.5 ml twice a day
6.5–8.4 6 ml twice a day
8.5–10.4 7.5 ml twice a day
10.5–13.4 9.5 ml twice a day
13.5–16.9 12ml twice a day
17.0–20.9 15ml twice a day
21.0–24.0 16.5 ml twice a day
METHODS
NIHR Journals Library www.journalslibrary.nihr.ac.uk
8
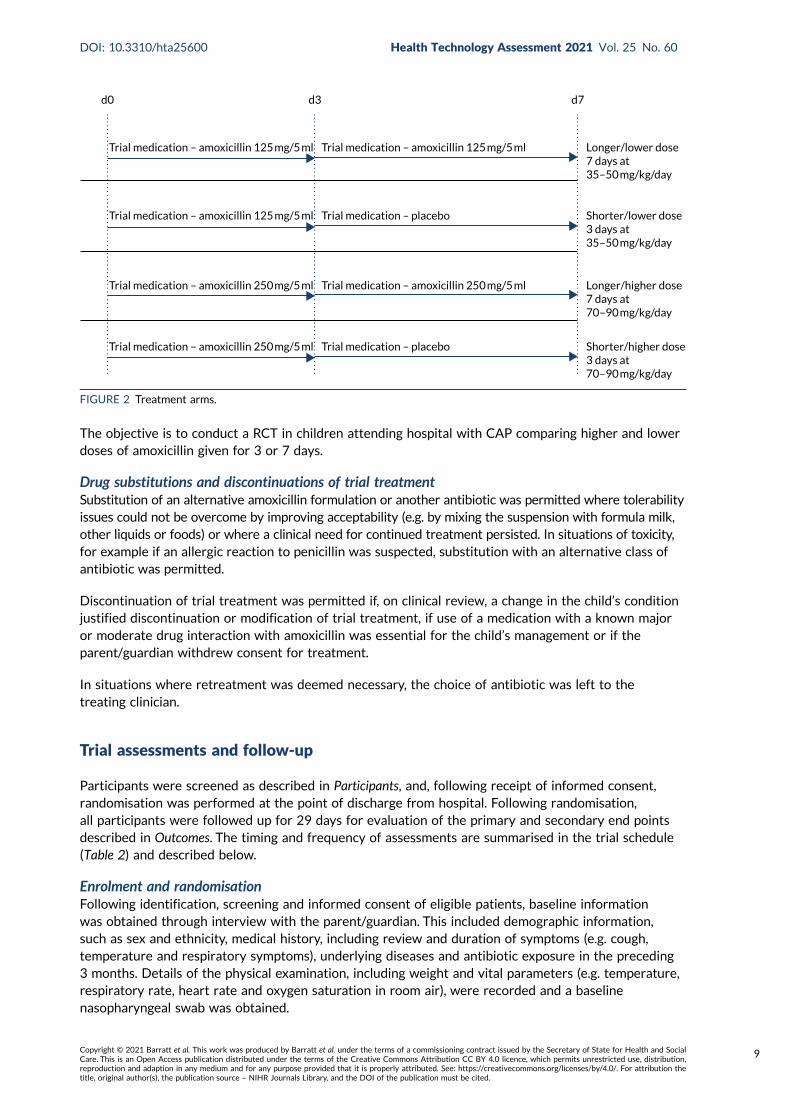
The objective is to conduct a RCT in children attending hospital with CAP comparing higher and lowerdoses of amoxicillin given for 3 or 7 days.
Drug substitutions and discontinuations of trial treatmentSubstitution of an alternative amoxicillin formulation or another antibiotic was permitted where tolerabilityissues could not be overcome by improving acceptability (e.g. by mixing the suspension with formula milk,other liquids or foods) or where a clinical need for continued treatment persisted. In situations of toxicity,for example if an allergic reaction to penicillin was suspected, substitution with an alternative class ofantibiotic was permitted.
Discontinuation of trial treatment was permitted if, on clinical review, a change in the child’s conditionjustified discontinuation or modification of trial treatment, if use of a medication with a known majoror moderate drug interaction with amoxicillin was essential for the child’s management or if theparent/guardian withdrew consent for treatment.
In situations where retreatment was deemed necessary, the choice of antibiotic was left to thetreating clinician.
Trial assessments and follow-up
Participants were screened as described in Participants, and, following receipt of informed consent,randomisation was performed at the point of discharge from hospital. Following randomisation,all participants were followed up for 29 days for evaluation of the primary and secondary end pointsdescribed in Outcomes. The timing and frequency of assessments are summarised in the trial schedule(Table 2) and described below.
Enrolment and randomisationFollowing identification, screening and informed consent of eligible patients, baseline informationwas obtained through interview with the parent/guardian. This included demographic information,such as sex and ethnicity, medical history, including review and duration of symptoms (e.g. cough,temperature and respiratory symptoms), underlying diseases and antibiotic exposure in the preceding3 months. Details of the physical examination, including weight and vital parameters (e.g. temperature,respiratory rate, heart rate and oxygen saturation in room air), were recorded and a baselinenasopharyngeal swab was obtained.
d0 d3 d7
Trial medication – amoxicillin 125 mg/5 ml
Trial medication – amoxicillin 125 mg/5 ml
Trial medication – amoxicillin 250 mg/5 ml
Trial medication – amoxicillin 250 mg/5 ml
Trial medication – amoxicillin 125 mg/5 ml
Trial medication – placebo
Trial medication – amoxicillin 250 mg/5 ml
Trial medication – placebo
Longer/lower dose7 days at35–50 mg/kg/day
Shorter/lower dose3 days at35–50 mg/kg/day
Longer/higher dose7 days at70–90 mg/kg/day
Shorter/higher dose3 days at70–90 mg/kg/day
FIGURE 2 Treatment arms.
DOI: 10.3310/hta25600 Health Technology Assessment 2021 Vol. 25 No. 60
Copyright © 2021 Barratt et al. This work was produced by Barratt et al. under the terms of a commissioning contract issued by the Secretary of State for Health and SocialCare. This is an Open Access publication distributed under the terms of the Creative Commons Attribution CC BY 4.0 licence, which permits unrestricted use, distribution,reproduction and adaption in any medium and for any purpose provided that it is properly attributed. See: https://creativecommons.org/licenses/by/4.0/. For attribution thetitle, original author(s), the publication source – NIHR Journals Library, and the DOI of the publication must be cited.
9
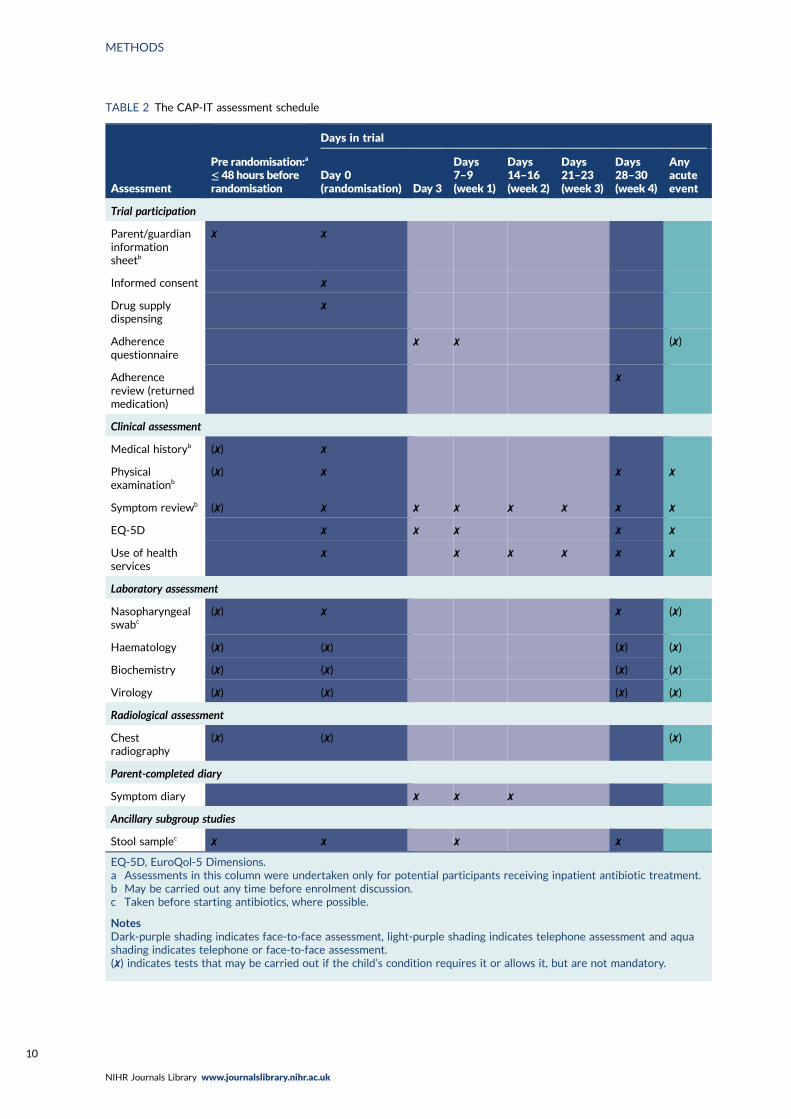
TABLE 2 The CAP-IT assessment schedule
Assessment
Pre randomisation:a
≤ 48 hours beforerandomisation
Days in trial
Day 0(randomisation) Day 3
Days7–9(week 1)
Days14–16(week 2)
Days21–23(week 3)
Days28–30(week 4)
Anyacuteevent
Trial participation
Parent/guardianinformationsheetb
✗ ✗
Informed consent ✗
Drug supplydispensing
✗
Adherencequestionnaire
✗ ✗ (✗)
Adherencereview (returnedmedication)
✗
Clinical assessment
Medical historyb (✗) ✗
Physicalexaminationb
(✗) ✗ ✗ ✗
Symptom reviewb (✗) ✗ ✗ ✗ ✗ ✗ ✗ ✗
EQ-5D ✗ ✗ ✗ ✗ ✗
Use of healthservices
✗ ✗ ✗ ✗ ✗ ✗
Laboratory assessment
Nasopharyngealswabc
(✗) ✗ ✗ (✗)
Haematology (✗) (✗) (✗) (✗)
Biochemistry (✗) (✗) (✗) (✗)
Virology (✗) (✗) (✗) (✗)
Radiological assessment
Chestradiography
(✗) (✗) (✗)
Parent-completed diary
Symptom diary ✗ ✗ ✗
Ancillary subgroup studies
Stool samplec ✗ ✗ ✗ ✗
EQ-5D, EuroQol-5 Dimensions.a Assessments in this column were undertaken only for potential participants receiving inpatient antibiotic treatment.b May be carried out any time before enrolment discussion.c Taken before starting antibiotics, where possible.
NotesDark-purple shading indicates face-to-face assessment, light-purple shading indicates telephone assessment and aquashading indicates telephone or face-to-face assessment.(✗) indicates tests that may be carried out if the child’s condition requires it or allows it, but are not mandatory.
METHODS
NIHR Journals Library www.journalslibrary.nihr.ac.uk
10
No additional tests were mandated, but results were collected if tests were performed as partof clinical care, including haematology tests (e.g. haemoglobin, platelet count, leucocyte count,neutrophil count and lymphocyte count), biochemistry tests (e.g. C-reactive protein, procalcitoninand electrolytes), virology [rapid testing for respiratory syncytial virus and influenza A/B (any method)]and chest radiography.
Parents/guardians were provided with trial materials, including a symptom diary, participant informationsheet, IMP administration instructions and contact details for the trial team. The symptom diary collecteddata pertinent to the primary and secondary outcomes and was completed by parents for 14 daysfollowing randomisation.
Follow-upTelephone contact was made with participants on days 3, 7–9, 14–16 and 21–23, with a face-to facevisit within 2 days of day 28. At these contacts, primary and secondary end points were reviewed,including additional antibiotic treatment, clinical signs and symptoms, adverse treatment effects andIMP adherence. During face-to-face visits (final or unscheduled) a nasopharyngeal swab was collected,and, if CAP symptoms were ongoing, physical examination findings and physiological parameters werecollected. If a hospitable face-to-face visit was not possible for final follow-up, it was attempted bytelephone or as a home visit. If this failed, despite reasonable efforts, primary end-point data weresought through contact with the general practitioner (GP) where consent had been given to do so.
If participants required acute clinical assessment for ongoing/re-emerging symptoms during the follow-upperiod, the treating clinician’s judgement determined if investigations, treatment or hospitalisationwas required. On premature discontinuation of IMP, irrespective of reason, parents/guardians wereencouraged to remain in follow-up. However, parent/guardian decisions were respected, and if follow-upwas stopped prematurely, then data and samples already collected were included in the analysis unlessparents/guardians requested otherwise.
Data collection and handlingData were recorded on paper case report forms and entered onto the CAP-IT database by clinical orresearch staff at each site. Staff with data entry responsibilities completed standardised databasetraining before being granted access to the database. Data were exported into Stata® (v15.1) (StataCorp LP,College Station, TX, USA) for analysis.
Randomisation
Eligibility was confirmed by CAP-IT site investigators through completion of an eligibility checklist.Patients were randomised simultaneously to each of the two factorial randomisations in a 1 : 1 ratio.Randomisation was stratified by group (PED and ward) according to whether or not they had receivedany non-trial antibiotics in hospital before being enrolled.
A computer-generated randomisation list was produced by the trial statistician based on randompermuted blocks of eight. Each block contained an equal number of the four possible combinations ofdose and duration in random order. The IMP supplier packaged the trial medication into kits that weregrouped into blocks of eight, in accordance with to the randomisation list specification. Blinded IMPlabels were applied to each kit, which contained the kit identifications (IDs). Kit IDs were made up offour numerical digits, the first three of which represented the block ID and fourth specified the kit IDwithin the block. Blinded randomised blocks of IMP were delivered to trial sites and participants wererandomised by dispensing the next sequentially numbered kit within the active block.
DOI: 10.3310/hta25600 Health Technology Assessment 2021 Vol. 25 No. 60
Copyright © 2021 Barratt et al. This work was produced by Barratt et al. under the terms of a commissioning contract issued by the Secretary of State for Health and SocialCare. This is an Open Access publication distributed under the terms of the Creative Commons Attribution CC BY 4.0 licence, which permits unrestricted use, distribution,reproduction and adaption in any medium and for any purpose provided that it is properly attributed. See: https://creativecommons.org/licenses/by/4.0/. For attribution thetitle, original author(s), the publication source – NIHR Journals Library, and the DOI of the publication must be cited.
11
Blinding
All treating clinicians, parents/guardians and outcome assessors [including End-Point ReviewCommittee (ERC) members] were blinded to the allocated treatment. The use of placebo, as wellas the permuted block randomisation strategy and blinded drug kits, ensured that parents andclinic staff remained blinded to amoxicillin duration and dose.
Access to the randomisation list was restricted to trial statisticians and IMP repackagers, andunblinded data were reviewed confidentially only by the Independent Data Monitoring Committee(IDMC) (annually) and trial statisticians. The Trial Management Team remained blinded until afterthe trial end and completion of the statistical analysis in accordance with the prespecified statisticalanalysis plan (SAP).
Unblinding was possible in situations where a treating clinician deemed it necessary, for example inthe case of a significant overdose. This could be performed using an emergency unblinding systemaccessible through the CAP-IT website. Only the treating clinician would then be informed of thechild’s allocation, maintaining the blinding of the trial team.
Outcomes
Primary outcomeThe primary outcome for CAP-ITwas defined as any clinically indicated systemic antibacterial treatmentprescribed for respiratory tract infection (including CAP) other than trial medication up to and at week 4final follow-up (i.e. day 28). Prescription of non-trial medication when the primary reason was (1) illnessother than respiratory tract infection, (2) intolerance of or adverse reaction to IMP, (3) parentalpreference or (4) administrative error did not constitute a primary end point.
An ERC, comprising doctors independent of the Trial Management Group and blinded to randomisedallocations, reviewed all cases of a participant being prescribed non-trial systemic antibacterialtreatment. The main role of the ERC was to adjudicate, based on all available data, whether or not theprimary outcome was met. The ERC classified non-trial systemic antibacterial treatment as being forrespiratory tract infection with likelihoods of ‘definitely/probably’, ‘possibly’, ‘unlikely’ or ‘too littleinformation’. Those infections categorised as ‘CAP’, ‘chest infection’ or ‘other respiratory tract infection’with a treatment likelihood assessment of ‘definitely/probably’ or ‘possibly’ were regarded as fulfillingthe primary end point.
Information on additional antibacterial treatments was collected from parents through follow-uptelephone contact with parents on days 3, 7, 14 and 21, at the final visit contact and finally througha daily diary completed by parents on days 1–14.
During enrolment, parents were asked to provide consent for the research teams to contact their child’sgeneral practice to collect information regarding antibacterial treatment given during the follow-upperiod. This additional information supported the ERC in accurately adjudicating events. In addition, thisallowed the collection of primary outcome data where contact with participants had been lost prior tocompletion of the follow-up period.
Changes to primary end pointThe primary end-point definition was clarified in protocol v3.0 to specify that ‘systemic antibacterial’treatments should avoid inclusion of topical antibiotics, which were not of interest. In protocol v4.0,the primary end point was refined further, resulting in the definition in Primary outcome. This definitionspecified that the systemic antibacterial must be clinically indicated and prescribed for a respiratorytract infection (including CAP), as adjudicated by the ERC.
METHODS
NIHR Journals Library www.journalslibrary.nihr.ac.uk
12
Secondary outcomesSecondary outcomes included measures of morbidity, antimicrobial resistance and trialmedication adherence.
MorbidityMorbidity secondary outcomes included severity and duration of parent/guardian-reported CAPsymptoms and specified clinical AEs.
The following CAP symptoms were elicited at baseline, in follow-up telephone calls at days 4, 8,15 and 22 and at the final visit, as well as at unscheduled visits: cough, wet cough (i.e. phlegm),breathing faster (i.e. shortness of breath), wheeze, sleep disturbed by cough, vomiting (includingafter cough), eating/drinking less and interference with normal activity. Parents/guardians wereasked to grade each symptom using the following five categories: (1) not present, (2) slight/little,(3) moderate, (4) bad and (5) severe/very bad. Date of start and resolution were also elicited.Symptoms and their severity (using the same categories) were obtained daily on the symptomdiary for 14 days from randomisation.
Information about diarrhoea, skin rash and thrush was collected and graded in the same way asCAP symptoms. In addition, AEs related to the stopping of trial medication or the start of non-trialantibiotics were recorded.
Other AEs meeting the criteria for seriousness [i.e. serious adverse events (SAEs)] were reportedwithin 24 hours of research sites becoming aware of the event. SAEs were classified by systemorgan class and lower-level term in accordance with the Medical Dictionary for Regulatory Activities(MedDRA®; version 21.1) and were graded using the Division of Aids (DAIDS) Table for Grading theSeverity of Adult and Paediatric Adverse Events.81
Antimicrobial resistanceThe antimicrobial resistance secondary end point was defined as phenotypic resistance to penicillinat week 4 measured in S. pneumoniae isolates colonising the nasopharynx. Carriage and resistanceof S. pneumoniae isolates were assessed by analysis of nasopharyngeal samples, collected fromparticipants at baseline, at the final visit (i.e. day 29) and at any unscheduled visits during thefollow-up period.
Phenotypic penicillin susceptibility was determined for S. pneumoniae isolates by microbroth dilutionacross a dilution range for penicillin of 0.016–16 mg/l and interpreted in accordance with EUCAST(European Committee on Antimicrobial Susceptibility Testing) clinical break-point tables v10.0 forbenzylpenicillin and S. pneumoniae (infections other than meningitis) [i.e. sensitive (MIC ≤ 0.064 mg/l),non-susceptible (MIC 0.125–2 mg/l) or resistant (MIC > 2 mg/l)].82 The same approach was taken foramoxicillin susceptibility testing [isolates with MIC ≤ 0.5 mg/l were sensitive and isolates with MIC> 1 mg/l were resistant). S. pneumoniae ATCC® 49619™ (ATCC, Manassas, VA, USA) was used forquality control.82
AdherenceData on IMP adherence were elicited during follow-up telephone calls, at the final visit (where follow-uptelephone calls were not performed) and at unscheduled visits. At each time point, parents/guardianswere asked if IMP had been stopped early, and, if so, the date of the last dose taken and for whichof the following reasons: CAP improved/cured, CAP worsened/not improving or gagging/spitting out/refusing. In addition, parents/guardians were asked how many doses of each bottle were either missedor were less than the full prescribed volume.
DOI: 10.3310/hta25600 Health Technology Assessment 2021 Vol. 25 No. 60
Copyright © 2021 Barratt et al. This work was produced by Barratt et al. under the terms of a commissioning contract issued by the Secretary of State for Health and SocialCare. This is an Open Access publication distributed under the terms of the Creative Commons Attribution CC BY 4.0 licence, which permits unrestricted use, distribution,reproduction and adaption in any medium and for any purpose provided that it is properly attributed. See: https://creativecommons.org/licenses/by/4.0/. For attribution thetitle, original author(s), the publication source – NIHR Journals Library, and the DOI of the publication must be cited.
13

Sample size
The sample size was based on demonstrating non-inferiority for the primary efficacy end point for eachof the duration and dose randomisations. Although inflation factors have been advocated for factorialtrials to account for interaction between the interventions, or a reduction in the number of events, thisis not necessary if either randomised intervention (dose or duration) has a null effect (i.e. the underlyinghypothesis with a non-inferiority design), as marginal analyses can then be conducted.
The expected antibiotic retreatment rate was originally assumed to be 5%. However, data emergingduring the enrolment phase suggested that the primary outcome event rate was considerably higher,at approximately 15%. This necessitated a change in the non-inferiority margin, which was increasedfrom 4% to 8%. This is still lower than the European Medicines Agency’s recommendation of a 10%non-inferiority margin for adult CAP trials.83 Assuming a 15% event rate, 8% non-inferiority margin(on a risk difference scale) assessed against a two-sided 90% confidence interval (CI) and 15% loss tofollow-up, the sample size was calculated as 800 children to achieve 90% power.
Statistical methods
Analysis principlesThe primary analysis adopted a modified intention-to-treat (ITT) principle, that is it included all patientsenrolled and analysed in accordance with the group to which they were randomised, regardless oftreatment actually received. One modification to the strict ITT principle prespecified in the trial SAP wasthe exclusion of randomised patients who did not take any IMP. Owing to the blinded nature of the trial, therisk of introducing bias by exclusion of these patients was considered minimal. A secondary on-treatmentanalysis was performed that excluded ‘non-adherent’ participants, defined as having taken < 80% ofscheduled trial medication, based on (1) all trial medication including placebo and (2) active drug only.
In the primary and secondary analyses, the main effect for each randomisation was estimated bycollapsing across levels of the other randomisation factor, supplemented by tests for interactionbetween the two randomisations and with previous systemic antibacterial exposure. Interaction wasassessed on an additive scale.
For continuous variables, the mean (with standard deviation) or median [with interquartile range (IQR)]of absolute values and of changes in absolute values from baseline were reported by scheduledtelephone calls/visits and by randomised group.
For binary and categorical variables, differences between groups at particular time points were testedusing chi-squared tests (or exact tests, if appropriate). For ordered variables, differences betweengroups at particular time points were tested using rank tests.
For time-to-event outcomes, the time from baseline to the event date was used, applying Kaplan–Meierestimation.Where participants did not experience an event, data were censored at the date of last reviewof that event. Differences between groups were tested using a log-rank test.
Formal statistical adjustment for multiple comparisons (particularly pertinent for some of the secondaryend points) were not applied, and significance tests should be interpreted in the context of the totalnumber of related comparisons performed.
The primary end point was analysed within a non-inferiority framework, where significance testing hasno clear role (with emphasis instead on CIs). Secondary outcomes were analysed within a superiorityframework (i.e. assessing the null hypothesis of no difference). All estimates, including differencesbetween randomised groups, are presented with two-sided 90% CIs (rather than the more conventional95%) to achieve consistency with the reporting of the primary end point.
METHODS
NIHR Journals Library www.journalslibrary.nihr.ac.uk
14
Primary outcomeThe proportion of children meeting the primary end point was obtained from the cumulative incidenceat day 28, as estimated by Kaplan–Meier methods (i.e. accounting for the differential follow-up times).Participants with incomplete primary outcome data (e.g. as a result of a missed final visit) were censoredat the time of their last contact. In the case of participants who missed the final visit but whose GPconfirmed that no additional antibacterials were prescribed during the follow-up period, day 28 was usedas the censoring date.
Kaplan–Meier estimates were used to derive the risk difference between the randomised groups forthe primary end point, and standard errors and CIs for the risk difference were derived from theestimated standard errors of the individual survival functions.
Lower-dose treatment and shorter-duration treatment were considered ‘non-inferior’ to higher-dosetreatment and longer-duration treatment, respectively, if the upper limit of the two-sided 90% CI forthe difference in the proportion of children with the primary end point at day 28 was less than thenon-inferiority margin of 8%. Although the non-inferiority margin was important to the design of thetrial, it is less relevant to its interpretation, which should be based on observed estimates and CIs.
Sensitivity analysesAs described in Primary outcome, the primary analysis included only end points confirmed by the ERCas clinically indicated antibacterial treatment for respiratory tract infection (including CAP). To improveconfidence in the primary analysis, the following sensitivity analyses were performed for the primaryend point:
l including all systemic antibacterial treatments other than trial medication regardless of reasonand indication
l including only ERC-adjudicated clinically indicated systemic antibacterial treatment where eitherCAP or ‘chest infection’ was specified as the reason for this treatment (rather than any respiratorytract infection)
l as above, but also including, as an end point, all systemic antibacterial treatments for CAP or ‘chestinfection’ where the clinical indication was ‘unlikely’, as adjudicated by the ERC
l disregarding systemic antibacterial prescriptions occurring within the first 3 days from randomisation,as these events cannot be related to the treatment duration randomisation, to allow comparison ofshorter and longer treatment.
Subgroup analysesTwo subgroup analyses were performed. The first considered severity of CAP at enrolment to providereassurance that a potential null effect was not due to dilution arising from inclusion of children withmild disease. The main efficacy analysis was repeated, but included only participants with severe CAP,defined as two or more of the following abnormal signs/symptoms at enrolment: raised respiratoryrate (> 37 breaths/minute for children aged 1–2 years; > 28 breaths/minute for children aged 3–5 years),oxygen saturation < 92% in room air and presence of chest retractions.
The second subgroup analysis considered the potential for seasonal changes in infections, by includingonly primary end points occurring in the two winter seasons spanned by CAP-IT. This was based onPublic Health England reports of circulating viruses/bacteria in the winter seasons spanned by CAP-IT.
Community-acquired pneumonia symptomsThe severity of the symptoms (detailed in Morbidity) were reviewed by the number (%) of symptoms ineach severity category at each scheduled contact visit and analysed as described for ordered outcomesin Analysis principles.
DOI: 10.3310/hta25600 Health Technology Assessment 2021 Vol. 25 No. 60
Copyright © 2021 Barratt et al. This work was produced by Barratt et al. under the terms of a commissioning contract issued by the Secretary of State for Health and SocialCare. This is an Open Access publication distributed under the terms of the Creative Commons Attribution CC BY 4.0 licence, which permits unrestricted use, distribution,reproduction and adaption in any medium and for any purpose provided that it is properly attributed. See: https://creativecommons.org/licenses/by/4.0/. For attribution thetitle, original author(s), the publication source – NIHR Journals Library, and the DOI of the publication must be cited.
15

Duration of a symptom was measured as time from baseline to resolution, defined as the first day thesymptom was reported as not present. This was analysed as a time-to-event outcome, as specified inAnalysis principles. Where a symptom was not present at enrolment, participants were excluded fromthe analysis of that symptom.
Clinical adverse eventsSolicited clinical AEs, specified in Morbidity, were analysed overall and by randomised arm. Analysisconsidered total number of events, number of participants with at least one event, the number ofparticipants with at least one new event and event severity. These variables were analysed asdescribed for binary outcomes in Analysis principles.
In addition, the number of participants experiencing at least one SAE were compared as a binary outcome(see Analysis principles).
Antimicrobial resistanceDescriptive analyses of baseline samples were analysed as follows: proportion of samples with positiveS. pneumoniae culture, frequency distribution of broth microdilution MIC values and proportion ofsamples classified as S – susceptible, standard dosing regimen; I – intermediate, increased exposure;and R – resistant (see Secondary outcomes).
S. pneumoniae carriage, determined by tabulation of the proportion of samples with positiveS. pneumoniae culture at the final visit by randomisation group, was compared using tests for binaryvariables, as described in Secondary outcomes. S. pneumoniae culture results at the final visit werecross-tabulated with baseline culture results (including missing values).
For the antimicrobial resistance analysis, a descriptive analysis of the proportion of samples withresistance to penicillin (S – susceptible/I – intermediate/R – resistant categorisation) at the final visitwas performed using both cut-off points (penicillin and amoxicillin) described in Secondary outcomes.This analysis was repeated, first, including only samples with a positive S. pneumoniae culture resultand, second, including all samples. Randomised groups were compared by tests for binary variables,and cross-tabulation of penicillin resistance at the final visit compared with penicillin resistance atbaseline was performed as a descriptive analysis.
Finally, the change in broth microdilution MIC (in patients for whom this was measured at both thebaseline and the final visit) was analysed with randomisation group as factors and after adjusting forbaseline MIC.
Interim analyses
The trial was reviewed by the CAP-IT IDMC. They met three times over the course of the trial: onceat a joint meeting with the Trial Steering Committee (TSC) in June 2017 and twice in strict confidencein January 2018 and January 2019. The IDMC reviewed unblinded safety and efficacy data and maderecommendations through correspondence to the TSC following each meeting.
Patient and public involvement
Parents of young children were involved during the development and delivery of CAP-IT. A PPIrepresentative was a member of the TSC, contributing at meetings and in an ad hoc fashion whenrequired. When considering the research question, the trial team were advised by parents that shorterantibiotic courses would be welcomed if equally effective, because of difficulties in giving medicine(due to palatability or challenges with day care and daytime doses). For the same reasons, parents
METHODS
NIHR Journals Library www.journalslibrary.nihr.ac.uk
16
supported the twice-daily dosing of the CAP-IT. Multiple PPI representatives reviewed and providedinput on the patient information materials, including the CAP-IT information film, to ensure that theywere clear, easy to understand and not off-putting to parents, while still providing sufficient detail toallow informed consent. Valuable input was provided from the PPI representative on the CAP-IT TSCon the plan for dissemination of the CAP-IT results.
Protocol amendments
The CAP-IT protocol v.2.0 was active when recruitment to CAP-IT commenced in January 2017. Twoprotocol amendments were completed subsequently, with version 3 implemented in September 2017 andversion 4 in December 2018. Amendments were largely in relation to selection criteria (see Exclusioncriteria) and the SAP (to which three significant updates were made on the basis of accumulating trialdata). First, a stratified analysis was originally planned based on the PED and ward groups. This waschanged to a joint analysis in protocol version 3 because of significant clinical overlap (see Appendix 1for more details) Second, the primary end-point definition was made more specific in protocol version 3and further refined in version 4 (see Changes to primary end point). Finally, the non-inferiority margin wasadjusted, as the primary end-point event rate had been substantially underestimated. The trial and allsubstantial amendments were approved by the London – West London & GTAC Research EthicsCommittee (reference 16/LO/0831).
DOI: 10.3310/hta25600 Health Technology Assessment 2021 Vol. 25 No. 60
Copyright © 2021 Barratt et al. This work was produced by Barratt et al. under the terms of a commissioning contract issued by the Secretary of State for Health and SocialCare. This is an Open Access publication distributed under the terms of the Creative Commons Attribution CC BY 4.0 licence, which permits unrestricted use, distribution,reproduction and adaption in any medium and for any purpose provided that it is properly attributed. See: https://creativecommons.org/licenses/by/4.0/. For attribution thetitle, original author(s), the publication source – NIHR Journals Library, and the DOI of the publication must be cited.
17

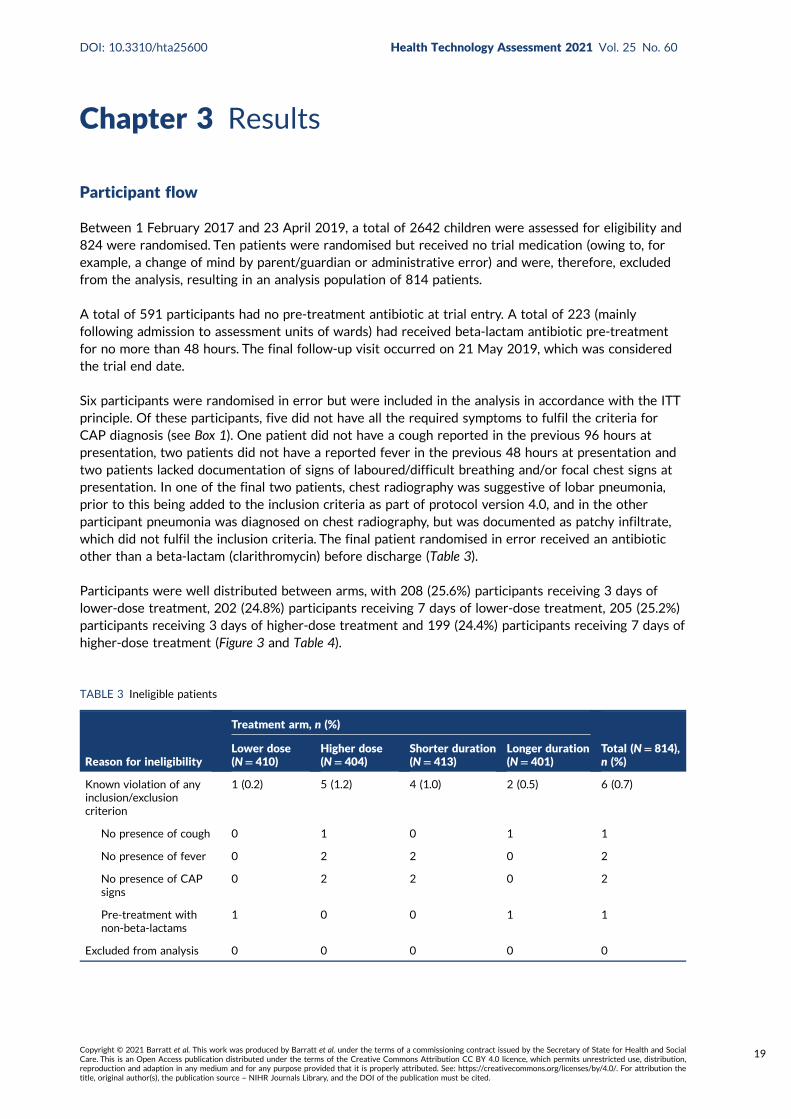
Chapter 3 Results
Participant flow
Between 1 February 2017 and 23 April 2019, a total of 2642 children were assessed for eligibility and824 were randomised. Ten patients were randomised but received no trial medication (owing to, forexample, a change of mind by parent/guardian or administrative error) and were, therefore, excludedfrom the analysis, resulting in an analysis population of 814 patients.
A total of 591 participants had no pre-treatment antibiotic at trial entry. A total of 223 (mainlyfollowing admission to assessment units of wards) had received beta-lactam antibiotic pre-treatmentfor no more than 48 hours. The final follow-up visit occurred on 21 May 2019, which was consideredthe trial end date.
Six participants were randomised in error but were included in the analysis in accordance with the ITTprinciple. Of these participants, five did not have all the required symptoms to fulfil the criteria forCAP diagnosis (see Box 1). One patient did not have a cough reported in the previous 96 hours atpresentation, two patients did not have a reported fever in the previous 48 hours at presentation andtwo patients lacked documentation of signs of laboured/difficult breathing and/or focal chest signs atpresentation. In one of the final two patients, chest radiography was suggestive of lobar pneumonia,prior to this being added to the inclusion criteria as part of protocol version 4.0, and in the otherparticipant pneumonia was diagnosed on chest radiography, but was documented as patchy infiltrate,which did not fulfil the inclusion criteria. The final patient randomised in error received an antibioticother than a beta-lactam (clarithromycin) before discharge (Table 3).
Participants were well distributed between arms, with 208 (25.6%) participants receiving 3 days oflower-dose treatment, 202 (24.8%) participants receiving 7 days of lower-dose treatment, 205 (25.2%)participants receiving 3 days of higher-dose treatment and 199 (24.4%) participants receiving 7 days ofhigher-dose treatment (Figure 3 and Table 4).
TABLE 3 Ineligible patients
Reason for ineligibility
Treatment arm, n (%)
Total (N= 814),n (%)
Lower dose(N= 410)
Higher dose(N= 404)
Shorter duration(N= 413)
Longer duration(N= 401)
Known violation of anyinclusion/exclusioncriterion
1 (0.2) 5 (1.2) 4 (1.0) 2 (0.5) 6 (0.7)
No presence of cough 0 1 0 1 1
No presence of fever 0 2 2 0 2
No presence of CAPsigns
0 2 2 0 2
Pre-treatment withnon-beta-lactams
1 0 0 1 1
Excluded from analysis 0 0 0 0 0
DOI: 10.3310/hta25600 Health Technology Assessment 2021 Vol. 25 No. 60
Copyright © 2021 Barratt et al. This work was produced by Barratt et al. under the terms of a commissioning contract issued by the Secretary of State for Health and SocialCare. This is an Open Access publication distributed under the terms of the Creative Commons Attribution CC BY 4.0 licence, which permits unrestricted use, distribution,reproduction and adaption in any medium and for any purpose provided that it is properly attributed. See: https://creativecommons.org/licenses/by/4.0/. For attribution thetitle, original author(s), the publication source – NIHR Journals Library, and the DOI of the publication must be cited.
19

Assessed for eligibility(n = 2642)
Underwent randomisation(n = 824)
Included in the analysis(n = 410)
Included in the analysis(n = 404)
Included in the analysis(n = 413)
Included in the analysis(n = 401)
Not enrolled(n = 1818)
• Discharged on antibiotic other than amoxicillin, n = 334• Failed ward group criteria,a
n = 671• Language barrier, n = 148• Eligible but not enrolled (parents’ decision), n = 665
Assigned to lower dose(n = 412)
• Did not take trial medication,b n = 2
Primary end-point statusfully characterised
(n = 401)
• Withdrew or were lost to follow-up,c n = 9
Assigned to higher dose(n = 412)
• Did not take trial medication,b n = 8
Primary end-point statusfully characterised
(n = 388)
• Withdrew or were lost to follow-up,c n = 16
Assigned to shorter duration(n = 416)
• Did not take trial medication,b n = 3
Primary end-point statusfully characterised
(n = 401)
• Withdrew or were lost to follow-up,c n = 12
Assigned to longer duration(n = 408)
• Did not take trial medication,b n = 7
Primary end-point statusfully characterised
(n = 388)
• Withdrew or were lost to follow-up,c n = 13
FIGURE 3 A CONSORT (Consolidated Standards of Reporting Trials) flow diagram. a, Inpatient stay > 48 hours andtreated with non-beta-lactam antibiotics as inpatients; b, these children have been excluded from all analyses; andc, follow-up included up to time of withdrawal or no further contact.
TABLE 4 Randomisation outcomes: analysis population
Outcome
Treatment arm, n (%)
Total (N= 814), n (%)PED (N= 591) Ward (N= 223)
Randomisation arm
Lower dose plus shorter duration 153 (25.9) 55 (24.7) 208 (25.6)
Lower dose plus longer duration 150 (25.4) 52 (23.3) 202 (24.8)
Higher dose plus shorter duration 146 (24.7) 59 (26.5) 205 (25.2)
Higher dose plus longer duration 142 (24.0) 57 (25.6) 199 (24.4)
Dose randomisation
Lower 303 (51.3) 107 (48.0) 410 (50.4)
Higher 288 (48.7) 116 (52.0) 404 (49.6)
Duration randomisation
Shorter 299 (50.6) 114 (51.1) 413 (50.7)
Longer 292 (49.4) 109 (48.9) 401 (49.3)
RESULTS
NIHR Journals Library www.journalslibrary.nihr.ac.uk
20

Baseline
Patient characteristicsBaseline patient characteristics were well balanced between the randomisation groups (see Table 4).The median age of participants was 2.5 (IQR 1.6–3.7) years, with a minimum and maximum age of0.5 and 8.8 years, respectively, and 52% were male (Table 5).
Medical historyOne-third of participants (30.7%) reported an underlying diagnosis of asthma or use of an asthmainhaler within the past month. The second most common comorbidity (affecting 20% of participants)was eczema, followed by food or drug allergies (9.6%) and hay fever (9.1%). Routine vaccinations hadbeen received by 95% of participants; the remaining 5% either had not had routine vaccinations (3.2%),or were of unknown vaccination status or had been vaccinated outside the UK (1.8%).
Vital parameters and clinical signsParticipant vital parameters were measured at presentation and were similar between randomisationgroups (Table 6). The median temperature was 38.1 °C (IQR 37.2–38.8 °C) and median oxygensaturation was 96% (IQR 95–98%). The median number of days for which a child had a cough atpresentation was 4 (IQR 2–7) days, and the median number of days for which a child had atemperature was 3 (IQR 1–4) days. The median weight was 13.5 (IQR 11.2–16.4) kg.
The most common baseline clinical signs were coryza [affecting 599/814 (73.6%) participants] andchest retractions [affecting 483/814 (59.3%) participants] (Table 7). Other baseline clinical signs wereless common (enlarged tonsils or pharyngitis, 22.5%; pallor, 20.9%; nasal flaring, 9.3%, inflamed/bulgingtympanic membrane or middle ear effusion, 9%; and stridor, 1.2%).
Multiple vital parameters and clinical signs differed at presentation between the children previouslyexposed and unexposed to antibiotics (see Table 7).
TABLE 5 Patient characteristics
Characteristic
Treatment arm
Total(N= 814)
Lower dose(N= 410)
Higher dose(N= 404)
Shorter duration(N= 413)
Longer duration(N= 401)
Age (years)
Median (IQR) 2.5 (1.6–3.7) 2.4 (1.6–3.7) 2.5 (1.7–3.7) 2.5 (1.5–3.7) 2.5 (1.6–3.7)
Minimum, maximum 0.5, 8.8 0.5, 8.5 0.5, 8.5 0.5, 8.8 0.5, 8.8
Sex, n (%)
Male 210 (51) 211 (52) 217 (53) 204 (51) 421 (52)
Female 200 (49) 193 (48) 196 (47) 197 (49) 393 (48)
Ethnicity, n (%)
White 275 (67) 279 (69) 283 (69) 271 (68) 554 (68)
Asian or British Asian 55 (13) 51 (13) 53 (13) 53 (13) 106 (13)
Black or black British 40 (10) 36 (9) 40 (10) 36 (9) 76 (9)
Other 40 (10) 38 (9) 37 (9) 41 (10) 78 (10)
Number (%) ofhouseholds with smokers
69 (17) 62 (16) 61 (15) 70 (18) 131 (16)
DOI: 10.3310/hta25600 Health Technology Assessment 2021 Vol. 25 No. 60
Copyright © 2021 Barratt et al. This work was produced by Barratt et al. under the terms of a commissioning contract issued by the Secretary of State for Health and SocialCare. This is an Open Access publication distributed under the terms of the Creative Commons Attribution CC BY 4.0 licence, which permits unrestricted use, distribution,reproduction and adaption in any medium and for any purpose provided that it is properly attributed. See: https://creativecommons.org/licenses/by/4.0/. For attribution thetitle, original author(s), the publication source – NIHR Journals Library, and the DOI of the publication must be cited.
21

TABLE 6 Medical history
Medical history
Treatment arm, n (%)
Total (N= 814),n (%)
Lower dose(N= 410)
Higher dose(N= 404)
Shorter duration(N= 413)
Longer duration(N= 401)
Asthma or inhaler usewithin past month
119 (29) 136 (34) 125 (30) 130 (32) 255 (31)
Hay fever 34 (8) 40 (10) 37 (9) 37 (9) 74 (9)
Food or drug allergy 38 (9) 40 (10) 37 (9) 41 (10) 78 (10)
Eczema 84 (20) 79 (20) 78 (19) 85 (21) 163 (20)
Prematurity 43 (10) 43 (11) 51 (12) 35 (9) 86 (11)
Routine vaccinations?
Yes 388 (95) 385 (95) 394 (95) 379 (95) 773 (95)
No 14 (3) 12 (3) 15 (4) 11 (3) 26 (3)
Not sure(or vaccinatedoutside UK)
8 (2) 7 (2) 4 (1) 11 (3) 15 (2)
Other underlyingdisease
37 (9) 19 (5) 21 (5) 35 (9) 56 (7)
TABLE 7 Vital parameters and clinical signs at presentation by randomisation status
Parameter/clinicalsign
Treatment arm
Total (N= 814)Lower dose(N= 410)
Higher dose(N= 404)
Shorter duration(N= 413)
Longer duration(N= 401)
Weight (kg), median(IQR)
13.6 (11.2–16.8) 13.3 (11.1–16.2) 13.8 (11.5–16.4) 13.2 (10.9–16.4) 13.5 (11.2–16.4)
Temperature (°C),median (IQR)
38.1 (37.3–38.9) 38.0 (37.2–38.6) 38.0 (37.1–38.7) 38.1 (37.3–38.8) 38.1 (37.2–38.8)
Temperature ≥ 38 °C,n (%)
227 (55) 214 (53) 221 (54) 220 (55) 441 (54)
Heart rate (b.p.m.),median (IQR)
146 (131–160) 143 (130–158) 144 (131–158) 146 (130–162) 145 (130–160)
Abnormal heart rate,a
n (%)307 (75) 271 (67) 282 (68) 296 (74) 578 (71)
Respiratory rate(breaths/minute),median (IQR)
37 (30–44) 38 (32–44) 36 (30–43) 38 (32–45) 37 (30–44)
Abnormal respiratoryrate,b n (%)
270 (66) 258 (64) 262 (64) 266 (67) 528 (65)
Oxygen saturation(%), median (IQR)
96 (95–98) 96 (95–98) 96 (95–98) 96 (95–98) 96 (95–98)
Abnormal oxygensaturation,c n (%)
18 (4) 25 (6) 18 (4) 25 (6) 43 (5)
Nasal flaring, n (%) 33 (8) 42 (10) 35 (9) 40 (10) 75 (9)
Chest retractions,n (%)
239 (58) 244 (60) 239 (58) 244 (61) 483 (59)
Pallor, n (%) 82 (20) 87 (22) 93 (23) 76 (19) 169 (21)
RESULTS
NIHR Journals Library www.journalslibrary.nihr.ac.uk
22
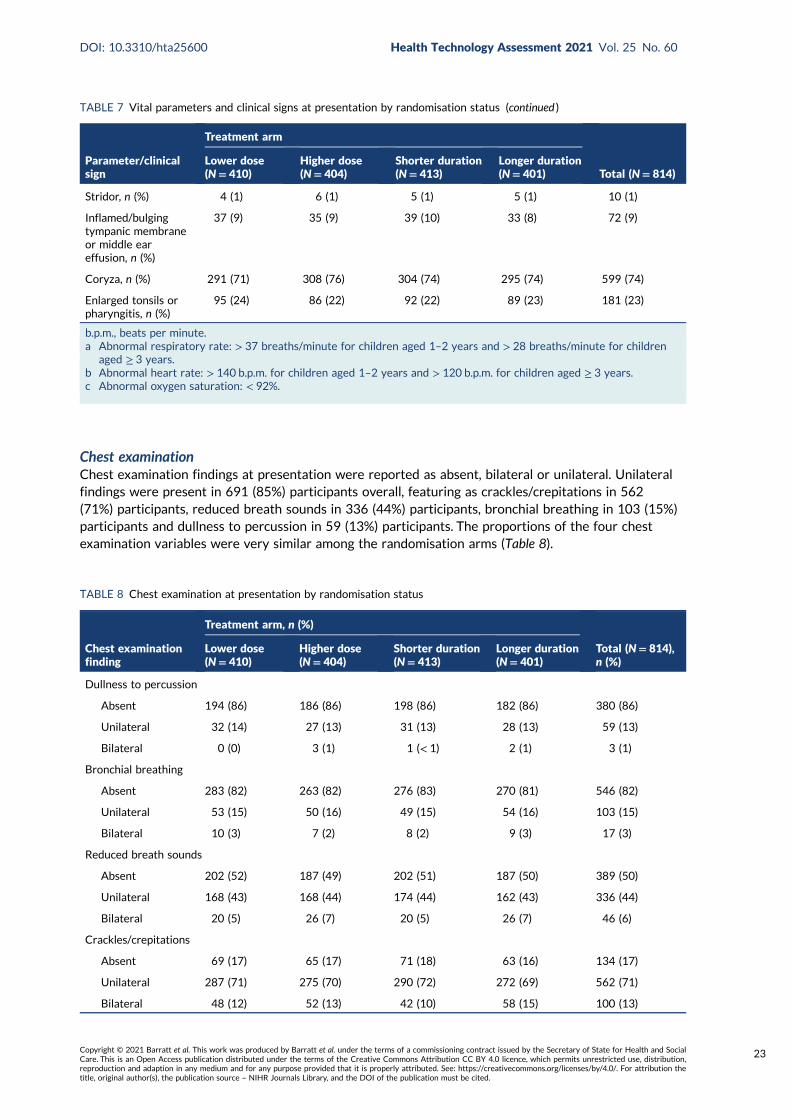
Chest examinationChest examination findings at presentation were reported as absent, bilateral or unilateral. Unilateralfindings were present in 691 (85%) participants overall, featuring as crackles/crepitations in 562(71%) participants, reduced breath sounds in 336 (44%) participants, bronchial breathing in 103 (15%)participants and dullness to percussion in 59 (13%) participants. The proportions of the four chestexamination variables were very similar among the randomisation arms (Table 8).
TABLE 7 Vital parameters and clinical signs at presentation by randomisation status (continued )
Parameter/clinicalsign
Treatment arm
Total (N= 814)Lower dose(N= 410)
Higher dose(N= 404)
Shorter duration(N= 413)
Longer duration(N= 401)
Stridor, n (%) 4 (1) 6 (1) 5 (1) 5 (1) 10 (1)
Inflamed/bulgingtympanic membraneor middle eareffusion, n (%)
37 (9) 35 (9) 39 (10) 33 (8) 72 (9)
Coryza, n (%) 291 (71) 308 (76) 304 (74) 295 (74) 599 (74)
Enlarged tonsils orpharyngitis, n (%)
95 (24) 86 (22) 92 (22) 89 (23) 181 (23)
b.p.m., beats per minute.a Abnormal respiratory rate: > 37 breaths/minute for children aged 1–2 years and > 28 breaths/minute for children
aged ≥ 3 years.b Abnormal heart rate: > 140 b.p.m. for children aged 1–2 years and > 120 b.p.m. for children aged ≥ 3 years.c Abnormal oxygen saturation: < 92%.
TABLE 8 Chest examination at presentation by randomisation status
Chest examinationfinding
Treatment arm, n (%)
Total (N= 814),n (%)
Lower dose(N= 410)
Higher dose(N= 404)
Shorter duration(N= 413)
Longer duration(N= 401)
Dullness to percussion
Absent 194 (86) 186 (86) 198 (86) 182 (86) 380 (86)
Unilateral 32 (14) 27 (13) 31 (13) 28 (13) 59 (13)
Bilateral 0 (0) 3 (1) 1 (< 1) 2 (1) 3 (1)
Bronchial breathing
Absent 283 (82) 263 (82) 276 (83) 270 (81) 546 (82)
Unilateral 53 (15) 50 (16) 49 (15) 54 (16) 103 (15)
Bilateral 10 (3) 7 (2) 8 (2) 9 (3) 17 (3)
Reduced breath sounds
Absent 202 (52) 187 (49) 202 (51) 187 (50) 389 (50)
Unilateral 168 (43) 168 (44) 174 (44) 162 (43) 336 (44)
Bilateral 20 (5) 26 (7) 20 (5) 26 (7) 46 (6)
Crackles/crepitations
Absent 69 (17) 65 (17) 71 (18) 63 (16) 134 (17)
Unilateral 287 (71) 275 (70) 290 (72) 272 (69) 562 (71)
Bilateral 48 (12) 52 (13) 42 (10) 58 (15) 100 (13)
DOI: 10.3310/hta25600 Health Technology Assessment 2021 Vol. 25 No. 60
Copyright © 2021 Barratt et al. This work was produced by Barratt et al. under the terms of a commissioning contract issued by the Secretary of State for Health and SocialCare. This is an Open Access publication distributed under the terms of the Creative Commons Attribution CC BY 4.0 licence, which permits unrestricted use, distribution,reproduction and adaption in any medium and for any purpose provided that it is properly attributed. See: https://creativecommons.org/licenses/by/4.0/. For attribution thetitle, original author(s), the publication source – NIHR Journals Library, and the DOI of the publication must be cited.
23
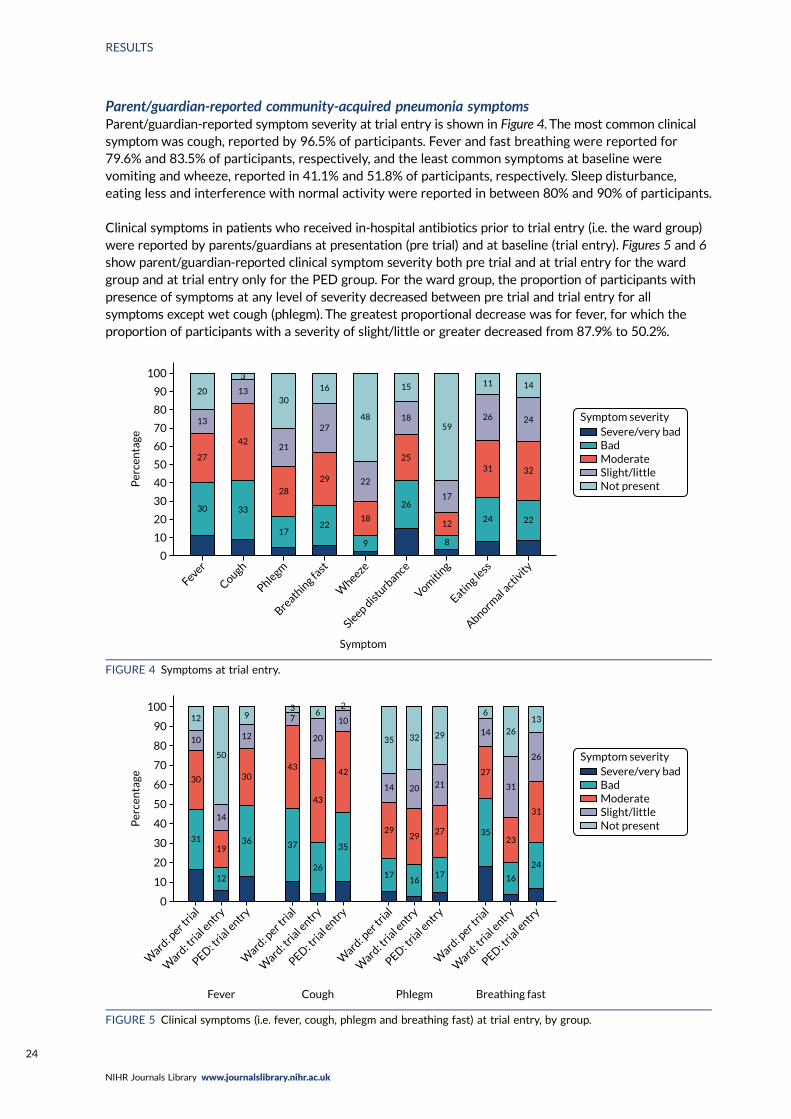
Parent/guardian-reported community-acquired pneumonia symptomsParent/guardian-reported symptom severity at trial entry is shown in Figure 4. The most common clinicalsymptom was cough, reported by 96.5% of participants. Fever and fast breathing were reported for79.6% and 83.5% of participants, respectively, and the least common symptoms at baseline werevomiting and wheeze, reported in 41.1% and 51.8% of participants, respectively. Sleep disturbance,eating less and interference with normal activity were reported in between 80% and 90% of participants.
Clinical symptoms in patients who received in-hospital antibiotics prior to trial entry (i.e. the ward group)were reported by parents/guardians at presentation (pre trial) and at baseline (trial entry). Figures 5 and 6show parent/guardian-reported clinical symptom severity both pre trial and at trial entry for the wardgroup and at trial entry only for the PED group. For the ward group, the proportion of participants withpresence of symptoms at any level of severity decreased between pre trial and trial entry for allsymptoms except wet cough (phlegm). The greatest proportional decrease was for fever, for which theproportion of participants with a severity of slight/little or greater decreased from 87.9% to 50.2%.
0
10
20
30
40
50
Per
cen
tage
60
70
80
90
100
Fever
Cough
Phlegm
Breath
ing fa
st
Wheeze
Sleep distu
rbance
Vomiti
ng
Eating le
ss
Abnormal a
ctivity
Severe/very badBadModerateSlight/littleNot present
20
3
13
42
33
17
28
21
30
16
27
29
22
Symptom
9
18
22
48
15
18
25
26
8
12
17
59
11
26
31
24 22
32
24 Symptom severity
14
13
27
30
FIGURE 4 Symptoms at trial entry.
0
10
20
30
40
50
Per
cen
tage
60
70
80
90
100
Ward
: per t
rial
Ward
: tria
l entry
PED: tria
l entry
Severe/very badBadModerateSlight/littleNot present
Ward
: per t
rial
Ward
: tria
l entry
PED: tria
l entry
Ward
: per t
rial
Ward
: tria
l entry
PED: tria
l entry
Ward
: per t
rial
Ward
: tria
l entry
PED: tria
l entry
Fever Cough Phlegm Breathing fast
31
30
10
12
50
14
19
12
36
30
12
937
43
37
26
43
20
62
10
42
35
17
29
14
35 32
20
29
1617
27
21
29
6
14
27
35
16
23
31
26
13
26
31
24
Symptom severity
FIGURE 5 Clinical symptoms (i.e. fever, cough, phlegm and breathing fast) at trial entry, by group.
RESULTS
NIHR Journals Library www.journalslibrary.nihr.ac.uk
24
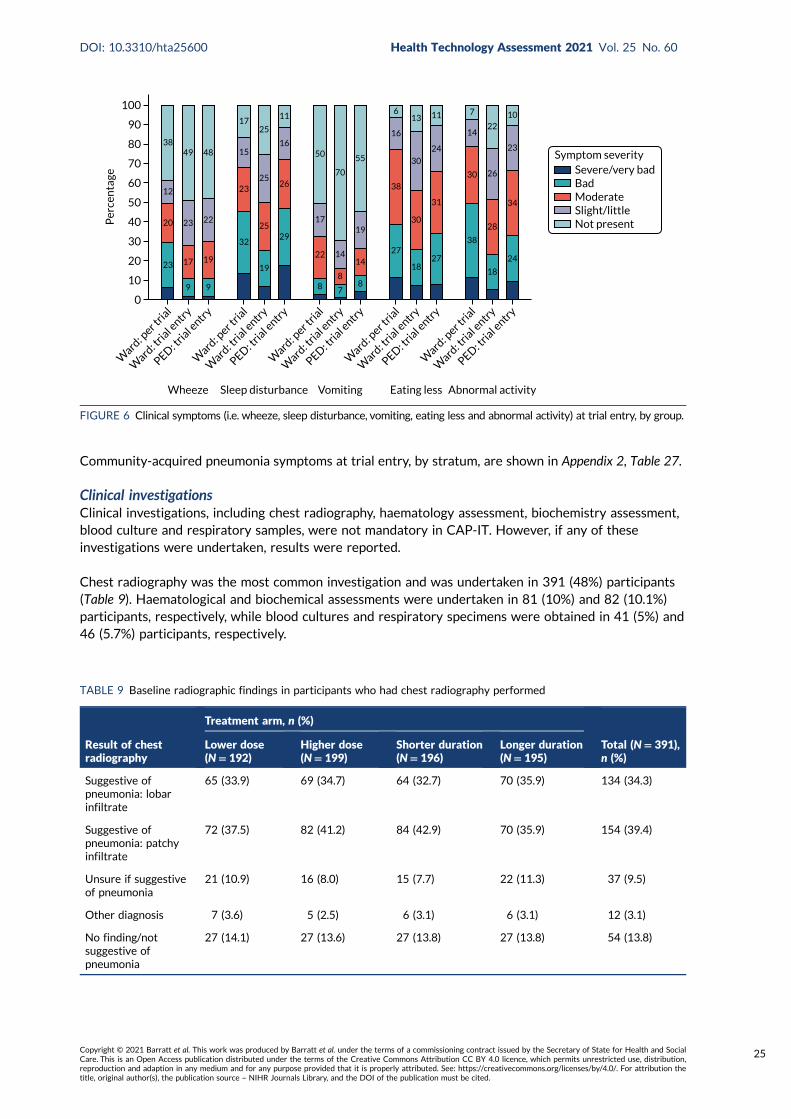
Community-acquired pneumonia symptoms at trial entry, by stratum, are shown in Appendix 2, Table 27.
Clinical investigationsClinical investigations, including chest radiography, haematology assessment, biochemistry assessment,blood culture and respiratory samples, were not mandatory in CAP-IT. However, if any of theseinvestigations were undertaken, results were reported.
Chest radiography was the most common investigation and was undertaken in 391 (48%) participants(Table 9). Haematological and biochemical assessments were undertaken in 81 (10%) and 82 (10.1%)participants, respectively, while blood cultures and respiratory specimens were obtained in 41 (5%) and46 (5.7%) participants, respectively.
0
10
20
30
40
50
Per
cen
tage
60
70
80
90
100
Ward
: per t
rial
Ward
: tria
l entry
PED: tria
l entry
Severe/very badBadModerateSlight/littleNot present
Ward
: per t
rial
Ward
: tria
l entry
PED: tria
l entry
Ward
: per t
rial
Ward
: tria
l entry
PED: tria
l entry
Ward
: per t
rial
Ward
: tria
l entry
PED: tria
l entry
Ward
: per t
rial
Ward
: tria
l entry
PED: tria
l entry
Wheeze Sleep disturbance Vomiting Abnormal activityEating less
23
9
17
23
49 48
22
19
9
32
23
15
1725
25
25
19
29
26
16
11
50
17
22
8 7
8
14
70
55
19
14
8
27
38
16
613
30
30
1827
31
24
11 7
14
30
38
18
28
26
2210
23
34
24
20
12
38
Symptom severity
FIGURE 6 Clinical symptoms (i.e. wheeze, sleep disturbance, vomiting, eating less and abnormal activity) at trial entry, by group.
TABLE 9 Baseline radiographic findings in participants who had chest radiography performed
Result of chestradiography
Treatment arm, n (%)
Total (N= 391),n (%)
Lower dose(N= 192)
Higher dose(N= 199)
Shorter duration(N= 196)
Longer duration(N= 195)
Suggestive ofpneumonia: lobarinfiltrate
65 (33.9) 69 (34.7) 64 (32.7) 70 (35.9) 134 (34.3)
Suggestive ofpneumonia: patchyinfiltrate
72 (37.5) 82 (41.2) 84 (42.9) 70 (35.9) 154 (39.4)
Unsure if suggestiveof pneumonia
21 (10.9) 16 (8.0) 15 (7.7) 22 (11.3) 37 (9.5)
Other diagnosis 7 (3.6) 5 (2.5) 6 (3.1) 6 (3.1) 12 (3.1)
No finding/notsuggestive ofpneumonia
27 (14.1) 27 (13.6) 27 (13.8) 27 (13.8) 54 (13.8)
DOI: 10.3310/hta25600 Health Technology Assessment 2021 Vol. 25 No. 60
Copyright © 2021 Barratt et al. This work was produced by Barratt et al. under the terms of a commissioning contract issued by the Secretary of State for Health and SocialCare. This is an Open Access publication distributed under the terms of the Creative Commons Attribution CC BY 4.0 licence, which permits unrestricted use, distribution,reproduction and adaption in any medium and for any purpose provided that it is properly attributed. See: https://creativecommons.org/licenses/by/4.0/. For attribution thetitle, original author(s), the publication source – NIHR Journals Library, and the DOI of the publication must be cited.
25
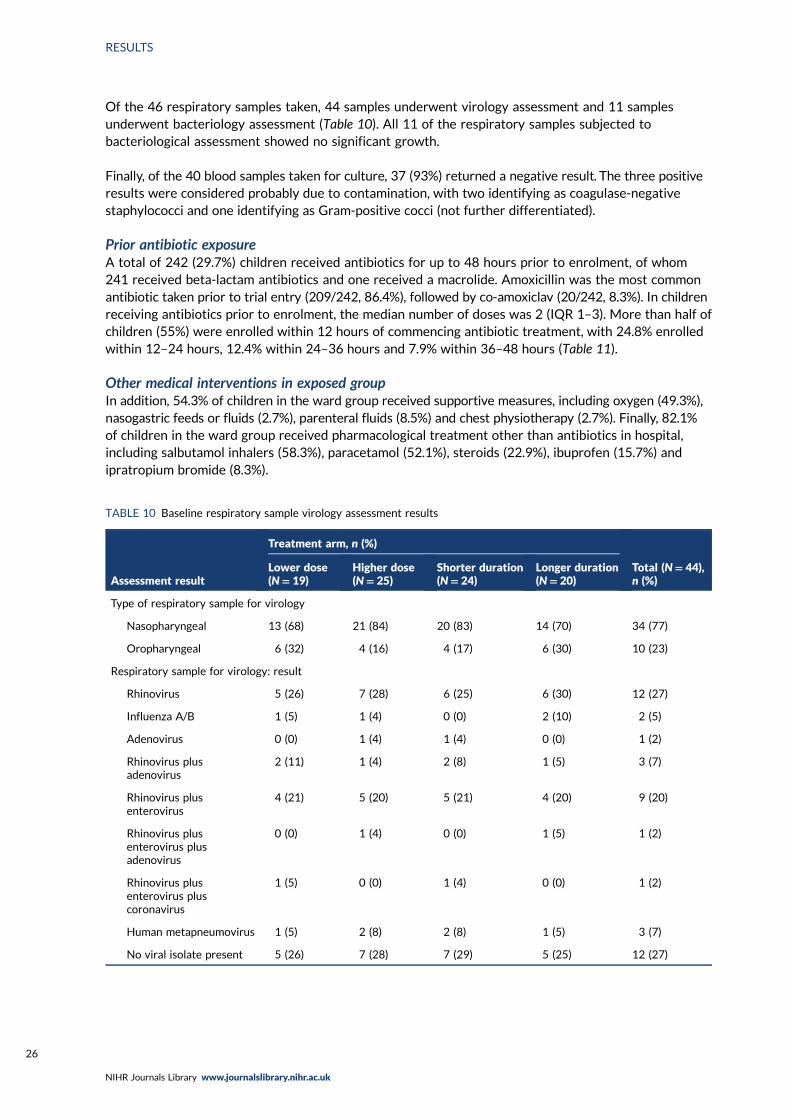
Of the 46 respiratory samples taken, 44 samples underwent virology assessment and 11 samplesunderwent bacteriology assessment (Table 10). All 11 of the respiratory samples subjected tobacteriological assessment showed no significant growth.
Finally, of the 40 blood samples taken for culture, 37 (93%) returned a negative result. The three positiveresults were considered probably due to contamination, with two identifying as coagulase-negativestaphylococci and one identifying as Gram-positive cocci (not further differentiated).
Prior antibiotic exposureA total of 242 (29.7%) children received antibiotics for up to 48 hours prior to enrolment, of whom241 received beta-lactam antibiotics and one received a macrolide. Amoxicillin was the most commonantibiotic taken prior to trial entry (209/242, 86.4%), followed by co-amoxiclav (20/242, 8.3%). In childrenreceiving antibiotics prior to enrolment, the median number of doses was 2 (IQR 1–3). More than half ofchildren (55%) were enrolled within 12 hours of commencing antibiotic treatment, with 24.8% enrolledwithin 12–24 hours, 12.4% within 24–36 hours and 7.9% within 36–48 hours (Table 11).
Other medical interventions in exposed groupIn addition, 54.3% of children in the ward group received supportive measures, including oxygen (49.3%),nasogastric feeds or fluids (2.7%), parenteral fluids (8.5%) and chest physiotherapy (2.7%). Finally, 82.1%of children in the ward group received pharmacological treatment other than antibiotics in hospital,including salbutamol inhalers (58.3%), paracetamol (52.1%), steroids (22.9%), ibuprofen (15.7%) andipratropium bromide (8.3%).
TABLE 10 Baseline respiratory sample virology assessment results
Assessment result
Treatment arm, n (%)
Total (N= 44),n (%)
Lower dose(N= 19)
Higher dose(N= 25)
Shorter duration(N= 24)
Longer duration(N= 20)
Type of respiratory sample for virology
Nasopharyngeal 13 (68) 21 (84) 20 (83) 14 (70) 34 (77)
Oropharyngeal 6 (32) 4 (16) 4 (17) 6 (30) 10 (23)
Respiratory sample for virology: result
Rhinovirus 5 (26) 7 (28) 6 (25) 6 (30) 12 (27)
Influenza A/B 1 (5) 1 (4) 0 (0) 2 (10) 2 (5)
Adenovirus 0 (0) 1 (4) 1 (4) 0 (0) 1 (2)
Rhinovirus plusadenovirus
2 (11) 1 (4) 2 (8) 1 (5) 3 (7)
Rhinovirus plusenterovirus
4 (21) 5 (20) 5 (21) 4 (20) 9 (20)
Rhinovirus plusenterovirus plusadenovirus
0 (0) 1 (4) 0 (0) 1 (5) 1 (2)
Rhinovirus plusenterovirus pluscoronavirus
1 (5) 0 (0) 1 (4) 0 (0) 1 (2)
Human metapneumovirus 1 (5) 2 (8) 2 (8) 1 (5) 3 (7)
No viral isolate present 5 (26) 7 (28) 7 (29) 5 (25) 12 (27)
RESULTS
NIHR Journals Library www.journalslibrary.nihr.ac.uk
26
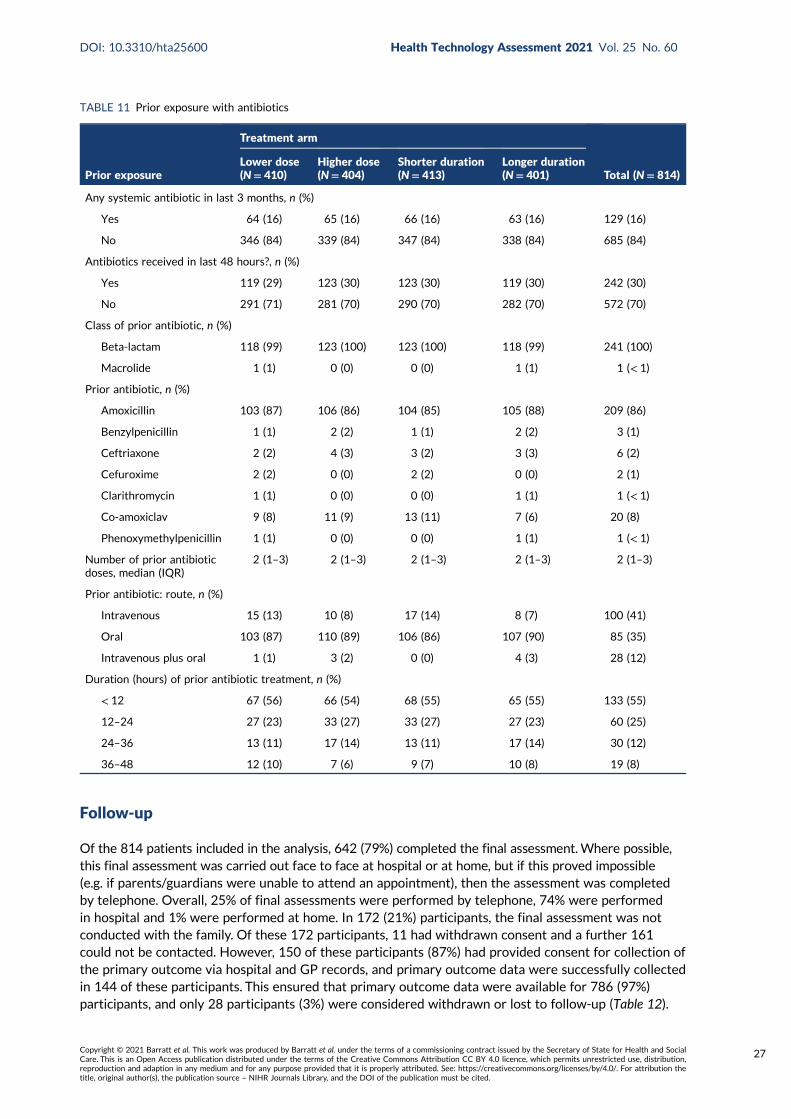
Follow-up
Of the 814 patients included in the analysis, 642 (79%) completed the final assessment.Where possible,this final assessment was carried out face to face at hospital or at home, but if this proved impossible(e.g. if parents/guardians were unable to attend an appointment), then the assessment was completedby telephone. Overall, 25% of final assessments were performed by telephone, 74% were performedin hospital and 1% were performed at home. In 172 (21%) participants, the final assessment was notconducted with the family. Of these 172 participants, 11 had withdrawn consent and a further 161could not be contacted. However, 150 of these participants (87%) had provided consent for collection ofthe primary outcome via hospital and GP records, and primary outcome data were successfully collectedin 144 of these participants. This ensured that primary outcome data were available for 786 (97%)participants, and only 28 participants (3%) were considered withdrawn or lost to follow-up (Table 12).
TABLE 11 Prior exposure with antibiotics
Prior exposure
Treatment arm
Total (N= 814)Lower dose(N= 410)
Higher dose(N= 404)
Shorter duration(N= 413)
Longer duration(N= 401)
Any systemic antibiotic in last 3 months, n (%)
Yes 64 (16) 65 (16) 66 (16) 63 (16) 129 (16)
No 346 (84) 339 (84) 347 (84) 338 (84) 685 (84)
Antibiotics received in last 48 hours?, n (%)
Yes 119 (29) 123 (30) 123 (30) 119 (30) 242 (30)
No 291 (71) 281 (70) 290 (70) 282 (70) 572 (70)
Class of prior antibiotic, n (%)
Beta-lactam 118 (99) 123 (100) 123 (100) 118 (99) 241 (100)
Macrolide 1 (1) 0 (0) 0 (0) 1 (1) 1 (< 1)
Prior antibiotic, n (%)
Amoxicillin 103 (87) 106 (86) 104 (85) 105 (88) 209 (86)
Benzylpenicillin 1 (1) 2 (2) 1 (1) 2 (2) 3 (1)
Ceftriaxone 2 (2) 4 (3) 3 (2) 3 (3) 6 (2)
Cefuroxime 2 (2) 0 (0) 2 (2) 0 (0) 2 (1)
Clarithromycin 1 (1) 0 (0) 0 (0) 1 (1) 1 (< 1)
Co-amoxiclav 9 (8) 11 (9) 13 (11) 7 (6) 20 (8)
Phenoxymethylpenicillin 1 (1) 0 (0) 0 (0) 1 (1) 1 (< 1)
Number of prior antibioticdoses, median (IQR)
2 (1–3) 2 (1–3) 2 (1–3) 2 (1–3) 2 (1–3)
Prior antibiotic: route, n (%)
Intravenous 15 (13) 10 (8) 17 (14) 8 (7) 100 (41)
Oral 103 (87) 110 (89) 106 (86) 107 (90) 85 (35)
Intravenous plus oral 1 (1) 3 (2) 0 (0) 4 (3) 28 (12)
Duration (hours) of prior antibiotic treatment, n (%)
< 12 67 (56) 66 (54) 68 (55) 65 (55) 133 (55)
12–24 27 (23) 33 (27) 33 (27) 27 (23) 60 (25)
24–36 13 (11) 17 (14) 13 (11) 17 (14) 30 (12)
36–48 12 (10) 7 (6) 9 (7) 10 (8) 19 (8)
DOI: 10.3310/hta25600 Health Technology Assessment 2021 Vol. 25 No. 60
Copyright © 2021 Barratt et al. This work was produced by Barratt et al. under the terms of a commissioning contract issued by the Secretary of State for Health and SocialCare. This is an Open Access publication distributed under the terms of the Creative Commons Attribution CC BY 4.0 licence, which permits unrestricted use, distribution,reproduction and adaption in any medium and for any purpose provided that it is properly attributed. See: https://creativecommons.org/licenses/by/4.0/. For attribution thetitle, original author(s), the publication source – NIHR Journals Library, and the DOI of the publication must be cited.
27

Follow-up data were also collected by telephone at days 3, 7, 14 and 21 (Table 13). Follow-up rates were88% at day 3, 75% at day 14 and 76% at day 21. A total of 443 (54%) parents/guardians of participantscompleted all telephone calls and the final visit, with 153 (19%) parents/guardians of participants missingone follow-up visit, 95 (12%) parents/guardians of participants missing two follow-up visits, 51 (6%)parents/guardians of participants missing three follow-up visits and 48 (6%) parents/guardians ofparticipants missing four follow-up visits. Twenty-four (3%) parents/guardians of participants missed alltelephone calls and visits.
TABLE 12 Final visit and follow-up data completeness
Final visit andfollow-up data
Treatment arm, n (%)
Total (N= 814),n (%)
Lower dose(N= 410)
Higher dose(N= 404)
Shorter duration(N= 413)
Longer duration(N= 401)
Attendance
Final visit completed 329 (80) 313 (77) 315 (76) 327 (82) 642 (79)
Previously withdrawn 8 (2) 3 (1) 6 (1) 5 (1) 11 (1)
Not withdrawn butnot completed
73 (18) 88 (22) 92 (22) 69 (17) 161 (20)
Where/how did final visit take place?
Hospital 242 (74) 236 (75) 231 (73) 247 (76) 478 (74)
Home 3 (1) 3 (1) 3 (1) 3 (1) 6 (1)
Telephone call 84 (26) 74 (24) 81 (26) 77 (24) 158 (25)
Consent for further data collection?
Yes 71 (88) 79 (87) 87 (89) 63 (85) 150 (87)
No 10 (12) 12 (13) 11 (11) 11 (15) 22 (13)
Day 28 data received from GP?
Yes 70 (99) 74 (94) 84 (97) 60 (95) 144 (96)
No 1 (1) 5 (6) 3 (3) 3 (5) 6 (4)
Final visit status
Completed 329 (80) 313 (77) 315 (76) 327 (82) 642 (79)
Not completed, butGP data received
70 (17) 74 (18) 84 (20) 60 (15) 144 (18)
Withdrawn/lost 11 (3) 17 (4) 14 (3) 14 (3) 28 (3)
TABLE 13 Participant follow-up rate
Follow-up
Treatment arm, n (%)
Total (N= 814),n (%)
Lower dose(N= 410)
Higher dose(N= 404)
Shorter duration(N= 413)
Longer duration(N= 401)
Trial entry 410 (100) 404 (100) 413 (100) 401 (100) 814 (100)
Day 3 355 (87) 360 (89) 365 (88) 350 (87) 715 (88)
Day 7 332 (81) 343 (85) 342 (83) 333 (83) 675 (83)
Day 14 314 (77) 299 (74) 307 (74) 306 (76) 613 (75)
Day 21 315 (77) 302 (75) 303 (73) 314 (78) 617 (76)
Final visit (day 28) 329 (80) 313 (77) 315 (76) 327 (82) 642 (79)
RESULTS
NIHR Journals Library www.journalslibrary.nihr.ac.uk
28
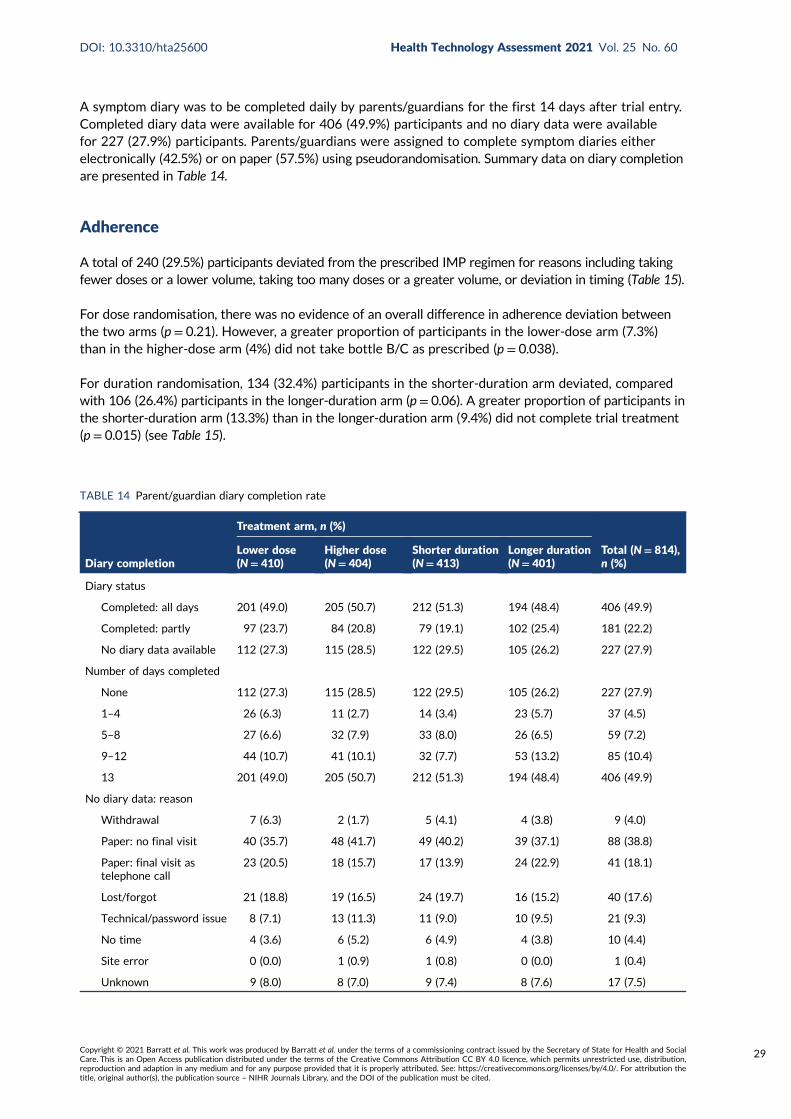
A symptom diary was to be completed daily by parents/guardians for the first 14 days after trial entry.Completed diary data were available for 406 (49.9%) participants and no diary data were availablefor 227 (27.9%) participants. Parents/guardians were assigned to complete symptom diaries eitherelectronically (42.5%) or on paper (57.5%) using pseudorandomisation. Summary data on diary completionare presented in Table 14.
Adherence
A total of 240 (29.5%) participants deviated from the prescribed IMP regimen for reasons including takingfewer doses or a lower volume, taking too many doses or a greater volume, or deviation in timing (Table 15).
For dose randomisation, there was no evidence of an overall difference in adherence deviation betweenthe two arms (p = 0.21). However, a greater proportion of participants in the lower-dose arm (7.3%)than in the higher-dose arm (4%) did not take bottle B/C as prescribed (p = 0.038).
For duration randomisation, 134 (32.4%) participants in the shorter-duration arm deviated, comparedwith 106 (26.4%) participants in the longer-duration arm (p = 0.06). A greater proportion of participants inthe shorter-duration arm (13.3%) than in the longer-duration arm (9.4%) did not complete trial treatment(p = 0.015) (see Table 15).
TABLE 14 Parent/guardian diary completion rate
Diary completion
Treatment arm, n (%)
Total (N= 814),n (%)
Lower dose(N= 410)
Higher dose(N= 404)
Shorter duration(N= 413)
Longer duration(N= 401)
Diary status
Completed: all days 201 (49.0) 205 (50.7) 212 (51.3) 194 (48.4) 406 (49.9)
Completed: partly 97 (23.7) 84 (20.8) 79 (19.1) 102 (25.4) 181 (22.2)
No diary data available 112 (27.3) 115 (28.5) 122 (29.5) 105 (26.2) 227 (27.9)
Number of days completed
None 112 (27.3) 115 (28.5) 122 (29.5) 105 (26.2) 227 (27.9)
1–4 26 (6.3) 11 (2.7) 14 (3.4) 23 (5.7) 37 (4.5)
5–8 27 (6.6) 32 (7.9) 33 (8.0) 26 (6.5) 59 (7.2)
9–12 44 (10.7) 41 (10.1) 32 (7.7) 53 (13.2) 85 (10.4)
13 201 (49.0) 205 (50.7) 212 (51.3) 194 (48.4) 406 (49.9)
No diary data: reason
Withdrawal 7 (6.3) 2 (1.7) 5 (4.1) 4 (3.8) 9 (4.0)
Paper: no final visit 40 (35.7) 48 (41.7) 49 (40.2) 39 (37.1) 88 (38.8)
Paper: final visit astelephone call
23 (20.5) 18 (15.7) 17 (13.9) 24 (22.9) 41 (18.1)
Lost/forgot 21 (18.8) 19 (16.5) 24 (19.7) 16 (15.2) 40 (17.6)
Technical/password issue 8 (7.1) 13 (11.3) 11 (9.0) 10 (9.5) 21 (9.3)
No time 4 (3.6) 6 (5.2) 6 (4.9) 4 (3.8) 10 (4.4)
Site error 0 (0.0) 1 (0.9) 1 (0.8) 0 (0.0) 1 (0.4)
Unknown 9 (8.0) 8 (7.0) 9 (7.4) 8 (7.6) 17 (7.5)
DOI: 10.3310/hta25600 Health Technology Assessment 2021 Vol. 25 No. 60
Copyright © 2021 Barratt et al. This work was produced by Barratt et al. under the terms of a commissioning contract issued by the Secretary of State for Health and SocialCare. This is an Open Access publication distributed under the terms of the Creative Commons Attribution CC BY 4.0 licence, which permits unrestricted use, distribution,reproduction and adaption in any medium and for any purpose provided that it is properly attributed. See: https://creativecommons.org/licenses/by/4.0/. For attribution thetitle, original author(s), the publication source – NIHR Journals Library, and the DOI of the publication must be cited.
29

TABLE 15 Adherence to trial medication by randomisation arm
Adherence to trial medication
Treatment arm, n (%)
p-value
Treatment arm, n (%)
p-value Total (N= 814), n (%)Lower dose(N= 410)
Higher dose(N= 404)
Shorter duration(N= 413)
Longer duration(N= 401)
Early cessation of trial treatment
Trial treatment completed 355 (86.6) 366 (90.6) 0.10 358 (86.7) 363 (90.5) 0.015 721 (88.6)
Early cessation for clinical improvement 7 (1.7) 1 (0.2) 5 (1.2) 3 (0.7) 8 (1.0)
Early cessation for clinical deterioration 16 (3.9) 11 (2.7) 10 (2.4) 17 (4.2) 27 (3.3)
Early cessation for other reason 32 (7.8) 26 (6.4) 40 (9.7) 18 (4.5) 58 (7.1)
Day of last dose of trial medication
Day 0 or 1 11 (20) 4 (11) 0.62 9 (16) 6 (16) 0.61 15 (16)
Day 2 or 3 17 (31) 15 (39) 16 (29) 16 (42) 32 (34)
Day 4 or 5 22 (40) 15 (39) 24 (44) 13 (34) 37 (40)
Day 6 or after 5 (9) 4 (11) 6 (11) 3 (8) 9 (10)
Bottles received
Taken bottle A but not bottles B/C 30 (7.3) 16 (4.0) 0.038 21 (5.1) 25 (6.2) 0.48 46 (5.7)
Taken bottle A and bottles B/C 380 (92.7) 388 (96.0) 392 (94.9) 376 (93.8) 768 (94.3)
Overall: fewer doses taken than scheduled
Yes 86 (21.0) 77 (19.1) 0.49 85 (20.6) 78 (19.5) 0.69 163 (20.0)
No 324 (79.0) 327 (80.9) 328 (79.4) 323 (80.5) 651 (80.0)
Overall: fewer doses or less volume taken than scheduled
Yes 104 (25.4) 95 (23.5) 0.54 113 (27.4) 86 (21.4) 0.050 199 (24.4)
No 306 (74.6) 309 (76.5) 300 (72.6) 315 (78.6) 615 (75.6)
Overall: any deviation (including too many doses/volume or timing deviations)
Yes 128 (31.2) 107 (26.5) 0.14 133 (32.2) 102 (25.4) 0.033 235 (28.9)
No 282 (68.8) 297 (73.5) 280 (67.8) 299 (74.6) 579 (71.1)
RESU
LTS
NIH
RJournals
Library
www.jo
urnalslib
rary.nihr.ac.u
k
30
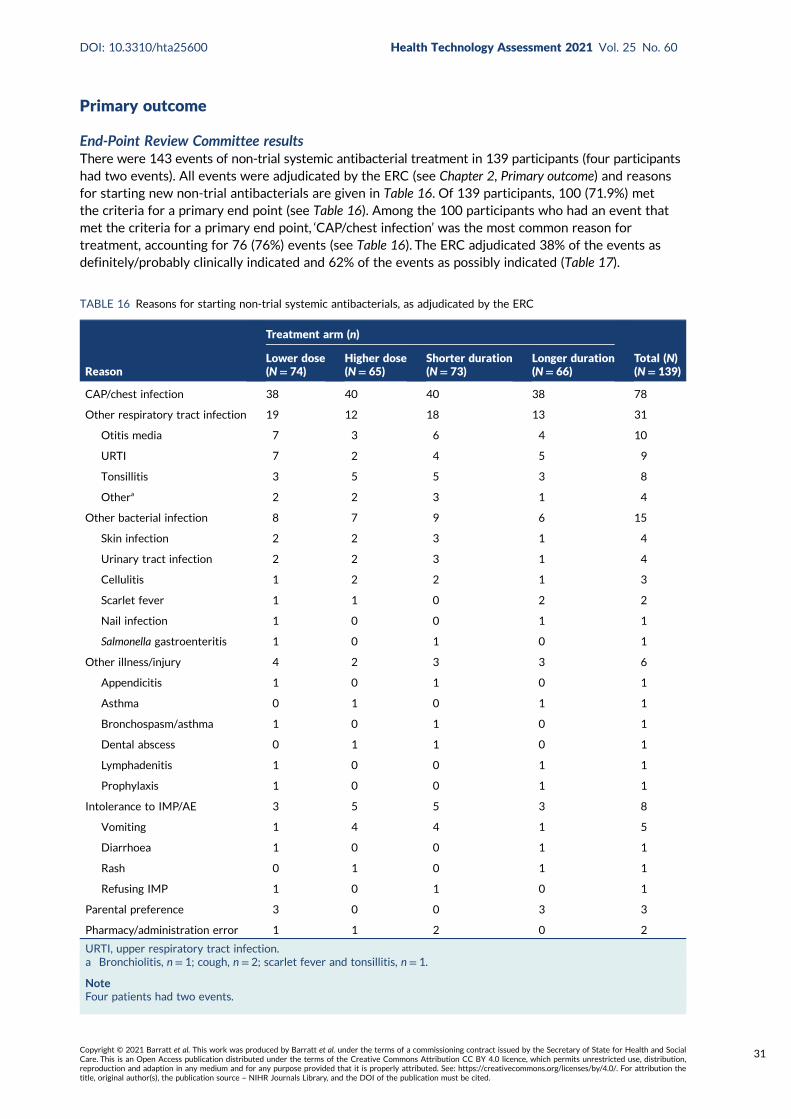
Primary outcome
End-Point Review Committee resultsThere were 143 events of non-trial systemic antibacterial treatment in 139 participants (four participantshad two events). All events were adjudicated by the ERC (see Chapter 2, Primary outcome) and reasonsfor starting new non-trial antibacterials are given in Table 16. Of 139 participants, 100 (71.9%) metthe criteria for a primary end point (see Table 16). Among the 100 participants who had an event thatmet the criteria for a primary end point, ‘CAP/chest infection’ was the most common reason fortreatment, accounting for 76 (76%) events (see Table 16). The ERC adjudicated 38% of the events asdefinitely/probably clinically indicated and 62% of the events as possibly indicated (Table 17).
TABLE 16 Reasons for starting non-trial systemic antibacterials, as adjudicated by the ERC
Reason
Treatment arm (n)
Total (N)(N= 139)
Lower dose(N= 74)
Higher dose(N= 65)
Shorter duration(N= 73)
Longer duration(N= 66)
CAP/chest infection 38 40 40 38 78
Other respiratory tract infection 19 12 18 13 31
Otitis media 7 3 6 4 10
URTI 7 2 4 5 9
Tonsillitis 3 5 5 3 8
Othera 2 2 3 1 4
Other bacterial infection 8 7 9 6 15
Skin infection 2 2 3 1 4
Urinary tract infection 2 2 3 1 4
Cellulitis 1 2 2 1 3
Scarlet fever 1 1 0 2 2
Nail infection 1 0 0 1 1
Salmonella gastroenteritis 1 0 1 0 1
Other illness/injury 4 2 3 3 6
Appendicitis 1 0 1 0 1
Asthma 0 1 0 1 1
Bronchospasm/asthma 1 0 1 0 1
Dental abscess 0 1 1 0 1
Lymphadenitis 1 0 0 1 1
Prophylaxis 1 0 0 1 1
Intolerance to IMP/AE 3 5 5 3 8
Vomiting 1 4 4 1 5
Diarrhoea 1 0 0 1 1
Rash 0 1 0 1 1
Refusing IMP 1 0 1 0 1
Parental preference 3 0 0 3 3
Pharmacy/administration error 1 1 2 0 2
URTI, upper respiratory tract infection.a Bronchiolitis, n = 1; cough, n = 2; scarlet fever and tonsillitis, n= 1.
NoteFour patients had two events.
DOI: 10.3310/hta25600 Health Technology Assessment 2021 Vol. 25 No. 60
Copyright © 2021 Barratt et al. This work was produced by Barratt et al. under the terms of a commissioning contract issued by the Secretary of State for Health and SocialCare. This is an Open Access publication distributed under the terms of the Creative Commons Attribution CC BY 4.0 licence, which permits unrestricted use, distribution,reproduction and adaption in any medium and for any purpose provided that it is properly attributed. See: https://creativecommons.org/licenses/by/4.0/. For attribution thetitle, original author(s), the publication source – NIHR Journals Library, and the DOI of the publication must be cited.
31
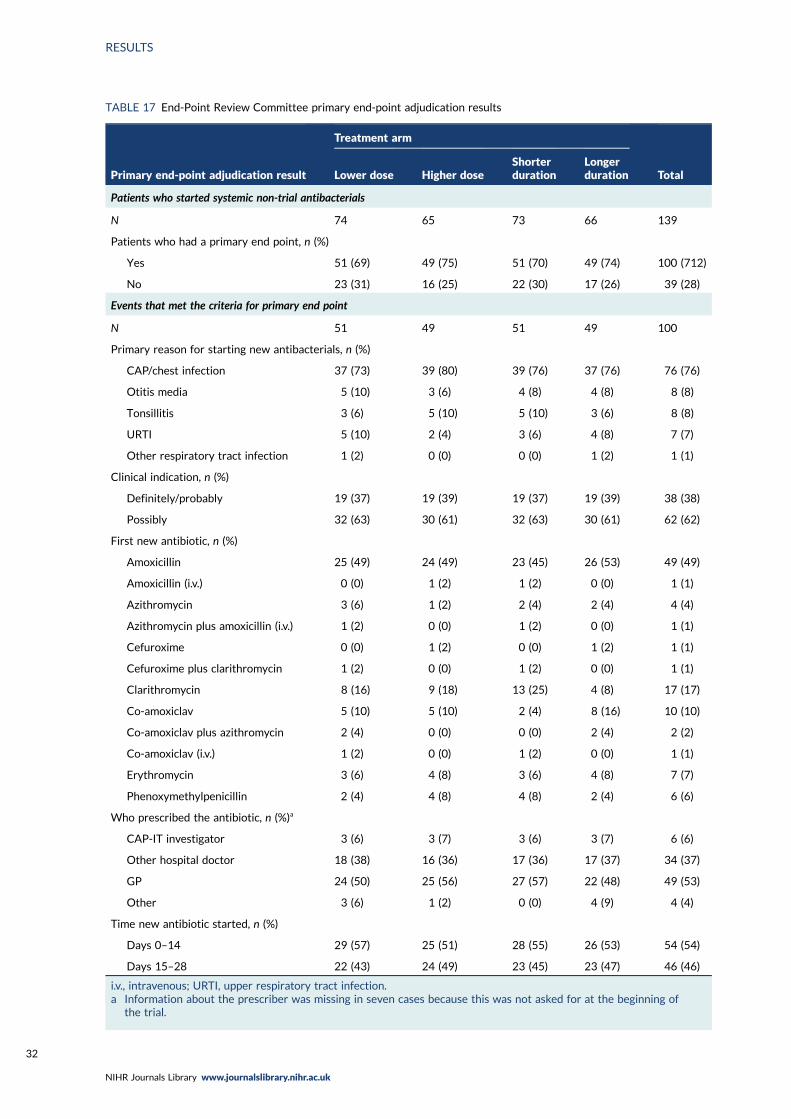
TABLE 17 End-Point Review Committee primary end-point adjudication results
Primary end-point adjudication result
Treatment arm
TotalLower dose Higher doseShorterduration
Longerduration
Patients who started systemic non-trial antibacterials
N 74 65 73 66 139
Patients who had a primary end point, n (%)
Yes 51 (69) 49 (75) 51 (70) 49 (74) 100 (712)
No 23 (31) 16 (25) 22 (30) 17 (26) 39 (28)
Events that met the criteria for primary end point
N 51 49 51 49 100
Primary reason for starting new antibacterials, n (%)
CAP/chest infection 37 (73) 39 (80) 39 (76) 37 (76) 76 (76)
Otitis media 5 (10) 3 (6) 4 (8) 4 (8) 8 (8)
Tonsillitis 3 (6) 5 (10) 5 (10) 3 (6) 8 (8)
URTI 5 (10) 2 (4) 3 (6) 4 (8) 7 (7)
Other respiratory tract infection 1 (2) 0 (0) 0 (0) 1 (2) 1 (1)
Clinical indication, n (%)
Definitely/probably 19 (37) 19 (39) 19 (37) 19 (39) 38 (38)
Possibly 32 (63) 30 (61) 32 (63) 30 (61) 62 (62)
First new antibiotic, n (%)
Amoxicillin 25 (49) 24 (49) 23 (45) 26 (53) 49 (49)
Amoxicillin (i.v.) 0 (0) 1 (2) 1 (2) 0 (0) 1 (1)
Azithromycin 3 (6) 1 (2) 2 (4) 2 (4) 4 (4)
Azithromycin plus amoxicillin (i.v.) 1 (2) 0 (0) 1 (2) 0 (0) 1 (1)
Cefuroxime 0 (0) 1 (2) 0 (0) 1 (2) 1 (1)
Cefuroxime plus clarithromycin 1 (2) 0 (0) 1 (2) 0 (0) 1 (1)
Clarithromycin 8 (16) 9 (18) 13 (25) 4 (8) 17 (17)
Co-amoxiclav 5 (10) 5 (10) 2 (4) 8 (16) 10 (10)
Co-amoxiclav plus azithromycin 2 (4) 0 (0) 0 (0) 2 (4) 2 (2)
Co-amoxiclav (i.v.) 1 (2) 0 (0) 1 (2) 0 (0) 1 (1)
Erythromycin 3 (6) 4 (8) 3 (6) 4 (8) 7 (7)
Phenoxymethylpenicillin 2 (4) 4 (8) 4 (8) 2 (4) 6 (6)
Who prescribed the antibiotic, n (%)a
CAP-IT investigator 3 (6) 3 (7) 3 (6) 3 (7) 6 (6)
Other hospital doctor 18 (38) 16 (36) 17 (36) 17 (37) 34 (37)
GP 24 (50) 25 (56) 27 (57) 22 (48) 49 (53)
Other 3 (6) 1 (2) 0 (0) 4 (9) 4 (4)
Time new antibiotic started, n (%)
Days 0–14 29 (57) 25 (51) 28 (55) 26 (53) 54 (54)
Days 15–28 22 (43) 24 (49) 23 (45) 23 (47) 46 (46)
i.v., intravenous; URTI, upper respiratory tract infection.a Information about the prescriber was missing in seven cases because this was not asked for at the beginning of
the trial.
RESULTS
NIHR Journals Library www.journalslibrary.nihr.ac.uk
32
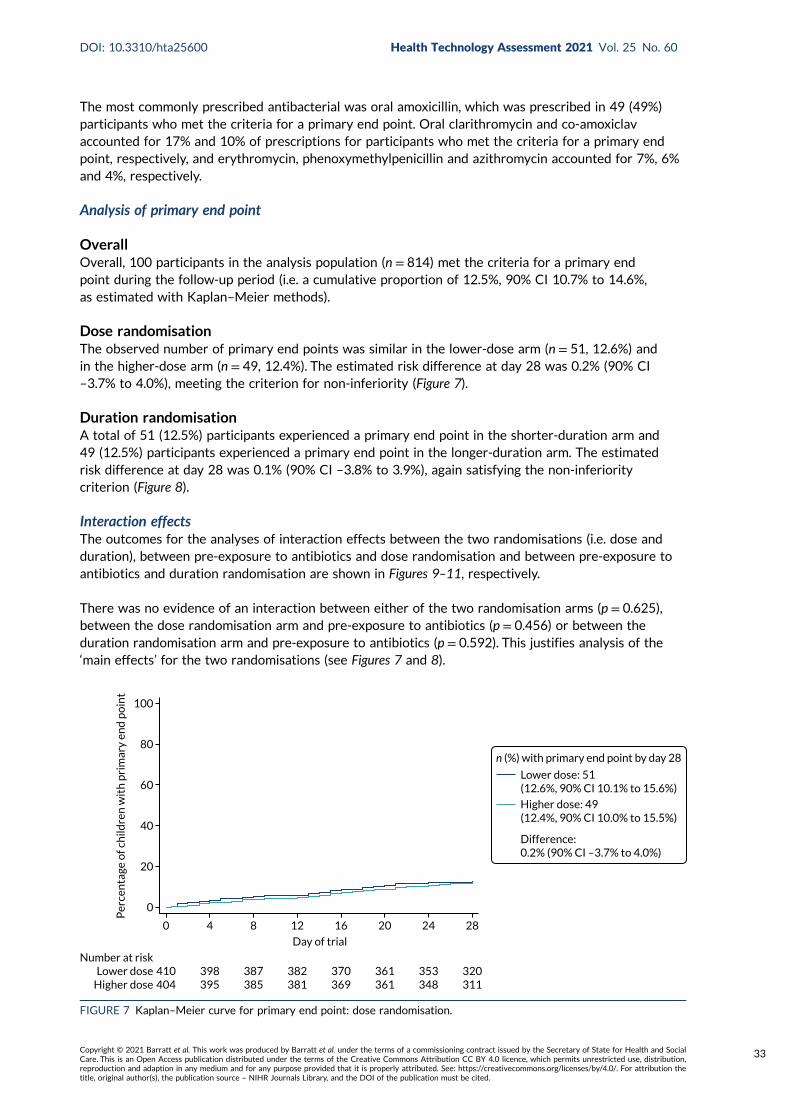
The most commonly prescribed antibacterial was oral amoxicillin, which was prescribed in 49 (49%)participants who met the criteria for a primary end point. Oral clarithromycin and co-amoxiclavaccounted for 17% and 10% of prescriptions for participants who met the criteria for a primary endpoint, respectively, and erythromycin, phenoxymethylpenicillin and azithromycin accounted for 7%, 6%and 4%, respectively.
Analysis of primary end point
OverallOverall, 100 participants in the analysis population (n = 814) met the criteria for a primary endpoint during the follow-up period (i.e. a cumulative proportion of 12.5%, 90% CI 10.7% to 14.6%,as estimated with Kaplan–Meier methods).
Dose randomisationThe observed number of primary end points was similar in the lower-dose arm (n = 51, 12.6%) andin the higher-dose arm (n = 49, 12.4%). The estimated risk difference at day 28 was 0.2% (90% CI–3.7% to 4.0%), meeting the criterion for non-inferiority (Figure 7).
Duration randomisationA total of 51 (12.5%) participants experienced a primary end point in the shorter-duration arm and49 (12.5%) participants experienced a primary end point in the longer-duration arm. The estimatedrisk difference at day 28 was 0.1% (90% CI –3.8% to 3.9%), again satisfying the non-inferioritycriterion (Figure 8).
Interaction effectsThe outcomes for the analyses of interaction effects between the two randomisations (i.e. dose andduration), between pre-exposure to antibiotics and dose randomisation and between pre-exposure toantibiotics and duration randomisation are shown in Figures 9–11, respectively.
There was no evidence of an interaction between either of the two randomisation arms (p = 0.625),between the dose randomisation arm and pre-exposure to antibiotics (p = 0.456) or between theduration randomisation arm and pre-exposure to antibiotics (p = 0.592). This justifies analysis of the‘main effects’ for the two randomisations (see Figures 7 and 8).
0
0 4 8 12 16
Day of trial
20 24 28
410404
Number at riskLower dose
Higher dose398395
387385
382381
370369
361361
353348
320311
20
40
60
Per
cen
tage
of c
hild
ren
wit
h p
rim
ary
end
po
int
80
100
Lower dose: 51(12.6%, 90% CI 10.1% to 15.6%)
Higher dose: 49(12.4%, 90% CI 10.0% to 15.5%)
Difference:0.2% (90% CI –3.7% to 4.0%)
n (%) with primary end point by day 28
FIGURE 7 Kaplan–Meier curve for primary end point: dose randomisation.
DOI: 10.3310/hta25600 Health Technology Assessment 2021 Vol. 25 No. 60
Copyright © 2021 Barratt et al. This work was produced by Barratt et al. under the terms of a commissioning contract issued by the Secretary of State for Health and SocialCare. This is an Open Access publication distributed under the terms of the Creative Commons Attribution CC BY 4.0 licence, which permits unrestricted use, distribution,reproduction and adaption in any medium and for any purpose provided that it is properly attributed. See: https://creativecommons.org/licenses/by/4.0/. For attribution thetitle, original author(s), the publication source – NIHR Journals Library, and the DOI of the publication must be cited.
33
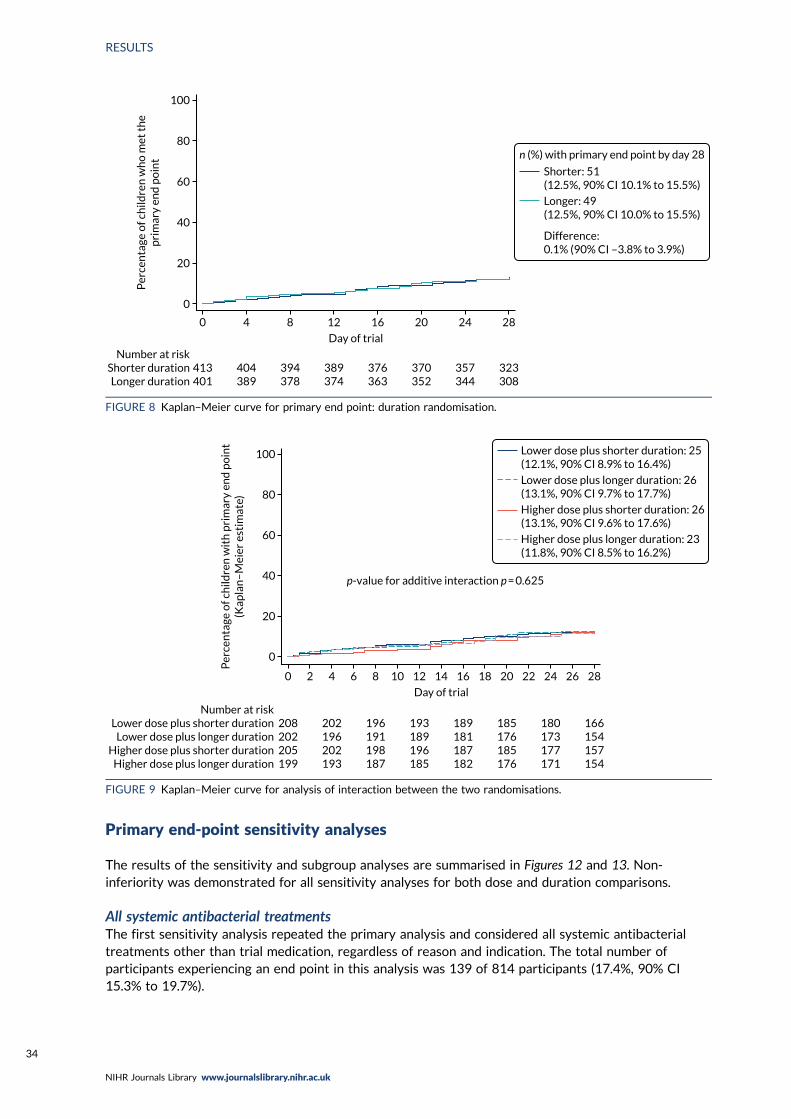
Primary end-point sensitivity analyses
The results of the sensitivity and subgroup analyses are summarised in Figures 12 and 13. Non-inferiority was demonstrated for all sensitivity analyses for both dose and duration comparisons.
All systemic antibacterial treatmentsThe first sensitivity analysis repeated the primary analysis and considered all systemic antibacterialtreatments other than trial medication, regardless of reason and indication. The total number ofparticipants experiencing an end point in this analysis was 139 of 814 participants (17.4%, 90% CI15.3% to 19.7%).
0
0 4 8 12 16
Day of trial
20 24 28
413401
Number at riskShorter durationLonger duration
404389
394378
389374
376363
370352
357344
323308
20
40
60
Per
cen
tage
of c
hild
ren
wh
o m
et t
he
pri
mar
y en
d p
oin
t80
100
Shorter: 51(12.5%, 90% CI 10.1% to 15.5%)
Longer: 49(12.5%, 90% CI 10.0% to 15.5%)
Difference:0.1% (90% CI –3.8% to 3.9%)
n (%) with primary end point by day 28
FIGURE 8 Kaplan–Meier curve for primary end point: duration randomisation.
0
0 2 6 10 14 18 22 264 8 12 16
Day of trial
20 24 28
208202205199
Number at riskLower dose plus shorter duration
Lower dose plus longer durationHigher dose plus shorter duration
Higher dose plus longer duration
202196202193
196191198187
193189196185
189181187182
185176185176
180173177171
166154157154
20
40
60
Per
cen
tage
of c
hild
ren
wit
h p
rim
ary
end
po
int
(Kap
lan
–M
eier
est
imat
e) 80
100 Lower dose plus shorter duration: 25(12.1%, 90% CI 8.9% to 16.4%)
Lower dose plus longer duration: 26(13.1%, 90% CI 9.7% to 17.7%)
Higher dose plus shorter duration: 26(13.1%, 90% CI 9.6% to 17.6%)
Higher dose plus longer duration: 23(11.8%, 90% CI 8.5% to 16.2%)
p-value for additive interaction p = 0.625
FIGURE 9 Kaplan–Meier curve for analysis of interaction between the two randomisations.
RESULTS
NIHR Journals Library www.journalslibrary.nihr.ac.uk
34
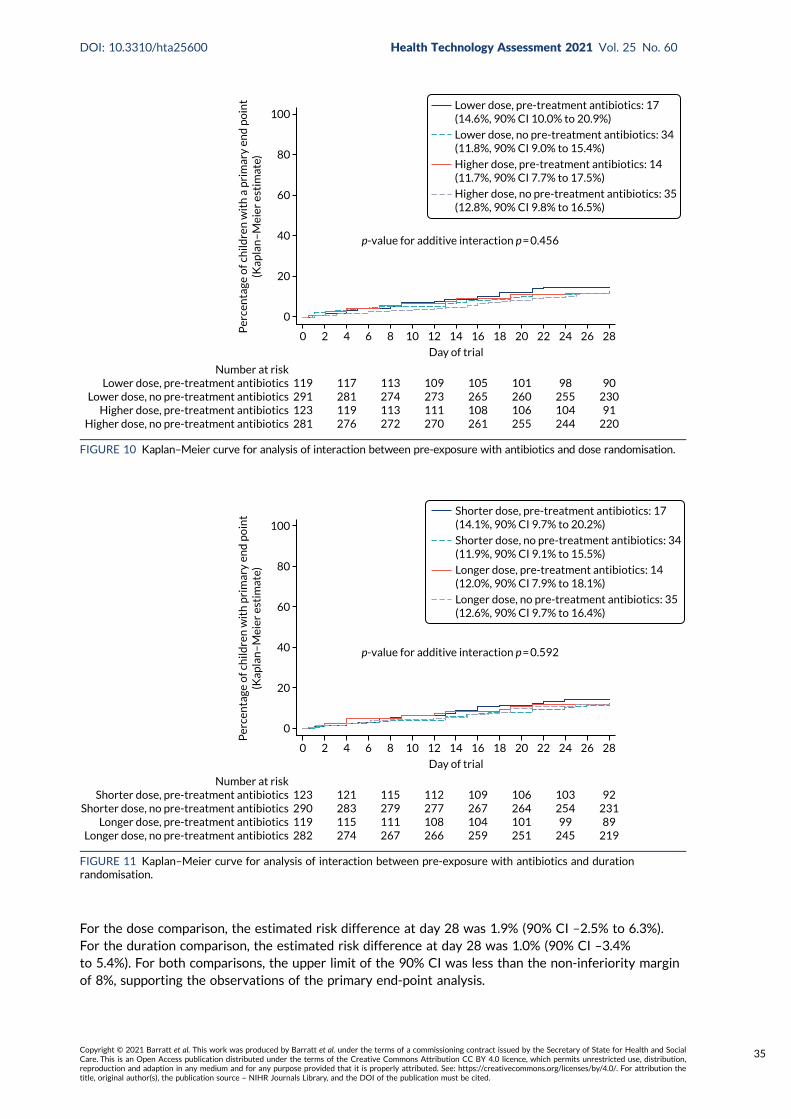
For the dose comparison, the estimated risk difference at day 28 was 1.9% (90% CI –2.5% to 6.3%).For the duration comparison, the estimated risk difference at day 28 was 1.0% (90% CI –3.4%to 5.4%). For both comparisons, the upper limit of the 90% CI was less than the non-inferiority marginof 8%, supporting the observations of the primary end-point analysis.
0
0 2 6 10 14 18 22 264 8 12 16
Day of trial
20 24 28
119291123281
Number at riskLower dose, pre-treatment antibiotics
Lower dose, no pre-treatment antibioticsHigher dose, pre-treatment antibiotics
Higher dose, no pre-treatment antibiotics
117281119276
113274113272
109273111270
105265108261
101260106255
98255104244
9023091
220
20
40
60
Per
cen
tage
of c
hild
ren
wit
h a
pri
mar
y en
d p
oin
t(K
apla
n–
Mei
er e
stim
ate) 80
100Lower dose, pre-treatment antibiotics: 17(14.6%, 90% CI 10.0% to 20.9%)
Lower dose, no pre-treatment antibiotics: 34(11.8%, 90% CI 9.0% to 15.4%)
Higher dose, pre-treatment antibiotics: 14(11.7%, 90% CI 7.7% to 17.5%)
Higher dose, no pre-treatment antibiotics: 35(12.8%, 90% CI 9.8% to 16.5%)
p-value for additive interaction p = 0.456
FIGURE 10 Kaplan–Meier curve for analysis of interaction between pre-exposure with antibiotics and dose randomisation.
0
0 2 6 10 14 18 22 264 8 12 16
Day of trial
20 24 28
123290119282
Number at riskShorter dose, pre-treatment antibiotics
Shorter dose, no pre-treatment antibioticsLonger dose, pre-treatment antibiotics
Longer dose, no pre-treatment antibiotics
121283115274
115279111267
112277108266
109267104259
106264101251
10325499
245
9223189
219
20
40
60
Per
cen
tage
of c
hild
ren
wit
h p
rim
ary
end
po
int
(Kap
lan
–M
eier
est
imat
e) 80
100Shorter dose, pre-treatment antibiotics: 17(14.1%, 90% CI 9.7% to 20.2%)
Shorter dose, no pre-treatment antibiotics: 34(11.9%, 90% CI 9.1% to 15.5%)
Longer dose, pre-treatment antibiotics: 14(12.0%, 90% CI 7.9% to 18.1%)
Longer dose, no pre-treatment antibiotics: 35(12.6%, 90% CI 9.7% to 16.4%)
p-value for additive interaction p = 0.592
FIGURE 11 Kaplan–Meier curve for analysis of interaction between pre-exposure with antibiotics and durationrandomisation.
DOI: 10.3310/hta25600 Health Technology Assessment 2021 Vol. 25 No. 60
Copyright © 2021 Barratt et al. This work was produced by Barratt et al. under the terms of a commissioning contract issued by the Secretary of State for Health and SocialCare. This is an Open Access publication distributed under the terms of the Creative Commons Attribution CC BY 4.0 licence, which permits unrestricted use, distribution,reproduction and adaption in any medium and for any purpose provided that it is properly attributed. See: https://creativecommons.org/licenses/by/4.0/. For attribution thetitle, original author(s), the publication source – NIHR Journals Library, and the DOI of the publication must be cited.
35
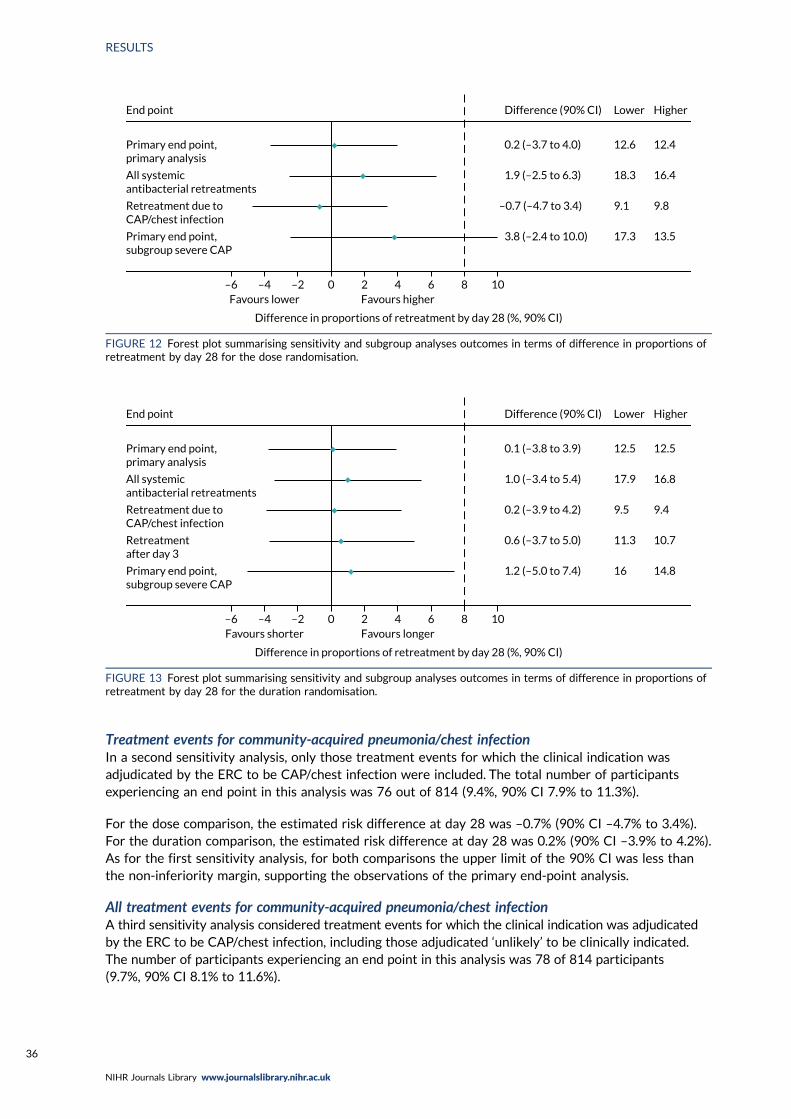
Treatment events for community-acquired pneumonia/chest infectionIn a second sensitivity analysis, only those treatment events for which the clinical indication wasadjudicated by the ERC to be CAP/chest infection were included. The total number of participantsexperiencing an end point in this analysis was 76 out of 814 (9.4%, 90% CI 7.9% to 11.3%).
For the dose comparison, the estimated risk difference at day 28 was –0.7% (90% CI –4.7% to 3.4%).For the duration comparison, the estimated risk difference at day 28 was 0.2% (90% CI –3.9% to 4.2%).As for the first sensitivity analysis, for both comparisons the upper limit of the 90% CI was less thanthe non-inferiority margin, supporting the observations of the primary end-point analysis.
All treatment events for community-acquired pneumonia/chest infectionA third sensitivity analysis considered treatment events for which the clinical indication was adjudicatedby the ERC to be CAP/chest infection, including those adjudicated ‘unlikely’ to be clinically indicated.The number of participants experiencing an end point in this analysis was 78 of 814 participants(9.7%, 90% CI 8.1% to 11.6%).
0 2 4 6 8 10–2–4–6Favours higherFavours lower
Difference in proportions of retreatment by day 28 (%, 90% CI)
End point Difference (90% CI) Lower Higher
Primary end point,primary analysis
0.2 (–3.7 to 4.0) 12.6 12.4
All systemicantibacterial retreatments
1.9 (–2.5 to 6.3) 18.3 16.4
Retreatment due toCAP/chest infection
–0.7 (–4.7 to 3.4) 9.1 9.8
Primary end point,subgroup severe CAP
3.8 (–2.4 to 10.0) 17.3 13.5
FIGURE 12 Forest plot summarising sensitivity and subgroup analyses outcomes in terms of difference in proportions ofretreatment by day 28 for the dose randomisation.
0 2 4 6 8 10–2–4–6Favours longerFavours shorter
Difference in proportions of retreatment by day 28 (%, 90% CI)
End point Difference (90% CI) Lower Higher
Primary end point,primary analysis
0.1 (–3.8 to 3.9) 12.5 12.5
All systemicantibacterial retreatments
1.0 (–3.4 to 5.4) 17.9 16.8
Retreatment due toCAP/chest infection
0.2 (–3.9 to 4.2) 9.5 9.4
Retreatmentafter day 3
0.6 (–3.7 to 5.0) 11.3 10.7
Primary end point,subgroup severe CAP
1.2 (–5.0 to 7.4) 16 14.8
FIGURE 13 Forest plot summarising sensitivity and subgroup analyses outcomes in terms of difference in proportions ofretreatment by day 28 for the duration randomisation.
RESULTS
NIHR Journals Library www.journalslibrary.nihr.ac.uk
36
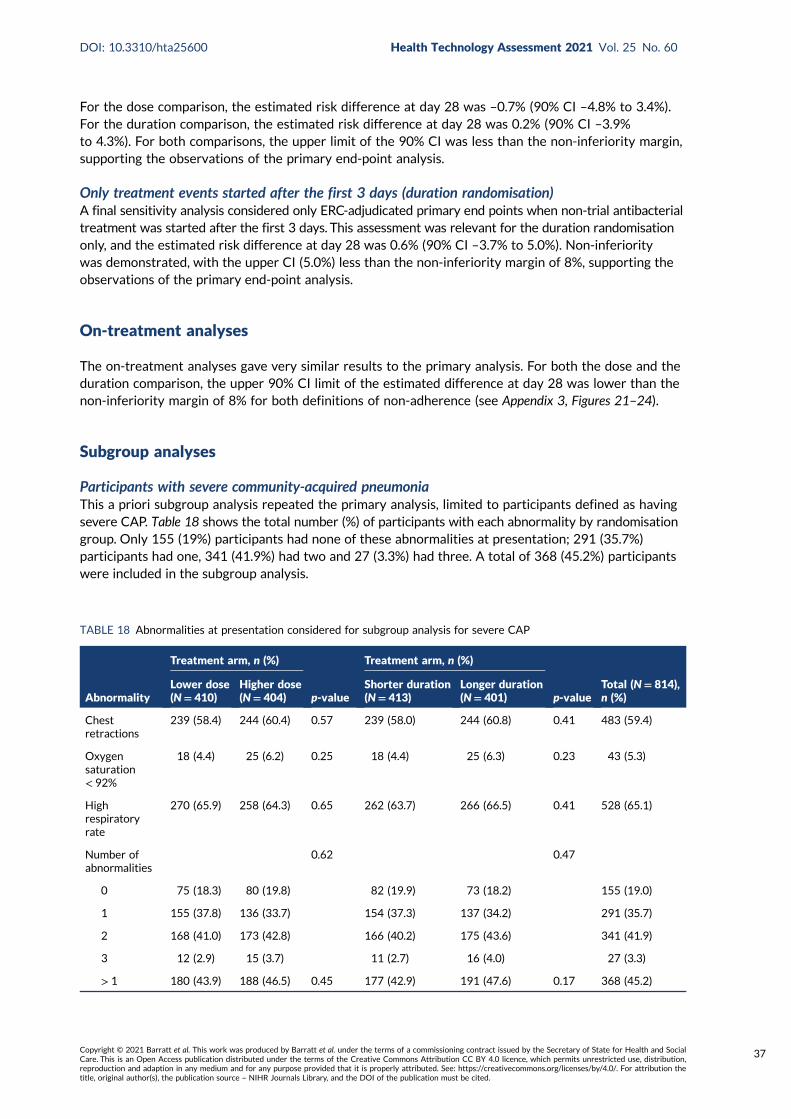
For the dose comparison, the estimated risk difference at day 28 was –0.7% (90% CI –4.8% to 3.4%).For the duration comparison, the estimated risk difference at day 28 was 0.2% (90% CI –3.9%to 4.3%). For both comparisons, the upper limit of the 90% CI was less than the non-inferiority margin,supporting the observations of the primary end-point analysis.
Only treatment events started after the first 3 days (duration randomisation)A final sensitivity analysis considered only ERC-adjudicated primary end points when non-trial antibacterialtreatment was started after the first 3 days. This assessment was relevant for the duration randomisationonly, and the estimated risk difference at day 28 was 0.6% (90% CI –3.7% to 5.0%). Non-inferioritywas demonstrated, with the upper CI (5.0%) less than the non-inferiority margin of 8%, supporting theobservations of the primary end-point analysis.
On-treatment analyses
The on-treatment analyses gave very similar results to the primary analysis. For both the dose and theduration comparison, the upper 90% CI limit of the estimated difference at day 28 was lower than thenon-inferiority margin of 8% for both definitions of non-adherence (see Appendix 3, Figures 21–24).
Subgroup analyses
Participants with severe community-acquired pneumoniaThis a priori subgroup analysis repeated the primary analysis, limited to participants defined as havingsevere CAP. Table 18 shows the total number (%) of participants with each abnormality by randomisationgroup. Only 155 (19%) participants had none of these abnormalities at presentation; 291 (35.7%)participants had one, 341 (41.9%) had two and 27 (3.3%) had three. A total of 368 (45.2%) participantswere included in the subgroup analysis.
TABLE 18 Abnormalities at presentation considered for subgroup analysis for severe CAP
Abnormality
Treatment arm, n (%)
p-value
Treatment arm, n (%)
p-valueTotal (N= 814),n (%)
Lower dose(N= 410)
Higher dose(N= 404)
Shorter duration(N= 413)
Longer duration(N= 401)
Chestretractions
239 (58.4) 244 (60.4) 0.57 239 (58.0) 244 (60.8) 0.41 483 (59.4)
Oxygensaturation< 92%
18 (4.4) 25 (6.2) 0.25 18 (4.4) 25 (6.3) 0.23 43 (5.3)
Highrespiratoryrate
270 (65.9) 258 (64.3) 0.65 262 (63.7) 266 (66.5) 0.41 528 (65.1)
Number ofabnormalities
0.62 0.47
0 75 (18.3) 80 (19.8) 82 (19.9) 73 (18.2) 155 (19.0)
1 155 (37.8) 136 (33.7) 154 (37.3) 137 (34.2) 291 (35.7)
2 168 (41.0) 173 (42.8) 166 (40.2) 175 (43.6) 341 (41.9)
3 12 (2.9) 15 (3.7) 11 (2.7) 16 (4.0) 27 (3.3)
> 1 180 (43.9) 188 (46.5) 0.45 177 (42.9) 191 (47.6) 0.17 368 (45.2)
DOI: 10.3310/hta25600 Health Technology Assessment 2021 Vol. 25 No. 60
Copyright © 2021 Barratt et al. This work was produced by Barratt et al. under the terms of a commissioning contract issued by the Secretary of State for Health and SocialCare. This is an Open Access publication distributed under the terms of the Creative Commons Attribution CC BY 4.0 licence, which permits unrestricted use, distribution,reproduction and adaption in any medium and for any purpose provided that it is properly attributed. See: https://creativecommons.org/licenses/by/4.0/. For attribution thetitle, original author(s), the publication source – NIHR Journals Library, and the DOI of the publication must be cited.
37

In total, 56 (15.4%) participants experienced a primary end point. There was no significant differencebetween the arms for either the dose comparison (p = 0.283) or the duration comparison (p = 0.821).For duration randomisation, the estimated risk difference at day 28 was 1.2% (90% CI –5.0% to 7.4%)(Figure 14). For dose randomisation, the estimated difference at day 28 was 3.8% (90% CI –2.4% to 10.0%).This is consistent with no effect, although the 90% CI crossed the non-inferiority margin (Figure 15).
Seasonal effectA further a priori planned subgroup analysis repeated the primary analysis, but including only eventsoccurring during the two winter periods spanned by CAP-IT (i.e. 2017/18 and 2018/19), based onPublic Health England reports of circulating viruses/bacteria.
The overall event rate in 2017/18 was 14.1% and 12.2% in 2018/19 (p= 0.515). There was no evidence ofan interaction with either the duration or dose randomisations (p= 0.848 and p= 0.677, respectively).
0
0 4 8 12 16
Day of trial
20 24 28
177191
Number at riskShorter durationLonger duration
174182
168179
165175
159169
156163
147161
133145
20
40
60
Per
cen
tage
of c
hild
ren
wit
h a
pri
mar
y en
d p
oin
t
80
100
Shorter duration: 28(16.0%, 90% CI 12.0% to 21.2%)
Longer duration: 28(14.8%, 90% CI 11.1% to 19.6%)
Difference:1.2% (90% CI –5.0% to 7.4%)
n (%) with a primary end point by day 28
Log-rank p = 0.821
FIGURE 14 Kaplan–Meier curve for severe CAP subgroup primary analysis for duration randomisation.
0
0 4 8 12 16
Day of trial
20 24 28
180188
Number at riskLower dose
Higher dose173183
168179
164176
157171
152167
146162
135143
20
40
60
Per
cen
tage
of c
hild
ren
wit
h a
pri
mar
y en
d p
oin
t
80
100
Log-rank p = 0.283
Lower dose: 31(17.3%, 90% CI 13.2% to 22.6%)
Higher dose: 25(13.5%, 90% CI 9.9% to 18.3%)
Difference:3.8% (90% CI –2.4% to 10.0%)
n (%) with a primary end point by day 28
FIGURE 15 Kaplan–Meier curve for severe CAP subgroup primary analysis for dose randomisation.
RESULTS
NIHR Journals Library www.journalslibrary.nihr.ac.uk
38
Streptococcus pneumoniae carriage and resistance
Carriage and resistance to penicillin of S. pneumoniae isolates were assessed by analysis ofnasopharyngeal samples collected from participants at baseline, at the final visit and at anyunscheduled visits during follow-up.
Availability of nasopharyngeal culture resultsOf the 814 participants in the analysis population, 647 (79%) had a nasopharyngeal sample taken atbaseline and 437 (54%) had a sample taken at the final visit. There were 376 (46%) participants whohad both a baseline and final visit sample taken, 271 (33%) who had just a baseline sample takenand 61 (7%) who had just a final visit sample taken. The remaining 106 (13%) participants did nothave a sample taken. In addition, 28 (4%) participants had a sample taken at an unscheduled visit andfour participants had samples taken at two unscheduled visits (1%) (Table 19).
Streptococcus pneumoniae carriageOverall, 272 of 647 (42%) baseline samples and 129 of 437 (30%) final visit samples were culturepositive for S. pneumoniae. Of the participants with a culture result at both baseline and final visit,70 of 376 (19%) were positive for S. pneumoniae at both visits, 100 of 376 (27%) were positive atbaseline only and 41 of 376 (11%) were positive at the final visit only. The remaining 165 (44%)sample cultures were negative at both visits (Table 20).
Streptococcus pneumoniae penicillin non-susceptibilityNo penicillin-resistant pneumococcal isolates were identified in CAP-IT. Penicillin non-susceptibilitywas detected in 45 of 647 (7%) baseline samples providing a culture result (either positive or negative)(17% of S. pneumoniae-positive samples) and in 21 (5%) samples taken at the final visit and providing aculture result (either positive or negative) (16% of S. pneumoniae-positive samples). Of participants withpositive or negative culture results at both baseline and final visit, 23 (6%) had pneumococcal penicillinnon-susceptibility identified in the baseline sample only, 11 (3%) participants had pneumococcal penicillinnon-susceptibility identified in in the final visit sample only and seven (2%) participants had pneumococcalpenicillin non-susceptibility identified in both baseline and final visit samples. In the remaining 335 (89%)participants, penicillin resistance was not identified in either sample culture.
TABLE 19 Availability of nasopharyngeal culture results
Culture result
Group, n (%)
p-valueTotal (N= 814),n (%)PED (N= 591) Ward (N= 223)
Baseline culture available 474 (80) 173 (78) 0.41 647 (79)
Final visit culture available 316 (53) 121 (54) 0.84 437 (54)
If final visit happened hospital, at home 316 (89) 121 (92) 0.25 437 (90)
Summary availability
None 75 (13) 31 (14) 0.84 106 (13)
Both baseline and final visit 274 (46) 102 (46) 376 (46)
Baseline only 200 (34) 71 (32) 271 (33)
Final visit only 42 (7) 19 (9) 61 (7)
Unscheduled visit: number of culture samples available
0 490 (95) 186 (97) 0.37 676 (95)
1 22 (4) 6 (3) 28 (4)
2 4 (1) 0 (1) 4 (1)
DOI: 10.3310/hta25600 Health Technology Assessment 2021 Vol. 25 No. 60
Copyright © 2021 Barratt et al. This work was produced by Barratt et al. under the terms of a commissioning contract issued by the Secretary of State for Health and SocialCare. This is an Open Access publication distributed under the terms of the Creative Commons Attribution CC BY 4.0 licence, which permits unrestricted use, distribution,reproduction and adaption in any medium and for any purpose provided that it is properly attributed. See: https://creativecommons.org/licenses/by/4.0/. For attribution thetitle, original author(s), the publication source – NIHR Journals Library, and the DOI of the publication must be cited.
39

There was no evidence of a difference between the lower- and higher-dose randomisation groups in thepenicillin non-susceptibility of isolates cultured from either baseline or final visit samples, or betweenthe shorter- and longer-duration randomisation groups in the penicillin non-susceptibility of isolatescultured from baseline samples (see Table 21). The proportion of pneumococcal isolates cultured fromfinal visit samples that were penicillin non-susceptible was slightly higher in the shorter-duration group(n = 14, 7% of all samples, 22% of S. pneumoniae-positive samples) than in the longer-duration group[n = 7, 3% of all samples (p = 0.063), 11% of S. pneumoniae-positive samples (p = 0.10)]. This pattern wasalso found when the analysis was limited to participants with a positive culture result for S. pneumoniae(excluding all samples with a negative culture result), with penicillin non-susceptibility detected in 22%(n = 14) of samples taken from participants in the shorter-duration arm and in 11% (n = 7) of samplesfrom participants in the longer-duration arm (p = 0.10).
Streptococcus pneumoniae amoxicillin resistance/non-susceptibilityAmoxicillin non-susceptibility or resistance was detected in S. pneumoniae isolates cultured from seven(2%) baseline samples with a culture result (either positive or negative) and in four final visit (1%)samples with a culture result (either positive or negative). Among participants for whom culture results(positive or negative) were available for both baseline and final visit samples, amoxicillin resistancewas detected in isolates cultured from the baseline sample only in the case of one (< 1%) participant,in isolates cultured from the final visit sample only in the case of two (1%) participants and in isolatesfrom both samples in the case of one (< 1%) participant. In the remaining 361 (99%) participants, neitheramoxicillin non-susceptibility nor resistance was identified in any samples.
There was no evidence of a difference between the lower- and higher-dose groups in the amoxicillinnon-susceptibility of isolates cultured from either baseline or final visit sample cultures, or betweenthe shorter- and longer-duration groups groups in the amoxicillin non-susceptibility of isolates culturedfrom either baseline or final visit samples (Table 21). This was also found when the analysis of amoxicillinnon-susceptibility was limited to participants whose samples provided a positive culture result forS. pneumoniae (excluding all samples with a negative culture result).
Community-acquired pneumonia symptoms
Parent/guardian-reported symptom data were elicited at follow-up telephone calls and through parental/guardian completion of a daily diary up to day 14. The proportion of participants for whom parent/guardian-reported symptom data from any source were available reduced from days 3 (93%), 7 (88%),14 (83%) and 21 (76%) to day 28 (75%) (Figure 16).
TABLE 20 Streptococcus pneumoniae carriage
S. pneumoniae carriage
Treatment arm, n (%)
p-value
Treatment arm, n (%)
p-value Total, n (%)Lower dose Higher doseShorterduration
Longerduration
Baseline: positive 133 (41) 139 (43) 132 (42) 140 (42) 272 (42)
Final visit: positive 66 (29) 63 (30) 0.98 65 (32) 64 (28) 0.35 129 (30)
Summary: pneumococcal carriagea
Never 93 (48) 72 (40) 76 (44) 89 (43) 165 (44)
Baseline only 46 (24) 54 (30) 39 (23) 61 (30) 100 (27)
Final visit only 21 (11) 20 (11) 20 (12) 21 (10) 41 (11)
Both 34 (18) 36 (20) 36 (21) 34 (17) 70 (19)
a Patients with culture results at both time points.
RESULTS
NIHR Journals Library www.journalslibrary.nihr.ac.uk
40

TABLE 21 Penicillin and amoxicillin resistance/non-susceptibility in all participants with a culture result, either negativeor positive for S. pneumoniae
Penicillin and amoxicillinresistance/non-susceptibility
Treatment arm, n (%)
p-value
Treatment arm, n (%)
p-valueLower dose Higher dose Shorter duration Longer duration
Penicillin non-susceptibility at baseline
No 302 (92) 299 (93) 0.59 293 (92) 308 (93) 0.65
Yes 25 (8) 21 (7) 24 (8) 22 (7)
Penicillin non-susceptibility at the final visit
No 212 (95) 204 (96) 0.58 191 (93) 225 (97) 0.063
Yes 12 (5) 9 (4) 14 (7) 7 (3)
Penicillin non-susceptibility: summarya
Never 175 (90) 166 (91) 0.79 151 (88) 190 (93) 0.29
Baseline only 10 (5) 9 (5) 9 (5) 10 (5)
Final visit only 6 (3) 3 (2) 6 (4) 3 (1)
Both baseline and final visit 3 (2) 4 (2) 5 (3) 2 (1)
Amoxicillin resistance/non-susceptibility at baseline
No 318 (98) 311 (99) 0.27 309 (99) 320 (98) 0.28
Yes 5 (2) 2 (1) 2 (1) 5 (2)
Amoxicillin resistance/non-susceptibility at the final visit
No 218 (99) 210 (99) 0.97 199 (99) 229 (99) 0.89
Yes 2 (1) 2 (1) 2 (1) 2 (1)
Amoxicillin resistance/non-susceptibility: summarya
Never 185 (99) 176 (99) 0.26 162 (99) 199 (99) 0.56
Baseline only 1 (1) 0 (0) 0 (0) 1 (< 1)
Final visit only 0 (0) 2 (1) 1 (1) 1 (< 1)
Both baseline and final visit 1 (1) 0 (0) 1 (1) 0 (0)
a In patients with culture results at both time points.
0
20
40
Per
cen
tage
of p
arti
cip
ants
60
80
100
Telephone call/visit onlyDiary onlyBothNeithera
3 7
Day of trial
14 21 28
22 22 27
76 75
0
24
0
25
7
49
17
5 5
61
12
66
7
Data source
FIGURE 16 Availability of symptom data over time, by data source. a, No data available because telephone call/visit didnot happen or no data were reported.
DOI: 10.3310/hta25600 Health Technology Assessment 2021 Vol. 25 No. 60
Copyright © 2021 Barratt et al. This work was produced by Barratt et al. under the terms of a commissioning contract issued by the Secretary of State for Health and SocialCare. This is an Open Access publication distributed under the terms of the Creative Commons Attribution CC BY 4.0 licence, which permits unrestricted use, distribution,reproduction and adaption in any medium and for any purpose provided that it is properly attributed. See: https://creativecommons.org/licenses/by/4.0/. For attribution thetitle, original author(s), the publication source – NIHR Journals Library, and the DOI of the publication must be cited.
41
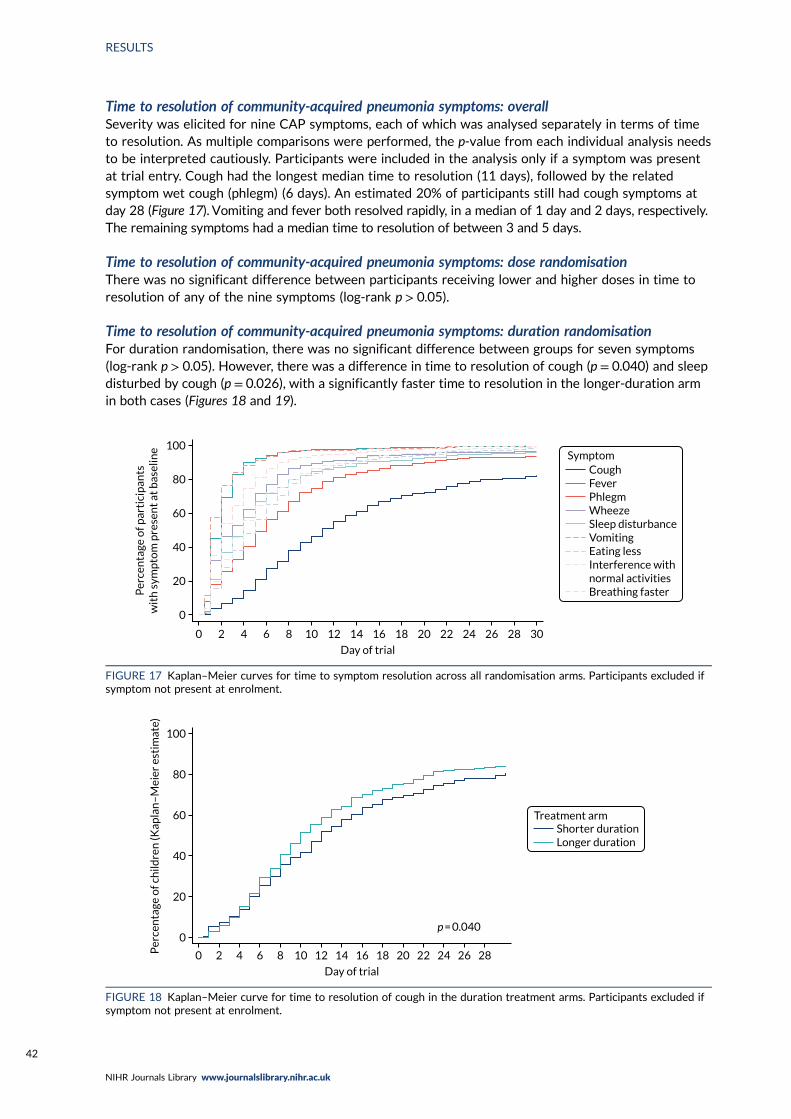
Time to resolution of community-acquired pneumonia symptoms: overallSeverity was elicited for nine CAP symptoms, each of which was analysed separately in terms of timeto resolution. As multiple comparisons were performed, the p-value from each individual analysis needsto be interpreted cautiously. Participants were included in the analysis only if a symptom was presentat trial entry. Cough had the longest median time to resolution (11 days), followed by the relatedsymptom wet cough (phlegm) (6 days). An estimated 20% of participants still had cough symptoms atday 28 (Figure 17). Vomiting and fever both resolved rapidly, in a median of 1 day and 2 days, respectively.The remaining symptoms had a median time to resolution of between 3 and 5 days.
Time to resolution of community-acquired pneumonia symptoms: dose randomisationThere was no significant difference between participants receiving lower and higher doses in time toresolution of any of the nine symptoms (log-rank p > 0.05).
Time to resolution of community-acquired pneumonia symptoms: duration randomisationFor duration randomisation, there was no significant difference between groups for seven symptoms(log-rank p > 0.05). However, there was a difference in time to resolution of cough (p = 0.040) and sleepdisturbed by cough (p = 0.026), with a significantly faster time to resolution in the longer-duration armin both cases (Figures 18 and 19).
0
0 2 6 10 14 18 22 264 8 12 16
Day of trial
Symptom
20 24 28 30
20
40
60
Per
cen
tage
of p
arti
cip
ants
wit
h s
ymp
tom
pre
sen
t at
bas
elin
e
80
100
CoughFeverPhlegmWheezeSleep disturbanceVomitingEating lessInterference withnormal activitiesBreathing faster
FIGURE 17 Kaplan–Meier curves for time to symptom resolution across all randomisation arms. Participants excluded ifsymptom not present at enrolment.
0
0 2 4 6 8 10 12 14 16
Day of trial
Treatment arm
18 20 22 24 26 28
p = 0.040
20
40
60
Per
cen
tage
of c
hild
ren
(Kap
lan
–M
eier
est
imat
e)
80
100
Shorter durationLonger duration
FIGURE 18 Kaplan–Meier curve for time to resolution of cough in the duration treatment arms. Participants excluded ifsymptom not present at enrolment.
RESULTS
NIHR Journals Library www.journalslibrary.nihr.ac.uk
42
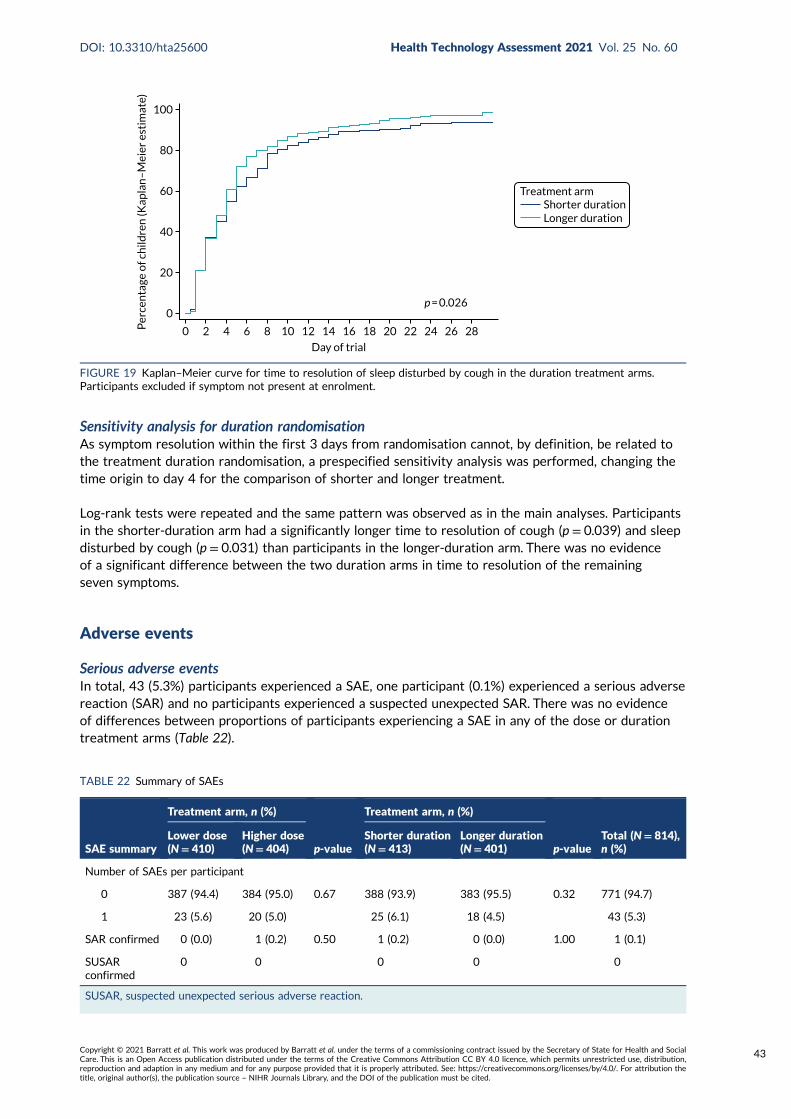
Sensitivity analysis for duration randomisationAs symptom resolution within the first 3 days from randomisation cannot, by definition, be related tothe treatment duration randomisation, a prespecified sensitivity analysis was performed, changing thetime origin to day 4 for the comparison of shorter and longer treatment.
Log-rank tests were repeated and the same pattern was observed as in the main analyses. Participantsin the shorter-duration arm had a significantly longer time to resolution of cough (p = 0.039) and sleepdisturbed by cough (p = 0.031) than participants in the longer-duration arm. There was no evidenceof a significant difference between the two duration arms in time to resolution of the remainingseven symptoms.
Adverse events
Serious adverse eventsIn total, 43 (5.3%) participants experienced a SAE, one participant (0.1%) experienced a serious adversereaction (SAR) and no participants experienced a suspected unexpected SAR. There was no evidenceof differences between proportions of participants experiencing a SAE in any of the dose or durationtreatment arms (Table 22).
0
0 2 4 6 8 10 12 14 16
Day of trial
18 20 22 24 26 28
p = 0.026
20
40
60
Per
cen
tage
of c
hild
ren
(Kap
lan
–M
eier
est
imat
e)80
100
Shorter durationLonger duration
Treatment arm
FIGURE 19 Kaplan–Meier curve for time to resolution of sleep disturbed by cough in the duration treatment arms.Participants excluded if symptom not present at enrolment.
TABLE 22 Summary of SAEs
SAE summary
Treatment arm, n (%)
p-value
Treatment arm, n (%)
p-valueTotal (N= 814),n (%)
Lower dose(N= 410)
Higher dose(N= 404)
Shorter duration(N= 413)
Longer duration(N= 401)
Number of SAEs per participant
0 387 (94.4) 384 (95.0) 0.67 388 (93.9) 383 (95.5) 0.32 771 (94.7)
1 23 (5.6) 20 (5.0) 25 (6.1) 18 (4.5) 43 (5.3)
SAR confirmed 0 (0.0) 1 (0.2) 0.50 1 (0.2) 0 (0.0) 1.00 1 (0.1)
SUSARconfirmed
0 0 0 0 0
SUSAR, suspected unexpected serious adverse reaction.
DOI: 10.3310/hta25600 Health Technology Assessment 2021 Vol. 25 No. 60
Copyright © 2021 Barratt et al. This work was produced by Barratt et al. under the terms of a commissioning contract issued by the Secretary of State for Health and SocialCare. This is an Open Access publication distributed under the terms of the Creative Commons Attribution CC BY 4.0 licence, which permits unrestricted use, distribution,reproduction and adaption in any medium and for any purpose provided that it is properly attributed. See: https://creativecommons.org/licenses/by/4.0/. For attribution thetitle, original author(s), the publication source – NIHR Journals Library, and the DOI of the publication must be cited.
43

Of the 43 SAEs, 42 (98%) were hospitalisations and one (2%) (exacerbation of asthma, unrelated to thetrial medication) was classified as life-threatening (Table 23), necessitating intubation and transfer ofthe patient to a paediatric intensive care unit. Respiratory events were the most common diagnoses,accounting for 35 of 43 SAEs (81%), of which 16 (37%) were classified as respiratory distress, eight(19%) were lower respiratory tract infection and five (12%) were pneumonia; the remaining six wereasthma (n = 3, 7%), bronchiolitis (n = 2, 5%) and influenza (n = 1, 2%). Most SAEs occurred betweendays 1 and 4 (n = 29, 67%).
TABLE 23 Serious adverse event details
SAE details
Treatment arm, n (%)
Total (N= 43),n (%)
Shorter duration(N= 25)
Longer duration(N= 18)
Lower dose(N= 23)
Higher dose(N= 20)
Type of SAE
Life-threatening 0 1 (6) 0 1 (5) 1 (2)
Hospitalisation 25 (100) 17 (94) 23 (100) 19 (95) 42 (98)
Body system
Dermatological 1 (4) 1 (6) 1 (4) 1 (5) 2 (5)
Cyanosis peripheral 0 1 (6) 1 (4) 0 1 (2)
Herpes simplex oral 1 (4) 0 0 1 (5) 1 (2)
Gastrointestinal 4 (16) 0 2 (9) 2 (10) 4 (9)
Coffee ground vomiting 1 (4) 0 0 1 (5) 1 (2)
Epiploic appendagitis 1 (4) 0 1 (4) 0 1 (2)
Salmonella gastroenteritis 1 (4) 0 1 (4) 0 1 (2)
Vomiting 1 (4) 0 0 1 (5) 1 (2)
Neurological 1 (4) 1 (6) 2 (9) 0 2 (5)
Cerebellar tumour 0 1 (6) 1 (4) 0 1 (2)
Febrile seizure 1 (4) 0 1 (4) 0 1 (2)
Respiratory 19 (76) 16 (89) 18 (78) 17 (85) 35 (81)
Asthma 1 (4) 2 (11) 0 3 (15) 3 (7)
Bronchiolitis 2 (8) 0 2 (9) 0 2 (5)
Influenza 1 (4) 0 1 (4) 0 1 (2)
Lower respiratory tractinfection viral
1 (4) 7 (39) 3 (13) 5 (25) 8 (19)
Pneumonia 2 (8) 3 (17) 5 (22) 0 5 (12)
Respiratory distress 12 (48) 4 (22) 7 (30) 9 (45) 16 (37)
Trial study day of hospitalisationa
Days 0–3 20 (80) 9 (50) 16 (70) 13 (65) 29 (67)
Days 4–7 0 2 (11) 1 (4) 1 (5) 2 (5)
Days 8–14 2 (8) 1 (6) 1 (4) 2 (10) 3 (7)
Days 15–21 0 2 (11) 0 2 (10) 2 (5)
Days 22–28 3 (12) 4 (22) 5 (22) 2 (10) 7 (16)
RESULTS
NIHR Journals Library www.journalslibrary.nihr.ac.uk
44

The SAR was a diagnosis of vomiting, originally classified by the site investigator as unlikely to berelated to the IMP. However, on clinical review by the Trial Management Team, it was felt that the SAEcould be related to the IMP and the event was, therefore, reclassified as a SAR.
Specified clinical adverse events (diarrhoea, thrush and skin rash)Presence and severity of diarrhoea, thrush and skin rash were elicited from parents at trial entry andthroughout follow-up. Diarrhoea was the most common clinical AE and was present in 345 (43.6%)participants after baseline. Skin rash was present in 193 (24.4%) participants and oral thrush in 57(7.2%) participants after baseline. For both dose and duration randomisations, there was no evidenceof a difference between the randomised arms in terms of overall prevalence of diarrhoea and oralthrush after baseline (Table 24). For skin rash, there was some evidence of a difference between shorter-and longer-duration arms in terms of prevalence after baseline, with the number of participants everhaving skin rash after baseline being 106 (27.4%) in the longer-duration arm and 87 (21.5%) in theshorter-duration arm (p = 0.055).
TABLE 23 Serious adverse event details (continued )
SAE details
Treatment arm, n (%)
Total (N= 43),n (%)
Shorter duration(N= 25)
Longer duration(N= 18)
Lower dose(N= 23)
Higher dose(N= 20)
Event grade
1 11 (44) 4 (22) 9 (39) 6 (30) 15 (35)
2 6 (24) 9 (50) 7 (30) 8 (40) 15 (35)
3 8 (32) 3 (17) 6 (26) 5 (25) 11 (26)
4 0 2 (11) 1 (4) 1 (5) 2 (5)
Relationship to trial medication
Not related 20 (80) 16 (89) 19 (83) 17 (85) 36 (84)
Unlikely 5 (20) 2 (11) 4 (17) 3 (15) 7 (16)
Possibly 0 0 0 0 0
Probably 0 0 0 0 0
Definitely 0 0 0 0 0
Expected of trial medication
Expected 7 (29) 0 5 (22) 2 (11) 7 (17)
Unexpected 17 (71) 18 (100) 18 (78) 17 (89) 35 (83)
Action on trial medication
None 16 (64) 8 (44) 10 (43) 14 (70) 24 (56)
Treatment delayed 1 (4) 0 1 (4) 0 1 (2)
Treatment stopped 8 (32) 10 (56) 12 (52) 6 (30) 18 (42)
Started new antibiotic duringSAE?
12 (48) 15 (83) 16 (70) 11 (55) 27 (63)
Event status at the end of follow-up
Resolved 24 (96) 17 (94) 21 (91) 20 (100) 41 (95)
Ongoing at study exit 1 (4) 1 (6) 2 (9) 0 2 (5)
a This includes the life-threatening SAE.
DOI: 10.3310/hta25600 Health Technology Assessment 2021 Vol. 25 No. 60
Copyright © 2021 Barratt et al. This work was produced by Barratt et al. under the terms of a commissioning contract issued by the Secretary of State for Health and SocialCare. This is an Open Access publication distributed under the terms of the Creative Commons Attribution CC BY 4.0 licence, which permits unrestricted use, distribution,reproduction and adaption in any medium and for any purpose provided that it is properly attributed. See: https://creativecommons.org/licenses/by/4.0/. For attribution thetitle, original author(s), the publication source – NIHR Journals Library, and the DOI of the publication must be cited.
45

TABLE 24 Prevalence of diarrhoea, oral thrush and skin rash after baseline
Prevalence of diarrhoea,oral thrush and skin rash
Treatment arm, n (%)Total(N= 814),n (%)
Lower dose(N= 410)
Higher dose(N= 404)
Shorter duration(N= 413)
Longer duration(N= 401)
First diarrhoea after baselinea
No 276 (78.0) 252 (76.4) 259 (75.1) 269 (79.4) 528 (77.2)
Yes 78 (22.0) 78 (23.6) 86 (24.9) 70 (20.6) 156 (22.8)
p-value p = 0.62 p = 0.18
New diarrhoea after baseline or worse than at baseline
No 303 (75.6) 288 (73.8) 296 (73.3) 295 (76.2) 591 (74.7)
Yes 98 (24.4) 102 (26.2) 108 (26.7) 92 (23.8) 200 (25.3)
p-value p = 0.58 p = 0.34
Ever diarrhoea after baseline
No 234 (58.2) 213 (54.6) 217 (53.7) 230 (59.3) 447 (56.4)
Yes 168 (41.8) 177 (45.4) 187 (46.3) 158 (40.7) 345 (43.6)
p-value p = 0.31 p = 0.11
First thrush after baselineb
No 386 (96.3) 381 (96.0) 390 (96.8) 377 (95.4) 767 (96.1)
Yes 15 (3.7) 16 (4.0) 13 (3.2) 18 (4.6) 31 (3.9)
p-value p = 0.83 p = 0.33
New thrush after baseline or worse than at baseline
No 385 (96.0) 374 (95.9) 390 (96.5) 369 (95.3) 759 (96.0)
Yes 16 (4.0) 16 (4.1) 14 (3.5) 18 (4.7) 32 (4.0)
p-value p = 0.94 p = 0.40
Ever thrush after baseline
No 374 (93.3) 360 (92.3) 379 (93.8) 355 (91.7) 734 (92.8)
Yes 27 (6.7) 30 (7.7) 25 (6.2) 32 (8.3) 57 (7.2)
p-value p = 0.60 p = 0.26
First rash after baselinec
No 310 (86.6) 317 (86.8) 329 (88.4) 298 (84.9) 627 (86.7)
Yes 48 (13.4) 48 (13.2) 43 (11.6) 53 (15.1) 96 (13.3)
p-value p = 0.92 p = 0.16
New rash after baseline or worse than at baseline
No 348 (86.8) 331 (84.9) 354 (87.6) 325 (84.0) 679 (85.8)
Yes 53 (13.2) 59 (15.1) 50 (12.4) 62 (16.0) 112 (14.2)
p-value p = 0.44 p = 0.14
Ever rash after baseline
No 307 (76.6) 291 (74.6) 317 (78.5) 281 (72.6) 598 (75.6)
Yes 94 (23.4) 99 (25.4) 87 (21.5) 106 (27.4) 193 (24.4)
p-value p = 0.52 p = 0.055
a Excludes all participants with diarrhoea at trial entry.b Excludes all participants with thrush at trial entry.c Excludes all participants with rash at trial entry.
RESULTS
NIHR Journals Library www.journalslibrary.nihr.ac.uk
46
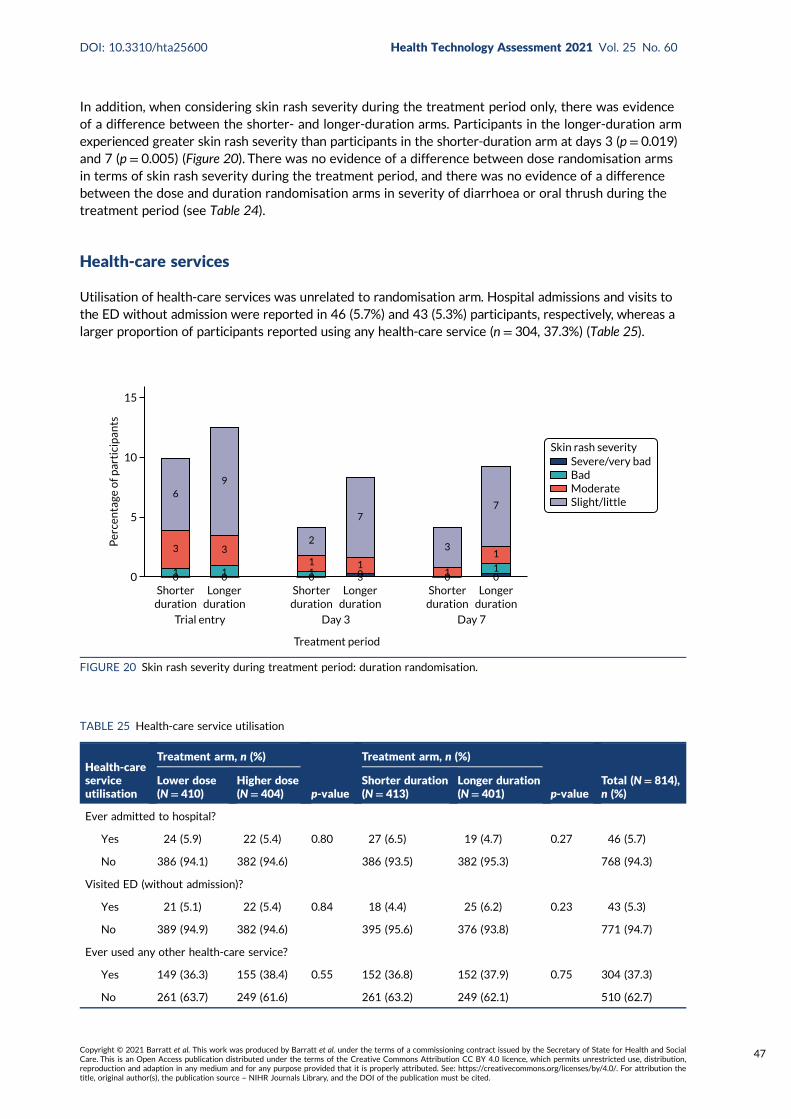
In addition, when considering skin rash severity during the treatment period only, there was evidenceof a difference between the shorter- and longer-duration arms. Participants in the longer-duration armexperienced greater skin rash severity than participants in the shorter-duration arm at days 3 (p = 0.019)and 7 (p = 0.005) (Figure 20). There was no evidence of a difference between dose randomisation armsin terms of skin rash severity during the treatment period, and there was no evidence of a differencebetween the dose and duration randomisation arms in severity of diarrhoea or oral thrush during thetreatment period (see Table 24).
Health-care services
Utilisation of health-care services was unrelated to randomisation arm. Hospital admissions and visits tothe ED without admission were reported in 46 (5.7%) and 43 (5.3%) participants, respectively, whereas alarger proportion of participants reported using any health-care service (n = 304, 37.3%) (Table 25).
0
Per
cen
tage
of p
arti
cip
ants
15
10
5
Severe/very badBadModerateSlight/little
Shorterduration
Longerduration
Shorterduration
Longerduration
Shorterduration
Longerduration
Trial entry Day 3
Treatment period
Day 7
Skin rash severity
6
3
10 1
3
9
0 11
2
0 301
7
1
3
0 01
1
7
FIGURE 20 Skin rash severity during treatment period: duration randomisation.
TABLE 25 Health-care service utilisation
Health-careserviceutilisation
Treatment arm, n (%)
p-value
Treatment arm, n (%)
p-valueTotal (N= 814),n (%)
Lower dose(N= 410)
Higher dose(N= 404)
Shorter duration(N= 413)
Longer duration(N= 401)
Ever admitted to hospital?
Yes 24 (5.9) 22 (5.4) 0.80 27 (6.5) 19 (4.7) 0.27 46 (5.7)
No 386 (94.1) 382 (94.6) 386 (93.5) 382 (95.3) 768 (94.3)
Visited ED (without admission)?
Yes 21 (5.1) 22 (5.4) 0.84 18 (4.4) 25 (6.2) 0.23 43 (5.3)
No 389 (94.9) 382 (94.6) 395 (95.6) 376 (93.8) 771 (94.7)
Ever used any other health-care service?
Yes 149 (36.3) 155 (38.4) 0.55 152 (36.8) 152 (37.9) 0.75 304 (37.3)
No 261 (63.7) 249 (61.6) 261 (63.2) 249 (62.1) 510 (62.7)
DOI: 10.3310/hta25600 Health Technology Assessment 2021 Vol. 25 No. 60
Copyright © 2021 Barratt et al. This work was produced by Barratt et al. under the terms of a commissioning contract issued by the Secretary of State for Health and SocialCare. This is an Open Access publication distributed under the terms of the Creative Commons Attribution CC BY 4.0 licence, which permits unrestricted use, distribution,reproduction and adaption in any medium and for any purpose provided that it is properly attributed. See: https://creativecommons.org/licenses/by/4.0/. For attribution thetitle, original author(s), the publication source – NIHR Journals Library, and the DOI of the publication must be cited.
47

Daily activities and child care
Data on daily activities and child care were available from parent/guardian-completed diaries for441 participants (Table 26). No differences in reported disruption to daily activities and child care werefound between randomisation arms. In total, 73.9% of participants reported that the child had missedschool, day care or nursery, and the median number of days missed was 4 (IQR 0–6) days. In addition,63.8% of parents reported missing work, with a median of 3 (IQR 0–5) days missed, and 34.9% ofparents reported requiring additional care for the child.
TABLE 26 Daily activities and child care
Daily activity/child care
Treatment arm
p-value
Treatment arm
p-valueTotal(N= 441)
Lower dose(N= 298)
Higher dose(N= 289)
Shorterduration(N= 291)
Longerduration(N= 296)
Child missed school, day care or nursery: ever, n (%)
Yes 152 (71.0) 174 (76.7) 0.18 159 (72.3) 167 (75.6) 0.43 326 (73.9)
No 62 (29.0) 53 (23.3) 61 (27.7) 54 (24.4) 115 (26.1)
Days child missed school, daycare or nursery, median (IQR)
4 (0–5) 4 (2–6) 0.14 4 (0–6) 4 (2–6) 0.62 4 (0–6)
Parent missed work: ever, n (%)
Yes 128 (64.0) 136 (63.6) 0.92 127 (62.9) 137 (64.6) 0.71 264 (63.8)
No 72 (36.0) 78 (36.4) 75 (37.1) 75 (35.4) 150 (36.2)
Days parent missed work,median (IQR)
3 (0–4) 3 (0–5) 0.43 3 (0–4) 3 (0–5) 0.20 3 (0–5)
Parent missed other activities: ever, n (%)
Yes 50 (33.6) 56 (33.7) 0.97 53 (34.2) 53 (33.1) 0.84 106 (33.7)
No 99 (66.4) 110 (66.3) 102 (65.8) 107 (66.9) 209 (66.3)
Days parent missed otheractivities: cumulative, median(IQR)
0 (0–4) 0 (0–4) 0.88 0 (0–5) 0 (0–4) 0.50 0 (0–4)
Additional care needed for child: ever, n (%)
Yes 73 (36.3) 72 (33.5) 0.54 73 (34.9) 72 (34.8) 0.98 145 (34.9)
No 128 (63.7) 143 (66.5) 136 (65.1) 135 (65.2) 271 (65.1)
Days additional care neededfor child: cumulative, median(IQR)
0 (0–3) 0 (0–3) 0.54 0 (0–3) 0 (0–3) 0.83 0 (0–3)
NoteData are as reported in the symptom diary.
RESULTS
NIHR Journals Library www.journalslibrary.nihr.ac.uk
48
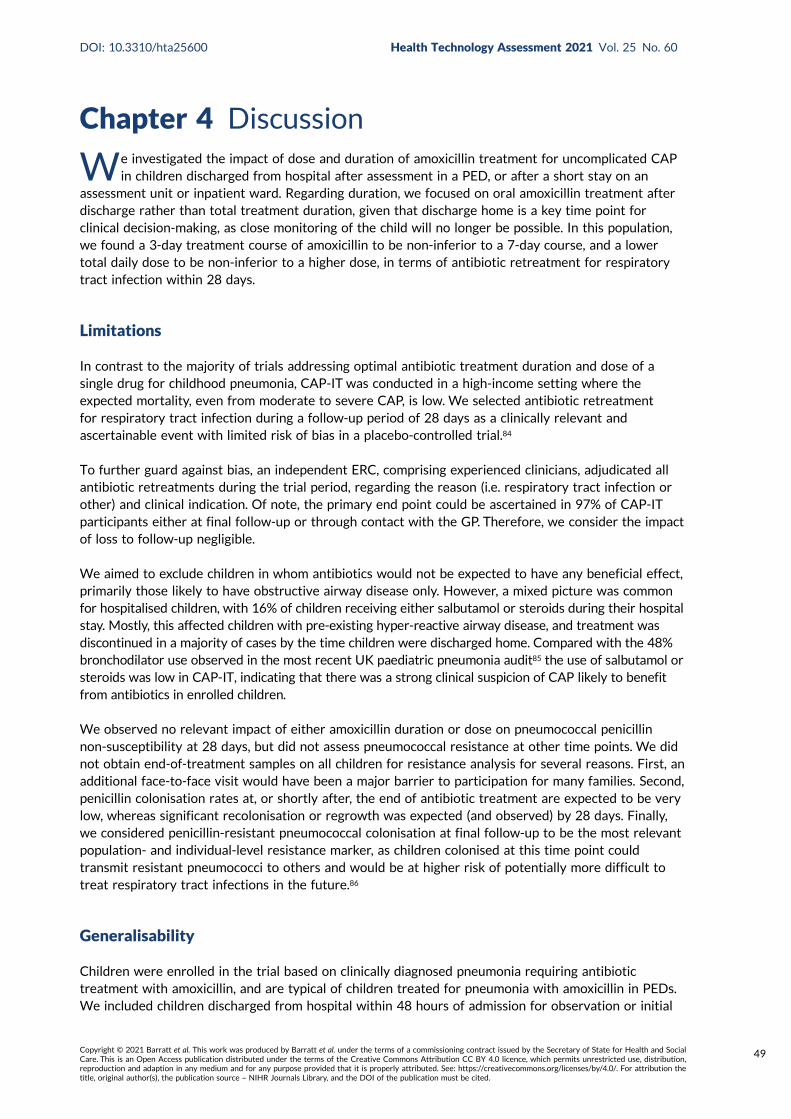
Chapter 4 Discussion
We investigated the impact of dose and duration of amoxicillin treatment for uncomplicated CAPin children discharged from hospital after assessment in a PED, or after a short stay on an
assessment unit or inpatient ward. Regarding duration, we focused on oral amoxicillin treatment afterdischarge rather than total treatment duration, given that discharge home is a key time point forclinical decision-making, as close monitoring of the child will no longer be possible. In this population,we found a 3-day treatment course of amoxicillin to be non-inferior to a 7-day course, and a lowertotal daily dose to be non-inferior to a higher dose, in terms of antibiotic retreatment for respiratorytract infection within 28 days.
Limitations
In contrast to the majority of trials addressing optimal antibiotic treatment duration and dose of asingle drug for childhood pneumonia, CAP-IT was conducted in a high-income setting where theexpected mortality, even from moderate to severe CAP, is low. We selected antibiotic retreatmentfor respiratory tract infection during a follow-up period of 28 days as a clinically relevant andascertainable event with limited risk of bias in a placebo-controlled trial.84
To further guard against bias, an independent ERC, comprising experienced clinicians, adjudicated allantibiotic retreatments during the trial period, regarding the reason (i.e. respiratory tract infection orother) and clinical indication. Of note, the primary end point could be ascertained in 97% of CAP-ITparticipants either at final follow-up or through contact with the GP. Therefore, we consider the impactof loss to follow-up negligible.
We aimed to exclude children in whom antibiotics would not be expected to have any beneficial effect,primarily those likely to have obstructive airway disease only. However, a mixed picture was commonfor hospitalised children, with 16% of children receiving either salbutamol or steroids during their hospitalstay. Mostly, this affected children with pre-existing hyper-reactive airway disease, and treatment wasdiscontinued in a majority of cases by the time children were discharged home. Compared with the 48%bronchodilator use observed in the most recent UK paediatric pneumonia audit85 the use of salbutamol orsteroids was low in CAP-IT, indicating that there was a strong clinical suspicion of CAP likely to benefitfrom antibiotics in enrolled children.
We observed no relevant impact of either amoxicillin duration or dose on pneumococcal penicillinnon-susceptibility at 28 days, but did not assess pneumococcal resistance at other time points. We didnot obtain end-of-treatment samples on all children for resistance analysis for several reasons. First, anadditional face-to-face visit would have been a major barrier to participation for many families. Second,penicillin colonisation rates at, or shortly after, the end of antibiotic treatment are expected to be verylow, whereas significant recolonisation or regrowth was expected (and observed) by 28 days. Finally,we considered penicillin-resistant pneumococcal colonisation at final follow-up to be the most relevantpopulation- and individual-level resistance marker, as children colonised at this time point couldtransmit resistant pneumococci to others and would be at higher risk of potentially more difficult totreat respiratory tract infections in the future.86
Generalisability
Children were enrolled in the trial based on clinically diagnosed pneumonia requiring antibiotictreatment with amoxicillin, and are typical of children treated for pneumonia with amoxicillin in PEDs.We included children discharged from hospital within 48 hours of admission for observation or initial
DOI: 10.3310/hta25600 Health Technology Assessment 2021 Vol. 25 No. 60
Copyright © 2021 Barratt et al. This work was produced by Barratt et al. under the terms of a commissioning contract issued by the Secretary of State for Health and SocialCare. This is an Open Access publication distributed under the terms of the Creative Commons Attribution CC BY 4.0 licence, which permits unrestricted use, distribution,reproduction and adaption in any medium and for any purpose provided that it is properly attributed. See: https://creativecommons.org/licenses/by/4.0/. For attribution thetitle, original author(s), the publication source – NIHR Journals Library, and the DOI of the publication must be cited.
49
clinical management, as hospital stays for acute respiratory tract infections, including pneumonia,are mostly of very short duration.87,88 Data from the pilot phase confirmed that these children couldbe considered part of the same spectrum of disease as those discharged directly home from the ED.Only 13% of screened children were not approached because of physician preference for an antibioticother than amoxicillin at discharge. This is in keeping with guidance suggesting that amoxicillin is usedas the first-line antibiotic for oral treatment of uncomplicated childhood pneumonia in the community.
We excluded children with complicated pneumonia requiring prolonged hospitalisation, and those receivingnon-beta-lactam treatment. Our findings, therefore, cannot be directly generalised to more severelyill children or those treated for atypical pneumonia. However, it is highly likely that our observationsare relevant to children with mild to moderate pneumonia seen in primary care, who would be treatedwith oral amoxicillin at home. In primary care, the acuity of disease is generally lower and a lower rateof pneumonia likely to benefit from antibiotic treatment is expected.
No nasopharyngeal penicillin-resistant pneumococcal isolates were observed in the trial, either at baselineor at final follow-up, which is consistent with reported low penicillin resistance levels in northernEurope.89 Therefore, our findings for the effectiveness of lower compared with higher amoxicillin dose,and impact on resistance, may be of limited generalisability to children with pneumonia in other high-income settings with higher pneumococcal penicillin resistance prevalence.
Twice-daily dosing of amoxicillin in line with WHO and other international recommendations was usedin CAP-IT, rather than administration in three daily doses, as recommended by the BNFc. This wasselected as it is known to maximise adherence, which would be particularly important in childrenallocated to the lower-dose and shorter-duration arms. In addition, patient representatives involvedin the design phase indicated this approach to be particularly family friendly, as an additional mid-daydose is difficult to give to children who attend day care. Consequently, our findings, especiallyfor antimicrobial resistance outcomes, may not be generalisable to children being treated with athrice-daily amoxicillin regimen. However, participants in CAP-IT had rates of antibiotic retreatmentand secondary or rehospitalisation similar to those described in observational studies conducted insettings with standard administration of amoxicillin in three doses.41,87,90,91
Interpretation
To the best of our knowledge, few head-to-head comparisons of the same antibiotic in differentdosing or duration regimens have been conducted in children being treated for pneumonia. Most ofthe existing literature reports on trials conducted in low- and middle-income settings prior to thewidespread availability of PCVs and in an era with lower pneumococcal penicillin resistance.92,93 Tworecent relevant trials94,95 conducted in Malawi investigated 3-day compared with 5-day amoxicillintreatment and 3-day amoxicillin treatment compared with placebo in young children with non-severepneumonia and not infected with human immunodeficiency virus. In summary, 3-day treatment at adose corresponding to the higher total daily dose in CAP-IT was found to be non-inferior to 5-daytreatment for early treatment failure, but this was not the case for placebo compared with 3-daytreatment. The same trial identified the number needed to treat for children with non-severe fast-breathing pneumonia to be 33. These trials used high-sensitivity, but low-specificity eligibility criteriaappropriate for a high-mortality setting. Evidence specific to high-income settings is lacking and hasled some guideline-setting bodies to question the generalisability of findings from large trials in low-or middle-income countries to high-income settings. The persisting evidence gap for children identifiedas having pneumonia applying higher specificity clinical criteria in high-income settings has now beenaddressed by CAP-IT.
A relatively high retreatment rate of 12.5% was observed in the CAP-IT cohort. This is consistent withsimilarly high retreatment rates in primary care reported in large observational studies, but has not
DISCUSSION
NIHR Journals Library www.journalslibrary.nihr.ac.uk
50

previously been described for children with CAP seen in EDs or discharged from hospital after a shortstay. Similarly, the secondary or rehospitalisation rate of around 5% was similar to that described forchildren with pneumonia in observational studies.
We observed remarkably similar retreatment rates for respiratory tract infections between the 3- and7-day treatment durations, despite 2-day slower resolution of mild cough, on average, in the shorter-duration arm. We did not identify any differences between the lower- and higher-dose treatment arms.Antibiotic retreatment for respiratory tract infection during the follow-up period could be related totrue failure of the initial treatment or could be linked to persistent symptoms unlikely to be responsiveto amoxicillin because they were mainly triggered by a viral (co-)infection or new respiratory tractinfection episodes.
Children and parents in the 3-day randomisation arm were not reported to have spent a longer timeaway from day care or school and work, making it unlikely that cough had a major impact on children’susual routines. Slightly longer time to symptom resolution in placebo arms or placebo-controlledshorter-duration arms has been reported for acute otitis media.96 However, it is unclear how childrenbeing mildly symptomatic for longer is weighed against the benefits of shorter treatment by childrenand their families. When symptoms are minor, shorter treatment is likely to be a key factor in allowingchildren to return to usual activities and will maximise adherence.97,98
Antimicrobial resistance was a key secondary outcome in CAP-IT. Colonisation by penicillin-non-susceptible pneumococci at 28 days was similar for both randomisation arms. In general, the observedprevalence of pneumococcal penicillin non-susceptibility and the complete absence of penicillin-resistant pneumococci was in line with the UK being a low-resistance setting. Pneumococcal penicillinresistance alone is unlikely to reflect the full impact of amoxicillin dose and duration on the childnasopharyngeal microflora, including the presence of resistance genotypes. Next-generationsequencing approaches could provide in-depth information about differential changes in themicrobiome and resistome with higher or lower amoxicillin dose and shorter or longer treatmentduration. However, the interpretation of such analyses is likely to be complex, and will need to takeaccount of the interactions between different pneumococcal subpopulations, as well as betweenpneumococci and other bacteria in a densely populated niche. An analysis of nasopharyngeal samplesobtained in CAP-IT using next-generation sequencing approaches is ongoing.
Several other trials have generated results that complement CAP-IT findings, or are expected to in thenear future. In the UK, this includes the primary care-based ARTIC PC (Antibiotics for lower RespiratoryTract Infection in Children presenting in Primary Care) study,99 a randomised placebo-controlled trialinvestigating the benefit of a 7-day course of oral amoxicillin in children with possible lower respiratorytract infection (but not considered to have pneumonia clinically). The SAFER (Short-Course AntimicrobialTherapy for Pediatric Community-Acquired Pneumonia) trial100 in Canada and SCOUT-CAP (ShortCourse Outpatient Therapy of Community Acquired Pneumonia) study in the USA both target childrenpresenting to EDs but not admitted to hospital, the former comparing 5- and 10-day treatment courseswith amoxicillin and the latter a selection of beta-lactams. The SCOUT-CAP study is expected to reporton results at the end of 2021. Finally, a Canadian open-label RCT (NCT03031210) is investigating twice-compared with thrice-daily amoxicillin dosing in children treated for pneumonia. The total daily dose inthis trial corresponds to the higher total daily dose investigated in CAP-IT.
Implications
For clinical practice, CAP-IT supports routine use of shorter, 3-day, oral amoxicillin courses at currentdoses for children presenting to hospital with uncomplicated clinically diagnosed CAP for community-based treatment after discharge from acute care. A slightly longer time to resolution of mild cough canbe expected in children treated for 3 days, compared with children treated for 7 days.
DOI: 10.3310/hta25600 Health Technology Assessment 2021 Vol. 25 No. 60
Copyright © 2021 Barratt et al. This work was produced by Barratt et al. under the terms of a commissioning contract issued by the Secretary of State for Health and SocialCare. This is an Open Access publication distributed under the terms of the Creative Commons Attribution CC BY 4.0 licence, which permits unrestricted use, distribution,reproduction and adaption in any medium and for any purpose provided that it is properly attributed. See: https://creativecommons.org/licenses/by/4.0/. For attribution thetitle, original author(s), the publication source – NIHR Journals Library, and the DOI of the publication must be cited.
51

For research, existing systematic reviews and meta-analyses should be updated to include CAP-IT andother high-income setting trials. A series of relevant trials includes studies already completed or aboutto complete. Their inclusion, for example in existing Cochrane reviews, would ensure that key referencesystematic reviews are relevant globally.
The question of the comparison between two and three times daily dosing of amoxicillin needs to beaddressed. However, this may best be tackled by modelling and simulation based on high-qualitypharmacokinetic data analysed using modern pharmacometric approaches. Such data are needed froma variety of settings, including low/high prevalence of pneumococcal penicillin resistance, varyingpneumococcal vaccine coverage and low-, middle- and high-income settings characterised by varyingprevalence of important covariates, such as malnutrition and obesity. Data from adults suggest that gutamoxicillin absorption may be saturable, limiting the expected utility of high-dose regimens.101
A proportion of children screened for CAP-IT were identified to be ineligible because the managingclinician was planning treatment with an antibiotic other than amoxicillin. Trial data supporting theuse of macrolides (targeting atypical pathogens) or alternative beta-lactams, such as amoxicillin/clavulanate (co-amoxiclav, targeting Gram-negative respiratory pathogens producing beta-lactamases),are lacking.
DISCUSSION
NIHR Journals Library www.journalslibrary.nihr.ac.uk
52
Chapter 5 Conclusions
l For children presenting to acute care settings with uncomplicated, clinically diagnosed, moderate ormoderate to severe CAP who can be managed at home, there is no evidence to suggest that a longer7-day treatment course of oral amoxicillin offers any advantage over a shorter 3-day course, in termsof antibiotic retreatment for respiratory tract infection within 4 weeks. Therefore, the trial supportsroutine use of 3-day oral amoxicillin courses after discharge from hospital in this population.
l Slightly longer time to resolution of mild cough was observed in children treated for 3 days than inthose treated for 7 days. Given the advantages of a shorter duration of treatment for adherenceand the observed declining adherence during treatment days 4–7 in the trial, a 3-day course of oralamoxicillin nonetheless appears preferable. This would have the added benefit of greater harmonisationof antibiotic treatment duration guidance between low-/middle-income and high-income settings.
l Similarly, we found that lower total daily doses of oral amoxicillin were non-inferior to higher dailydoses, in terms of antibiotic retreatment for respiratory tract infection within 4 weeks. Dosingregimens were also similar in terms of impact on pneumococcal antimicrobial resistance and safety.
l Of note, a weight-banded approach was used for dose selection, resulting in less variability in totaldaily dose compared with an age-banded approach (as is used in the UK in clinical practice). Basedon the age-banded approach, both doses studied in CAP-IT are expected to be prescribed in the UKbecause of variations in weight within broad age bands.
l Either (lower and higher) total daily dose is feasible to deliver in high-income settings whereamoxicillin suspensions of different concentrations are available and are prescribed in preferenceto solid child-appropriate formulations (i.e. solid forms that are liquid on ingestion or become liquidon administration). As a result, moving between lower and higher total daily doses does not result ingreater volumes per dose for treated children.
l However, the situation is different in low- and middle-income settings, where the preferredformulation is dispersible tablets. The lowest-concentration child-appropriate solid formulationsupported by the United Nations International Children's Emergency Fund (UNICEF) and WHOcontains 250 mg of amoxicillin in a non-divisible dispersible tablet. Administration of this tablet twicea day to young infants (weighing 4–10 kg) gives a wide dose range of 50 (10 kg) to 125 (4 kg) mg/kgper day, with many children expected to receive doses in the higher dose range of CAP-IT. CAP-ITresults did not identify any clinically relevant disadvantages to using higher doses; therefore,supporting the continued use of existing dispersible tablets.
l We did not formally compare twice- with thrice-daily dosing. However, we note that children inCAP-IT had good clinical outcomes, with antibiotic retreatment rates and secondary or re-admissionrates similar to those described for children with acute lower respiratory tract infections in observationalstudies in the UK where amoxicillin treatment would generally be given three times daily.
DOI: 10.3310/hta25600 Health Technology Assessment 2021 Vol. 25 No. 60
Copyright © 2021 Barratt et al. This work was produced by Barratt et al. under the terms of a commissioning contract issued by the Secretary of State for Health and SocialCare. This is an Open Access publication distributed under the terms of the Creative Commons Attribution CC BY 4.0 licence, which permits unrestricted use, distribution,reproduction and adaption in any medium and for any purpose provided that it is properly attributed. See: https://creativecommons.org/licenses/by/4.0/. For attribution thetitle, original author(s), the publication source – NIHR Journals Library, and the DOI of the publication must be cited.
53


Acknowledgements
We would like to thank all of the patients, their families and the staff from the participatingcentres for their vital contributions to CAP-IT.
Trial Steering Committee
Elizabeth Molyneux (chairperson), Chris Butler, Alan Smyth and Catherine Pritchard (PPI).
Independent Data Monitoring Committee
Tim Peto (chairperson), Simon Cousens and Stuart Logan.
Independent End-Point Review Committee
Alasdair Bamford (chairperson), Anna Turkova, Anna Goodman and Felicity Fitzgerald.
Trial Management Group
Mike Sharland (chairperson), Julia Bielicki, Mark Lyttle, Colin Powell, Paul Little, Saul Faust, Adam Finn,Julie Robotham, Mandy Wan, David Dunn, Wolfgang Stöhr, Lynda Harper, Sam Barratt, Nigel Klein,Louise Rogers, Elia Vitale and Diana Gibb.
Investigator sites
Alder Hey Children’s Hospital NHS Foundation Trust, Liverpool: Dan Hawcutt (principal investigator),Matt Rotheram, Liz D Lee and Rachel Greenwood-Bibby.
Birmingham Children’s Hospital: Stuart Hartshorn (principal investigator), Deepthi Jyothish, Louise Rogersand Juliet Hopkins.
Bristol Royal Hospital for Children: Mark Lyttle (principal investigator), Stefania Vergnano, Lucie Aplin,Pauline Jackson, Gurnie Kaur, Beth Pittaway, Michelle Ross, Sarah Sheedy, Alice Smith and Yesenia Tanner.
Chelsea and Westminster Hospital NHS Foundation Trust, London: James Ross (principal investigator),Poonam Patel, Nabila Burney, Hannah Fletcher, Jaime Carungcong and Kribashnie Nundlall.
City Hospitals Sunderland NHS Foundation Trust: Niall Mullen (principal investigator), Rhona McCroneand Paul P Corrigan.
Countess of Chester Hospital: Susie Holt (principal investigator), John Gibbs, Caroline Burchett,Caroline Lonsdale and Sarah De-Beger.
Darlington Memorial Hospital: Godfrey Nyamugunuduru (principal investigator), John Furness(former principal investigator) and Dawn Eggington.
Derbyshire Children’s Hospital, Derby: Gisela Robinson (principal investigator), Lizzie Starkey andMel Hayman.
DOI: 10.3310/hta25600 Health Technology Assessment 2021 Vol. 25 No. 60
Copyright © 2021 Barratt et al. This work was produced by Barratt et al. under the terms of a commissioning contract issued by the Secretary of State for Health and SocialCare. This is an Open Access publication distributed under the terms of the Creative Commons Attribution CC BY 4.0 licence, which permits unrestricted use, distribution,reproduction and adaption in any medium and for any purpose provided that it is properly attributed. See: https://creativecommons.org/licenses/by/4.0/. For attribution thetitle, original author(s), the publication source – NIHR Journals Library, and the DOI of the publication must be cited.
55
Evelina London Children’s Hospital: Anastasia Alcock (principal investigator), Dani Hall(former principal investigator), Ronny Cheung, Alyce B Sheedy and Mohammad Ahmad.
James Cook University Hospital, Middlesbrough: Arshid Murad (principal investigator), Katherine Jarmanand Joanna Green.
John Radcliffe Hospital, Oxford: Tanya Baron (principal investigator), Chris Bird (former principalinvestigator I), Shelley Segal and Sally Beer.
King’s College Hospital, London: Fleur Cantle (principal investigator), Hannah Eastman,Raine Astin-Chamberlain, Paul Riozzi and Hannah Cotton.
Leeds Children’s Hospital: Sean O’Riordan (principal investigator), Alice Downes, Marjorie Allen andLouise Conner.
Leicester Royal Infirmary: Damian Roland (principal investigator), Srini Bandi and Rekha Patel.
Nottingham University Hospitals NHS Trust: Chris Gough (principal investigator), Megan McAulay andLouise Conner.
Southport and Ormskirk Hospital NHS Trust: Sharryn Gardner (principal investigator), Zena Haslamand Moira Morrison.
Our Lady’s Children’s Hospital, Crumlin: Michael Barrett (principal investigator) and Madeleine Niermeyer.
Royal Alexandra Children’s Hospital, Brighton: Emily Walton (principal investigator), Akshat Kapur andVivien Richmond.
Royal Hospital for Children, Glasgow: Steven Foster (principal investigator), Ruth Bland, Ashleigh Neil,Barry Milligan and Helen Bannister.
Royal London Hospital: Ben Bloom (principal investigator), Ami Parikh, Olivia Boulton and Imogen Skene.
Royal Manchester Children’s Hospital: Katherine Potier (principal investigator), Fiona Poole andJill L Wilson.
Sheffield Children’s NHS Foundation Trust: Judith Gilchrist (principal investigator), Noreen West,Jayne Evans and Julie Morecombe.
St George’s Hospital, London: Paul Heath (principal investigator), Yasser Iqbal, Malte Kohns,Elena Stefanova and Elia Vitale.
St Mary’s Hospital, London: Ian Maconochie (principal investigator), Suzanne Laing and Rikke Jorgensen.
University Hospital Lewisham: Maggie Nyirenda (principal investigator), Anastasia Alcock, Samia Pilgrimand Emma Gardiner.
University Hospital of Wales, Cardiff: Jeff Morgan (principal investigator), Colin VE Powell(former principal investigator), Jennifer Muller and Gail Marshall.
Southampton Children’s Hospital: Katrina Cathie (principal investigator), Jane Bayreuther, Ruth Ensomand Emily Cornish.
ACKNOWLEDGEMENTS
NIHR Journals Library www.journalslibrary.nihr.ac.uk
56

Contributions of authors
Sam Barratt (https://orcid.org/0000-0003-3265-9486) (Clinical Trials Manager) contributed tocompiling data and drafting the report.
Julia A Bielicki (https://orcid.org/0000-0002-3902-5489) (Consultant in Paediatric InfectiousDiseases) drafted the report.
David Dunn (https://orcid.org/0000-0003-1836-4446) (Professor of Medical Statistics) performedstatistical analyses.
Saul N Faust (https://orcid.org/0000-0003-3410-7642) (Professor of Paediatric Immunology andInfectious Diseases) contributed to drafting the report.
Adam Finn (https://orcid.org/0000-0003-1756-5668) (Professor of Paediatrics) performedresistance analyses.
Lynda Harper (https://orcid.org/0000-0003-3430-0127) (Clinical Project Manager) contributed todrafting the report.
Pauline Jackson (https://orcid.org/0000-0001-6461-953X) (Paediatric Nurse) contributed to draftingthe report.
Mark D Lyttle (https://orcid.org/0000-0002-8634-7210) (Consultant in Paediatric Emergency Medicine)contributed to drafting the report.
Colin VE Powell (https://orcid.org/0000-0001-8181-875X) (Consultant in Paediatric EmergencyMedicine) contributed to drafting the report.
Louise Rogers (https://orcid.org/0000-0002-5037-847X) (Clinical Research Sister) contributed todrafting the report.
Damian Roland (https://orcid.org/0000-0001-9334-5144) (Consultant in Paediatric EmergencyMedicine) contributed to drafting the report.
Wolfgang Stöhr (https://orcid.org/0000-0002-6533-2888) (Senior Medical Statistician) performedstatistical analyses.
Kate Sturgeon (https://orcid.org/0000-0003-2209-141X) (Senior Research Nurse) contributed todrafting the report.
Elia Vitale (https://orcid.org/0000-0001-5750-8436) (Senior Paediatric Clinical Research Nurse)contributed to drafting the report.
Mandy Wan (https://orcid.org/0000-0001-8802-0425) (Paediatric Clinical Trials Pharmacist)contributed to drafting the report.
Diana M Gibb (https://orcid.org/0000-0002-9738-5490) (Professor, Epidemiology) drafted the report.
Mike Sharland (https://orcid.org/0000-0001-8626-8291) (Professor of Paediatric Infectious Diseases)drafted the report.
DOI: 10.3310/hta25600 Health Technology Assessment 2021 Vol. 25 No. 60
Copyright © 2021 Barratt et al. This work was produced by Barratt et al. under the terms of a commissioning contract issued by the Secretary of State for Health and SocialCare. This is an Open Access publication distributed under the terms of the Creative Commons Attribution CC BY 4.0 licence, which permits unrestricted use, distribution,reproduction and adaption in any medium and for any purpose provided that it is properly attributed. See: https://creativecommons.org/licenses/by/4.0/. For attribution thetitle, original author(s), the publication source – NIHR Journals Library, and the DOI of the publication must be cited.
57

Data-sharing statement
All data requests should be submitted to the corresponding author for consideration. Access toanonymised data may be granted following review.
Patient data
This work uses data provided by patients and collected by the NHS as part of their care and support.Using patient data is vital to improve health and care for everyone. There is huge potential to makebetter use of information from people’s patient records, to understand more about disease, developnew treatments, monitor safety, and plan NHS services. Patient data should be kept safe and secure, toprotect everyone’s privacy, and it’s important that there are safeguards to make sure that it is storedand used responsibly. Everyone should be able to find out about how patient data are used. #datasaveslivesYou can find out more about the background to this citation here: https://understandingpatientdata.org.uk/data-citation.
ACKNOWLEDGEMENTS
NIHR Journals Library www.journalslibrary.nihr.ac.uk
58
References
1. Lyttle MD, Bielicki JA, Barratt S, Dunn D, Finn A, Harper L, et al. Efficacy, safety and impact onantimicrobial resistance of duration and dose of amoxicillin treatment for young children withCommunity-Acquired Pneumonia: a protocol for a randomIsed controlled Trial (CAP-IT).BMJ Open 2019;9:e029875. https://doi.org/10.1136/bmjopen-2019-029875
2. Holstiege J, Schink T, Molokhia M, Mazzaglia G, Innocenti F, Oteri A, et al. Systemic antibioticprescribing to paediatric outpatients in 5 European countries: a population-based cohort study.BMC Pediatr 2014;14:174. https://doi.org/10.1186/1471-2431-14-174
3. Sturkenboom MC, Verhamme KM, Nicolosi A, Murray ML, Neubert A, Caudri D, et al. Drug usein children: cohort study in three European countries. BMJ 2008;337:a2245. https://doi.org/10.1136/bmj.a2245
4. Vaz LE, Kleinman KP, Raebel MA, Nordin JD, Lakoma MD, Dutta-Linn MM, Finkelstein JA. Recenttrends in outpatient antibiotic use in children. Pediatrics 2014;133:375–85. https://doi.org/10.1542/peds.2013-2903
5. Grijalva CG, Nuorti JP, Griffin MR. Antibiotic prescription rates for acute respiratory tractinfections in US ambulatory settings. JAMA 2009;302:758–66. https://doi.org/10.1001/jama.2009.1163
6. Hersh AL, Shapiro DJ, Pavia AT, Shah SS. Antibiotic prescribing in ambulatory pediatrics in theUnited States. Pediatrics 2011;128:1053–61. https://doi.org/10.1542/peds.2011-1337
7. Cevey-Macherel M, Galetto-Lacour A, Gervaix A, Siegrist CA, Bille J, Bescher-Ninet B, et al.Etiology of community-acquired pneumonia in hospitalized children based on WHO clinicalguidelines. Eur J Pediatr 2009;168:1429–36. https://doi.org/10.1007/s00431-009-0943-y
8. Bielicki J, Doerholt K, Sharland M. The Effect of Age Banding on Daily Dose of Amoxicillin-BasedTreatments of Community Acquired Pneumonia. The British Paediatric Allergy Immunity andInfection Group Winter Meeting, London, UK, 2013.
9. Sands R, Shanmugavadivel D, Stephenson T, Wood D. Medical problems presenting topaediatric emergency departments: 10 years on. Emerg Med J 2012;29:379–82. https://doi.org/10.1136/emj.2010.106229
10. Oostenbrink R, Thompson M, Lakhanpaul M, Steyerberg EW, Coad N, Moll HA. Children withfever and cough at emergency care: diagnostic accuracy of a clinical model to identify childrenat low risk of pneumonia. Eur J Emerg Med 2013;20:273–80. https://doi.org/10.1097/MEJ.0b013e32835771fd
11. Gill PJ, Goldacre MJ, Mant D, Heneghan C, Thomson A, Seagroatt V, Harnden A. Increase inemergency admissions to hospital for children aged under 15 in England, 1999–2010: nationaldatabase analysis. Arch Dis Child 2013;98:328–34. https://doi.org/10.1136/archdischild-2012-302383
12. Brousseau DC, Nimmer MR, Yunk NL, Nattinger AB, Greer A. Nonurgent emergency-department care: analysis of parent and primary physician perspectives. Pediatrics2011;127:e375–81. https://doi.org/10.1542/peds.2010-1723
13. NHS Digital. Hospital Episode Statistics. URL: www.hscic.gov.uk/hes (accessed 26 September 2020).
14. Koshy E, Murray J, Bottle A, Sharland M, Saxena S. Impact of the seven-valent pneumococcalconjugate vaccination (PCV7) programme on childhood hospital admissions for bacterialpneumonia and empyema in England: national time-trends study, 1997–2008. Thorax2010;65:770–4. https://doi.org/10.1136/thx.2010.137802
DOI: 10.3310/hta25600 Health Technology Assessment 2021 Vol. 25 No. 60
Copyright © 2021 Barratt et al. This work was produced by Barratt et al. under the terms of a commissioning contract issued by the Secretary of State for Health and SocialCare. This is an Open Access publication distributed under the terms of the Creative Commons Attribution CC BY 4.0 licence, which permits unrestricted use, distribution,reproduction and adaption in any medium and for any purpose provided that it is properly attributed. See: https://creativecommons.org/licenses/by/4.0/. For attribution thetitle, original author(s), the publication source – NIHR Journals Library, and the DOI of the publication must be cited.
59
15. Honkinen M, Lahti E, Osterback R, Ruuskanen O, Waris M. Viruses and bacteria in sputumsamples of children with community-acquired pneumonia. Clin Microbiol Infect 2012;18:300–7.https://doi.org/10.1111/j.1469-0691.2011.03603.x
16. McEllistrem MC, Adams JM, Patel K, Mendelsohn AB, Kaplan SL, Bradley JS, et al. Acute otitismedia due to penicillin-nonsusceptible Streptococcus pneumoniae before and after the introductionof the pneumococcal conjugate vaccine. Clin Infect Dis 2005;40:1738–44. https://doi.org/10.1086/429908
17. Casey JR, Pichichero ME. Changes in frequency and pathogens causing acute otitis media in1995-2003. Pediatr Infect Dis J 2004;23:824–8. https://doi.org/10.1097/01.inf.0000136871.51792.19
18. Public Health England, Department of Health and Social Care. Immunisation Against InfectiousDisease. URL: www.gov.uk/government/collections/immunisation-against-infectious-disease-the-green-book (accessed 25 September 2020).
19. Screening and Immunisations Team, Health and Social Care Information Centre. NHSImmunisation Statistics, England – 2012–13. URL: https://digital.nhs.uk/data-and-information/publications/statistical/nhs-immunisation-statistics/nhs-immunisation-statistics-england-2012-13(accessed 3 August 2021).
20. Foster D, Walker AS, Paul J, Griffiths D, Knox K, Peto TE, et al. Reduction in invasivepneumococcal disease following implementation of the conjugate vaccine in the Oxfordshireregion, England. J Med Microbiol 2011;60:91–7. https://doi.org/10.1099/jmm.0.023135-0
21. van Gageldonk-Lafeber AB, Bogaerts MA, Verheij RA, van der Sande MA. Time trends inprimary-care morbidity, hospitalization and mortality due to pneumonia. Epidemiol Infect2009;137:1472–8. https://doi.org/10.1017/S0950268809002258
22. Harris M, Clark J, Coote N, Fletcher P, Harnden A, McKean M, et al. British Thoracic Societyguidelines for the management of community acquired pneumonia in children: update 2011.Thorax 2011;66:ii1–23. https://doi.org/10.1136/thoraxjnl-2011-200598
23. Courtoy I, Lande AE, Turner RB. Accuracy of radiographic differentiation of bacterial fromnonbacterial pneumonia. Clin Pediatr 1989;28:261–4. https://doi.org/10.1177/000992288902800604
24. Swingler GH. Radiologic differentiation between bacterial and viral lower respiratory infectionin children: a systematic literature review. Clin Pediatr 2000;39:627–33. https://doi.org/10.1177/000992280003901101
25. McCarthy PL, Spiesel SZ, Stashwick CA, Ablow RC, Masters SJ, Dolan TF. Radiographicfindings and etiologic diagnosis in ambulatory childhood pneumonias. Clin Pediatr 1981;20:686–91.https://doi.org/10.1177/000992288102001101
26. Neuman MI, Hall M, Hersh AL, Brogan TV, Parikh K, Newland JG, et al. Influence ofhospital guidelines on management of children hospitalized with pneumonia. Pediatrics2012;130:e823–30. https://doi.org/10.1542/peds.2012-1285
27. Hayward G, Thompson M, Hay AD. What factors influence prognosis in children with acutecough and respiratory tract infection in primary care? BMJ 2012;345:e6212. https://doi.org/10.1136/bmj.e6212
28. Hay AD, Fahey T, Peters TJ, Wilson A. Predicting complications from acute cough in pre-schoolchildren in primary care: a prospective cohort study. Br J Gen Pract 2004;54:9–14.
29. Chorazy ML, Lebeck MG, McCarthy TA, Richter SS, Torner JC, Gray GC. Polymicrobial acuterespiratory infections in a hospital-based pediatric population. Pediatr Infect Dis J2013;32:460–6. https://doi.org/10.1097/INF.0b013e31828683ce
REFERENCES
NIHR Journals Library www.journalslibrary.nihr.ac.uk
60

30. Van den Bruel A, Haj-Hassan T, Thompson M, Buntinx F, Mant D, European Research Networkon Recognising Serious Infection investigators. Diagnostic value of clinical features atpresentation to identify serious infection in children in developed countries: a systematicreview. Lancet 2010;375:834–45. https://doi.org/10.1016/S0140-6736(09)62000-6
31. Craig JC, Williams GJ, Jones M, Codarini M, Macaskill P, Hayen A, et al. The accuracy of clinicalsymptoms and signs for the diagnosis of serious bacterial infection in young febrile children:prospective cohort study of 15 781 febrile illnesses. BMJ 2010;340:c1594. https://doi.org/10.1136/bmj.c1594
32. Van den Bruel A, Bartholomeeusen S, Aertgeerts B, Truyers C, Buntinx F. Serious infections inchildren: an incidence study in family practice. BMC Fam Pract 2006;7:23. https://doi.org/10.1186/1471-2296-7-23
33. Aujesky D, Fine MJ. The pneumonia severity index: a decade after the initial derivation andvalidation. Clin Infect Dis 2008;47:133–9. https://doi.org/10.1086/591394
34. Welte T. Risk factors and severity scores in hospitalized patients with community-acquiredpneumonia: prediction of severity and mortality. Eur J Clin Microbiol Infect Dis 2012;31:33–47.https://doi.org/10.1007/s10096-011-1272-4
35. Reed C, Madhi SA, Klugman KP, Kuwanda L, Ortiz JR, Finelli L, Fry AM. Development of theRespiratory Index of Severity in Children (RISC) score among young children with respiratoryinfections in South Africa. PLOS ONE 2012;7:e27793. https://doi.org/10.1371/journal.pone.0027793
36. Scott JA, Wonodi C, Moïsi JC, Deloria-Knoll M, DeLuca AN, Karron RA, et al. The definition ofpneumonia, the assessment of severity, and clinical standardization in the Pneumonia EtiologyResearch for Child Health study. Clin Infect Dis 2012;54:109–16. https://doi.org/10.1093/cid/cir1065
37. Tiewsoh K, Lodha R, Pandey RM, Broor S, Kalaivani M, Kabra SK. Factors determining theoutcome of children hospitalized with severe pneumonia. BMC Pediatr 2009;9:15. https://doi.org/10.1186/1471-2431-9-15
38. Lozano JM. Epidemiology of hypoxaemia in children with acute lower respiratory infection.Int J Tuberc Lung Dis 2001;5:496–504.
39. Fu LY, Ruthazer R, Wilson I, Patel A, Fox LM, Tuan TA, et al. Brief hospitalization and pulseoximetry for predicting amoxicillin treatment failure in children with severe pneumonia.Pediatrics 2006;118:e1822–30. https://doi.org/10.1542/peds.2005-2673
40. Webb C, Ngama M, Ngatia A, Shebbe M, Morpeth S, Mwarumba S, et al. Treatment failureamong Kenyan children with severe pneumonia – a cohort study. Pediatr Infect Dis J2012;31:e152–7. https://doi.org/10.1097/INF.0b013e3182638012
41. Currie CJ, Berni E, Jenkins-Jones S, Poole CD, Ouwens M, Driessen S, et al. Antibiotictreatment failure in four common infections in UK primary care 1991–2012: longitudinalanalysis. BMJ 2014;349:g5493. https://doi.org/10.1136/bmj.g5493
42. Cornford C, Morgan M, Ridsdale L. Why do mothers consult when their children cough?Fam Pract 1993;10:193–6. https://doi.org/10.1093/fampra/10.2.193
43. Kai J. What worries parents when their preschool children are acutely ill, and why: aqualitative study. BMJ 1996;313:983–6. https://doi.org/10.1136/bmj.313.7063.983
44. Kuzujanakis M, Kleinman K, Rifas-Shiman S, Finkelstein JA. Correlates of parental antibioticknowledge, demand, and reported use. Ambul Pediatr 2003;3:203–10. https://doi.org/10.1367/1539-4409(2003)003<0203:COPAKD>2.0.CO;2
DOI: 10.3310/hta25600 Health Technology Assessment 2021 Vol. 25 No. 60
Copyright © 2021 Barratt et al. This work was produced by Barratt et al. under the terms of a commissioning contract issued by the Secretary of State for Health and SocialCare. This is an Open Access publication distributed under the terms of the Creative Commons Attribution CC BY 4.0 licence, which permits unrestricted use, distribution,reproduction and adaption in any medium and for any purpose provided that it is properly attributed. See: https://creativecommons.org/licenses/by/4.0/. For attribution thetitle, original author(s), the publication source – NIHR Journals Library, and the DOI of the publication must be cited.
61

45. Hay AD,Wilson A, Fahey T, Peters TJ. The duration of acute cough in pre-school childrenpresenting to primary care: a prospective cohort study. Fam Pract 2003;20:696–705. https://doi.org/10.1093/fampra/cmg613
46. Atkinson M, Lakhanpaul M, Smyth A, Vyas H, Weston V, Sithole J, et al. Comparison of oralamoxicillin and intravenous benzyl penicillin for community acquired pneumonia in children(PIVOT trial): a multicentre pragmatic randomised controlled equivalence trial. Thorax2007;62:1102–6. https://doi.org/10.1136/thx.2006.074906
47. Thompson M, Vodicka TA, Blair PS, Buckley DI, Heneghan C, Hay AD, TARGET ProgrammeTeam. Duration of symptoms of respiratory tract infections in children: systematic review.BMJ 2013;347:f7027. https://doi.org/10.1136/bmj.f7027
48. Esposito S, Cohen R, Domingo JD, Pecurariu OF, Greenberg D, Heininger U, et al. Antibiotictherapy for pediatric community-acquired pneumonia: do we know when, what and for how longto treat? Pediatr Infect Dis J 2012;31:e78–85. https://doi.org/10.1097/INF.0b013e318255dc5b
49. Bradley JS, Byington CL, Shah SS, Alverson B, Carter ER, Harrison C, et al. The management ofcommunity-acquired pneumonia in infants and children older than 3 months of age: clinicalpractice guidelines by the Pediatric Infectious Diseases Society and the Infectious DiseasesSociety of America. Clin Infect Dis 2011;53:e25–76. https://doi.org/10.1093/cid/cir531
50. World Health Organization (WHO). Pocket Book of Hospital Care for Children. 2nd edn. Geneva:WHO; 2013.
51. National Institute for Health and Care Excellence. Pneumonia (Community-Acquired):Antimicrobial Prescribing. NICE Guideline [NG138]. 2019. URL: www.nice.org.uk/guidance/ng138/chapter/Recommendations#choice-of-antibiotic (accessed 25 September 2020).
52. Calbo E, Garau J. Application of pharmacokinetics and pharmacodynamics to antimicrobialtherapy of community-acquired respiratory tract infections. Respiration 2005;72:561–71.https://doi.org/10.1159/000089567
53. Appelbaum PC. Microbiological and pharmacodynamic considerations in the treatment ofinfection due to antimicrobial-resistant Streptococcus pneumoniae. Clin Infect Dis2000;31:29–34. https://doi.org/10.1086/314057
54. Vilas-Boas AL, Fontoura MS, Xavier-Souza G, Araújo-Neto CA, Andrade SC, Brim RV, et al.Comparison of oral amoxicillin given thrice or twice daily to children between 2 and 59months old with non-severe pneumonia: a randomized controlled trial. J Antimicrob Chemother2014;69:1954–9. https://doi.org/10.1093/jac/dku070
55. Paediatric Formulary Committee. BNF for Children 2012–2013. London: BMJ Group,Pharmaceutical Press and RCPCH Publications; 2012.
56. Bielicki JA, Barker CIS, Saxena S, Wong ICK, Long PF, Sharland M. Not too little, not toomuch: problems of selecting oral antibiotic dose for children. BMJ 2015;351:h5447.https://doi.org/10.1136/bmj.h5447
57. Lassi ZS, Das JK, Haider SW, Salam RA, Qazi SA, Bhutta ZA. Systematic review on antibiotictherapy for pneumonia in children between 2 and 59 months of age. Arch Dis Child2014;99:687–93. https://doi.org/10.1136/archdischild-2013-304023
58. Lassi ZS, Imdad A, Bhutta ZA. Short course versus long course intravenous therapy of thesame antibiotic for severe community-acquired pneumonia in children aged two monthsto 59 months. Cochrane Database Syst Rev 2017;10:CD008032. https://doi.org/10.1002/14651858.CD008032.pub3
REFERENCES
NIHR Journals Library www.journalslibrary.nihr.ac.uk
62

59. The British Society for Antimicrobial Chemotherapy. Resistance Surveillance Project – RespiratoryData. URL: www.bsacsurv.org/reports/respiratory/ (accessed 28 August 2020).
60. Kessel AS, Sharland M. The new UK antimicrobial resistance strategy and action plan.BMJ 2013;346:f1601. https://doi.org/10.1136/bmj.f1601
61. European Committee on Antimicrobial Susceptibility Testing. Breakpoint Tables forInterpretation of MICs and Zone Diameters. Version 5.0, 2015. Växjö: European Committee onAntimicrobial Susceptibility Testing; 2015.
62. Samore MH, Magill MK, Alder SC, Severina E, Morrison-De Boer L, Lyon JL, et al. High ratesof multiple antibiotic resistance in Streptococcus pneumoniae from healthy children living inisolated rural communities: association with cephalosporin use and intrafamilial transmission.Pediatrics 2001;108:856–65. https://doi.org/10.1542/peds.108.4.856
63. Regev-Yochay G, Raz M, Dagan R, Porat N, Shainberg B, Pinco E, et al. Nasopharyngealcarriage of Streptococcus pneumoniae by adults and children in community and family settings.Clin Infect Dis 2004;38:632–9. https://doi.org/10.1086/381547
64. Dunais B, Pradier C, Carsenti H, Sabah M, Mancini G, Fontas E, Dellamonica P. Influence of childcare on nasopharyngeal carriage of Streptococcus pneumoniae and Haemophilus influenzae. PediatrInfect Dis J 2003;22:589–92. https://doi.org/10.1097/01.inf.0000073203.88387.eb
65. Lietzau S, Raum E, von Baum H, Marre R, Brenner H. Household contacts were key factor forchildren’s colonization with resistant Escherichia coli in community setting. J Clin Epidemiol2007;60:1149–55. https://doi.org/10.1016/j.jclinepi.2007.01.016
66. Costelloe C, Metcalfe C, Lovering A, Mant D, Hay AD. Effect of antibiotic prescribing in primarycare on antimicrobial resistance in individual patients: systematic review and meta-analysis.BMJ 2010;340:c2096. https://doi.org/10.1136/bmj.c2096
67. Raum E, Lietzau S, von Baum H, Marre R, Brenner H. Changes in Escherichia coli resistancepatterns during and after antibiotic therapy: a longitudinal study among outpatients inGermany. Clin Microbiol Infect 2008;14:41–8. https://doi.org/10.1111/j.1469-0691.2007.01841.x
68. Chung A, Perera R, Brueggemann AB, Elamin AE, Harnden A, Mayon-White R, et al. Effect ofantibiotic prescribing on antibiotic resistance in individual children in primary care: prospectivecohort study. BMJ 2007;335:429. https://doi.org/10.1136/bmj.39274.647465.BE
69. Guillemot D, Carbon C, Balkau B, Geslin P, Lecoeur H, Vauzelle-Kervroëdan F, et al. Lowdosage and long treatment duration of beta-lactam: risk factors for carriage of penicillin-resistant Streptococcus pneumoniae. JAMA 1998;279:365–70. https://doi.org/10.1001/jama.279.5.365
70. Duffy MA, Hernandez-Santiago V, Orange G, Davey PG, Guthrie B. Trimethoprim prescriptionand subsequent resistance in childhood urinary infection: multilevel modelling analysis. Br JGen Pract 2013;63:e238–43. https://doi.org/10.3399/bjgp13X665198
71. Hillier S, Roberts Z, Dunstan F, Butler C, Howard A, Palmer S. Prior antibiotics and risk ofantibiotic-resistant community-acquired urinary tract infection: a case-control study.J Antimicrob Chemother 2007;60:92–9. https://doi.org/10.1093/jac/dkm141
72. Schrag SJ, Peña C, Fernández J, Sánchez J, Gómez V, Pérez E, et al. Effect of short-course,high-dose amoxicillin therapy on resistant pneumococcal carriage: a randomized trial. JAMA2001;286:49–56. https://doi.org/10.1001/jama.286.1.49
73. Samore MH, Tonnerre C, Hannah EL, Stoddard GJ, Borotkanics RJ, Haddadin B, Harbarth S.Impact of outpatient antibiotic use on carriage of ampicillin-resistant Escherichia coli.Antimicrob Agents Chemother 2011;55:1135–41. https://doi.org/10.1128/AAC.01708-09
DOI: 10.3310/hta25600 Health Technology Assessment 2021 Vol. 25 No. 60
Copyright © 2021 Barratt et al. This work was produced by Barratt et al. under the terms of a commissioning contract issued by the Secretary of State for Health and SocialCare. This is an Open Access publication distributed under the terms of the Creative Commons Attribution CC BY 4.0 licence, which permits unrestricted use, distribution,reproduction and adaption in any medium and for any purpose provided that it is properly attributed. See: https://creativecommons.org/licenses/by/4.0/. For attribution thetitle, original author(s), the publication source – NIHR Journals Library, and the DOI of the publication must be cited.
63
74. Tam VH, Louie A, Fritsche TR, Deziel M, Liu W, Brown DL, et al. Impact of drug-exposureintensity and duration of therapy on the emergence of Staphylococcus aureus resistance to aquinolone antimicrobial. J Infect Dis 2007;195:1818–27. https://doi.org/10.1086/518003
75. Drusano GL, Liu W, Brown DL, Rice LB, Louie A. Impact of short-course quinolone therapy onsusceptible and resistant populations of Staphylococcus aureus. J Infect Dis 2009;199:219–26.https://doi.org/10.1086/595739
76. Martinez MN, Papich MG, Drusano GL. Dosing regimen matters: the importance of earlyintervention and rapid attainment of the pharmacokinetic/pharmacodynamic target. AntimicrobAgents Chemother 2012;56:2795–805. https://doi.org/10.1128/AAC.05360-11
77. Jumbe N, Louie A, Leary R, Liu W, Deziel MR, Tam VH, et al. Application of a mathematicalmodel to prevent in vivo amplification of antibiotic-resistant bacterial populations duringtherapy. J Clin Invest 2003;112:275–85. https://doi.org/10.1172/JCI16814
78. Opatowski L, Mandel J, Varon E, Boelle P-Y, Temime L, Guillemot D. Antibiotic dose impact onresistance selection in the community: a mathematical model of beta-lactams and Streptococcuspneumoniae dynamics. Antimicrob Agents Chemother 2010;54:2330–7. https://doi.org/10.1128/AAC.00331-09
79. Schechner V, Temkin E, Harbarth S, Carmeli Y, Schwaber MJ. Epidemiological interpretation ofstudies examining the effect of antibiotic usage on resistance. Clin Microbiol Rev 2013;26:289–307.https://doi.org/10.1128/CMR.00001-13
80. Lyttle MD, O’Sullivan R, Hartshorn S, Bevan C, Cleugh F, Maconochie I, PERUKI. PediatricEmergency Research in the UK and Ireland (PERUKI): developing a collaborative for multicentreresearch. Arch Dis Child 2014;99:602–3. https://doi.org/10.1136/archdischild-2013-304998
81. Division of AIDS, National Institute of Allergy and Infectious Diseases, National Institutes ofHealth, U.S. Department of Health and Human Services. Division of AIDS (DAIDS) Table forGrading the Severity of Adult and Pediatric Adverse Events. URL: https://rsc.niaid.nih.gov/sites/default/files/daids-ae-grading-table-v2-nov2014.pdf (accessed 28 September 2020).
82. European Committee on Antimicrobial Susceptibility Testing. Breakpoint Tables forInterpretation of MICs and Zone Diameters Version 10.0, 2020. Växjö: European Committee onAntimicrobial Susceptibility Testing; 2020.
83. Committee for Medicinal Products for Human Use. Guideline on the Evaluation of MedicinalProducts Indicated for Treatment of Bacterial Infections, Rev. 3. URL: www.ema.europa.eu/en/documents/scientific-guideline/draft-guideline-evaluation-medicinal-products-indicated-treatment-bacterial-infections-revision-3_en.pdf (accessed 3 August 2021).
84. Bradley JS, McCracken GH. Unique considerations in the evaluation of antibacterials in clinicaltrials for pediatric community-acquired pneumonia. Clin Infect Dis 2008;47:241–8. https://doi.org/10.1086/591410
85. Legg J, Rampton C. BTS 2016/17 Paediatric Pneumonia Audit Report – 15 January 2018.London: British Thoracic Society; 2018.
86. Tyrstrup M, Melander E, Hedin K, Beckman A, Mölstad S. Children with respiratory tractinfections in Swedish primary care; prevalence of antibiotic resistance in common respiratorytract pathogens and relation to antibiotic consumption. BMC Infect Dis 2017;17:603. https://doi.org/10.1186/s12879-017-2703-3
87. Brogan TV, Hall M, Williams DJ, Neuman MI, Grijalva CG, Farris RW, Shah SS. Variability inprocesses of care and outcomes among children hospitalized with community-acquired pneumonia.Pediatr Infect Dis J 2012;31:1036–41. https://doi.org/10.1097/INF.0b013e31825f2b10
REFERENCES
NIHR Journals Library www.journalslibrary.nihr.ac.uk
64

88. Al-Mahtot M, Barwise-Munro R, Wilson P, Turner S. Changing characteristics of hospitaladmissions but not the children admitted – a whole population study between 2000 and 2013.Eur J Pediatr 2018;177:381–8. https://doi.org/10.1007/s00431-017-3064-z
89. European Centre for Disease Prevention and Control. Surveillance of Antimicrobial Resistancein Europe 2018. URL: www.ecdc.europa.eu/sites/default/files/documents/surveillance-antimicrobial-resistance-Europe-2018.pdf (accessed 28 September 2020).
90. Florin TA, French B, Zorc JJ, Alpern ER, Shah SS. Variation in emergency departmentdiagnostic testing and disposition outcomes in pneumonia. Pediatrics 2013;132:237–44.https://doi.org/10.1542/peds.2013-0179
91. Neuman MI, Hall M, Gay JC, Blaschke AJ, Williams DJ, Parikh K, et al. Readmissions amongchildren previously hospitalized with pneumonia. Pediatrics 2014;134:100–9. https://doi.org/10.1542/peds.2014-0331
92. Pakistan Multicentre Amoxycillin Short Course Therapy (MASCOT) Pneumonia Study Group.Clinical efficacy of 3 days versus 5 days of oral amoxicillin for treatment of childhoodpneumonia: a multicentre double-blind trial. Lancet 2002;360:835–41. https://doi.org/10.1016/S0140-6736(02)09994-4
93. Agarwal G, Awasthi S, Kabra SK, Kaul A, Singhi S, Walter SD, ISCAP Study Group. Three dayversus five day treatment with amoxicillin for non-severe pneumonia in young children:a multicentre randomised controlled trial. BMJ 2004;328:791. https://doi.org/10.1136/bmj.38049.490255.DE
94. Ginsburg AS, Mvalo T, Nkwopara E, McCollum ED, Phiri M, Schmicker R, et al. Amoxicillin for3 or 5 days for chest-indrawing pneumonia in Malawian children. N Engl J Med 2020;383:13–23.https://doi.org/10.1056/NEJMoa1912400
95. Ginsburg AS, Mvalo T, Nkwopara E, McCollum ED, Ndamala CB, Schmicker R, et al. Placebo vs.amoxicillin for nonsevere fast-breathing pneumonia in Malawian children aged 2 to 59 months: adouble-blind, randomized clinical noninferiority trial. JAMA Pediatr 2019;173:21–8. https://doi.org/10.1001/jamapediatrics.2018.3407
96. Hoberman A, Paradise J, Rockette HE, Kearney DH, Bhatnagar S, Shope TR, et al.Shortened antimicrobial treatment for acute otitis media in young children. N Engl J Med2016;375:2446–56. https://doi.org/10.1056/NEJMoa1606043
97. Kardas P. Patient compliance with antibiotic treatment for respiratory tract infections.J Antimicrob Chemother 2002;49:897–903. https://doi.org/10.1093/jac/dkf046
98. Llor C, Hernández S, Bayona C, Moragas A, Sierra N, Hernández M, Miravitlles M. A studyof adherence to antibiotic treatment in ambulatory respiratory infections. Int J Infect Dis2013;17:e168–72. https://doi.org/10.1016/j.ijid.2012.09.012
99. Little P, Francis NA, Stuart B, O’Reilly G, Thompson N, Becque T, et al. Antibiotics for lowerrespiratory tract infection in children presenting in primary care in England (ARTIC PC):a double-blind, randomised, placebo-controlled trial [published online ahead of printSeptember 22 2021]. Lancet 2021. https://doi.org/10.1016/S0140-6736(21)01431-8
100. Pernica JM, Harman S, Kam AJ, Carciumaru R, Vanniyasingam T, Crawford T, et al. Short-courseantimicrobial therapy for pediatric community-acquired pneumonia: the SAFER randomizedclinical trial. JAMA Pediatr 2021;175:475–82. https://doi.org/10.1001/jamapediatrics.2020.6735
101. de Velde F, deWinter BC, Koch BC, van Gelder T, Mouton JW, COMBACTE-NET consortium.Non-linear absorption pharmacokinetics of amoxicillin: consequences for dosing regimens andclinical breakpoints. J Antimicrob Chemother 2016;71:2909–17. https://doi.org/10.1093/jac/dkw226
DOI: 10.3310/hta25600 Health Technology Assessment 2021 Vol. 25 No. 60
Copyright © 2021 Barratt et al. This work was produced by Barratt et al. under the terms of a commissioning contract issued by the Secretary of State for Health and SocialCare. This is an Open Access publication distributed under the terms of the Creative Commons Attribution CC BY 4.0 licence, which permits unrestricted use, distribution,reproduction and adaption in any medium and for any purpose provided that it is properly attributed. See: https://creativecommons.org/licenses/by/4.0/. For attribution thetitle, original author(s), the publication source – NIHR Journals Library, and the DOI of the publication must be cited.
65

Appendix 1 Details of main protocolamendment: joint analysis of paediatricemergency department and ward groups
Initially, PED and ward groups were treated as separate strata because of (1) an expected higherseverity of CAP in the ward group, (2) the expected differences in prior receipt of antibiotic for
current episode having an impact on the duration of treatment analysis and (3) the need for differenttrial procedures (i.e. consent process, enrolment and additional data capture during the inpatientperiod for the ward group). However, based on the pilot phase, the following key aspects emerged andformed the basis for the joint analysis of PED and ward groups. First, in a substantial proportion ofparticipating hospitals, children were first seen in a paediatric assessment unit before either beingformally admitted or discharged. This made the distinction between PED and ward less relevant,especially as many paediatric assessment units admitted children for up to 48 hours. Second, althoughclinical signs and symptoms at presentation to ED were (as expected) worse, on average, in wardchildren than in PED children, considerable overlap in the two distributions was observed. Third, theduration of prior antibiotic exposure in the ward group was much shorter than anticipated (< 12 hours,54%; < 24 hours, 75%). Finally, there was no evidence of a difference between the primary end-pointrate between PED and ward groups.
DOI: 10.3310/hta25600 Health Technology Assessment 2021 Vol. 25 No. 60
Copyright © 2021 Barratt et al. This work was produced by Barratt et al. under the terms of a commissioning contract issued by the Secretary of State for Health and SocialCare. This is an Open Access publication distributed under the terms of the Creative Commons Attribution CC BY 4.0 licence, which permits unrestricted use, distribution,reproduction and adaption in any medium and for any purpose provided that it is properly attributed. See: https://creativecommons.org/licenses/by/4.0/. For attribution thetitle, original author(s), the publication source – NIHR Journals Library, and the DOI of the publication must be cited.
67


Appendix 2 Community-acquiredpneumonia symptoms at trial entry by strata
TABLE 27 Community-acquired pneumonia symptoms at trial entry by stratum
Stratum
Strata, n (%)
p-value Total (N= 814), n (%)PED (N= 591) Ward (N= 223)
Fever
Not present 54 (9.2) 111 (49.8) < 0.001 165 (20.3)
Slight/little 71 (12.0) 31 (13.9) 102 (12.5)
Moderate 175 (29.7) 42 (18.8) 217 (26.7)
Bad 215 (36.4) 26 (11.7) 241 (29.6)
Severe/very bad 75 (12.7) 13 (5.8) 88 (10.8)
Cough
Not present 14 (2.4) 14 (6.3) < 0.001 28 (3.4)
Slight/little 61 (10.3) 45 (20.2) 106 (13.0)
Moderate 246 (41.7) 96 (43.0) 342 (42.1)
Bad 208 (35.3) 59 (26.5) 267 (32.8)
Severe/very bad 61 (10.3) 9 (4.0) 70 (8.6)
Wet cough (phlegm)
Not present 174 (29.5) 72 (32.3) 0.58 246 (30.3)
Slight/little 125 (21.2) 44 (19.7) 169 (20.8)
Moderate 159 (26.9) 65 (29.1) 224 (27.6)
Bad 103 (17.5) 36 (16.1) 139 (17.1)
Severe/very bad 29 (4.9) 6 (2.7) 35 (4.3)
Breathing faster (shortness of breath)
Not present 77 (13.1) 57 (25.6) < 0.001 134 (16.5)
Slight/little 151 (25.6) 70 (31.4) 221 (27.2)
Moderate 182 (30.8) 52 (23.3) 234 (28.8)
Bad 140 (23.7) 36 (16.1) 176 (21.6)
Severe/very bad 40 (6.8) 8 (3.6) 48 (5.9)
Wheeze
Not present 283 (48.0) 109 (48.9) 0.95 392 (48.2)
Slight/little 129 (21.9) 52 (23.3) 181 (22.3)
Moderate 112 (19.0) 37 (16.6) 149 (18.3)
Bad 56 (9.5) 21 (9.4) 77 (9.5)
Severe/very bad 10 (1.7) 4 (1.8) 14 (1.7)
continued
DOI: 10.3310/hta25600 Health Technology Assessment 2021 Vol. 25 No. 60
Copyright © 2021 Barratt et al. This work was produced by Barratt et al. under the terms of a commissioning contract issued by the Secretary of State for Health and SocialCare. This is an Open Access publication distributed under the terms of the Creative Commons Attribution CC BY 4.0 licence, which permits unrestricted use, distribution,reproduction and adaption in any medium and for any purpose provided that it is properly attributed. See: https://creativecommons.org/licenses/by/4.0/. For attribution thetitle, original author(s), the publication source – NIHR Journals Library, and the DOI of the publication must be cited.
69
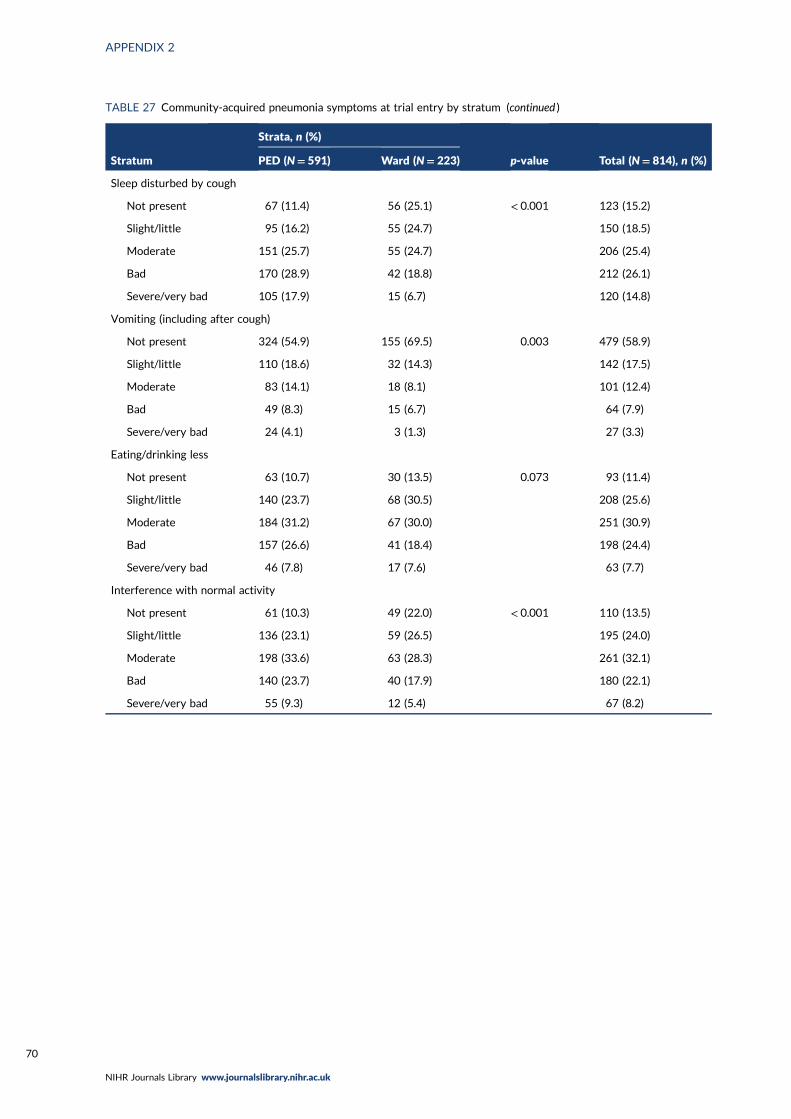
TABLE 27 Community-acquired pneumonia symptoms at trial entry by stratum (continued )
Stratum
Strata, n (%)
p-value Total (N= 814), n (%)PED (N= 591) Ward (N= 223)
Sleep disturbed by cough
Not present 67 (11.4) 56 (25.1) < 0.001 123 (15.2)
Slight/little 95 (16.2) 55 (24.7) 150 (18.5)
Moderate 151 (25.7) 55 (24.7) 206 (25.4)
Bad 170 (28.9) 42 (18.8) 212 (26.1)
Severe/very bad 105 (17.9) 15 (6.7) 120 (14.8)
Vomiting (including after cough)
Not present 324 (54.9) 155 (69.5) 0.003 479 (58.9)
Slight/little 110 (18.6) 32 (14.3) 142 (17.5)
Moderate 83 (14.1) 18 (8.1) 101 (12.4)
Bad 49 (8.3) 15 (6.7) 64 (7.9)
Severe/very bad 24 (4.1) 3 (1.3) 27 (3.3)
Eating/drinking less
Not present 63 (10.7) 30 (13.5) 0.073 93 (11.4)
Slight/little 140 (23.7) 68 (30.5) 208 (25.6)
Moderate 184 (31.2) 67 (30.0) 251 (30.9)
Bad 157 (26.6) 41 (18.4) 198 (24.4)
Severe/very bad 46 (7.8) 17 (7.6) 63 (7.7)
Interference with normal activity
Not present 61 (10.3) 49 (22.0) < 0.001 110 (13.5)
Slight/little 136 (23.1) 59 (26.5) 195 (24.0)
Moderate 198 (33.6) 63 (28.3) 261 (32.1)
Bad 140 (23.7) 40 (17.9) 180 (22.1)
Severe/very bad 55 (9.3) 12 (5.4) 67 (8.2)
APPENDIX 2
NIHR Journals Library www.journalslibrary.nihr.ac.uk
70

Appendix 3 On-treatment analysis of theprimary end point
The on-treatment analyses of the primary end point excluded participants who took < 80% oftrial medication as scheduled (e.g. when patients missed two doses of medication, when a smaller
volume of medication was taken). When patients switched from medication to non-trial antibioticsbecause of deterioration this was not regarded as non-adherence. For each randomised comparison,non-adherence was analysed in two ways: (1) based on all trial medication including placebo and(2) based on active drug only (Figures 21–24).
0
0 4 8 12 16
Day of trial
20 24 28
343350
Number at riskLower dose
Higher dose341347
336343
332340
320328
312321
304310
277276
20
40
60
Per
cen
tage
of c
hild
ren
wit
h a
pri
mar
y en
d p
oin
t
80
100
Lower dose: 32(9.5%, 90% CI 7.2% to 12.5%)
Higher dose: 35(10.2%, 90% CI 7.8% to 13.3%)
Difference:–0.7% (90% CI –4.5% to 3.1%)
n (%) with a primary end point by day 28
FIGURE 21 Dose randomisation: participants who took at least 80% of all trial medication, including placebo.
0
0 4 8 12 16
Day of trial
20 24 28
376376
Number at riskLower dose
Higher dose373371
366365
361362
349350
340343
332331
301294
20
40
60
Per
cen
tage
of c
hild
ren
wit
h a
pri
mar
y en
d p
oin
t
80
100
Lower dose: 38(10.3%, 90% CI 8.0% to 13.2%)
Higher dose: 40(10.9%, 90% CI 8.5% to 13.9%)
Difference:–0.6% (90% CI –4.4% to 3.1%)
n (%) with a primary end point by day 28
FIGURE 22 Dose randomisation: participants who took at least 80% of active trial drug.
DOI: 10.3310/hta25600 Health Technology Assessment 2021 Vol. 25 No. 60
Copyright © 2021 Barratt et al. This work was produced by Barratt et al. under the terms of a commissioning contract issued by the Secretary of State for Health and SocialCare. This is an Open Access publication distributed under the terms of the Creative Commons Attribution CC BY 4.0 licence, which permits unrestricted use, distribution,reproduction and adaption in any medium and for any purpose provided that it is properly attributed. See: https://creativecommons.org/licenses/by/4.0/. For attribution thetitle, original author(s), the publication source – NIHR Journals Library, and the DOI of the publication must be cited.
71
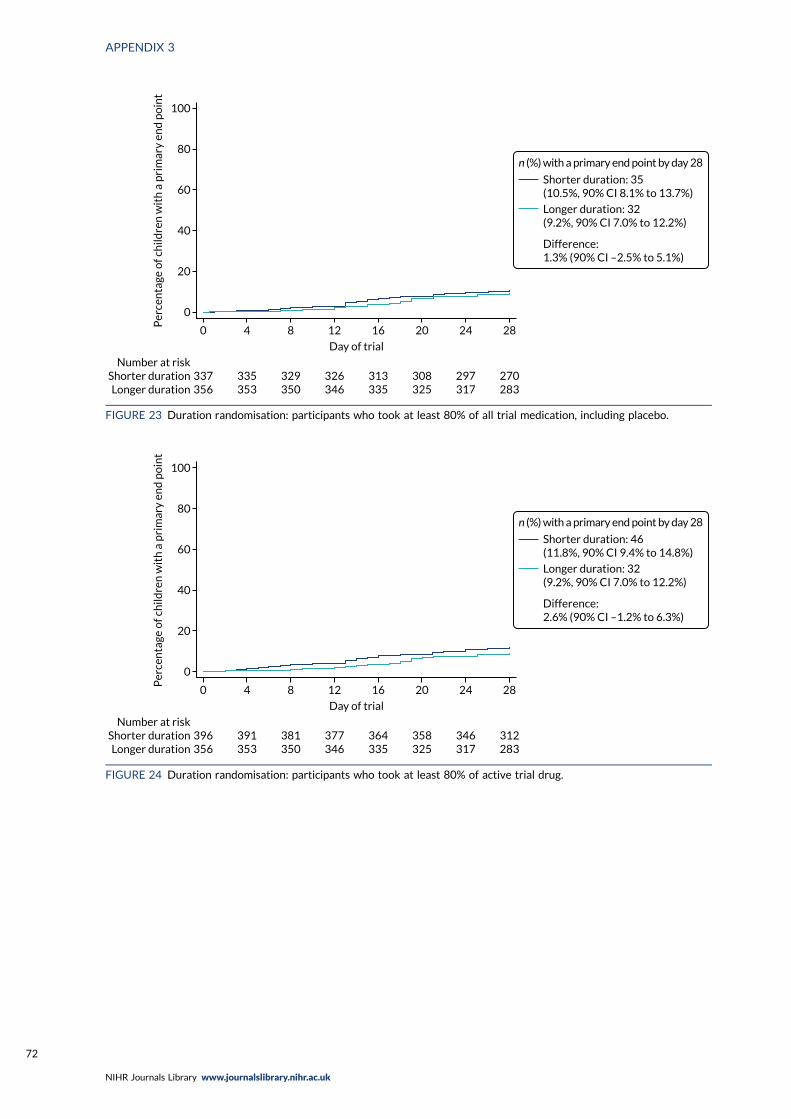
0
0 4 8 12 16
Day of trial
20 24 28
337356
Number at riskShorter durationLonger duration
335353
329350
326346
313335
308325
297317
270283
20
40
60
Per
cen
tage
of c
hild
ren
wit
h a
pri
mar
y en
d p
oin
t80
100
Shorter duration: 35(10.5%, 90% CI 8.1% to 13.7%)
Longer duration: 32(9.2%, 90% CI 7.0% to 12.2%)
Difference:1.3% (90% CI –2.5% to 5.1%)
n (%) with a primary end point by day 28
FIGURE 23 Duration randomisation: participants who took at least 80% of all trial medication, including placebo.
0
0 4 8 12 16
Day of trial
20 24 28
396356
Number at riskShorter durationLonger duration
391353
381350
377346
364335
358325
346317
312283
20
40
60
Per
cen
tage
of c
hild
ren
wit
h a
pri
mar
y en
d p
oin
t
80
100
Shorter duration: 46(11.8%, 90% CI 9.4% to 14.8%)
Longer duration: 32(9.2%, 90% CI 7.0% to 12.2%)
Difference:2.6% (90% CI –1.2% to 6.3%)
n (%) with a primary end point by day 28
FIGURE 24 Duration randomisation: participants who took at least 80% of active trial drug.
APPENDIX 3
NIHR Journals Library www.journalslibrary.nihr.ac.uk
72


EMEHS&DRHTAPGfARPHRPart of the NIHR Journals Librarywww.journalslibrary.nihr.ac.uk
This report presents independent research funded by the National Institute for Health Research (NIHR). The views expressed are those of the author(s) and not necessarily those of the NHS, the NIHR or the Department of Health and Social Care
Published by the NIHR Journals Library


