Ammonium and nitrate transport during saturated and ...Ammonium and nitrate transport during...
13
Ammonium and nitrate transport during saturated and unsaturated water flow through sandy soils Davie M. Kadyampakeni 1 *, Peter Nkedi-Kizza 2 , Jorge A. Leiva 2 , Augustine Muwamba 2 , Evelyn Fletcher 3 , and Kelly T. Morgan 4 1 University of Florida, Citrus Research and Education Center, 700 Experiment Station Road, Lake Alfred, FL 33850, USA 2 University of Florida, Soil and Water Science Department, 2181 McCarty Hall, P.O. Box 110290, Gainesville, FL 32611-0290, USA 3 University of Florida, Institute of Food and Agricultural Sciences, 111 Yelvington Rd, Suite 1, Palatka, FL 32131-2114, USA 4 University of Florida, Southwest Florida Research and Education Center, 2685 SR 29 N, Immokalee, FL 34142-9515, USA Abstract Citrus production in Florida accounts for » 60% of national production in USA. The sandy soil characteristic (> 95% sand) makes water and nutrient management extremely difficult, raising concerns about environmental sustainability as a result of nutrient inputs in citrus producing regions where sandy soils dominate. Thus, laboratory column and field experiments were con- ducted to better understand the leaching patterns of NH þ 4 and NO 3 ions in Florida’s sandy soils. The soil columns were first saturated from the bottom with two pore volumes of simulated Florida rain followed by pumping a pulse of fertilizer mixture at a steady Darcy flux of 14 cm h –1 . Nitrate and Cl – appeared earlier in the effluent than NH þ 4 in the A and B h horizons, due to cation exchange of NH þ 4 . Essentially identical breakthrough curves (BTCs) for NH þ 4 and NO 3 were observed in the E-horizon, due to very low sorption of NH þ 4 . The convective and dispersive equili- brium (CDE) model simulations were in good agreement with measured breakthrough curves (BTCs) for NH þ 4 , NO 3 , and Cl – . However, the sorption coefficient (K D ) values used in the CDE model to simulate the BTCs for NH þ 4 were about 10 times less than the batch isotherm K D val- ues. This was attributed to differences in pH, cation composition, and ionic strength between batch (static) and dynamic (leaching) systems. The field experiment showed that under unsatu- rated flow, improved short-pulse fertigation systems (drip and microsprinkler) limited NH þ 4 and NO 3 transport beyond the root zone (top 30 cm), which might have promoted nutrient and water uptake in citrus. The column study revealed that under extreme weather events such as hurri- canes or storm surge in Florida, saturated soil conditions can trigger N mobility below the root zone to surficial or groundwater aquifers. In the field experiment, the use of judicious, minimal and split applications and accurate placement of N-fertilizers reduced leaching of N especially during heavy storms in the summer rainy months of Florida. The field experiment demonstrated that it is possible to manage inorganic N forms for optimal residence time for uptake and minimal leaching concerns. Key words: ammonium sorption coefficient / batch slurry method / breakthrough curves / bromide-tracer / chloride-tracer / Spodosol Accepted November 09, 2017 1 Introduction Nutrient management in cropping systems of Florida has become critical as a major environmental issue that could undermine the long-term environmental quality and agricultur- al sustainability (Woodard et al., 2003; Alva et al., 2003; 2006a; 2006b). The situation of N leaching is exacerbated in Florida by approximately 60% of annual rains (» 1400 mm) in the summer months of June through September, making water and nutrient management extremely difficult (Paramasi- vam et al., 2001; 2002). Also, most of the citrus, vegetables, and pasture growing areas of the state are dominated by sandy soils (> 90% sand content) associated with low nutrient and chemical retention, low water holding capacity,y and high leaching potential (Obreza and Collins, 2008). Importantly, extreme weather scenarios such as hurricanes and storm surge tend to compound the leaching problem of agrochemi- cals into groundwater. Thus, it is important to have a good approximation of the likely pattern of chemical leaching in the root zone and beyond, because the leaching potential of any chemical will vary depending on soil composition and texture. In Florida, for instance, fertilizer and pesticide leaching beyond the root zone has been reported on well-drained Enti- sols (Lamb et al., 1999; Paramasivam et al., 2001; 2002) and poorly drained Spodosols (Mansell et al., 1977; McNeal et al., 1995), thereby contaminating surficial aquifers, wells ª 2017 WILEY-VCH Verlag GmbH & Co. KGaA, Weinheim www.plant-soil.com J. Plant Nutr. Soil Sci. 2017, 000, 1–13 DOI: 10.1002/jpln.201700405 1 * Correspondence: D. M. Kadyampakeni; e-mail: dkadyampakeni@ ufl.edu
Transcript of Ammonium and nitrate transport during saturated and ...Ammonium and nitrate transport during...

Ammonium and nitrate transport during saturated and unsaturated waterflow through sandy soilsDavie M. Kadyampakeni1*, Peter Nkedi-Kizza2, Jorge A. Leiva2, Augustine Muwamba2, Evelyn Fletcher3, andKelly T. Morgan4
1 University of Florida, Citrus Research and Education Center, 700 Experiment Station Road, Lake Alfred, FL 33850, USA2 University of Florida, Soil and Water Science Department, 2181 McCarty Hall, P.O. Box 110290, Gainesville, FL 32611-0290, USA3 University of Florida, Institute of Food and Agricultural Sciences, 111 Yelvington Rd, Suite 1, Palatka, FL 32131-2114, USA4 University of Florida, Southwest Florida Research and Education Center, 2685 SR 29 N, Immokalee, FL 34142-9515, USA
Abstract
Citrus production in Florida accounts for » 60% of national production in USA. The sandy soilcharacteristic (> 95% sand) makes water and nutrient management extremely difficult, raisingconcerns about environmental sustainability as a result of nutrient inputs in citrus producingregions where sandy soils dominate. Thus, laboratory column and field experiments were con-ducted to better understand the leaching patterns of NHþ4 and NO�3 ions in Florida’s sandy soils.The soil columns were first saturated from the bottom with two pore volumes of simulated Floridarain followed by pumping a pulse of fertilizer mixture at a steady Darcy flux of 14 cm h–1. Nitrateand Cl– appeared earlier in the effluent than NHþ4 in the A and Bh horizons, due to cationexchange of NHþ4 . Essentially identical breakthrough curves (BTCs) for NHþ4 and NO�3 wereobserved in the E-horizon, due to very low sorption of NHþ4 . The convective and dispersive equili-brium (CDE) model simulations were in good agreement with measured breakthrough curves(BTCs) for NHþ4 , NO�3 , and Cl–. However, the sorption coefficient (KD) values used in the CDEmodel to simulate the BTCs for NHþ4 were about 10 times less than the batch isotherm KD val-ues. This was attributed to differences in pH, cation composition, and ionic strength betweenbatch (static) and dynamic (leaching) systems. The field experiment showed that under unsatu-rated flow, improved short-pulse fertigation systems (drip and microsprinkler) limited NHþ4 andNO�3 transport beyond the root zone (top 30 cm), which might have promoted nutrient and wateruptake in citrus. The column study revealed that under extreme weather events such as hurri-canes or storm surge in Florida, saturated soil conditions can trigger N mobility below the rootzone to surficial or groundwater aquifers. In the field experiment, the use of judicious, minimaland split applications and accurate placement of N-fertilizers reduced leaching of N especiallyduring heavy storms in the summer rainy months of Florida. The field experiment demonstratedthat it is possible to manage inorganic N forms for optimal residence time for uptake and minimalleaching concerns.
Key words: ammonium sorption coefficient / batch slurry method / breakthrough curves / bromide-tracer /chloride-tracer / Spodosol
Accepted November 09, 2017
1 Introduction
Nutrient management in cropping systems of Florida hasbecome critical as a major environmental issue that couldundermine the long-term environmental quality and agricultur-al sustainability (Woodard et al., 2003; Alva et al., 2003;2006a; 2006b). The situation of N leaching is exacerbated inFlorida by approximately 60% of annual rains (» 1400 mm) inthe summer months of June through September, makingwater and nutrient management extremely difficult (Paramasi-vam et al., 2001; 2002). Also, most of the citrus, vegetables,and pasture growing areas of the state are dominated bysandy soils (> 90% sand content) associated with low nutrientand chemical retention, low water holding capacity,y and highleaching potential (Obreza and Collins, 2008). Importantly,
extreme weather scenarios such as hurricanes and stormsurge tend to compound the leaching problem of agrochemi-cals into groundwater. Thus, it is important to have a goodapproximation of the likely pattern of chemical leaching inthe root zone and beyond, because the leaching potential ofany chemical will vary depending on soil composition andtexture.
In Florida, for instance, fertilizer and pesticide leachingbeyond the root zone has been reported on well-drained Enti-sols (Lamb et al., 1999; Paramasivam et al., 2001; 2002) andpoorly drained Spodosols (Mansell et al., 1977; McNealet al., 1995), thereby contaminating surficial aquifers, wells
ª 2017 WILEY-VCH Verlag GmbH & Co. KGaA, Weinheim www.plant-soil.com
J. Plant Nutr. Soil Sci. 2017, 000, 1–13 DOI: 10.1002/jpln.201700405 1
* Correspondence: D. M. Kadyampakeni; e-mail: [email protected]

and groundwater sources. Carefully designed column studiestailored to mimic fertigation practices during extreme climaticevents such as hurricanes, storm surge or over-irrigationcould offer important insights into the fertilizer residence timeand leaching potential depending on the pulse duration. Suchan approach, focusing primarily on the soil’s horizons couldoffer a rational basis for more efficient management of agricul-tural chemicals and help with on-farm decisions.
Many studies have been done to improve the understandingof nutrient leaching in the soil profile on a field scale. How-ever, no study has been conducted on Florida’s Spodosols,with uniquely delineated horizons A, E, and Bh to understandthe leaching dynamics of N and its dominant inorganic forms,NHþ4 and NO�3 . Such studies in the field or laboratory, if any,were done on different soils in other parts of the United States(Wagenet et al., 1977; Paramasivam et al., 2001; 2002; Gehlet al., 2005; Feaga et al., 2010; Guertal and Howe, 2012) orother regions of the world (Misra and Mishra, 1977; Naka-mura et al., 2004).
The Spodosols are sandy with the spodic horizon having pre-dominantly quartz sand (> 90%) (Carlisle et al., 1989; Obrezaand Collins, 2008). The spodic materials are dominated byorganic carbon and small amounts of Al and Fe (Carlisleet al., 1989). The spodic horizon also has a larger amount ofcrystalline clay than overlying and subjacent horizons A andE (Carlisle et al., 1989), thereby impeding drainage (Obrezaand Collins, 2008). The study hypothesized that inorganic Ntransport would differ as a function of water saturation or nosaturation in the root zone due to variable fluxes under thetwo scenarios and would require differential N management.Thus, column leaching and field experiments were concep-tualized to (1) monitor NHþ4 and NO�3 leaching through the A,E, and Bh horizons using a fertilizer mixture pulse and Cl–
tracer; (2) develop break-through curves (BTCs) for Cl–, NHþ4 ,and NO�3 leaching through the A, E, and Bh horizons; (3) com-pare the measured BTCs for Cl–, NHþ4 , and NO�3 with thosesimulated using the convective-dispersive equilibrium (CDE)model; and (4) investigate Br–, NHþ4 , and NO�3 leachingpatterns under field conditions on two Florida soils usingHYDRUS software packages.
2 Material and methods
2.1 Experiment 1: Laboratory study duringsaturated water flow
2.1.1 Soil type and methods for determining soilproperties
The soil used for the experiment was taken from the Univer-sity of Florida, Southwest Florida Research and EducationCenter, Immokalee, Florida (latitude 26�25’ N, longitude81�25’ W) in the Flatwoods with poorly drained soils. The soilis classified as Immokalee fine sand (sandy, siliceous, hyper-themic Arenic Haplaquods) with the spodic horizon lying with-in 1 m of the soil surface (Obreza and Collins, 2008). Particledensity and bulk density were determined using methodsdescribed by Blake and Hartge (1986). Soil textural analysis
was done using the hydrometer method (Gee and Bauder,1986). A batch slurry method (Nkedi-Kizza et al., 1982) wasused to determine sorption isotherms for NHþ4 in soil fromeach horizon using the fertilizer mixture solution as the sup-porting electrolyte. The linear sorption isotherm data wereused to calculate the sorption coefficient (KD) values pre-sented in Tab. 1.
2.1.2 Column design and experimental procedures
The column used was 7.5 cm in diameter and 15 cm long(Tab. 1). The column was packed with each horizon separate-ly using air dry soil to simulate the field horizon (A, E, and Bh)bulk density, and then saturated upwards with 2 pore volumesof simulated Florida rain (Muwamba, 2012) before applyingthe fertilizer mixture pulse. The fertilizer mixture of ammoniumnitrate (NH4NO3), potassium hydrogen phosphate (K2HPO4),and potassium chloride (KCl) was applied to the soil columnat the recommended rates for sugarcane and citrus produc-tion (200 kg N ha–1, 22 kg P ha–1, and 166 kg K ha–1 appliedin six splits annually). The initial solution concentration of thefertilizer mixture was 1642 and 477 mg L–1 for NO�3 and NHþ4 ,respectively. Chloride as KCl was used as a tracer and wasmixed with the fertilizer solution at a concentration of50 mg L–1. Therefore, NO�3 , NHþ4 , and Cl– were simultane-ously applied to each soil column and allowed to leachthrough the each column as a pulse (Tab. 1). After the pulseapplication the columns were eluted with Florida rain until theend of the experiment. A steady Darcy flux during saturatedwater flow was maintained throughout the experiment using apump and 20-mL aliquots of effluent were collected from thetop outflow of the column in test tubes using a fraction collec-tor (Tab. 1). The BTCs for NO�3 , NHþ4 , and Cl– were measuredusing miscible displacement techniques as described byNkedi-Kizza et al. (1982).
2.1.3 Column effluent solution samples analysesand BTCs simulations
Ammonium-N in the effluent from the soil columns was deter-mined by EPA method 350.1 (USEPA, 1983), NO3-N by EPAmethod 353.2 (USEPA, 1993), and chloride by EPA method325.2 (USEPA, 1979). The concentrations in the effluent ofeach solute from a given column experiment were plotted asBTC. The BTCs were simulated with the one dimensionalconvective-dispersive equilibrium (CDE) model CFTIM devel-oped by van Genuchten (1980). The model was adapted inour laboratory as a PC version with modified input files.Essentially the model provides an analytical solution toEq. (1) written in dimensionless parameters and subjected toconcentration boundary conditions at the inlet and outlet for afinite soil column with application of a solute pulse T (porevolumes).
R¶C*¶p¼ 1
P
� �¶2C*¶X2 �
¶C*¶X
; (1)
where the retardation factor R = 1 + rKD/q; r (g cm–3) is thebulk density; KD (mL g–1) is the sorption coefficient, and q isthe saturated water content in the soil column. The relativeconcentration C* = C/Co, where C (mg mL–1) is the effluent
ª 2017 WILEY-VCH Verlag GmbH & Co. KGaA, Weinheim www.plant-soil.com
2 Kadyampakeni, Nkedi-Kizza, Leiva, Muwamba, Fletcher, Morgan J. Plant Nutr. Soil Sci. 2017, 000, 1–13
concentration and Co (mg mL–1), is the initial solution concen-tration of the pulse (T) applied to the soil column. The Pecletnumber is defined as P = vL/D; v (cm h–1) is the pore watervelocity, L (cm) is the column length, and D (cm2 h–1) is thehydrodynamic dispersion coefficient. The pore volume is cal-culated as p = vt/L, where t (h) is the water flow time since thebeginning of the pulse application. The model can be used todetermine solute transport parameters by simulating the efflu-
ent BTC data with the analytical solution of the model. In ourcase the parameters to optimize could have been R, P, p, andT. However, the parameters p and T were accurately meas-ured from the soil columns and thus were not optimized fromany of the solute’s BTC. The Peclet number (P) was opti-mized from the BTC data of NO�3 and Cl–, and was used tosimulate NHþ4 effluent BTC for each soil column. Therefore,only R was optimized from the BTC for NHþ4 . For the A hori-
ª 2017 WILEY-VCH Verlag GmbH & Co. KGaA, Weinheim www.plant-soil.com
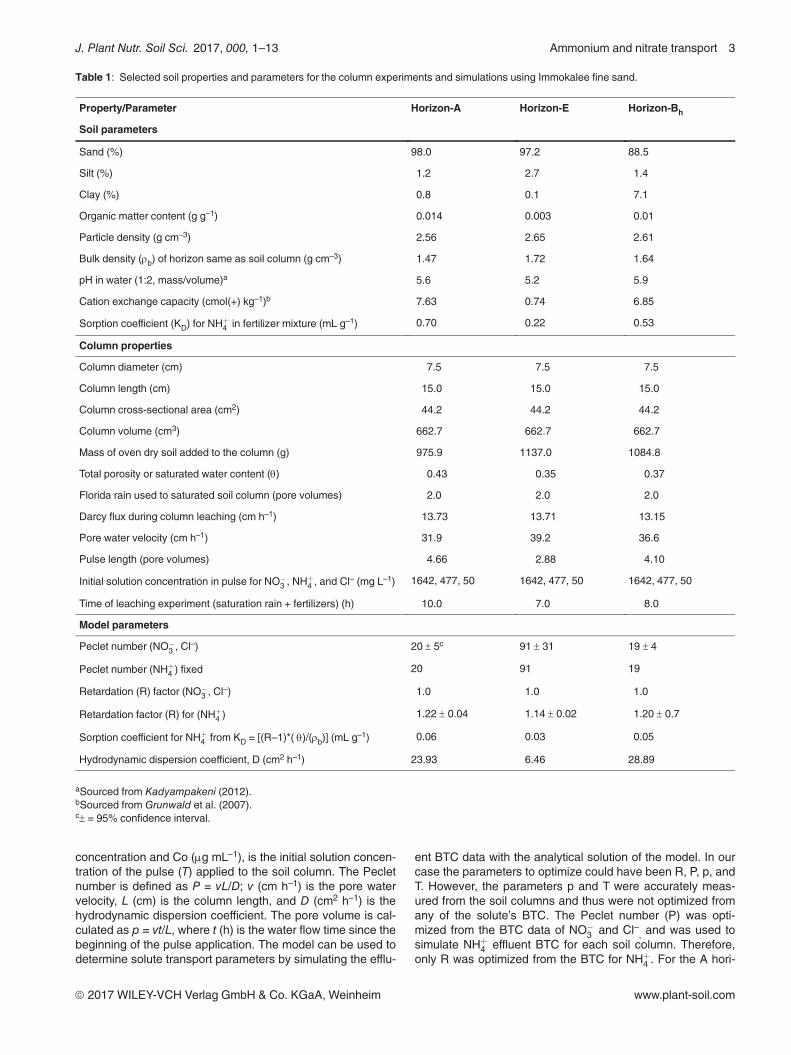
Table 1: Selected soil properties and parameters for the column experiments and simulations using Immokalee fine sand.
Property/Parameter Horizon-A Horizon-E Horizon-Bh
Soil parameters
Sand (%) 98.0 97.2 88.5
Silt (%) 1.2 2.7 1.4
Clay (%) 0.8 0.1 7.1
Organic matter content (g g–1) 0.014 0.003 0.01
Particle density (g cm–3) 2.56 2.65 2.61
Bulk density (rb) of horizon same as soil column (g cm–3) 1.47 1.72 1.64
pH in water (1:2, mass/volume)a 5.6 5.2 5.9
Cation exchange capacity (cmol(+) kg–1)b 7.63 0.74 6.85
Sorption coefficient (KD) for NHþ4 in fertilizer mixture (mL g–1) 0.70 0.22 0.53
Column properties
Column diameter (cm) 7.5 7.5 7.5
Column length (cm) 15.0 15.0 15.0
Column cross-sectional area (cm2) 44.2 44.2 44.2
Column volume (cm3) 662.7 662.7 662.7
Mass of oven dry soil added to the column (g) 975.9 1137.0 1084.8
Total porosity or saturated water content (q) 0.43 0.35 0.37
Florida rain used to saturated soil column (pore volumes) 2.0 2.0 2.0
Darcy flux during column leaching (cm h–1) 13.73 13.71 13.15
Pore water velocity (cm h–1) 31.9 39.2 36.6
Pulse length (pore volumes) 4.66 2.88 4.10
Initial solution concentration in pulse for NO�3 , NHþ4 , and Cl– (mg L–1) 1642, 477, 50 1642, 477, 50 1642, 477, 50
Time of leaching experiment (saturation rain + fertilizers) (h) 10.0 7.0 8.0
Model parameters
Peclet number (NO�3 , Cl–) 20 – 5c 91 – 31 19 – 4
Peclet number (NHþ4 ) fixed 20 91 19
Retardation (R) factor (NO�3 , Cl–) 1.0 1.0 1.0
Retardation factor (R) for (NHþ4 ) 1.22 – 0.04 1.14 – 0.02 1.20 – 0.7
Sorption coefficient for NHþ4 from KD = [(R–1)*( q)/(rb)] (mL g–1) 0.06 0.03 0.05
Hydrodynamic dispersion coefficient, D (cm2 h–1) 23.93 6.46 28.89
aSourced from Kadyampakeni (2012).bSourced from Grunwald et al. (2007).c– = 95% confidence interval.
J. Plant Nutr. Soil Sci. 2017, 000, 1–13 Ammonium and nitrate transport 3
zon soil column the p values were divided by the optimized Rvalues for NHþ4 to remove the effect of sorption and the BTCwas compared to the BTCs for NO�3 and Cl– since they haveR = 1 to determine if there was any form of NHþ4 sorption non-equilibrium.
To check on the validity of the simulated R value for NH4+using soil column of A horizon, the pore volumes for the BTCof NHþ4 were normalized by the retardation factor R = 1.22 inorder to remove the effect of sorption and the data were plot-ted together with the BTCs for NO�3 and Cl–. The BTCs dataexamined are before the pulse application of 4.66 porevolumes was stopped. This is essentially the same as con-ducting frontal analysis of BTCs. Such an approach was usedby Nkedi-Kizza et al. (1987) investigating sorption non-equili-brium for diuron, atrazine, and tritium in soils from whichorganic matter was removed.
2.2 Experiment 2: Field study during unsaturatedwater flow
2.2.1 Site description and experimental set-up
The detailed experimental design, weather conditions, sitedescription and irrigation systems are described in Kadyam-pakeni et al. (2014a; 2014b). Soil samples were taken at 0 to15, 15 to 30, 30 to 60, and 60 to 90 cm, 15 June 2010, atSouthwest Florida Research and Education Center(SWFREC) and 07 July 2010 at Citrus Research and Educa-tion Center (CREC) from the irrigated zones to analyze forNHþ4 -N and NO3-N and describe N movement. Further, soilsamples were taken in duplicates from 04 to 17 June 2011and 22 August to 06 September 2011 at SWFREC andCREC, respectively. The samples were taken every 2 to 3 dat 0 to 15, 15 to 30-, 30 to 45, and 45 to 60 cm at 15 cm fromthe tree in the irrigated zone and 45 cm from the tree in thenon-irrigated zone to measure and monitor NHþ4 -N andNO3-N movement. Fertilizer was applied using ratesdescribed above and Br tracer was applied at 90 kg ha–1.
2.2.2 Governing equations and parameters for waterflow, nutrient transport and uptake
The governing equations for water flow and nutrient transportin HYDRUS software package are given by the Richards(1931) and CDE model (Simunek et al., 1999; Simunek andHopmans, 2009):
¶q¶t¼ 
¶xiK KA
ij¶h¶xjþ KA
iz
� �� �� s hð Þ; (2)
where q is the volumetric water content (cm3 cm–3), h is thepressure head (cm), xi (i = 1, 2) are the spatial coordinates(cm) for two-dimensional flow, t is time (s), KA
ij are compo-nents of a dimensionless anisotropy tensor KA (whichreduces to the unit matrix when the medium is isotropic), K isthe unsaturated hydraulic conductivity function (cm s–1), ands is a sink/source term (cm3 cm–3 s–1), accounting for rootwater uptake (transpiration). The sink/source represents thevolume of water removed per unit time from a unit volume ofsoil due to compensated citrus water uptake.
The equation (CDE) governing transport of independent sol-utes, i.e., single-ion transport is given as:
¶rbc1
¶tþ ¶qc2
¶t¼ 
¶xiqDij
¶c12
¶xj
� �� ¶qic2
¶xi�F� ra c; hð Þ; (3)
where c1 and c2 are solute concentrations in the solid (g g–1)and liquid (g cm–3) phases, respectively, qi is the ith compo-nent of volumetric flux density (cm s–1), F is the rate ofchange of mass per unit volume by chemical or biological re-actions or other sources (negative) or sinks (positive) (g cm–3
s–1), respectively, providing connections between individualchain species, rb is the soil bulk density (g cm–3), Dij is thehydrodynamic dispersion coefficient tensor for the liquidphase (cm2 s–1). The term ra represents the root nutrientuptake (g cm–3 s–1) which is the sum of actual active and pas-sive nutrient uptake. The solid phase concentration, c1,accounts for nutrient either sorbed in the solid phase or pre-cipitated in various minerals. This is usually quantified by theadsorption isotherm relating c1 and c2 described by the linearequation of the form:
c1 ¼ KDc2; (4)
where KD (cm3 g–1) is the distribution coefficient of species 1.Nitrate or a tracer (e.g., bromide) are assumed to have aKD = 0 cm3 g–1, while ammonium has a KD in the range of 1.5to 4.0 (Lotse et al., 1992; Paramasivam et al., 2002; Hansonet al., 2006). The first order decay constant ranges from0.36–0.56 d–1 (Ling and El-Kadi, 1998). Rate coefficientfor the nitrification of ammonium nitrate ranges from0.02–0.72 d–1 (Misra et al., 1974; Jansson and Karlberg,2001; Lotse et al., 1992; Ling and El-Kadi, 1998). Bulk densityfor the soil is in the range 1.59–1.72 g cm–3 (Immokalee) and1.55–1.93 g cm–3 (Lake Alfred) (T. A. Obreza, unpublished).Estimated parameters are presented in Tab. 2.
2.2.3 Data analysis
Data were analyzed using PROC General Linear MixedModel procedures using SAS 9.4 Type III (SAS Institute,2015). Means were separated using Tukey’s HSD proce-dure and the measured results of water, NH4, and NO3transport were documented in Kadyampakeni et al.(2014b). The goodness of fit between predicted and meas-ured NH4, NO3 and Br– were evaluated using the rootmean square error (RMSE), and correlation coefficient (r2)as described by other researchers (Kandelous et al., 2011;Leiva et al., 2017).
3 Results and discussion
3.1 Column studies
3.1.1 A-horizon soil column
The BTCs data revealed that NO�3 and Cl– moved throughthe column similarly and, therefore, were plotted together(Fig. 1). In the study we used Cl– as a tracer but NO�3 couldalso be considered as a tracer for water movement. For theBTCs simulations, R was set equal to 1, implying no sorption
ª 2017 WILEY-VCH Verlag GmbH & Co. KGaA, Weinheim www.plant-soil.com
4 Kadyampakeni, Nkedi-Kizza, Leiva, Muwamba, Fletcher, Morgan J. Plant Nutr. Soil Sci. 2017, 000, 1–13

and T = 4.66 pore volumes, whichwas the pulse applied. The Pecletnumber (P) was the only parameteroptimized. The value of P = 20 ob-tained from BTCs of NO�3 and Cl–
was fixed as was the value ofT = 4.66 pore volumes obtainedfrom the column while simulatingthe BTC for NHþ4 . The only parame-ter optimized from the NHþ4 break-through curve was the retardationfactor (R = 1.22 – 0.04) as shown inTab. 1. The tracers (Cl– and NO�3 )and NHþ4 showed symmetricalBTCs for the measured and fittedvalues. This implies that there wasno physical non-equilibrium in thesoil column. The data also showthat NHþ4 sorption in the soil is notkinetic.
Due to cation exchange the ammo-nium ions took about 1.22 porevolumes for C/Co to be equal to 0.5in the effluent compared to the twotracers, nitrate and chloride, thatrequired 1 pore volume similar towhat was reported by Brenner(1962).
From the data in Tab. 1, thecalculated sorption coefficient(KD = 0.7 cm3 g–1) for NHþ4 fromthe sorption isotherm in theA-horizon is about 12 times largerthan the KD = 0.06 cm3 g–1 calcu-lated from the fitted R value of 1.22using the model. Such discrepan-cies between batch sorption iso-therm KD values and simulated KDvalues from BTCs for cations havebeen observed (Nkedi-Kizza et al.,1982). Note that the cation ex-change capacity (CEC) in the soilis mainly due to organic matter thathas a pH dependent charge. Theother problem is that in a static sys-tem (batch) the ionic composition,ionic strength, pH, and CEC remainrelatively constant, while for adynamic system (column leaching)all the above parameters arechanging with time and locationwithin the column. Therefore, thecations competing for exchangesites, pH, and ionic strength in thesoil column are different from thosein a batch system, causing thedetermined KD values from the twosystems to be different. Even for asimplified soil column experiment
ª 2017 WILEY-VCH Verlag GmbH & Co. KGaA, Weinheim www.plant-soil.com
Table 2: Irrigation system parameters for HYDRUS-2D for Immokalee and Candler fine sand.
Irrigation system parameter Drip Microsprinkler
Irrigation
Discharge rate (L h–1) 2 40
Irrigation time (d) 0.13 0.08
Irrigation interval (d) 1 1
Within- x cross-row tree spacing (cm)-Immokalee 305 x 671 306 x 671
Within- x cross-row tree spacing (cm)-Lake Alfred 305 x 610 306 x 610
Water use
Transpiration February/March (mm d–1) 1 1
Transpiration June/July (mm d–1) 3 3
Evaporation February/March (mm d–1) 2 2
Evaporation June/July (mm d–1) 2.5 2.5
Crop coefficient February/March (mm d–1)a 0.71 0.71
Crop coefficient June/July (mm d–1)a 0.83 0.83
Simulated domain
Source Point Line
Two-dimensional geometry Axisymmetrical Planar
Width (cm) NA 50
Radius (cm) 50 NA
Depth (cm) 60 60
Number of triangular finite elements 2462 3834
Number of nodes 1232 1918
Root water uptake Feddes pressure headsb
P0 (cm) –10 –10
Popt (cm) –25 –25
P2H (cm) –200 –200
P2L (cm) –1000 –1000
P3 (cm) –8000 –8000
r2H (cm d–1) 0.5 0.5
r2L (cm d–1) 0.1 0.1
Root zone parameters
Root distribution model Vrugt Vrugt
Maximum rooting depth (cm) 45 45
Depth with maximum root density (cm) 15 15
Maximum root lateral extension (cm) 45 45
Distance with maximum root density (cm) 30 30
Non-symmetry coefficients, pz and pr 1 1
aObtained from Morgan et al. (2006).bObtained from Feddes et al. (1978).
J. Plant Nutr. Soil Sci. 2017, 000, 1–13 Ammonium and nitrate transport 5

for the isotopic exchange of 45Ca and 40Ca, when the soilwas initially saturated with 40Ca, the KD value from the sorp-tion isotherm was not adequate to predict 45Ca movementthrough a soil column (Nkedi-Kizza et al., 1982). Thus, theKD value for NHþ4 in this experiment was optimized to simu-late the BTC data with the model.
The data from this study presented in Fig. 1C show that thenon-adsorbed solutes NO�3 and Cl– have their BTCs coincid-ing with the normalized BTC for NHþ4 . This further suggeststhat the major process influencing NHþ4 movement throughthe soil column different from NO�3 and Cl– is sorption. Thecomparison of BTCs was done during a short time of pulseapplication when NHþ4 might not have undergone any trans-formation. The BTCs data also support that the optimized Rvalue for NHþ4 using the model is appropriate under the exper-imental conditions.
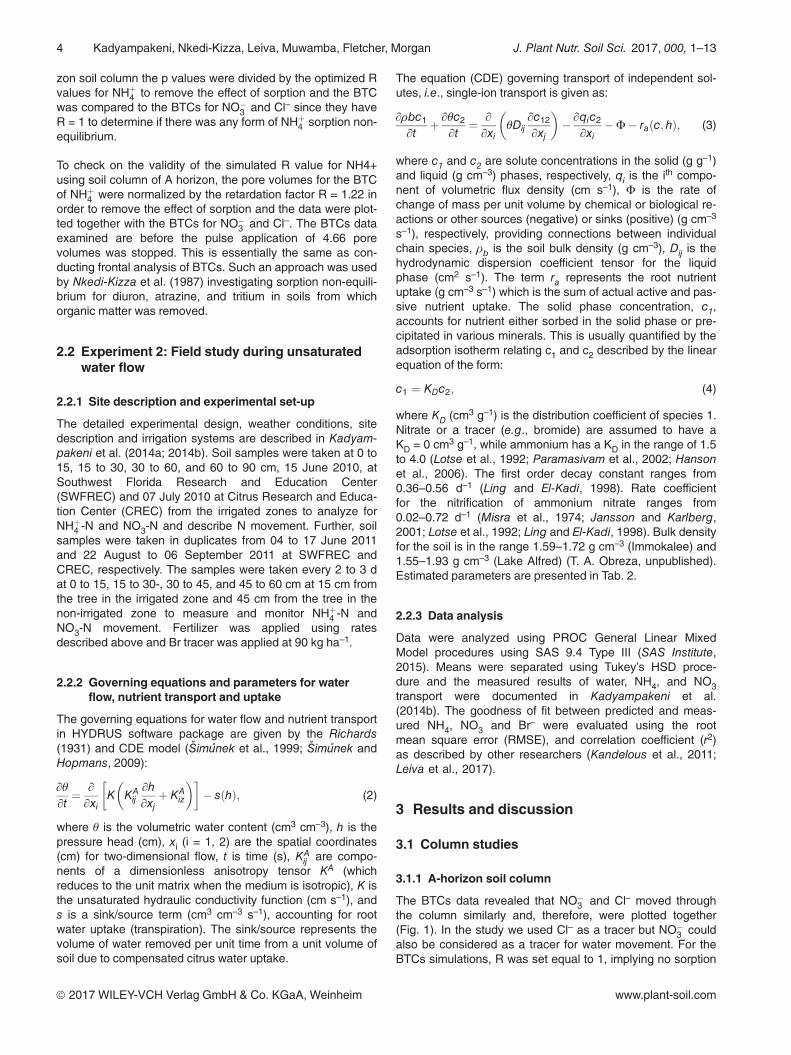
3.1.2 E-horizon soil column
Nitrate was used as a tracer for water movement in the dis-placement experiment using soil from the E-horizon. Theparameter optimized for the BTC of NO�3 was the Pecletnumber and fixing R = 1 and the T = 2.88 pore volumesobtained from the column. The P = 91 value obtained fromthe NO�3 data was then use to simulate NHþ4 data. There-fore, T = 2.88 and P = 91 were fixed. The parameter opti-mized was the retardation factor (R = 1.14) as shown inFig. 2. As was observed for the A horizon experiment, thecalculated KD value for NHþ4 using the simulated R value is0.03 compared to KD value from the sorption isotherm of0.22 (Tab. 1). The KD from the BTC is about 8 times lessthan the KD from the isotherm. The E-horizon is composedof uniform sand particles with almost no clay particles andvery low organic matter content and CEC (Tab. 1). Due tothe low sorption of NHþ4 in the E horizon the ammoniummoves almost like nitrate (Fig. 2).
The BTC for nitrate resembles piston displacement with asmall dispersion coefficient (Fig. 2). Due to the very sharpfront of the BTC it was difficult to measure nitrate in the efflu-ent. For example, between 0.9 and 1.4 pore volumes, theC/Co increased from 0.17 to 1. Since the aliquots collectedwere about 20 mL, only four samples were available for BTCfront and tail for nitrate analysis as shown in Fig. 2. The Pec-let number (P = 91) implies that water and solute movementwere dominated by convective transport in the E-horizon soilcolumn. Nitrate moved about 91 times faster by convectiveflow compared with dispersive flow, since the Peclet number(P = residence time due to dispersive flow/residence time dueto convective flow). It also appears from the measured andsimulated BTCs that no N transformation occurred in E-hori-zon soil column.
3.1.3 Bh–horizon soil column
As was observed for the A-horizon soil column, the BTCsdata for NO�3 and Cl– show that they moved similarly throughthe Bh-horizon column and therefore were plotted together(Fig. 3). The nitrate and chloride BTCs were simulated with
the model when R = 1 and T = 4.1 pore volumes were fixed,except for the P = 19 – 4 that was optimized. There wasexcellent agreement between the measured and the modelsimulation for the BTCs of Cl– and NO�3 . The BTC forammonium was simulated with the model by optimizing the
ª 2017 WILEY-VCH Verlag GmbH & Co. KGaA, Weinheim www.plant-soil.com
Pore volume (p)0 2 4 6 8
Rel
ativ
e co
ncen
trat
ion
(C/C
o)
0.0
0.2
0.4
0.6
0.8
1.0
1.2
Chloride Nitrate Model
R = 1T = 4.66P = 20 ± 5
Pore volume (p)
0 2 4 6 8
Rel
ativ
e co
ncen
trat
ion
(C/C
o)
0.0
0.2
0.4
0.6
0.8
1.0
1.2
Ammonium Model
P = 20R = 1.22 ± 0.04T = 4.66
Pore volume (p)
0 1 2 3 4
Rel
ativ
e co
ncen
trat
ion
(C/C
o)
0.0
0.2
0.4
0.6
0.8
1.0
1.2
Chloride Nitrate Ammonium
Figure 1: Measured and simulated breakthrough curves for chlorideand nitrate (top) and ammonium (middle) and normalized break-through curves for chloride, nitrate, and ammonium (bottom) fromA-horizon soil column.
6 Kadyampakeni, Nkedi-Kizza, Leiva, Muwamba, Fletcher, Morgan J. Plant Nutr. Soil Sci. 2017, 000, 1–13
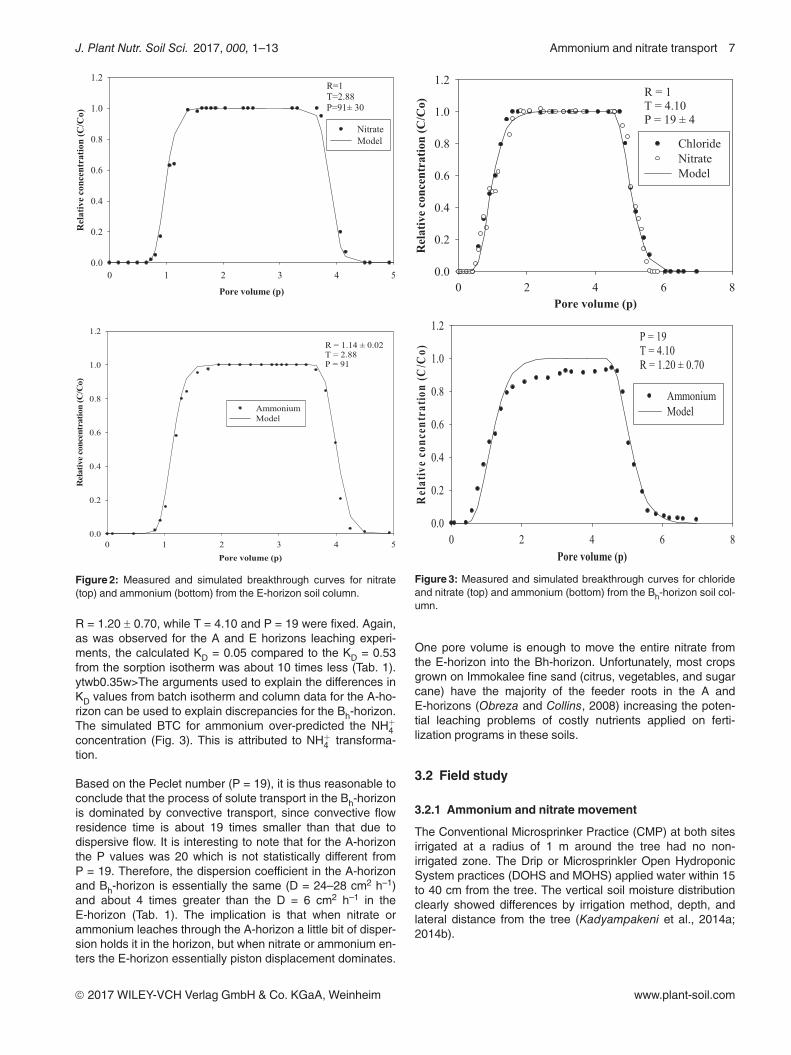
R = 1.20 – 0.70, while T = 4.10 and P = 19 were fixed. Again,as was observed for the A and E horizons leaching experi-ments, the calculated KD = 0.05 compared to the KD = 0.53from the sorption isotherm was about 10 times less (Tab. 1).ytwb0.35w>The arguments used to explain the differences inKD values from batch isotherm and column data for the A-ho-rizon can be used to explain discrepancies for the Bh-horizon.The simulated BTC for ammonium over-predicted the NHþ4concentration (Fig. 3). This is attributed to NHþ4 transforma-tion.
Based on the Peclet number (P = 19), it is thus reasonable toconclude that the process of solute transport in the Bh-horizonis dominated by convective transport, since convective flowresidence time is about 19 times smaller than that due todispersive flow. It is interesting to note that for the A-horizonthe P values was 20 which is not statistically different fromP = 19. Therefore, the dispersion coefficient in the A-horizonand Bh-horizon is essentially the same (D = 24–28 cm2 h–1)and about 4 times greater than the D = 6 cm2 h–1 in theE-horizon (Tab. 1). The implication is that when nitrate orammonium leaches through the A-horizon a little bit of disper-sion holds it in the horizon, but when nitrate or ammonium en-ters the E-horizon essentially piston displacement dominates.
One pore volume is enough to move the entire nitrate fromthe E-horizon into the Bh-horizon. Unfortunately, most cropsgrown on Immokalee fine sand (citrus, vegetables, and sugarcane) have the majority of the feeder roots in the A andE-horizons (Obreza and Collins, 2008) increasing the poten-tial leaching problems of costly nutrients applied on ferti-lization programs in these soils.
3.2 Field study
3.2.1 Ammonium and nitrate movement
The Conventional Microsprinker Practice (CMP) at both sitesirrigated at a radius of 1 m around the tree had no non-irrigated zone. The Drip or Microsprinkler Open HydroponicSystem practices (DOHS and MOHS) applied water within 15to 40 cm from the tree. The vertical soil moisture distributionclearly showed differences by irrigation method, depth, andlateral distance from the tree (Kadyampakeni et al., 2014a;2014b).
ª 2017 WILEY-VCH Verlag GmbH & Co. KGaA, Weinheim www.plant-soil.com
R=1T=2.88P=91± 30
Pore volume (p)
0 1 2 3 4 5
Rel
ativ
e co
ncen
trat
ion
(C/C
o)
0.0
0.2
0.4
0.6
0.8
1.0
1.2
Nitrate Model
Pore volume (p)0 1 2 3 4 5
Rel
ativ
e co
ncen
trat
ion
(C/C
o)
0.0
0.2
0.4
0.6
0.8
1.0
1.2
Ammonium Model
R = 1.14 ± 0.02T = 2.88P = 91
Figure 2: Measured and simulated breakthrough curves for nitrate(top) and ammonium (bottom) from the E-horizon soil column.
Pore volume (p)0 2 4 6 8
Rel
ativ
e co
ncen
trat
ion
(C/C
o)
0.0
0.2
0.4
0.6
0.8
1.0
1.2
Chloride Nitrate Model
R = 1T = 4.10P = 19 ± 4
Pore volume (p)0 2 4 6 8
Rel
ativ
e co
ncen
trat
ion
(C/C
o)
0.0
0.2
0.4
0.6
0.8
1.0
1.2
Ammonium Model
P = 19T = 4.10R = 1.20 ± 0.70
Figure 3: Measured and simulated breakthrough curves for chlorideand nitrate (top) and ammonium (bottom) from the Bh-horizon soil col-umn.
J. Plant Nutr. Soil Sci. 2017, 000, 1–13 Ammonium and nitrate transport 7
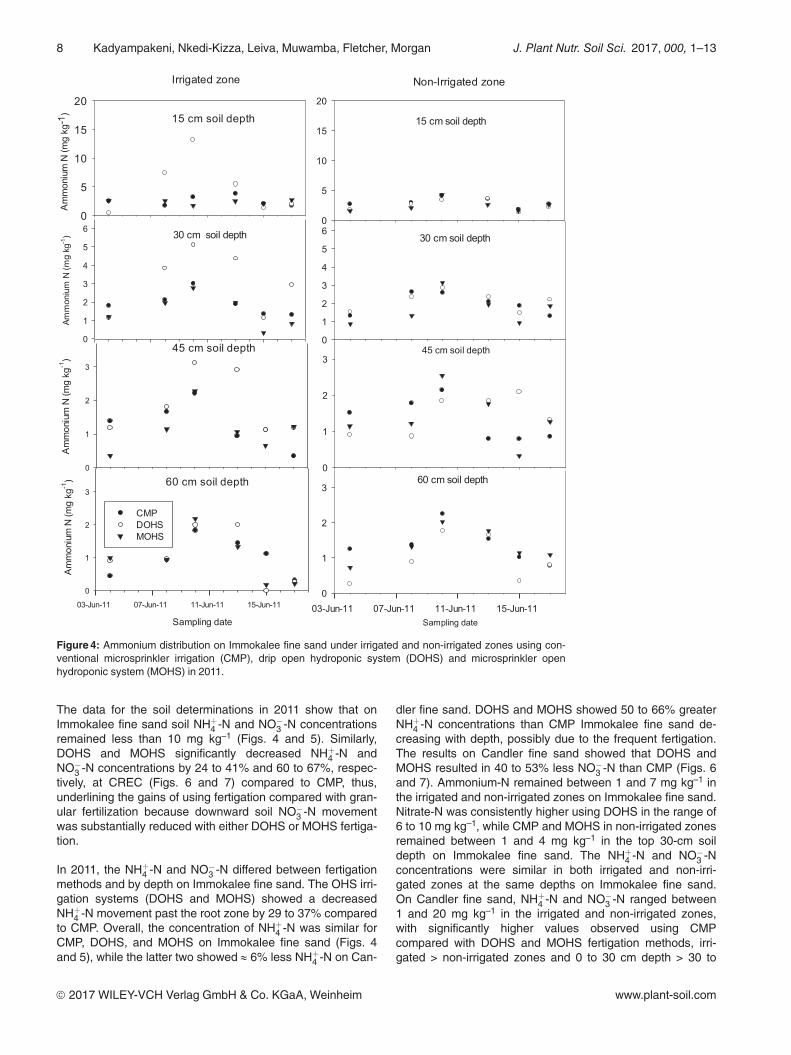
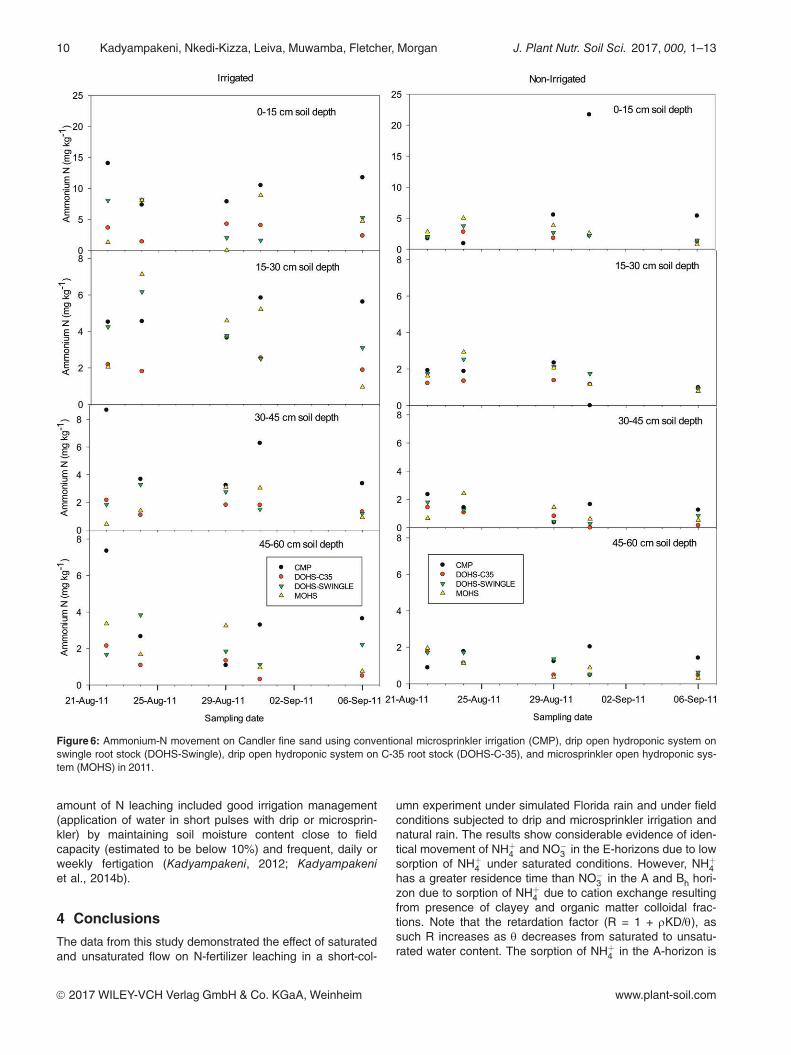
The data for the soil determinations in 2011 show that onImmokalee fine sand soil NHþ4 -N and NO�3 -N concentrationsremained less than 10 mg kg–1 (Figs. 4 and 5). Similarly,DOHS and MOHS significantly decreased NHþ4 -N andNO�3 -N concentrations by 24 to 41% and 60 to 67%, respec-tively, at CREC (Figs. 6 and 7) compared to CMP, thus,underlining the gains of using fertigation compared with gran-ular fertilization because downward soil NO�3 -N movementwas substantially reduced with either DOHS or MOHS fertiga-tion.
In 2011, the NHþ4 -N and NO�3 -N differed between fertigationmethods and by depth on Immokalee fine sand. The OHS irri-gation systems (DOHS and MOHS) showed a decreasedNHþ4 -N movement past the root zone by 29 to 37% comparedto CMP. Overall, the concentration of NHþ4 -N was similar forCMP, DOHS, and MOHS on Immokalee fine sand (Figs. 4and 5), while the latter two showed » 6% less NHþ4 -N on Can-
dler fine sand. DOHS and MOHS showed 50 to 66% greaterNHþ4 -N concentrations than CMP Immokalee fine sand de-creasing with depth, possibly due to the frequent fertigation.The results on Candler fine sand showed that DOHS andMOHS resulted in 40 to 53% less NO�3 -N than CMP (Figs. 6and 7). Ammonium-N remained between 1 and 7 mg kg–1 inthe irrigated and non-irrigated zones on Immokalee fine sand.Nitrate-N was consistently higher using DOHS in the range of6 to 10 mg kg–1, while CMP and MOHS in non-irrigated zonesremained between 1 and 4 mg kg–1 in the top 30-cm soildepth on Immokalee fine sand. The NHþ4 -N and NO�3 -Nconcentrations were similar in both irrigated and non-irri-gated zones at the same depths on Immokalee fine sand.On Candler fine sand, NHþ4 -N and NO�3 -N ranged between1 and 20 mg kg–1 in the irrigated and non-irrigated zones,with significantly higher values observed using CMPcompared with DOHS and MOHS fertigation methods, irri-gated > non-irrigated zones and 0 to 30 cm depth > 30 to
ª 2017 WILEY-VCH Verlag GmbH & Co. KGaA, Weinheim www.plant-soil.com
15 cm soil depth
Am
mon
ium
N (m
g kg
-1)
0
5
10
15
20
30 cm soil depth
Amm
oniu
m N
(mg
kg-1
)
0
1
2
3
4
5
6
45 cm soil depth
Am
mon
ium
N (m
g kg
-1)
0
1
2
3
60 cm soil depth
Sampling date
03-Jun-11 07-Jun-11 11-Jun-11 15-Jun-11
Am
mon
ium
N (m
g kg
-1)
0
1
2
3
30 cm soil depth
0
1
2
3
4
5
6
15 cm soil depth
0
5
10
15
20
60 cm soil depth
Sampling date03-Jun-11 07-Jun-11 11-Jun-11 15-Jun-11
0
1
2
3
45 cm soil depth
0
1
2
3
CMP DOHS MOHS
Irrigated zone Non-Irrigated zone
Figure 4: Ammonium distribution on Immokalee fine sand under irrigated and non-irrigated zones using con-ventional microsprinkler irrigation (CMP), drip open hydroponic system (DOHS) and microsprinkler openhydroponic system (MOHS) in 2011.
8 Kadyampakeni, Nkedi-Kizza, Leiva, Muwamba, Fletcher, Morgan J. Plant Nutr. Soil Sci. 2017, 000, 1–13
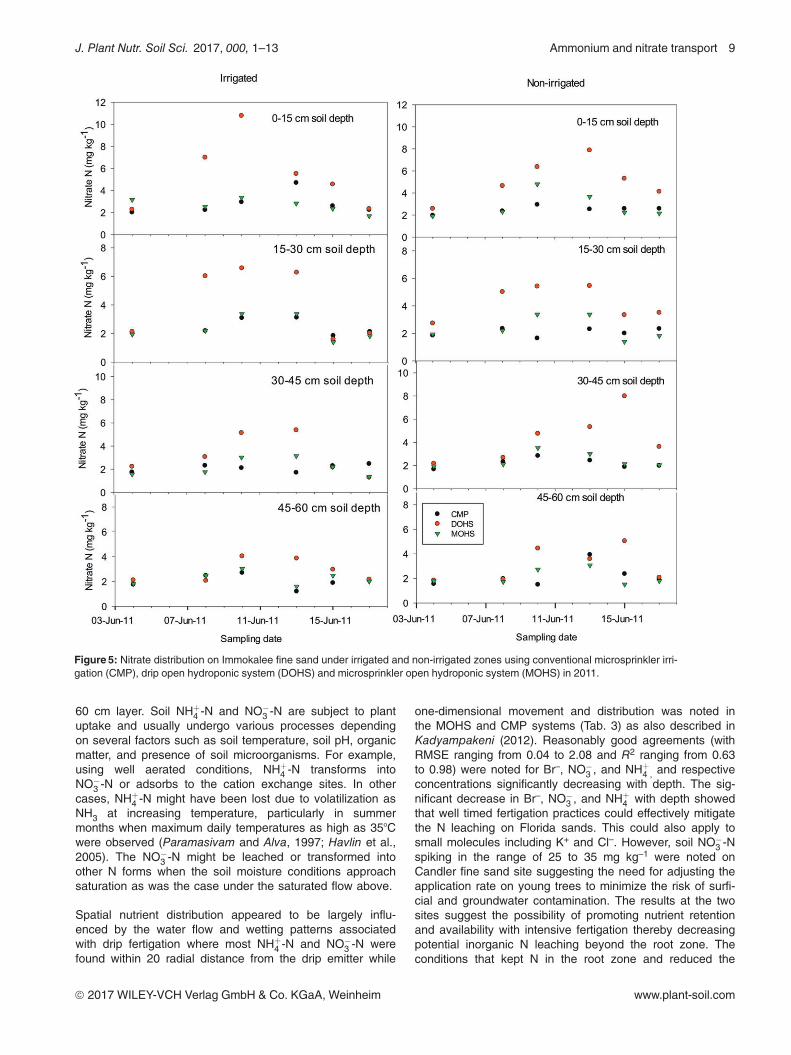
60 cm layer. Soil NHþ4 -N and NO�3 -N are subject to plantuptake and usually undergo various processes dependingon several factors such as soil temperature, soil pH, organicmatter, and presence of soil microorganisms. For example,using well aerated conditions, NHþ4 -N transforms intoNO�3 -N or adsorbs to the cation exchange sites. In othercases, NHþ4 -N might have been lost due to volatilization asNH3 at increasing temperature, particularly in summermonths when maximum daily temperatures as high as 35�Cwere observed (Paramasivam and Alva, 1997; Havlin et al.,2005). The NO�3 -N might be leached or transformed intoother N forms when the soil moisture conditions approachsaturation as was the case under the saturated flow above.
Spatial nutrient distribution appeared to be largely influ-enced by the water flow and wetting patterns associatedwith drip fertigation where most NHþ4 -N and NO�3 -N werefound within 20 radial distance from the drip emitter while
one-dimensional movement and distribution was noted inthe MOHS and CMP systems (Tab. 3) as also described inKadyampakeni (2012). Reasonably good agreements (withRMSE ranging from 0.04 to 2.08 and R2 ranging from 0.63to 0.98) were noted for Br–, NO�3 , and NHþ4 , and respectiveconcentrations significantly decreasing with depth. The sig-nificant decrease in Br–, NO�3 , and NHþ4 with depth showedthat well timed fertigation practices could effectively mitigatethe N leaching on Florida sands. This could also apply tosmall molecules including K+ and Cl–. However, soil NO�3 -Nspiking in the range of 25 to 35 mg kg–1 were noted onCandler fine sand site suggesting the need for adjusting theapplication rate on young trees to minimize the risk of surfi-cial and groundwater contamination. The results at the twosites suggest the possibility of promoting nutrient retentionand availability with intensive fertigation thereby decreasingpotential inorganic N leaching beyond the root zone. Theconditions that kept N in the root zone and reduced the
ª 2017 WILEY-VCH Verlag GmbH & Co. KGaA, Weinheim www.plant-soil.com
Figure 5: Nitrate distribution on Immokalee fine sand under irrigated and non-irrigated zones using conventional microsprinkler irri-gation (CMP), drip open hydroponic system (DOHS) and microsprinkler open hydroponic system (MOHS) in 2011.
J. Plant Nutr. Soil Sci. 2017, 000, 1–13 Ammonium and nitrate transport 9
amount of N leaching included good irrigation management(application of water in short pulses with drip or microsprin-kler) by maintaining soil moisture content close to fieldcapacity (estimated to be below 10%) and frequent, daily orweekly fertigation (Kadyampakeni, 2012; Kadyampakeniet al., 2014b).
4 Conclusions
The data from this study demonstrated the effect of saturatedand unsaturated flow on N-fertilizer leaching in a short-col-
umn experiment under simulated Florida rain and under fieldconditions subjected to drip and microsprinkler irrigation andnatural rain. The results show considerable evidence of iden-tical movement of NHþ4 and NO�3 in the E-horizons due to lowsorption of NHþ4 under saturated conditions. However, NHþ4has a greater residence time than NO�3 in the A and Bh hori-zon due to sorption of NHþ4 due to cation exchange resultingfrom presence of clayey and organic matter colloidal frac-tions. Note that the retardation factor (R = 1 + rKD/q), assuch R increases as q decreases from saturated to unsatu-rated water content. The sorption of NHþ4 in the A-horizon is
ª 2017 WILEY-VCH Verlag GmbH & Co. KGaA, Weinheim www.plant-soil.com
Figure 6: Ammonium-N movement on Candler fine sand using conventional microsprinkler irrigation (CMP), drip open hydroponic system onswingle root stock (DOHS-Swingle), drip open hydroponic system on C-35 root stock (DOHS-C-35), and microsprinkler open hydroponic sys-tem (MOHS) in 2011.
10 Kadyampakeni, Nkedi-Kizza, Leiva, Muwamba, Fletcher, Morgan J. Plant Nutr. Soil Sci. 2017, 000, 1–13

likely to cause ammonium ions to reside long enough in theA-horizon for transformation of NHþ4 into NO�3 , making bothN-forms available to plants. Under unsaturated flow, themovement of NO�3 was not as pronounced due to moisturecontent remaining close to field capacity, though it was some-what greater than that of NHþ4 . However, greater mobility ofNHþ4 and NO�3 was noted in irrigated than non-irrigatedzones. The field study demonstrated that it is possible to man-age inorganic N forms for optimal residence time for uptakeand minimal leaching concerns.
Acknowledgments
The authors would like to thank the University of Florida Insti-tute of Food and Agricultural Sciences for funding thisresearch work. The United States Department of AgricultureNational Institute of Food and Agriculture REEport ProjectNumber FLA005593 is also acknowledged for paying for pub-lication charges.
ª 2017 WILEY-VCH Verlag GmbH & Co. KGaA, Weinheim www.plant-soil.com
Figure 7: Nitrate-N movement on Candler fine sand using conventional microsprinkler irrigation (CMP), drip open hydroponic system on swin-gle root stock (DOHS-Swingle), drip open hydroponic system on C-35 root stock (DOHS-C-35), and microsprinkler open hydroponic system(MOHS) in 2011.
J. Plant Nutr. Soil Sci. 2017, 000, 1–13 Ammonium and nitrate transport 11

References
Alva, A. K., Paramasivam, S., Graham, W. D., Wheaton, T. A. (2003):Best nitrogen and irrigation management practices for citrusproduction in sandy soils. Water Air Soil Pollut. 143, 139–154.
Alva, A. K., Paramasivam, S., Fares, A., Delgado, J. A.,Mattos Jr., D., Sajwan, K. (2006a): Nitrogen and irrigationmanagement practices to improve nitrogen uptake efficiency andminimize leaching losses. J. Crop Improvement 15, 369–420.
Alva, A. K., Paramasivam, S., Fares, A., Obreza, T. A.,Schumann, A. W. (2006b): Nitrogen best management practice forcitrus trees II. Nitrogen fate, transport, and components of Nbudget. Sci. Hortic. 109, 223–233.
Blake, G. R., Hartge, K. H. (1986): Particle Density, in Klute, A. (ed.):Methods of Soil Analysis: Part 1—Physical and MineralogicalMethods. ASA, SSSA, Madison, FL, USA, pp. 363–375.
Brenner, H. (1962): The diffusion model of longitudinal mixing in bedsof finite length. Numerical values. Chem. Eng. Sci. 17, 229–243.
Carlisle, V. W., Sodek, F., Collins, M., Hammond, L. C., Harris, W. G.(1989): Characterization Data for Selected Florida Soils. Universityof Florida, Gainesville, FL, USA.
Feaga, J. B., Selker, J. S., Dick, R. P., Hemphill, D. D. (2010): Long-term nitrate leaching under vegetable production with cover cropsin the Pacific Northwest. Soil Sci. Soc. Am. J. 74, 186–195.
Feddes, R. A., Kowalik, P. J., Zarandny, H. (1978): Simulation ofField Water Use and Crop Yield. John Wiley & Sons, New York,NY, USA.
Gee, G. W., Bauder, J. W. (1986): Hydrometer Method, in Klute, A.(ed.): Methods of Soil Analysis: Part 1—Physical and MineralogicalMethods. ASA, SSSA, Madison, FL, USA, pp. 383–411.
Gehl, R. J., Schmidt, J. P., Stone, L. R., Schlegel, A. J., Clark, G. A.(2005): In situ measurements of nitrate leaching implicate poornitrogen and irrigation management on sandy soils. J. Environ.Qual. 34, 2243–2254.
Grunwald, S., Harris, W. G., Hurt, W., Bloom, S. A., Deich, W.,Hoover, B., Rivero, R., Ramasundaram, V., Gao, M., Murphy, B.,Bloom, K. (2007): Florida Soil Characterization Data RetrievalSystem. Universisty of Florida, Gainesville, FL, USA. Available at:http://soils.ifas.ufl.edu/flsoils/index.asp.
Guertal, E. A., Howe, J. A. (2012): Nitrate, ammonium, and urealeaching in hybrid bermudagrass as affected by nitrogen source.Agron. J. 104, 344–352.
Hanson, B. R., Simunek, J., Hopmans, J. W. (2006): Evaluation ofurea–ammonium–nitrate fertigation with drip irrigation usingnumerical modeling. Agric. Water Manage. 86, 102–113.
Jansson, P.-E., Karlberg, L. (2001): Coupled Heat and Mass TransferModel for Soil–Plant–Atmosphere Systems. Royal Institute ofTechnology, Stockholm, Sweden.
Havlin, J. L., Beaton, J. D., Tisdale, S. L., Nelson, W. L. (2005): SoilFertility and Fertilizers: An Introduction to Nutrient Management,7th Ed. Prentice Hall, Englewood Cliffs, NJ, USA.
Kadyampakeni, D. M. (2012): Citrus advanced production system:understanding water and NPK uptake and leaching in Florida Flat-woods and Ridge soils. PhD thesis, University of Florida, Gaines-ville, FL, USA.
Kadyampakeni, D. M., Morgan, K. T., Schumann, A. W., Nkedi-Kizza, P. (2014a): Effect of irrigation pattern and timing on rootdensity of young citrus trees infected with Huanglongbing disease.HortTechnol. 24, 209–221.
Kadyampakeni, D. M., Morgan, K. T., Schumann, A. W., Nkedi-Kizza, P., Mahmoud, K. (2014b): Ammonium and nitrate distri-bution in soil using drip and microsprinkler irrigation for citrusproduction. Soil Sci. Soc. Am. J. 78, 645–654.
Kandelous, M., Simunek, J., van Genuchten, M., Malek, K. (2011):Soil water content distributions between two emitters of asubsurface drip irrigation system. Soil Sci. Soc. Am. J. 75,488–497.
Lamb, S. T., Graham, W. D., Harrison, C. B., Alva, A. K. (1999):Impact of alternative citrus management practices on groundwaternitrate in the Central Florida Ridge. I. Field investigation. Trans.ASAE 42, 1653–1668.
Leiva, J. A., Nkedi-Kizza, P., Morgan, K. T., Kadyampakeni, D. M.(2017): Imidacloprid transport and sorption nonequilibrium in singleand multilayered columns of Immokalee fine sand. PLoS ONE 12,e0183767. DOI: 10.1371/journal.pone.0183767.
Ling, G., El-Kadi, A. I. (1998): A lumped parameter model for nitrogentransformation in the unsaturated zone. Water Resour. Res. 34,203–212.
ª 2017 WILEY-VCH Verlag GmbH & Co. KGaA, Weinheim www.plant-soil.com
Table 3: Statistical comparison between the observed and simulated Br, NH4, and NO3 on Candler and Immokalee sand.
Soil Comparisona Br NO3 NH4
RMSE (mg kg–1) R2b RMSEc (mg kg–1) R2 RMSE (mg kg–1) R2
Candler OBS vs MS –Fall at 15 cm 2.08 0.89 1.65 0.88 1.06 0.98
Candler OBS vs MS –Fall at 60 cm 1.25 0.76 1.52 0.84 NAd NA
Candler OBS vs DRIP- Fall at 15 cm 0.35 0.96 5.48 0.98 1.98 0.91
Candler OBS vs DRIP-Fall at 60 cm 0.86 0.75 1.90 0.66 NA NA
Immokalee OBS vs MS-summer at 15 cm 7.57 0.79 5.25 0.75 1.33 0.95
Immokalee OBS vs DRIP-summer at 15 cm 0.44 0.90 1.66 0.91 1.15 0.93
Immokalee OBS vs MS- summer at 60 cm 0.06 0.74 4.88 0.82 NA NA
Immokalee OBS vs DRIP- summer at 60 cm 0.04 0.63 1.95 0.85 NA NA
aOBS: Observed or measured in the field, MS: Microsprinkler irrigation, DRIP: Drip irrigation;bR2: Coefficient of determination;cRMSE: Root mean square error, mm;dNA: Not applicable.
12 Kadyampakeni, Nkedi-Kizza, Leiva, Muwamba, Fletcher, Morgan J. Plant Nutr. Soil Sci. 2017, 000, 1–13

Lotse, E. G., Jabro, J. D., Simmons, K. E., Baker, D. E. (1992): Simu-lation of nitrogen dynamics and leaching from arable soils. J.Contam. Hydrol. 10, 183–196.
Mansell, R. S., Calvert, D. V., Stewart, E. H., Wheeler, W. B.,Rogers, J. S., Graetz, D. A., Allen, L. H., Overman, A. R., Knipling,E. B. (1977): Fertilizer and pesticide movement from citrus grovesin Florida flatwood soils. Completion report for Project R-800517.USEPA, Athens, GA, USA.
McNeal, B. L., Stanley, C. D., Graham, W. D., Gilreath, P. R.,Downey, D., Creighton, J. F. (1995): Nutrient-loss trends for vege-table and citrus fields in west-central Florida: I. Nitrate. J. Environ.Qual. 24, 95–100.
Misra, C., Mishra, B. K. (1977): Miscible displacement of nitrate andchloride under field conditions. Soil Sci. Soc. Am. J. 41, 496–499.
Misra, C., Nielsen, D. R., Biggar, J. W. (1974): Nitrogen transforma-tions in soil during leaching: ii. steady state nitrification and nitratereduction. Soil Sci. Soc. Am. J. 38, 294–299.
Morgan, K. T., Obreza, T. A., Scholberg, J. M. S., Parsons, L. R.,Wheaton, T. A. (2006): Citrus water uptake dynamics on a sandyFlorida Entisol. Soil Sci. Soc. Am. J. 70, 90–97.
Muwamba, A. (2012): Effect of water table depth on phosphorus andnitrogen movement in dominant mineral soils used for sugarcaneproduction in southwest Florida. PhD thesis, University of Florida,Gainesville, FL, USA.
Nakamura, K., Harter, T., Hirono, Y., Horino, H., Mitsuno, T. (2004):Assessment of root zone nitrogen leaching as affected by irrigationand nutrient management practices. Vadose Zone J. 3,1353–1366.
Nkedi-Kizza, P., Rao, P. S. C., Jessup, R. E., Davidson, J. M. (1982):Ion exchange and diffusive mass transfer during miscibledisplacement through an aggregated Oxisol. Soil Sci. Soc. Am. J.46, 471–476.
Nkedi-Kizza, P., Rao, P. S. C., Hornsby, A. G. (1987): The influenceof organic cosolvents on leaching of hydrophobic organic chemi-cals through soils. Environ. Sci. Technol. 21, 1107–1111.
Obreza, T. A., Collins, M. E. (2008): Common soils used for citrusproduction in Florida. University of Florida, Gainesville, FL, USA.
Paramasivam, S., Alva, A. K. (1997): Leaching of nitrogen forms fromcontrolled-release nitrogen fertilizers. Commun. Soil. Sci. PlantAnal. 28, 1663–1674.
Paramasivam, S., Alva, A. K., Fares, A., Sajwan, K. S. (2001): Esti-mation of nitrate leaching in an Entisol under optimum citrusproduction. Soil Sci. Soc. Am. J. 65, 914–921.
Paramasivam, S., Alva, A. K., Fares, A., Sajwan, K. (2002): Fate ofnitrate and bromide in an unsaturated zone of a sandy soil undercitrus production. J. Environ. Qual. 31, 671–681.
Richards, L. A. (1931): Capillary conduction of liquids through porousmedium. Physics 1, 318–333.
SAS Institute (2015): The SAS system for Microsoft Windows-Release 9.4. Cary, NC, USA.
Simunek, J., Hopmans, J. (2009): Modeling compensated root waterand nutrient uptake. Ecol. Model. 220, 505–521.
Simunek, J., Sejna, M., van Genuchten, M. T. (1999): The HYDRUS-2D Software Package for Simulating Two-Dimensional Movementof Water, Heat, and Multiple Solutes in Variably-Saturated Media.USDA, Riverside, CA, USA.
USEPA—U. S. Environmental Protection Agency (1979): Chloride.Method 325.2. Methods for Chemical Analysis of Water andWastes, EPA-600/4-79-020. USEPA, Cincinnati, OH, USA.
USEPA—U. S. Environmental Protection Agency (1983): Nitrogen,Ammonia. Method 350.1. Methods for Chemical Analysis of Waterand Wastes, EPA-600/ 4-79-020. USEPA, Cincinnati, OH, USA.
USEPA—U. S. Environmental Protection Agency (1993): Determi-nation of Nitrate-Nitrite Nitrogen by Automated Colorimetry. Method353.2. Environmental Monitoring Systems Laboratory Office ofResearch and Development. USEPA, Cincinnati, OH, USA.
van Genuchten, M. T. (1980): Determining Transport Parametersfrom Miscible Displacement Experiments. Research Report No.118. USDA, ARS, Riverside, CA, USA.
Wagenet, R. J., Biggar, J. W., Nielsen, D. R. (1977): Tracing thetransformations of urea fertilizer during leaching. Soil Sci. Soc.Am. J. 41, 896–902.
Woodard, K. R., French, E. C., Sweat, L. A., Graetz, D. A., Sollen-berger, L. E., Macoon, B., Portier, K. M., Rymph, S. J.,Wade, B. L., Prine, G. M., Van Horn, H. H. (2003): Nitrogenremoval and nitrate leaching for two perennial, sod-based foragesystems receiving dairy effluent. J. Environ. Qual. 32, 996–1007.
ª 2017 WILEY-VCH Verlag GmbH & Co. KGaA, Weinheim www.plant-soil.com
J. Plant Nutr. Soil Sci. 2017, 000, 1–13 Ammonium and nitrate transport 13