Amlak Finance PJSC · AMLAK FINANCE PJSC Investor Relations Annual Information Pack December 2015...
30
1 AMLAK FINANCE PJSC Investor Relations Annual Information Pack December 2015 1 Investor Relations Unit, Amlak Finance PJSC, P O Box 2441, Dubai Web: http://www.amlakfinance.com/en/investor-relations.html Email: [email protected] Contact Us:
Transcript of Amlak Finance PJSC · AMLAK FINANCE PJSC Investor Relations Annual Information Pack December 2015...
1
AMLAK FINANCE PJSC
Investor Relations Annual Information Pack
December 2015
1
Investor Relations Unit, Amlak Finance PJSC, P O Box 2441, Dubai
Web: http://www.amlakfinance.com/en/investor-relations.html
Email: [email protected]
Contact Us:
2
Disclaimer
2
The information set out in this presentation is being made available to recipients for information purposes only. It does not constitute, nor is it intended to be an offer to sell, or an invitation to subscribe for, or purchase, any securities in the Company. Neither this presentation nor anything in it shall form the basis of any contract or commitment.
This presentation may contain forward looking statements including statements regarding our intent, belief or current expectations with respect to Company’s businesses and operations, market conditions, results of operation and financial condition, capital adequacy, specific provisions and risk management practices. Readers are cautioned not to place undue reliance on these forward looking statements.
The information contained herein has been prepared to assist the Recipients in making their own evaluation on the Company and does not purport to contain all information that they may desire. In all cases, the Recipients should conduct their own investigation and analysis of the Company, its business, prospects, results of operations and financial condition as well as any other information the Recipients may deem relevant to their decision making.
The Presentation is at the date hereof. Neither the delivery of this Presentation nor any further discussions in relation to the Company or the contemplated issue of shares with any of the Recipients shall, under any circumstances, create any implication that there has been no change in the affairs of the Company since the date of this Presentation.
Without the express prior written consent of the Company, the Presentation and any information contained within it may not be (i) reproduced (in whole or in part), (ii) copied at any time, (iii) used for any purpose other than your evaluation of the Company.
3 3
Sections
UAE & DUBAI ECONOMY
REAL ESTATE MARKET
MORTGAGE MARKET
AMLAK AT A GLANCE
FINANCIAL HIGHLIGHTS
STRATEGY
STOCK INFORMATION
AWARDS

4 4
UAE & DUBAI ECONOMY
5
UAE & Dubai Economy - Overview
5
The United Arab Emirates (UAE) continues to drive regional change with an economy that has remained relatively
buoyant throughout the last couple years.
The country boasts one of the most agile economies in the world and has witnessed strong growth. As a result, the
UAE consistently scores high across all global competitiveness indices compiled by both regional and international
organizations.
President His Highness Sheikh Khalifa Bin Zayed Al Nahyan calls the Emirates’ economic model both sustainable
and responsible and expressed confidence that, as such, current policy ensures the long-term prosperity of the
nation.
Despite sharp fall in oil prices recently, UAE economy has shown resilience and capable in accommodating
changes to market dynamics, open new frontiers, and diversity thanks to the country’s strong infrastructure,
technology, and logistics.
UAE, mainly Dubai, seeks to create new sustainable and competitive economic models and adopt more flexible
approaches that boost cooperation between the public and private sector, which particularly suits the country’s
international position as a main economic player in the MENA hub. Dubai has adopted diversity in its economy and
whilst oil prices do have an undeniable effect, the variety of business activities, to a large extend, mitigate oil price
fluctuations.
Despite, many geo-political and economic challenges in Middle East, the UAE and Dubai have consistently provided
an investment oasis for professional and non-professional investors. With the 2020 Expo set for Dubai, the city is
expected to attract further attention and direct regional and foreign investment over the next few years.
6
Key Economic Indicators - Overview
6
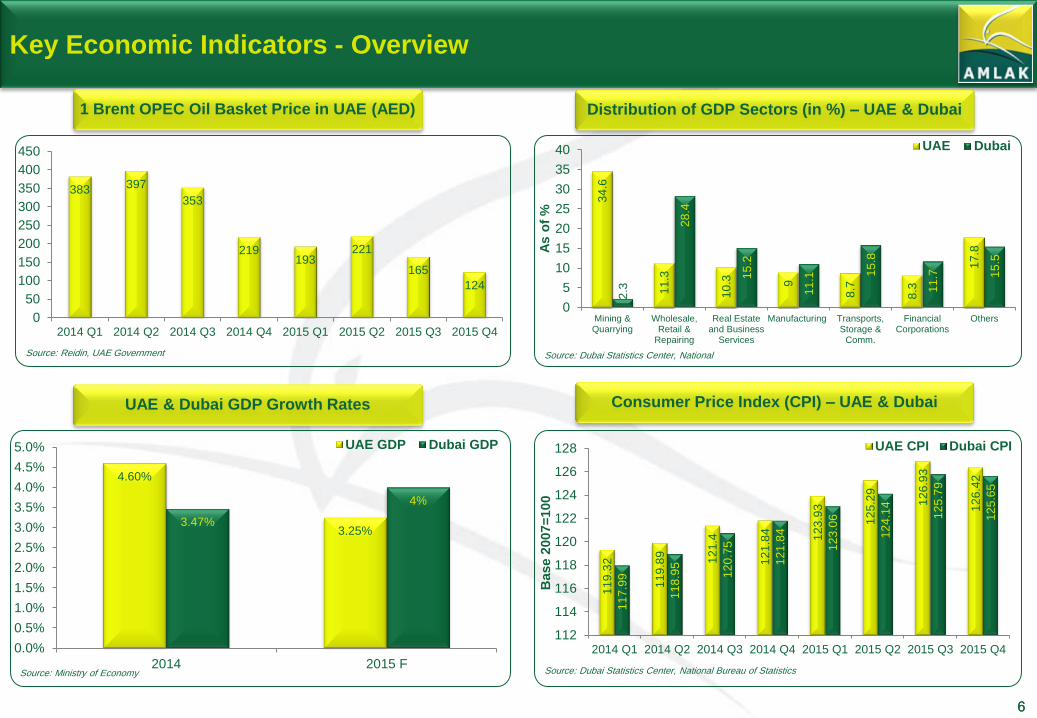
1 Brent OPEC Oil Basket Price in UAE (AED)
383 397
353
219 193
221
165
124
0
50
100
150
200
250
300
350
400
450
2014 Q1 2014 Q2 2014 Q3 2014 Q4 2015 Q1 2015 Q2 2015 Q3 2015 Q4
Source: Reidin, UAE Government
UAE & Dubai GDP Growth Rates
4.60%
3.25% 3.47%
4%
0.0%
0.5%
1.0%
1.5%
2.0%
2.5%
3.0%
3.5%
4.0%
4.5%
5.0%
2014 2015 F
UAE GDP Dubai GDP
Source: Ministry of Economy
Distribution of GDP Sectors (in %) – UAE & Dubai
34
.6
11
.3
10
.3
9
8.7
8.3
17
.8
2.3
28
.4
15
.2
11
.1 15
.8
11
.7
15
.5
0
5
10
15
20
25
30
35
40
Mining &Quarrying
Wholesale,Retail &
Repairing
Real Estateand Business
Services
Manufacturing Transports,Storage &
Comm.
FinancialCorporations
Others
As o
f %
UAE Dubai
Source: Dubai Statistics Center, National
Consumer Price Index (CPI) – UAE & Dubai
11
9.3
2
11
9.8
9
12
1.4
12
1.8
4
12
3.9
3
12
5.2
9
12
6.9
3
12
6.4
2
11
7.9
9
11
8.9
5
12
0.7
5
12
1.8
4
12
3.0
6
12
4.1
4
12
5.7
9
12
5.6
5
112
114
116
118
120
122
124
126
128
2014 Q1 2014 Q2 2014 Q3 2014 Q4 2015 Q1 2015 Q2 2015 Q3 2015 Q4
Base 2
007=
100
UAE CPI Dubai CPI
Source: Dubai Statistics Center, National Bureau of Statistics

7 7
REAL ESTATE MARKET
8
Real Estate Market - Overview
8
The real estate market is an important and integral part of Dubai economy. The city is famous for its community
living, commercial district and leisure projects. Major developers have retuned to the market in earnest over the last
3 years with many off plan launches, many of which have shown great success. Many lessons have also been
learnt. New laws and regulations, property registration and strata management have helped stabilize the real estate
market in Dubai allowing better visibility for investors and end users in this market segment.
However, given signs of recession in many parts of the global and regional economies, the Dubai real estate market
has cooled down since the beginning of 2015 after expanding significantly in 2013 and 2014. Coupled with lower oil
prices and the appreciation of the US dollar, has dented demand for real estate by foreign investors with
repercussions on other of key sectors such as retail and tourism.
According to the Dubai Land Department, there appears to be marked shift of investors recently, to GCC and Arab
investors with a drop in other foreigner investors who traditionally were from India, Pakistan, and United Kingdom.
2016 is likely to see fresh supply of completed properties ready for hand over which could create further price
pressure in the market. Residential sales prices are expected to decline further in 2016 but at a diminishing rate
compared to 2015, as Dubai is in the maturity phase of its real estate cycle. Rentals, on the other hand, are
expected to stay relatively stronger and robust due to the fairly more steady demand.
The commercial rent prices are expected to stabilize given the number of quality office projects scheduled to be
delivered in 2016.
9
Key Real Estate Indicators - Overview
9
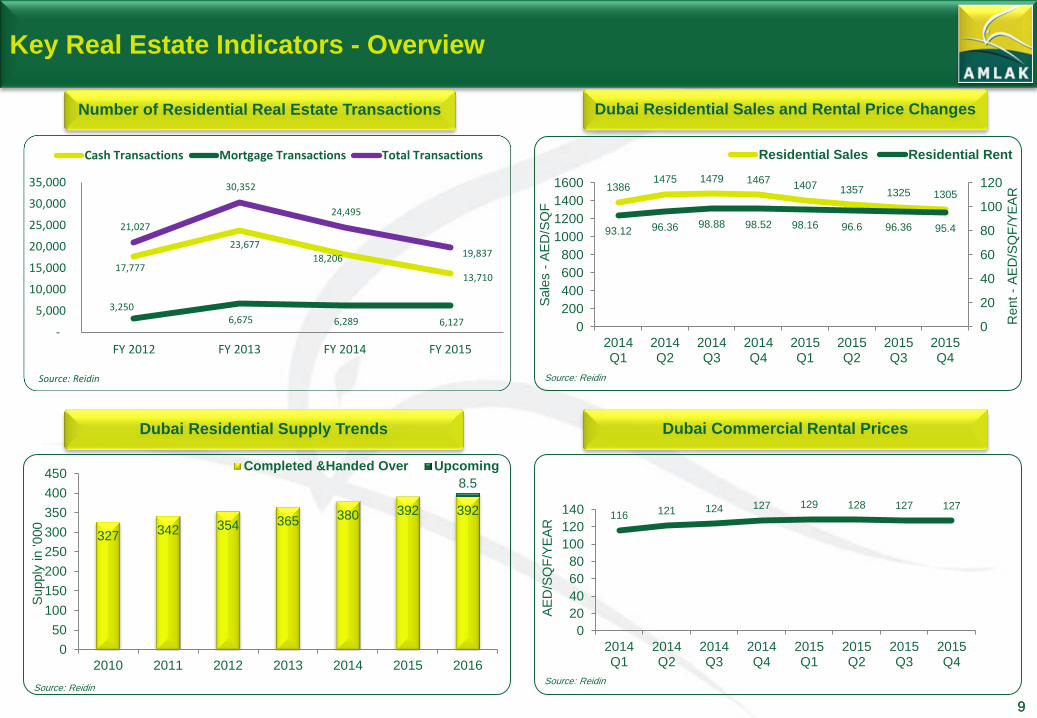
Number of Residential Real Estate Transactions
Dubai Residential Supply Trends
327 342 354 365 380 392 392
8.5
0
50
100
150
200
250
300
350
400
450
2010 2011 2012 2013 2014 2015 2016
Supply
in '000
Completed &Handed Over Upcoming
Source: Reidin
Dubai Residential Sales and Rental Price Changes
Dubai Commercial Rental Prices
1386 1475 1479 1467
1407 1357 1325 1305
93.12 96.36 98.88 98.52 98.16 96.6 96.36 95.4
0
20
40
60
80
100
120
0
200
400
600
800
1000
1200
1400
1600
2014Q1
2014Q2
2014Q3
2014Q4
2015Q1
2015Q2
2015Q3
2015Q4
Rent
- A
ED
/SQ
F/Y
EA
R
Sale
s -
AE
D/S
QF
Residential Sales Residential Rent
Source: Reidin
116 121 124 127 129 128 127 127
0
20
40
60
80
100
120
140
2014Q1
2014Q2
2014Q3
2014Q4
2015Q1
2015Q2
2015Q3
2015Q4
AE
D/S
QF
/YE
AR
Source: Reidin
17,777
23,677
18,206
13,710
3,250 6,675 6,289 6,127
21,027
30,352
24,495
19,837
-
5,000
10,000
15,000
20,000
25,000
30,000
35,000
FY 2012 FY 2013 FY 2014 FY 2015
Cash Transactions Mortgage Transactions Total Transactions
Source: Reidin

10 10
MORTGAGE MARKET
11
Dubai Mortgage Market - Overview
11
Historically, cash transactions have dominated residential acquisitions in the Dubai real estate market over the
mortgage transactions for the last decade. This trend highlights that Dubai real estate market has been more investor-
oriented than end-users.
Mortgage penetration rates (mortgage debt as a percentage of GDP) in GCC countries are low at 5-10%. In contrast,
developed countries like the US and UK, have mortgage penetration rates of more than 70%.
Overall value of Dubai mortgage market is estimated to be around AED 66 billion per annum over the last few years.
Out of this value, around AED 12.5 billion relates to the residential unit mortgage transactions per year.
When Dubai is compared to other real estate markets, Dubai was among the top cities in terms of price appreciation in
2013 and 2014, registering double digit increases, has now become a more affordable place to buy real estate after
prices declined around 10 - 15%. The real estate market in Dubai offers an average yield of 7%, about 2-3% above the
average yield in international property markets, especially when compared to the modest yields that mature markets like
London, Paris or New York offer.
There have been a number of changes in the Dubai mortgage market over the past year by Dubai Land Department and
Central Bank of UAE such as a new mortgage law and higher property transaction fees.
These recent changes have protected Dubai’s rebounding property market from pure speculators.
Although these recent changes may have created a short term negative effect in the market among investors in 2014,
mortgage market remained stagnant in the following years despite the overall market softening in terms of prices and
transactions.
Amlak’s main competitors in the property financing market are both local and international banks. Recently, banks have
offered lower mortgage profit/interest rates to expand their customer base in today’s slower market conditions. However,
Amlak as a specialized property financier has developed a number of innovative products which are unique and appeal
to the investor segment more prominently. Our Istithmari product which is a “Buy-to-Let” package is a clear example.

12
Mortgage Transactions and Rental Yields
12
Number of Transactions Over the Years Rental Yields in Dubai
0
2,000
4,000
6,000
8,000
10,000
12,000
2014 Q1 2014 Q2 2014 Q3 2014 Q4 2015 Q1 2015 Q2 2015 Q3 2015 Q4
Total Transactions Sales Transactions Mortgage Transactions
0%
1%
2%
3%
4%
5%
6%
7%
8%
9%
2014 Q1 2014 Q2 2014 Q3 2014 Q4 2015 Q1 2015 Q2 2015 Q3 2015 Q4
Apartment Villa
There has been a decrease in number of sales transactions over the past two years as the Dubai real estate market experienced a healthy
correction period. Mortgage transactions, over past couple of years, have shown stable movement during this correction period. While
number of sales transactions dropped around 35% over the last two years, mortgage transactions were almost flat.
This trend is likely to continue in the near future, with some potential increase in number of transactions as market is expected to pick up
once again over the next couple of year.
Also, new project launches and a positive market outlook are expected to create further demand for mortgage financing. Combining the
new investment opportunities towards Expo 2020 and relatively low mortgage interest rates, mortgage transactions are expected to start
increasing in the medium and longer terms.
Overall, Dubai rental yields are a major attraction for property investors which is set to continue as property prices remain tight.

13 13
AMLAK AT A GLANCE
14
About Amlak
14
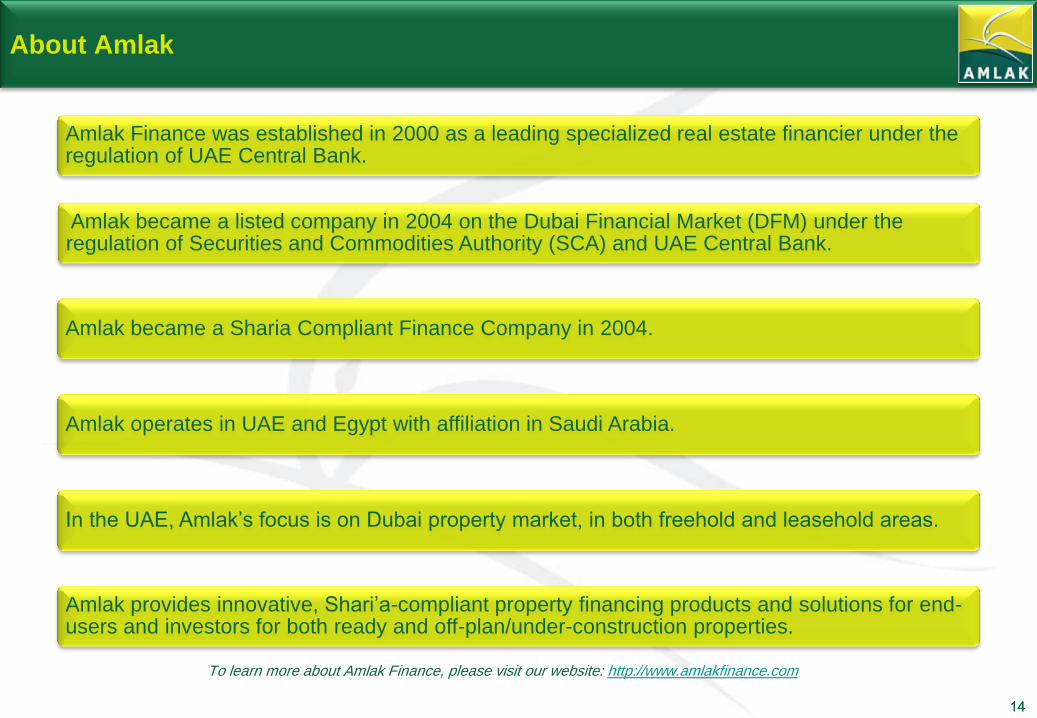
Amlak Finance was established in 2000 as a leading specialized real estate financier under the regulation of UAE Central Bank.
Amlak became a listed company in 2004 on the Dubai Financial Market (DFM) under the regulation of Securities and Commodities Authority (SCA) and UAE Central Bank.
Amlak became a Sharia Compliant Finance Company in 2004.
Amlak operates in UAE and Egypt with affiliation in Saudi Arabia.
In the UAE, Amlak’s focus is on Dubai property market, in both freehold and leasehold areas.
Amlak provides innovative, Shari’a-compliant property financing products and solutions for end-users and investors for both ready and off-plan/under-construction properties.
To learn more about Amlak Finance, please visit our website: http://www.amlakfinance.com
15
Vision & Mission Statements
15
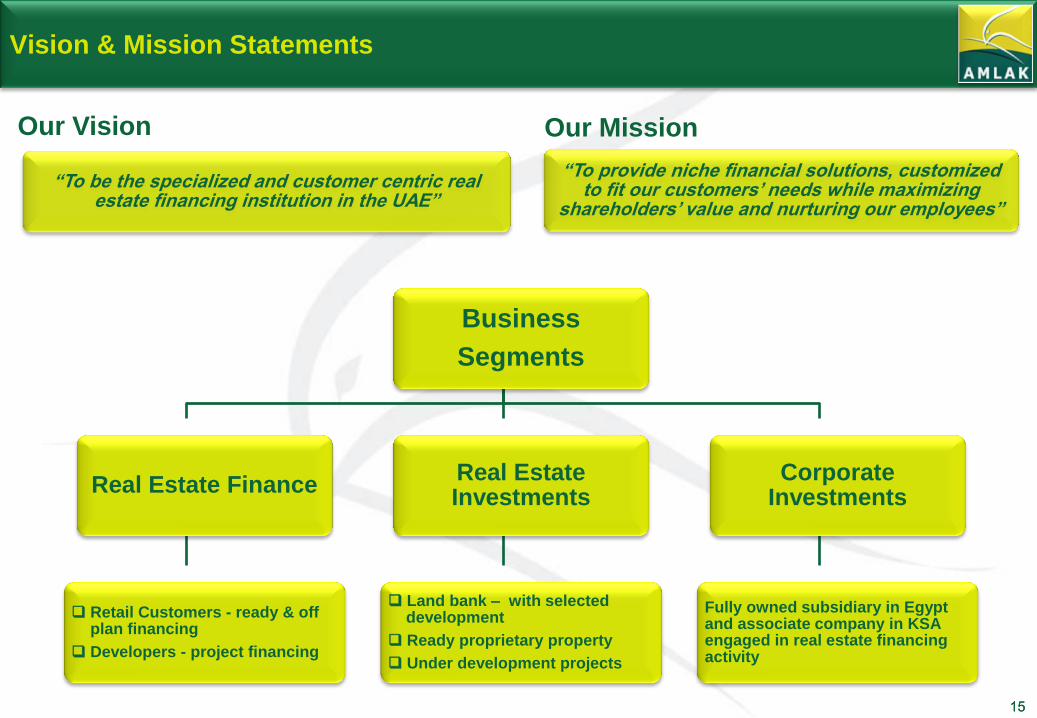
“To be the specialized and customer centric real estate financing institution in the UAE”
Our Mission Our Vision
“To provide niche financial solutions, customized to fit our customers’ needs while maximizing
shareholders’ value and nurturing our employees”
Business
Segments
Real Estate Finance
Retail Customers - ready & off plan financing
Developers - project financing
Real Estate Investments
Land bank – with selected development
Ready proprietary property
Under development projects
Corporate Investments
Fully owned subsidiary in Egypt and associate company in KSA engaged in real estate financing activity

16
Board
Business (Financing and RE investments)
Finance & Investments Operations & IT Corporate Services Strategy & Organization
Development Legal, Compliance
&Sharia
Zakat
Committee
Audit
Committee
Internal
Audit
Managing Director & Chief Executive Officer
Organization Structure
16
Board Committees:
Zakat Committee
Audit Committee
Corporate Governance
Executive Committees:
MANCO (Management Committee)
ALCO (Assets Liability Committee)
Risk Committee
17
Key Products and Services
17
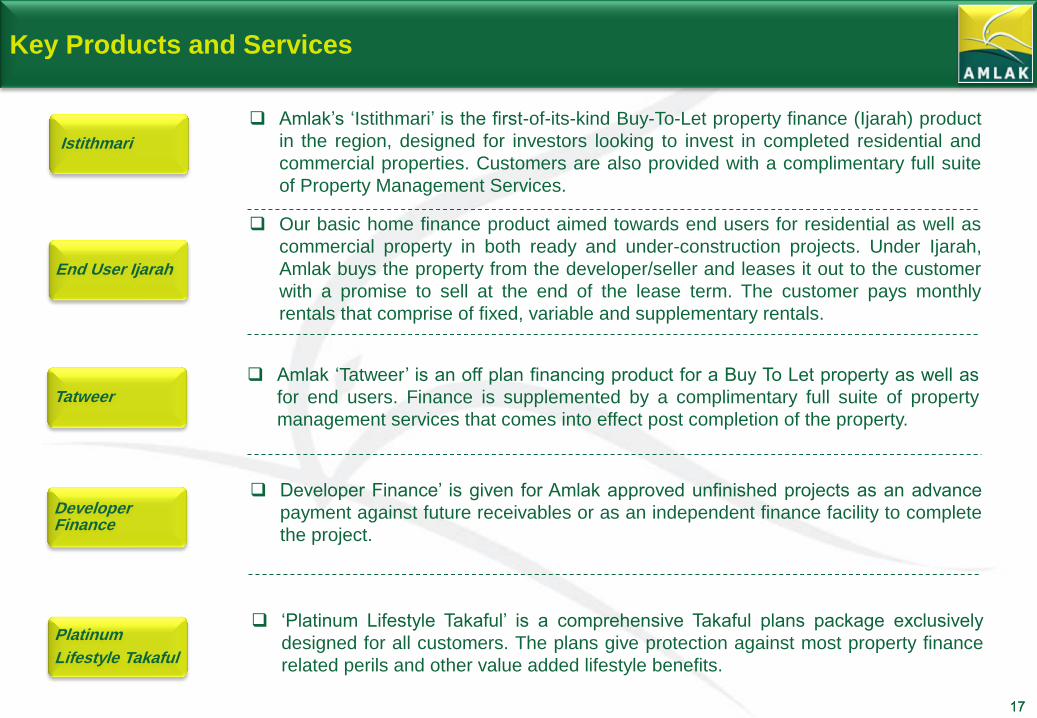
Amlak ‘Tatweer’ is an off plan financing product for a Buy To Let property as well as
for end users. Finance is supplemented by a complimentary full suite of property
management services that comes into effect post completion of the property.
Our basic home finance product aimed towards end users for residential as well as
commercial property in both ready and under-construction projects. Under Ijarah,
Amlak buys the property from the developer/seller and leases it out to the customer
with a promise to sell at the end of the lease term. The customer pays monthly
rentals that comprise of fixed, variable and supplementary rentals.
Amlak’s ‘Istithmari’ is the first-of-its-kind Buy-To-Let property finance (Ijarah) product
in the region, designed for investors looking to invest in completed residential and
commercial properties. Customers are also provided with a complimentary full suite
of Property Management Services.
End User Ijarah
Istithmari
Tatweer
‘Platinum Lifestyle Takaful’ is a comprehensive Takaful plans package exclusively
designed for all customers. The plans give protection against most property finance
related perils and other value added lifestyle benefits.
Platinum
Lifestyle Takaful
Developer Finance’ is given for Amlak approved unfinished projects as an advance
payment against future receivables or as an independent finance facility to complete
the project.
Developer Finance
18
Recent Developments
18
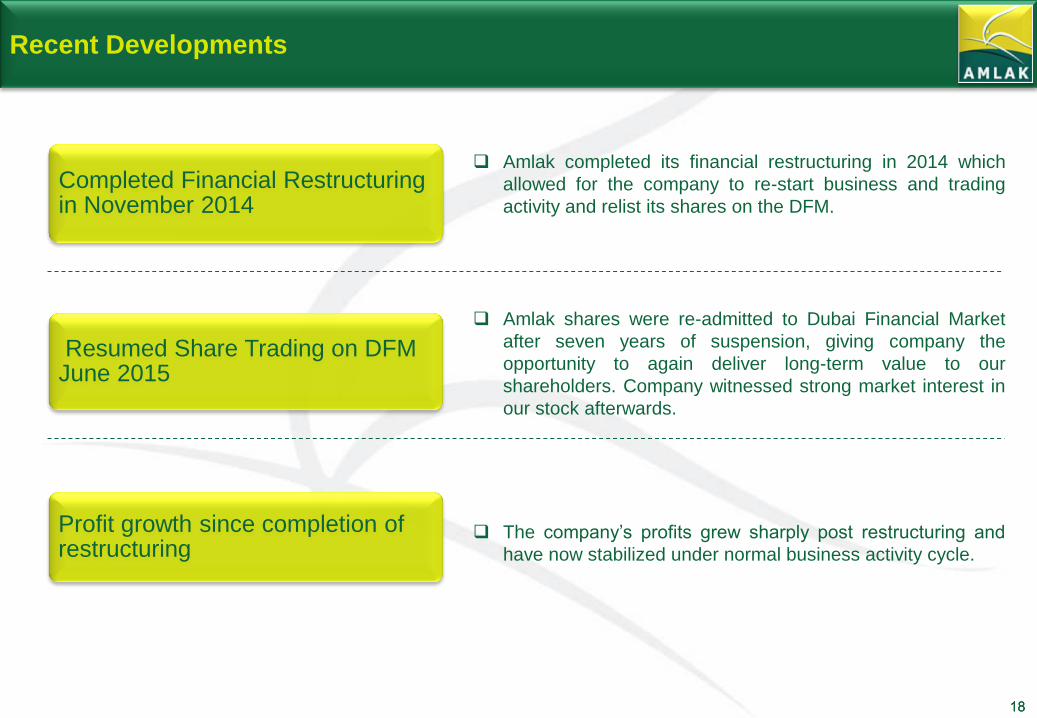
Completed Financial Restructuring in November 2014
Amlak completed its financial restructuring in 2014 which
allowed for the company to re-start business and trading
activity and relist its shares on the DFM.
Profit growth since completion of restructuring
The company’s profits grew sharply post restructuring and
have now stabilized under normal business activity cycle.
Resumed Share Trading on DFM June 2015
Amlak shares were re-admitted to Dubai Financial Market
after seven years of suspension, giving company the
opportunity to again deliver long-term value to our
shareholders. Company witnessed strong market interest in
our stock afterwards.

19 19
FINANCIAL HIGHLIGHTS
20
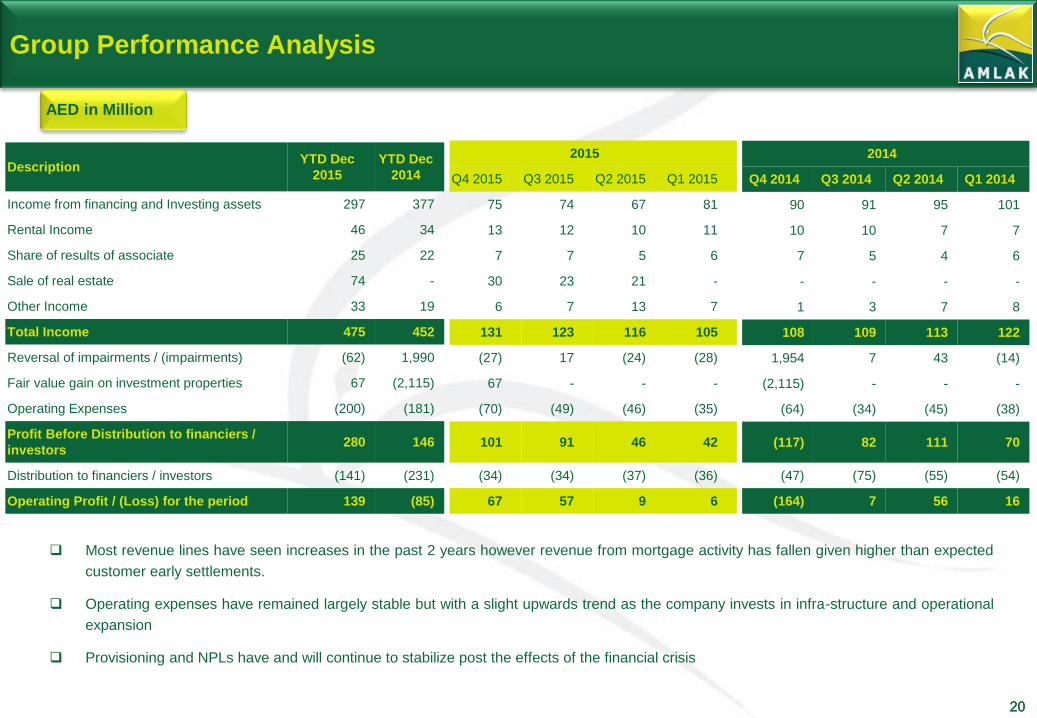
Group Performance Analysis
20
Description YTD Dec
2015
YTD Dec
2014
Income from financing and Investing assets 297 377
Rental Income 46 34
Share of results of associate 25 22
Sale of real estate 74 -
Other Income 33 19
Total Income 475 452
Reversal of impairments / (impairments) (62) 1,990
Fair value gain on investment properties 67 (2,115)
Operating Expenses (200) (181)
Profit Before Distribution to financiers /
investors 280 146
Distribution to financiers / investors (141) (231)
Operating Profit / (Loss) for the period 139 (85)
2015
Q4 2015 Q3 2015 Q2 2015 Q1 2015
75 74 67 81
13 12 10 11
7 7 5 6
30 23 21 -
6 7 13 7
131 123 116 105
(27) 17 (24) (28)
67 - - -
(70) (49) (46) (35)
101 91 46 42
(34) (34) (37) (36)
67 57 9 6
AED in Million
2014
Q4 2014 Q3 2014 Q2 2014 Q1 2014
90 91 95 101
10 10 7 7
7 5 4 6
- - - -
1 3 7 8
108 109 113 122
1,954 7 43 (14)
(2,115) - - -
(64) (34) (45) (38)
(117) 82 111 70
(47) (75) (55) (54)
(164) 7 56 16
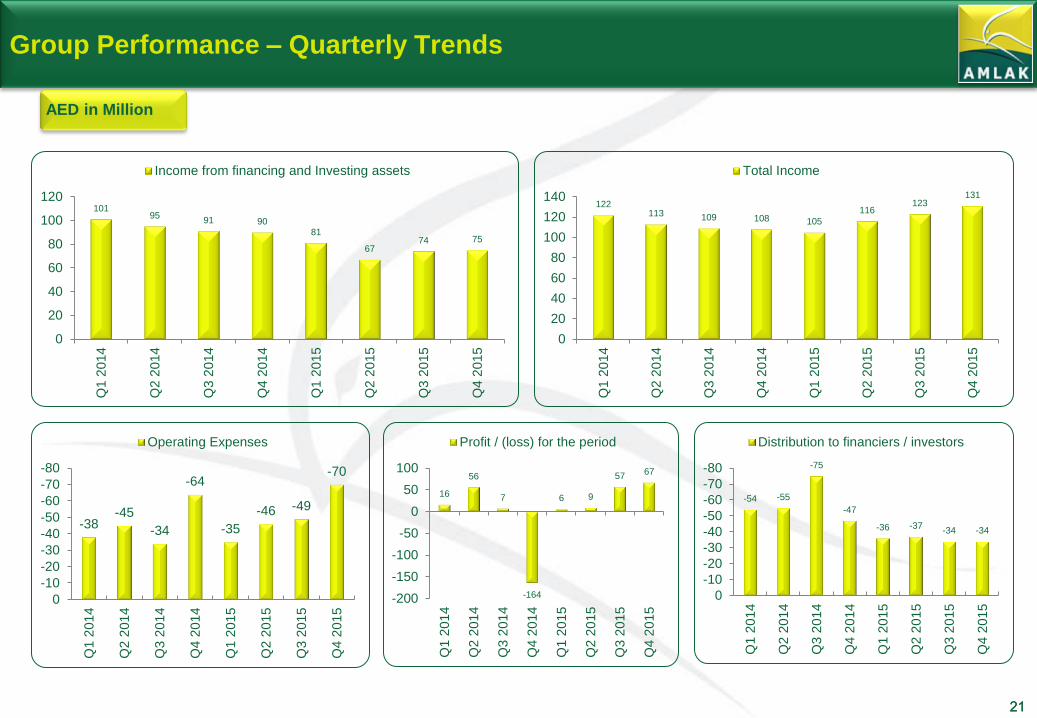
Most revenue lines have seen increases in the past 2 years however revenue from mortgage activity has fallen given higher than expected
customer early settlements.
Operating expenses have remained largely stable but with a slight upwards trend as the company invests in infra-structure and operational
expansion
Provisioning and NPLs have and will continue to stabilize post the effects of the financial crisis
21
Group Performance – Quarterly Trends
21
AED in Million
101 95
91 90 81
67 74 75
0
20
40
60
80
100
120
Q1 2
014
Q2 2
014
Q3 2
014
Q4 2
014
Q1 2
015
Q2 2
015
Q3 2
015
Q4 2
015
Income from financing and Investing assets
122 113 109 108 105
116 123
131
0
20
40
60
80
100
120
140
Q1 2
014
Q2 2
014
Q3 2
014
Q4 2
014
Q1 2
015
Q2 2
015
Q3 2
015
Q4 2
015
Total Income
-38 -45
-34
-64
-35
-46 -49
-70 -80
-70
-60
-50
-40
-30
-20
-10
0
Q1 2
014
Q2 2
014
Q3 2
014
Q4
20
14
Q1 2
015
Q2 2
015
Q3 2
015
Q4 2
015
Operating Expenses
16
56
7
-164
6 9
57 67
-200
-150
-100
-50
0
50
100
Q1 2
014
Q2 2
014
Q3 2
014
Q4 2
014
Q1 2
015
Q2 2
015
Q3 2
015
Q4 2
015
Profit / (loss) for the period
-54 -55
-75
-47
-36 -37 -34 -34
-80
-70
-60
-50
-40
-30
-20
-10
0
Q1 2
014
Q2 2
014
Q3 2
014
Q4 2
014
Q1 2
015
Q2 2
015
Q3 2
015
Q4 2
015
Distribution to financiers / investors
22
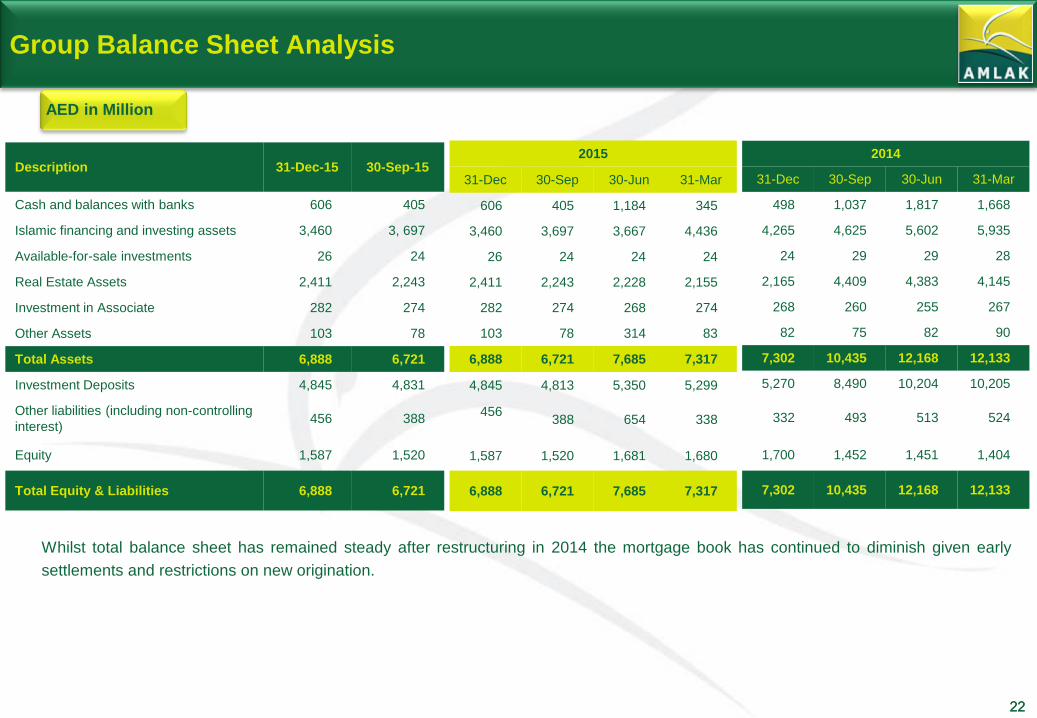
Group Balance Sheet Analysis
22
Description 31-Dec-15 30-Sep-15
Cash and balances with banks 606 405
Islamic financing and investing assets 3,460 3, 697
Available-for-sale investments 26 24
Real Estate Assets 2,411 2,243
Investment in Associate 282 274
Other Assets 103 78
Total Assets 6,888 6,721
Investment Deposits 4,845 4,831
Other liabilities (including non-controlling
interest) 456 388
Equity 1,587 1,520
Total Equity & Liabilities 6,888 6,721
2015
31-Dec 30-Sep 30-Jun 31-Mar
606 405 1,184 345
3,460 3,697 3,667 4,436
26 24 24 24
2,411 2,243 2,228 2,155
282 274 268 274
103 78 314 83
6,888 6,721 7,685 7,317
4,845 4,813 5,350 5,299
456
388 654 338
1,587 1,520 1,681 1,680
6,888 6,721 7,685 7,317
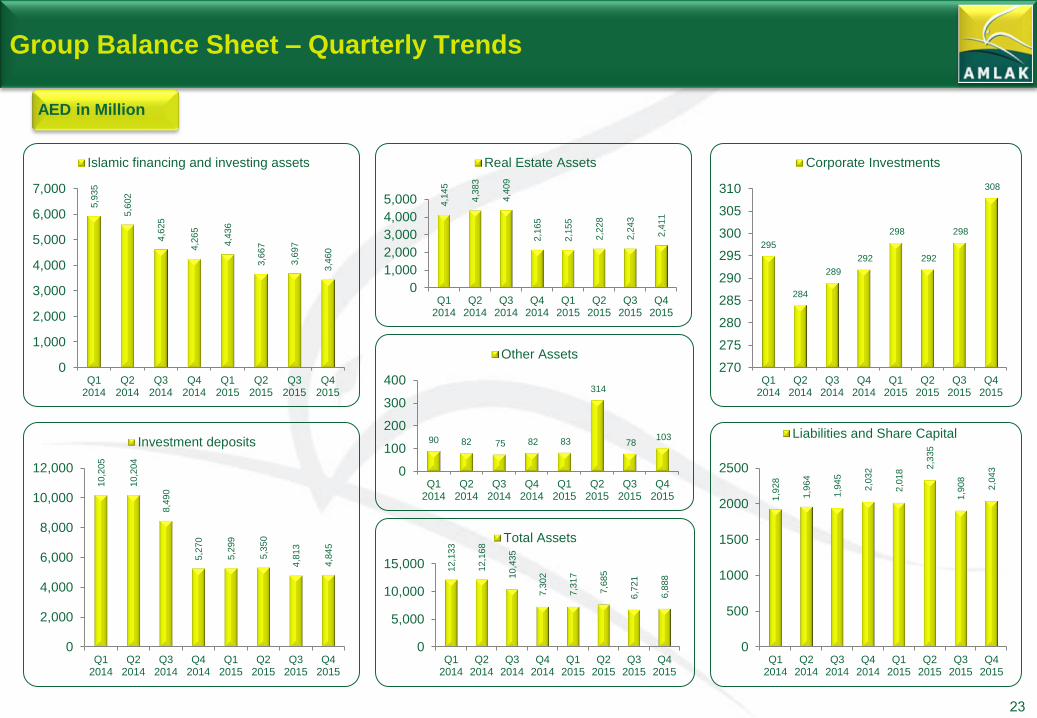
Whilst total balance sheet has remained steady after restructuring in 2014 the mortgage book has continued to diminish given early
settlements and restrictions on new origination.
AED in Million
2014
31-Dec 30-Sep 30-Jun 31-Mar
498 1,037 1,817 1,668
4,265 4,625 5,602 5,935
24 29 29 28
2,165 4,409 4,383 4,145
268 260 255 267
82 75 82 90
7,302 10,435 12,168 12,133
5,270 8,490 10,204 10,205
332 493 513 524
1,700 1,452 1,451 1,404
7,302 10,435 12,168 12,133
23
Group Balance Sheet – Quarterly Trends
AED in Million
12,1
33
12,1
68
10,4
35
7,3
02
7,3
17
7,6
85
6,7
21
6,8
88
0
5,000
10,000
15,000
Q12014
Q22014
Q32014
Q42014
Q12015
Q22015
Q32015
Q42015
Total Assets
5,9
35
5,6
02
4,6
25
4,2
65
4,4
36
3,6
67
3,6
97
3,4
60
0
1,000
2,000
3,000
4,000
5,000
6,000
7,000
Q12014
Q22014
Q32014
Q42014
Q12015
Q22015
Q32015
Q42015
Islamic financing and investing assets
4,1
45
4,3
83
4,4
09
2,1
65
2,1
55
2,2
28
2,2
43
2,4
11
0
1,000
2,000
3,000
4,000
5,000
Q12014
Q22014
Q32014
Q42014
Q12015
Q22015
Q32015
Q42015
Real Estate Assets
295
284
289
292
298
292
298
308
270
275
280
285
290
295
300
305
310
Q12014
Q22014
Q32014
Q42014
Q12015
Q22015
Q32015
Q42015
Corporate Investments
90 82 75 82 83
314
78 103
0
100
200
300
400
Q12014
Q22014
Q32014
Q42014
Q12015
Q22015
Q32015
Q42015
Other Assets
10,2
05
10,2
04
8,4
90
5,2
70
5,2
99
5,3
50
4,8
13
4,8
45
0
2,000
4,000
6,000
8,000
10,000
12,000
Q12014
Q22014
Q32014
Q42014
Q12015
Q22015
Q32015
Q42015
Investment deposits
1,9
28
1,9
64
1,9
45
2,0
32
2,0
18 2,3
35
1,9
08
2,0
43
0
500
1000
1500
2000
2500
Q12014
Q22014
Q32014
Q42014
Q12015
Q22015
Q32015
Q42015
Liabilities and Share Capital

24 24
STRATEGY
25
Amlak’s Strategic Direction
25
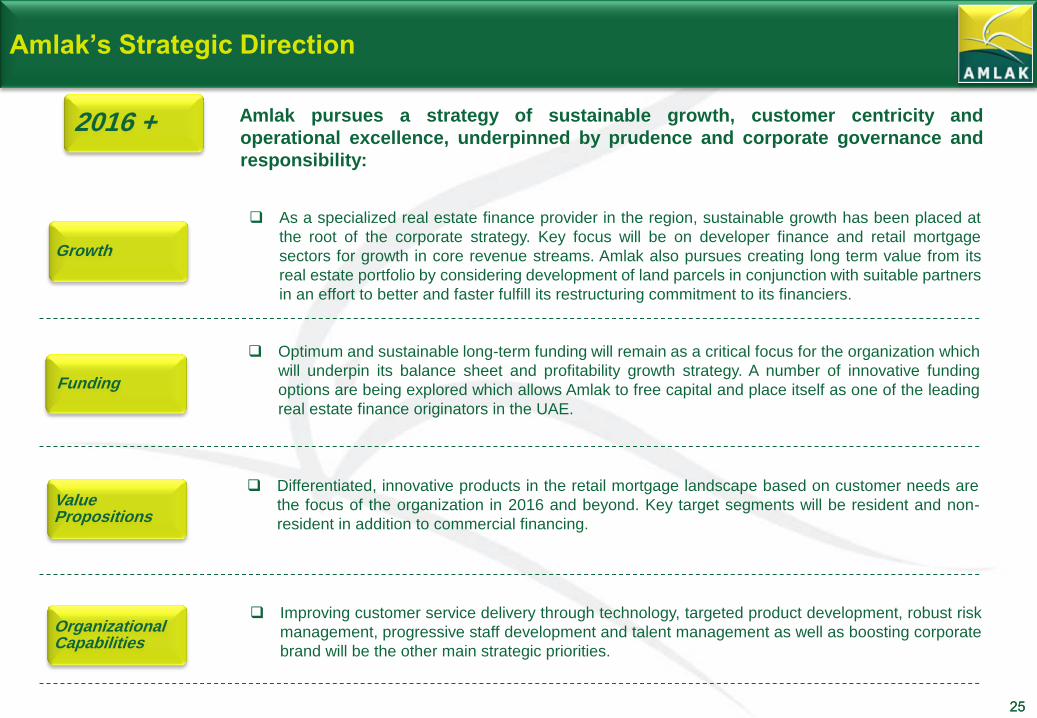
Optimum and sustainable long-term funding will remain as a critical focus for the organization which
will underpin its balance sheet and profitability growth strategy. A number of innovative funding
options are being explored which allows Amlak to free capital and place itself as one of the leading
real estate finance originators in the UAE.
Differentiated, innovative products in the retail mortgage landscape based on customer needs are
the focus of the organization in 2016 and beyond. Key target segments will be resident and non-
resident in addition to commercial financing.
As a specialized real estate finance provider in the region, sustainable growth has been placed at
the root of the corporate strategy. Key focus will be on developer finance and retail mortgage
sectors for growth in core revenue streams. Amlak also pursues creating long term value from its
real estate portfolio by considering development of land parcels in conjunction with suitable partners
in an effort to better and faster fulfill its restructuring commitment to its financiers.
Growth
Funding
Value Propositions
Improving customer service delivery through technology, targeted product development, robust risk
management, progressive staff development and talent management as well as boosting corporate
brand will be the other main strategic priorities.
Organizational Capabilities
2016 + Amlak pursues a strategy of sustainable growth, customer centricity and
operational excellence, underpinned by prudence and corporate governance and
responsibility:
26
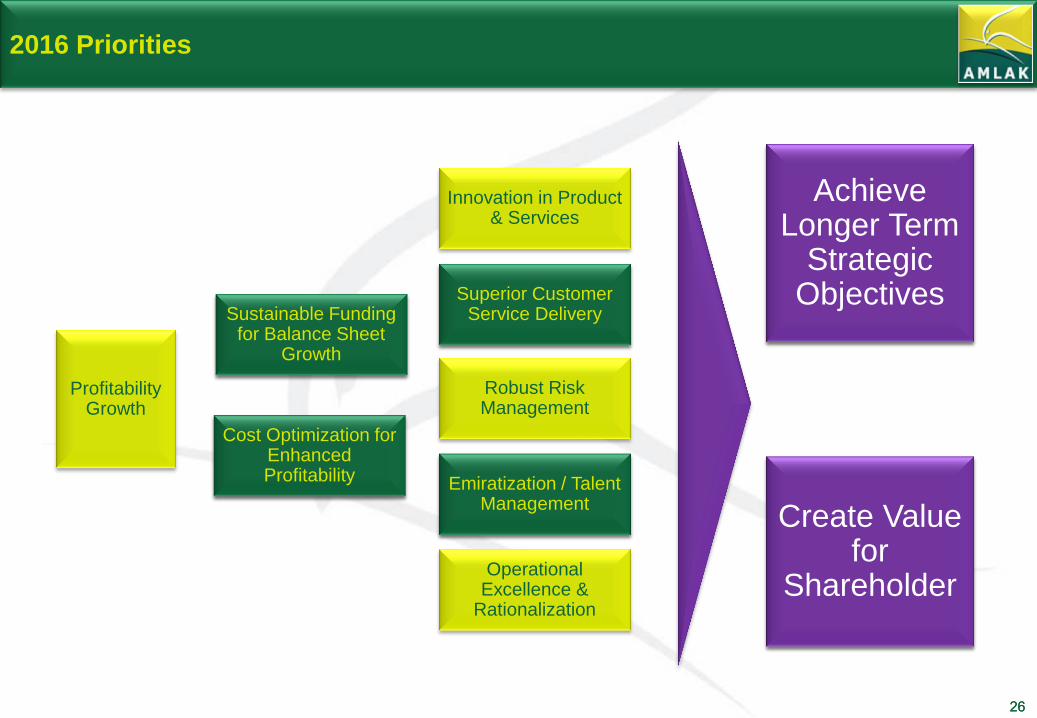
2016 Priorities
26
Innovation in Product & Services
Superior Customer Service Delivery
Robust Risk Management
Emiratization / Talent Management
Operational Excellence &
Rationalization
Sustainable Funding for Balance Sheet
Growth
Cost Optimization for Enhanced Profitability
Profitability Growth
Achieve Longer Term
Strategic Objectives
Create Value for
Shareholder

27 27
STOCK INFORMATION
28
Company Stock Information
28
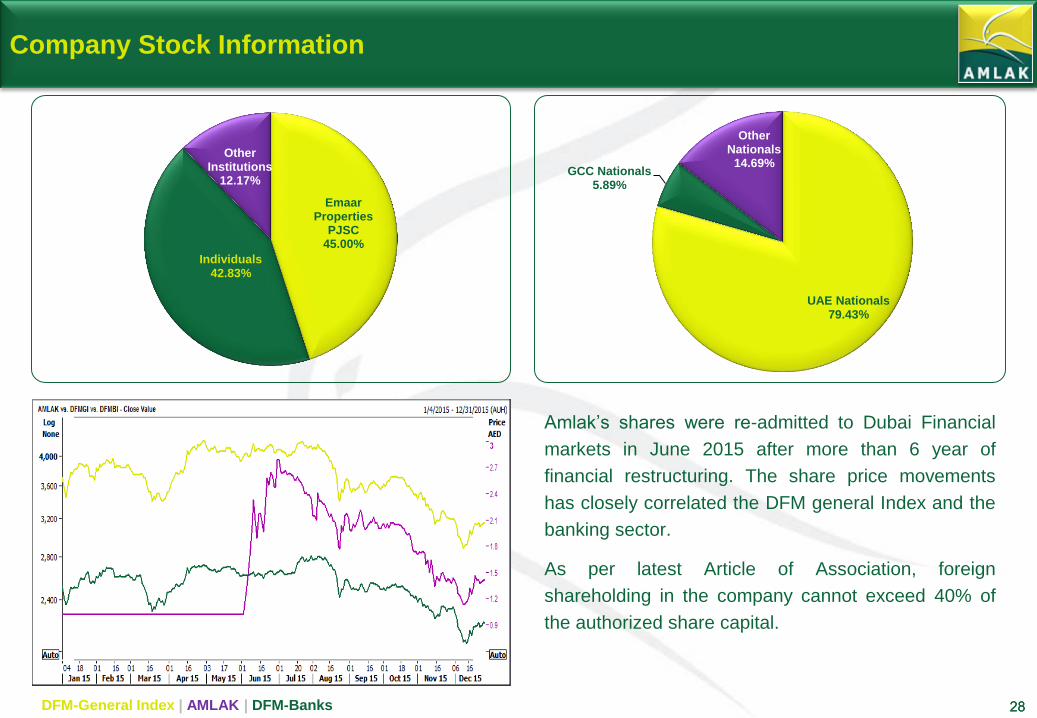
Emaar Properties
PJSC 45.00%
Individuals 42.83%
Other Institutions
12.17%
UAE Nationals 79.43%
GCC Nationals 5.89%
Other Nationals
14.69%
DFM-General Index | AMLAK | DFM-Banks
Amlak’s shares were re-admitted to Dubai Financial
markets in June 2015 after more than 6 year of
financial restructuring. The share price movements
has closely correlated the DFM general Index and the
banking sector.
As per latest Article of Association, foreign
shareholding in the company cannot exceed 40% of
the authorized share capital.

29 29
AWARDS

30
Awards - 2015
30