AML - IAMAI Report on Evolution of Mobile VAS in India 2011-07
76
-
date post
13-Sep-2014 -
Category
Technology
-
view
6.594 -
download
2
description
This summary report document is a word document format of the much larger report that Analysys Mason and IAMAI have prepared. The detailed report is available for purchase on IAMAI’s website – www.iamai.in and is an in-depth guide to each of the specific sub-segments within the mobile value added services ecosystem. Dr. Subho Ray, President IAMAI stated, " This is the first ever study in India which charts the evolution of the mobile value added services industry, maps the future growth potential and makes practical suggestions on what needs to be done by various stakeholders set this industry on a ‘take off’ mode. We are confident that this will become the industry's guide for the next 10 years" This report has focused on the following: • The Indian Mobile VAS Opportunity • Policy and Market Enablers • Key Trends in the Mobile VAS industry in India • Key Growth Areas in Services and Applications • Mobile VAS Industry Growth Forecasts Profiles of the report sponsors are also included at the end of the report, along with profiles of 40 leading players in the Mobile VAS value chain. The key findings of the report are as follows: • Carriers are increasingly focusing on non-voice services to drive revenue growth as voice services become commoditized. During the next five years, VAS ARPU will increase by 48%, which will compensate for the 14% decline in voice ARPU. As a result, overall ARPU will stabilize and decline by only 4.5% between 2011 and 2015. • Mobile data will emerge as the next ‘killer application’, accounting for 32% of total incremental wireless revenue – primarily driven by the latent demand for connectivity, which wireline broadband has been unable to address because of availability issues. • Mobile commerce will represent an INR20 billion revenue opportunity by 2015. • Utility services that can provide a scalable, technology-enabled solution to issues around access to information, opportunity and infrastructure (for example, healthcare, education and agricultural/husbandry advice) can add significant value and, as a result, enhance the value proposition for users – particularly those in rural areas. • Mobile video has been promoted as the key differentiator on 3G networks, but the limited amount of allocated spectrum (5MHz) and associated capacity constraints will limit video-based services in specific segments and geographies.
Transcript of AML - IAMAI Report on Evolution of Mobile VAS in India 2011-07


iiiEvolution of Mobile VAS in India
Dear Reader,
We are delighted to present to you this comprehensive report on the past, present and future of that enigma which is known as the mobile value added services industry in India. In the enclosed pages, we have attempted to lay bare before you the story of the genesis and evolution of this industry, the roadblocks that it faces, and the opportunities that it presents to all stakeholders. More importantly, we have taken much pain to suggest a practical way to put this industry on a virtuous cycle to ensure sustainable progress and to identify the areas that will truly see tremendous growth.
You will appreciate that such a “first of its kind” report cannot be the work of a single group. It is collective effort, and we have benefitted from detailed conversations with and feedback from more than 50 stakeholder organizations including telecom operators, government agencies, mobile value added services companies, handset OEMs, applications developers and, last but not the least, users. We would like to acknowledge our gratitude to all of them.
We should also clarify that what you see before you is a “distilled” version of the much larger report that Analysys Mason and IAMAI have been working on for more than six months. The larger and much more detailed report is prepared almost as a step by step guide to each of the specific sub-segments within the mobile value added services ecosystem. In case you are serious about harnessing the data and services opportunity that the telecom industry presents today, the larger report can be suggested as “essential reading”.
The present version of the report contextualizes the primary question: “What should be done in order for the industry to move ahead?” in the light of “what has been in the past and what can be in the future”. So the focus essentially is on urging stakeholders to collaborate in charting the path forward for the industry. And, in attempting to do so, we have suggested “a particular” way that we believe will be acceptable to all stakeholders. The larger appeal here, obviously, is a call for collective and effective action since this industry cannot flower with an attitude of “more of the same” any longer.
With this report we have set our best foot forward with the best interests of the industry and users, and we sincerely hope you will appreciate the direction that has been outlined.
Thank You.
Dr. Subho RayPresident
Internet and Mobile Association of India
Kunal BajajPartner and Director India
Analysys Mason
FOREWORD

Evolution of Mobile VAS in Indiaiv
Letter [NBED to be provided by IAMAI]List of Sponsors
Platinum Sponsor
Gold Sponsors

Evolution of Mobile VAS in India v
Peer Review Steering CommitteeWe would like to thank the peer review steering committee for dedicating their time to this initiative and helping to identify the key issues to focus on. Producing this report would not have been possible without their inputs and feedback.
• Parag Kar VP, Government Affairs, Qualcomm (India & South Asia)
• PG Ponnapa Chief Executive Officer- India/Asia Pac, MPortal
• Sanjay K Goyal Founder & CEO, ACL Wireless
• Dr. Subho Ray President, IAMAI
• Vijay Shekhar Sharma Chairman & MD, One97
We would like to acknowledge the following people for their extraordinary contributions
• Anand Virani Business Development Lead, Services Ecosystem, Qualcomm (India & South Asia)
• Chirag Jain Vice President - Marketing & Business Development, Webaroo
• Mohit Narain Business Director, ACL Wireless
• Rakesh Mahajan Independent Consultant
Acknowledgements
Evolution of Mobile VAS in Indiavi
1. The Indian non-voice market is at an inflexion point, and the growth opportunity remains significant
We believe that access to relatively higher speed data on HSPA, EVDO and LTE networks, and a renewed focus of carriers on the mobile data opportunity will help drive growth in the Indian non-voice market in the immediate future. We see the foundational elements for such an inflexion point falling in place with improving data access speed, increasing penetration of smartphones and feature-phones as well as increasing maturity of the content ecosystem. The opportunity for growth of non-voice revenues in India remains significant, as has been witnessed in multiple other emerging markets, especially after the introduction of 3G. However, unlike most other markets, India will be a mobile-first market with the latent demand for mobile data being fulfilled by internet access through mobile handsets, tablets and other forms of CCDs (connected computing devices).
2. Similar to other mobile-first markets, mobile internet (handset plus dongles / CCDs) will drive growth in non-voice revenues while traditional services stabilize
As in other mobile-first markets with no legacy infrastructure for internet access, the growth in non-voice revenues in India will be primarily driven by mobile data access. The mix of devices (handsets, dongles and other connected computing devices) driving this market growth will depend on the economics and maturity of the underlying technologies (HSPA, EVDO and LTE). In contrast to growth in the data market, we believe that the share of traditional services will begin to stabilize or decline due to multiple demand and supply side constraints. We believe that SMS penetration will begin to stabilize unless issues around local language on handsets is resolved, while CRBT penetration will stagnate primarily due to
the inability of carriers to drop prices significantly combined with the limited purchasing power of incremental users.
3. However, various market and policy enablers are required in on-deck VAS, off-deck VAS and SMS channels to realize this growth opportunity
As in any rapidly growing ecosystem, there exist operational issues which limit market efficiency and consumer welfare. For the on-deck MVAS delivery model, the issues are centered around the absence of a governing body to address operational issues such as MIS reconciliation and dispute resolution. The issues affecting the off-deck VAS delivery model are structural in nature, with the low penetration of financial instruments such as credit & debit cards resulting in the carrier being the predominant means of reaching and billing mobile subscribers. In addition, there are operational issues around interoperability, with D2C providers required to negotiate bilateral agreements and system integration with individual carriers. Similarly, for the SMS channel, absence of handsets with a common local language standard limits the penetration of SMS, which in turn limits the reach of mobile enabled services to the mass market, including for services like education and health. For the rapid growth of the mobile VAS ecosystem in India, these issues need resolution, either through market mechanisms or by regulatory intervention.
4. From a market perspective, a self-regulating body for settling issues between market participants can be an effective way to address on-deck challenges
For commercial agreements between carriers, who are licensed entities, and mobile VAS providers, who are non-licensed entities, regulatory intervention for monitoring MIS reconciliation and similar such
Executive Summary
Executive Summary vii
operational issues is not feasible. In such a market construct, self-regulation involving all ecosystem participants has been an effective means of addressing contractual issues and commitments, as can be seen for the advertising market in India through the establishment of a body such as the ASCI (Advertising Standards Council of India). We propose that such an industry council should have members from the carrier industry associations such as COAI and AUSPI, mobile VAS provider organizations and other stakeholders as representatives on a governing board. The members of this council will include carriers, handset OEMs, technology platform providers as well as MVAS providers. This board can draft guidelines for MIS reconciliation between mobile VAS providers and carriers to protect the interests of all parties, and can also act as a forum for grievance redressal, and could issue directives for action.
5. From a policy perspective, we believe that following a model of market determined revenue share with no special VAS license is the best route
Multiple models for potentially regulating mobile VAS providers, including bringing them under a licensing framework were evaluated. In the scenario of a licensed mobile VAS provider, the regulator can potentially regulate revenue shares and other interconnection agreements between the carrier and MVAS providers. However, an evaluation of the pros and cons of the licensing model suggests that it will result in significant operational and financial overheads on MVASPs, without the equivalent upside. We also note that even in other emerging markets that have witnessed growth in non-voice revenues, there is no precedent of licensing of MVASPs. Additionally, if revenue shares are regulated through setting a floor, the incentive for MVASPs to innovate to target higher revenue shares gets significantly impacted. We therefore propose that the MVASPs may be kept outside the licensing framework and revenue shares should remain market determined and competitive.
6. We recommend establishing an agency under the direction of TRAI to help address off-deck adoption
issues and facilitate the allocation and management of a central short code registry system
In the current market structure for short codes and premium numbers, a D2C provider needs to negotiate commercial terms with individual carriers and then follow that with system integration before being able to offer a uniformly accessible service by consumers across carriers. In addition, in a majority of the cases, the carrier has a strong influence in determining the end user pricing of the D2C service to preempt cannibalization of its own offerings. Such a model inherently limits consumer choice, and also creates a significant barrier to the growth of the D2C ecosystem.
We recommend that TRAI should establish a Central Short Code (CSC) agency as a licensed entity to be governed by them. Licensing of the CSC agency will allow it to enter into agreements with other licensed entities (cellular service providers). The CSC agency will issue the short code to an MVASP (at a predetermined price), and will communicate the same to all UASL licensees. The carriers will then have to process the activation of these short codes in a pre-defined timeframe, across all circles. This framework can potentially dictate the pricing of off-deck enablers (access, hosting and billing) using a modular approach to the different components involved, allowing VAS providers to choose the access services that they need. The formulation of a “rate card” for the services provided by the carriers can be done by TRAI under the interconnection regime in consultation with carriers through an acceptable methodology (e.g. on a cost plus basis).
7. It is also recommended that a common standard for local language characters should be mandated on all handsets sold in India to facilitate growth in SMS
Since incremental mobile subscribers are coming from semi urban and rural areas, there is a demand for Indian language support on handsets. Various encoding schemes and other mechanisms are currently in use for sharing local language content, but there are interoperability issues across devices. We propose

viii Executive Summary
mandating a standard like the one developed by CeWIT for local language support on device, as well as mandating the incorporation of this standard on all handsets sold in India.
8. Resolution of above issues also becomes imperative for maintaining market efficiency and balance of power in the evolving VAS value chain
The VAS value chain has become significantly complex over the last few years, with the emergence of new service providers such as handset OEMs, new revenue models such as ad-support as well as a shift in the level of control by various participants. With increasing adoption of mobile internet, handset OEMs have been exploring opportunities to offer D2C services and applications through application stores as well as retail channels (mobile banking). In parallel, faced with increasing competition in the voice market, carriers have been exerting their control over the mobile VAS value chain to reduce operating expenses. Some of these initiatives include integrating VAS platforms into the core network, and significantly diluting the role of technology platform providers. This is in turn putting pressure on technology providers to introduce new variants of traditional services such as CRBT, as well as integrate backward to increase their share of the carrier spend on VAS. Initiatives to foster growth of the D2C ecosystem will help maintain market efficiency by introducing further competition and incentivizing innovation.
9. Among the emerging services, we believe that mobile commerce and utility services will have a significant social impact
There have been multiple pilots and stakeholder initiatives for driving adoption of utility services which can provide a scalable, technology enabled solution to existing issues around access to information, opportunity and infrastructure. With the increasing availability of quality data access and better devices, there is an opportunity for service providers to enhance the quality and deepen the penetration of these services in urban as well as rural areas. Among these
services, the most valuable will be services providing a replacement to infrastructure, such as mobile-health, mobile-education and mobile-banking. We believe that carriers are well positioned to make a substantial social impact by leveraging their retail distribution reach and offering banking, payments and domestic remittance services for the urban and rural poor. The only limiting factor in driving the adoption of utility as well as financial inclusion services is the multiple stakeholder partnerships required by carriers in developing the market ecosystem, which necessitates significant effort and time, and sometime reduces speed-to-market for some of these services.
10. Finally, we believe that mobile internet adoption will result in a proliferation of data enabled services and applications around video, advertising, community, entertainment and enterprise mobility
Video has long been hailed as the potential ‘killer application’ on 3G networks, with global 3G carriers offering a portfolio of video based services. However, with limited spectrum allocation in India, we believe that data intensive video applications will remain muted. On the other hand, we believe that penetration of mobile data access in conjunction with rising sales of smartphones and feature-phones will enable the growth of a vibrant applications ecosystem. This will also include social networking and community applications, either as an extension of their online avatars or customized for a mobile-first user base. Some of the business applications will allow enterprises to m-enable their field force and harness the benefits of faster turn-around time and reduced working capital. Finally, data and smartphone adoption will also substantially improve users’ gaming experience and hence adoption, and also foster new business and monetization models for mobile music.

Executive Summary ix


xiEvolution of Mobile VAS in India
Table of Contents
1. The Indian Mobile VAS Opportunity 2
2. Policy Enablers Required for Growth of the
Mobile VAS Ecosystem 8
3. Trends in the Mobile VAS Industry 18
4. Key Growth Areas: Services and Applications 28
5. Forecasts 46
Annexure: Sponsors’ Profiles 54

1. The Indian Mobile VAS Opportunity

2Evolution of Mobile VAS in India
Globally, carriers have witnessed significant growth in mobile non-voice revenues, with a clear dominance of mobile data, especially in markets that have a latent demand for internet connectivity
With voice becoming a commodity across global markets and with carriers focus on non-voice services growing, facilitated by availability of 3G & 4G access technologies, rising penetration of smartphones and a vibrant applications and services ecosystem, the contribution of VAS revenues is increasing across emerging as well as developed markets. Leading carriers in developed and emerging markets have mobile non-voice services contributing to as much as 50% and 35-40% of their total wireless revenues, respectively. While a comparison of India with the developed markets might not be fair, we believe that an understanding of the key trends and drivers of mobile VAS in emerging markets can help better inform the future of the mobile non-voice market in India.
Until now, the introduction of 3G has been one of the inflexion points for adoption of mobile non-voice services, with the exception of markets such as China. A study of seven emerging markets illustrates that after introduction of 3G, the yearly growth in share of non-voice revenues has been dependent on underlying structural parameters such as PC penetration, fixed line base and internet penetration. The share of non-voice revenues is the highest for countries where internet and PC penetration is high – indicating that users have easily translated their fixed online experience onto the mobile. For these illustrative markets, the contribution of non-voice revenues has increased by ~4% per annum from the year of launch of 3G, which is double that for ‘mobile-first’ markets where the PC and internet penetration has been lower at the time of 3G launch, as seen in Figure 1.1.
India is similar to the ‘mobile-first’ markets of Indonesia and South Africa that have witnessed
1. The Indian Mobile VAS Opportunity
Global experience suggests that India has a latent demand for connectivity that can empower it as a ‘mobile first’ data market. While historically, VAS in India lags behind other markets, enablers across the ecosystem (devices, content and access) are now coming together to support a growing demand for mobile data and applications. Supported by these structural enablers, we believe that the mobile VAS industry will hit an inflexion point in the next couple of years. With the right market and policy imperatives, the mobile VAS1 market can grow to an INR 671 bn industry and contribute 31% to overall wireless revenues in 2015
1. In the context of this report, “VAS” and “MVAS” both refer to all services other than voice, and are used interchangeably with the term “non-voice”

3 The Indian Mobile VAS Opportunity
growth in mobile data (within VAS) to address a latent demand for connectivity that was present due to lack of infrastructure and affordability issues. Although the share of non-voice revenues in these markets increases at a relatively lower pace, these
markets have mobile internet access as the primary driver for growth of non-voice revenues, as can be seen in Figure 1.2 for carriers across various emerging markets.
Figure 1.2: Trend of Non-Voice Revenue and Mix (Messaging vs. Data and Others)3
38% 37%
9%
56%
62%52%
91%
44%
11%
Q1 2009 Q1 2009 Q1 2009 Q1 2009
Data Messaging Others
44%53%
24%
63%
56% 35%76%
37%
12%
Q3 2009 Q2 2010 Q1 2010 Q2 2010
30.4% 33.6% 28.0% 30.0% 14.2% 23.4%12.1% 19.4%% of Non –
Voice Revenue
Maxis Vivo Telekomsela Vodacom
Source: © Wireless Intelligence 2011
Figure 1.1: Share of Non-Voice Revenuesa by Carrier for Global Carriers2
0%
15%
30%
45%
60%
Q12005
Q22005
Q32005
Q42005
Q12006
Q22006
Q32006
Q42006
Q12007
Q22007
Q32007
Q42007
Q12008
Q22008
Q32008
Q42008
Q12009
Q22009
Q32009
Q42009
Q12010
China Unicom Vivo, Brazil Globe, PhilippinesSmart, Philippines Maxis, Malaysia AIS, ThailandTelkomsel, Indonesia MTN, South Africa Vodacom, South Africa
Launch of 3G Services
Messaging Driven Market• Messaging dominant markets with
high base of non-voice revenues • Philippines
High Growth post 3G• Markets that have witnessed an
average changec of ~4% per year since 3G
• Malaysia, Brazil
Moderate Growth post 3G• Markets that have witnessed an
average changec of ~2.5% per year since 3G
• S Africa, Indonesia, Thailand & China
1
2
3S Africa: 8.2%, 8.7%
Malaysia: 21.8%, 64.1%
Brazil: ~16%, 45.0%
China: ~4.8%, 28.2%
d
f
e
Legendb: Country: PC Penetration, Internet Penetration
Source: Analysys Mason, © Wireless Intelligence 2011
2. a. Non-voice revenues includes revenue from messaging, data usage and other non-voice related activities; b. PC penetration figures are for 2005 and Internet Penetration figures are as of 2006; c. Average yearly change in share of non-voice revenues (within total revenues); d. China Unicom was considered rather than China Mobile, because the latter launched 3G with TD-SCDMA while the former did so with W-CDMA / HSPA; e. Smart launched 3G services in Q1’06; f. Vodacom launched 3G services in Q4’043. a. For Telekomsel – some share of other VAS included within data

The Indian Mobile VAS Opportunity 4
The mobile data and VAS market in India has been lagging other markets, but is expected to hit an inflexion point in the near future
Unlike the wireless voice market, the growth of non-voice has been slower in India in comparison to other emerging markets, as can be seen from Figure 1.3 for some leading carriers.
Overall consumer experience was one of the prime inhibitors for adoption of mobile VAS in India, which in turn has a number of contributing factors in the form of device feature set, speed of data access, availability of relevant content, and the right end user pricing structure. If we review the trends in these areas in the recent past, it appears that a majority of these constraints will be addressed in the
Figure 1.3: Share of Non-Voice Revenues for Select Carriers in Emerging Markets4
0%
10%
20%
30%
40%
50%
60%
Q1 2009 Q2 2009 Q3 2009 Q4 2009 Q1 2010
Vodacom, South Africa
Maxis, Malaysia
Globe, Philippines
China Mobile, China
Airtel, India
Telekomsel, Indonesia
Vodafone, India
Idea, India
Source: © Wireless Intelligence 2011, Company Reports
4. Non-voice revenues includes revenue from messaging, data usage and other non-voice related activities5. a. Estimated price for entry level plan with unlimited monthly data usage
Figure 1.4: Demand and Supply Side Trends5
51%
65%
2009 2010
Share of GPRS Enabled Handsets in Total Handset Sales
Data (2.5G) Plan Tariffs (INR)a
30
75
CY2008 CY2010
Active Mobile Data (GPRS) Users in India
450
90
2008 2010
The Indian Music Industry Revenues by Component (2010)
41%
49%
10%
1
Digital Music
Physical Music
Others
Source: Analysys Mason, Industry Inputs, FICCI Frames 2010

5 The Indian Mobile VAS Opportunity
next couple of years, and result in a seamless content access and consumption experience for mobile users in India, as seen in Figure 1.4.
• Devices: The emergence of the feature-phone category, which allows a smartphone like experience at affordable prices for mass market consumers, has had a significant impact on adoption of mobile internet. The feature-phone category is being driven by the entry of local Indian handset OEMs, with a data enabled phone available at below INR 2,000. An estimated 65% of devices sold last year were GPRS enabled, up from 51% in 2009, and data enabled devices (both GPRS and 3G) now constitute ~70-80% of the installed handset base. In addition, many of these devices have a QWERTY keyboard, embedded applications, embedded browsers and multimedia capabilities, which as a whole offers a good online experience for mobile first users at an affordable price point.
• Access: The availability of affordable feature-phones is also aided in a significant manner by the introduction of sachet pricing plans for mobile internet, as well as the availability of these services in more than 150,000 villages across India. There are an estimated 100 mn active data users in India as of today, and mobile internet contributes to as much as CRBT revenues for some carriers. Carrier price plans for data are available for as low as INR 48 for a 2GB monthly plan and INR 10 per MB for pay-as-you-go plans6.
Additionally, while network capacity was constrained earlier, the launch of 3G networks is expected to relieve some congestion and offer additional bandwidth for richer mobile applications and services, at least for customers in tier 1 cities and CBDs (Central Business Districts). However, current 3G data pricing is at a premium to 2.5G data pricing and is expected to remain so in the near future, which can limit uptake in the initial years.
• Content: Increasing availability of content for consumers across the board is further helping enrich end user experience. This content includes access to carrier run application stores as well as application stores available on handsets (such as Android, iTunes and Nokia app stores) and independent application stores (such as GetJar). The wide variety of popular applications in the area of entertainment and communication (e.g. music and SNC apps), as well as models which allow for free, ‘freemium’ and paid downloads have helped enhance the utility of mobile devices and quality of engagement with end users. A study conducted by one of the leading handset vendors in India suggests that the most popular apps to download are music (41%), social networking (41%), business (27%), photo / personalization (22%) and games (22%)7. In the non-app segment, music based services (full song download, music streaming and mobile radio among others) have witnessed reasonable adoption, with Indian carriers such as Airtel claiming to be the largest digital music distributor in India8.
• Carrier focus: With the penetration of CRBT stabilizing at about 18% levels, and no significant growth in any other mobile VAS category, mobile internet has emerged as a clear focus area of Indian carriers. In some cases, mobile internet access and tariffs have been leveraged as a differentiator to ramp up subscriber acquisition. With India being a mobile-first market (a recent survey suggests that for over 40% Indians, a mobile is the only means of internet access9), carrier focus and the availability of affordable devices, access and content, the non-voice ecosystem is poised to grow considerably in the coming few years. This is reflected in the fact that mobile data page views have grown an estimated 218% over the last year alone10.
In parallel to the above market enablers, policy enablers will be required to help realize the full potential of mobile VAS in India
6. Carrier Tariffs7. Nokia App Store data, February 20118. As disclosed by Airtel Deputy CEO, May 20099. Survey by Opera, March 201110. Opera Mobile Web report, May 2011

The Indian Mobile VAS Opportunity 6
Mobile VAS has the potential to be an INR 671 bn business by 2015, contributing to 31% of total wireless telecom revenues in India, as can be seen in Figure 1.5.
This growth will largely be driven by India emerging as a ‘mobile first’ market for internet access, with the mobile becoming the primary means of access to the internet for a large section of the population. Thus the contribution from mobile data is expected to reach 54% of total MVAS revenues by 2015 (inclusive of data access revenues from dongles and CCDs – connected computing devices), and emerge as the single largest piece. As an INR 671 bn industry, MVAS also has the potential to have multiple second order impact on areas such as entre-preneurship and employment.
However, this growth is to a certain extent constrained by market inefficiencies, which can be addressed through initiatives by the market participants and the regulator. VAS providers face different types of challenges with on-deck services, off-deck services and local language SMS, some of which are best left
for the market to resolve while others would benefit from policy intervention. On-deck VAS providers at times face hurdles in MIS reconciliation and dispute resolution in addition to skewed revenue shares. Off-deck VAS providers are challenged by a lack of alternate billing mechanisms along with carrier control over pricing and revenue, and delays in premium number integration. Challenges in SMS adoption are mainly due to the lack of a standard encoding scheme for local language SMS and the consequent interoperability issues between handsets.
We believe that there are potential areas of market intervention through self-governance and appropriate policy frameworks which will allow the Indian market to achieve parity with other emerging markets for non-voice services adoption.
Figure 1.5: Mobile VAS Market Potential (INR bn)
213291
480603
671
368
16%18%
27%
31% 31%
22%
2010 2011 2012 2013 2014 2015
VAS Revenue (INR bn) MVAS Share of Total Revenue
Source: Analysys Mason, Industry Inputs
2 Policy Enablers Required for Growth of the Mobile VAS Ecosystem

8Evolution of Mobile VAS in India
2.1. Key issues impeding the growth of MVAS
industry in India
The growth constraints in the on-deck (carrier billed, carrier delivered) and off-deck (D2C delivered, carrier or D2C billed) ecosystems are different and thus need independent resolutions
The on-deck ecosystem works with mobile VAS providers providing platforms and solutions to carriers through a mutually discussed commercial agreement which is not governed by any policy framework. Given the carrier ownership of mobile users and their scale, there always remains a possibility in such transactions for market inefficiencies, which in turn may impact innovation and market development. For off-deck service providers, the bilateral mode of dealing with one carrier at a time for basic services such as short code setup results in significant delay and coordination needs, in addition to separate system integration costs with multiple carriers. For both on-deck and off-deck mobile VAS offerings, we evaluated the potential resolution frameworks to maximize market efficiency and consumer welfare. In addition, there are structural issues such as the lack of local language support across devices which impact the adoption of SMS and related services.
2.2. On-Deck VAS Providers
Given the high level of market inefficiency and carrier control, there is a significant amount of uncertainty in business models for TPEs
The primary issue in the on-deck MVAS space is the absence of a formal dispute redressal mechanism to address potential conflicts such as MIS reconciliation between carriers and mobile VAS providers, which results in payment delays and consequent working capital requirements from smaller mobile VAS providers. This becomes especially important as VAS providers rarely have the negotiating power to deal with carriers, and the commercial arrangements between a carrier and a VAS provider remains outside the purview of TRAI regulation. In addition to this working capital constraint, there is also an element of uncertainty in mobile VAS providers’ revenue due to the carrier-VAS provider collaboration model being based on a revenue share agreement.
Carriers take over 60% of revenue share for most of the mobile VAS offerings. The reason behind such a high revenue share is the cost of their branding, marketing and promotional support for on-deck mobile VAS offerings, in addition to the customer
Growth constraints in the MVAS industry differ between on-deck and off-deck models, and include dispute redressal and data reconciliation, absence of direct consumer billing mechanisms, and lack of pricing control. Further, some services such as SMS face challenges in driving penetration from the lack of regulatory standards on enablers such as local language text. We believe that a policy framework without the requirement for licensing and with market determined revenue shares can help drive the overall growth of the mobile VAS ecosystem
2 Policy Enablers Required for Growth of the Mobile VAS Ecosystem

9 Policy Enablers Required for Growth of the Mobile VAS Ecosystem
care and other such operational costs involved in delivering the services to the end user. In addition, as the primary revenue stream of such mobile VAS providers (TPEs) is dependent on carriers, in cases of a decline in carrier revenue due to increasing competition or the changing nature of demand, the revenues of mobile VAS providers is at risk. More importantly, there have been instances when the carriers have had to reduce revenue shares when they have been under pressure to optimize their operational expenditure, further putting pressure on mobile VAS provider revenues. We understand that this is a business model issue and the risk taken by a mobile VAS provider in a market place, yet this induces a high level of uncertainty in the timing and amount of expected revenues for a mobile VAS provider working with a carrier.
This unpredictability of overall revenue and limited profitability potential has led to limited innovation and platform providers investing in international markets
Due to the unpredictability of their overall revenues, many TPEs are expanding to international markets which offer better revenue shares and also have a
higher level of end user pricing of VAS services. These mobile VAS providers have adopted an organic as well as inorganic expansion route to enter some of the international markets, and for some of the TPEs, more than 30% of their subscribers through carrier and OEM partnerships are from international markets.
The second issue is that many carriers have a relatively higher focus on services which offer immediate revenues and are reluctant to go for ‘capability investing’ models which are innovative but have only a long term monetization potential. This results in limited innovation, with significant focus of carriers on increasing penetration of basic services & restricted investments. This is also leading mobile VAS providers to focus on mass market services as they do not have sufficient funds and incentive to experiment with new offerings for specific niche consumer segments.
Finally, given the high level of control of carriers and the relatively smaller overall market for platform providers, larger international VAS providers have stayed away from the Indian market
Figure 2.1: Revenue Share Range Estimates by Type of MVAS and their Level of Content / Service Differentiation
0%
10%
20%
30%
40%
50%
60%
News Alerts CRBT Celebrity Talk
• Very generic service• No clear differentiator
between providers
• Very popular service, albeit stabilizing now• Network integrated service – harder to
switch providers• Content is important
• Innovative service with high value proposition
• Celebrities are procured by VASP
Source: Analysys Mason, Industry Inputs

Policy Enablers Required for Growth of the Mobile VAS Ecosystem 10
But there have been positive signs from carriers recently as they begin to focus more on non-voice services. This remains true even in the current market scenario with VAS providers offering services / content with differentiation are rewarded with higher revenue shares than VAS providers offering generic services. Figure 2.1 compares the revenue shares in the industry today across generic and differentiated services.
Given this direct impact of revenue shares on innovation, we believe that revenue shares should be left to market forces. There is also no precedent of revenue share regulation in other global markets. Setting a floor for minimum revenue shares will only disincentivize VAS providers from striving for innovation in their offerings.
2.3. Off-Deck VAS Providers
The lack of alternate billing / payment channels has been a significant factor in restricting the growth of off-deck VAS in India
Lack of a direct billing channel, carrier control on
pricing and revenue shares, and delay in access to premium numbers are the core issues hampering the growth of the off-deck / D2C ecosystem in India.
From a technological perspective, WAP / GPRS is the only channel on which services can be offered directly to consumers. TRAI recommendations have protected the open mobile internet model, which does not allow the carrier to block any particular portal.
However, the lack of alternate billing mechanisms results in a carrier controlled off-deck MVAS industry where the off-deck VAS provider has no control over the pricing of his offerings. This has resulted in the price of VAS services being controlled by carriers for on-deck as well as off-deck services, resulting in the price point of these services being fairly constant over the years, as can be seen in Figure 2.2.
The lack of alternate billing / payment channels has resulted in restricted growth of off-deck VAS in India. The absence of mass penetration of alternate payment channels such as credit cards / wallets
Figure 2.2: Carrier Control over Pricing11
10
3
10
15
10
30
3 3
10
15
10
30
0
10
20
30
Voice PremiumSMS
Mono Tone Poly Tone WallpaperDownload
CRBTSubscription
2007 2010
End user Price for Voice and Non-Voice Offerings in India (2007 & 2010)a
161.6
2171.7
1507.5
444.6
722.3
54.0 44.6 42.8 44.6 119.7
0
500
1000
1500
2000
2500
India USA UK China Malaysia
ARPU Game Price
ARPU vs. Price of Popular Game in Different Countries (INR)b
(33%)
(2%)
(3%)
(10%)
(17%)
INR INR
(10 mins call)a
Source: Analysys Mason11. a. For a 10 minute call; 2007 rate assumed at INR 1 per minute, 2009 rate at INR 0.5 paisa per second, Cost of per transaction for SMS, monotone, polytone & wallpaper, monthly subscription for CRBT; b. India (Paid game on Indiatimes), USA, UK, China (Paid game on Apple Apps Store), Malaysia (GamesUnlimited; Maxis games site); Most games in China are cracked & available for free. Number in parenthesis indicates the cost of game as a % of ARPU Number in parenthesis indicates the cost of game as a % of ARPU

11 Policy Enablers Required for Growth of the Mobile VAS Ecosystem
restricts the ability of off-deck VAS providers to directly bill consumers.
Most VAS providers go through carrier billing to increase their reach, and end up sharing a high share (~60-70%) of their revenues with the carrier for use of only the billing channel. This is in sharp contrast to global markets where an off-deck VAS industry thrives in the absence of billing constraints. Global markets such as China, Japan and Korea have a robust D2C ecosystem and the market has benefitted from an early opening of carrier walled gardens to offer easy access to D2C services.
In addition, mobile VAS providers face significant hurdles in activating short codes across multiple carriers, in addition to the high integration cost
For SMS and voice, short code services face several issues from allotment of short code to deployment of services. Individual carrier controlled and maintained short codes make national rollouts a lengthy and complicated process.
Short code services face multiple issues, right from the first step of short code allocation to service
deployment and management. Delays in request processing and allotment of short codes are common within the industry. In addition, since short codes are controlled by the carriers, situations arise where some carriers have allotted short codes, while others have not. In such a situation, services get delayed and sometimes don’t get launched ever.
Even once allotted and deployed, short code services face issues such as arbitrary pricing and blocking of services that are deemed ‘competitive’ by the carrier.
2.4. SMS Adoption
Penetration of SMS users in India is low as compared to other developing markets such as China and Philippines. While very low pricing has been an important factor in such high usage in China and Philippines, another important reason is the availability of standards-based and efficient encoding schemes. In India, less than 10% of the installed base of handsets supports non-Roman characters, which means a large portion of the population is unable to use SMS. Also different handset OEMs use their own proprietary standards for local language text, creating interoperability issues across devices.
Figure 2.3: SMS Penetration, 2010
100%
80%
47%
0%
25%
50%
75%
100%
Philippines China India
Source: Analysys Mason

Policy Enablers Required for Growth of the Mobile VAS Ecosystem 12
Absence of standards based solutions for local language SMS is another challenge to be addressed for growth in SMS users and usage. Complexity of Indic scripts results in relatively high number of characters per word on an average while the inherent efficiency of the Chinese language (average word-length less than 2) overcame the limitations imposed by Unicode (UCS-2) in terms of 70-character size limit. In the case of Philippines, the local languages are written using the Roman script which means that the default 7-bit GSM alphabet can be used (as in the case of English).
Variation in keypad layouts and standards for Indic language support across vendors / devices results in loss of content. This difference creates incompatibility between handsets. Some OEMs are using the coded picture messaging technology for Indian language SMS, which gets limited to specific handsets. These issues have constrained the growth of SMS usage in India. As the number of subscribers from rural areas is growing at a faster rate than in urban areas, the demand for SMS in Indian language is likely to continue to grow.
2.5. Recommendation
There are multiple view points on the potential solutions to these issues, specifically with respect to revenue share regulation. Opinions vary across industry stakeholders on the preferred solutions to address the current issues with the mobile VAS industry. Broadly, there are three positions proposed by different stakeholders:
1. Policy Framework With Market Determined Revenue Shares: The basic premise of this position is that no separate VAS license is required, as it may increase the cost for VAS providers, and negatively impact innovation as smaller VAS providers will have to bear the attendant costs of
a license. In addition, this position also suggests that revenue shares should not be regulated as it directly impacts innovation by guaranteeing a minimum level or constraining services to a maximum, and are therefore best left to market forces. Recent deals and market movements demonstrate that innovation is being rewarded.
Proposed Solution: Includes formation of a self-regulated industry forum, similar to the Advertising Standards Council of India, ASCI to govern the mobile VAS sector. Such a body can provide industry representation and a formal dispute redressal mechanism for supporting the on-deck ecosystem in addressing the challenges of MIS reconciliation and dispute redressal. This will also be supported by the formation of a premium number policy which will govern the operation of short codes and rates of inter-connection to help in promoting the off-deck ecosystem.
2. Licensing with Market Determined Revenue Shares: This position supports a broad licensing framework for the VAS industry, but allows revenue shares to be determined by market forces. The basic premise is that licensing will ensure that the VAS industry gets support on critical issues such as MIS reconciliation and dispute resolution, although business terms such as revenue shares would remain part of the commercial agreements between entities and therefore left to market forces.
Proposed Solution: Development of a mobile VAS licensing framework that will regulate MIS reconciliation, address dispute resolution and other issues, but will leave revenue shares to market participants. All VAS providers would be required to acquire a license.
13 Policy Enablers Required for Growth of the Mobile VAS Ecosystem
3. Licensing with Policy Determined Revenue Shares: This position supports a focused licensing regime for VAS providers, including regulation of minimum revenue shares. The basic premise is that revenue share remains a critical issue in the ecosystem and with the regulation of revenue shares other operational issues such as MIS reconciliation will also get addressed.
Proposed Solution: Development of a VAS licensing framework that will specify a minimum revenue share, in addition to regulating MIS reconciliation, dispute resolution and other aspects. All VAS providers would be required to acquire a license.
While licensing is potentially an option to address these issues, licensing by itself does not guarantee a solution. Based on carrier and service provider submissions, the pros of licensing can be enumerated as follows12:
• Licensing will ensure that the VAS industry gets support on critical issues such as MIS reconciliation and dispute redressal.
• Licensing would allow the sector to become more organized and formalised.
• It would also allow VASPs to come under inter-connection regulation and thus access carrier services in a timely fashion with guaranteed QOS, and without the threat of being blocked.
• It would also rate players in the VAS space for their compliance with best practices and standards set by TRAI and others. Coupled with information disclosure measures, this would help in improving market functioning and dispute redressal.
However, licensing may not be the best solution for these issues as it comes with additional administrative and financial requirements, as listed below:
• Licensing will result in high costs, including license fee payments, and delays in processes as
Govt approvals would be required.
• Innovation will be hindered as launching a new VASP will require acquiring a license. Given the nature of work in development of VAS services, it is important that small entrepreneurs get the flexibility and encouragement that is necessary to drive innovation.
• Increased overheads resulting from reporting requirements can inhibit the growth of smaller companies and increase costs for the ecosystem.
The absence of any licensing framework in other emerging markets which have witnessed a high adoption of VAS supports the first option of not having a license. However, these markets had the benefit of legacy structure and infrastructural enablers such as alternate billing mechanisms (high penetration of credit and debit cards), high smartphone penetration, higher internet penetration and established 3G networks. If policy intervention can help put these structural enablers in place, then the Indian mobile VAS ecosystem can also prosper without a licensing and regulatory framework.
Our recommendations to the regulatory approach are as follows:
1. We believe that revenue shares are best left to market forces, given their direct impact on innovation
Revenue shares are a business discussion between two commercial entities and should be determined by the value placed by the carrier on the differentiated nature and monetization potential of the service offered by a mobile VASP. Such a commercial model should help reward new and innovative offerings, while commoditized services are compensated differently.
2. The formation of an industry self-governing board that can act as a formal forum for
12. Response to the TRAI VAS consultation paper 2011
Policy Enablers Required for Growth of the Mobile VAS Ecosystem 14
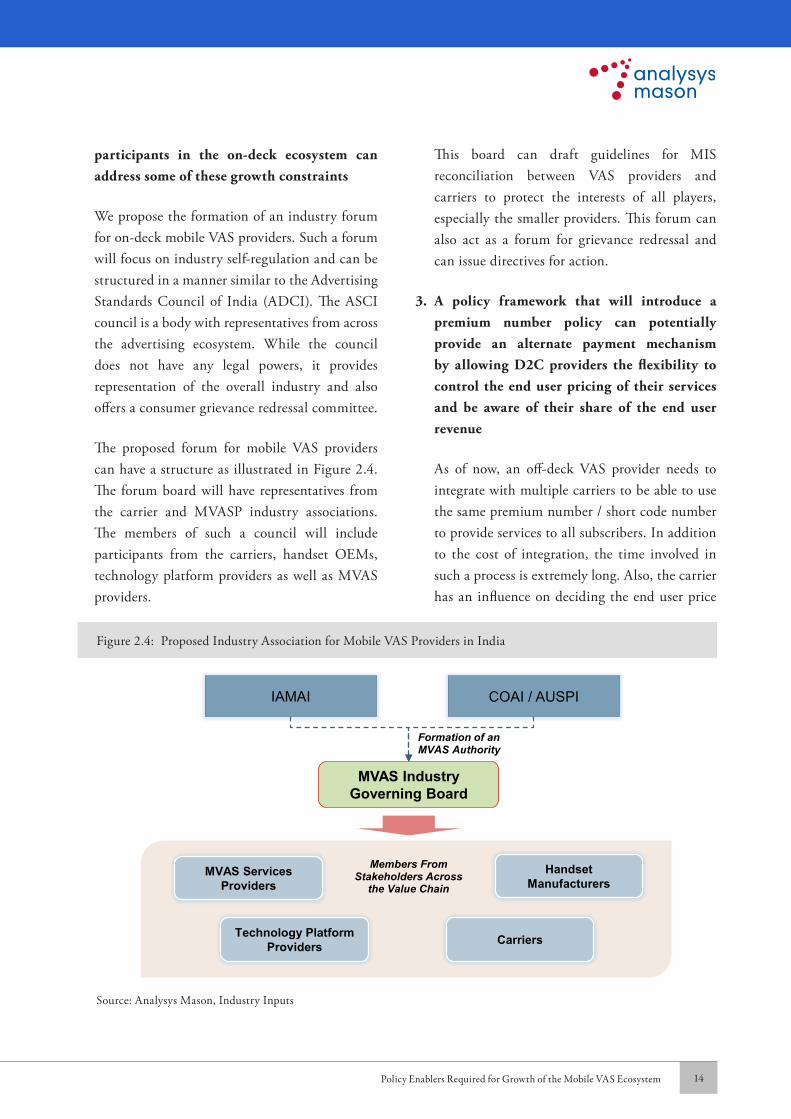
participants in the on-deck ecosystem can address some of these growth constraints
We propose the formation of an industry forum for on-deck mobile VAS providers. Such a forum will focus on industry self-regulation and can be structured in a manner similar to the Advertising Standards Council of India (ADCI). The ASCI council is a body with representatives from across the advertising ecosystem. While the council does not have any legal powers, it provides representation of the overall industry and also offers a consumer grievance redressal committee.
The proposed forum for mobile VAS providers can have a structure as illustrated in Figure 2.4. The forum board will have representatives from the carrier and MVASP industry associations. The members of such a council will include participants from the carriers, handset OEMs, technology platform providers as well as MVAS providers.
This board can draft guidelines for MIS reconciliation between VAS providers and carriers to protect the interests of all players, especially the smaller providers. This forum can also act as a forum for grievance redressal and can issue directives for action.
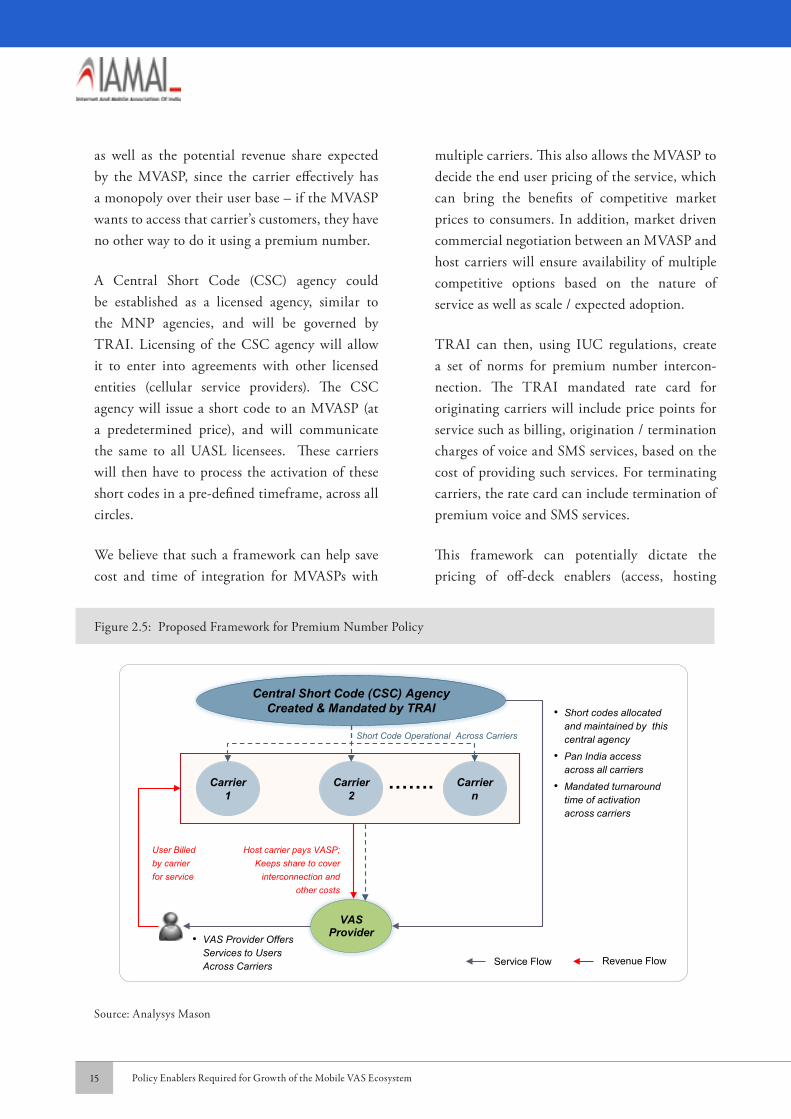
3. A policy framework that will introduce a premium number policy can potentially provide an alternate payment mechanism by allowing D2C providers the flexibility to control the end user pricing of their services and be aware of their share of the end user revenue
As of now, an off-deck VAS provider needs to integrate with multiple carriers to be able to use the same premium number / short code number to provide services to all subscribers. In addition to the cost of integration, the time involved in such a process is extremely long. Also, the carrier has an influence on deciding the end user price
Figure 2.4: Proposed Industry Association for Mobile VAS Providers in India
MVAS Industry Governing Board
IAMAI COAI / AUSPI
MVAS Services Providers
Technology Platform Providers Carriers
Formation of an MVAS Authority
Members From Stakeholders Across
the Value Chain
Handset Manufacturers
Source: Analysys Mason, Industry Inputs
15 Policy Enablers Required for Growth of the Mobile VAS Ecosystem
as well as the potential revenue share expected by the MVASP, since the carrier effectively has a monopoly over their user base – if the MVASP wants to access that carrier’s customers, they have no other way to do it using a premium number.
A Central Short Code (CSC) agency could be established as a licensed agency, similar to the MNP agencies, and will be governed by TRAI. Licensing of the CSC agency will allow it to enter into agreements with other licensed entities (cellular service providers). The CSC agency will issue a short code to an MVASP (at a predetermined price), and will communicate the same to all UASL licensees. These carriers will then have to process the activation of these short codes in a pre-defined timeframe, across all circles.
We believe that such a framework can help save cost and time of integration for MVASPs with
multiple carriers. This also allows the MVASP to decide the end user pricing of the service, which can bring the benefits of competitive market prices to consumers. In addition, market driven commercial negotiation between an MVASP and host carriers will ensure availability of multiple competitive options based on the nature of service as well as scale / expected adoption.
TRAI can then, using IUC regulations, create a set of norms for premium number intercon-nection. The TRAI mandated rate card for originating carriers will include price points for service such as billing, origination / termination charges of voice and SMS services, based on the cost of providing such services. For terminating carriers, the rate card can include termination of premium voice and SMS services.
This framework can potentially dictate the pricing of off-deck enablers (access, hosting
Figure 2.5: Proposed Framework for Premium Number Policy
Central Short Code (CSC) AgencyCreated & Mandated by TRAI
Carrier 1
Carrier n
Carrier 2
…….
VAS Provider
• Short codes allocated and maintained by this central agency
• Pan India access across all carriers
• Mandated turnaround time of activation across carriers
• VAS Provider Offers Services to Users Across Carriers
User Billed by carrier for service
Short Code Operational Across Carriers
Host carrier pays VASP; Keeps share to cover
interconnection and other costs
Revenue FlowService Flow
Source: Analysys Mason

Policy Enablers Required for Growth of the Mobile VAS Ecosystem 16
and billing) using a modular approach to the different components involved, allowing the VAS providers to choose the access services that they need. The formulation of this “rate card” for the services provided by the carriers can be done by TRAI in consultation with the carriers through an acceptable methodology (e.g. on a cost plus basis).
4. Standardization of character set and incorporation of local language support on device can be a potential enabler to drive SMS penetration
We propose mandating a standard like the CeWIT developed standardized solutions for local language support on device, which has been approved by GSMA. As incremental mobile subscribers are coming from semi urban and rural areas, there is a demand for handsets with Indian language support. Various encoding schemes and other mechanisms such as Unicode
(UCS-2), ISCII and picture messaging are currently in use for sharing local language content, but these solutions are not interoperable across devices. In 2008, 3GPP, the body for global mobile telephony standards, amended the SMS standards to accommodate a request from Turkey to support the full Turkish alphabet. Identifying a standardized set of characters of local language fonts in partnership with the industry will provide the key inputs for deciding the Indic 7-bit encoding format, simplified Indic keypad design (to make user adoption easy) and memory efficient font libraries (critical for distribution and field support).
In addition to the standard solution for local language encoding schemes, we propose mandating the incorporation of local language text on all handsets sold in India. This enforcement on handset vendors will provide better reach and awareness as devices are replaced over time.
Figure 2.6: Proposed Transaction Model for Premium Number Policy
Central Short Code (CSC) AgencyCreated & Mandated by TRAI
Carrier 1
Carrier 2
VAS Provider
• Short codes allocated and maintained by this central agency
• Short code will be accessible Pan India across all carriers
• Mandated turnaround time of activation across carriers
Carrier 1 Subscriber
Sends SMS to the premium code of VAS provider A
INR a-b-c
INR b
Keeps price as per the rate card for: • Origination /
Termination charges (INR b)
• Billing – includes customer care cost(INR c)
As per commercial
negotiations
Originating Flow
Termination Flow
• Selects a carrier for hosting based on the best rate offered for hosting and commercial deal
End user price (INR a)
Source: Analysys Mason

3 Trends in the Mobile VAS Industry
18Evolution of Mobile VAS in India
3.1. Mobile Data
A majority of the incremental growth in Mobile VAS revenues is expected to come from mobile data, including mobile handset and dongle / CCD usage. The contribution of mobile data to total MVAS revenues is expected to increase from 34% in 2010 to 54% by 2015
The adoption of mobile handset data has been traditionally constrained due to well-known reasons of 2.5G network capacity and handset capabilities resulting in a sub-optimal user experience. With some of the new entrants using mobile handset data as a differentiator to acquire users as well as availability of GPRS/EDGE enabled feature-phones and basic phones at reasonable price points (< INR 2,000), the mobile handset user base has been increasing. Carriers are reported to have provisioned or enhanced GPRS capacity in more than 150,000 villages in India, which can provide mobile data access to a large share of the Indian population.
In addition to network, handset OEMs are also using mobile internet based community and
utility applications to differentiate and position their offerings. Community applications which are proprietary to handset OEMs (e.g. BlackBerry Messenger), as well as aggregation of multiple online community applications on devices (e.g. Facebook, Twitter and Orkut) by local as well as global handset OEMs have provided a strong use case for end users, especially the youth population, to opt for a mobile internet connection. Such data enabled handsets are increasingly becoming the norm, and accounted for about 65% of handset sales in 2010. Data enabled feature phones can also drive mid-level users to use mobile data. Figure 3.1 illustrates a case study where a carrier has been able to drive their mobile data usage among low end users through effective usage and implementation of widgets.
Also, the price points at which these data plans are available today are also decreasing significantly, with some carriers offering 6GB data for INR 100. Although it’s a perceived value pricing model given that a user generally consumes 100 to 300 MB of data per month (depending on the type of device), still the overall price per MB for handset data has
The past couple of years have witnessed structural changes in the mobile VAS value chain with the uptake of mobile data facilitating the entry of handset OEMs and OTT service providers for offering D2C services to end users. We expect this trend to continue and mobile data to emerge as a pre-dominant driver for non-voice services, counterbalancing the stabilizing penetration of traditional services such as CRBT and P2P SMS. In addition, emerging services such as mobile commerce and mobile advertising are also offering an opportunity to carriers to generate revenues from brands, government and other ecosystem participants. As the D2C ecosystem grows, we expect carriers to focus more on traditional network dependent services
3 Trends in the Mobile VAS Industry

19 Trends in the Mobile VAS Industry
reduced significantly. In addition, with introduction of sachet plans and pay per site models, the entry barrier for a mass market user to experience internet on mobile has come down.
Finally, with the stabilizing penetration of CRBT and the absence of any killer application on 2G/2.5G as well as 3G, mobile internet access is going to be a key revenue focus for carriers. Video was expected to be the primary differentiator for 3G based offerings, however with the limited amount of allocated spectrum (5 MHz) and associated capacity constraint; video based services will be limited to certain segments and geographies, atleast in the initial stages of rollout.
In addition to handset data, dongles, tablets and embedded laptops will also account for a major section of the mobile internet revenue. As of now, the large screen market has been driven by EVDO service providers with their advantages in capacity and per unit economics as compared to WCDMA / HSPA providers. We believe that large screen data
will continue to grow for the next few years as currently the networks are empty and can support non-linear growth in dongle data traffic. However, in the long term we believe dongles will become an accessory and carrier focus will shift to monetizing handset based data for optimum asset utilization and efficiency. Data access through dongles, data cards and CCDs contributes about 66% of mobile internet revenue in 2010, which declines to 41% by 2015 as majority of the new users in this segment subscribe to pre-paid mode of payment at lower spend levels, thus pulling down the ARPU.
Given these enablers, we believe that mobile data uptake is close to an inflection point. As a parallel, it might benefit to look at China. Over the last three years, data contributed 50%13 to the incremental revenues for the Chinese wireless telecom industry. Although internet penetration in China is significantly higher than India (28% opposed to 6%13), which aids the migration of a user from PC to the mobile for internet usage. We believe that even for India there is a latent demand for mobile
Figure 3.1: Case Study: Driving Data Usage on Feature Phones
Situation• Cricket Communications is a carrier in the US that follows a cost
leadership strategy
• Customer base is largely in the lower income groups, and from ethnic groups
• Discretionary income is scarce and economic climate unfavorable for the users to spend on mobile web
Complication• Cricket wanted to grow the overall value in the segment, through moving
users to high revenue generating plans that included the mobile web
• They also wanted to meet their goal of add-on services and needed a way of making it easier for users to purchase downloads on their devices
• Focus on the value segment also limited the type of devices that Cricket could offer to it’s users
mPortal Solution• Widgets provided the perfect solution as they can be easily integrated
into the home screen while allowing users easy access and high level of customization
• They can be ported across multiple handset platforms and can include distribution strategies / storefronts that can help drive downloads
• mPortal announced the availability of MyHomeScreen on five handsets in Oct 2009
Cricket MyHomeScreen Handset Rollout
-
200
400
600
800
1,000
1,200
Jun-09 Jul-09 Aug-09 Sep-09 Oct-09 Nov-09 Dec-09 Jan-10
Wid
get S
ubsc
riber
s (‘0
00)
Cricket A300
(November)
Cricket A200
(Sect 22)
MotorolaVE465
(September 1)PCD
TXTM8(July 22)Samsung
My Shot(June 11)
MessagerII
(August 27)
Source: mPortal, Analysys Mason
13. Credit Suisse report on India Telecoms Sector dated 23 May 2011
Trends in the Mobile VAS Industry 20
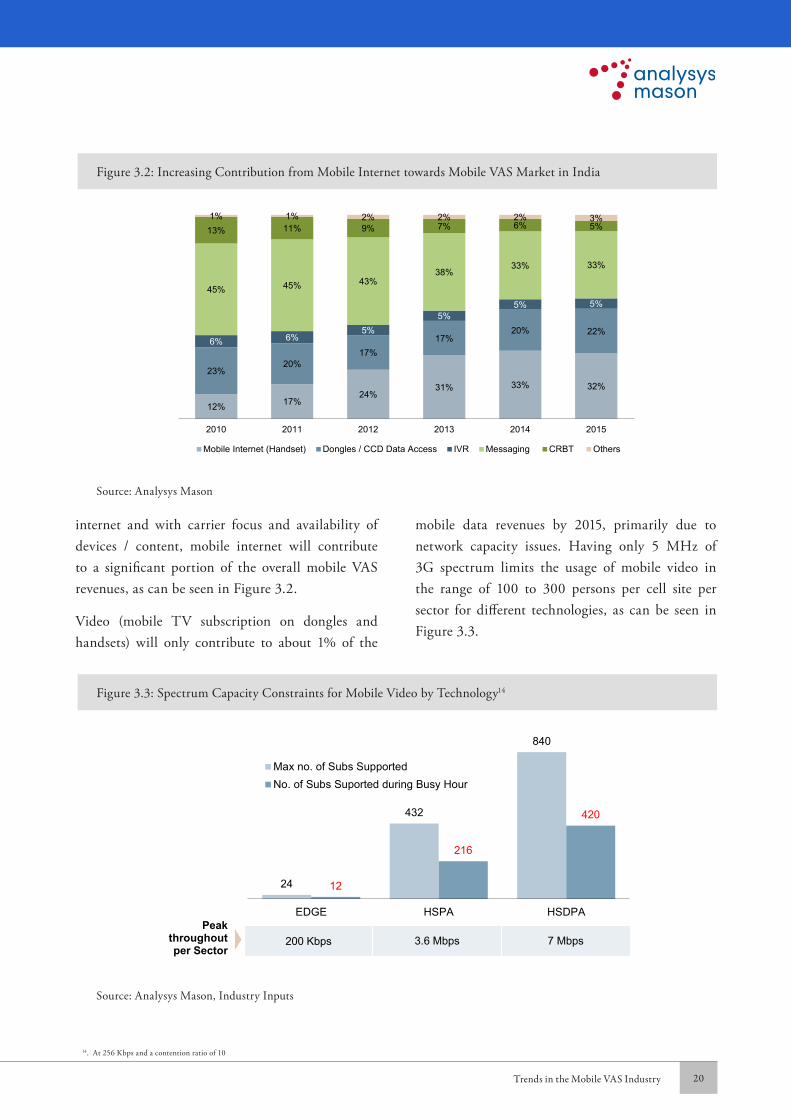
internet and with carrier focus and availability of devices / content, mobile internet will contribute to a significant portion of the overall mobile VAS revenues, as can be seen in Figure 3.2.
Video (mobile TV subscription on dongles and handsets) will only contribute to about 1% of the
mobile data revenues by 2015, primarily due to network capacity issues. Having only 5 MHz of 3G spectrum limits the usage of mobile video in the range of 100 to 300 persons per cell site per sector for different technologies, as can be seen in Figure 3.3.
Figure 3.2: Increasing Contribution from Mobile Internet towards Mobile VAS Market in India
12% 17%24%
31% 33% 32%
23%20%
17%17%
20% 22%6% 6%
5%5%
5% 5%45% 45% 43%
38%33% 33%
13% 11% 9% 7% 6% 5%1% 1% 2% 2% 2% 3%
2010 2011 2012 2013 2014 2015
Mobile Internet (Handset) Dongles / CCD Data Access IVR Messaging CRBT Others
Source: Analysys Mason
Figure 3.3: Spectrum Capacity Constraints for Mobile Video by Technology14
24
432
840
12
216
420
EDGE HSPA HSDPA
Max no. of Subs SupportedNo. of Subs Suported during Busy Hour
200 Kbps 3.6 Mbps 7 MbpsPeak
throughout per Sector
Source: Analysys Mason, Industry Inputs
14. At 256 Kbps and a contention ratio of 10

21 Trends in the Mobile VAS Industry
Given these constraints on capacity and no indication on future allocation of spectrum, we believe that although there is a demand for video, mobile video offerings will gain traction only in the medium term.
3.2. CRBT
CRBT penetration is expected to stabilize given poor per unit economics, discovery issues and limited carrier focus
CRBT has been a major contributor to non-voice revenues for Indian carriers and has reached penetration levels of 18 to 20%. However, this still remains low as compared to the penetration of CRBT in other markets such as China, where penetration had reached 68% for China Mobile in 2007, although the China user base includes a high proportion of passive users who subscribe to a service package for discounted voice tariff and get the CRBT service bundled within the package. Guangdong Mobile, the first provincial carrier which adopted CRBT in China and achieved a high CRBT penetration of 80% in Q1 2007, saw the penetration start to decline, falling to 75% by Q3 2007. This was also driven in part by consumer’s access to rich multimedia content such as video.
In India, industry inputs indicate that the penetration will not reach such high levels and will remain constrained mainly due to service affordability issues. In the last four years, except for selective circle level promotions, the price of a CRBT subscription and song change has remained relatively stable. In addition to the fact that it remains a network dependent service which can only be offered to a consumer by its own carrier, there are boundary conditions on per unit economics which make it unviable for carriers to reduce the price point of these services across the board beyond a certain point.
The acquisition cost for a CRBT customer is
estimated to be INR 20-25, with tele-calling, OBD and other marketing communication accounting for a bulk of the costs. The primary issue is the high level of churn associated with the CRBT service, with an average customer lifetime of only 40 days. The average realized revenue per user over this life time is estimated to be INR 25-28, and after payout for content (~INR 5), the net revenue is only INR 20 – 23. This results in an EBITDA margin of INR 3 – 8 for subscription and INR 0 – 2 for a song change, as can be seen in Figure 3.4.
For the existing base, where the affordability constraint is not applicable, we believe that CRBT has almost reached the maximum penetration. Given that the ARPU from incremental users in India is extremely low (ARPU of ~ INR 80) and they are not very technology savvy, there are service discovery and affordability constraints in adopting CRBT for new subscribers.
Given these constraints, we believe that CRBT penetration is likely to peak at 18% of the base, and might even decline over the next few years.
3.3. Messaging
Messaging (P2P SMS) may peak in terms of penetration over the next year, but usage within the target consumer segments will potentially increase
P2P SMS constitutes around 38% of the overall mobile VAS market in India, with an estimated 47% penetration of the user base in 2010. The penetration is primarily limited by end user literacy and comfort in using English language as well as Roman characters. The price of P2P SMS has come down over time, but the price point of an SMS is 60% higher than a one minute voice call (local), unless the end user opts for a SMS pack. Until local language support becomes easily available on handsets and interoperable across carriers, it will be difficult to increase SMS penetration on the overall

Trends in the Mobile VAS Industry 22
base significantly. Less than 10% of the installed base of handsets supports non-Roman characters in India. Standardization of character set and incorporation of local language support on device can drive SMS penetration.
We believe that although SMS penetration will
stabilize, but the usage within certain penetrated segments will continue to grow. This is especially true for teens and youth segment of the Indian user base. A comparison of teenage texting behavior between teens in urban India and the US (as shown in Figure 3.5) indicates that the usage behavior is not very
Figure 3.4: CRBT: Per Unit Economics15
40 days
INR 20-25
Average Duration of CRBT User
User May Drop Off Due to Low
Balance
User May or May Not Renew On
Their Own
INR 3 - 8
• Revenue realized per user on subscription is only INR 3 – 8; and as low as INR 2 for song change
• OBD calls cost ~ INR 12-13 for each user
• Other acquisition costs accrue upto INR 8-12
• New Song:• ~ INR 5 is the avg. payout
per download
Source: Analysys Mason, Industry Inputs
Figure 3.5: SMS Usage and Behavior Trends in the US and Urban India, 2010
38%
76%
54%
72%
2,500
3,339
US India
Teens Using SMS Daily
Teens Using SMS
Average SMS Sent / Received per Teen
per Month
Source: Pew Research, Nielsen, Assocham, Analysys Mason
15. Estimates made on the basis of industry inputs

23 Trends in the Mobile VAS Industry
different. Teens in both urban India and the US are emerging to be avid users of text messaging – to keep in constant touch with their friends. We believe that usage of SMSs will continue to significantly increase in this segment – for communication as well as A2P VAS services.
On a per user basis, there is still potential for SMS, and SMS based services to grow in India. Figure 3.6 compares the average text messages per user per month (2009) across countries.
Countries such as the USA have witnessed significant growth in the usage of text messaging from an average of 8 SMS per user per month in 2003 to 408 SMS per user per month in 200916 – driven mainly by add-on packages for SMS where users get unlimited text messaging for a flat monthly fee.
The only foreseeable threat to increasing SMS usage in this segment is the increasing proliferation of mobile phone based Instant Messaging (IM) services. IM usage in countries such as the US is slowing down the growth of text messaging for carriers in recent quarters. We expect IM to grow within this youth segment in India as well, given the popularity of applications such as BBM and WhatsApp. However, we don’t yet expect IM to cannibalize text messaging segment within the youth, and believe that both IM and messaging will grow significantly in parallel in this segment.
3.4. Emerging Value Chain
In addition to the above service-specific trends, there are structural shifts within the mobile VAS value chain which can potentially have a long term impact
Figure 3.6: Average Text Messages Sent Per User Per Month for the Top Ten Countries
609
408
259215 196 193
158 155 138113
Philippines USA Malaysia Korea Venezuela Ireland Denmark Lithuania Portugal Indonesia
• Cheaper than voice calls• Ecosystem for a range of services on SMS
• Flat rate add-on packs for SMS, with unlimited messaging
Source: ictDATA.org, Analysys Mason
16. ictDATA.org
Trends in the Mobile VAS Industry 24
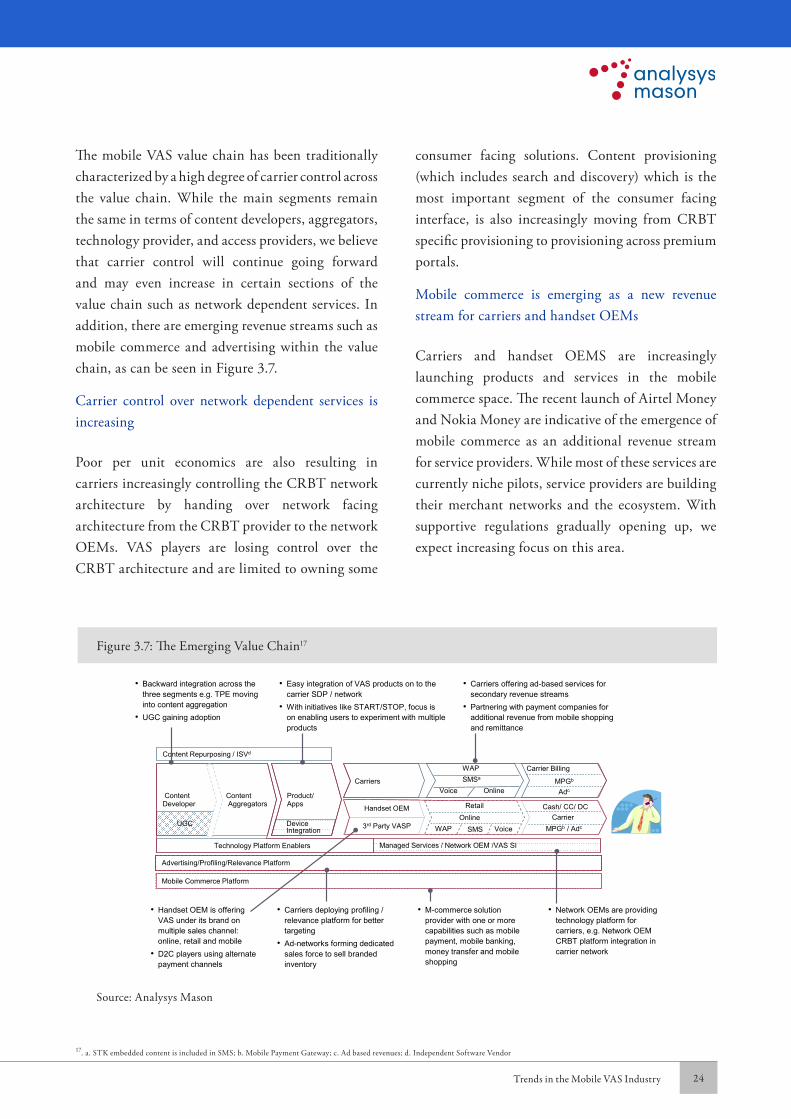
The mobile VAS value chain has been traditionally characterized by a high degree of carrier control across the value chain. While the main segments remain the same in terms of content developers, aggregators, technology provider, and access providers, we believe that carrier control will continue going forward and may even increase in certain sections of the value chain such as network dependent services. In addition, there are emerging revenue streams such as mobile commerce and advertising within the value chain, as can be seen in Figure 3.7.
Carrier control over network dependent services is increasing
Poor per unit economics are also resulting in carriers increasingly controlling the CRBT network architecture by handing over network facing architecture from the CRBT provider to the network OEMs. VAS players are losing control over the CRBT architecture and are limited to owning some
consumer facing solutions. Content provisioning (which includes search and discovery) which is the most important segment of the consumer facing interface, is also increasingly moving from CRBT specific provisioning to provisioning across premium portals.
Mobile commerce is emerging as a new revenue stream for carriers and handset OEMs
Carriers and handset OEMS are increasingly launching products and services in the mobile commerce space. The recent launch of Airtel Money and Nokia Money are indicative of the emergence of mobile commerce as an additional revenue stream for service providers. While most of these services are currently niche pilots, service providers are building their merchant networks and the ecosystem. With supportive regulations gradually opening up, we expect increasing focus on this area.
17. a. STK embedded content is included in SMS; b. Mobile Payment Gateway; c. Ad based revenues; d. Independent Software Vendor
Figure 3.7: The Emerging Value Chain17
Product/ Apps
ContentAggregators
Carriers
Technology Platform Enablers
Retail
Advertising/Profiling/Relevance Platform
Mobile Commerce Platform
Content Repurposing / ISVd
OnlineHandset OEM
3rd Party VASP WAP SMS
Content Developer
UGC Device Integration
CarrierCash/ CC/ DC
MPGb / AdcVoice
• Backward integration across the three segments e.g. TPE moving into content aggregation
• UGC gaining adoption
• Easy integration of VAS products on to the carrier SDP / network
• With initiatives like START/STOP, focus is on enabling users to experiment with multiple products
• Carriers offering ad-based services for secondary revenue streams
• Partnering with payment companies for additional revenue from mobile shopping and remittance
• M-commerce solution provider with one or more capabilities such as mobile payment, mobile banking, money transfer and mobile shopping
• Carriers deploying profiling / relevance platform for better targeting
• Ad-networks forming dedicated sales force to sell branded inventory
• Network OEMs are providing technology platform for carriers, e.g. Network OEM CRBT platform integration in carrier network
Managed Services / Network OEM /VAS SI
Carrier Billing
MPGb
Adc
• Handset OEM is offering VAS under its brand on multiple sales channel: online, retail and mobile
• D2C players using alternate payment channels
VoiceSMSa
Online
WAP
Source: Analysys Mason
25 Trends in the Mobile VAS Industry
Mobile advertising is emerging as an alternative monetization model for D2C providers
The adoption of mobile advertising has been muted in the last few years, despite a lot of initiatives by market participants, including carriers. Going forward, we believe that with the launch of 3G services, smartphones and more importantly, profiling and targeting will help drive the ecosystem. This could potentially emerge as an alternate revenue stream from third parties such as brands and also offer an avenue to D2C providers to offer ad supported content and services.
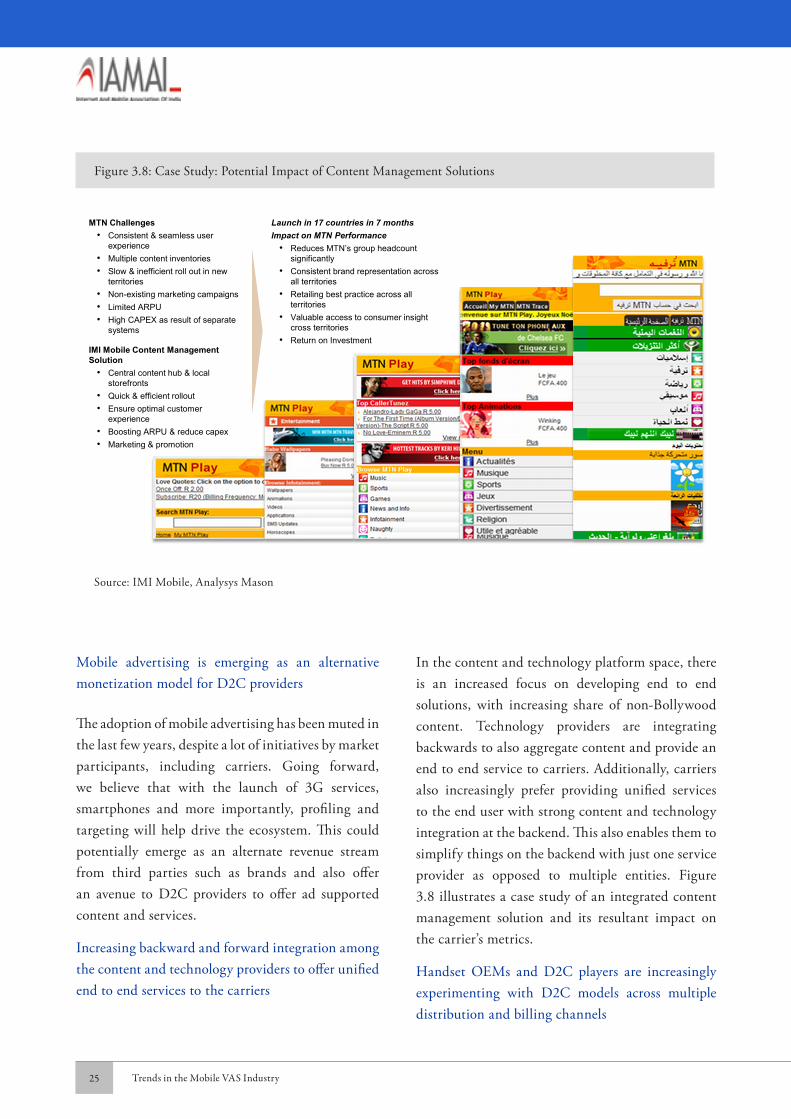
Increasing backward and forward integration among the content and technology providers to offer unified end to end services to the carriers
In the content and technology platform space, there is an increased focus on developing end to end solutions, with increasing share of non-Bollywood content. Technology providers are integrating backwards to also aggregate content and provide an end to end service to carriers. Additionally, carriers also increasingly prefer providing unified services to the end user with strong content and technology integration at the backend. This also enables them to simplify things on the backend with just one service provider as opposed to multiple entities. Figure 3.8 illustrates a case study of an integrated content management solution and its resultant impact on the carrier’s metrics.
Handset OEMs and D2C players are increasingly experimenting with D2C models across multiple distribution and billing channels
Figure 3.8: Case Study: Potential Impact of Content Management Solutions
Launch in 17 countries in 7 monthsImpact on MTN Performance
• Reduces MTN’s group headcount significantly
• Consistent brand representation across all territories
• Retailing best practice across all territories
• Valuable access to consumer insight cross territories
• Return on Investment
MTN Challenges• Consistent & seamless user
experience• Multiple content inventories• Slow & inefficient roll out in new
territories• Non-existing marketing campaigns• Limited ARPU• High CAPEX as result of separate
systems
IMI Mobile Content Management Solution
• Central content hub & local storefronts
• Quick & efficient rollout• Ensure optimal customer
experience• Boosting ARPU & reduce capex• Marketing & promotion
Source: IMI Mobile, Analysys Mason

Trends in the Mobile VAS Industry 26
Carriers still remain the dominant consumer access channel due to their control over billing. Increasingly, handset OEMs and D2C players are experimenting with D2C models across multiple distribution and billing channels. However, bypassing carrier billing to monetize through credit cards has seen only limited success so far, with handset OEM app stores increasingly integrating carrier billing as an option.
While revenue shares haven’t changed much in favor of the VAS providers, these shifts in the value chain will eventually lead to a more equitable power and revenue distribution across the value chain.

4 Key Growth Areas: Services and Applications

28Evolution of Mobile VAS in India
4.1. Introduction to themes
Based on the above trends in the overall mobile VAS market, as well as the structural changes in the value chain, we have identified nine themes which
we believe will have a significant role in shaping the mobile VAS ecosystem in India in the coming years (Figure 4.1).
Within the consumer mobile VAS business we
As the VAS ecosystem develops, we focus on some of the critical industry growth themes to better understand their available opportunity, critical success factors and emerging business models. Some of these themes such as advertising, entertainment, applications, video and enterprise mobility have strong underlying linkages to the growth in data services, in addition to availability of devices and sufficient spectrum. Mobile commerce and utility services will leverage multiple bearer channels and have a significant potential to add value to the urban and rural mass market customers through financial inclusion and access to information, opportunities and infrastructure. However, a majority of these services will require carriers to forge new partnerships and invest a significant amount of effort before they reach significant scale and monetization potential
4 Key Growth Areas: Services and Applications
Figure 4.1: List of Key Themes and Trends within Each
Category Current Situation Key Trends
Category Themes
1
Consumer VAS
• Commerce • Current scalable models use prepaid cards, and not mobile; pilots by carriers, banks, D2C
• UID accepted as KYC will increase share of G2C; carriers pushing financial inclusion also a key driver (banking, domestic remittances)
2 • Entertainment Services
• Services around music and gaming has seen early adoption among mid ARPU segment
• New products such as streaming music, full song download and mobile games
3 • Utility Services • Multiple pilots, with few scalable models (e.g. RML, IKSL), Location based services
• Utility apps and affordable feature-phones to drive adoption of productivity and livelihood enhancement services
4 • Community Services • Carrier promoted SNCs (e.g. AirtelFrenz) aggregating audience on an ad monetization model
• Emergence of new monetization models based on micro transactions, content sales (e.g. Rocketalk) with carrier marketing support, and increased off-deck usage
5 • Mobile Video • Limited services on EDGE with very poor user experience
• Launch of 3G services by 2011 by all major carriers, with a strong video services portfolio (e.g. mobile TV, video calling)
6 • Device Apps and App Stores
• Carrier app stores dominate; D2C app stores facing issues of billing as credit card penetration is low
• Emergence of affordable android based phones, app store push by handset OEMs, launch of 3G, utility apps (e.g. railway booking)
7 Network VAS • Network Services
• Among all the network services such as CRBT, CMS, Roaming, Recharging, Location Enablement, CRBT contributes significant share to total MVAS market
• CRBT has reached a mature level of adoption, while few network services such as voice mail is limited by cultural and price points
8Enterprise
VAS
• Mobile Ad / Marketing • SMS / display ads used for lead generation and digital content sale; poor user experience
• 3G and better device form factors expected to enhance effectiveness of display advertising and help ecosystem growth
9 • Enterprise Solutions • Enterprise messaging solutions (e.g. Valuefirst) , Sales force management
• Emergence of enterprise mobility providers with vertical specific, carrier / software agnostic middleware solutions (e.g. Mobien)
Source: Analysys Mason
29 Key Growth Areas: Services and Applications
focus on the key themes of entertainment, utility services, community services, video, commerce and applications / app stores. We believe that the underlying adoption of mobile data will help drive the adoption of applications (utility and community) and services (video, entertainment and commerce). Also, we believe that SMS, and to some extent voice channel based enablement of some of these services and applications, is also going to be a significant adoption driver in the future.
Network based services including call management offerings (such as missed call alerts) are also expected to become important in the future as technology and network becomes a key element of the innovation focus of carriers. Enterprise VAS including enterprise mobility for addressing the last mile connectivity issues for field force remains small, but has the potential to grow significantly especially if it’s able to help companies save working capital and turnaround times. CRM (Customer Relationship Management) will also be another key area of growth in enterprise VAS as companies uses the individual reach of mobiles to communicate with their customers.
One point to note would be that from a market revenue projection perspectives, it will not be correct to sum the value of these themes’ revenues, as most are cross-bearer and they are not mutually exclusive.
4.2. Mobile Commerce
There have been multiple initiatives by carriers, handset OEMs and technology platform providers in the mobile commerce market in the recent past. From a consumer engagement and retention perspective, m-commerce has significant potential for telecom market participants, as has also been witnessed in other emerging markets (analysis of a major Africa mobile money service shows subscribers churn 60% less than general subscribers – 2.18% versus 5.71% monthly churn18). However, in India, we believe that
m-commerce remains a niche opportunity in the medium term (2 to 3 years) until the power equation between banks and carriers reaches equilibrium, regulatory and policy frameworks are in place and monetization / engagement models get established.
There are three broad areas within mobile commerce: mobile banking, mobile remittance and mobile payments and shopping, and there are multiple business models for each of these services, as can be seen from Figure 4.2.
Banking: In the banking segment, the role of the mobile ecosystem is to provide geographical reach through its distribution channel, means of authentication, as well as the convenience of doing financial transactions from any location. Banking penetration in India is estimated to be less than 20% as it becomes unviable for banks to set up branches in rural locations, especially given the low deposit values. RBI had introduced the Banking Correspondent (BC) based model in 2006, but the scalability of the model has been a challenge with only ~30 mn accounts opened under the BC scheme by 2010. The primary issue is the limited geographic reach of BCs and the weak economics of the model for BCs. Leveraging the carrier distribution network of about 2.0 million retail outlets, the geographical coverage issue gets resolved to some extent, and the commercial negotiation between banks and carriers is expected to address the business case issues plaguing the non-carrier BC models. Also, integrating UID with the mobile enabled BC models can result in faster verification of subscribers, and such a model can be used for timely payments of wages under MGNREGA (Mahatma Gandhi National Rural Employment Guarantee Act) and other Govt schemes. If this segment is used for G2C payments, then the monetization opportunity for carriers is increased multifold. However, as of now there are no commercial mobile banking models
18. CGAP Business Insights on Mobile Money, April 2011

Key Growth Areas: Services and Applications 30
being launched by any major carrier, although there are bank led models ‘powered by’ handset OEMs which are offering BC based banking services leveraging their own distribution network.
Remittance: Domestic and overseas remittance remain another important area where the mobile channel and device can be used to address market inefficiencies. Under the current regulations, mobile enablement is possible only for domestic remittance. India has about 80 mn domestic migrants remitting about USD 12 bn annually to their households in rural areas. The migration pattern is concentrated within few corridors in India and can be permanent or seasonal migration. For this segment, the primary means of sending money is through informal channels which are expensive as well as risky. A large part of the current unbanked population can potentially shift to using mobile BC based remittance driven by convenience / lower transaction costs. When including all the sources of domestic remittance,
the market for cash-to-cash domestic remittance through informal as well as formal (money order) channels is estimated to be USD 25 bn, with money orders accounting for only USD 2 bn of domestic remittances (as of 2009).
Shopping and Payments: Stored value wallets provide the only model which is the most carrier-friendly, as it doesn’t require a bank for offering the service, though the aggregate value of deposits must be kept with a bank. The carrier establishes partnerships with merchants and gets a small fee on every transaction made by the subscriber. As the current regulations prohibit the conversion of this digital money to cash, the carrier is best positioned to monetize the digital cash as long as it ensures that there are multiple outlets available for subscribers to make transactions. Also, as the carriers have been using the e-recharge model on prepaid, maintaining a stored value wallet becomes an extension of the e-recharge model with the same recharge network
Figure 4.2: M-Commerce Service Offering and Business Models in India: Existing and Emerging
Mobile Banking Mobile Remittance
Mobile Payments
Linked Value
Stored Value
BC Based
E.g. Obopay (Yes Bank)
Cash out is not allowed
E.g. mChek
E.g. Airtel Money
E.g. Nokia Money and
UBI
E.g. Nokia Money and
UBI
E.g. iMobile (ICICI Bank)
Non-banking model
E.g. Eko and SBI
Legend: Status of Service Offerings / Business Models:
Existing Emerging NA
Source: Analysys Mason

31 Key Growth Areas: Services and Applications
being leveraged for stored wallet services as well.
4.3. Mobile Entertainment
The mobile entertainment market is primarily dominated by mobile music and mobile gaming, with some share of other miscellaneous items such as wallpapers and theme downloads.
In the past few years, CRBT emerged as the dominant mode of monetizing digital music in India, with mobile accounting for as much as 28% of overall music revenues. However, due to reasons mentioned in section 3.2, we expect CRBT penetration to start stabilizing soon. Also, as the CRBT market matures and revenue growth slows down, carriers are increasingly integrating CRBT components into the network, limiting the role of CRBT VAS providers to being a facilitator between the various parties. Technology platform providers are thus increasingly focusing on innovations on the basic CRBT model to drive adoption in mass market (e.g. ad based CRBT), easier forms of user
activation (e.g. outbound dialers) and service differ-entiation. Beyond CRBT, carriers are also focusing on other music monetization models such as full track downloads and streaming.
Across entertainment categories, carriers and VAS providers are collaborating to optimize and finetune search and discovery to drive page views and downloads by helping users to find what they want more efficiently. In a specific instance with a Latin American carrier, a portal management solution with integrated search and discovery tips helped double portal page views and content downloads (Figure 4.3).
In addition to search and discovery, trends in the music entertainment space reflect differentiation in content, with specific genres, such as regional and devotional gaining traction as they drive higher margins.
Mobile games as a category within entertainment behaves very differently from other VAS in terms
Figure 4.3: Case Study: Impact of Integrated Search and Discovery within Portal
Amdocs Solution for Leading Latin American Carrier
Off-portal profiling & navigation – gives control over the Mobile Internet experience & branding
Search engine – capitalize on sponsored links & create stickiness by faster content discovery
Targeted advertising platform – increases ad inventory & revenues
Retailing & billing platform – allows selling more premium content
Personalized Portal – increases portal usage & stickiness by displaying relevant content
Off-portal links – capitalize on sponsored links
Recommendations engine – increases content sales & customer experience
Direct billing enabler – allows billing for off- portal content (extension of billing platform)
0
5
10
15
Feb-10 Jan-11
Downloads (mn)
0
5
10
15
Jun-10 Jan-11
Unique Page Views Page Views
Pageviews (mn)
Source: Amdocs, Analysys Mason

Key Growth Areas: Services and Applications 32
of revenue growth and penetration drivers. Gaming serves a niche segment of the base and does not show price elasticity, as opposed to other mass market services which tend to attract subscribers when prices drop. From a consumer usage and adoption behavior perspective, the games market can be segmented in terms of casual, amateur and core gamers, representing the increasing level of engagement and usage of games. The drivers for growth in mobile gaming will be to focus on increasing the core and casual gaming segment while enhancing overall ARPU.
Each of these segments of gamers needs to be addressed separately to enable the overall growth of mobile gaming. While the penetration of core gamers within data users will remain stable over the years, the overall base of casual gamers can be driven through the introduction of simple casual games that are social, engaging and have an easier discovery mechanisms. This is not unlike the online success of simple casual games such as “Farmville”. Also, with the increasing adoption of smartphones and feature-phones with touch screens, the end user experience of mobile games has altered significantly, although a major part of these revenues
remain off-deck. The success of “Angry Birds” demonstrates this.
Coming to the last traditional segment within mobile entertainment, we expect the adoption of wallpapers and themes to remain marginal. Easy access to mobile internet for free content, might cannibalize some carrier revenues from these services, but this cannibalization is likely to be balanced in the near term by the newer and less tech savvy users who will continue to use carrier portals for these services. Therefore, while revenues may remain flat, contribution will decrease.
However, going forward, new types of entertainment VAS are being pioneered in India keeping in mind the ability to reach the mass market and leveraging popular and exclusive content. One such example that has been seeing subscriber traction recently is One97 Communication’s StarTalk service, which allows subscribers to listen to and talk with celebrities live (Figure 4.4).
4.4. Utility Services
There are multiple initiatives underway by carriers,
Figure 4.4: Case Study: Emerging Innovative Services within Mobile Entertainment
0.2
2.5 2.6 2.8
3.4
4.2 4.3
5.3
6.4 6.4
Sep
tem
ber
2010
Oct
ober
2010
Nov
embe
r20
10
Dec
embe
r20
10
Janu
ary
2011
Febr
uary
2011
Mar
ch20
11
Apr
il20
11
May
2011
June
2011
Registrations for Star Talk (One97 Communications) (mn)
Offering• It is an innovative service that allows customers to use their
mobile phones to talk with and listen to their favoritecelebrities
• One97 has partnered with various operators to allow subscribers to dial, connect and interact with their favoritestars live
• The service allows a select group of callers at a time to connect with the celebrity for a live conversation in a sequential mode
Business ModelSubscription Model (Automated Renewal):
• Subscribe to Star Talk for INR 10
• Celebrity portal, like celebrity interviews, archives, Bollywood gossips, review and preview
Event Based Charging:
• To talk live to a celebrity, INR10 for the event (auto-renewal)
Source: One97 Communications, Analysys Mason
33 Key Growth Areas: Services and Applications
handset OEMs as well as the D2C service providers in the utility services market. A majority of these services are focused on addressing multiple market inefficiencies existing in the urban as well as the rural markets, including enabling access to information (e.g. weather updates), opportunities (e.g. job listings), and infrastructure (e.g. financial inclusion) for end users.
The access to information proposition has been existing for some time now using SMS and voice channels and the adoption of data will help drive sharing of multi-media information through mobile / connected computing devices. Access and devices aren’t the major hurdle for basic information-centric service, however the aggregation of quality, relevant and accurate content is the key to make sure that some of these mobile enabled services are able to actually replace the physical mechanism of aggregation of this information. In some of the rural areas, consumers reportedly went to the local mandi to cross-check the crop produce rates and other agricultural parameters with the data pushed by service providers on their mobiles. In urban areas as well, the key value driver also remains the aggregation of relevant data and content. The current limitation on the adoption of these services is the ability of service providers to continue to cost effectively collect and update data, while distributing it in a monetizable fashion.
Access to the opportunities value proposition appears to be much more applicable for urban areas for use cases like trying to address the information asymmetry in niche areas such as job listings for blue collar workers. For such a service, creating a dynamic database of entry level blue collar workers with periodic updates and providing a validated standardized list of options to employers has significant value. The role of mobile in such a model is to allow suppliers (job seekers) to post their qualifications using the SMS, voice or data
channel, with automated matching of buyer and supplier requirements. The adoption of such services remains limited due to availability of alternate informal channels (word-of-mouth, friends & family etc.) for both buyers as well as sellers to fulfil their requirements.
Finally, we believe that the most significant value addition by mobile enablement will be in the area of access to infrastructure. A key example of such mobile enablement is in the area of financial inclusion where the carrier assets of a widespread distribution network and use of mobile for authentication and authorization helps significantly reduce transaction cost and enhance convenience for end users. Similarly, use of mobile for simple services such as railway reservations helps rural users save a day of travel time as well as cost of travel. For offering some of these services, there are regulatory requirements which necessitate partnerships with other ecosystem stakeholders (e.g. with banks for offering financial inclusion).
This holds true for services such as mobile health, agricultural advice and mobile education, as well. For example, mobile healthcare offers telemedicine facilities in areas where the primary healthcare infrastructure is not optimal. However, this requires a robust partnership between the various stakeholders – carriers, hospitals, technology platform enablers – with a very high level of coordination required to create, grow and optimise this ecosystem. Only then can such services go mainstream. Similarly for mobile education as well, multiple partnerships are required between schools, carriers, content providers, digital content creators, etc. to enable a complete offering for the end user. This is also true for services that provide agricultural advice to farmers – they require partnerships between agricultural universities, carriers and technology providers – to enable dissemination of

Key Growth Areas: Services and Applications 34
accurate information in a timely manner to the end users.
From an operational perspective, industry inputs suggest that the use case and value proposition of these services is significantly different depending on the urban vs. rural deployment of the service, as illustrated in Figure 4.5.
The focus of urban deployments include objectives such as lifestyle and entertainment, in addition to livelihood enhancement, as compared to rural areas where the primary focus is livelihood enhancement.
Carriers are also entering into partnerships with institutions with deep engagement levels with the rural community (such as IFFCO fertilizers) to leverage these channels for pushing voice as well as mobile VAS services.
4.5. Community Services
Mobile community services can broadly be classified as Social Networking, Instant Messaging and Micro
Blogging, while there exist two business models for mobile community services:
• Mobile as extension of online community services: These communities are feature rich platforms such as “Facebook” that allow a wide range of activities. The mobile version of the community service is usually an application which is a simplified version in terms of features and activities, given the limitations of a smaller screen and device functionalities. The key target segment for such mobile applications include online users typically from metros and tier 1 cities, who already are online registered users with these communities, and mobile offers them continuous connectivity. The monetization models include ads and micro-transactions, though most online SNCs (Social Networking Communities) are currently not monetizing mobile usage.
• Mobile only services: These are communities with mobile as the primary access channel and with platforms optimized for mobile usage. Features offered through these communities are customized to work on slower 2.5G data channels, as well as other bearer channels such as SMS. Also, these communities are designed to target
Figure 4.5: Utility Services for Rural and Urban User Segment
Rural Urban / Semi-urban
Primary User Segment
Life
styl
e / E
nter
tain
men
tLi
velih
ood
Agriculture alerts
Health support for
cattle
Education
Governance
News alerts
LBSPush Email
Job Listings
Health Support
Shopping & Payment
Financial Inclusion
Entertainment Services
Prim
ary
Valu
e Pr
opos
ition
• Majority of the utility services adopted by rural segments enhance livelihood
• Agriculture alerts and health support for cattle increases the productivity of farmers
• In urban areas, majority of utility services are point solutions such as interview support, learn English, while few services such as job listings provides livelihood support
Source: Analysys Mason

35 Key Growth Areas: Services and Applications
specific needs of end users such as allowing users to interact using contacts from their address books. The target segment is mobile first users from tier 2 / 3 cities who typically are not registered in online SNCs.
Multiple mobile only models are also gaining traction as the online extension model is limited to users with PC based internet access. The mobile only SNCs in India are currently aggregating audiences in non-metros with limited focus on monetization and are offering services relevant to the mass market to keep their audience engaged.
To capitalize on growth in this area, some carriers and OEMs have started to offer their own services for social networking under their own brand. Various solutions provide the necessary tools to do different elements of this. For example, Qualcomm’s Yagatta platform focuses on IP-based text, voice and image messaging (Figure 4.6).
Following the trend in International markets, there
has been some growth in mobile instant messaging in India. This growth is driven by emergence of companies offering mobile only IM, or group messaging across bearer channels, and which do not require users to register online. Although a number of initiatives have been taken by players across the ecosystem, monetization still remains limited to revenues from increase in data adoption and device sales.
Although there exist multiple monetization models for mobile based microblogs (e.g. subscription, pay per message), yet increasing revenue levels remains a challenge. Mobile blogs on voice have witnessed significant adoption in India, especially services such as BubbleBlog, which allows users to share updates in their own voice with their social circle or follow celebrities and listen to their updates. This is another example of how innovation in emerging markets allows traditional models to be moulded to address a wider market. Through partnerships across multiple carriers and using celebrities to drive
Figure 4.6: Case Study: Mobile IP Communications Platform19
• A full-featured, carrier-grade mobile IP-communications platform that offers simultaneous delivery of high-quality, low-latency voice, messaging, audio, and video
• Yagatta deployment can be hosted by the Operator/OEM or by Qualcomm
• First release: YagattaTalk, for all-in-one text, voice, and image messaging
• Operator can drive data subscriptions with desirable IP-based offerings (with full IMS/RCS-e interoperability)
• Operator can keep its brand
Operators
• OEM can differentiate with leading-edge communication tools & extend their brand into lifestyle services
OEMs
• Developer can enrich its apps and services with a wide range of new capabilities; Voice and Text messaging, Group calling, Location features and more
Developers
Source: Qualcomm, Analysys Mason
19. Yagatta services are available for deployment with Operators and OEMs today, ISV/Developer SDK to release soon
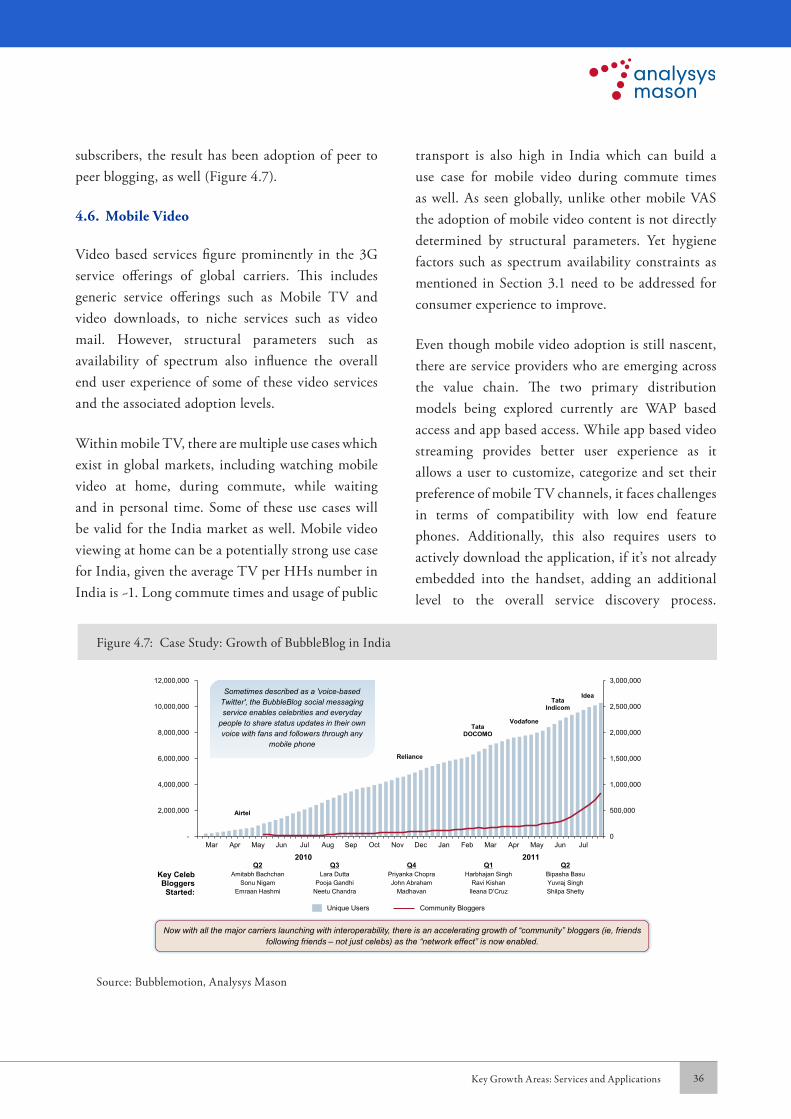
Key Growth Areas: Services and Applications 36
subscribers, the result has been adoption of peer to peer blogging, as well (Figure 4.7).
4.6. Mobile Video
Video based services figure prominently in the 3G service offerings of global carriers. This includes generic service offerings such as Mobile TV and video downloads, to niche services such as video mail. However, structural parameters such as availability of spectrum also influence the overall end user experience of some of these video services and the associated adoption levels.
Within mobile TV, there are multiple use cases which exist in global markets, including watching mobile video at home, during commute, while waiting and in personal time. Some of these use cases will be valid for the India market as well. Mobile video viewing at home can be a potentially strong use case for India, given the average TV per HHs number in India is ~1. Long commute times and usage of public
transport is also high in India which can build a use case for mobile video during commute times as well. As seen globally, unlike other mobile VAS the adoption of mobile video content is not directly determined by structural parameters. Yet hygiene factors such as spectrum availability constraints as mentioned in Section 3.1 need to be addressed for consumer experience to improve.
Even though mobile video adoption is still nascent, there are service providers who are emerging across the value chain. The two primary distribution models being explored currently are WAP based access and app based access. While app based video streaming provides better user experience as it allows a user to customize, categorize and set their preference of mobile TV channels, it faces challenges in terms of compatibility with low end feature phones. Additionally, this also requires users to actively download the application, if it’s not already embedded into the handset, adding an additional level to the overall service discovery process.
Figure 4.7: Case Study: Growth of BubbleBlog in India
Key CelebBloggers Started:
Q2Amitabh Bachchan
Sonu NigamEmraan Hashmi
Q3Lara Dutta
Pooja GandhiNeetu Chandra
Q4Priyanka ChopraJohn Abraham
Madhavan
Q1Harbhajan Singh
Ravi KishanIleana D’Cruz
Q2Bipasha BasuYuvraj SinghShilpa Shetty
0
500,000
1,000,000
1,500,000
2,000,000
2,500,000
3,000,000
-
2,000,000
4,000,000
6,000,000
8,000,000
10,000,000
12,000,000
Mar Apr May Jun Jul Aug Sep Oct Nov Dec Jan Feb Mar Apr May Jun Jul
2010
Now with all the major carriers launching with interoperability, there is an accelerating growth of “community” bloggers (ie, friends following friends – not just celebs) as the “network effect” is now enabled.
2011
Sometimes described as a 'voice-based Twitter', the BubbleBlog social messaging service enables celebrities and everyday
people to share status updates in their own voice with fans and followers through any
mobile phone
Unique Users Community Bloggers
Airtel
Reliance
Tata DOCOMO
Vodafone
Tata Indicom
Idea
Source: Bubblemotion, Analysys Mason

37 Key Growth Areas: Services and Applications
However, we believe that inspite of these issues app based video is likely to gain in the longer term as the overall user experience and level of personalization offered is a significant value addition to the service.
Unlike most other VAS categories, carrier alignment is not a crucial success factor for mobile video services. Exclusivity of content – whether live or recorded – can help drive adoption for D2C models, e.g. exclusive rights to IPL (Indian Premier League) content can potentially be a huge driver for adoption in India. Exclusive content can help buffer this through its ability to command a premium for the services. Also, currently the service providers are trying to differentiate their offerings in terms of live vs. recorded content, as well as the range of channels being offered. A few companies are providing as many as 150 live channels while others are building libraries of pre-recorded content. However, from an
end user consumption perspective the adoption of the particular use case will decide whether mobile TV is a substitute for live TV watching or will primarily be a means of watching clips of exclusive content which is not available elsewhere.
Overall, we believe that an app based carrier aligned service with access to exclusive content could reach a scale as 3G / 4G services are rolled out across India.
4.7. Mobile Applications and App Stores
The app store market in India witnessed a download of over 1 billion apps last year, with the growth in app downloads primarily driven by games and community applications. The demand for apps comes mainly from tier 2 cities due to limited available alternatives for entertainment in these cities. The demand is expected to further increase
Figure 4.8: Relative Positioning of Unique 3G Servicesa Launched by Global Carriers20
Ban
dwid
th R
equi
rem
ent
Mobile Email, 100%
Single Player Mobile Games,
94%
Full Track Downloads, 90%
Mobile TV, 81%Video Calling, 71%
Video Streaming, 68%
Video Download, 65%Video Sharing -
P2P, 45%
Photo Sharing -P2P, 52%
Mobile IM, 39%
Maps and Navigation, 39%
Mobile Blog, 23%
SNC, 13%
Mobile Surveillance, 23%
Mobile Video –Animation, 23%
Mobile Radio, 16%
Video Conference, 16%
Video Mail, 13%
Adult Content,
6%
Multi Player
Gaming, 3%
Music Streaming,
6%
Mobile Comics, 6%
Mobile Newspaper,
6%
Nicheb GenericcCategory of Services
Video Chat, 6%
Low
High
Photo Sharing –Album, 19%
Legend: Service name, % of carriers offering service
Source: Analysys Mason
20.a. 3G services of a total of 31 carriers were analyzed: US – AT&T, Verizon, Sprint Nextel; UK – 3, O2, Orange, Vodafone; South Africa – Vodacom, MTN; Malaysia – Maxis, Celcom; Australia – Telstra; Singapore – Singtel; South Korea – SK Telecom; Sri Lanka – Dialog Telekom; Indonesia – Telkomsel; Saudi Arabia – Mobily; Egypt – Vodafone; Qatar – Qtel; UAE – Etisalat; Philippines – Smart Communication; Kuwait – Zain; China – China Unicom; New Zealand – Vodafone; Netherlands – Vodafone; Spain – Orange; Germany – T Mobile; Japan – NTT Docomo; Hong Kong – 3; Switzerland – Orange; Russia – MTS; b. Niche refers to services offered by only few carriers; c. Generic refers to services offered by majority of carriers
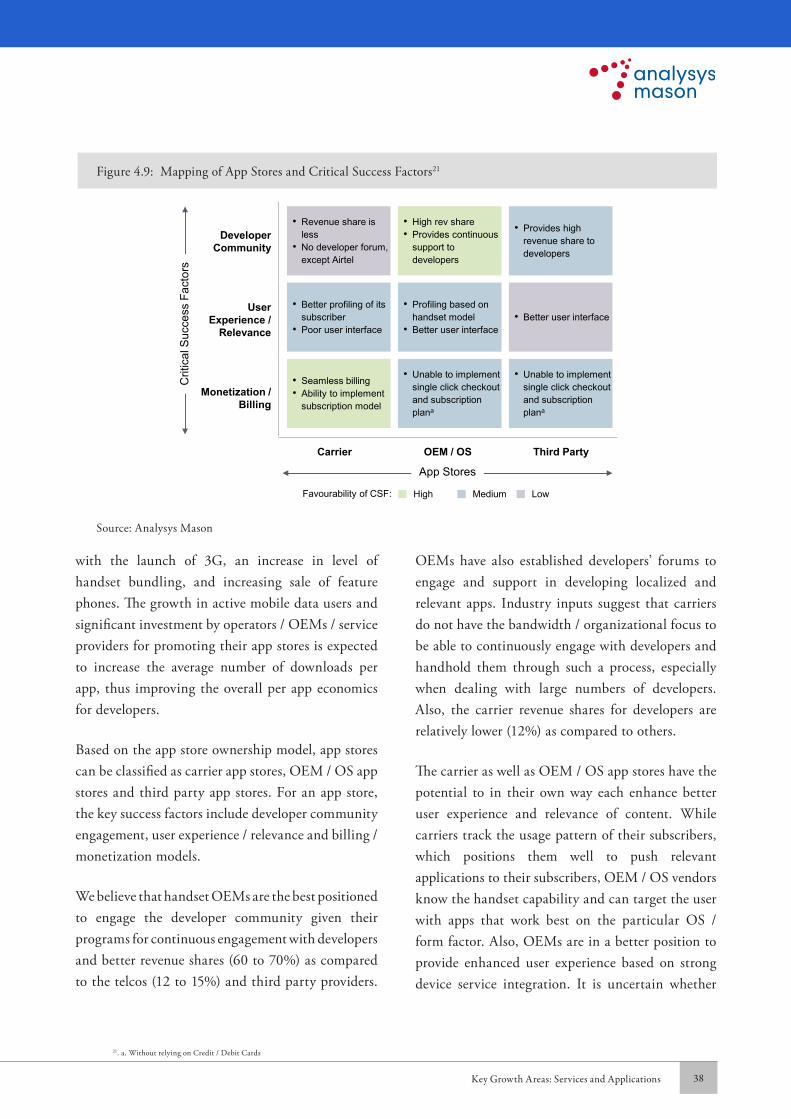
Key Growth Areas: Services and Applications 38
with the launch of 3G, an increase in level of handset bundling, and increasing sale of feature phones. The growth in active mobile data users and significant investment by operators / OEMs / service providers for promoting their app stores is expected to increase the average number of downloads per app, thus improving the overall per app economics for developers.
Based on the app store ownership model, app stores can be classified as carrier app stores, OEM / OS app stores and third party app stores. For an app store, the key success factors include developer community engagement, user experience / relevance and billing / monetization models.
We believe that handset OEMs are the best positioned to engage the developer community given their programs for continuous engagement with developers and better revenue shares (60 to 70%) as compared to the telcos (12 to 15%) and third party providers.
OEMs have also established developers’ forums to engage and support in developing localized and relevant apps. Industry inputs suggest that carriers do not have the bandwidth / organizational focus to be able to continuously engage with developers and handhold them through such a process, especially when dealing with large numbers of developers. Also, the carrier revenue shares for developers are relatively lower (12%) as compared to others.
The carrier as well as OEM / OS app stores have the potential to in their own way each enhance better user experience and relevance of content. While carriers track the usage pattern of their subscribers, which positions them well to push relevant applications to their subscribers, OEM / OS vendors know the handset capability and can target the user with apps that work best on the particular OS / form factor. Also, OEMs are in a better position to provide enhanced user experience based on strong device service integration. It is uncertain whether
Figure 4.9: Mapping of App Stores and Critical Success Factors21
Developer Community
UserExperience /
Relevance
Monetization / Billing
Carrier OEM / OS Third Party
Crit
ical
Suc
cess
Fac
tors
App Stores
• Revenue share is less
• No developer forum, except Airtel
• Better profiling of its subscriber
• Poor user interface
High Medium LowFavourability of CSF:
• High rev share• Provides continuous
support to developers
• Provides high revenue share to developers
• Profiling based on handset model
• Better user interface• Better user interface
• Seamless billing• Ability to implement
subscription model
• Unable to implement single click checkout and subscription plana
• Unable to implement single click checkout and subscription plana
Source: Analysys Mason
21. a. Without relying on Credit / Debit Cards

39 Key Growth Areas: Services and Applications
carrier or OEM app stores will emerge as the leader in user experience and relevance of content.
In continuation of the current situation, we expect carriers to continue to have a strong control over billing and monetization especially for mass market users. Carrier app stores will continue to provide seamless and single click billing while it is a multiple step process to purchase apps at other stores. Carriers are also better positioned to implement subscription models and dynamic charging to target a broader user base more effectively, while handset OEMs would find it challenging to execute models like daily subscriptions as they don’t have access to the subscribers prepaid balance or postpaid account.
4.8. Network Based Services
Network VAS are defined as value added services that are network functionality dependent and consequently can only be offered by carriers. The range of VAS that can be classified as network VAS ranges from dominant services (such as CRBT and SMS) to niche (such as CMS22 and MMS), and emerging services (Video calling and IVVR23). Services such as CRBT and SMS (P2P) have been prevalent in the Indian market for quite some time, and have witnessed mass market penetration. However, both these services are now stabilizing (in terms of penetration) due to various reasons, as detailed in Chapter 3.
Other niche services such as MMS have witnessed moderate adoption within consumer segments, and remain constrained by multiple issues. P2P MMS has remained limited in India, as in global markets, primarily due to issues with pricing, compatibility and network interoperability. However, with the emergence of low cost feature rich handsets, MMS is emerging as a product offering for the user segment which does not access mobile internet data to
provide access to rich multimedia content that they can share / exchange with others. In addition, MMS has a use case in mobile advertising where rich ads can be pushed to end users opting for the service.
Call management and call completion services such as missed call alerts have found some success in the India market, with ~5% penetration for missed call alerts on a country wide basis. The primary value proposition for such services is to drive additional call traffic on the network and enhance asset utilization, rather than generate incremental revenues from the service itself. Other call management services such as Voicemail have only witnessed moderate adoption (~1 mn users) in India due to a lack of awareness, cultural issues and high pricing. Pricing in particular is rather high as compared to other markets where missed call alerts are offered free. In addition to pricing, operators don’t promote these services in their ATL VAS promotions, resulting in lower awareness among consumers.
Emerging services within network VAS includes video solutions such as video calling and IVVR portals. While there is a lot of expectation built-up from these solutions, it remains to be seen if they will be successful in the Indian context. Demand side surveys reflect that a compelling use case does exist for video based solutions in India, especially among the youth segment24. Services such as video calling have not been very popular worldwide, and it remains to be seen if they will be adopted extensively in India. Certain demand drivers, like high level of domestic migrant labour, could create an environment for success of video calling. But in addition to device issues (lack of front camera) and pricing, industry feedback suggests that current networks are not yet optimized for video delivery – whether its video calling or IVVR portals. For video services, device encoding needs to be in sync with
22. Call Management Services23. Interactive Voice and Video Response24.PwC VAS Report Survey, 2010

Key Growth Areas: Services and Applications 40
network encoding and current networks are still not in a position to enable seamless video delivery. These issues should be addressed soon, but it is expected to take another 6 months to a year before seamless video on the mobile can become a reality. Even when that is achieved, network capacity will still remain a challenge (as discussed in Chapter 3).
4.9. Mobile Advertising
Prima facie, mobile appears to be a very effective means of reaching a large population through multiple audio and video channels, including the possibility of message customization based on customer profiling and usage information. However, despite the reach and inherent benefits of the mobile communication channel, the adoption of mobile advertising in India has been limited, with the dominant use case being lead generation. This has been primarily due to the channel characteristics of mobile across the SMS, WAP and voice channels.
Low cost and easy accessibility have been key drivers for SMS adoption by SMEs and SOHOs for lead generation in India, especially for the BFSI, Travel, Retail and FMCG verticals. However, current price levels are not sustainable, especially with the TRAI regulations restricting the usage of promotional messages between 9 pm to 9 am. This will result in insufficient capacity utilization of the SMSC capacity leased from the carrier. In addition, potential introduction of termination charges for bulk SMS may result in the overall bulk SMS business case becoming unviable for participating aggregators.
SMS ads typically come in two forms: ad-fill or push. Ad-fill SMSs are typically messages sent for another purpose where the footer (e.g. 80 or more characters) are used for advertising. Push SMS represents the prevalent use case of SMS pushed for marketing activities and promotional services. The push SMS
model has been the focus of public scrutiny given its potential violation of user privacy. The recent regulations for governing SMS based advertising only allows advertisers to send promotional messages to registered users relevant to categories chosen by them. Post these new regulations the growth in SMS advertising will primarily come from the opt-in model and enterprise usage for CRM, and there could be potential value addition from profiling information that allows targeted advertising. Such models are already beginning to witness traction, with service providers focusing on targeted advertising to users based on their historical profile information to generate higher metrics, as in the example illustrated in Figure 4.10.
Voice advertising has the benefit of being similar to radio advertising media and appear intuitive to brands. However, if the voice based messages are not positioned properly (for example, when a consumer is waiting for accessing some service), it can disrupt the user experience significantly. Consumer feedback on use cases of pre-call inserts have not been very positive. Also, industry inputs suggest that the inventory of voice based ad calls is very high and there is only limited ad inventory which results in low fill rates and a muted business case. However, the CPMs on voice are higher than for other channels (in the range of INR 200-400) as brands are more willing to experiment with the voice medium, given its similarity to radio. Additionally, advertisers prefer the voice medium as all the ads get delivered and users listen to the ad with undivided attention, However, even though there have been multiple pilots, the growth in voice based advertising is yet to be realized.
WAP inventory has seen significant growth over the past one year, led by feature phone adoption and reduced data pricing. India has emerged as the largest mobile ad impression market in

41 Key Growth Areas: Services and Applications
Figure 4.11: Benefits to Entities across the Mobile Advertising Ecosystem with Changes in Market Dynamics
Profiling /Targeting Measurement Metrics 3G Service / Device Features
Consumers NA Relevant ads Enhanced user experience
Ad Networks Better reporting Higher CPM; Increase in CTR
Richer ad formats;
Increase in branded inventory
AdvertisersKnowledge of
RoI; Increased spend on mobile medium
Higher conversionInteractive ads; Ads for
brand recognition (display / banner ads)
Legend: Status of Market Dynamics: Emerging Required NA
Source: Analysys Mason
Figure 4.10: Case Study: Targeted SMS Advertising and it’s Impact on Metrics
Situation
• FutureBazaar.com launched “Battle‟, a shopping initiative that lasted 96 hours and had consumers vying to buy consumer electronics products with genuine manufacturer’s warranty
• The initiative offered a lowest price guarantee with free of cost delivery to the customer
• The focus was on consumer electronics as a leading sector of the growing e-commerce market in India
• Purchases were made through Future Bazaar’s online portal or on the phone
Objective
• To achieve maximum sales in 96 hours, for the duration of the “Battle” shopping initiative
SMS GupShup Solution
• The SMS GupShup audience was targeted on the basis of their historically captured profiling data and usage and attitude patterns
• No SMS blast was used – only 1.8 – 2 mn users (pre-screened on the basis of their profiles) were targeted
• Campaign designed exclusively for sales generation, and not for marketing / lead generation
6.8
Sales
Revenue Generated from Converted Sales (INR mn)
Insights• Equivalent CTRs for confirmed
sales: 4 – 5% • Cost of sales ~ 14% was
significantly lower than for other channels
• Tier 2 Traffic: 24 / 28 states represented in the purchase tally
Source: SMS GupShup, Analysys Mason
Key Growth Areas: Services and Applications 42
Asia-Pacific25 with the total WAP ad inventory growing from 1.1 bn in 2009 to an estimated 4.0 bn in 2010. Average number of page views in India was in the range of 350 pages per user per month in 2010, and is expected to grow further in 2011 to ~550-700 pages per user per month. However, inspite of increasing WAP usage, CTRs and CPMs have remained stable in the range of 0.4% to 1% for CTRs and INR 60-70 for CPMs (increasing to INR 80 - 120 for some publishers), primarily due to the increasing share of low value users among data subscribers and prevalent practices of untargeted advertising. Better targeting and profiling can help drive CPMs / CTRs. Additionally, other non RoI based metrics as well as innovative lead generation metrics (e.g. click to call) are also likely to drive better campaigns for brand awareness / lead generation purposes. Driven by increasing mobile internet penetration and better metrics, WAP based advertising is expected to witness significant growth.
Going forward, we expect profiling, measurement metrics & better service/device quality to drive growth of mobile advertising.
Better targeting and higher CPMs are realizable if carriers can potentially share subscriber information with ad networks. Ad networks need to work with carriers to better profile the consumers for displaying relevant ads across carrier / non-carrier products. In addition, carriers have the opportunity to leverage consumer profiling data to emerge as ‘smart pipes’ by offering highly relevant and contextual information and content to end users. This will also allow carriers to play a more significant role in the growth of the off deck VAS ecosystem.
Given the wide variety of networks, handsets, and mobile sites, a comprehensive view of mobile audience measurement technique has not yet been developed. Currently ad networks employ different
methods to estimate the reach, leading to lack of standard metrics for advertisers, as opposed to online advertising.
Additionally, with 3G and better device features, mobile can be used for branding ads, rather than just lead generation, as richer ad formats can be supported. Ad networks can also leverage device features and higher bandwidth to build complexity in the campaigns to support interactivity for a higher level of consumer engagement.
4.10. Enterprise Services
Enterprise VAS services include the two main categories of SMS aggregation and Enterprise Mobility services, which also includes CRM.
The SMS aggregation market in India is estimated to be a USD 56 mn market, with over 5 bn SMS messages being sent every month. It’s largely dominated by transactional business SMS (e.g. alert from a bank on cash withdrawal) and push advertising. Bulk SMS volume has been rising constantly, while its prices have been steadily declining over the years. Based on how the SMS aggregators source the capacity from carriers, there exist two business models: variable pricing and fixed pricing. In a variable pricing model, carriers sell SMS on a per SMS basis to aggregators and the pricing varies on the basis of volume. In a fixed pricing model, carriers sell bandwidth on the basis of transactions per second (TPS). Peak time utilization of a TPS link is approximately 8 to 10 hours / day @ 70% efficiency. While the top six aggregators account for a large share of the market, the remaining market is fragmented across multiple resellers.
Enterprise mobility is still in a nascent stage of adoption in India, being primarily dominated by mobile email and collaboration applications.
20. Admob Mobile Metrics, May 2010

43 Key Growth Areas: Services and Applications
The primary driver for adoption of other mobility applications such as ERP is the cost saving that can potentially accrue from lower sales turnaround time. Enterprise customers (as compared to SMBs) account for a bulk of these applications, and are open to spending as much as 25-30% of their total spend on productivity applications for having them mobile enabled. Verticals such as financial services, pharmaceuticals and FMCG are leading the overall deployments in this space, and the business models range from a fixed capex model to a pay per user per
month model. The need of field employees to stay connected and the overall shift of the workplace to being more efficient and decentralized signals a high potential for these services in the future.
Another key segment within enterprise applications is consumer facing solutions such as CRM. These applications can be used to drive user stickiness, convenience and overall engagement levels with the user, as is seen in an integrated CRM tool deployed with a cable operator in the US (Figure 4.12).
Figure 4.12: Case Study: CRM with Enhanced Discovery and Upsell / Cross Sell Opportunities
Situation• A large cable operator in North America offers video, high speed data and
phone services
• The company recently started quad play through offering wireless data cards. They now also plan to offer mobile voice and data solutions to help retain users and also drive their life time value
Challenge• Company faced significant challenges in its overall brand evolution.
Primary concern around product was on how to promote the discovery of their services and offerings both to new users as well as the larger cable subscriber base
• Additionally, they wanted to be able to make intelligent recommendations and offer personalization to enhance the overall user experience
Approach• mPortal with its SPRINGBOARD product suite implemented a discovery
solution for smart phones and tablets
• The solution is well positioned to help drive retention of users, better service discovery and improve uptake
• Additionally, more control over the discovery coupled with insights into consumer usage help plan future services
Source: mPortal, Analysys Mason

Key Growth Areas: Services and Applications 44

5 Forecasts
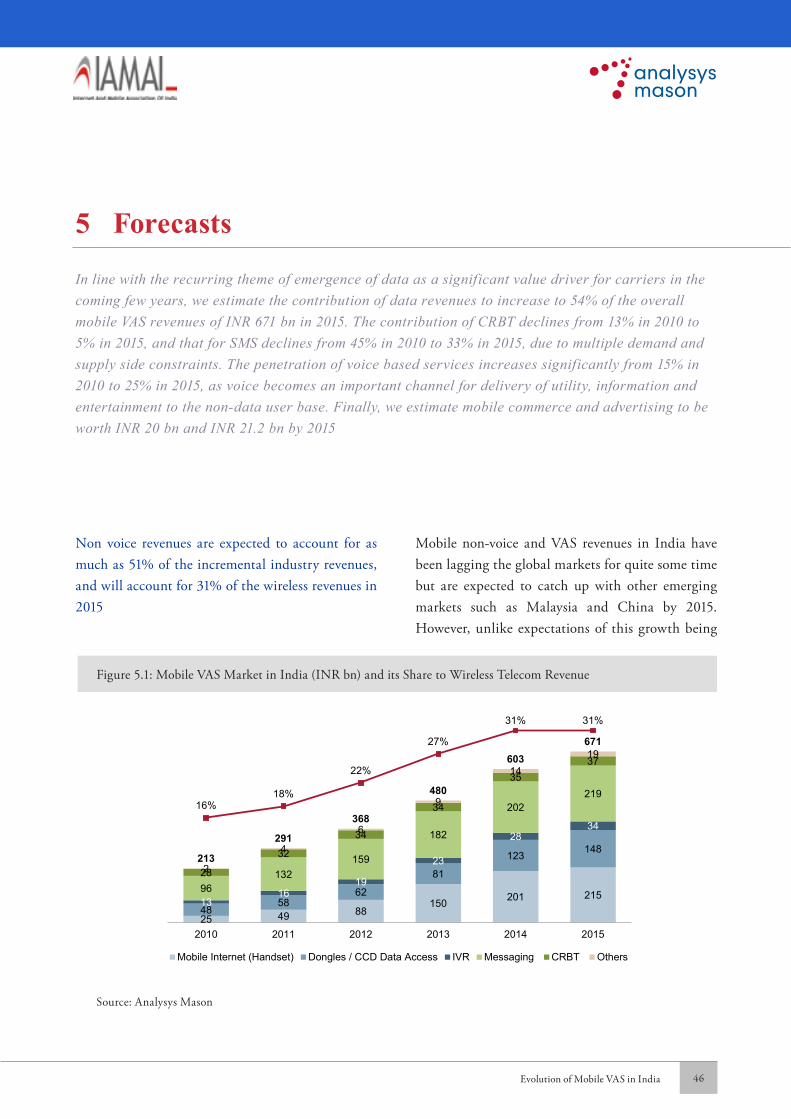
46Evolution of Mobile VAS in India
Non voice revenues are expected to account for as much as 51% of the incremental industry revenues, and will account for 31% of the wireless revenues in 2015
Mobile non-voice and VAS revenues in India have been lagging the global markets for quite some time but are expected to catch up with other emerging markets such as Malaysia and China by 2015. However, unlike expectations of this growth being
In line with the recurring theme of emergence of data as a significant value driver for carriers in the coming few years, we estimate the contribution of data revenues to increase to 54% of the overall mobile VAS revenues of INR 671 bn in 2015. The contribution of CRBT declines from 13% in 2010 to 5% in 2015, and that for SMS declines from 45% in 2010 to 33% in 2015, due to multiple demand and supply side constraints. The penetration of voice based services increases significantly from 15% in 2010 to 25% in 2015, as voice becomes an important channel for delivery of utility, information and entertainment to the non-data user base. Finally, we estimate mobile commerce and advertising to be worth INR 20 bn and INR 21.2 bn by 2015
5 Forecasts
Figure 5.1: Mobile VAS Market in India (INR bn) and its Share to Wireless Telecom Revenue
25 49 88 150 201 215
4858
62
81
123 148
1316
19
23
2834
96132
159
182
202219
28
32
34
34
3537
2
4
6
9
1419
213
291
368
480
603 671
16%18%
22%
27%
31% 31%
2010 2011 2012 2013 2014 2015
Mobile Internet (Handset) Dongles / CCD Data Access IVR Messaging CRBT Others
Source: Analysys Mason
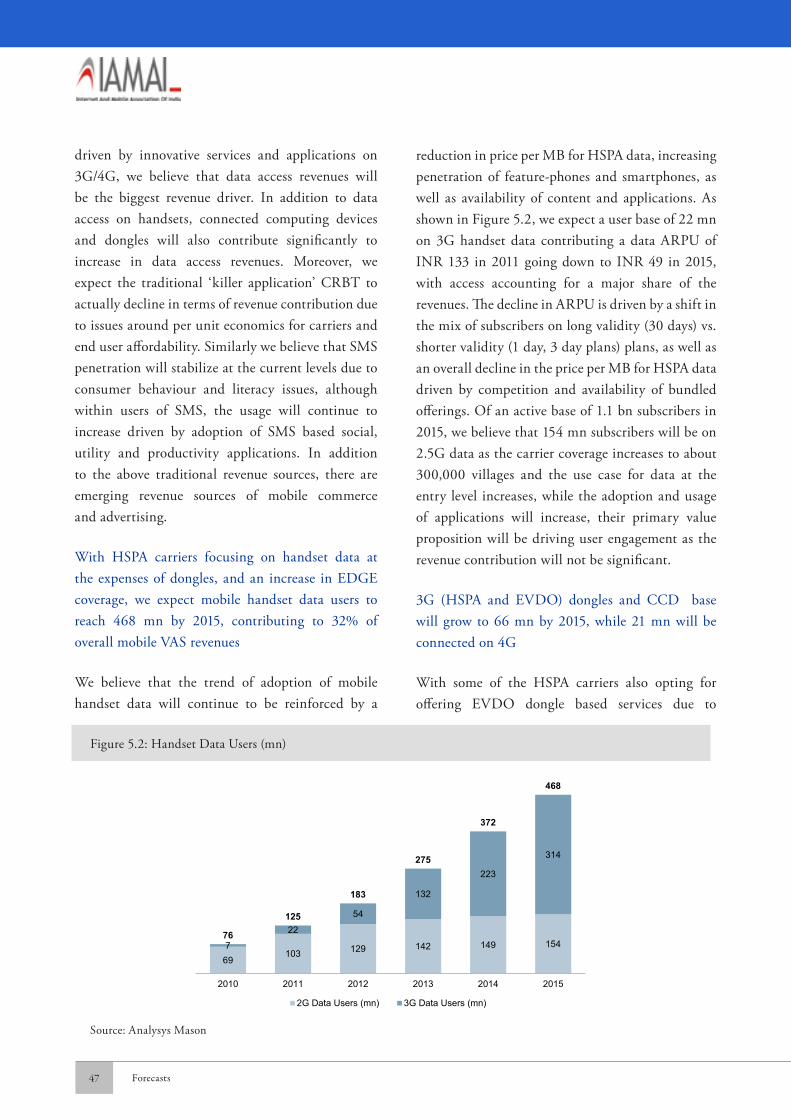
47 Forecasts
driven by innovative services and applications on 3G/4G, we believe that data access revenues will be the biggest revenue driver. In addition to data access on handsets, connected computing devices and dongles will also contribute significantly to increase in data access revenues. Moreover, we expect the traditional ‘killer application’ CRBT to actually decline in terms of revenue contribution due to issues around per unit economics for carriers and end user affordability. Similarly we believe that SMS penetration will stabilize at the current levels due to consumer behaviour and literacy issues, although within users of SMS, the usage will continue to increase driven by adoption of SMS based social, utility and productivity applications. In addition to the above traditional revenue sources, there are emerging revenue sources of mobile commerce and advertising.
With HSPA carriers focusing on handset data at the expenses of dongles, and an increase in EDGE coverage, we expect mobile handset data users to reach 468 mn by 2015, contributing to 32% of overall mobile VAS revenues
We believe that the trend of adoption of mobile handset data will continue to be reinforced by a
reduction in price per MB for HSPA data, increasing penetration of feature-phones and smartphones, as well as availability of content and applications. As shown in Figure 5.2, we expect a user base of 22 mn on 3G handset data contributing a data ARPU of INR 133 in 2011 going down to INR 49 in 2015, with access accounting for a major share of the revenues. The decline in ARPU is driven by a shift in the mix of subscribers on long validity (30 days) vs. shorter validity (1 day, 3 day plans) plans, as well as an overall decline in the price per MB for HSPA data driven by competition and availability of bundled offerings. Of an active base of 1.1 bn subscribers in 2015, we believe that 154 mn subscribers will be on 2.5G data as the carrier coverage increases to about 300,000 villages and the use case for data at the entry level increases, while the adoption and usage of applications will increase, their primary value proposition will be driving user engagement as the revenue contribution will not be significant.
3G (HSPA and EVDO) dongles and CCD base will grow to 66 mn by 2015, while 21 mn will be connected on 4G
With some of the HSPA carriers also opting for offering EVDO dongle based services due to
Figure 5.2: Handset Data Users (mn)
69 103 129 142 149 154 7
22
54
132
223
314
76
125
183
275
372
468
2010 2011 2012 2013 2014 2015
2G Data Users (mn) 3G Data Users (mn)
Source: Analysys Mason
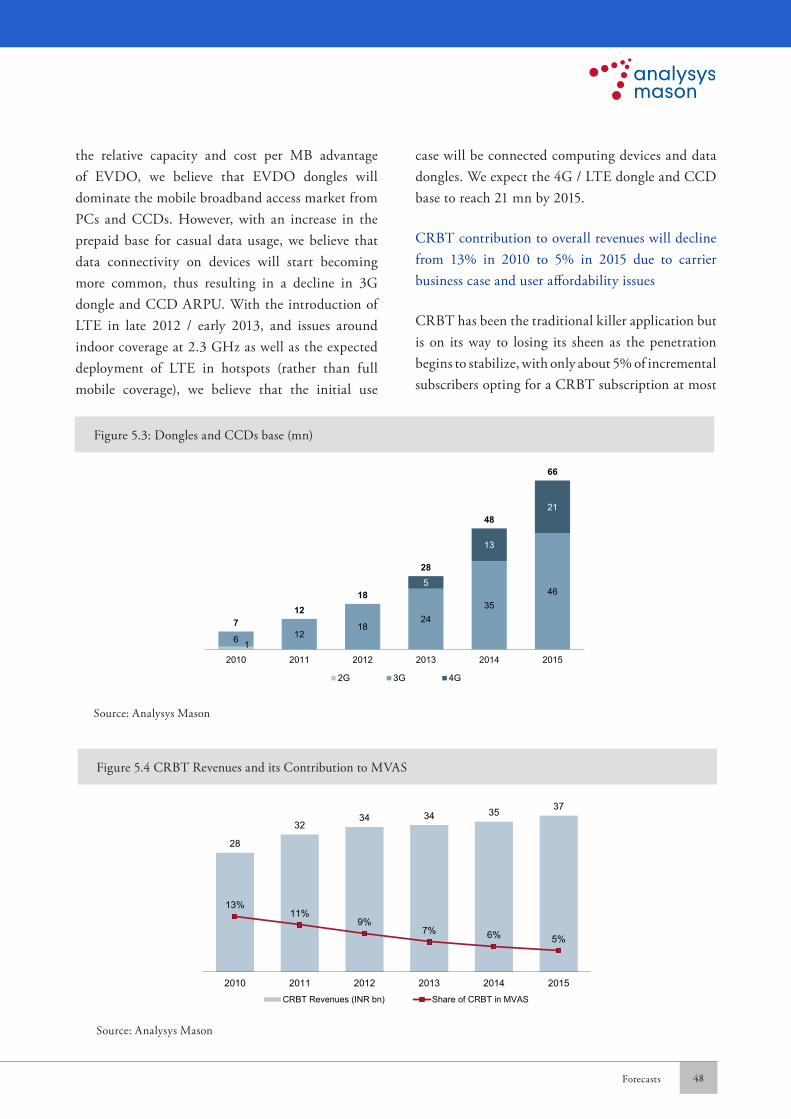
Forecasts 48
the relative capacity and cost per MB advantage of EVDO, we believe that EVDO dongles will dominate the mobile broadband access market from PCs and CCDs. However, with an increase in the prepaid base for casual data usage, we believe that data connectivity on devices will start becoming more common, thus resulting in a decline in 3G dongle and CCD ARPU. With the introduction of LTE in late 2012 / early 2013, and issues around indoor coverage at 2.3 GHz as well as the expected deployment of LTE in hotspots (rather than full mobile coverage), we believe that the initial use
case will be connected computing devices and data dongles. We expect the 4G / LTE dongle and CCD base to reach 21 mn by 2015.
CRBT contribution to overall revenues will decline from 13% in 2010 to 5% in 2015 due to carrier business case and user affordability issues
CRBT has been the traditional killer application but is on its way to losing its sheen as the penetration begins to stabilize, with only about 5% of incremental subscribers opting for a CRBT subscription at most
Figure 5.3: Dongles and CCDs base (mn)
6 1218
2435
465
13
21
712
18
28
48
66
12010 2011 2012 2013 2014 2015
2G 3G 4G
Source: Analysys Mason
Figure 5.4 CRBT Revenues and its Contribution to MVAS
28
32 34 34 35 37
13%11%
9%7% 6% 5%
2010 2011 2012 2013 2014 2015
CRBT Revenues (INR bn) Share of CRBT in MVAS
Source: Analysys Mason
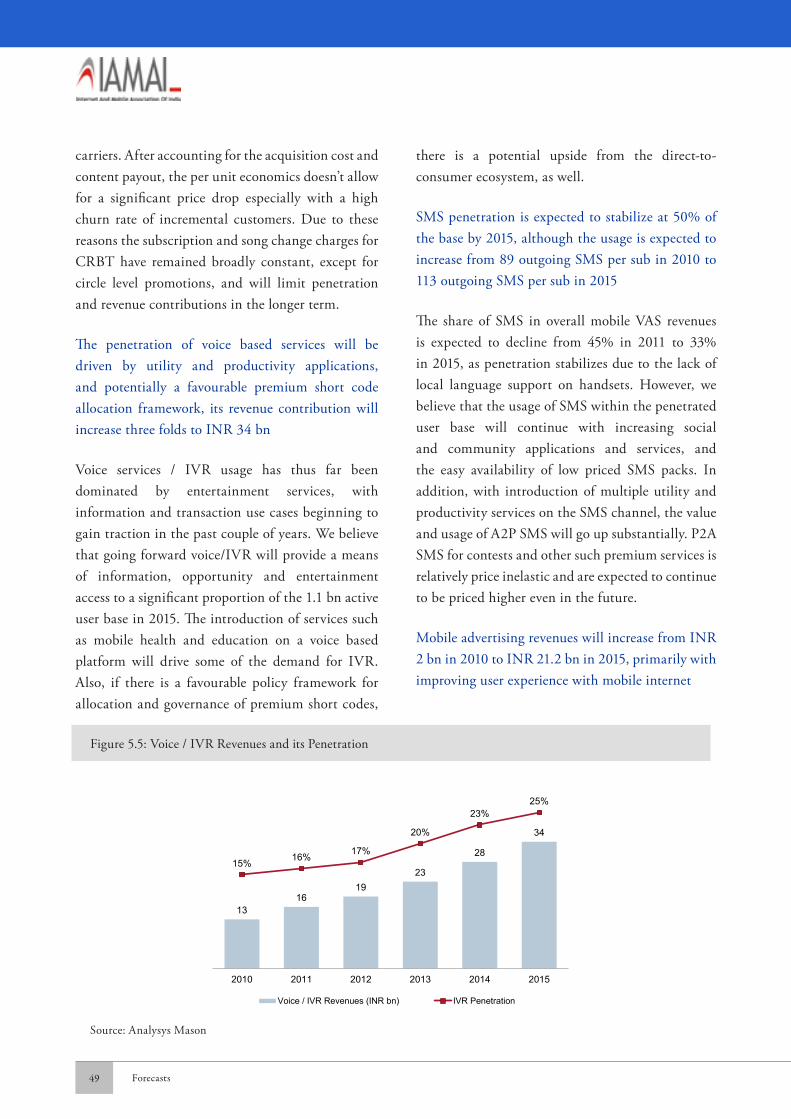
49 Forecasts
carriers. After accounting for the acquisition cost and content payout, the per unit economics doesn’t allow for a significant price drop especially with a high churn rate of incremental customers. Due to these reasons the subscription and song change charges for CRBT have remained broadly constant, except for circle level promotions, and will limit penetration and revenue contributions in the longer term.
The penetration of voice based services will be driven by utility and productivity applications, and potentially a favourable premium short code allocation framework, its revenue contribution will increase three folds to INR 34 bn
Voice services / IVR usage has thus far been dominated by entertainment services, with information and transaction use cases beginning to gain traction in the past couple of years. We believe that going forward voice/IVR will provide a means of information, opportunity and entertainment access to a significant proportion of the 1.1 bn active user base in 2015. The introduction of services such as mobile health and education on a voice based platform will drive some of the demand for IVR. Also, if there is a favourable policy framework for allocation and governance of premium short codes,
there is a potential upside from the direct-to-consumer ecosystem, as well.
SMS penetration is expected to stabilize at 50% of the base by 2015, although the usage is expected to increase from 89 outgoing SMS per sub in 2010 to 113 outgoing SMS per sub in 2015
The share of SMS in overall mobile VAS revenues is expected to decline from 45% in 2011 to 33% in 2015, as penetration stabilizes due to the lack of local language support on handsets. However, we believe that the usage of SMS within the penetrated user base will continue with increasing social and community applications and services, and the easy availability of low priced SMS packs. In addition, with introduction of multiple utility and productivity services on the SMS channel, the value and usage of A2P SMS will go up substantially. P2A SMS for contests and other such premium services is relatively price inelastic and are expected to continue to be priced higher even in the future.
Mobile advertising revenues will increase from INR 2 bn in 2010 to INR 21.2 bn in 2015, primarily with improving user experience with mobile internet
Figure 5.5: Voice / IVR Revenues and its Penetration
13 16
19 23
28
34
15% 16% 17%
20%
23%25%
2010 2011 2012 2013 2014 2015
Voice / IVR Revenues (INR bn) IVR Penetration
Source: Analysys Mason

Forecasts 50
Mobile advertising has remained limited to a lead generation channel due to multiple issues resulting in a sub-optimal customer experience and the associated reluctance of brands to seriously invest in this channel. With increasing penetration of mobile internet and improvements in data access and device features, we expect WAP ad inventory to grow substantially. In addition, with industry initiatives around ad effectiveness metrics and carrier profiling of end users, we believe that fill rates and CPMs
will rise. We also believe that the push SMS market has significant user privacy issues as well as policy scrutiny and will grow only marginally, especially if there is any regulatory intervention on termination charges. However, opt-in SMS advertising models will gain traction from better user profiling, introduction of SMS based utility services as well as enterprise CRM. Voice based advertising is not expected to grow significantly due to consumer intrusion and low fill rates.
Figure 5.6: Messaging Revenues (INR bn)
96
132
159
182 202
219
2010 2011 2012 2013 2014 2015
Source: Analysys Mason
Figure 5.7: Mobile Advertising Revenues (INR bn)
2 4
7
12
17
21
2010 2011 2012 2013 2014 2015
Source: Analysys Mason
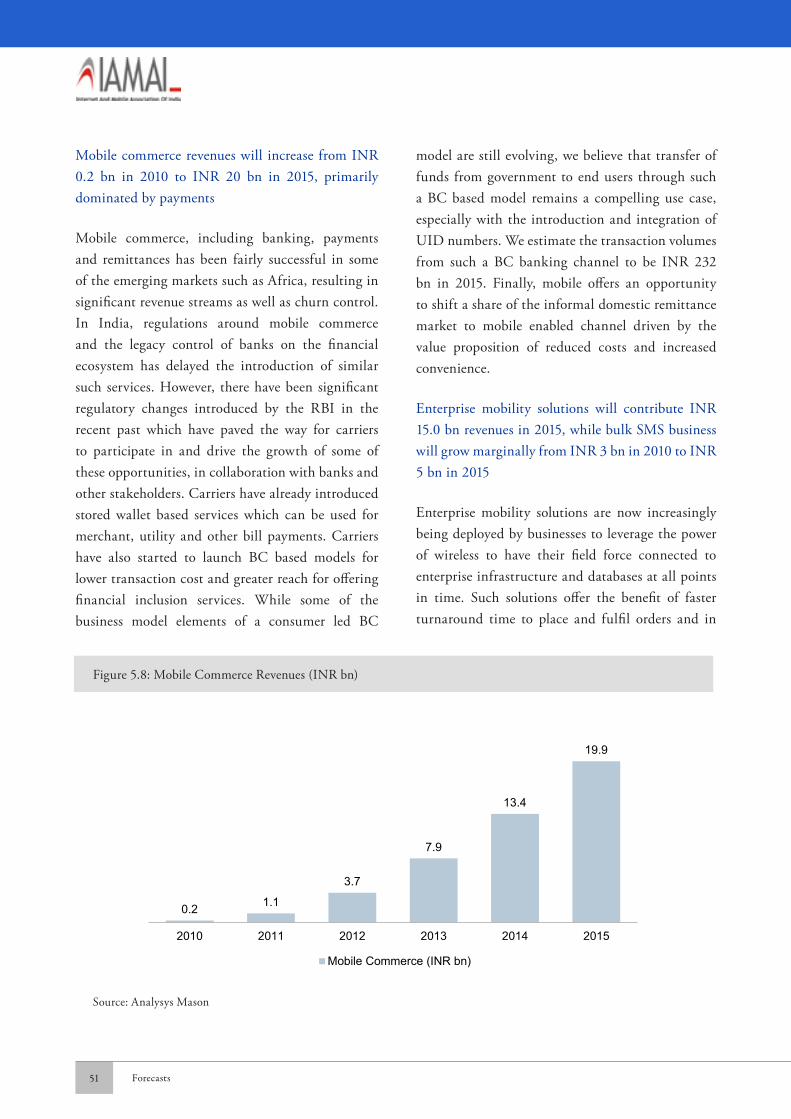
51 Forecasts
Mobile commerce revenues will increase from INR 0.2 bn in 2010 to INR 20 bn in 2015, primarily dominated by payments
Mobile commerce, including banking, payments and remittances has been fairly successful in some of the emerging markets such as Africa, resulting in significant revenue streams as well as churn control. In India, regulations around mobile commerce and the legacy control of banks on the financial ecosystem has delayed the introduction of similar such services. However, there have been significant regulatory changes introduced by the RBI in the recent past which have paved the way for carriers to participate in and drive the growth of some of these opportunities, in collaboration with banks and other stakeholders. Carriers have already introduced stored wallet based services which can be used for merchant, utility and other bill payments. Carriers have also started to launch BC based models for lower transaction cost and greater reach for offering financial inclusion services. While some of the business model elements of a consumer led BC
model are still evolving, we believe that transfer of funds from government to end users through such a BC based model remains a compelling use case, especially with the introduction and integration of UID numbers. We estimate the transaction volumes from such a BC banking channel to be INR 232 bn in 2015. Finally, mobile offers an opportunity to shift a share of the informal domestic remittance market to mobile enabled channel driven by the value proposition of reduced costs and increased convenience.
Enterprise mobility solutions will contribute INR 15.0 bn revenues in 2015, while bulk SMS business will grow marginally from INR 3 bn in 2010 to INR 5 bn in 2015
Enterprise mobility solutions are now increasingly being deployed by businesses to leverage the power of wireless to have their field force connected to enterprise infrastructure and databases at all points in time. Such solutions offer the benefit of faster turnaround time to place and fulfil orders and in
Figure 5.8: Mobile Commerce Revenues (INR bn)
0.2 1.1
3.7
7.9
13.4
19.9
2010 2011 2012 2013 2014 2015
Mobile Commerce (INR bn)
Source: Analysys Mason
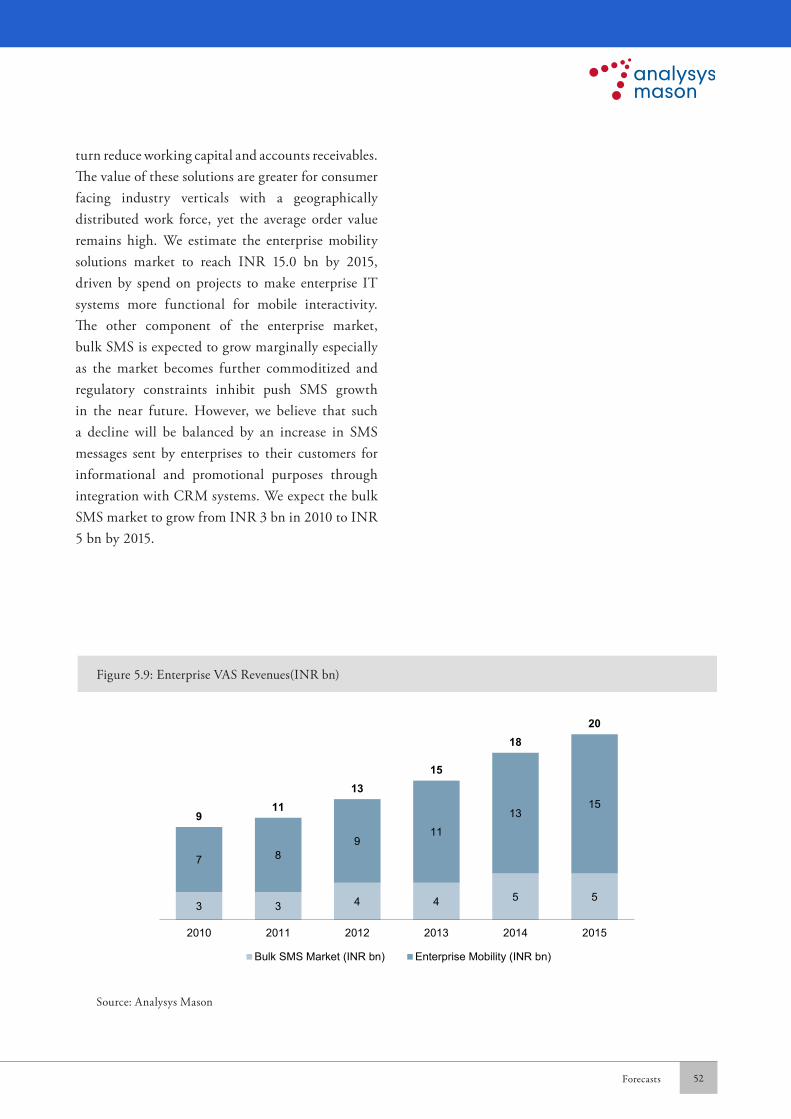
Forecasts 52
turn reduce working capital and accounts receivables. The value of these solutions are greater for consumer facing industry verticals with a geographically distributed work force, yet the average order value remains high. We estimate the enterprise mobility solutions market to reach INR 15.0 bn by 2015, driven by spend on projects to make enterprise IT systems more functional for mobile interactivity. The other component of the enterprise market, bulk SMS is expected to grow marginally especially as the market becomes further commoditized and regulatory constraints inhibit push SMS growth in the near future. However, we believe that such a decline will be balanced by an increase in SMS messages sent by enterprises to their customers for informational and promotional purposes through integration with CRM systems. We expect the bulk SMS market to grow from INR 3 bn in 2010 to INR 5 bn by 2015.
Figure 5.9: Enterprise VAS Revenues(INR bn)
3 3 4 4 5 5
7 89
11
1315
911
1315
1820
2010 2011 2012 2013 2014 2015
Bulk SMS Market (INR bn) Enterprise Mobility (INR bn)
Source: Analysys Mason

Annexure: Sponsors’ Profiles

Platinum Sponsor
Gold Sponsors
Annexure: Sponsors’ Profiles 55
Summary
Founded in 2000, mPortal is a leading enabler of next generation mobile user experiences. The mPortal solution simplifies and optimizes access to data services for users to make personal and relevant choices about mobile applications and content.
Company Overview
Management Team: D. P. Venkatesh, Founder & CEO; P.G. Ponnapa, CEO Emerging Markets
Investors: Friedli Corp Finance, Zurich
Key Platform Partnerships: Amazon, Apple, Google, HP/Palm, HTML 5, Mediatek, Microsoft, Qualcomm and RIMM
Key Clients: AOL, Bloomberg, Disney, ESPN, Time Warner Cable, Comcast, Cox, Cricket, Reliance Infocomm and Verizon Wireless
Key Offerings & Business Models
Offers SPRINGBOARD Customer Experience Platform which provides two key components of the connected device experience ecosystem:
• SPRINGBOARD Discovery Platform which is a connected device software platform that permits the development of a next generation user experience across multiple mobile devices, tablets and smart TVs with a focus on Idle/Home screen presence.
• SPRINGBOARD Delivery Platform which is a content and application creation, aggregation, analytics, monetization and delivery platform for managing and delivering connected device content and applications.
Business Model is a cloud based globally managed services model with revenues generated by licensing software directly to service providers and device players as well as revenue share arrangements based on value or revenues generated by its platform.
Future Plans
Focus on Emerging markets – with a solution aimed at Handsets in the feature phone and smart phone space enhancing Content discovery across device and OS platforms ranging from MTK, BREW, Android, Microsoft, RIMM and others.
Help Carriers in the Developed and Emerging Markets optimize their mobile experience by superior user experience and enhanced Home Screen Content Discovery across all types of mobile phones, tablets and Smart TVs.
Company Profile: mPortal

Annexure: Sponsors’ Profiles 56
Dyn
amic
Wid
get P
latf
orm
mPortal’s Idle Screen Solution

Annexure: Sponsors’ Profiles 57
Company Profile: Amdocs
Summary
Founded in 1982, Amdocs is the market leader in customer experience systems innovation. The company combines business and operational support systems, service delivery platforms, proven services and deep industry expertise to enable service providers and their customers to do more in the connected world. Amdocs’ offerings help service providers explore new business models, differentiate through personalized customer experiences, and streamline operations. A global company with revenue of approximately $3.0 billion in fiscal 2010, Amdocs has over 19,000 employees & serves customers in more than 60 countries worldwide.
Company Overview
Management Team: Eli Gelman, CEO; Anshoo Gaur, India Head; Shrirang Bapat, Vice President, R&D India
Investors: Listed on NYSE (DOX)
Key Partnerships: Alcatel Lucent, Cognizant, CTC, HT, IBM, tech Mahindra and others
Key Clients: Amdocs’ customer base includes services companies in more than 60 countries worldwide. Some key customers are AT &T, Bell Canada, SingTel Optus, Videocon, Vodafone Germany, Vodafone UK, Vodafone Greece and others
Key Offerings
Offers OSS/BSS solutions.
Offers Managed Services such as Customer Management, Revenue Management, Service Delivery and Portfolio Management.
Future Plans
Plans to amplify the training programs to equip the employees with best of tools and knowledge to perform at highest levels; focus on new projects and launches; refine and expand the base modules and develop customer experience systems; pursue new acquisitions and other initiatives to offer new products and services.
Amdocs is #1 in Worldwide OSS and Billing with a 31.2% Market Share
(January 2009)
Amdocs named the #1 Telecom Operations Management Systems Vendor
(May 2009)
“Amdocs benefits from a strong managed services business…”
(February 2009)

Annexure: Sponsors’ Profiles 58
Company Profile: Bubble Motion
Summary
Leader in Mobile Social Media with the launch of BubbleBlog – a voice blogging service that has grown rapidly throughout Asia (started in India).
Company Overview
Management Team: Silicon Valley veterans transplanted to Asia - from former startups Facebook, Yahoo!, Oracle, BEA Systems, Skype and Google
Investors: Sequoia Capital US, Sequoia Capital India, SingTel, Comcast, Palomar Ventures, Infocomm Investors and NGP
Global and India Footprint: Launching with all major operators in India as well as in Indonesia, Japan and the Philippines
Key Partnerships: Partnered with 30+ media companies to secure exclusive rights to 500+ celebrities and with 20+ Tier 1 operators to launch BubbleBlog
Key Clients: Airtel, Reliance, Vodafone, Tata, Idea Cellular, Telkomsel, Indosat, XL, Globe, Smart, AIS, KDDI, Softbank, Turkcell and other operators
Subscriber Base: Over 10 million (June 2011)
Growth Rate: 382% y-o-y
Key Focus
Social Media: Focused solely on social media, specifically mobile social microblogging
BubbleBlog: Initial service launch, which is a voice blogging service (i.e, Twitter with a voice)
Future Plans
Text/Photo/Video: Initial service was ‘voice’ blogging, but already added text as well as deep Facebook/Twitter integration – next up: photo and video;
Expand Geographies: To rest of Asian countries not yet launched in: Thailand, Malaysia, Vietnam, South Korea, Taiwan, Cambodia and others
Smartphone Apps: Launch an iPhone and Android app for BubbleBlog

Annexure: Sponsors’ Profiles 59
Company Profile: IMImobile
Summary
IMImobile is the leading, trusted specialist provider of mobile data delivery technology platforms and managed services globally for top telecom operators, B2C brands and media companies enabling an open mobile market managed services.
Our leading DaVinci Evolved Service Platform™ powers a wide range of services (created, delivered & managed by IMImobile) including: social aggregation, contact management, mobile advertising & marketing, messaging, storefronts, ring back tones & digital music services. Currently, IMImobile has presence across Asia, Europe, LatAm, & Middle East. A 650 employee base provides services to 71 operators & blue-chip clients in 59 countries.
Company Overview
Management Team (India): Vishwanath Alluri, Founder, Chairman & CEO; Shyam Bhat, CTO & Founder
Global Footprint: Besides India, UK, USA, Dubai, Dhaka and Sri Lanka
Key Partnerships: National Geographic, SaReGaMa, CRY, Warner Music Group & Universal
Key Clients: Operators: MTN, Vodafone, Virgin Mobile, Airtel, MTNL, BSNL, MTNL, Reliance, Aircel, TTST, Maxis, Grameenphone and others
Media, Advertisers & Enterprises: Reuters, Google, Meteor, Sahara, Hindustan Times, Hindu, Yahoo, Cricinfo, Star, Jaya TV and others
Global Membership in Trade Industry Associations: GSMA, WAC (Wholesale Application Community), MEF (Mobile Entertainment Forum) & MMA (Mobile Marketing Association)
Key Offerings and Business Models
Offers unique combination of cost optimisation and revenue generation. Further, IMImobile is working towards opening operators’ dormant network assets so that network works as a ‘smart pipe’ instead of a ‘bit pipe’.
Provides a unique combination of content management, operational model, business model and wholly-owned technology which enables a quality and breadth of solution, cost effective SaaS delivery model and high service level availability unmatched in the industry.
Offers a unique personalized SMS service - mVaayoo™. It is the most cost effective End-to-End Enterprise Mobile Messaging Service with an incomparable, high service level availability.
Future Plans
Plans of creating and driving an open global mobile marketplace for new applications and services, and to help operators realize the network-as-a-service model and make their networks smarter. It also plans to become a specialist provider of technology platforms and managed services globally to 100 leading telecom operators, B2C brands and media companies in the next 2 years and to over 500 customers in 5 years.

Annexure: Sponsors’ Profiles 60
Company Profile: One97 Communication
Summary
One97 is a pioneer in mobile internet services for consumers in India. It has the widest and largest deployment of telecom application cloud platform.
Thriving on innovation, One97 delivers mobile content, advertising and commerce services to millions of mobile consumers.
Company Overview
Headquartered in New Delhi, One97 is more than 1,000 people strong team with regional offices in Mumbai, Chennai, Dhaka, Lagos and Dubai
Management Team: Vijay Shekhar Sharma, Chariman & Managing Director
Investors: Marquee investors like Intel Capital, SAIF Partners and Silicon Valley Bank
Investments: One97 has set up a USD 100 million fund to invest and incubate in mobile ecosystem. It has already made investments in the following companies:
• Oorja, New Delhi: An analytics driven comprehensive customer communications platform
• LeapSky Wireless, Singapore: A mobile internet roaming service
• Ciqual, Scotland: A mobile Internet analytics platform
• TenCube, Singapore: Makers of award winning mobile internet security service WaveSecure (sold to McAfee, USA)
• PayTM, New Delhi: A mobile commerce platform for consumers and enterprise
Key Offerings and Business Models
Offers Inapaq branded content services for mobile consumers.
Offers Oorja Mobile Advertising – pay per click and pay per insert mobile advertising on 2.5G and mobile internet properties.
Provides a mobile commerce platform, PayTM for mobile recharge offers and deals for consumers.
Future Plans
Leading emerging market player in select segments of mobile internet value chain.
Annexure: Sponsors’ Profiles 61
Company Profile: Qualcomm
About Qualcomm Inc.
Overview
Qualcomm Incorporated, a FORTUNE 500® company is the world leader in next-generation mobile technologies. Today, Qualcomm technologies are powering the convergence of mobile communications and consumer electronics, making wireless devices and services more personal, affordable and accessible to people everywhere. Established in July 1985, Qualcomm is headquartered in San Diego, California and has an employee base of about 17,500 highly skilled professional spread across 139 locations worldwide. Qualcomm believes in giving back to community and encourages employees to achieve work-life balance. Qualcomm is listed on the NASDAQ under the symbol QCOM. Dr. Paul E. Jacobs is the chairman and chief executive officer of Qualcomm.
Quick Facts
• Revenues $10.99 billion (fiscal year 2010)
• Approximately 17,500 full-time and temporary employees
• GAAP R&D expenses $2.55 billion for fiscal year 2010 (23% of revenues)
• Ranked #33 in FORTUNE’s list of “100 Best Companies to Work For” in 2011
About Qualcomm India
Qualcomm established its India operations in 1996 with Qualcomm India Private Limited. Headquartered in Mumbai, it also has a business development location in Delhi. Kanwalinder Singh, president, Qualcomm India and South Asia heads Qualcomm’s operations in the region.
In addition to its offices in Mumbai and Delhi, Qualcomm has R&D presence in Hyderabad and Bangalore, including a handset pre-certification lab in Hyderabad. Qualcomm has expanded its presence with representation of Qualcomm Ventures.
Quick Facts:
• Dr. Avneesh Agrawal, President, Qualcomm India & South Asia and Senior Vice President, Qualcomm, Inc.
• Office locations: Mumbai, New Delhi, Hyderabad, Bangalore
• Recognized among India’s top 25 ‘Great Places to Work’ for five consecutive years (2007-2011) and ranked No. 1 in telecom sector in 2008, 2009 and 2010.
Annexure: Sponsors’ Profiles 62
Company Profile: SMS Gupshup
Summary
Founded in 2007, SMS Gupshup is India’s largest and fastest growing group messaging platform processing over 2.5 billion messages per month, with over 45 million users and 3.5 million communities.
Company Overview
Management Team: Beerud Sheth, Co-Founder & CEO; Rakesh Mathur, Co-Founder and Chairman; Vishwanath Ramachandaran, Founding Executive & CTO; Milind Agarwal, Founding Executive & VP Sales; Chirag Jain, Founding Executive
Investors: Charles River Ventures, Helion Ventures, Globespan Ventures, Private Equity funds and others
Key Partnerships: Tata, Aircel, Airtel, Loop, BSNL (India); Sun, Smart, Globe (Philipinnes); Telkomsel, Bakrie (Indonesia); Batelco (Bahrain); Dialog (Srilanka)
Key Offerings
Offers mobile marketing solutions to acquire new customers, engage and retain existing customers.
Provides CRM applications (Sales Tracker, Inventory Tracker, Loyalty program, rewards & offers, content cards and other apps).
Offers mobile communities for social networking and chatrooms.
Launched “Reply-All” (many-to-many) SMS capability.
Future Plans
Plans to expand its network across new geographies.
Plans to increase focus on expanding its product portfolio to provide a richer experiences to smartphone users.
Plans to strengthen the sales and marketing teams in India and international markets.
0%5%10%15%20%25%30%35%40%45%50%
0
50,000
100,000
150,000
200,000
250,000
300,000
350,000
Jan-
09Fe
b-09
Mar
-09
Apr
-09
May
-09
Jun-
09Ju
l-09
Aug
-09
Sep
-09
Oct
-09
Nov
-09
Dec
-09
Jan-
10Fe
b-10
Mar
-10
Apr
-10
May
-10
Jun-
10Ju
l-10
Aug
-10
Sep
-10
Oct
-10
Nov
-10
Dec
-10
Jan-
11Fe
b-11
last 30-day Active Publishers Active Subscriber %
SMS Gupshup Active User Base (Jan 09-Feb11)

Analysys Mason is a trusted adviser on telecoms, technology and media. With 260 staff across 12 offices, we are respected worldwide for our exceptional quality of work, independence and flexibility in responding to client needs. For more than 25 years, we have been helping clients in more than 100 countries to maximise their opportunities.
We work with our clients, including operators, regulators and end users, to:
• design winning strategies that deliver measurable results
• make informed decisions based on market intelligence and analytical rigour
• develop innovative propositions to gain competitive advantage
• make intelligent investments in public and private companies of varying sizes
Analysys Mason’s India office has been operational since 2004, and has a team of 19 professionals with strong experience in corporate planning, strategy consulting, transaction advisory and research.
Our experience in the mobile value added services industry in India includes the following projects:
• Corporate Planning (Global Software and Services Vendor, 2009): Identified distribution channels and go-to-market strategy in India for their on-device portal integrated application platform. Recommendations included a detailed plan indicating the short, medium and long-term objectives, including the types of applications / services
• Go-to-Market Strategy (Global MVAS provider, 2009): Developed a growth strategy (organic and inorganic) for the client’s India business, by identifying possible growth opportunities based on the total addressable market, competitive intensity across bearer channels (e.g. WAP) and distribution channels (e.g. D2C) and possible business model shifts between current and future services
• Transaction Advisory (Private Equity Fund, 2011): Conducted a business due diligence of a leading local search and listings service provider in India. Developed a market model to understand the future scalability potential, evaluated the competitive and regulatory scenario and estimated the incremental revenue opportunity from increase in price, penetration and upgrade
• Transaction Advisory (Private Equity Fund, 2011): Identified key growth areas within mobile VAS in India based on their demand and supply analysis and total addressable market. Within the growth areas, evaluated leading VAS companies and shortlisted them based on multiple parameters
For more information, please contact:
Analysys Mason
BD – 4th Floor, Big Jo’s Tower
Netaji Subhash Place, Pitampura
New Delhi, 110034, India
Tel: +91 11 4700 3100
Fax : +91 11 4700 3102
www.analysysmason.com
The Internet and Mobile Association of India [IAMAI] is a young and vibrant association with ambitions of representing the entire gamut of digital businesses in India. It was established in 2004 by the leading online publishers, but in the last seven years has come to effectively address the challenges facing the digital and online industry including mobile content and services, online publishing, mobile advertising, online advertising, ecommerce and mobile & digital payments among others.
Among the macro issues that has kept the association busy have been content and services on internet and mobile, internet through mobile, broadband penetration, tech entrepreneurship and tech entrepreneurship funding.
Seven years after its establishment, the association is still the only professional industry body representing the online and mobile VAS industry in India.
The association is registered under the Societies Act and is a recognised charity in Maharashtra. With a membership of 110 odd Indian and MNC companies, offices in Delhi and Mumbai and a permanent and professional staff of 10, the association is well placed to work towards charting a growth path for the digital industry in India.
For more information please contact:
Internet & Mobile Association of India
F-36, Basement
East of Kailash
New Delhi, 110 065
Tel: +91 11 4657 0328
www.iamai.in


www.iamai.in www.analysysmason.com