America's Macroeconomic Policies and the Global Economy
21
America’s Macroeconomic Policies and the Global Economy Menzie D. Chinn Robert M. La Follette School of Public Affairs and Department of Economics University of Wisconsin and NBER Presentation at Global Hot Spots Pyle Center, UW Madison December 6, 2013
Transcript of America's Macroeconomic Policies and the Global Economy
America’s Macroeconomic Policies and the Global Economy
Menzie D. ChinnRobert M. La Follette School of Public Affairs and Department of EconomicsUniversity of Wisconsin and NBER
Presentation at Global Hot SpotsPyle Center, UW MadisonDecember 6, 2013
Outline
Where have we been?Navigating the US recovery International spilloversDownside risks
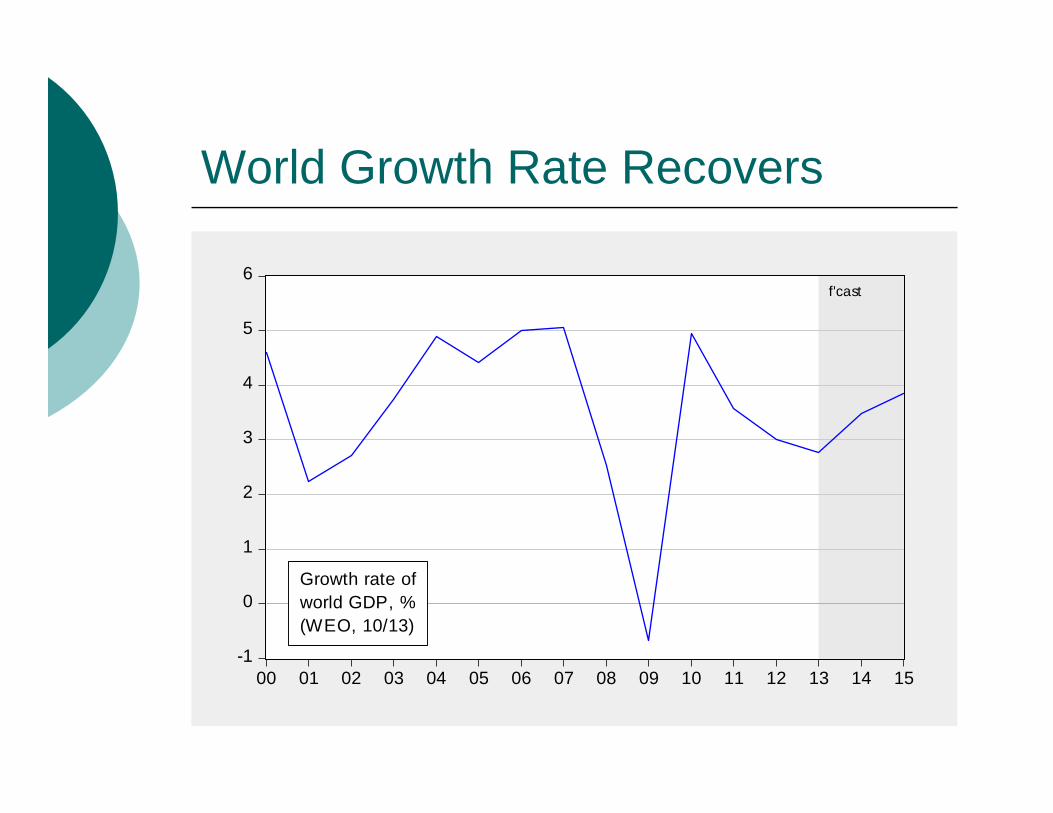
World Growth Rate Recovers
-1
0
1
2
3
4
5
6
00 01 02 03 04 05 06 07 08 09 10 11 12 13 14 15
Growth rate ofworld GDP, %(WEO, 10/13)
f'cast
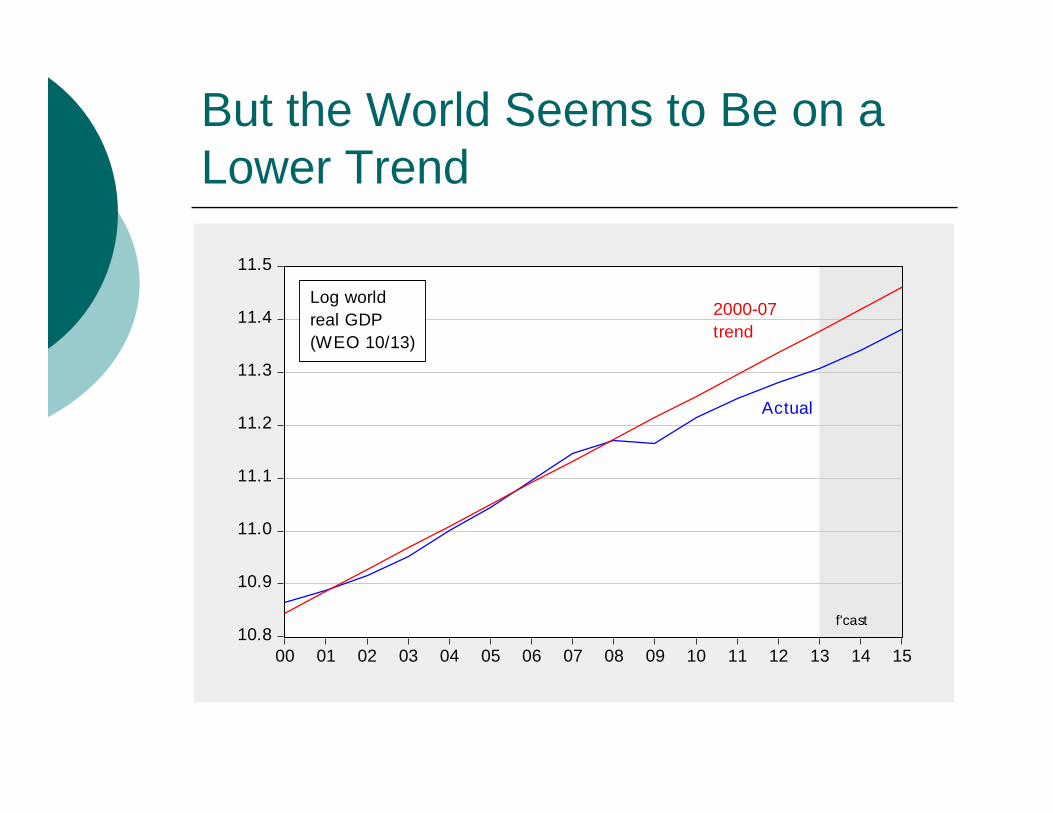
But the World Seems to Be on a Lower Trend
10.8
10.9
11.0
11.1
11.2
11.3
11.4
11.5
00 01 02 03 04 05 06 07 08 09 10 11 12 13 14 15
Log worldreal GDP(WEO 10/13)
2000-07trend
Actual
f'cast
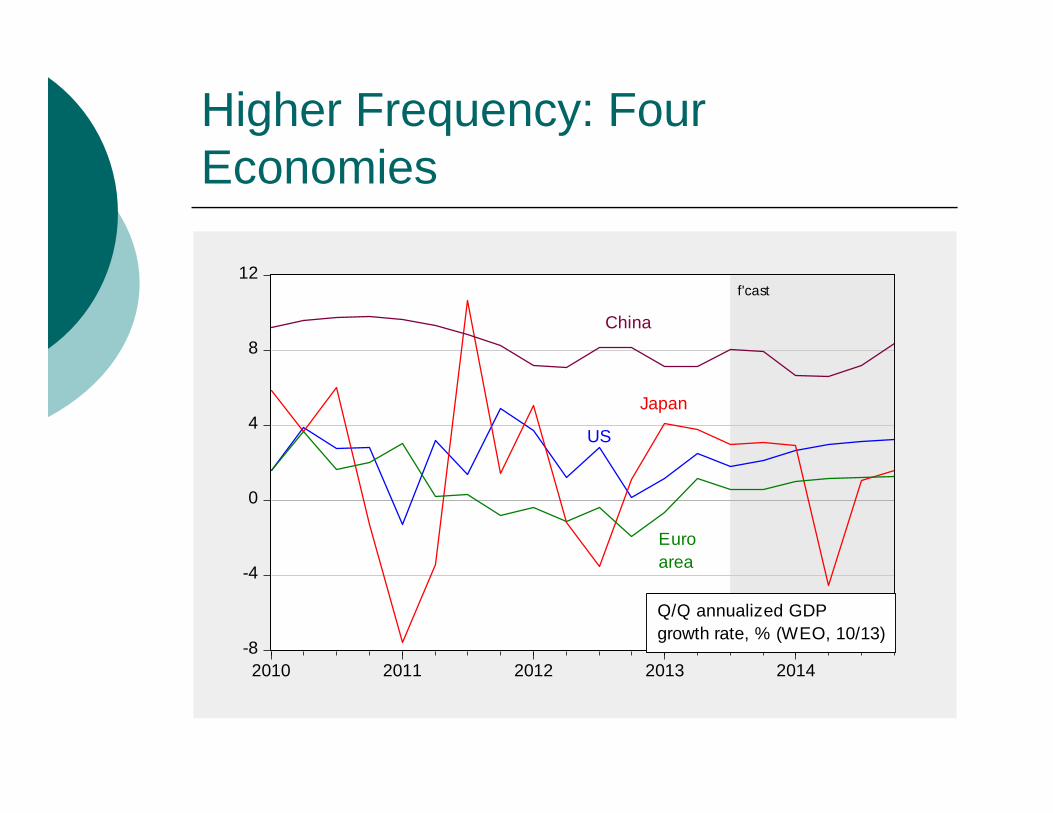
Higher Frequency: Four Economies
-8
-4
0
4
8
12
2010 2011 2012 2013 2014
Q/Q annualized GDPgrowth rate, % (WEO, 10/13)
f'cast
US
Japan
Euroarea
China
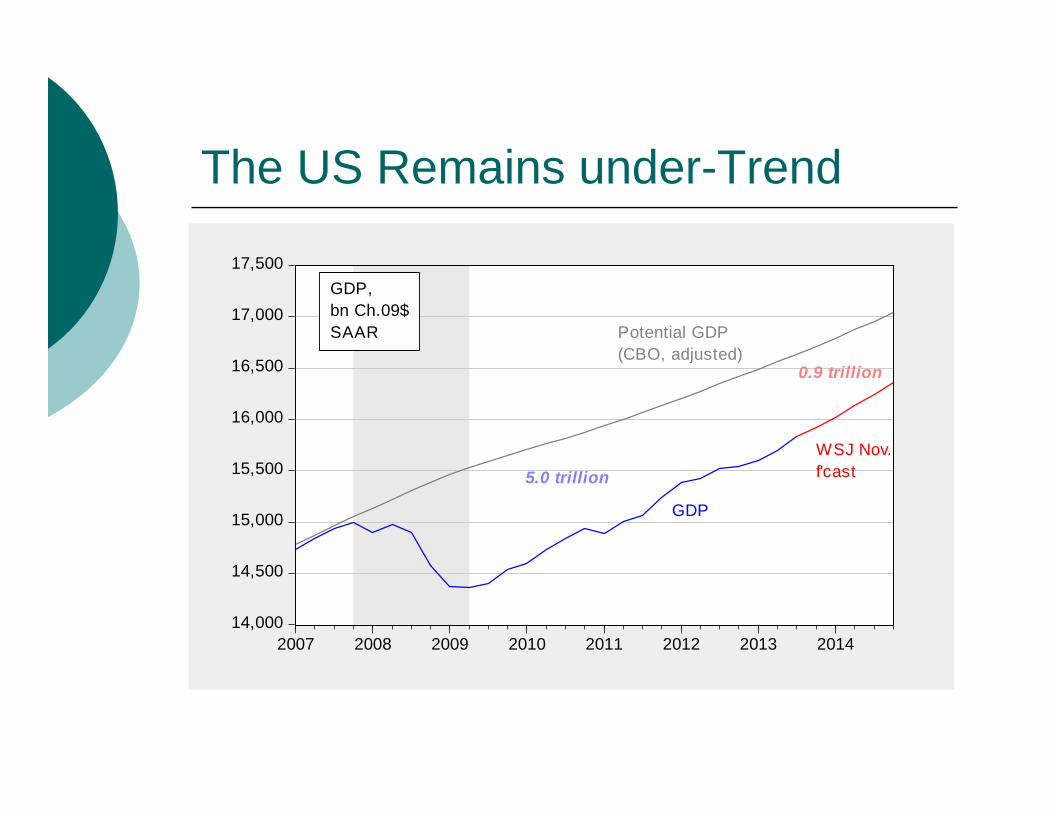
The US Remains under-Trend
14,000
14,500
15,000
15,500
16,000
16,500
17,000
17,500
2007 2008 2009 2010 2011 2012 2013 2014
GDP
WSJ Nov.f'cast
Potential GDP(CBO, adjusted)
GDP,bn Ch.09$SAAR
5.0 trillion
0.9 trillion
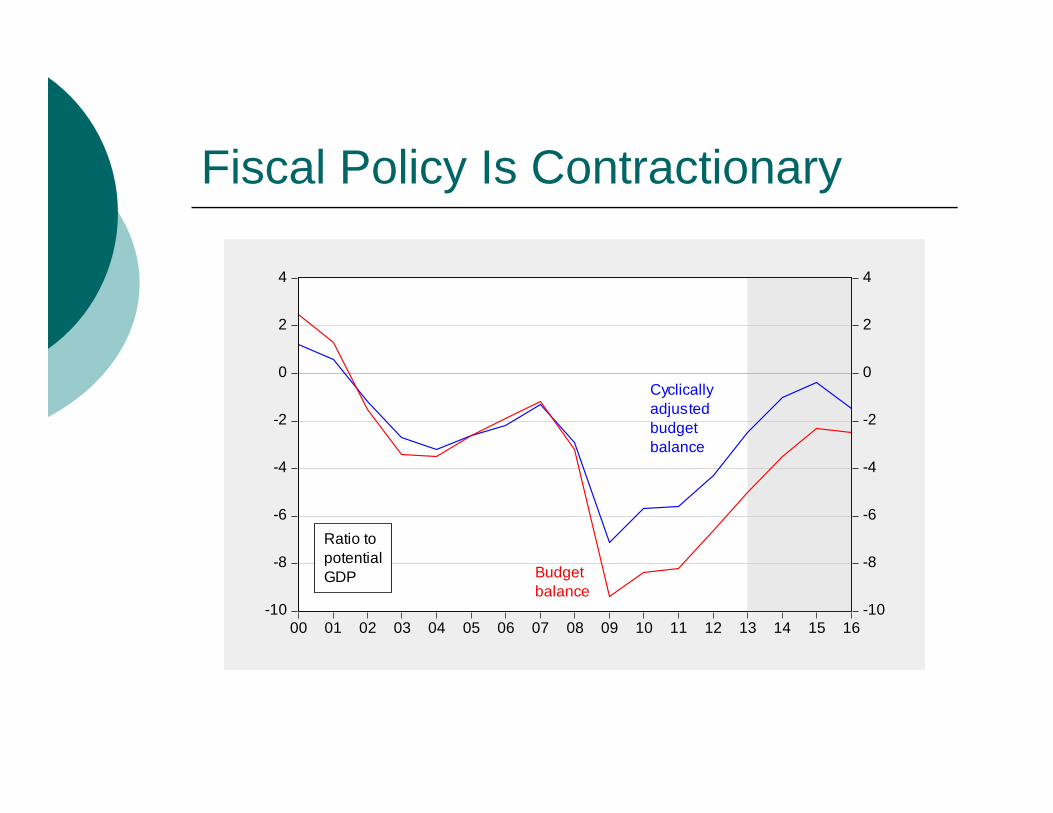
Fiscal Policy Is Contractionary
-10
-8
-6
-4
-2
0
2
4
-10
-8
-6
-4
-2
0
2
4
00 01 02 03 04 05 06 07 08 09 10 11 12 13 14 15 16
Budgetbalance
Cyclicallyadjustedbudgetbalance
Ratio topotentialGDP
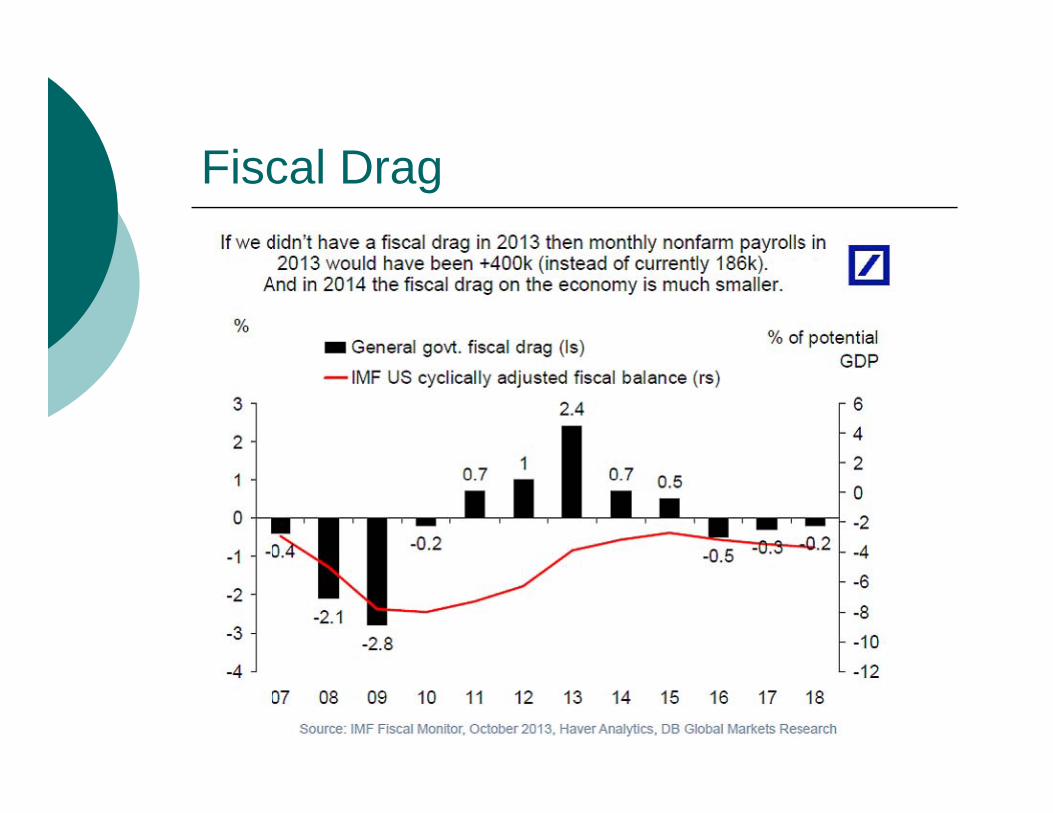
Fiscal Drag
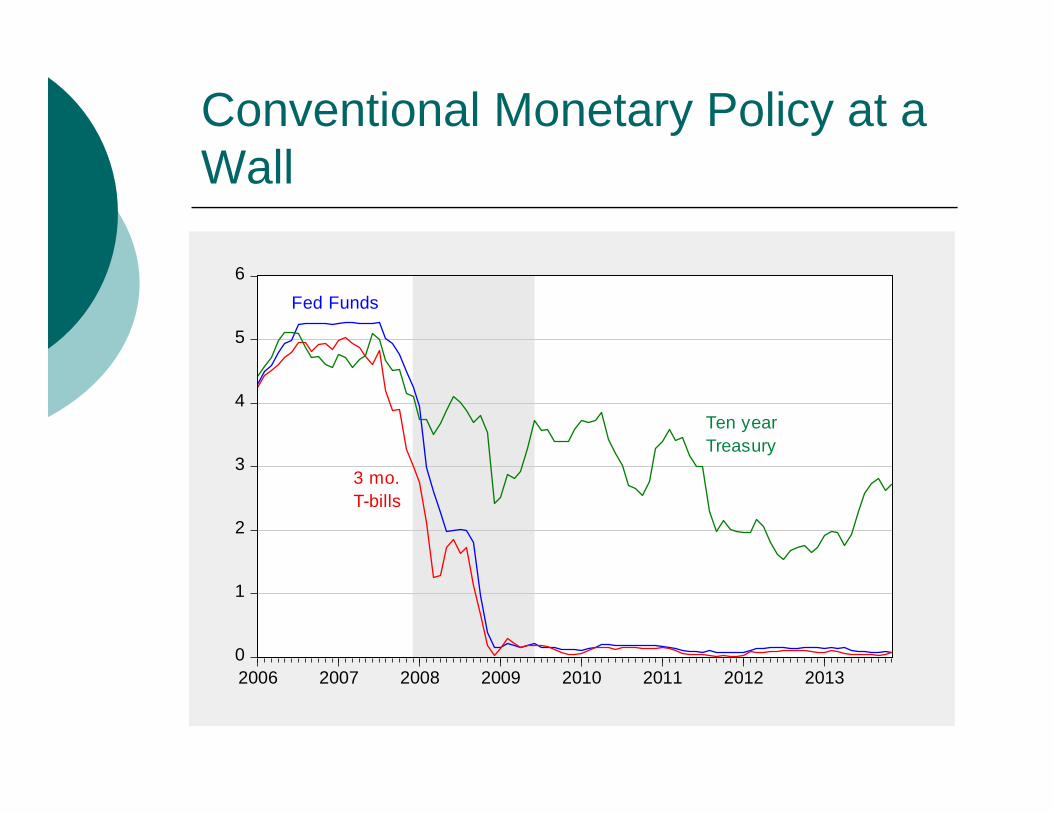
Conventional Monetary Policy at a Wall
0
1
2
3
4
5
6
2006 2007 2008 2009 2010 2011 2012 2013
Fed Funds
3 mo.T-bills
Ten yearTreasury
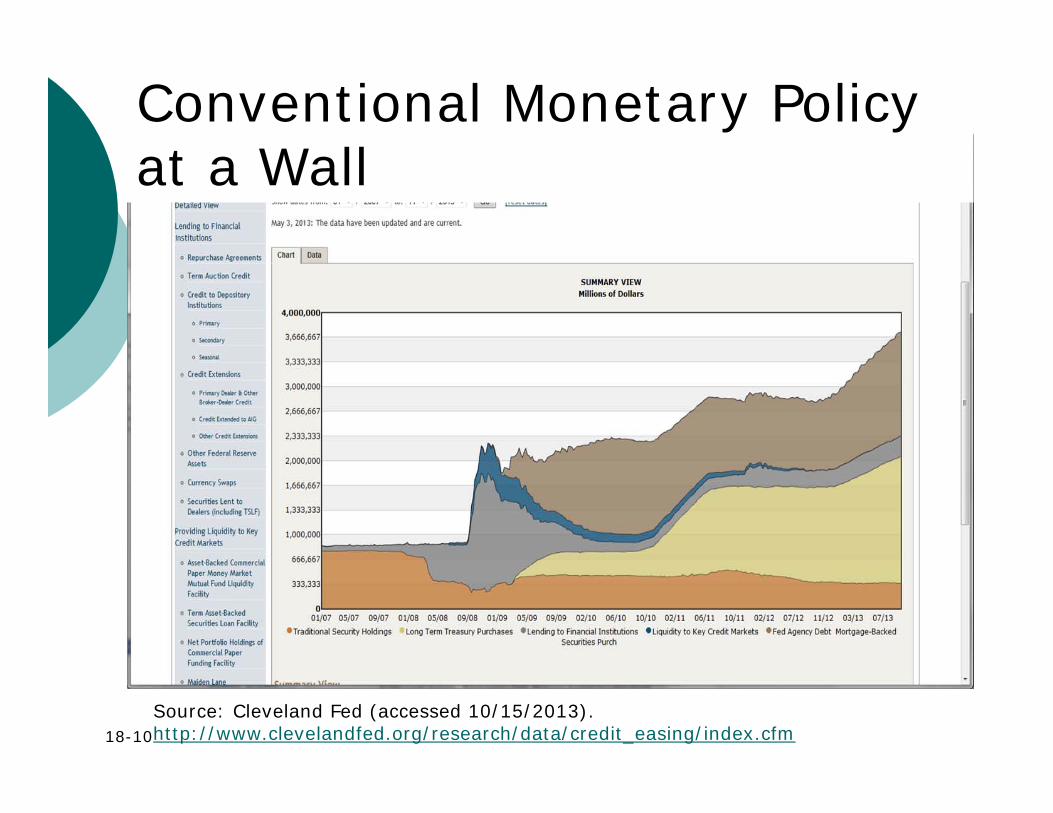
18-10Source: Cleveland Fed (accessed 10/15/2013).http://www.clevelandfed.org/research/data/credit_easing/index.cfm
Conventional Monetary Policy at a Wall

Spillover Effects on the World Economy
Growth effectsUncertainty effectsMonetary policy effects
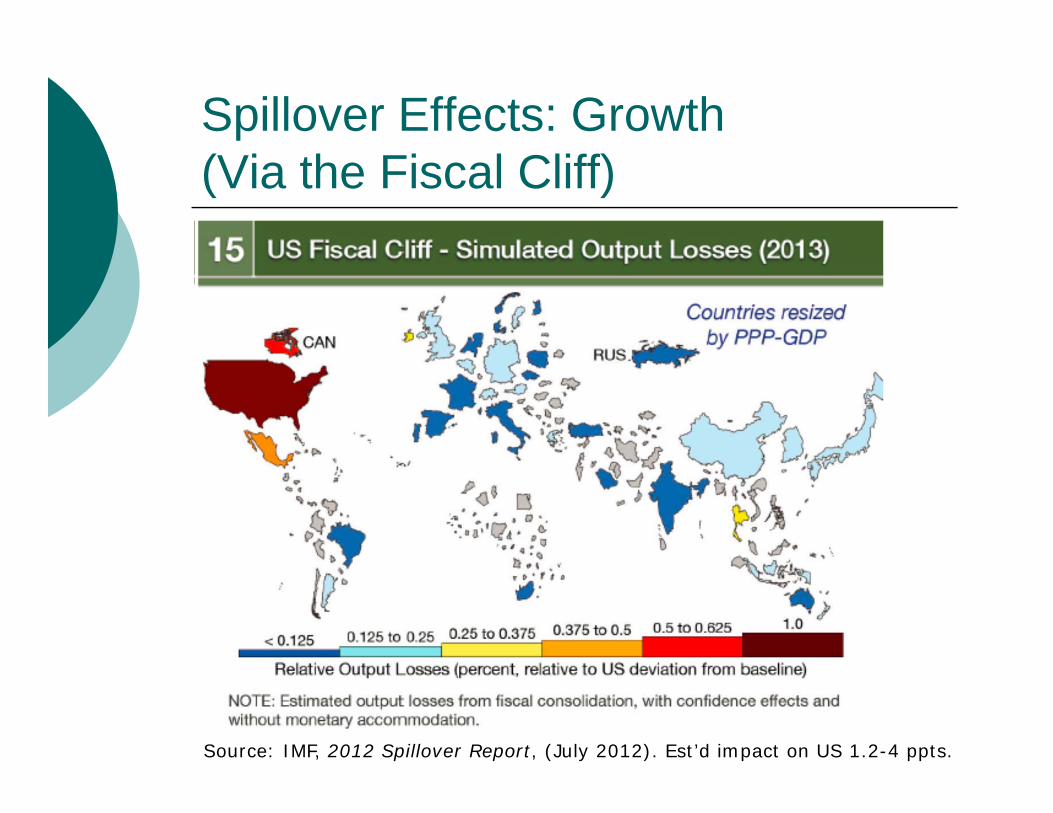
Spillover Effects: Growth(Via the Fiscal Cliff)
Source: IMF, 2012 Spillover Report, (July 2012). Est’d impact on US 1.2-4 ppts.
Spillover Effects: Uncertainty
Heightened policy uncertainty has a negative impact on output (maybe)
Economic uncertainty might depress investment and output
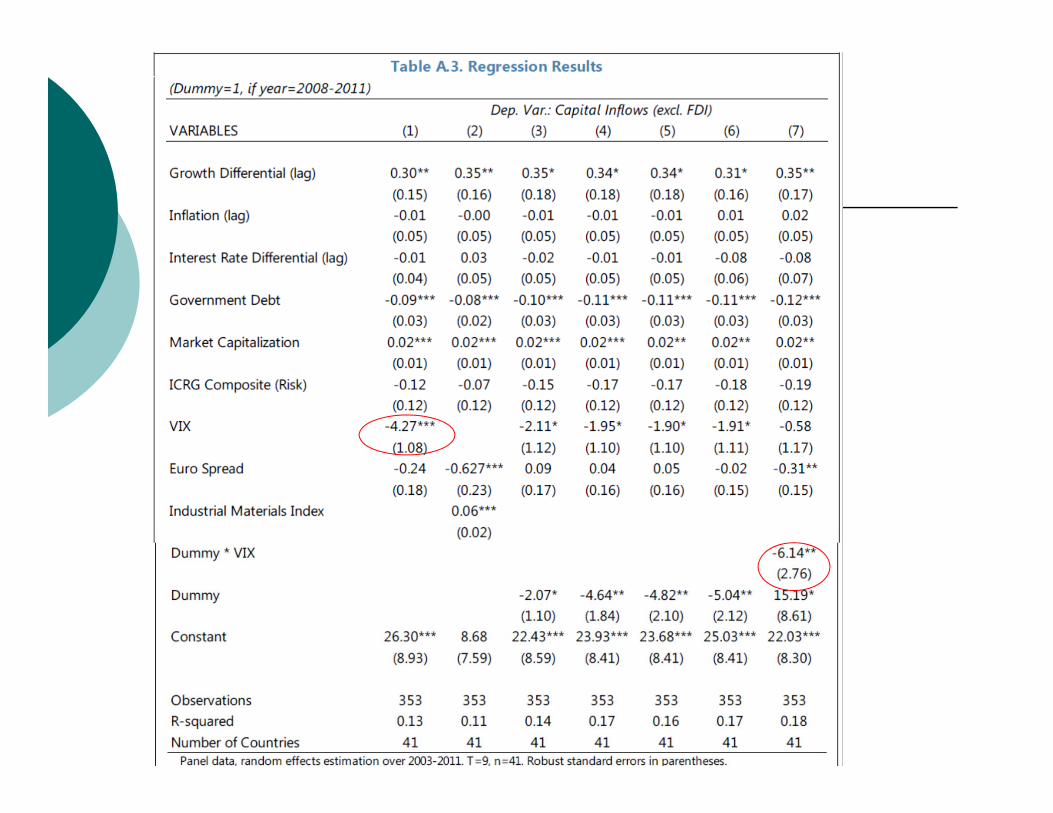
Higher uncertainty appears to induce capital flows to the US.
0
100
200
300
400
500
600
2011 2012 2013
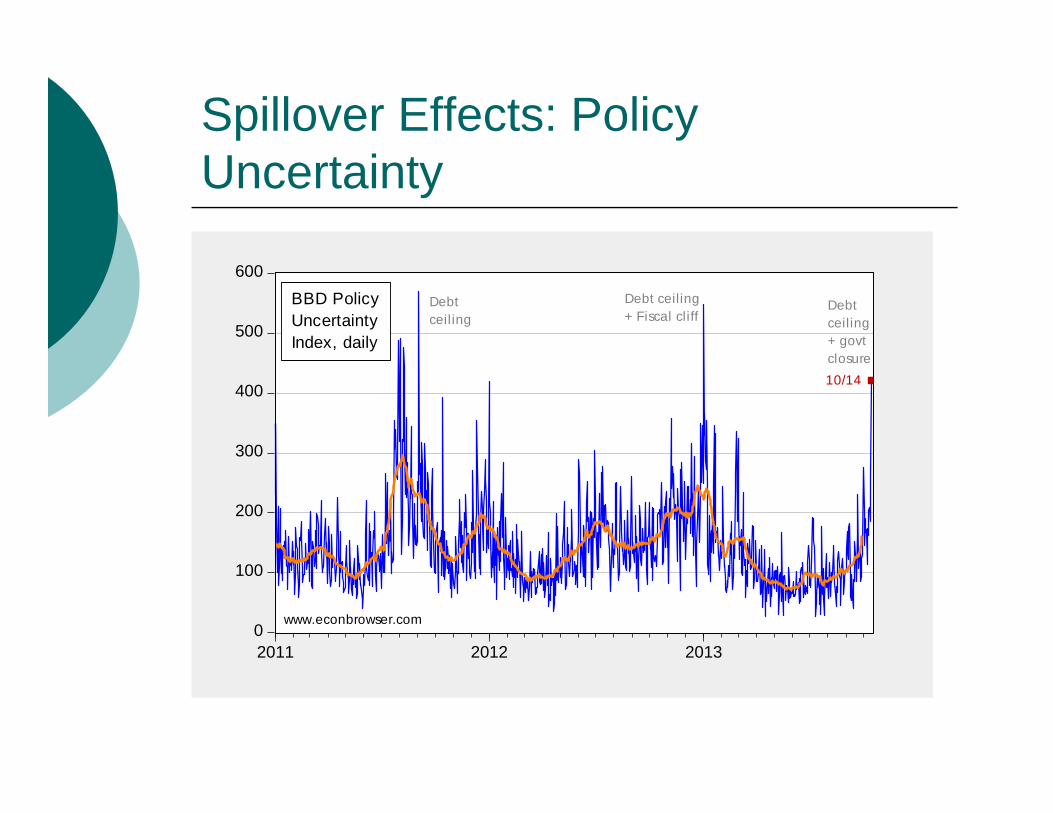
Debt ceiling+ Fiscal cliff
Debtceiling
BBD PolicyUncertaintyIndex, daily
www.econbrowser.com
10/14
Debtceiling+ govtclosure
Spillover Effects: Policy Uncertainty
Spillover Effects: Monetary Policy
Quantitative easing/credit easing had different effects at different times
But the mere mention of a taper induced a large reaction in June 2013
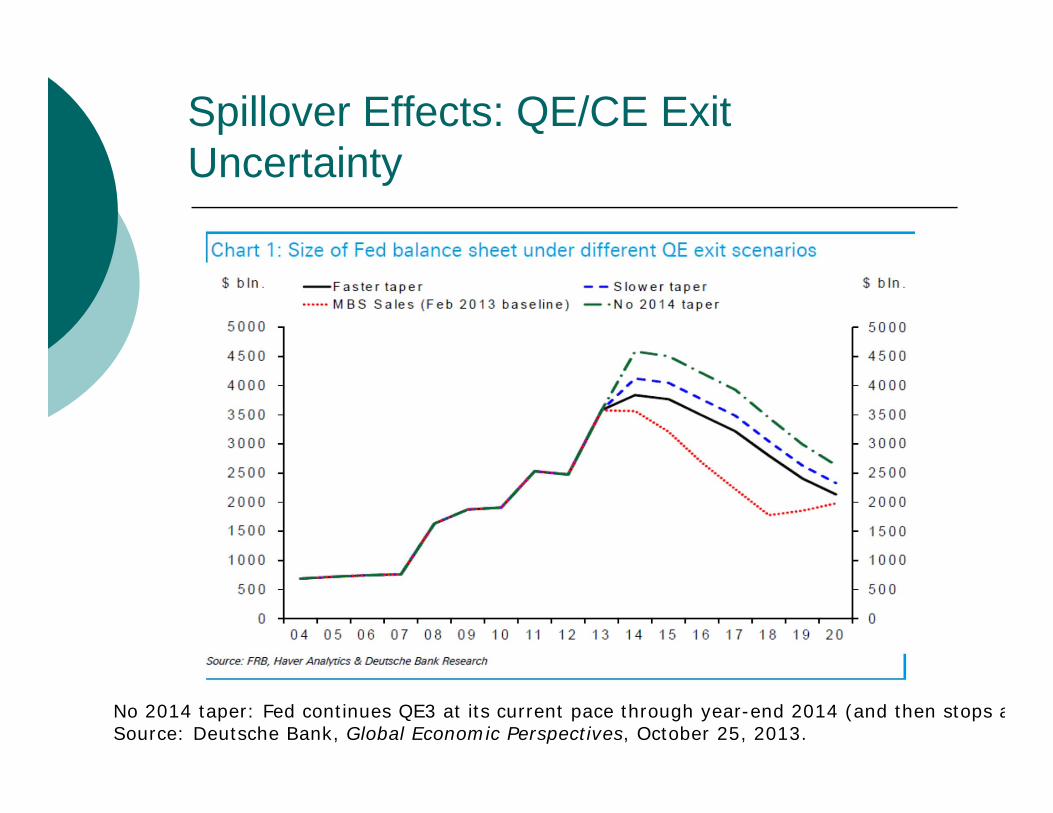
Spillover Effects: QE/CE Exit Uncertainty
No 2014 taper: Fed continues QE3 at its current pace through year-end 2014 (and then stops aSource: Deutsche Bank, Global Economic Perspectives, October 25, 2013.

Spillover Effects: Extended Guidance Uncertainty
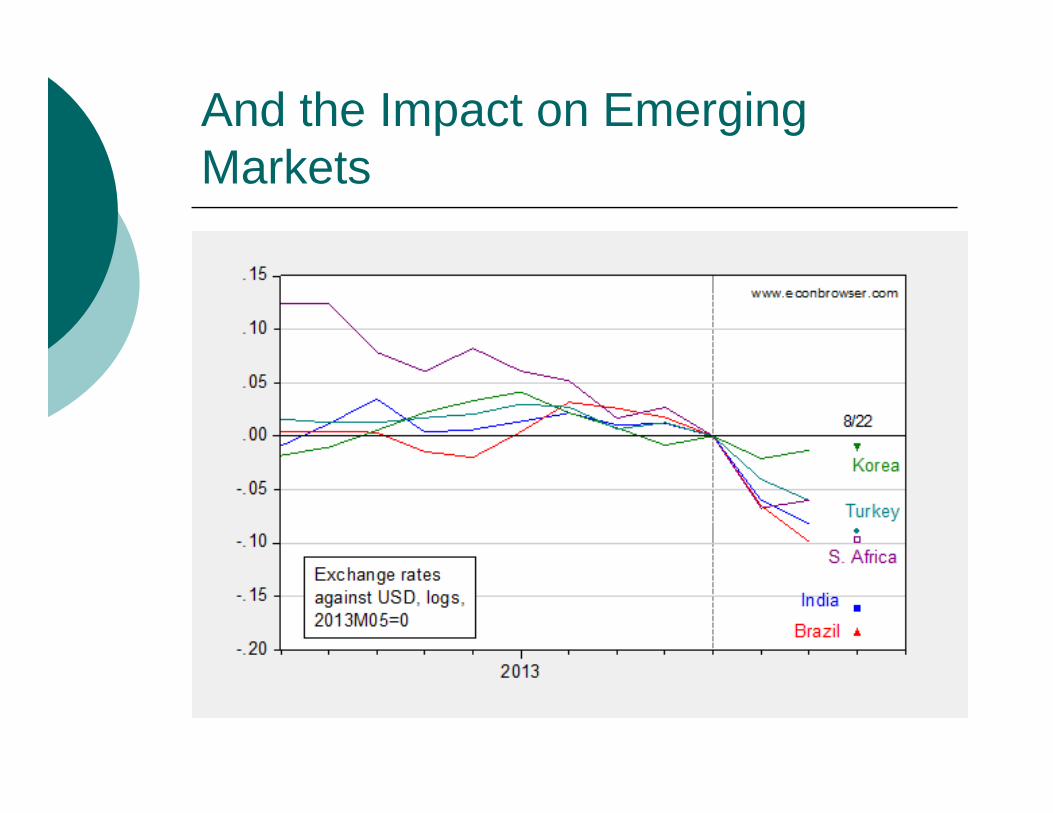
And the Impact on Emerging Markets
Conclusion
The US remains the key in the global economy
The world economic recovery remains fragile
Actions in the US could easily derail that recovery
Excessively rapid fiscal contraction or another debt ceiling crisis are potential worries.
Thank You!
Additional information:
www.econbrowser.com
http://www.imf.org/external/ns/cs.aspx?id=29
Chinn and Frieden, Lost Decades(Norton, 2011, 2012)