America’s Brightest ORANGE - University Assessment & … · America’s Brightest ORANGE ......
56
America’s Brightest ORANGE Oklahoma State University Committee for the Assessment of General Education And The Office of University Assessment General Education Assessment Annual Report, 2011 Committee for the Assessment of General Education Jon Comer John Gelder Ed Walkiewicz Greg Wilber Office of University Assessment and Testing Jeremy Penn, Ph.D., Director Mark Nicholas, Ph.D., Assistant Director John D. Hathcoat, M.S., Statistical Analyst Sungah Kim, M.A., Graduate Research Associate http://uat.okstate.edu [email protected] (405) 744-6687
Transcript of America’s Brightest ORANGE - University Assessment & … · America’s Brightest ORANGE ......

America’s Brightest ORANGE
Oklahoma State University
Committee for the Assessment of General Education And
The Office of University Assessment
General Education Assessment Annual Report, 2011
Committee for the Assessment of General Education Jon Comer
John Gelder Ed Walkiewicz
Greg Wilber
Office of University Assessment and Testing Jeremy Penn, Ph.D., Director
Mark Nicholas, Ph.D., Assistant Director John D. Hathcoat, M.S., Statistical Analyst
Sungah Kim, M.A., Graduate Research Associate http://uat.okstate.edu
[email protected] (405) 744-6687

1
Table of Contents Table of Tables ............................................................................................................................. 3
Table of Figures .............................................................................................................. 4
Executive Summary ........................................................................................................ 5
Introduction .................................................................................................................. 5
Written Communication Results .................................................................................. 5
Mean differences by grade classification ................................................................. 7
Mean differences by gender ..................................................................................... 7
ACT and OSU GPA scores ...................................................................................... 7
Mean differences by transfer status ......................................................................... 7
Mean differences by transfer status, GPA, and cumulative credit hours .................. 8
Impact of the General Education writing requirements beginning in 2005 ............... 9
Mean differences by retention status ..................................................................... 10
Use of Results ........................................................................................................... 12
Future Plans .............................................................................................................. 13
Methods ........................................................................................................................ 14
Scoring Process: 2011 Written Communication ........................................................ 16
Differences in rater severity ................................................................................... 17
Unexpected scores ................................................................................................ 18
Results .......................................................................................................................... 24
Average component scores for sub-areas of written communication for 2011 .......... 25
Written communication skills scores, 2001-2006, 2008-2011 (years combined) ....... 26
Average component scores for sub-areas for 2006, 2008–2011: .............................. 26
Comparison of overall average written communication scores by year ..................... 27
Comparison of overall average scores by classification and by year ......................... 27
Key Findings .............................................................................................................. 28
Differences between Transfer and Non-transfer Students ............................................ 30
Discussion of Results ................................................................................................ 32
Assessment of Minimum Writing Requirements for GE Designated Courses ............... 34
Key Findings .............................................................................................................. 39
General Education and Student Retention .................................................................... 40
Key Findings .............................................................................................................. 48
General Education Institutional Portfolios Summary .................................................. 49
Appendix A: 2011 Committee Membership and the History of General Education ....... 51
2011 Committee for the Assessment of General Education Committee Members .... 51
2
Committee History ..................................................................................................... 51
Institutional Portfolios ............................................................................................. 52
General Education Course Database ..................................................................... 52
College-, Department-, and Program-level Approaches ......................................... 52
Appendix B: Rubric for Evaluating Written Communication ........................................... 54
OSU Written Communication Rubric ......................................................................... 55

3
Table of Tables Table 1. 2011 Collection of Writing Samples .............................................................................. 15 Table 2. Reliability of Rater Groups 1-4 ...................................................................................... 16 Table 3. Reliability Estimates of Teams 5-8 ................................................................................ 17 Table 4. Rater Severity ............................................................................................................... 18 Table 5. Unexpected Scores ....................................................................................................... 19 Table 6. Component Score Weights by Reviewer for Written Communication ........................... 22 Table 7. Written Communication Scores by Review Group ........................................................ 23 Table 8. Student Demographics for Assessment: 2001-2006 and 2008-2011 ........................... 24 Table 9. 2011 Written Communication Scores: Overall and by Class and Transfer Status ........ 25 Table 10. 2011 Average Component Scores for Written Communication .................................. 25 Table 11. Written Communication Scores, Years Combined: 2001-2006, 2008-2011 ............... 26 Table 12. Average Component Scores: 2006, 2008-2011 .......................................................... 26 Table 13. Comparison of Overall Written Communication Scores by Year ................................ 27 Table 14. Comparison of Overall Written Communication Score by Year and Classification ..... 27 Table 15. Hierarchical Regression Analysis Investigating the Prediction of Writing Consensus Scores from Transfer Status, OSU GPA, and Cumulative Credit Hours .................................... 31 Table 16. Descriptive Statistics for General Education Designated Writing Artifacts from 2001 to 2011 ............................................................................................................................................ 35 Table 17. Average Writing Scores by General Education Designation: Before and After 2005.. 36 Table 18. Descriptive Statistics for Interaction between General Education Categories and Year of Report ..................................................................................................................................... 38 Table 19. One-year Retention Rates by Writing Consensus Scores .......................................... 41 Table 20. One-year Retention Rates by High and Low Writing Consensus Scores ................... 41 Table 21. One-year Retention Rates by Writing Consensus Scores for Freshmen .................... 42 Table 22. One-year Retention Rates by Writing Consensus Score for Sophomores ................. 42 Table 23. Retention by Writing Consensus Score and Year of Report ....................................... 43 Table 24. Two-year Retention Rates by Writing Consensus Scores .......................................... 46 Table 25. Two-year Retention Rates by Writing Consensus Scores for Freshmen .................... 47 Table 26. Two-year Retention Rates by Writing Consensus Scores for Sophomores ................ 47 Table 27. Two-year Retention Rates by High and Low Writing Consensus Scores for Sophomores ................................................................................................................................ 48 Table 28. Number of Student Artifacts by Portfolio Area and Year: 2001-2011 ......................... 50 Table 29. Overall Portfolio Scores by Area: All Years ................................................................ 50

4
Table of Figures Figure 1. Writing Scores by Year and Number of Student Artifacts .............................................. 6 Figure 2. Interaction between Transfer Status and OSU GPA ................................................... 31 Figure 3. Interaction Between OSU GPA and Cumulative Credit Hours..................................... 32 Figure 4. Trajectory of Average Writing Scores for General Education Designated and Non-General Education Designated Courses ..................................................................................... 34 Figure 5. Interaction Between GE Designation and Year of Report ........................................... 36 Figure 6. Trajectory of Writing Scores by GE Designation Category .......................................... 37 Figure 7. Interaction Between Specific GE Categories and Year of Report................................ 38 Figure 8. Average Consensus Score by One-year Retention Status and Year of Report for Freshmen .................................................................................................................................... 44 Figure 9. Average Consensus Score for One-year Retention Status by Year of Report for Sophomores ................................................................................................................................ 45

5
Executive Summary Introduction General education at Oklahoma State University (OSU) is intended to1:
A. Construct a broad foundation for the student’s specialized course of study, B. Develop the student’s ability to read, observe, and listen with comprehension, C. Enhance the student’s skills in communicating effectively, D. Expand the student’s capacity for critical analysis and problem solving, E. Assist the student in understanding and respecting diversity in people, beliefs,
and societies, and F. Develop the student’s ability to appreciate and function in the human and natural
environment. OSU has been involved in assessment of general education for more than ten years. Three approaches are used to evaluate the general education program: institutional portfolios, review of general education course database, and college-, department-, and program-level approaches. This report focuses on OSU’s use of institutional portfolios to assess the general education program. Institutional portfolios provide direct evidence of student achievement of the overall goals of general education. Institutional portfolios have been developed in five areas that represent the overall goals of the general education program (letters in parentheses map portfolios to the goals above):
1. Written communication (B and C) 2. Critical thinking (D) 3. Math problem solving (D) 4. Science problem solving (D and F) 5. Diversity (E and F)
Recognizing that these goals cannot be achieved only through completion of courses with general education designations, student artifacts are collected from courses across campus that reveal students’ achievement in each institutional portfolio area. These student artifacts are then assessed by a panel of faculty members using rubrics created by faculty members at OSU. Each rubric has a different number of categories used in the scoring process. All rubrics use a 1 to 5 scale where a 1 is low and a 5 is high. In 2011 one portfolio was developed in the area of written communication. Written Communication Results In 2011 544 artifacts were analyzed for written communication. Artifacts were assessed by 8 teams of 2 faculty members. Of the 544 artifacts, 12 (2.2%) were assigned a score of 1, 117 (21.5%) were assigned a score of 2, 241 (44.3%) were assigned a score of 3, 144 (26.5%) were assigned a score of 4, and 30 (5.5%) were assigned a score of 5.
1 http://osu.okstate.edu/acadaffr/aa/gened-CriteriaGoals.htm

6
Figure 1 shows a summary of results for the written communication institutional portfolio over the last ten years. Figure 1. Writing Scores by Year and Number of Student Artifacts
The orange bars show the average score by year and classification status (the left y-axis). The black line shows the number of artifacts collected by year and classification status (the right y-axis). The blue horizontal line shows the overall average score across all years and classification statuses. The black horizontal line shows the pilot-created expected senior proficiency score developed in 2010.

7
Mean differences by grade classification In 2011 the average writing score was 3.12 (SD = .88). In 2011 differences in average writing scores across grade classification were statistically significant F (3, 540) = 3.927, p = .009. Follow-up tests indicated that on average freshmen (M = 2.90, SD = .818) had lower writing scores than seniors (M = 3.21, SD = .852) p = .007, 95% CI [-0.07, -0.60], d = .371. An analysis of all years combined indicated statistically significant differences in average writing scores across freshmen (M = 2.74, SD = .832), sophomores (M = 2.93, SD = .921, juniors (M = 2.90, SD = .877), and seniors (M = 3.03, SD = .890) F (3, 1819) = 8.310, p < .001. Tukey’s HSD test indicated that freshmen had on average lower writing scores than sophomores p = .019, 95% CI [-0.38, -0.02], juniors p = .037, 95% CI [-0.34, -0.01], and seniors p < .001, 95% CI [-0.46, -0.14]. Mean differences by gender In 2011 a one-way ANOVA indicated that observed mean differences in writing scores were not statistically significant across gender F (1, 542) = .138, p = .71. An analysis of all years combined indicated that differences in writing scores across females (M = 2.98, SD = .881) and males (M = 2.90, SD = .898) were not statistically significant t (1739) = 1.92, p = .055, 95% CI [-0.002, 0.166] when using p < .05. ACT and OSU GPA scores Across all years combined the students whose writing artifacts were included in the general education assessment process had an average ACT composite score of 24.19 (SD = 4.10) and an average OSU GPA of 2.94 (SD = .625). The observed correlation among ACT composite scores and writing consensus scores was statistically significant (r = .337, p < .001) as was the observed correlation among writing scores and OSU GPA (r = .275, p < .001). A simple linear regression analysis indicated that for a student with an average OSU GPA, an increase in 1 ACT point predicted an increase of .042 points in writing consensus scores (p <.001) whereas for a student with an average ACT score, an increase in OSU GPA of 1 point predicted an increase in writing consensus scores of .242 points (p < .001). Combined ACT composite scores and OSU GPA accounted for approximately 13% of the variance in writing consensus scores F (2, 1393) = 106.20, p < .001. A hierarchical regression failed to find a statistically significant interaction among ACT composite scores and OSU GPA 2R = .000, p = .595. Mean differences by transfer status In 2011 a one-way ANOVA indicated that on average transfer students (M = 2.96, SD = .986) had lower writing scores than non-transfer students (M = 3.16, SD = .848) F (1, 541) = 4.70, p = .031, d = .217. An examination of the 95% CIs around observed means suggests that such differences should be interpreted with caution. When constructed around the observed mean for transfer students the 95% CI is 2.77 to 3.14; whereas the 95% CI for the average writing score among non-transfer students is 3.08 to 3.24. The 95% CI constructed around the mean difference however, supports the significance test and was calculated as .019 to .318. An analysis of all years combined indicated that the average writing score for transfer students (M = 2.82, SD = .916) was lower than that of non-transfer students (M = 2.99, SD = .877) t (1748) = -3.332, p = .001, 95% CI [-0.07, -0.26].

8
Mean differences by transfer status, GPA, and cumulative credit hours A hierarchical regression analysis was conducted in order to further examine differences in writing consensus scores across transfer status. Transfer status, cumulative credit hours, and OSU GPA were the variables considered in this analysis. ACT scores were not considered since we lack this information for a number of students, which may introduce a potential selection effect into the analysis. The hierarchical regression thus examined all main effects for these variables as well as all possible interactions. Results indicated that cumulative credit hours, GPA, and transfer status accounted for 8.6% of the variance in writing consensus scores F (3, 1667) = 52.526, p < .001. At step 2 all two-interaction terms were entered into the equation, which accounted for an additional 0.7% of the variance in writing scores F (3, 1664) = 4.18, p = .006. The increase in explained variance at Step 3, which included the three way interaction among transfer status, GPA, and cumulative credit hours, was not statistically significant F (1, 1663) = 1.549, p = .213. Only statistically two-way interaction terms were interpreted. The first two-way interaction was between transfer status and OSU GPA (OSU GPA does not include transfer credit). The predicted writing score for a non-transfer student with an average number of cumulative credit hours (i.e. 80.60) and average GPA (i.e. 3.03) is 2.956. This same predicted value is .128 points lower for transfer students (p = .015). The two-way interaction among transfer status and GPA indicates that the expected increase in writing scores predicted from GPA varies across transfer status. For non-transfer students an increase in GPA of one unit is associated with an expected increase in writing scores of .458 points (p < .001) whereas for transfer students a unit increase in GPA predicts an increase in writing scores of .298 points (p < .001). In other words, the relationship among GPA and writing scores is stronger for non-transfer students than for transfer students. This interaction also implies that predicted writing scores for students with a GPA at 1 standard deviation below the mean (i.e. GPA = 2.26) are similar for transfer and non-transfer students. However, for individuals with a GPA 1 standard deviation above the mean (i.e. GPA = 3.56) non-transfer students have a predicted writing score of 3.39 whereas transfer students have a predicted writing score of 3.12. In other words, the predicted effect of GPA on writing scores was not the same across transfer status. Increases in GPA predicted higher writing scores among non-transfer students than transfer students. Both transfer and non-transfer students with low GPAs have similar predicted writing scores whereas for students with high GPAs non-transfer students have higher predicted writing scores than non-transfer students. It is important to note that such an effect controls for cumulative credit hours, thus reducing the possibility that this can be attributed to increases in the total number of courses taken. The other statistically significant two-way interaction however, indicates that the effect of GPA is not consistent across levels of cumulative credit hours. One unit increase in GPA predicts a .582 (p < .001) increase in writing scores for individuals 1 standard deviation above the mean in cumulative credit hours (i.e. cumulative credit hours = 129.51). For individuals 1 standard deviation below the mean in cumulative credit hours
9
(i.e. cumulative credit hours = 46.99) a unit increase in GPA predicts an increase in writing scores of .334 points (p < .001). This interaction also indicates that for students 1 standard deviation below the mean on GPA (i.e. GPA = 2.26) the predicted writing score is similar for students with high and low levels of cumulative credit hours. Students with GPAs 1 standard deviation above the mean (i.e. GPA = 3.56) with a high number of cumulative credit hours have a predicted writing score of 3.39 whereas students with a low number of cumulative credit hours have a predicted writing score of 3.08. In other words, the interaction among GPA and cumulative credit hours suggests that as students accumulate more experience GPA becomes a better predictor of overall writing ability. Impact of the General Education writing requirements beginning in 2005 Additional analyses were performed to examine the effect of phasing in additional writing requirements to courses with a general education (GE) designation. Initially two groups were created: one which included artifacts sampled from courses with GE designations and one group which included artifacts sampled from courses without GE designations. A graphical examination of the data suggested that up to and including 2005 no obvious pattern emerged in the average writing score across these two categories. After 2005 however it appears that artifacts sampled from courses with GE designations may have higher average writing scores than artifacts sampled from courses without GE designations. Four groups were created to examine this potential interaction: 1) GE designated courses up to and including 2005, 2) GE designated courses after 2005, 3) Non-GE designated courses up to and including 2005, and 4) Non-GE designated courses after 2005. Aligned with last year’s report a 2 X 2 factorial ANOVA indicated a statistically significant interaction among year of report and GE designation F (1, 1827) = 9.013, p = .003. Follow-up tests indicated that up to and including 2005 there was no statistically significant difference in writing scores across courses with and without GE designations t (702) = .748, p = .455, 95% CI [.188, -.084]. However, artifacts with a GE designation had on average higher writing scores after 2005 than artifacts with a GE designation collected up to and including 2005 t (1032) = 2.02, p = .043, 95% CI [.004, .243], d = .13. This finding was further investigated by examining whether such changes were evident among specific GE designations. Given the small sample size in some categories, however, a decision was made to collapse GE designations into broad, albeit conceptually relevant, categories. Consequently, three categories were created. The first category was labeled Social and Behavioral Sciences and was composed of GE designations S, IS, and DS. The second category was labeled Humanities and was composed of GE designations HI, H, and DH, and I. The third category was labeled None and consisted of artifacts sampled in courses without GE designations. No additional categories were created due to either small sample sizes across years of data collection or because the remaining GE designations were not considered conceptually similar to newly constructed categories. Results of the 2 X 3 factorial ANOVA indicated a statistically significant interaction among these GE categories and year of report F (2, 1751) = 5.862, p = .003. Follow-up

10
tests indicated that for artifacts from courses with no GE designations showed a statistically significant decrease in average writing scores after 2005 t (795) = 2.282, p = .023, d = .162. Artifacts with Humanities GE designations showed no statistically significant changes after 2005 t (581) = .342, p = .733. However, artifacts with Social and Behavioral Sciences designations showed statistically significant increases after 2005 t (375) = 2.785, p = .006, d = .288. In other words, this provides some evidence to suggest that the increase in average writing scores after 2005 among GE designated courses may in part be attributed to courses with Social and Behavioral Science designations. Courses without a GE designation appear to be influenced by the inclusion of 2008 within the analysis. This year may be considered an outlier given that the average score in 2008 tends to be lower than that of other years. If we remove 2008 from the analysis then differences in courses without a GE designation fail to be statistically significant. Removing 2008 from the analysis, however, does not alter the substantive findings related to courses with an S or H GE designation. Mean differences by retention status In 2011 retention statistics were gathered for 401 freshmen and sophomores from 2001 through 2010. All data were retrieved from Institutional Research and Information Management (IRIM) for artifacts with valid student identification numbers. One-year retention was defined as a dichotomous variable wherein students were identified as being retained if they enrolled in the following 2 semesters from the semester of their initial assessment. Two-year retention was identified if students were still enrolled 4 semesters from the semester of their initial general education assessment. About 90.3% of the freshman and sophomore students whose artifacts were included in the general education process were still enrolled at OSU one year later (i.e. 88.6% of freshmen artifacts and 91.7% of sophomore artifacts). The average writing consensus score for artifacts from students who were retained after 1 year was 2.74 (SD = .88) whereas the average writing consensus score for artifacts from students who were not retained after 1 year was 2.77 (SD = .93). These differences were not statistically significant t (399) = -.194, p = .846. Among freshmen there were 148 artifacts from students who were retained after 1 year, with an average writing score of 2.62 (SD = .83). Among freshmen there were 19 artifacts from students who were not retained after 1 year, with an average writing score of 2.79 (SD = .98). These differences were also not statistically significant t (165) = -.815, p = .416. Among sophomores there were 211 artifacts from students who were retained with an average writing score of 2.84 (SD = .90); whereas 19 artifacts from students who were not retained had an average writing score of 2.74 (SD = .93). These differences were also not statistically significant t (228) = .471, p = .638.
Across all years combined 288 (80%) freshman and sophomore students whose artifacts were included in the general education process were retained after 2 years. These artifacts had an average consensus score of 2.76 (SD = .88). Across all years combined 69 freshman and sophomore students whose artifacts were included in the

11
general education process were not retained after 2 years. These artifacts had an average consensus score of 2.52 (SD = .89). Mean differences in writing scores across retained and not-retained artifacts were statistically significant t (355) = = 2.021, p = .044, 95% CI [.006, .471], d = .214. For freshmen, 119 students whose artifacts were included in the general education process (77%) were retained 2 years later. These artifacts had an average writing consensus score of 2.61 (SD = .84). 35 freshmen whose artifacts were included in the general education process (23%) were not retained two years later. These artifacts had an average writing consensus score of 2.60 (SD = .91). Mean differences in average writing scores were not statistically significant among freshmen who were retained and those who were not retained t (152) = .082, p = .935.
For sophomores, 169 students whose artifacts were included in the general education process (85%) were retained 2 years later. These artifacts had an average writing consensus score of 2.86 (SD = .90). 30 sophomores whose artifacts were included in the general education process were not retained after 2 years. These artifacts had an average writing consensus score of 2.50 (SD = .86). Mean differences in average writing scores were statistically significant between sophomores who were retained and those who were not retained after two years t (197) = 2.055, p = .041, 95% CI [.015, .073], d = .293.

12
Use of Results Assessment data from the general education assessment process are used primarily in three ways:
To implement improvement initiatives To monitor recent curricular changes To consider and discuss additional modifications to the general education
program In response to data from the general education assessment process, in 2008-2009 the Provost’s Office, the Office of University Assessment, the General Education Assessment Committee, and the Institute for Teaching and Learning Excellence collaborated to implement the Provost’s Faculty Development Initiative: Focus on General Education. The purpose of this initiative is to develop faculty members’ expertise in teaching and assessing the general education learning goal, in integrating the general education learning goal into existing courses, and in creating high quality assignments that demonstrate students’ achievement of the general education goal. This initiative was continued in 2009-2010, 2010-2011, 2011-2012 and will be implemented again in 2012-2013. A task force to consider changes to the general education program was formed in the fall of 2011. In addition to considering results from general education assessment, the task force has held two open forums, hosted a speaker from the Association of American Colleges and Universities (AAC&U), sent three representatives to the AAC&U’s General Education and Assessment conference, and has studied books and articles on general education and assessment of general education. The work of this task force is expected to continue in 2012-2013. Another task force to study the assessment of student learning is being formed in early 2012; it is likely that the two task forces’ work will integrate and overlap to some extent, especially since the Chair of CAGE and the Director of UAT will be serving on both task forces.

13
Future Plans CAGE is planning on continuing the rotation to assess students’ critical thinking skills in 2012, then moving to diversity and science problem solving in 2013. Although the current general education assessment process has worked well for OSU, CAGE acknowledges areas for improvement. First, CAGE is interested in finding ways to provide better feedback to faculty members who participate in the general education assessment process. This report, while helpful at the institution level, is aggregated at too high a level to directly impact faculty members’ work in their classrooms. Second, CAGE is interested in finding ways to provide better feedback to students on their level of achievement of the general education learning outcomes. Third, CAGE would like to expand the assessment methods used to include methods that do not follow the traditional 3-10 page essay format. For example, CAGE is interested in considering how we might include students’ oral presentations, team projects, drawings, or other performances as part of the general education assessment process. Fourth, in 2012 CAGE is exploring the role of discipline-specific rubrics in the assessment of critical thinking. Three additional rubrics are being developed that include both the university-general elements of critical thinking and elements that are specific to that discipline area. CAGE hopes that the results from the discipline-specific elements of the rubric may further inform the teaching of critical thinking in the discipline and be a better match for the assignments from that discipline. Fifth, CAGE continues to examine strategies for improving inter-rater reliability. We are considering the development of software that will assist in the rating process by storing the samples of student work electronically, assigning those samples to raters based on good practices of inter- and intra-rater reliability, and providing live feedback to the raters about their inter- and intra-rater reliability. Due to other demands on programming time in the office this software will not be ready for 2012 but may be available for a pilot run in 2013. Sixth, CAGE will continue to work with the general education task force on revisions to the general education assessment process to gather a broader sample of student work and try to get a better understanding of how students develop these skills and abilities over time. CAGE also wants to see assessment more fully integrated into the general education program. Seventh, CAGE continues to seek strategies for engaging faculty members in ongoing professional development activities related to the general education learning goals. It is not enough to have data on student achievement of the general education learning goals – we need to make better use of these data for improving our general education program.
OSU Committee for the Assessment of General Education 2011 Annual Report
14
Methods Artifacts were collected by direct request from a random sample of general education designated courses, from faculty members who voluntarily submitted samples of student work, and from faculty members who participated in the Provost’s Faculty Development Initiative: Focus on General Education. The courses from which artifacts were sampled are shown in Table 1. Artifacts selected for the Institutional Portfolio were coded and all identifying information was removed from the samples. Demographic data were collected for each artifact using the OSU student database; these data were collected for analysis purposes only and the information cannot be used to identify any individual. The student demographic information associated with the samples was not shared with reviewers prior to the reviews.

OSU Committee for the Assessment of General Education 2011 Annual Report
15
Table 1. 2011 Collection of Writing Samples
Course No.
Course Name
General
Education Designation
(if any)
Number of artifacts
randomly collected from
one assignment
Number of artifacts reviewed
Number of artifacts used in
data analysis2
A & S 2323 Diversity and Inclusion in 21st Century DS 17 17 17
ANSI 3903 Agricultural Animals of the World I 26
ANTH 3353 Cultural Anthropology IS 22
ARCH 2216 Arch Design Studio III 12
ARCH 3083 Renaissance and Baroque Arch. H 22 20 20
AVED 4653 International Aero Issues I 22 21 21
CIED 4012 Integration of Literacy 21 20 20
CPSY 4443 Cultural Diversity in Professional Life D 20 19 18
ECON 3613 International Economic Relations S 8
ENGL 2413 Introduction to Literature DH 19 19 19
ENGL 3173 World Literature II HI 19 19 19
GEOG 1113 Introduction to Cultural Geography IS 29 29 29
GEOG 2253 World Regional Geography IS 25 5 5
GEOG 3723 Geography of Europe IS 26 22 22
HDFS 3203 Children's Play: A World Perspective I 29
HDFS 4793 Family World Perspectives S 21
HHP 2603 Total Wellness S 28 28 28
HHP 3673 Pathophysiology and Pharmacology 6
HHP 3723 Principles of Epidemiology 29
HIST 1613 Western Civilization to 1500 H 27 27 27
HIST 4353 American Military History H 25 24 22
HIST 1613 Western History to 1500 H 20 20 20
HRAD 3223 International Travel and Tourism I 10
MICR 3223 Advanced Microbiology 24
MUSI 2573 Introduction to Music H 6 6 6
NREM 4393 Forests, People, and Sustainable Develop I 16 16 13
NSCI 2211 Careers In Dietetics 26 25 24
NSCI 3543 Food and Human Environment IS 10 10 3
PHIL 1113 Introduction to Philosophy H 25 24 24
PHIL 1213 Philosophies of Life H 48 43 42
PHIL 3833 Biomedical Ethics H 20 20 20
PHIL 3920 Ethics and Globalization in Foreign Film 20 19 17
PHIL 3943 Asian Philosophy HI 15
PSYC 1113 Introduction to Psychology S 23 23 23
PSYC 3443 Abnormal Psychology S 15 15 15
PSYC 4213 Conflict Resolution S 20
SPCH 2713 Speech Communications S 11 11 11
SPCH 3733 Elements of Persuasion S 22 17 15
TH 3923 Theatre History I H 22 22 22
ZOOL 3104 Invertebrate Zoology 22 22 22
Total Number of Writing Artifacts (samples) 828 563 544
2 The number of artifacts reviewed was less than the number collected. The number of artifacts used in data analysis is less than the number reviewed because one artifact was not scored by the reviewers.
OSU Committee for the Assessment of General Education 2011 Annual Report
16
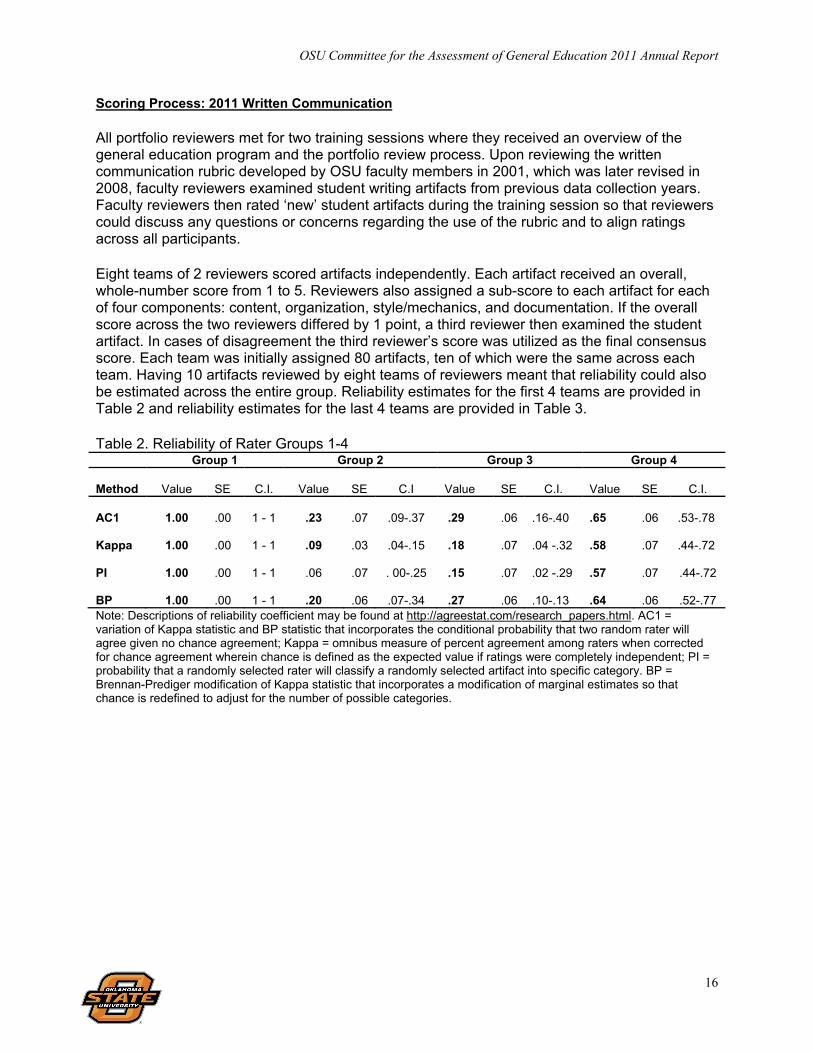
Scoring Process: 2011 Written Communication All portfolio reviewers met for two training sessions where they received an overview of the general education program and the portfolio review process. Upon reviewing the written communication rubric developed by OSU faculty members in 2001, which was later revised in 2008, faculty reviewers examined student writing artifacts from previous data collection years. Faculty reviewers then rated ‘new’ student artifacts during the training session so that reviewers could discuss any questions or concerns regarding the use of the rubric and to align ratings across all participants. Eight teams of 2 reviewers scored artifacts independently. Each artifact received an overall, whole-number score from 1 to 5. Reviewers also assigned a sub-score to each artifact for each of four components: content, organization, style/mechanics, and documentation. If the overall score across the two reviewers differed by 1 point, a third reviewer then examined the student artifact. In cases of disagreement the third reviewer’s score was utilized as the final consensus score. Each team was initially assigned 80 artifacts, ten of which were the same across each team. Having 10 artifacts reviewed by eight teams of reviewers meant that reliability could also be estimated across the entire group. Reliability estimates for the first 4 teams are provided in Table 2 and reliability estimates for the last 4 teams are provided in Table 3. Table 2. Reliability of Rater Groups 1-4 Group 1 Group 2 Group 3 Group 4 Method
Value
SE
C.I.
Value
SE
C.I
Value
SE
C.I.
Value
SE
C.I.
AC1
1.00
.00
1 - 1
.23
.07
.09-.37 .29
.06
.16-.40
.65
.06
.53-.78
Kappa
1.00
.00
1 - 1
.09
.03
.04-.15 .18
.07
.04 -.32
.58
.07
.44-.72
PI
1.00
.00
1 - 1
.06
.07
. 00-.25 .15
.07
.02 -.29
.57
.07
.44-.72
BP
1.00
.00
1 - 1
.20
.06
.07-.34 .27
.06
.10-.13
.64
.06
.52-.77
Note: Descriptions of reliability coefficient may be found at http://agreestat.com/research_papers.html. AC1 = variation of Kappa statistic and BP statistic that incorporates the conditional probability that two random rater will agree given no chance agreement; Kappa = omnibus measure of percent agreement among raters when corrected for chance agreement wherein chance is defined as the expected value if ratings were completely independent; PI = probability that a randomly selected rater will classify a randomly selected artifact into specific category. BP = Brennan-Prediger modification of Kappa statistic that incorporates a modification of marginal estimates so that chance is redefined to adjust for the number of possible categories.

OSU Committee for the Assessment of General Education 2011 Annual Report
17
Table 3. Reliability Estimates of Teams 5-8 Group 5 Group 6 Group 7 Group 8 Method
Value
SE
C.I.
Value
SE
C.I
Value
SE
C.I.
Value
SE
C.I.
AC1
.20
.05
.08-.32
1.00
.00
1 - 1 .91
.03
.85-.98
.33
.06
.22-.45
Kappa
.05
.07
0-.18
1.00
.00
1 - 1 .88
.04
.79-.97
.24
.07
.10-.38
PI
.05
.06
0-.18
1.00
.00
1 - 1 .88
.04
.79-.97
.22
.07
.08-.36
BP
.18
.06
.06-.30
1.00
.00
1 - 1 .91
.04
.84-.98
.33
.06
.20-.45
Note: Descriptions of reliability coefficient may be found at http://agreestat.com/research_papers.html. AC1 = variation of Kappa statistic and BP statistic that incorporates the conditional probability that two random rater will agree given no chance agreement; Kappa = omnibus measure of percent agreement among raters when corrected for chance agreement wherein chance is defined as the expected value if ratings were completely independent; PI = probability that a randomly selected rater will classify a randomly selected artifact into specific category. BP = Brennan-Prediger modification of Kappa statistic that incorporates a modification of marginal estimates so that chance is redefined to adjust for the number of possible categories. There are numerous ways to evaluate the adequacy of reliability estimates. Though many proposed benchmarks may be too liberal (Gwet, 2010), guidelines given by Altman (1991) are provided below:
< .20 = Slight Agreement .21 to .40 = Fair Agreement .41 to .60 = Moderate Agreement .61 to .80 = Good Agreement .81 to 1.00 = Very Good.
First, it is noted that the reliability estimates for group 1 and group 5 indicated perfect agreement. Perfect agreement given the scale length and number of artifacts is unlikely, which suggests that these team members reached consensus before submitting individual scores. Reliability estimates of group 7 were in the “very good” range whereas reliability estimates for group 4 were in the “moderate” to “good” range. Reliability estimates for group 8 indicated “fair” agreement among artifact ratings. Groups 2, 3, and 5 had only “slight” agreement. As previously indicated, corrections for unreliability were done by having a third rater examine artifacts on which group members disagreed. Overall consensus scores for these artifacts were assigned the score given after discussion by all three raters. Variation in reliability estimates, before corrections by a third rater, may be of some concern. Given that reliability estimates may attenuate correlation coefficients, such findings suggest a need to provide greater attention to rater training, feedback, monitoring, and intervention when evaluating student artifacts in future years. Differences in rater severity Analysis using the FACETS software and the Rasch many-facets technique revealed differences in raters’ severity. Many-facets Rasch analysis allows for estimation of raters’ severity across all five score components and allows for adjustment based on the 10 artifacts that were scored by all raters. Table 4 summarizes these results for the 16 raters. Note that there is not a direct link between the observed average score and the rater’s estimated severity due to differences in the ability levels of the students whose papers were assigned to each rater.

OSU Committee for the Assessment of General Education 2011 Annual Report
18
Table 4. Rater Severity
Rater Number of
ratings
Observed average
rating
Rater’s Severity
Estimate3 S.E.
1 366 3.32 ‐0.72 0.09
2 366 3.32 ‐0.73 0.09
3 352 3.41 ‐1.21 0.08
4 362 2.99 ‐0.21 0.08
5 358 3.30 ‐0.53 0.08
6 361 3.22 ‐0.34 0.08
7 369 2.92 ‐0.48 0.08
8 392 2.86 ‐0.38 0.08
9 379 2.95 1.04 0.08
10 372 2.77 1.52 0.08
11 344 2.77 1.25 0.09
12 359 2.69 1.38 0.08
13 360 3.23 ‐1.68 0.08
14 355 3.39 ‐2.02 0.08
15 358 3.51 ‐0.63 0.09
16 385 3.06 0.39 0.08
The separation is 12.33, which says that the difference between rater severity levels is about twelve times greater than the error with which these levels are measured. The fixed (all same) chi-square is 2443.4 with 15 degrees of freedom, p < 0.01. This indicates that at least two raters are significantly different in their rating severity. This suggests some concern that the score a student receives on the writing assessment may be due in part to the rater to whom that artifact was assigned. Unexpected scores Analysis using the FACETS software and the Rasch many-facets technique also revealed unexpected scores. That is, based on the Rasch measurement model, individual scores were flagged if they were substantially different from what was expected in the model. The one hundred most unexpected scores are shown in Table 5.
3 Measured in logits.

OSU Committee for the Assessment of General Education 2011 Annual Report
19
Table 5. Unexpected Scores Score given
by rater
Expected score Residual
Standardized residual Rater Artifact
Component number
Rubric component
4 4.9 -0.9 -3.2 1 124 3 style
2 1.1 0.9 2.9 1 172 3 style
5 3.3 1.7 2.6 1 174 3 style
1 3.9 -2.9 -4.6 1 553 4 documentation
1 3.2 -2.2 -3.4 1 562 4 documentation
1 2.9 -1.9 -2.9 1 726 4 documentation
1 2.9 -1.9 -2.9 1 798 4 documentation
4 2.2 1.8 2.7 1 927 2 organization
1 3.9 -2.9 -4.6 2 553 4 documentation
5 3.2 1.8 2.7 2 555 3 style
1 3.2 -2.2 -3.4 2 562 4 documentation
1 2.9 -1.9 -2.9 2 726 4 documentation
1 2.9 -1.9 -2.9 2 798 4 documentation
2 3.7 -1.7 -2.6 3 232 1 content
2 3.8 -1.8 -2.8 3 273 4 documentation
1 2.7 -1.7 -2.7 3 369 1 content
2 3.7 -1.7 -2.6 3 555 1 content
5 3.2 1.8 2.8 3 615 4 documentation
1 2.7 -1.7 -2.7 3 885 1 content
5 3.1 1.9 2.9 3 886 1 content
1 2.9 -1.9 -2.9 3 886 3 style
1 2.7 -1.7 -2.6 4 365 4 documentation
1 2.9 -1.9 -3 4 366 4 documentation
1 3.3 -2.3 -3.5 4 491 4 documentation
4 1.8 2.2 3.5 5 295 4 documentation
4 1.9 2.1 3.4 5 547 4 documentation
5 2.4 2.6 4 5 548 4 documentation
5 3.1 1.9 3 5 549 4 documentation
4 2.1 1.9 2.9 6 218 3 style
5 3.2 1.8 2.7 6 220 3 style
5 3.3 1.7 2.7 6 376 4 documentation
2 4.1 -2.1 -3.3 6 379 2 organization
1 2.7 -1.7 -2.7 6 478 3 style
1 2.8 -1.8 -2.8 6 552 2 organization
1 2.8 -1.8 -2.8 6 554 2 organization
2 3.8 -1.8 -2.7 6 752 2 organization
5 3.3 1.7 2.7 6 752 4 documentation
5 2.9 2.1 3.2 6 753 4 documentation
1 3.2 -2.2 -3.4 7 910 3 style

OSU Committee for the Assessment of General Education 2011 Annual Report
20
4 2.3 1.7 2.6 8 323 4 documentation
4 2.2 1.8 2.8 8 326 4 documentation
1 2.8 -1.8 -2.7 8 414 4 documentation
1 3 -2 -3 8 421 4 documentation
1 3.3 -2.3 -3.6 8 422 4 documentation
1 3 -2 -3.1 8 549 4 documentation
5 3.3 1.7 2.7 8 910 2 organization
1 3.3 -2.3 -3.6 8 930 4 documentation
1 3.1 -2.1 -3.2 8 933 4 documentation
2 3.7 -1.7 -2.6 9 440 4 documentation
4 2.2 1.8 2.8 9 552 3 style
2 4 -2 -3.2 9 758 3 style
2 3.7 -1.7 -2.7 9 880 2 organization
2 3.7 -1.7 -2.6 9 880 5 overall
1 2.9 -1.9 -2.9 10 249 4 documentation
1 3.1 -2.1 -3.2 10 253 4 documentation
5 3.2 1.8 2.8 10 266 1 content
5 3.3 1.7 2.7 10 267 1 content
1 2.7 -1.7 -2.7 10 551 4 documentation
1 3 -2 -3.1 10 553 4 documentation
3 1.4 1.6 2.9 10 620 3 style
4 1.7 2.3 3.7 10 762 4 documentation
4 2.2 1.8 2.8 11 394 4 documentation
4 2.2 1.8 2.9 12 394 4 documentation
4 2 2 3.2 12 395 4 documentation
1 2.8 -1.8 -2.8 12 551 4 documentation
1 3 -2 -3.1 12 553 4 documentation
5 2.9 2.1 3.3 12 720 4 documentation
5 2.9 2.1 3.3 12 723 4 documentation
5 3.1 1.9 3 12 763 3 style
1 2.7 -1.7 -2.6 13 669 4 documentation
5 2.8 2.2 3.4 14 233 4 documentation
5 3.2 1.8 2.8 14 234 4 documentation
4 2 2 3.2 14 235 4 documentation
1 3.1 -2.1 -3.2 14 474 4 documentation
5 2.8 2.2 3.4 14 605 4 documentation
1 3.1 -2.1 -3.2 14 606 4 documentation
3 4.5 -1.5 -2.6 15 114 2 organization
1 3.1 -2.1 -3.3 15 118 4 documentation
1 2.7 -1.7 -2.6 15 136 2 organization
4 5 -1 -4.9 15 138 2 organization
3 4.6 -1.6 -3.1 15 159 4 documentation
5 3.3 1.7 2.7 15 184 3 style
OSU Committee for the Assessment of General Education 2011 Annual Report
21
5 2.9 2.1 3.3 15 185 3 style
4 4.9 -0.9 -3.6 15 428 2 organization
3 4.7 -1.7 -3.3 15 429 2 organization
1 3.4 -2.4 -3.7 15 555 1 content
1 2.8 -1.8 -2.7 15 555 4 documentation
5 3 2 3.1 15 556 2 organization
4 2.3 1.7 2.6 15 572 3 style
5 2.9 2.1 3.2 15 657 4 documentation
2 3.8 -1.8 -2.9 15 660 3 style
5 3.2 1.8 2.8 15 742 4 documentation
4 4.9 -0.9 -2.9 16 137 2 organization
1 2.9 -1.9 -2.9 16 184 2 organization
1 2.7 -1.7 -2.6 16 549 4 documentation
4 2 2 3.2 16 554 4 documentation
1 2.9 -1.9 -3 16 571 4 documentation
4 2 2 3.2 16 572 2 organization
4 1.9 2.1 3.4 16 572 3 style
1 2.9 -1.9 -3 16 741 4 documentation
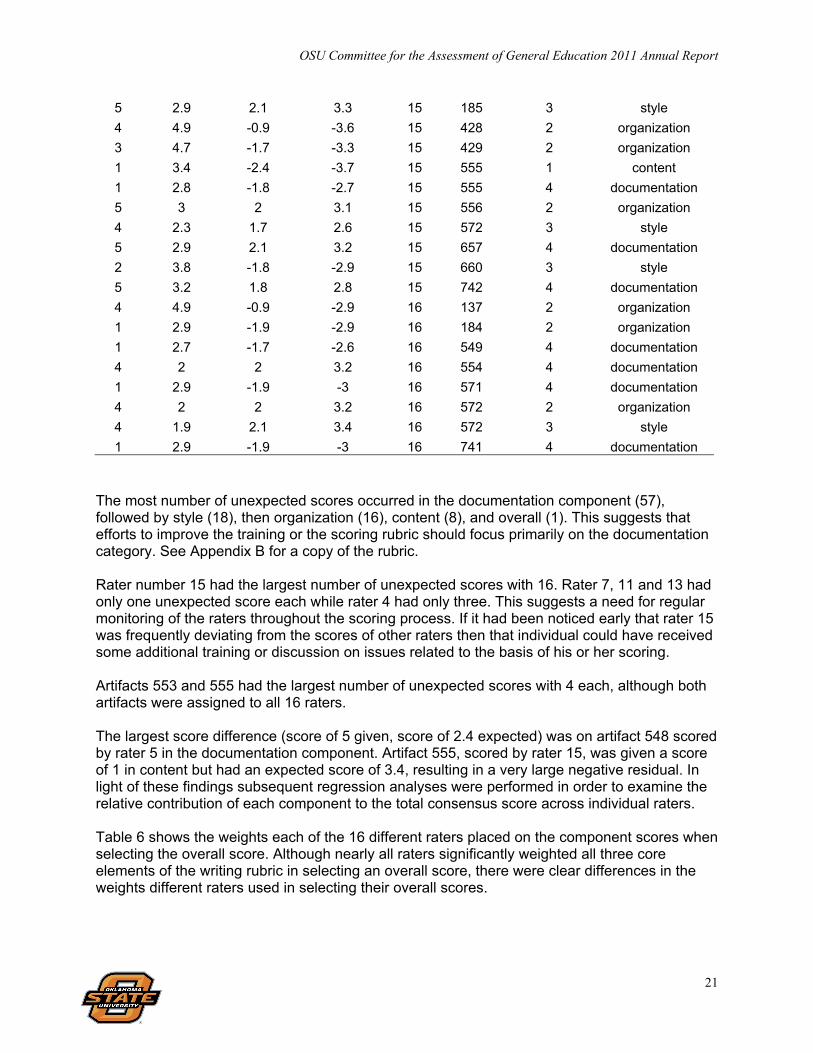
The most number of unexpected scores occurred in the documentation component (57), followed by style (18), then organization (16), content (8), and overall (1). This suggests that efforts to improve the training or the scoring rubric should focus primarily on the documentation category. See Appendix B for a copy of the rubric. Rater number 15 had the largest number of unexpected scores with 16. Rater 7, 11 and 13 had only one unexpected score each while rater 4 had only three. This suggests a need for regular monitoring of the raters throughout the scoring process. If it had been noticed early that rater 15 was frequently deviating from the scores of other raters then that individual could have received some additional training or discussion on issues related to the basis of his or her scoring. Artifacts 553 and 555 had the largest number of unexpected scores with 4 each, although both artifacts were assigned to all 16 raters. The largest score difference (score of 5 given, score of 2.4 expected) was on artifact 548 scored by rater 5 in the documentation component. Artifact 555, scored by rater 15, was given a score of 1 in content but had an expected score of 3.4, resulting in a very large negative residual. In light of these findings subsequent regression analyses were performed in order to examine the relative contribution of each component to the total consensus score across individual raters. Table 6 shows the weights each of the 16 different raters placed on the component scores when selecting the overall score. Although nearly all raters significantly weighted all three core elements of the writing rubric in selecting an overall score, there were clear differences in the weights different raters used in selecting their overall scores.

OSU Committee for the Assessment of General Education 2011 Annual Report
22
Table 6. Component Score Weights by Reviewer for Written Communication
Content Organization Style / Mechanics
Reviewer mean β weight mean β weight mean β weight
Team 1
1 3.43 .49*** 3.41 .38*** 3.49 .22***
2 3.43 .28*** 3.47 .45*** 3.53 .28**
Team 2
3 3.59 .46*** 3.56 .26*** 3.24 .39***
4 3.25 .28* 3.03 .24* 2.94 .35**
Team 3
5 3.45 .54*** 3.35 .24*** 3.27 .29***
6 3.54 .51*** 3.13 .30*** 3.31 .36***
Team 4
7 3.29 .16* 2.88 .50*** 2.67 .35***
8 3.20 .47*** 2.96 .39*** 2.64 .14
Team 5
9 3.16 .39*** 2.99 .48*** 3.00 .18**
10 3.25 .37** 2.87 .36** 2.96 .26**
Team 6
11 2.92 .26*** 2.76 .49*** 2.65 .28***
12 2.87 .31*** 2.67 .39*** 2.68 .33***
Team 7
13 3.36 .41*** 3.36 .31** 3.15 .22*
14 3.64 .27** 3.43 .29*** 3.20 .53***
Team 8
15 3.72 .54*** 3.57 .32*** 3.75 .26***
16 3.13 .51*** 3.23 .33*** 3.24 .24** *p < 0.05, **p < 0.01, ***p < 0.001 on individual-level regression with overall score as the dependent variable.
Tables 7, 8, 9, 10, 11, 12, 13, and 14 summarize the descriptive statistics for the 2011 scores for written communication.

OSU Committee for the Assessment of General Education 2011 Annual Report
23
Table 7. Written Communication Scores by Review Group
Review Group
Artifact Score
Number of Artifacts
Percent of Artifacts
#1 (76 artifacts scored)
1 2 2.6%
2 11 14.5%
3 28 36.8%
4 27 35.5%
5 8 10.5%
#2 (68 artifacts scored)
1 0 0.0%
2 9 13.2%
3 36 52.9%
4 19 27.9%
5 4 5.9%
#3 (65 artifacts scored)
1 0 0.0%
2 7 10.8%
3 29 44.6%
4 27 41.5%
5 2 3.1%
#4 (69 artifacts scored)
1 3 4.3%
2 22 31.9%
3 28 40.6%
4 14 20.3%
5 2 2.9%
#5 (69 artifacts scored)
1 1 1.4%
2 20 29.0%
3 32 46.4%
4 15 21.7%
5 1 1.4%
#6 (63 artifacts scored)
1 4 6.3%
2 25 39.7%
3 23 36.5%
4 9 14.3%
5 2 3.2%
#7 (66 artifacts scored)
1 1 1.5%
2 8 12.1%
3 37 56.1%
4 15 22.7%
5 5 7.6%
#8 (68 artifacts scored)
1 1 1.5%
2 15 22.1%
3 28 41.2%
4 18 26.5%
5 6 8.8%

OSU Committee for the Assessment of General Education 2011 Annual Report
24
Results Table 8. Student Demographics for Written Communication Assessment: 2001-2006 and 2008-2011
2001-06,
2008-2010 2011 Years Combined
N Pct N4 Pct N Pct
Number of Artifacts
# collected 1874 - 828 - 2702 -
# scored 1307 - 563 - 1870 -
# used in analysis 1287 - 544 - 1831 -
Class
Freshman 176 13.8% 124 22.8% 300 16.5%
Sophomore 236 18.5% 119 21.9% 355 19.5%
Junior 360 28.1% 121 22.2% 481 26.4%
Senior 507 39.6% 180 33.1% 687 37.7%
College
CAS 414 32.2% 215 39.5% 629 34.4%
CASNR 146 11.3% 46 8.5% 192 10.5%
SSB 198 15.4% 44 8.1% 242 13.2%
COE 140 10.9% 116 21.3% 256 14.0%
CEAT 179 13.9% 52 9.6% 231 12.6%
CHES 176 13.7% 46 8.5% 222 12.1%
UAS 34 2.6% 25 4.6% 59 3.2%
Gender Female 625 52.2% 296 54.4% 921 52.9%
Male 572 47.8% 248 45.6% 820 47.1%
Admit Type
Regular (A, AR, L) 756 58.7% 390 71.7% 1146 62.6%
Alternative Admit (F) 45 3.5% 28 5.1% 73 4.0%
Adult Admit (G) 8 0.6% 1 0.2% 9 0.5%
"Third Door" Admit (K) 5 0.4% 0 0.0% 5 0.3%
International (J) 6 0.5% 1 0.2% 7 0.4%
Transfer (M, MR) 356 27.7% 115 21.1% 471 25.7%
Other or Blank 111 8.6% 9 1.7% 120 6.6%
ACT
<22 266 27.1% 121 26.2% 387 26.8%
22 to 24 258 26.3% 132 28.6% 390 27.0%
25 to 27 233 23.7% 117 25.3% 350 24.2%
28 to 30 143 14.6% 69 14.9% 212 14.7%
>30 82 8.4% 23 5.0% 105 7.3%
OSU GPA
<2.0 64 5.7% 25 4.6% 89 5.3%
2.0 to 2.49 136 12.0% 69 12.8% 205 12.3%
2.50 to 2.99 269 23.8% 130 24.2% 399 23.9%
3.00 to 3.49 346 30.6% 172 32.0% 518 31.0%
3.50 to 4.00 316 27.9% 142 26.4% 458 27.4%
4 Artifacts with missing scores were deleted from each analysis.

OSU Committee for the Assessment of General Education 2011 Annual Report
25
Table 9. 2011 Written Communication Scores: Overall and by Class and Transfer Status
Score
1 2 3 4 5 M N5
Overall Scores
Overall n 12 117 241 144 30 3.12 544
% 2.2% 21.5% 44.3% 26.5% 5.5%
By Class
Freshmen n 3 38 54 27 2 2.90 124
% 2.4% 30.6% 43.5% 21.8% 1.6%
Sophomores n 3 23 51 36 6 3.16 119
% 2.5% 19.3% 42.9% 30.3% 5.0%
Juniors n 2 29 49 30 11 3.16 121
% 1.7% 24.0% 40.5% 24.8% 9.1%
Seniors n 4 27 87 51 11 3.21 180
% 2.2% 15.0% 48.3% 28.3% 6.1%
By Class (regular admit Only)
Freshmen n 3 31 50 23 2 2.91 109
% 2.8% 28.4% 45.9% 21.1% 1.8%
Sophomores n 2 14 38 33 4 3.25 91
% 2.2% 15.4% 41.8% 36.3% 4.4%
Juniors n 0 16 37 15 7 3.17 75
% 0.0% 21.3% 49.3% 20.0% 9.3%
Seniors n 1 13 51 43 7 3.37 115
% 0.9% 11.3% 44.3% 37.4% 6.1%
By Transfer Status
Non-transfer Students
n 6 86 192 123 21 3.16 428
% 1.4% 20.1% 44.9% 28.7% 4.9%
Transfer Students
n 6 31 49 20 9 2.96 115
% 5.2% 27.0% 42.6% 17.4% 7.8%
Average component scores for sub-areas of written communication for 2011 Table 10. 2011 Average Component Scores for Written Communication Component Content Organization Style/Mechanics Documentation Average Score6
3.33 (N=544)
3.17 (N=544)
3.11 (N=544)
2.61 (N=361)
5 Artifacts with missing scores were deleted from each analysis. 6 Individual reviewers provided scores for each component. Averages were calculated by the total sum of reviewers’ scores divided by the total number of reviewers.

OSU Committee for the Assessment of General Education 2011 Annual Report
26
Written communication skills scores, 2001-2006, 2008-2011 (years combined) Table 11. Written Communication Scores, Years Combined: 2001-2006, 2008-2011
Score
1 2 3 4 5 M N7
Overall Scores
Overall n 60 534 785 377 75 2.93 1831 % 3.3% 29.2% 42.9% 20.6% 4.1%
By Class
Freshmen n 13 111 123 48 5 2.74 300 % 4.3% 37.0% 41.0% 16.0% 1.7%
Sophomores n 16 99 149 75 16 2.93 355 % 4.5% 27.9% 42.0% 21.1% 4.5%
Juniors n 12 153 205 91 20 2.90 481 % 2.5% 31.8% 42.6% 18.9% 4.2%
Seniors n 19 170 302 162 34 3.03 687 % 2.8% 24.7% 44.0% 23.6% 4.9%
By Class (regular admit only)
Freshmen n 9 93 111 43 5 2.78 261 % 3.4% 35.6% 42.5% 16.5% 1.9%
Sophomores n 5 60 105 59 12 3.05 241 % 2.1% 24.9% 43.6% 24.5% 5.0%
Juniors n 3 63 123 49 13 3.02 251 % 1.2% 25.1% 49.0% 19.5% 5.2%
Seniors
n 5 79 175 111 21 3.16 391 % 1.3% 20.2% 44.8% 28.4% 5.4%
By Transfer Status
Non-transfer Students
n 34 341 554 279 53 2.98 1261 % 2.7% 27.0% 43.9% 22.1% 4.2%
Transfer Students
n 21 164 182 85 19 2.82 471
% 4.5% 34.8% 38.6% 18.0% 4.0% Average component scores for sub-areas of written communication for 2006, 2008–2011: Table 12. Average Component Scores: 2006, 2008-2011 Component Content Organization Style/Mechanics Documentation Average Score8
3.15 (N=1127)
2.98 (N=1127)
2.93 (N=1127)
2.63 (N=652)
Note: Written communication sub-scores were unavailable prior to 2006. The documentation sub-area was added in 2008.
7 Artifacts with missing scores were deleted from each analysis. 8 Individual reviewers provided scores for each component. Averages were calculated by the total sum of reviewers’ scores divided by the total number of reviewers.

OSU Committee for the Assessment of General Education 2011 Annual Report
27
Comparison of overall average written communication scores by year Table 13. Comparison of Overall Written Communication Scores by Year
Score
1 2 3 4 5 M N
Overall Scores
Overall n 60 534 785 377 75 2.93 1831
% 3.3% 29.2% 42.9% 20.6% 4.1%
By Year
2001 n 2 28 36 15 5 2.92 86
% 2.4% 32.9% 41.2% 17.6% 5.9%
2002 n 11 26 53 20 1 2.77 111
% 9.9% 23.4% 47.7% 18% 0.9%
2003 n 8 64 99 48 6 2.91 225
% 3.6% 28.4% 44% 21.3% 2.7%
2004 n 6 37 53 33 11 3.04 140
% 4.3% 26.4% 37.9% 23.6% 7.9%
2005 n 7 41 65 23 6 2.86 142
% 4.9% 28.9% 45.8% 16.2% 4.2%
2006 n 2 25 51 30 1 3.03 109
% 1.8% 22.9% 46.8% 27.5% 0.9%
2008 n 7 105 55 13 1 2.43 181
% 3.9% 58.0% 30.4% 7.2% 0.6%
2009 n 1 57 65 19 4 2.78 146
% 0.7% 39.0% 44.5% 13.0% 2.7%
2010 n 4 34 67 32 10 3.07 147
% 2.7% 23.1% 45.6% 21.8% 6.8%
2011 n 12 117 241 144 30 3.12 544
% 2.2% 21.5% 44.3% 26.5% 5.5%
Comparison of overall average written communication scores by classification and by year Table 14. Comparison of Overall Written Communication Score by Year and Classification Year
2001 2002 2003 2004 2005 2006 2008 2009 2010 2011 N
Freshmen n 15 23 31 19 16 6 24 25 17 124 300
M 2.47 2.65 2.58 2.74 2.69 2.67 2.25 2.68 3.06 2.90
Sophomores n 20 14 48 25 34 10 34 19 32 119 355
M 2.90 2.57 2.79 3.32 2.82 2.90 2.41 2.74 2.97 3.16
Juniors n 20 34 52 39 46 38 46 39 46 121 481
M 3.00 2.82 3.04 2.74 2.65 2.92 2.46 2.67 3.13 3.16
Seniors n 31 40 94 56 46 55 77 63 45 180 687
M 3.10 2.85 3.01 3.23 3.15 3.16 2.47 2.90 3.09 3.21

OSU Committee for the Assessment of General Education 2011 Annual Report
28
Key Findings In 2011 differences in average writing scores across grade classification were statistically
significant F (3, 540) = 3.927, p = .009. Follow-up tests indicated that on average freshmen (M = 2.91, SD = .818) had lower writing scores than seniors (M = 3.37, SD = .852) p = .007, 95% CI [-0.07, -0.60], d = .551.
In 2011 a one-way ANOVA indicated that on average transfer students (M = 2.96, SD = .986) had lower writing scores than non-transfer students (M = 3.16, SD = .848) F (1, 541) = 3.459, p = .035, d = .159. An examination of the 95% CIs around observed means suggests that such differences should be interpreted with caution. When constructed around the observed mean for transfer students the 95% CI is 2.77 to 3.14; whereas the 95% CI for the average writing score among non-transfer students is 3.08 to 3.24. The 95% CI constructed around the mean difference however supports the significance test. This interval was calculated as .019 to .318.
In 2011 a one-way ANOVA indicated that observed mean differences in writing scores were not statistically significant across gender F (1, 542) = .138, p = .71.
An analysis of all years combined indicated statistically significant differences in average writing scores across freshmen (M = 2.73, SD = .832), sophomores (M = 2.93, SD = .921, juniors (M = 2.90, SD = .877), and seniors (M = 3.03, SD = .890) F (3, 1819) = 8.310, p < .001. Tukey’s HSD test indicated that freshmen had on average lower writing scores than sophomores p = .019, 95% CI [-0.38, -0.02], juniors p = .037, 95% CI [-0.34, -0.01], and seniors p < .001, 95% CI [-0.46, -0.14].
An analysis of all years combined indicated that the average writing score for transfer students (M = 2.82, SD = .916) was lower than that of non-transfer students (M = 2.96, SD = .920) t (1730) = -3.248, p = .001, 95% CI [-0.06, -0.25], d = .156.
An analysis of all years combined indicated that difference in writing scores across females (M = 2.98, SD = .881) and males (M = 2.90, SD = .898) was not statistically significant t (1739) = 1.92, p = .055, 95% CI [-0.002, 0.166] when using p < .05 as the cut-off.
Across all years combined students whose writing artifacts were included in the general education assessment process had an average ACT score of 24.19 (SD = 4.10) and an average OSU GPA of 2.94 (SD = .625). The observed correlation among ACT composite scores and writing consensus scores was statistically significant (r = .337, p < .001) as was the observed correlation among writing scores and OSU GPA (r = .275, p < .001). A simple linear regression analysis indicated that for a student with an average OSU GPA, an increase in 1 ACT point predicted an increase of .042 points in writing consensus scores (p <.001) whereas for a student with an average ACT score, an increase in OSU GPA of 1 point predicted an increase in writing consensus scores of .242 points (p < .001). Combined ACT composite scores and OSU GPA accounted for approximately 13% of the variance in writing consensus scores F (2, 1393) = 106.20, p < .001. A hierarchical regression failed to
find a statistically significant interaction among ACT composite scores and OSU GPA 2R = .000, p = .595. Similarly, a hierarchical regression indicated that the amount of unique

OSU Committee for the Assessment of General Education 2011 Annual Report
29
variance predicted by OSU GPA accumulated in GE designated courses was not statistically
significant when controlling for overall OSU GPA and ACT composite scores 2R = .003, p = .182.
A one-way ANOVA indicated that the observed differences in the average senior writing comprehension score across 2001 (M = 3.10, SD = .91, n = 31), 2002 (M = 2.85, SD = .80, n = 40), 2003 (M = 3.01, SD = .82, n = 94), 2004 (M = 3.23, SD = 1.07, n = 57), 2005 (M = 3.15, SD = .90, n = 45), 2006 (M = 3.16, SD = .79, n = 55), 2008 (M = 2.47, SD = .75, n = 79), 2009 (M = 2.90, SD = .85, n = 63), 2010 (M = 3.09, SD = .90, n = 45) and 2011 (M = 3.21, SD = .90, n = 45 were statistically significant F(8, 500) = 5.046, p < .001. Follow-up tests indicated that seniors in 2008, on average, had lower writing comprehension scores than seniors in 2001 (p < .05), 2003 (p < .01), 2004 (p < .01), 2005 (p < .01), 2006 (p < .01), 2010 (p < .01), and in 2011 (p < .001).
A one-way ANOVA indicated that the observed differences in the average freshman writing
comprehension scores across 2001 (M = 2.47, SD = .92, n = 15), 2002 (M = 2.65, SD = .98, n = 23), 2003 (M = 2.58, SD = .90, n = 31), 2004 (M = 2.74, SD = .81, n = 19), 2005 (M = 2.69, SD = 1.08, n = 16), 2006 (M = 2.67, SD = .82, n = 6), 2008 (M = 2.25, SD = .44, n = 24), 2009 (M = 2.68, SD = .90, n = 25), 2010 (M = 3.06, SD = .83, n = 17), and 2011 (M = 2.88, SD = .83, n = 124) were statistically significant. Follow-up tests indicated that on average freshmen in 2011 had higher writing consensus scores than freshmen in 2008 (p = .023).

OSU Committee for the Assessment of General Education 2011 Annual Report
30
Differences between Transfer and Non-transfer Students A linear regression analysis indicated that differences in writing scores between transfer and non-transfer students were not statistically significant when controlling for OSU GPA (b = -.056, p = .242). Across all years combined writing artifacts had an overall OSU GPA 3.05 (SD = .62). This analysis thus indicates that if both a transfer and non-transfer student had an average OSU GPA of 3.05 their predicted difference in writing scores would not be statistically significant. Given this analysis, OSU GPA may be a proxy indicator of other variables that potentially contribute to observed differences in writing scores across transfer and non-transfer students. This section details subsequent analyses aimed at better understanding observed differences among transfer and non-transfer students. As previously indicated, across all years combined writing artifacts had an overall average OSU GPA of 3.05 (SD = .62), and additionally they had an overall average cumulative credit hours of 88.25 (SD = 41.26). Transfer students had an average GPA of 2.89 (SD = .68) whereas non-transfer students had an average GPA of 3.12 (SD = .58). These differences were statistically significant t (1688) = 7.138, p < .001, 95% CI [.17, .30], d = .347. Transfer students had an average of 106.18 (SD = 36.30) credit hours whereas non-transfer students had an average of 81.44 credit hours (SD = 40.82). These differences were also statistically significant t (1686) = 11.38, p < .001, 95% CI [20.70, 28.78], d = .554. Given such findings both OSU GPA and cumulative credit hours may be beneficial for predicting observed mean differences across transfer status. A hierarchical regression analysis was thus conducted in order to examine whether transfer status interacted with OSU GPA or cumulative credit hours when predicting writing scores. In this analysis transfer status is dummy coded so that transfer students = 1 and non-transfer students = 0. All continuous variables are mean centered before being entered into the regression analysis. The hierarchical regression analysis was conducted in 3 steps. First, the main effect of cumulative credit hours, OSU GPA, and transfer status was entered first into the regression equation. This is then followed at step 2 wherein all possible two-way interactions are entered into the analysis (i.e. transfer status x OSU GPA, OSU GPA x cumulative credit hours, and transfer status x cumulative credit hours). At step 3 the three-way interaction among transfer status, OSU GPA, and cumulative credit hours was entered into the equation. Evaluation of interaction terms are examined by evaluating statistically significant changes in R-square, or the differences in the amount of variance accounted for by the set of variables entered at each step. Results of the hierarchical regression analysis are presented in Table 15. Table 15 indicates that cumulative credit hours, GPA, and transfer status accounted for 8.6% of the variance in writing consensus scores F (3, 1667) = 52.526, p < .001. At step 2 all two-interaction terms were entered into the equation, which accounted for an additional 0.7% of the variance in writing scores F (3, 1664) = 4.18, p = .006. The increase in explained variance at Step 3, which included the three way interaction among transfer status, GPA, and cumulative credit hours, was not statistically significant F (1, 1663) = 1.549, p = .213. Consequently, only statistically significant two-way interaction terms entered were interpreted. The predicted writing score for a non-transfer student with an average number of cumulative credit hours and average GPA is 2.956. This same predicted value is .128 points lower for transfer students (p = .015). The two-way interaction among transfer status and GPA indicates that the expected increase in writing scores predicted from GPA varies across transfer status (see Figure 2).

OSU Committee for the Assessment of General Education 2011 Annual Report
31
Table 15. Hierarchical Regression Analysis Investigating the Prediction of Writing Consensus Scores from Transfer Status, OSU GPA, and Cumulative Credit Hours Step Predictors Step 1 Step 2 Step 3 1 CUMHRS .099*** .100*** .101*** GPA .265*** .320*** .312*** TRANSFER -.056* -.060* -.064* 2 TRANSFER x GPA ----- -.066* -.067* GPA x CUMHRS ----- .084** .064** TRANSFER x CUMHRS ----- .005 .012 3 TRANSFER x GPA x CUMHRS ----- ----- .036
2R .086*** .093*** .094***
2R .000 .007** .001
Note: All coefficients are standardized; CUMHRS = Cumulative credit hours; GPA = OSU grade point average; Transfer = transfer student coded “1” and non-transfer coded as “0”; *** = p < .001; ** = p < .01; * = p < .05. For non-transfer students an increase in GPA of one unit is associated with an expected increase in writing scores of .458 points (p < .001) whereas for transfer students a unit increase in GPA predicts an increase in writing scores of .298 points (p < .001). In other words, the relationship among GPA and writing scores is stronger for non-transfer students than for transfer students. This interaction also implies that predicted writing scores for students with a GPA at 1 standard deviation below the mean (i.e. GPA = 2.26) are similar for transfer and non-transfer students. However, for individuals with a GPA 1 standard deviation above the mean (i.e. GPA = 3.56) non-transfer students have a predicted writing score of 3.39 whereas transfer students have a predicted writing score of 3.12. Figure 2. Interaction between Transfer Status and OSU GPA
Note: This graph is controlling for cumulative credit hours. High GPA = 1 standard deviation above the OSU GPA mean or 3.56; Low GPA = 1 standard deviation below the OSU GPA mean or 2.26.

OSU Committee for the Assessment of General Education 2011 Annual Report
32
The hierarchical regression analysis also found a two-way interaction between GPA and cumulative credit hours (see Figure 3). An examination of this interaction indicates that the predicted increase in writing scores for every unit increase in GPA varies across levels of cumulative credit hours. One unit increase in GPA predicts a .582 (p < .001) increase in writing scores for individuals 1 standard deviation above the mean in cumulative credit hours (i.e. cumulative credit hours = 129.51). For individuals 1 standard deviation below the mean in cumulative credit hours (i.e. cumulative credit hours = 46.99) a unit increase in GPA predicts an increase in writing scores of .334 points (p < .001). This interaction also indicates that for students 1 standard deviation below the mean on GPA (i.e. GPA = 2.26) the predicted writing score is similar for students with high and low levels of cumulative credit hours. Students with GPAs 1 standard deviation above the mean (i.e. GPA = 3.56) with a high number of cumulative credit hours have a predicted writing score of 3.39 whereas students with a low number of cumulative credit hours have a predicted writing score of 3.08. Figure 3. Interaction Between OSU GPA and Cumulative Credit Hours
Note: This graph is for non-transfer students. The statistically insignificant three-way interaction however suggests that such an effect would be the same for transfer students. High GPA = 1 standard deviation above the OSU GPA mean or 3.56; Low GPA = 1 standard deviation below the OSU GPA mean or 2.26. High Hours = 1 standard deviation above the mean cumulative credit hours or 129.51; Low Hours = 1 standard deviation below the mean cumulative credit hours or 46.99 credit hours. Discussion of Results OSU GPA remains an important variable in the prediction of writing scores, and may serve as a proxy indicator of other important factors that contribute to observed differences in writing scores across transfer and non-transfer students. It is important to note that transfer students had, on average, lower OSU GPAs than non-transfer students. The predicted effect of GPA on writing scores however, was not the same across transfer status. Increases in GPA predicted higher writing scores among non-transfer students than transfer students. Both transfer and non-transfer students with low GPAs have similar predicting writing scores whereas for students

OSU Committee for the Assessment of General Education 2011 Annual Report
33
with high GPAs non-transfer students have higher predicted writing scores than that of transfer students. It is important to note that such an effect controls for cumulative credit hours, thus reducing the possibility that such an effect can be attributed to increases in the total number of courses taken. If we assume that most transfer students are acquiring their initial writing skills at other colleges or universities, then the above evidence may suggest that students who adequately acquired such skills at OSU tend to perform better than their counterparts. GPA is a reflection of student skill, motivation, and faculty assignments. One aspect of student skill may also be writing ability. Consequently, the above analysis cannot disentangle which aspect of GPA may be more or less important in this statistical interaction. The interaction among GPA and cumulative credit hours reflects that as students accumulate more experience GPA is a stronger predictor of overall writing ability. In support of this view, the interaction indicates that an increase in one letter grade among students with a low number of cumulative credit hours is a weaker predictor of writing ability than students who have a high number of cumulative credit hours. Such an effect suggests that changes in letter grades are a better indicator of writing ability as a student gains coursework experience at OSU. These findings may consequently imply that writing ability may matter more in upper-division courses.

OSU Committee for the Assessment of General Education 2011 Annual Report
34
Assessment of Minimum Writing Requirements for GE Designated Courses Increased writing requirements for General Education (GE) designated courses began being phased into the requirements for receipt of the GE designation in 2005. Subsequent analyses were performed in order to explore whether the implementation of these requirements were beneficial to student writing outcomes. Descriptive statistics for each observed GE designation across year of data collection are provided in Table 16 below. The descriptive information provided below indicates that there are numerous small sample sizes in particular GE designations. Thus two groups were initially created, which include 1 = Courses with GE designation and 2 = courses without a GE designation. Average writing scores for courses with and without GE designations were then graphically examined (see Figure 4). Figure 4. Trajectory of Average Writing Scores for General Education Designated and Non-General Education Designated Courses
Note: No writing scores were collected in 2007. The graph thus extrapolates 2007 writing scores from observed data.

OSU Committee for the Assessment of General Education 2011 Annual Report
35
Table 16. Descriptive Statistics for Writing Artifacts from 2001 to 2011 GE 2001 2002 2003 2004 2005 2006 2008 2009 2010 2011 TotalNone n
avg 43 2.77
53 2.58
103 2.92
100 3.04
101 2.89
48 2.34
117 2.39
82 2.71
67 3.01
83 3.07
797 2.81
D n avg
0 n/a
0 n/a
0 n/a
0 n/a
0 n/a
0 n/a
0 n/a
0 n/a
0 n/a
18 2.94
18 2.94
DS n avg
0 n/a
0 n/a
0 n/a
0 n/a
0 n/a
0 n/a
0 n/a
0 n/a
0 n/a
17 2.88
17 2.88
DH n avg
0 n/a
0 n/a
0 n/a
0 n/a
0 n/a
0 n/a
0 n/a
0 n/a
10 3.00
19 3.32
29 3.21
H n avg
38 3.16
29 3.24
53 2.94
10 3.20
0 n/a
30 3.37
27 2.96
24 3.21
19 2.95
203 3.03
433 3.07
I n avg
0 n/a
0 n/a
0 n/a
0 n/a
0 n/a
9 3.22
19 2.26
12 2.67
10 3.50
34 3.15
84 2.93
S n avg
0 n/a
20 2.75
42 2.86
20 3.00
0 n/a
8 2.75
0 n/a
15 2.73
17 2.76
92 3.26
214 3.01
HI n avg
0 n/a
4 3.25
8 3.00
0 n/a
0 n/a
0 n/a
0 n/a
6 2.67
0 n/a
19 3.47
37 3.22
N n avg
5 2.40
0 n/a
0 n/a
0 n/a
30 2.77
14 2.86
0 n/a
7 2.86
0 n/a
0 n/a
56 2.77
IS n avg
0 n/a
5 1.60
19 2.84
10 3.00
11 2.82
0 n/a
18 2.33
0 n/a
24 3.38
59 3.14
146 2.95
Total n avg
86 2.92
111 2.77
225 2.91
140 3.04
142 2.86
109 3.03
181 2.43
146 2.78
147 3.07
544 3.11
1831
A visual examination of the graph above suggests that up to and including 2005, or the year in which GE writing requirements were added to OSU standards, no obvious pattern in average writing scores appears to emerge across the two groups. After 2005 however, artifacts sampled from GE designated course appear to have consistently higher average writing scores than non-GE designated courses. It is important, however, to examine the likelihood of these observations when they are assumed to result from chance fluctuations. Though a true longitudinal investigation of this effect is complicated by the cross-sectional nature of the data, it is possible to approximate such estimations. For the present analysis 4 groups were created: 1 = GE designated course for 2005 or before; 2 = Non GE designated course for 2005 or before; GE designated course after 2005, and non-GE designated course after 2005. Descriptive statistics across these 4 categories are provided in Table 17. A 2 X 2 factorial ANOVA was conducted in order to investigate whether observed mean differences across these categories were statistically significant.
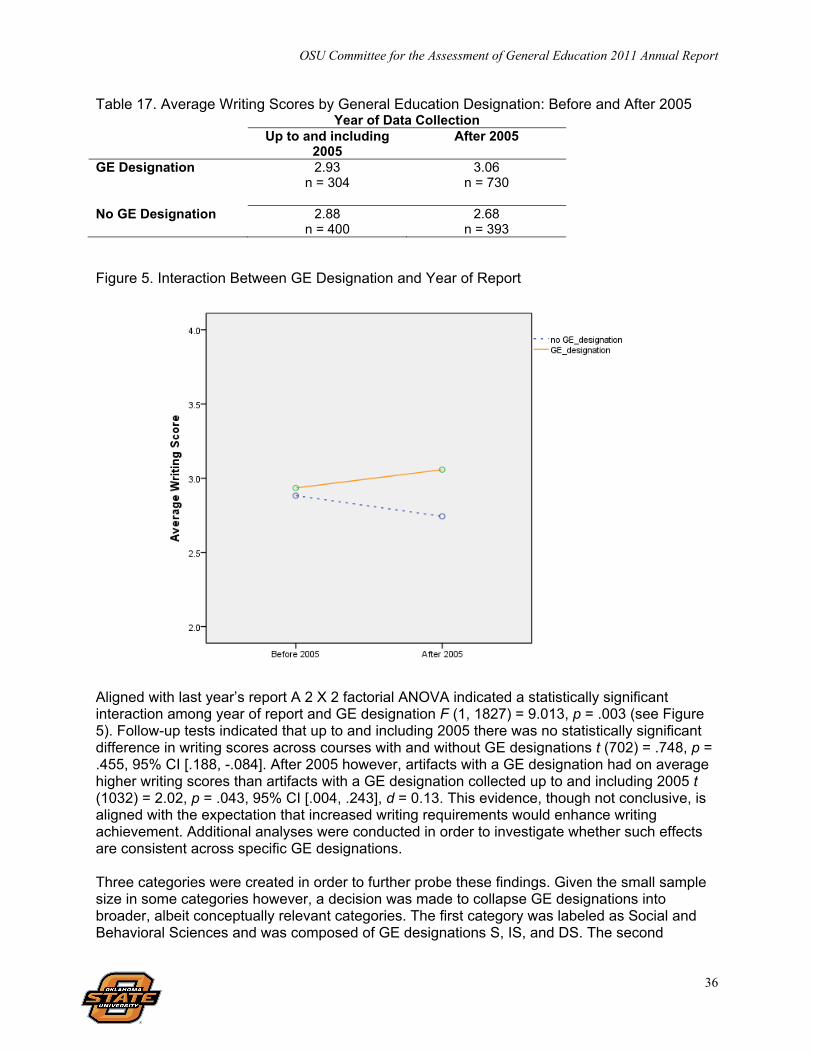
OSU Committee for the Assessment of General Education 2011 Annual Report
36
Table 17. Average Writing Scores by General Education Designation: Before and After 2005 Year of Data Collection Up to and including
2005 After 2005
GE Designation 2.93 n = 304
3.06 n = 730
No GE Designation 2.88 n = 400
2.68 n = 393
Figure 5. Interaction Between GE Designation and Year of Report
Aligned with last year’s report A 2 X 2 factorial ANOVA indicated a statistically significant interaction among year of report and GE designation F (1, 1827) = 9.013, p = .003 (see Figure 5). Follow-up tests indicated that up to and including 2005 there was no statistically significant difference in writing scores across courses with and without GE designations t (702) = .748, p = .455, 95% CI [.188, -.084]. After 2005 however, artifacts with a GE designation had on average higher writing scores than artifacts with a GE designation collected up to and including 2005 t (1032) = 2.02, p = .043, 95% CI [.004, .243], d = 0.13. This evidence, though not conclusive, is aligned with the expectation that increased writing requirements would enhance writing achievement. Additional analyses were conducted in order to investigate whether such effects are consistent across specific GE designations. Three categories were created in order to further probe these findings. Given the small sample size in some categories however, a decision was made to collapse GE designations into broader, albeit conceptually relevant categories. The first category was labeled as Social and Behavioral Sciences and was composed of GE designations S, IS, and DS. The second
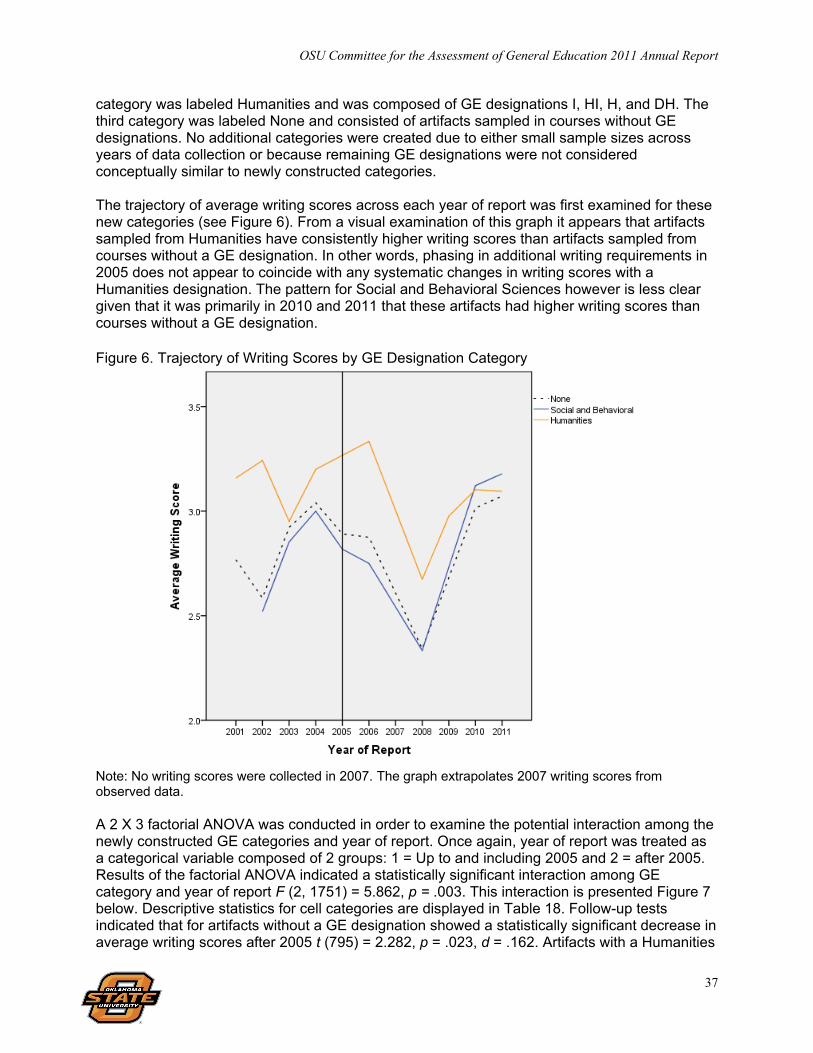
OSU Committee for the Assessment of General Education 2011 Annual Report
37
category was labeled Humanities and was composed of GE designations I, HI, H, and DH. The third category was labeled None and consisted of artifacts sampled in courses without GE designations. No additional categories were created due to either small sample sizes across years of data collection or because remaining GE designations were not considered conceptually similar to newly constructed categories. The trajectory of average writing scores across each year of report was first examined for these new categories (see Figure 6). From a visual examination of this graph it appears that artifacts sampled from Humanities have consistently higher writing scores than artifacts sampled from courses without a GE designation. In other words, phasing in additional writing requirements in 2005 does not appear to coincide with any systematic changes in writing scores with a Humanities designation. The pattern for Social and Behavioral Sciences however is less clear given that it was primarily in 2010 and 2011 that these artifacts had higher writing scores than courses without a GE designation. Figure 6. Trajectory of Writing Scores by GE Designation Category
Note: No writing scores were collected in 2007. The graph extrapolates 2007 writing scores from observed data. A 2 X 3 factorial ANOVA was conducted in order to examine the potential interaction among the newly constructed GE categories and year of report. Once again, year of report was treated as a categorical variable composed of 2 groups: 1 = Up to and including 2005 and 2 = after 2005. Results of the factorial ANOVA indicated a statistically significant interaction among GE category and year of report F (2, 1751) = 5.862, p = .003. This interaction is presented Figure 7 below. Descriptive statistics for cell categories are displayed in Table 18. Follow-up tests indicated that for artifacts without a GE designation showed a statistically significant decrease in average writing scores after 2005 t (795) = 2.282, p = .023, d = .162. Artifacts with a Humanities

OSU Committee for the Assessment of General Education 2011 Annual Report
38
GE designation showed no statistically significant changes after 2005 t (581) = .342, p = .733. Artifacts with a Social and Behavioral Sciences designation however, showed statistically significant increases after 2005 t (375) = 2.785, p = .006, d = .287. Figure 7. Interaction Between Specific GE Categories and Year of Report
Table 18. Descriptive Statistics for Interaction between General Education Categories and Year of Report Mean SE 95% CI Up to and including 2005
None
2.88 .04 2.79 - 2.97
Social and Behavioral
2.82 .08 2.67 – 2.97
Humanities
3.09 .07 2.95 – 3.24
After 2005 None
2.74 .04 2.66 – 2.83
Social and Behavioral
3.07 .06 2.96 – 3.18
Humanities 3.06 .04 2.98 – 3.14 Note: Social & Behavioral = GE designations S, IS, and DS; Humanities = GE designations I, HI, H, and DH; SE = standard error; 95% CI = 95% confidence interval. It is important to recognize that the average writing score in 2008 may be considered an outlier, given that this year’s average writing score tends to be lower than that of other years in which writing scores were assessed. When 2008 is removed from the analysis there are no statistically significant differences in courses sampled up to and including 2005 (M = 2.88, SE = .04) and after 2005 (M = 2.91, SE = .05) for courses without a GE designation. Stated differently, the apparent decrease in writing scores for courses without a GE designation appears to be a

OSU Committee for the Assessment of General Education 2011 Annual Report
39
function of the 2008 average writing scores. Removing 2008 from the analysis, however, does not change the substantive findings for courses with a Social and Behavioral Science or Humanities designation. Key Findings
Up to and including 2005, or the year in which GE writing requirements were added to OSU standards, no obvious patterns in writing scores emerged across artifacts with and without GE designations. After 2005, however, a clear pattern appears to emerge wherein average writing scores for GE designated courses were consistently higher than averages for non-GE designated courses.
A 2 X 2 factorial ANOVA indicated a statistically significant interaction among year of report and GE designation F (1, 1827) = 9.013, p = .003. Follow-up tests indicated that up to and including 2005 there was no statistically significant difference in writing scores across courses with and without GE designations t (702) = .748, p = .455, 95% CI [.188, -.084]. After 2005 however, artifacts with a GE designation had on average higher writing scores than artifacts with a GE designation collected up to and including 2005 t (1032) = 2.02, p = .043, 95% CI [.004, .243], d = .13.
Three categories were created in order to further probe these findings. The first category was labeled as Social and Behavioral Sciences and is composed of GE designations S, IS, and DS. The second category was labeled Humanities and is composed of GE designations I, HI, H, and DH. The third category is labeled ‘none’ and consists of artifacts sampled in courses without GE designations. Results of the 2 X 3 factorial ANOVA indicated a statistically significant interaction among these GE categories and year of report F (2, 1751) = 5.862, p = .003.
Follow-up tests indicated that artifacts with no GE designations showed a statistically significant decrease in average writing scores after 2005 t (795) = 2.282, p = .023, d = .161. Artifacts with a Humanities GE designation showed no statistically significant changes after 2005 t (581) = .342, p = .733. Artifacts with a Social and Behavioral Sciences designation however, showed statistically significant increases after 2005 t (375) = 2.785, p = .006, d = .287.
Courses without a GE designation appear to be influenced by the inclusion of 2008 within the analysis. This year may be considered an outlier given that the average score in 2008 tends to be lower than that of other years. If we remove 2008 from the differences in courses without a GE designation fail to be statistically significant. Removing 2008 from the analysis however, does not alter the substantive findings related to courses with an S or H GE designation.

OSU Committee for the Assessment of General Education 2011 Annual Report
40
General Education and Student Retention
In 2011 retention statistics were gathered for 401 freshmen and sophomores from 2001 through 2010. This specific sample of freshmen and sophomores was selected for previously scored artifacts that had valid identification numbers. All data were retrieved from Institutional Research and Information Management (IRIM). One-year retention was defined as a dichotomous variable wherein students were identified as being retained if they enrolled in the following 2 semesters from the semester of their initial assessment. Two-year retention was identified if students were still enrolled 4 semesters from the semester of their initial general education assessment. Retention information received from IRIM was then matched to information already collected on each student’s artifact. Descriptive statistics for the overall consensus score and 1-year retention is provided in Table 19. From these statistics it can be seen that 90.3% of freshmen and sophomore students whose writing artifacts were included in the general education assessment process were retained one year later. About 9.5% of students whose artifacts received a score of 1 were not retained, 9.7% of students whose artifacts received a score of 2 were not retained, 9.8% of students whose artifacts received a score of 3 were not retained, 8.6% of students whose artifacts received a score of 4 were not retained, and 15.4% of students whose artifacts received a score of 5 were not retained. Due to a small number of observations within each cell consensus scores were collapsed into high and low categories. A high consensus score was defined as having a score of either 4 or 5, whereas a low consensus score was defined as having a score of either a 1 or 2. The percentage of students retained across these categories is presented in Table 20. Table 20 shows that 9.6% of students whose artifacts received a low score were not retained 1 year later and 9.9% of students whose artifacts received a high writing score were not retained 1 year later. A chi-square indicated no relationship between retention status and artifact score,
2 (1) = 0.0, p = 1.00. Similar investigations were conducted separately for freshmen and sophomores (see Tables 21 and 22 respectively). Freshmen had an overall 1 year retention rate of 88.6% whereas sophomores had a 1 year retention rate of 91.7%. The campus-wide retention rate for first-to-second year for first-time full-time students is 78% (some students in the general education assessment pool may not be full-time students or may not be first-time students). The relationship among grade classification and retention status however, was not statistically significant 2 (1) = .755, p = .355. The relationship among high and low writing scores and
retention status was not statistically significant among freshmen 2 (1) = .220, p = .639 or
sophomores 2 (1) = .065, p = .799.

OSU Committee for the Assessment of General Education 2011 Annual Report
41
Table 19. One-year Retention Rates by Writing Consensus Scores Retained Consensus Total Score No Yes
1 2 9.5%
19 90.5%
21 5.2%
2 14 9.7%
131 90.3%
145 36.2%
3 16 9.8%
148 90.2%
164 40.9%
4 5 8.6%
53 91.4%
58 14.5%
5 2 15.4%
11 84.6%
13 3.2%
Retained Total 39 9.7%
362 90.3%
401 100.0%
Note: Table is for 2001-2010 freshmen and sophomores. Table 20. One-year Retention Rates by High and Low Writing Consensus Scores Retained Consensus Total Score No Yes
Low 16 9.6%
150 90.4%
166 70.0%
High 7 9.9%
64 90.1%
71 30.0%
Retained Total 23 9.7%
214 90.3%
237 100.0%
Note: Table is for 2001-2010 freshmen and sophomores. Low = consensus score of 1 or 2; High = consensus score of 4 or 5.
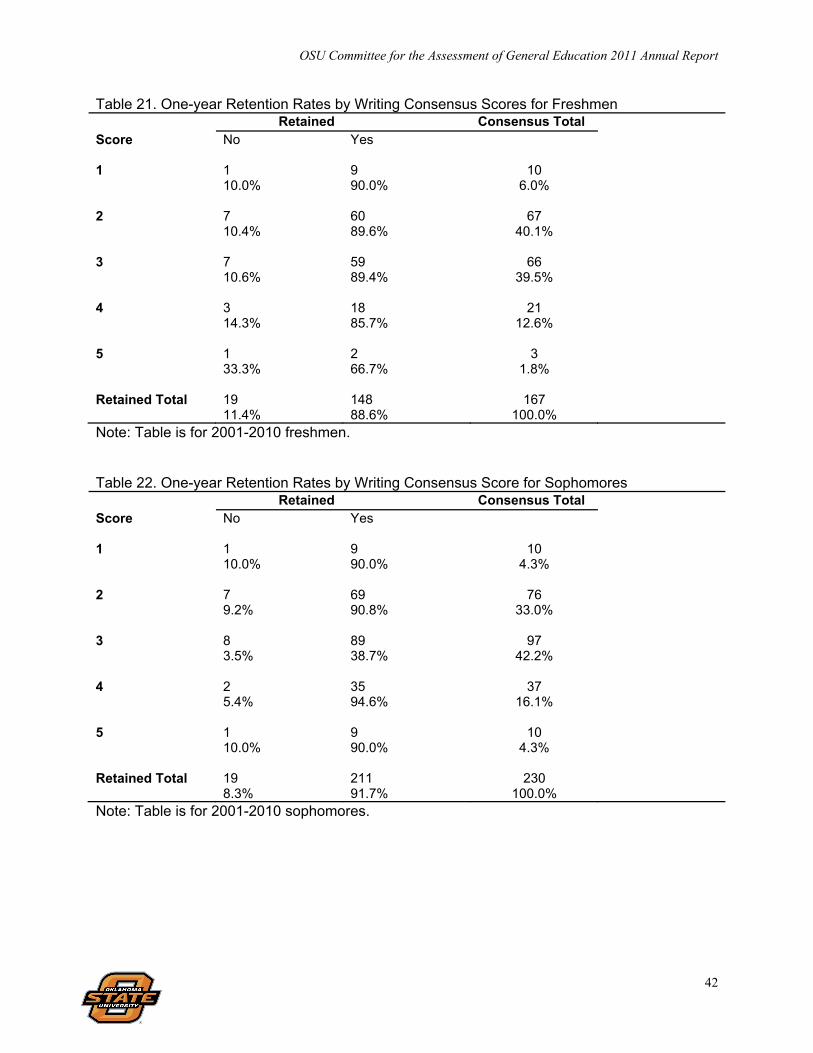
OSU Committee for the Assessment of General Education 2011 Annual Report
42
Table 21. One-year Retention Rates by Writing Consensus Scores for Freshmen Retained Consensus Total Score No Yes
1 1 10.0%
9 90.0%
10 6.0%
2 7 10.4%
60 89.6%
67 40.1%
3 7 10.6%
59 89.4%
66 39.5%
4 3 14.3%
18 85.7%
21 12.6%
5 1 33.3%
2 66.7%
3 1.8%
Retained Total 19 11.4%
148 88.6%
167 100.0%
Note: Table is for 2001-2010 freshmen. Table 22. One-year Retention Rates by Writing Consensus Score for Sophomores Retained Consensus Total Score No Yes
1 1 10.0%
9 90.0%
10 4.3%
2 7 9.2%
69 90.8%
76 33.0%
3 8 3.5%
89 38.7%
97 42.2%
4 2 5.4%
35 94.6%
37 16.1%
5 1 10.0%
9 90.0%
10 4.3%
Retained Total 19 8.3%
211 91.7%
230 100.0%
Note: Table is for 2001-2010 sophomores.

OSU Committee for the Assessment of General Education 2011 Annual Report
43
Table 23. Retention by Writing Consensus Score and Year of Report 2001 2002 2003 2004 2005 2006 2008 2009 2010 Score 1 0%
N = 1 100% N = 6
100% N = 4
100% N = 1
100% N = 1
100% N = 1
100% N = 1
0% N = 1
N/A
2 92.9% N = 14
100% N = 6
92.9% N = 28
84.6% N = 13
100% N = 12
50% N = 4
90.9% N = 33
85.0% N = 20
93.3% N = 15
3 100% N = 14
94.4% N = 18
78.8% N = 33
88.9% N = 18
94.7% N = 19
100% N = 8
94.1% N = 17
93.3% N = 15
86.4% N = 22
4 100% N = 2
100% N = 6
83.3% N = 12
75.0% N = 8
100% N = 8
100% N = 3
66.7% N = 3
100% N = 7
100% N = 9
5 100% N = 2
N/A N/A 80.0% N = 5
100% N = 2
N/A N/A 100% N = 1
66.7% N = 3
Note: N = total number of artifacts observed within each cell. For example in 2001 there were 14 artifacts that received a writing consensus score of 2. Of these 92.9% were retained 1 year after the date of assessment. N/A = no observations were made within this cell. This table is for all observed freshmen and sophomores. One-year retention rates are also reported for writing consensus scores across each year of observation in Table 23. In 2001 93.9% of the students whose writing artifacts were included in the general education assessment process were retained. Of these students approximately 13% had a writing score of a 4 or 5. In 2002 97.2% of the students whose writing artifacts were included in the general education assessment process were retained one year later. In 2002 no writing artifacts received a score of 5. Of the students in this group who were retained in 2002, 17% received a score of 4. In 2003 85.7% of the students whose writing artifacts were included in the general education assessment process were retained one year later. Once again in 2003, no artifacts received a score of 5. Of the students in this group who were retained in 2003, 15% received a score of 4. In 2004 84.4% of students whose writing artifacts were included in the general education assessment process were retained on year later. Of these students, 26% had a writing score of 4 or 5. In 2005 97.9% of students whose writing artifacts were included in the general education assessment process were retained one year later. Of these students, approximately 22% had a writing score of either 4 or 5. In 2006 87.5% of the students whose writing artifacts were included in the general education assessment process were retained one year later. No artifacts in 2006 received a score of 5. Approximately 21% of the students whose writing artifacts were included in the general education assessment process in 2004 received a score of 4. In 2008 90.7% of the students whose writing artifacts were included in the general education assessment process were retained one year later. No artifacts received a score of 5 in 2008 while approximately 4% of artifacts received a score of 4. In 2009 88.6% of students whose writing artifacts were included in the general education assessment process were retained one year later. Of these students nearly 21% had a writing score of 4 or 5. In 2010 89.8% of the students whose writing artifacts were included in the general education assessment process were retained one year later. Of these students, 25% had a writing score of 4 or 5. Figure 8 and 9 provide the observed mean writing scores across year of data collection and retention status. These changes are reported separately for freshmen and sophomores. These figures should be interpreted with caution however given that the number of students who were not retained was small in numerous years of data collection. Across all years combined there

OSU Committee for the Assessment of General Education 2011 Annual Report
44
were 362 artifacts from students who were retained and 39 artifacts from students who were not retained one year later. The average writing consensus score for artifacts from retained students was 2.74 (SD = .88) whereas the average writing consensus score for artifacts from students who were not retained was 2.77 (SD = .93). These differences were not statistically significant t (399) = -.194, p = .846. For freshmen there were 148 students whose writing artifacts were included in the general education assessment process who were retained, with an average writing score of 2.62 (SD = .83) and 19 artifacts from students who were not retained, with an average writing score of 2.79 (SD = .98). These differences were also not statistically significant t (165) = -.815, p = .416. For sophomores there were 211 students whose writing artifacts were included in the general education assessment process who were retained, with an average writing score of 2.84 (SD = .90) and 19 artifacts from students who were not retained, with an average writing score of 2.74 (SD = .93). These differences were also not statistically significant t (228) = .471, p = .638. Figure 8. Average Consensus Score by One-year Retention Status and Year of Report for Freshmen

OSU Committee for the Assessment of General Education 2011 Annual Report
45
Figure 9. Average Consensus Score for One-year Retention Status by Year of Report for Sophomores
Two year retention rates were also examined. Artifacts sampled in 2010 were not included in this analysis since 2 year-retention status is unavailable. Table 24 provides the two-year retention rates for writing consensus scores. Across all years combined 288 freshmen and sophomores whose writing artifacts were included in the general education assessment process were retained after 2 years. These artifacts had an average consensus score of 2.76 (SD = .88). Across all years combined 69 freshmen and sophomores whose writing artifacts were included in the general education assessment process were not retained after 2 years. These artifacts had an average consensus score of 2.52 (SD = .89). Mean differences in writing scores across retained and not-retained groups were statistically significant t (355) = 2.021, p = .044, 95% CI [.006, .471], d = .214.

OSU Committee for the Assessment of General Education 2011 Annual Report
46
Table 24. Two-year Retention Rates by Writing Consensus Scores Retained Consensus Total Score No Yes
1 6 28.6%
15 71.4%
21 5.9%
2 31 23.7%
100 76.3%
131 36.2%
3 24 16.6%
121 83.4%
145 40.6%
4 6 8.6%
43 87.8%
49 13.7%
5 2 18.2%
9 81.8%
11 3.1%
Retained Total 69 19.3%
288 80.7%
357 100.0%
Note: Table is for 2001-2009 freshmen and sophomores. Two-year retention rates were then examined across freshmen and sophomores independently. These rates are provided in Table 25 and Table 26 respectively. Table 25 shows that 119 freshmen who were included in the general education assessment process were retained 2 years later. Artifacts from these students had an average writing consensus score of 2.61 (SD = .84). Across all years combined 35 freshmen who were included in the general education assessment process were not retained two years later. Artifacts from these students had an average writing consensus score of 2.60 (SD = .91). Mean differences in average writing scores were not statistically significant between freshmen that were retained and those that were not retained t (152) = .082, p = .935. Table 26 indicates that for sophomores there were 169 artifacts from students who were included in the general education assessment process who were retained after 2 years. These artifacts had an average writing consensus score of 2.86 (SD = .90). Across all years combined 30 sophomores who were included in the general education assessment process were not retained after 2 years. These artifacts had an average writing consensus score of 2.50 (SD = .86). Mean differences in average writing scores were statistically significant among sophomores that were retained and those that were not retained t (197) = 2.055, p = .041, 95% CI [.015, .073], d = .293, d = .293.

OSU Committee for the Assessment of General Education 2011 Annual Report
47
Table 25. Two-year Retention Rates by Writing Consensus Scores for Freshmen Retained Consensus Total Score No Yes
1 3 30.0%
7 70.0%
10 6.5%
2 14 21.9%
50 78.1%
64 41.6%
3 13 22.0%
46 78.0%
59 38.3%
4 4 22.2%
14 77.8%
18 11.7%
5 1 33.3%
2 66.7%
3 1.9%
Retained Total 35 22.7%
119 77.3%
154 100.0%
Note: Table is for 2001-2009 freshmen. Table 26. Two-year Retention Rates by Writing Consensus Scores for Sophomores Retained Consensus Total Score No Yes
1 2 20.0%
8 80.0%
10 5.0%
2 15 23.1%
50 76.9%
65 32.7%
3 10 11.8%
75 88.2%
85 42.7%
4 2 6.5%
29 93.5%
31 15.6%
5 1 12.5%
7 87.5%
8 4.0%
Retained Total 30 15.1%
169 84.9%
199 100.0%
Note: Table is for 2001-2009 sophomores.

OSU Committee for the Assessment of General Education 2011 Annual Report
48
Table 27. Two-year Retention Rates by High and Low Writing Consensus Scores for Sophomores Retained Consensus Total Score No Yes
Low 17 22.7%
58 77.3%
75 65.8%
High 3 7.7%
36 92.3%
39 34.2%
Retained Total 20 17.5%
94 82.5%
114 100.0%
Note: Table is for 2001-2009 sophomores. Low = consensus score = 1 or 2; High = consensus score = 4 or 5. An examination of Table 27 indicates that sophomores who had writing artifacts with low scores (i.e. 1 or 2) had a retention rate of 77.3% whereas sophomores who had writing artifacts with high scores (i.e. = 4 or 5) had a retention rate of 92.3%. A chi-square test indicated that there was a relationship between retention status and artifact score for sophomores χ2(1) = 3.977, p = .046. The strength of this relationship, as indicated by the phi coefficient, was .187, p = .046. The relative risk ratio indicates that the probability of not being retained over a 2 year period was 2.947 times higher among sophomores with low consensus scores than sophomores with high consensus scores, 95% CI [.919, 9.445]. Key Findings
The average writing consensus score for artifacts from students who were retained after 1 year was 2.74 (SD = .88) whereas the average writing consensus score for artifacts from students who were not retained after 1 year was 2.77 (SD = .93). These differences were not statistically significant t (399) = -.194, p = .846.
For freshmen there were 148 artifacts from students who were retained after 1 year, with an average writing score of 2.62 (SD = .83). There were 19 artifacts from freshmen who were not retained after 1 year, with an average writing score of 2.79 (SD = .98). These differences were not statistically significant t (165) = -.815, p = .416.
For sophomores there were 211 artifacts from students who were retained after 1 year, with an average writing score of 2.84 (SD = .90). There were 19 artifacts from sophomores who were not retained after 1 year, with an average writing score of 2.74 (SD = .93). These differences were not statistically significant t (228) = .471, p = .638.
Across all years combined there were 288 artifacts from freshmen and sophomores who were retained after 2 years. These artifacts had an average consensus score of 2.76 (SD = .88). Across all years combined there were 69 artifacts from freshmen and sophomores who were not retained after 2 years. These artifacts had an average consensus score of 2.52 (SD = .89). Mean differences in writing scores across retained and not-retained artifacts were statistically significant t (355) = 2.021, p = .044, 95% CI [.006, .471], d = .214.
OSU Committee for the Assessment of General Education 2011 Annual Report
49
For freshmen there were 119 artifacts from students who were retained after 2 years, with an average writing consensus score of 2.61 (SD = .84). Across all years combined there were 35 artifacts from freshmen who were not retained after 2 years. These artifacts had an average writing consensus score of 2.60 (SD = .91). Mean differences in average writing scores were not statistically significant between freshmen who were retained and those who were not retained t (152) = .082, p = .935.
For sophomores there were 169 artifacts from students who were retained after 2 years, with an average writing consensus score of 2.86 (SD = .90). Across all years combined there were 30 artifacts from sophomores who were not retained after 2 years. These artifacts had an average writing consensus score of 2.50 (SD = .86). Mean differences in average writing scores were statistically significant between sophomores who were retained and those who were not retained t (197) = 2.055, p = .041, 95% CI [.015, .073], d = .293.
General Education Institutional Portfolios Summary The numbers of samples scored and used in analysis for each institutional portfolio developed in 2001-2011 are shown below. Institutional Portfolios for written communication skills assessment were developed in 2001 (pilot test year), 2002, 2003, 2004, 2005, 2006, 2008, 2009, 2010, and 2011; portfolios for math problem-solving skills were developed in 2002 (pilot test year), 2003, 2005 and 2007; and portfolios for science problem-solving skills were developed in 2003 (pilot test year), 2004, 2005, 2007 and 2009. An Institutional Portfolio for assessment of critical thinking was assessed in 2004 (pilot test year), 2005, 2006, 2007, 2008, 2009, and 2010. An Institutional Portfolio for assessment of students’ achievement of the diversity learning goal was pilot tested in 2006 and assessed in 2007, 2008, 2009, and 2010; 2006 results were not reported because the primary work of the committee was to develop a rubric for the assessment.

OSU Committee for the Assessment of General Education 2011 Annual Report
50
Table 28. Number of Student Artifacts by Portfolio Area and Year: 2001-2011
Year
Portfolio Type
Written Communication
Skills
Math Problem- Solving Skills
Science Problem- Solving Skills
Critical Thinking
Skills
Diversity Learning
Outcomes
Total number of samples - all portfolios
2001 86 - - - - 86
2002 111 76 - - - 187
2003 225 268 68 - - 561
2004 140 - 141 - - 281
2005 142 189 129 141 - 601
2006 109 - - 106 - 215
2007 - - 85 164 69 318
2008 181 - - 152 44 377
2009 146 - 88 155 71 460
2010 147 - - 140 66 353
2011 544 - - - - 544
All Years 1831 533 511 858 250 3983
Table 29. Overall Portfolio Scores by Area: All Years
Score
Artifacts 1 2 3 4 5
Critical Thinking Skills
(2005-2010)
N 23 246 449 136 4
% 2.7% 28.7% 52.3% 15.9% 0.5%
Diversity Learning Outcomes (2007-2010)
N 42 76 83 46 3
% 16.8% 30.4% 33.2% 18.4% 1.2%
Math Problem- Solving Skills
(2002, 2003, 2005)
N 60 155 159 118 41
% 11.3% 29.1% 29.8% 22.1% 7.7%
Science Problem- Solving Skills
(2003, 2004, 2005, 2007, 2009)
N 36 183 194 89 9
% 7.0% 35.8% 38.0% 17.4% 1.8%
Written Communication
Skills (2001-2006, 2008-2011)
N 60 534 785 377 75
% 3.3% 29.2% 42.9% 20.6% 4.1%

OSU Committee for the Assessment of General Education 2011 Annual Report
51
Appendix A: 2011 Committee Membership and the History of General Education 2011 Committee for the Assessment of General Education Committee Membership Jon Comer (Geography), Chair; John Gelder (Chemistry); Ed Walkiewicz (English); Greg Wilber (Civil and Environmental Engineering); Jeremy Penn (ex officio, University Assessment and Testing). Committee History Assessment of OSU’s general education program is required by the Higher Learning Commission of the North Central Association (HLC, OSU’s accrediting body) and by the Oklahoma State Regents for Higher Education. The Assessment Council (now Assessment and Academic Improvement Council) and the Office of University Assessment and Testing formed a faculty General Education Assessment Task Force in May 2000 for the purpose of developing and implementing a new plan to assess the effectiveness of OSU’s general education program. Although general education and “mid-level” assessment methods such as standardized tests and surveys had been conducted intermittently at OSU since 1993, no sustainable approach to evaluating the general education curriculum had been established. The task force formed in 2000 was the first group of OSU faculty members who were paid to work on this university-wide assessment project and marked a renewed commitment to general education assessment at OSU. Following the assessment standard of articulating desired student outcomes first, the Task Force started in 2000 by revising OSU’s Criteria and Goals for General Education Courses document and identifying “assessable” outcomes for the general education program. After studying general education assessment practices at other institutions, the task group developed the following guidelines for effective and sustainable general education assessment for OSU:
the process must not be aimed at individual faculty members or departments, the process should be led by faculty members, and faculty participation should
be voluntary, the process should use student work already produced in courses, and the process should assess all undergraduates, including transfer students,
because general education outcomes describe qualities expected for all OSU graduates.
After summer-long study and discussion, the 2000 task group agreed to initiate two assessment methods to evaluate general education that were consistent with these guidelines: institutional portfolios and a course-content database. Institutional portfolios directly assess student achievement of the expected learning outcomes for the general education program, and the course database evaluates how each general education course contributes to student achievement of those articulated outcomes. These methods were implemented in 2001.

OSU Committee for the Assessment of General Education 2011 Annual Report
52
In 2003, the Assessment Council and General Education Advisory Council approved the task force’s name change to the General Education Assessment Committee. The name was changed again in 2010 to the Committee for the Assessment of General Education (CAGE) to avoid confusion with the General Education Advisory Committee. CAGE is charged with continuing to develop and implement general education assessment and reports to the Assessment and Academic Improvement Council and the General Education Advisory Council; membership in these committees is intentionally overlapped. Committee members are extensively involved in undergraduate teaching at OSU, represent a range of disciplines, and are paid summer stipends for their work on general education assessment. Institutional Portfolios. The Committee has developed institutional portfolios to assess students’ written communication skills (data collection in 2001, 2002, 2003, 2004, 2005, 2006, 2008, 2009, 2010, and 2011), math problem solving skills (data collection in 2002, 2003 and 2005), science problem solving skills (data collection in 2003, 2004, 2005, 2007, and 2009), critical thinking (data collection in 2005, 2006, 2007, 2008, 2009, and 2010), and diversity (data collection in 2007, 2008, 2009, and 2010). Separate portfolios are developed to evaluate each general education learner goal, and each portfolio includes students’ work from course assignments collected across the undergraduate curriculum. Faculty members (including Committee members and additional faculty members involved in undergraduate teaching) work in groups to evaluate the work in each portfolio and assess student achievement relative to the learner goal that is being assessed by using standardized scoring rubrics. The results provide a measure of the extent to which students are achieving OSU’s general education learning goals. The Committee plans to continue to develop institutional portfolios to assess the learner goals for general education as described in the Criteria and Goals for General Education Courses (http://academicaffairs.okstate.edu/current-students/64-general-education-overview). General Education Course Database. The General Education Course Database is a tool for evaluating how each general education course is aligned with the overall expected learning outcomes for the general education program as a whole. Instructors are asked to submit their course information online via a web-based form, and the General Education Advisory Council reviews the submitted information during regular course reviews. The database form requests information about what general education learning goals are associated with the course and how the course provides students with opportunities to achieve those learning goals. Instructors are also asked to describe how student achievement of those goals is assessed within the course. The database provides a useful tool for holistically evaluating general education course offerings and the extent to which the overall general education goals are targeted across the curriculum. College-, Department-, and Program-level Approaches. Many colleges, departments, and programs include elements from the general education goals in their own assessment efforts. For example, a program may assess students’ ability to write a

OSU Committee for the Assessment of General Education 2011 Annual Report
53
research paper relevant to the discipline. This integrates elements from the general education program (e.g., written communication) with elements from the discipline and provides additional information on student achievement of this important goal. Colleges and departments may also incorporate elements of the general education goals into their ongoing assessment processes. In addition to these three primary assessment tools, student surveys such as the National Survey of Student Engagement and OSU Survey of Alumni from Undergraduate Programs contribute to the general education assessment process and are considered in reviewing general education assessment results.

OSU Committee for the Assessment of General Education 2011 Annual Report
54
Appendix B: Rubric for Evaluating Written Communication The General Education Assessment Committee developed the following rubric for evaluating samples of student writing in 2001. In 2006, the rubric was re-organized to reflect the three components that were scored separately in the assessment. As a result of discussion during the scoring and consensus process, the Style and Mechanics component of the rubric was modified in 2008. Consequently, the review committee used the rubric revised in 2008 during its evaluation.

OSU Committee for the Assessment of General Education 2011 Annual Report
55
OSU Written Communication Rubric Learning Outcome: Graduates will be able to communicate effectively in writing.
Level of Achievement
Skill 1
2*
3
4**
5
A
Content
Topic is poorly developed; support is only vague or general; ideas are trite; wording is unclear, simplistic; reflects lack of understanding of topic and audience; minimally accomplishes goals of the assignment.
Topic is evident; some supporting detail; wording is generally clear; reflects understanding of topic and audience; generally accomplishes goals of the assignment.
Topic/thesis is clearly stated and well developed; details/wording is accurate, specific, appropriate for the topic & audience, with no digressions; evidence of effective, clear thinking; completely accomplishes the goals of the assignment.
B
Organization
Most paragraphs are rambling and unfocused; no clear beginning or ending paragraphs; inappropriate or missing sequence markers. No clear over-all organization
Most paragraphs are focused; discernible beginning and ending paragraphs; some appropriate sequence markers. Overall organization can be inferred and is appropriate for the assignment
Paragraphs are clearly focused and organized around a central theme; clear beginnings and ending paragraphs; appropriate, coherent sequences and sequence markers. Overall organization is clearly marked and is appropriate for the assignment
C
Style and mechanics
Inappropriate or inaccurate word choice; repetitive words and sentence types; inappropriate or inconsistent point of view and tone. Frequent non-standard grammar, spelling, punctuation interferes with comprehension and writer's credibility.
Generally appropriate word choice; variety in vocabulary and sentence types; appropriate point of view and tone. Some non-standard grammar, spelling, and punctuation; errors do not generally interfere with comprehension or writer's credibility.
Word choice appropriate for the task; precise, vivid vocabulary; variety of sentence types; consistent and appropriate point of view and tone. Standard grammar, spelling, punctuation; no interference with comprehension or writer's credibility.
D Documentation
Intext and ending documentation are generally inconsistent and incomplete; cited information is not incorporated into the document.
Intext and ending documentation are generally clear, consistent, and complete; cited information is somewhat incorporated into the document.
Intext and ending documentation are clear, consistent, and complete; cited information is incorporated effectively into the document.
* Exhibits most characteristics of ‘1’ and some of ‘3’ ** Exhibits most characteristics of ‘3’ and some of ‘5’ revised 5-14-08