AMERICAN SAMOA WATERSHED PROTECTION … SAMOA WATERSHED PROTECTION PLAN ... that were developed for...
390
AMERICAN SAMOA WATERSHED PROTECTION PLAN Volume 1: Watersheds 1-23 Volume 2: Watersheds 24-35 Volume 3: Watersheds 36-41 Volume 4: Stormwater Management Evaluations Prepared for: American Samoa Environmental Protection Agency and American Samoa Coastal Zone Management Program Pago Pago, American Samoa 96799 (684) 633-2304 Prepared by: Pedersen Planning Consultants P. O. Box 1075 Saratoga, Wyoming 82331 Tel: (307) 327-5434, Fax: (307) 327-5210 E-mail: [email protected] January, 2000
Transcript of AMERICAN SAMOA WATERSHED PROTECTION … SAMOA WATERSHED PROTECTION PLAN ... that were developed for...

AMERICAN SAMOA WATERSHED PROTECTION PLAN
Volume 1: Watersheds 1-23
Volume 2: Watersheds 24-35
Volume 3: Watersheds 36-41
Volume 4: Stormwater Management Evaluations
Prepared for: American Samoa Environmental Protection Agency
and American Samoa Coastal Zone Management Program
Pago Pago, American Samoa 96799 (684) 633-2304
Prepared by: Pedersen Planning Consultants
P. O. Box 1075 Saratoga, Wyoming 82331
Tel: (307) 327-5434, Fax: (307) 327-5210 E-mail: [email protected]
January, 2000

Introduction, I-1
INTRODUCTION PURPOSE The primary purpose of the Watershed Protection Plan is to help focus future resource management efforts of the American Samoa Government. Resource management programs are already being carried out by various agencies of the American Samoa Government and other agencies of the United States Government. The primary agencies of the American Samoa Government (ASG) and federal agencies of the U.S. Government that are involved in resource management programs include the following: American Samoa Government
American Samoa Environmental Protection Agency American Samoa Department of Commerce, Coastal Zone Management Program American Samoa Power Authority American Samoa Department of Marine and Wildlife Resources American Samoa Department of Public Works American Samoa Community College, Land Grant Program American Samoa Department of Agriculture U.S. Government
U.S. Environmental Protection Agency U.S. Department of Agriculture, Natural Resources Conservation Service U.S. Department of Interior, National Park Service U.S. Department of Interior, Geological Survey It is important that future resource management programs in the Territory are closely coordinated to avoid potential overlaps and conflicts in program objectives, and encourage a more cooperative, inter-agency approach to resource management. The Watershed Protection Plan is intended to provide a starting point for future cooperative efforts among these agencies. SCOPE OF THE PLAN A wealth of environmental data has been compiled by the American Samoa Government for, at least, the past 30 years. The Watershed Protection Plan brings together a significant amount of selected resource information for 41 watershed planning areas on the Islands of Tutuila, Aunuu, Ofu, Olosega and Tau. The inventory of historical and recent watershed characteristics and related environmental indicators provide the basis for conclusions regarding various resource management issues in each watershed, as well as recommended strategies for future resource management. Specific responsibilities are assigned to various ASG agencies for the implementation of specific resource management projects, as well as longer-term monitoring of selected resources and land uses. Resource management issues that are addressed in the Plan for each watershed include:
• soil characteristics • soil suitability for agricultural production, as well as soil-based wastewater treatment and disposal • stream locations, drainage characteristics, and rates of stream flow • surface water quality of streams and the nearshore waters • wetlands • coral communities and giant clam production • wildlife habitat for birds and bats • shoreline protection

Introduction, I-2
• groundwater and surface water supplies • resident population and land uses, as well as use of the nearshore waters for fishing and general
water recreation • anticipated land uses to the year 2015 • the impact of future population growth upon water consumption and wastewater generation • flood potential • stormwater runoff, sedimentation, and the relationship to surface water quality • nearshore water quality and the marine environment The level of evaluation associated with each of these issues varies considerably. This variation is dependent upon the availability and reliability of relevant information, as well as the perceived importance of each issue to overall resource management priorities in each watershed. ORGANIZATION OF THE PLAN REPORT The Watershed Protection Plan is a three-volume report. Each volume contains this introductory section, a glossary of Samoan words and agency acronyms, and a portion of the individual watershed evaluations. The watersheds included in each volume are as follows:
Volume 1 (watersheds 1-23): North and southeast coasts of Tutuila from Poloa through Laulii Volume 2 (watersheds 24-35): Southcentral and southwest coasts of Tutuila from Pago Pago Harbor through Amanave, as well as the Island of Aunuu Volume 3 (watersheds 36-41): Islands of Ofu, Olosega, and Tau The names and location of each watershed are illustrated at the beginning of the Watershed Evaluations in each volume. The references associated with publications and personal communications, which were used in the preparation of the Watershed Protection Plan, are provided at the end of Volume 3. PLAN METHODOLOGY Compilation and Review of Available Information Available information was gathered from a variety of sources concerning natural resources, land uses, resident population, and other relevant data. Relevant information was summarized for subsequent incorporation into the Plan. The American Samoa Power Authority, for example, provided recent population, land use, as well as water and wastewater system evaluations that were developed for its draft Utility Master Plan. Soils information was gained from the Soil Survey of American Samoa that was published in 1984 by the U.S. Soil Conservation Service (now the Natural Resources Conservation Service). The ASG Department of Marine and Wildlife Resources and the ASG Department of Agriculture provided results from field surveys concerning wildlife resources and village agricultural activities. Pedersen Planning Consultants was also assisted by AECOS, Inc. in Kaneohe, Hawaii. Aecos, Inc. provided a review of available water quality information. This information generally represented historical information from the U.S Geological Survey, U.S. Environmental Protection Agency, as well as the American Samoa Environmental Protection Agency. Field Survey of Watershed Planning Areas Available information was also supplemented by a field survey of each watershed planning area by Pedersen Planning Consultants (PPC) during April-May, 1996. Informal discussions with one or more residents of each watershed were made in conjunction with the field surveys. Residents that were typically contacted by PPC included village matai, or other knowledgeable long-term residents of

Introduction, I-3
communities in the watershed. In some cases, residents toured PPC representatives in selected watershed areas to identify or clarify specific watershed issues. Photographs and field notes were taken by PPC representatives for each watershed. Significant issues were also documented on available topographic maps of the Territory that are based upon 1989 aerial photography. Geographical Information System for American Samoa A geographical information system (GIS) was developed by Pedersen Planning Consultants to facilitate future reference to selected types of information. This planning tool resource should facilitate future resource planning and management activities. The GIS for American Samoa was developed through the use of ArcView software, version 3.0, which is manufactured and distributed by Environmental Systems Research Institute, Inc. in Redlands, California. In the development of the GIS for American Samoa, some available digital information was provided by the American Samoa Department of Commerce, the American Samoa Power Authority, and the U.S. Geological Survey. A considerable amount of hardcopy information was also scanned via a high-quality scanner that was available at the University of Wyoming in Laramie, Wyoming. Some other information, e.g., point data, was manually digitized by PPC. Digital files were subsequently organized by Pedersen Planning Consultants to develop the actual geographical information system. It is important for users of the Watershed Protection Plan to recognize that the illustrations provided in this report reveal only a portion of information that is readily available through the GIS. Users of the Plan are strongly encouraged to use the GIS for American Samoa when reviewing data, conclusions and recommendations in the Plan. The level of detail available in the GIS and the opportunity to correlate various combinations of information, e.g., soils and anticipated growth, enables GIS users to gain a greater understanding of watershed issues and/or share the information with other personnel. RECOMMENDED STRATEGY FOR PLAN IMPLEMENTATION Establishment of a Territorial Watershed Resource Management Board Many of the federal programs of the U.S. Government that are related to resource management now encourage local resource management in the context of watersheds. This policy is a move away from past programs that focused primarily upon the preservation of endangered species or unique natural resources. It is widely recognized throughout most of the world that the conservation of natural resources is largely dependent upon the balance of ecological relationships within the watershed where natural resources are located. This is particularly true in the tropical environment of American Samoa. The implementation of the various resource management programs that are associated with watershed conservation requires a cooperative partnership between several agencies in American Samoa, as well as several federal U.S. Government agencies. Several federal agencies of the U.S. Government already provide technical assistance and/or grant funds that represent an important contribution to the implementation of various resource management programs in American Samoa. At the same time, several resource management agencies in American Samoa establish and carry out local programs to pursue various resource conservation strategies and, in some cases, related regulatory programs. In order to formalize a more cooperative resource management effort, it is recommended that a Territorial Watershed Resource Management Board be established. This Board would consist of one representative from each of the following agencies of the American Samoa Government:
• American Samoa Environmental Protection Agency • American Samoa Department of Commerce, Coastal Zone Management Program • American Samoa Power Authority

Introduction, I-4
• American Samoa Department of Marine and Wildlife Resources • American Samoa Department of Public Works • American Samoa Community College, Land Grant Program • American Samoa Department of Agriculture • Office of Samoan Affairs Ex-officio members of the Watershed Resource Management Board would also include representatives of the following federal agencies:
• U.S. Department of Agriculture, Natural Resources Conservation Service • U.S. Department of Interior, National Park Service The Watershed Resource Management Board should meet monthly or quarterly, or as frequently as desired. During regular meetings, the Board would discuss work progress and schedules related to the implementation of specific watershed improvement projects and ongoing monitoring tasks that are identified in the Watershed Protection Plan, as well as other cooperative resource management opportunities not reflected in the Plan. It is envisioned that representatives of participating agencies would also share findings from agency surveys, consultant reports, and other evaluations that would help increase the understanding of information gained from ongoing resource management programs of individual agencies. Establishment of a Lead Agency The Watershed Protection Board needs a lead agency that will assume responsibility for the overall management and daily implementation of the inter-agency, resource management program. Since many of the resource management issues relate to water quality, it is logical that the program should initially be managed by ASEPA. The designation of ASEPA as the lead agency for watershed protection would not supercede the authorities already given to various ASG agencies. Rather, it would act as the catalyst for cooperative, watershed improvement programs that are made on an inter-agency basis. In addition, ASEPA would also help ensure that the progress and information gained from both independent and cooperative resource management programs are shared by all participating agencies which are represented on the Watershed Protection Board. The lead agency will be responsible for assigning a full-time program manager who will be assigned to coordinate the implementation of the Watershed Protection Plan and the activities of the Territorial Watershed Resource Management Board. The program manager will need to be a strong individual who is willing to listen and constructively respond to the concerns of participating ASG and federal agencies and traditional village leaders, as well as take constructive, aggressive steps to support their decisions. It is also important that the selected program manager is highly motivated and committed to making the program a successful effort. Knowledge of the Samoan language and culture, as well as the environment of American Samoa, is essential. The use of a designated consultant firm should also be considered to provide occasional technical assistance to the lead agency, program manager, and the overall Watershed Resource Management Board. The selected firm would provide technical assistance related to specific watershed improvement projects, and possibly help make periodic evaluations of program success. Any firm selected for this work should have considerable experience associated with the environment of American Samoa, as well as some knowledge of faaSamoa. The firm should also be willing to supplement its resources with the capabilities of other consultants, if necessary.
Introduction, I-5
Participation of Traditional Leaders and Residents in Resource Management Solutions The implementation of the Watershed Protection Plan can only be accomplished via a cooperative inter-agency effort that is linked to traditional village leaders and residents. Despite significant changes in land tenure, a significant proportion of lands in the Territory remain as “communally-owned” lands. Many village councils also remain active in the management of village affairs, lifestyle, and village improvement projects. Traditional leaders and village residents in American Samoa are keenly aware of many resource management issues, as well as the specific environmental conditions in their respective watersheds. Desired modifications in the way people live and use natural resources typically require community motivation. More motivation for desirable changes can be expected when people affected can become involved in resource management decisions and gain some greater understanding and appreciation for the purpose and benefits of recommended changes in lifestyle, land use, and the use of other natural resources. It is their commitment that is essential to long-term change. Despite many ongoing cultural changes, the village remains the heart of faaSamoa.. It is this social unit that binds the families who live in Territory. It is interesting to note that some of the more recent immigrants to American Samoa, e.g., Tongans, are already building small communities within villages such as Nuuuli and Tafuna in order to organize themselves into their own “village units” away from their native islands. Through the establishment of a constructive working relationship, the American Samoa Government is confirming to its traditional leaders that their wisdom and experience has relevance to addressing long-term management issues. Further, ASEPA and participating resource management agencies on the Watershed Resource Management Board will be sending the message that they stand ready to assist the villages rather than only telling them what to do, or not to do. Through the sharing of information between villages and participating agencies, this process will help participating agencies better determine program and project priorities. Village leaders, in turn, will gradually begin to recognize that increased village participation and commitment to resource management will yield benefits that will help improve village sanitation, the quality of drinking water, flood control, surface water quality and coral communities, fishing opportunities, recreation, and general lifestyle. Village leaders will be requested by the core management group to identify one representative that can be the primary point-of-contact for a given village. It is important that this person is respected and trusted by the village council. Ideally, the point-of-contact will also be a member of the village council.


Poloa, Page 1-1
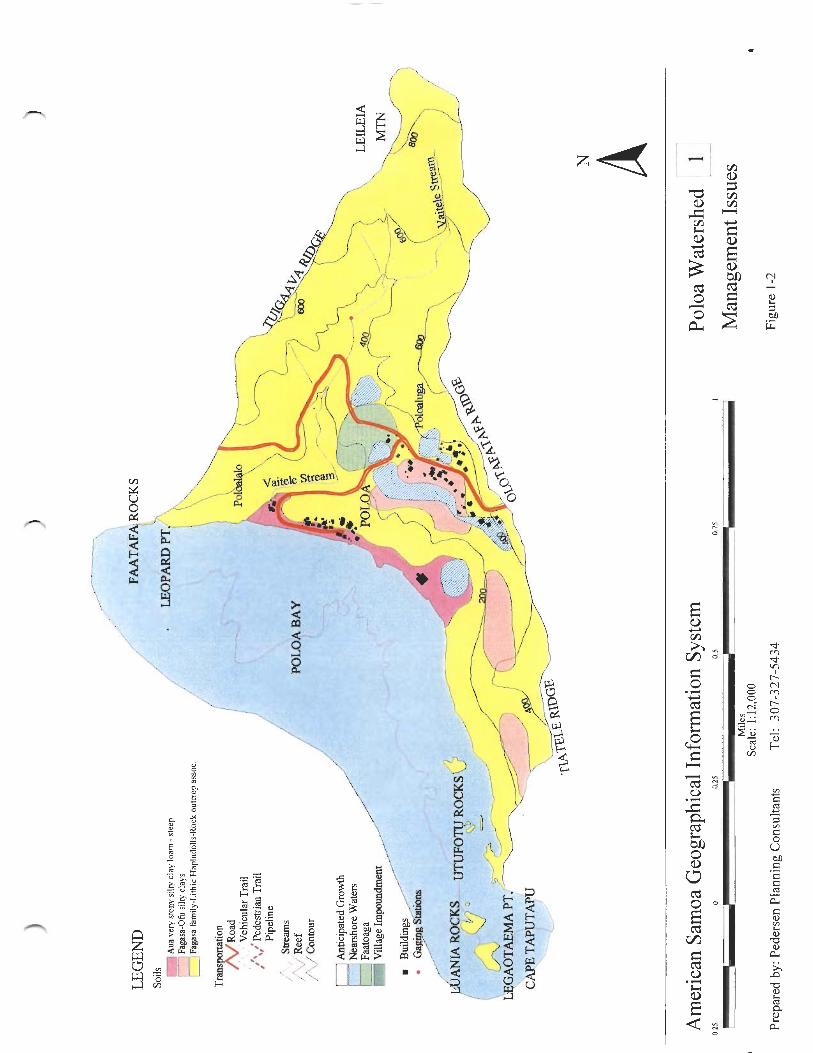
POLOA Watershed 01 GEOGRAPHY The Poloa watershed is situated along the western tip of the Island of Tutuila. The watershed, which contains approximately 0.42 square miles of land, begins on the west slope of Leileia Mountain (Figure 1-1). The upper slopes of this watershed are bounded by the mountain ridges known as Olotafatafa, Tiatele and Tuigaava Ridge. Along the shoreline, the watershed extends approximately one mile between Leopard Point and Cape Taputapu which form the natural boundaries of Poloa Bay. RESOURCES OF THE WATERSHED Soils The U.S. Soil Conservation Service (National Resource Conservation Service) published a Soil Survey of American Samoa in 1984. Selected information derived from this survey provides some useful information for future watershed planning and management (Figure 1-2). Three different soil classifications were identified by the U.S. Soil Conservation Service for lands within the Poloa watershed (Table 1-1). TABLE 1-1 SELECTED SOIL CHARACTERISTICS POLOA WATERSHED
Soil Depth To: Land Use Suitability SCS Soil Unit
Name Typical Slope
(Percent)
Flood Runoff Erosion High Water (Feet)
Bed Rock
(Inches)
Soil Based WW
Treatment
Subsistence Ag
Potential
2 Aua very stony silty clay loam
30-60 None Rapid Severe <6 <60 Severe Slope Poor
3 Fagasa-Ofu silty clays
30-60 None Medium to Rapid
Moderate to Severe
>6 20-40 Severe Slope Depth
Moderate
4 Fagasa family-Lithic Hapludolls-Rock outcrop assoc.
70-130 None Very Rapid
Very Severe
>6 20-60 Severe Slope Depth
Limited
Source: U.S. Soil Conservation Service, 1984 Aua Very Stony Silty Clay Loam (30 to 60 percent slopes) The soil that characterizes Poloa’s shoreline village area are identified by the U.S. Soil Conservation Service as Aua very stony silty clay loam on 30 to 60 percent slopes (SCS mapping unit 2). The Aua soils range between seven to 60 inches in depth. The permeability of these soils (between 2 and 6 inches per hour) is moderately rapid. For watershed management purposes, it is important to note that these Aua soils have a high potential for runoff and erosion. This Aua soil is not recommended for agricultural production because of the stoniness of the soil, the high erosion potential, and hazards associated with subsistence crop cultivation on steeper slopes. However, when cultivation in these soils is necessary, the use of a mulch or ground cover is recommended to reduce soil erosion in cultivated areas.


Poloa, Page 1-4
During an April, 1996 survey of this watershed, Pedersen Planning Consultants observed Poloa’s traditional use of coral rubble from the nearby shoreline to cover exposed soils around most of the homes in the shoreline village area. This is an excellent approach to reducing surface runoff from these soils since it encourages the percolation of urban runoff while stabilizing soils that have a high erosion potential. The U.S. Soil Conservation Service estimates that this soil can annually sustain up to 5 tons per acre of erosion without impacting crop productivity (U.S. Soil Conservation Service, 1984). While the erosive characteristics of this soil generally may not significantly impact subsistence crop productivity, the erosive quality of the soil can be a significant contributor to sedimentation in downslope streams and the nearshore waters. The general characteristics of these Aua soils are also undesirable for individual wastewater disposal systems (U.S. Soil Conservation Service, 1984) The soils contain a significant amount of larger stones that hamper installation and adequate soil treatment. Should additional residential development occur in Poloa’s shoreline residential area, the use of individual wastewater disposal systems should be accompanied with a mound-type treatment system, or other methods, that can provide more effective treatment of wastewater effluent. Fagasa-Ofu Silty Clays Between Cape Taputapu and the shoreline village area, there are three areas between the 200 and 400-foot elevation, that contain Fagasa-Ofu Silty Clays (SCS mapping unit 3). The soil ranges between 20 to 40-inches in depth. The permeability of this silty clay loam is moderately rapid (2 to 6 inches per hour). The potential for surface runoff from these soils is considered moderate to rapid. However, the potential for erosion is moderate to severe. The U.S. Soil Conservation Service indicates that this soil type is somewhat suitable for the production of subsistence crops. The soil can annually sustain from one to 5 tons per acre of erosion without impacting crop productivity. However, the Soil Conservation Service recommends the use of mulch, crop residues, and cross-slope farming to reduce the potential for soil erosion. Fagasa Family-Lithic Hapludolls-Rock Outcrop Association Adjoining land areas throughout most of the remaining watershed contain deep, well-drained soils on steep mountain ridges and slopes. The U.S. Soil Conservation Service identifies these soils as part of the Fagasa family-Lithic Hapludolls-Rock outcrop association (SCS mapping unit 4). This soil type is common and characterizes most of the steep, upland slopes along Tutuila’s north and west coast. The Fagasa Family soils contain a surface layer of dark, brown silty clay that is about 12 inches thick. A dark brown subsoil is approximately five inches thick. The substratum, which is characterized by a dark-brown, sandy clay loam, extends to a depth of 31 inches. The depth to bedrock ranges between 20 to 60 inches or more. The Lithic Hapludolls soils are shallow, well-drained soils that are derived from igneous rock. The surface layer is highly variable, but U.S. Soil Conservation Service soil scientists have observed the surface layer to contain about five inches of dark brown, cobbly silty clay. The subsurface layer, which is about four inches thick, is a dark brown, very cobbly, silty clay. The substratum represents a clay loam, approximately six inches thick, over weathered bedrock. The soil permeability of the Fagasa Family and Lithic Hapludolls soils are both between two and six inches per hour. Since the Fagasa Family-Lithic Hapludolls soils typically occur on very steep slopes,

Poloa, Page 1-5
potential runoff can be very rapid. The potential for water erosion is very severe (U.S. Soil Conservation Service, 1984). The cultivation of subsistence crops on these soils is not considered desirable. However, when cultivation in these soils is necessary, care should be exercised to minimize the amount of exposed soil in cultivated areas. When heavier rainfall events occur in this watershed, a significant contribution of soil erosion can be expected from undeveloped upslope areas of the watershed that contain this soil type. Natural runoff from steeper slopes in the watershed carries water, sediments, and organic debris to downslope drainage courses and Vaitele Stream. Such erosion can readily influence downstream water quality. These soils are also located in Poloa’s growing upland residential area that is known as Poloaluga. Increased residential development can encourage greater erosion and surface runoff. However, such impacts can be reduced by the use of coral rubble around the perimeter of homes, as well as a wide variety of ground covers, shrubs, and trees. Both ASCC Land Grant Program and the U.S. Natural Resource Conservation Service can provide specific recommendations to homeowners in this area. Streams Stream Locations The watershed is drained by one stream, Vaitele Stream. This stream originates at about the 640-foot elevation and drains the western slope of Leileia Mountain. Runoff from this drainage generally flows in a north-northwesterly direction between Olotafatafa Ridge and Tuigaava Ridge. Subsequently, the stream passes north of Poloa’s shoreline village area before it discharges into the northeast section of Poloa Bay. Stream Flows Within the Watershed The U.S. Geological Survey has estimated that the median rate of flow on this stream is about 0.14 cubic feet per second (cfs) (Wong, 1996). This estimate is based upon 14 intermittent measurements of stream flows between 1959 and 1976. Stream flow records were made at a gauging station (No. 16926000) that was located approximately 0.6 mile upstream of the Vaitele Stream mouth. Aquatic Fishes and Invertebrates Field surveys of fishes and invertebrates were made by the U.S. Fish and Wildlife Service, Division of Ecological Services, in March-April, 1978 and the U.S. Army Corps of Engineers in August, 1980. Vaitele Stream in Poloa was one of 37 streams in American Samoa that were inventoried by representatives of these federal agencies. Results from both field surveys were summarized in an American Samoa Stream Inventory that was published by the U.S. Army Corps of Engineers, Honolulu District, in July, 1981. Three points along Vaitele Stream were surveyed. These sampling stations included the stream mouth (station 30a), 500 feet upstream of the stream mouth (station 30b), and the culvert underneath the primary shoreline roadway (station 30c) at about the 280-foot elevation. Abundant populations of gobie fishes were observed at all three stations. Mountain bass were found at stations 30a and 30b. Eels were documented at stations 30b and 30c. Several species of shrimp were most evident at station 30b Surface Water Quality Streams

Poloa, Page 1-6
Data from a single water sample collected in Vaitele Stream in 1985 reveal that the total nitrogen concentration was high, primarily due to the high nitrate+nitrite concentration. Total phosphorus was also elevated (Table 1-2). Unfortunately, a one-time sampling provides little usefulness in terms of general watershed planning. The purpose of the 1985 sampling is unknown. TABLE 1-2 AVAILABLE WATER QUALITY DATA VAITELE STREAM MAY, 1985
Water Quality Parameter TN TKN NO3+NO2 TP Turbidity TSS pH Total Coliform
Date (µg/l) (µg/l) (µg/l) (µg/l) (ntu) (mg/l) (#/100 ml) 05/02/85
330
74
260
129
--
--
--
--
Source: ASEPA, 1995 Nearshore Waters ASEPA collected marine water samples from 17 embayments around the Island of Tutuila on July 25 and August 2, 1992 (Table 1-3). The samples were obtained from the outer portions of the embayments where more water exchange occurs at depths of three and 60 feet. Collected samples were subsequently analyzed for nutrients and chlorophyll a. Nutrient data gained from these samplings indicate that the outer waters of Poloa Bay met American Samoa water quality standards in late July and early August of 1992. Laboratory results also suggest that stormwater runoff from undeveloped lands upland of Poloa Bay may not generate any significant discharge of nutrients. TABLE 1-3 SURFACE WATER QUALITY OUTER WATERS OF PALA LAGOON JULY-AUGUST, 1992
Sample Depth Nitrate/ Nitrite mg N/l
Total N
mg N/1
Kjeldahl N
mg N/l
Total P
mg P/l
CHL a
mg/m3
3 feet <0.0001 0.122 0.120 0.007 0.06 60 feet <0.001 0.145 0.145 0.015 0.06
Source: ASEPA, 1992

Poloa, Page 1-7
Wetlands No wetlands are believed to be located in the Poloa watershed. Marine Resources Coral Communities Historical surveys of coral communities in the nearshore waters of Tutuila do not suggest that the coral communities in the Poloa watershed are significant in terms of coral abundance, diversity or live coral cover. However, the coral communities at Poloa are a significant ecological component of Poloa Bay. Corals provide shelter to fish, invertebrates, and other marine organisms. In addition, shoreline fish represent a source of supplemental food to residents. 1978
The reef slope between Tiaoalii Rock and Luania Rocks was surveyed in January, 1978 by the ASG Office of Marine Resources. A few crown-of-thorns starfish were observed on this reef slope, but no damage to the corals was evident (Aecos and Aquatic Farms, 1980). By August of 1979, a subsequent survey by Aecos and Aquatic Farms noted that “....about 60 percent of the coral heads on the upper reef front were still alive and a few starfish were present.”
A fringing reef community extends approximately 400 feet seaward of the Poloa Village shoreline (Aecos and Aquatic Farms, 1980). During the August-September, 1979 period, Aecos and Aquatic Farms observed a sparse coral coverage on the inner reef flat that fronts Poloa Village. About 50 feet seaward, the middle reef exhibited abundant coral coverage with coral coverage approaching 70 percent. The coral coverage of the outer reef platform that was observed to be about 25 percent. At least 56 species fish were counted in the coral community and rocky bottom that characterized the entire reef flat. 1992
In 1992, Maragos, Hunter, and Meier observed between 5 to 10 percent coverage in shallow nearshore waters (about 6 meters in depth) and between one and five percent coverage at about 18 meters in depth (Maragos, Hunter, and Meier, 1994).
Wildlife Resources Forest Birds A 1986 Survey of the Forest Birds of American Samoa recorded the number of birds observed on the islands of Tutuila, Ofu, Olosega, and Tau, during 8-minute counts in July, 1986 (Table 1-4).
Shoreline Protection The fringing reef that fronts the shoreline village area of Poloa provides some physical protection from occasional storm waves. The coral reef reduces the amount of wave energy that enters Poloa Bay embayment. In addition, basaltic boulders characterize the shoreline north and west of the lower Poloa Village area. While the fringing reef affords some protection, Poloa Bay has been characterized by higher storm waves during infrequent hurricane events. In addition, the shoreline of Poloa Bay has experienced considerable erosion. During an April 1996 survey, such erosion was particularly evident on the north end of the shoreline village area where erosion is close to eroding the adjacent paved roadway. The American Samoa

Poloa, Page 1-8
Government has installed a wire-woven gabion along the north end of the shoreline village area to reduce coastal erosion and stabilize the existing shoreline. Taputapu Elementary School is situated at the southern end of the Poloa village shoreline. The school is protected by a basaltic rock revetment that extends approximately 480 feet along the shoreline. In March, 1994, Sea Engineering, Inc. and Belt Collins Hawaii published a shoreline inventory report that outlined, in part, ongoing shoreline erosion conditions and related shore protection needs for American Samoa. Sea Engineering, Inc. and Belt Collins Hawaii noted no shoreline conditions in the Poloa watershed that were determined to be “critical”, or “potentially critical”. TABLE 1-4 FOREST BIRD SURVEY RESULTS NATIVE FOREST AND NON-FOREST BIRDS JULY, 1986
Species Tutuila Ofu Olosega Tau Total Tahiti Petrel 0 - - 1 1White-tailed Tropicbird 154 11 27 234 426Red-footed Booby 22 - - - 22Great Frigatebird 1 - - - 1Reef Heron 1 0 0 0 1Red Junglefowl 527 17 0 26 570Banded Rail 163 22 16 75 276Spotless Crake - - - 1 1Purple Swamphen 10 4 0 15 29Blue-gray Noddy 1 0 0 0 1Brown Noddy 65 1 0 359 425Black Noddy 0 11 0 5 16White Tern 331 88 17 60 496Many-colored Fruit Dove 10 0 0 2 12Purple-capped Fruit Dove 3,107 104 33 1,176 4,420Pacific Pigeon 207 15 8 282 512Blue-crowned Lory - 65 79 533 677Common Barn Owl 2 0 0 0 2White-rumped Swiftlet 441 348 13 284 1,086Collared Kingfisher 136 43 14 95 288Red-vented Bulbul 95 - - - 95Fiji Shrikebill - 1 9 93 103Wattled Honeyeater 3,748 875 457 2,779 7,859Cardinal Honeyeater 621 - - - 621Polynesian Starling 296 41 3 146 486Samoan Starling 1,647 253 91 929 2,920Total Birds Recorded 11,585 1,899 767 7,095 21,346Notes: A dash (-) indicates the species is not resident on the island surveyed.
Source: Engbring and Ramsey, 1989 Groundwater and Surface Water Supplies Groundwater Supply and Quality
There are no groundwater supplies that are used or developed in the Poloa watershed.

Poloa, Page 1-9
Surface Water Supply and Quality
The shoreline and upper village area of Poloa rely upon surface water sources for potable drinking water. One fresh-water spring, a stream catchment system, as well as individual roof catchment systems, represent the surface water sources that supply Poloa’s potable water needs.
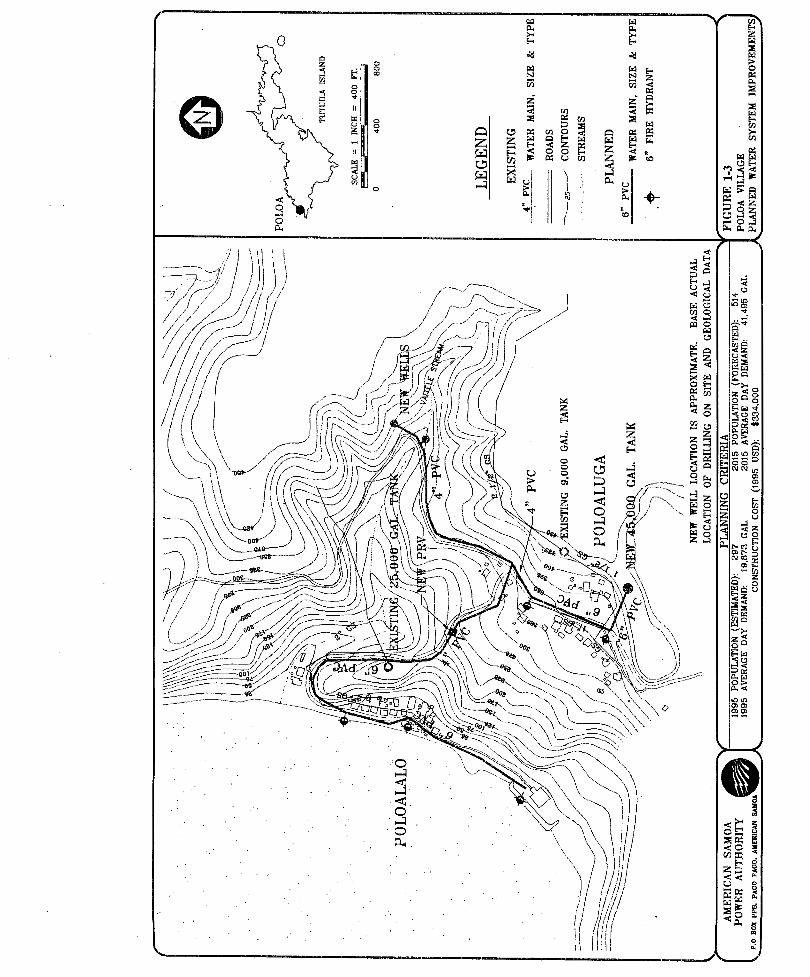
The shoreline village area is served by a spring that is located along Tuigaava Ridge at about the 350-foot elevation. Water is transported downslope via a 2-inch galvanized steel line, to a 25,000 gallon storage tank. A stream catchment along Vaitele Stream is situated about 490 feet above mean sea level. This system supports the upper village area. A series of 2.5, 1.5, and 1.0-inch galvanized steel line transports water to the Poloaluga area. The water quality of the village water system is monitored by ASEPA on a monthly basis. Such monitoring is believed to be limited to the stream catchment along Vaitele Stream. Available laboratory results for the 1993-1995 period indicate that this surface supply contains some bacterial contamination. For example, monthly monitoring records for FY 1995 indicate average fecal coliform levels of greater than 60 colonies per 100 milliliters and greater than 80 colonies of total coliform. Similar values were measured in FY 1994; however, somewhat less contamination was detected between December, 1993 and March, 1994. One of, at least, five piggeries in Poloaluga may be causing some contamination of Vaitele Stream. However, such contamination was not observed during the April, 1996 survey. “Turbidity levels are typically less than 5 NTU; however, it is believed to be very high during and following periods of heavier rainfall” (American Samoa Power Authority, 1996). The maximum monthly measurement during FY 1994 and FY 1995 was 4.0 NTU recorded in May, 1995. The surface water quality of this watershed is not unique and is generally comparable to the quality of similar untreated surface water supplies in the neighboring watershed of Fagalii. Nevertheless, bacterial contamination of both Vaitele Stream and the spring water source should continue to be an ongoing consideration because of the dependency of Poloa Village upon these surface water sources for potable uses. Proposed Water System Improvements The potential for increased residential development in the upper village area, as well as the presence of piggery operations, suggest that continued contamination of the surface water supply can be expected. In recognition of these concerns, the American Samoa Power Authority has proposed long-term water improvements for the village water system (Figure 1-3). These plans recommend the construction and installation of the following:
• two new groundwater wells that would have a minimum total production requirement of 32 gallons per minute;
• disinfection at each groundwater well; • one 45,000 gallon water storage tank in the Poloaluga area at about the 400-foot elevation; • 2,300-feet of 4-inch PVC transmission main from the new wells to a 6-inch distribution system,
and from distribution to the lower storage tank;

Poloa, Page 1-11
• a fire protection/distribution system; • a pressure reducing valve on the road that enters Poloalalo at about 200 feet above mean sea level;
and, • service laterals and meters.
The implementation of such plans by the American Samoa Power Authority would, in part, be dependent upon the incorporation of the village system into the ASPA’s overall public water system. In the absence of these improvements, it is recommended that village residents be encouraged to make a greater use of individual roof catchment systems for the collection of raw rain water for drinking, bathing, and laundry purposes. The existing surface supplies could be used for the disposal of wastewater from indoor toilets and general household maintenance. USE OF THE WATERSHED Resident Population Between 1980 and 1990, the population of Poloa grew almost 40 percent, or at annual rate of about 4 percent. Increased residential construction between 1990 and 1995 rose population to an estimated 297 residents in 1995 (American Samoa Power Authority, 1996). Land Use Residential The 1990 U.S. Census documented 21 homes in Poloa. Ninety percent of the homes were owner-occupied; none were rental units. The remaining ten percent were vacant or used as vacation homes by absentee owners. The housing stock expanded considerably during the 1990-1995 period. ASG Building Division records indicate that 12 new residential building permits were issued during this period. Consequently, the 1995 housing stock in Poloa includes 33 houses. The inhabited village area includes two residential concentrations. The original village lies between the shoreline and the 100-foot elevation. A second residential area is situated north of Olotafatafa Ridge on both sides of Tutuila’s primary roadway between the 325-400 foot elevation. Agriculture
Piggeries
During the April, 1996 survey, one resident indicated that there about five piggeries located in the Poloaluga area (Taumua, 1996). However, the largest piggery was observed at the faifeau’s home that is situated at the northern end of the shoreline village area. The piggery at the faifeau’s home is situated immediately adjacent to Vaitele Stream and the piggery operation does discharge some wastewater into the Stream.
A somewhat earlier inventory by the ASG Department of Agriculture in early 1996 is believed to be more representative of the number of piggeries and related pig population. This inventory documented three piggeries that housed a total of 68 pigs.

Poloa, Page 1-12
Subsistence Crop Production
A field survey of the watershed in April, 1996 indicates that agricultural activity in the Poloa watershed generally included the production of traditional subsistence crops. While no detailed inventory was made of agricultural production, the type of production generally observed included bananas and breadfruit.
Significant production areas were generally mapped and later incorporated into a new geographical information system for American Samoa. In general, banana and breadfruit production was located in two primary areas:
• north side of the paved roadway to the lower shoreline village area; and, • upland of the primary shoreline roadway in the Poloaluga area.
Commercial ASG business license records indicate that there are no commercial enterprises based in Poloa. No building permits were issued for any new commercial facilities during the 1990-1995 period. No commercial facilities were observed during a November, 1994 village inspection. It is suspected that local residents make consumer purchases in nearby Amanave where village stores are located. Grocery shopping and other retail shopping probably is made in Leone, Pavaivai, Nuuuli, or Fagatogo. Industrial No light industrial operations are based in Poloa. Public Facilities The ASG Department of Education offers an early childhood education program in Poloa. This program provided educational opportunities for 29 younger children in September, 1994. Elementary school-aged children attend school in the village at Taputapu Elementary School. High school students, however, are bussed to Leone High School in Leone. Use of the Nearshore Waters Nearshore Fishing The University of Hawaii Sea Grant Program conducted an American Samoa Subsistence Fishing Survey in the summer of 1992. This survey involved onsite interviews with shoreline users who were participating in fishing activities on selected days during that period. The results of the survey revealed, in part, that there is some use of the nearshore waters that adjoin the Poloa watershed. Some 18 to 20 persons were documented fishing on the reef in Poloa. Fishing methods included the use of rods and reels, diving, gleaning, and hand-and-line from a paopao (canoe). More recently, during an April 1996 survey of the watershed, one resident was observed fishing along the shoreline. One resident indicated that about 10 persons use the nearshore waters for fishing on a typical weekday. On weekends, not more than five persons are fishing in the nearshore waters (Taumua, 1996). RESOURCE MANAGEMENT ISSUES
Poloa, Page 1-13
Future Land Uses to the Year 2015 Residential Significant residential expansion is expected to gradually occur in Poloa during the next 20 years. However, growth will be considerably less than the annual rate of residential growth (about 11 percent per year) that occurred between 1990 and 1995. Future residential expansion will primarily occur on the north side of Olotafatafa Ridge where approximately 26 feasible housesites are located. Secondarily, six developable homesites are also located southeast and upslope of Taputapu Elementary School between the 50 and 125-foot elevation. Within the existing shoreline residential area, it is believed that two additional homes will be constructed. Despite the potential availability of developable residential lands, future residential construction in Poloa is somewhat constrained by the presence of steeper slopes throughout most of the village Census area. However, the attractive setting of this community will continue to attract greater in-migration from the continental United States, Hawaii, and other international areas until the supply of developable land is depleted. During the next 20 years, ASPA believes that these potential development opportunities and constraints will generate the following sequence and volume of residential construction.
1996-2000 Two new single-family homes on the south side of the existing shoreline residential area (below 25-foot elevation).
Eight new single-family homes will be built on the north side of Olotafatafa Ridge between the 250 and 350-foot elevation.
2001-2005 Six new single-family homes will be built on the north side of Olotafatafa Ridge between the 250 and 350-foot elevation.
2006-2010 Six new single-family homes will be built on the north side of Olotafatafa Ridge between the 250 and 350-foot elevation.
2011-2015 Six new single-family homes will be built on the north side of Olotafatafa Ridge between the 250 and 350-foot elevation.
Six new single-family homes upslope and southeast of Taputapu Elementary School between the 50 and 125-foot elevation.
The cumulative effect of this prospective residential growth is that the village housing stock will increase to roughly 67 housing units in the year 2015. During the same period, it is believed that the average household size will have gradually decreased to approximately 7.68 persons per household. Consequently, the anticipated future village population will include about 514 persons. Commercial Future commercial facility expansion in Poloa is not anticipated even though one potential commercial site is available. Other consumer shopping will continue to occur outside of the village where greater commercial facilities and services are available. At the same time, the anticipated increase in resident population will encourage the establishment of home-based occupations. These enterprises will likely include the establishment of one technical service operations during the 1996-2000 period. The start-up of a home-based company that sells and distributes various commercial products on a wholesale and retail basis is anticipated between the year 2001 and 2005. Each home-based enterprise will employ two persons.

Poloa, Page 1-14
Industrial The gradual increase in resident population is expected to attract one small, home-based enterprise of an industrial nature, e.g., auto repair business. However, the construction of new industrial facilities is not anticipated. Public Facilities Population characteristics for Poloa in 1990 suggest that approximately six percent of the village population is three and four years of age. Elementary school-aged children (5 and 13 years old) include about 21 percent of the village population; high school students represented about 11 percent of the population. The application of 1990 population characteristics to the anticipated 2015 village population suggest increased student enrollments in future early childhood, elementary education, and high school programs within and outside of Poloa. Anticipated student enrollments from the village population are expected to be as follows in the year 2015: • early childhood education 31 students • elementary school 108 students • high school 57 students Impact of Future Population Growth Upon Water Consumption and Waste Generation Residential and population growth in the Poloa watershed will increase the volume of future wastewater and solid wastes that are generated by local residents. Wastewater generation, for example, is expected to rise from about 13,911 gallons per day (gpd) to 29,047 gpd (American Samoa Power Authority, 1996). The consumption of potable water will also increase with a growing population. The American Samoa Power Authority (ASPA) estimates that the average day demand for water in Poloa was about 19,673 gallons in 1995. By the year 2015, ASPA anticipates that the average demand will increase to roughly 41,495 gpd. Flood Potential A flood insurance study of American Samoa and related flood insurance rate maps were published by the U.S. Federal Emergency Management Agency (FEMA) in 1991. The study evaluated selected geographical locations throughout the Territory. Hydrologic and hydraulic analyses that were presented in the study were made by the U.S. Army Corps of Engineers, Pacific Ocean Division. However, no specific analysis was made of Vaitele Stream in the Poloa watershed. Inland Flood Potential The flood insurance rate map for the west coast of Tutuila indicates the entire Poloa watershed has been designated by FEMA as “zone x”. This designation indicates that the area is outside of the 100-year floodplain (Federal Emergency Management Agency, 1991). In essence, FEMA is suggesting that the flood hazard potential in this watershed is limited. Coastal Flood Hazard

Poloa, Page 1-15
Along the shoreline, however, FEMA has indicated that it has determined a base flood elevation of 3.0 feet above mean sea level. Some of the anticipated residential development is expected immediately upslope of Taputapu Elementary School. However, the elevation of this area would suggest that such development would have little flood potential via storm waves. The Utufotu Rocks are outside of the 500-year floodplain and, consequently, have limited flood potential. Since no development is expected to occur at this location, this designation has little significance. Stormwater Runoff/Sedimentation and the Relationship to Surface Water Quality Heavier rainfall periods, steeper inland slopes, and more erosive soils in the Poloa watershed regularly contribute to periodic erosion and the related transport of sediments into Vaitele Stream. Ultimately, this natural erosion process carries a portion of these sediments into the nearshore waters that adjoin the watershed, especially during medium to higher flow stream conditions. Natural erosion from the undeveloped, upslope areas of the watershed is believed to be the primary cause of sedimentation in local streams, as well as downstream sedimentation of the nearshore waters. All drainage areas of the watershed are impacted by natural erosion and downstream sedimentation. Secondarily, the construction of ASG’s primary shoreline roadway between the 300 and 400-foot elevation clearly altered the prior natural slope of the watershed. When saturated, upslope soils above the primary roadway will often subside because natural erosion processes typically transport soil material in a manner that attempts to restore the original topographic slope. As a result, existing roadway cuts, which were required to build the road, generate frequent landslides following heavier rainfall periods. Some erosion may also be occurring from some faatoaga areas that are upslope of the inhabited Poloaluga area. During heavier rainfall periods, some erosion probably occurs and causes some sedimentation of Vaitele Stream. Urban runoff also occurs in the lower village area. However, the impact of this runoff is mitigated considerably by the use of coral rubble around the perimeter of residences along the shoreline. A future watershed management concern is the anticipated growth of the upper village area where future residential growth is expected to occur along the north side Olotafatafa Ridge between the 250 and 350-foot elevation. This area primarily contains Fagasa-Ofu silty clay soils that have a moderate to severe potential for both surface runoff and erosion. Without careful siting and clearing of residential house sites, increased erosion can be expected to occur. The potential downstream discharge of silt-laden surface runoff could ultimately increase the volume of sedimentation into the nearshore waters near Taputapu Elementary School. Nearshore Water Quality and the Marine Environment The nearshore waters that adjoin the watershed are impacted by natural sedimentation, urban runoff, a limited discharge of piggery wastes, as well as wave action and nearshore currents in Poloa Bay. It is believed that natural sedimentation, as well as wave action and nearshore currents are the primary influences upon nearshore water quality. However, with future residential growth, the impact of increased sedimentation from urban runoff is anticipated. Increased upslope erosion and runoff from Olotafatafa Ridge could easily generate one or more point sources of turbid water into the nearshore waters. Consequently, increased sedimentation of Poloa Bay should remain an important resource management consideration.

Poloa, Page 1-16
Coral communities are significantly dependent upon the availability of light and related photosynthesis, and occasional periods of significant turbidity and sedimentation do not promote long-term coral nutrition, growth, reproduction, and depth distribution (Richmond, 1993). When corals fertilize, they are free-swimming. Consequently, they need a good location to settle and make a good attachment. With significant soil deposition, sediments can physically interfere with the recruitment of coral larvae (Richmond, 1993; Dashbach, 1996). Coral communities are an important component of the overall ecology of the nearshore waters that adjoin the Poloa watershed. They provide shelter to fish, invertebrates, and other marine organisms. Some of these resources represent a supplemental food source for residents of Poloa. Groundwater and Surface Supplies The development of proposed groundwater supplies and related water system improvements (Figure 1-3), which are outlined in ASPA’s Utility Master Plan, should be implemented as soon as possible. In the interim, it is recommended that village residents make a greater use of individual roof catchment systems for the collection of raw rain water for drinking, bathing, and laundry purposes. The existing surface supplies should be used only for the disposal of wastewater from indoor toilets, general household maintenance, and other non-potable uses. MANAGEMENT NEEDS AND RECOMMENDATIONS The primary focus of future resource management in the Poloa watershed should be to: • reduce the amount of natural erosion, sedimentation, and urban runoff within the watershed; and, • provide technical assistance to selected village residents and the village council. Such assistance
will require a coordinated inter-agency effort of, at least, ASEPA, ASPA, ASDOC, ASDOA, ASCC Land Grant Program, and the ASG Department of Marine and Wildlife Resources.
Representatives of participating public agencies should make periodic visits to the watershed to observe, document, and monitor selected resource conditions, determine potential methods of correcting a potential hazard or undesirable conditions, share potential solutions with a designated resident of Poloa, and encourage the village’s implementation of resource management solutions. The scope of issues that should be addressed by each agency in the field is summarized in Table 1-5. The general focus of recommended technical assistance is also identified. The experience and insights of agency representatives would determine the specific methodology to be used in the field.

Poloa, Page 1-17
TABLE 1-5 RECOMMENDED FOCUS OF FUTURE TECHNICAL ASSISTANCE POLOA WATERSHED
Participating Public Agency
Resource Management Issue
Focus of Technical Assistance
ASEPA Facilitate a coordinated resource management effort within the watershed.
1. Coordinate overall watershed management activities. 2. Hold periodic meetings with participating ASG and federal agencies to discuss, prioritize, and schedule resource management activities. 3. Coordinate program efforts with local traditional leaders and/or designated resident of the watershed. 4. Make annual assessment of resource management program.
ASPA Develop new groundwater supply in Poloa and establish an ASPA satellite water system.
1. Meet with traditional village leaders to consider the development of two new groundwater wells. 2. If desired by village leaders, secure funding for water system design and construction. 3. Design water system improvements. 4. Construct proposed improvements.
ASEPA Reduce village exposure to potential waterborne diseases.
Encourage greater use of individual water catchment systems until ASPA water improvements are made.
ASEPA Monitor water quality of Vaitele Stream, as well as the nearshore waters.
Measure changes in and total/fecal bacteria, total suspended solids, turbidity, and nutrients on a quarterly basis.
ASDOC Monitor changes in population and land use
Annually map type and location of land uses in village and estimate resident population.
Reduce sedimentation from agricultural activities
1. Determine locations where upslope agricultural activities may be generating some sedimentation. 2. Encourage soil conservation methods with resident growers of subsistence crops.
ASCC Land Grant Program
Reduce urban runoff Encourage use of best management practices in the siting and location of homes in Poloaluga area and the growth of desirable ground covers.
ASG Department of Agriculture
Reduce piggery discharges into Vaitele Stream and nearshore waters
1. Inventory existing piggeries every two years. 2. Recommend best management practices for pig production and the discharge of wastewater from piggeries.
ASG Dept of Marine & Wildlife Resources
Sustain health of marine communities in nearshore waters
Monitor changes in coral coverage, fish habitat, diversity and other characteristics (used by Green) along the reef front of Poloa Bay approximately once every three years.
Source: Pedersen Planning Consultants, 1997
Fagalii, Page 2-1
FAGALII Watershed 02
GEOGRAPHY
The Fagalii watershed lies within a drainage basin that is generally located on the northwest coast of the Island of Tutuila. The watershed is bounded by Leileia Mountain’s Tuigaava Ridge and Lealafaalava Mountain’s Tausina Ridge. Along the shoreline, the watershed extends between Leopard Point and Fagalea Point. This watershed includes four unnamed streams and Vaisa Stream. The watershed contains approximately 0.80 square miles of land (Figure 2-1).
Steep upland slopes characterize the watershed. Five streams discharge surface runoff to the nearshore waters that adjoin the watershed. The inhabited village area of Fagalii is situated on a small coastal plain along the shoreline, as well as the northern slopes of Tuigaava Ridge. RESOURCES OF THE WATERSHED
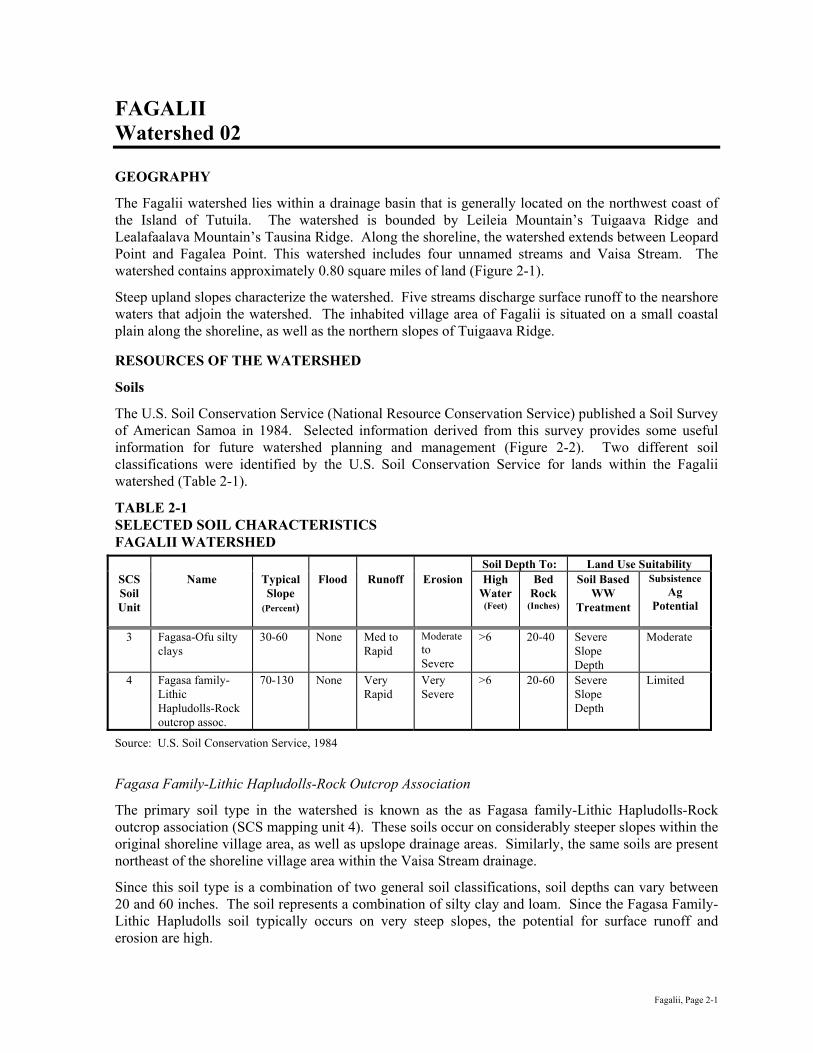
Soils
The U.S. Soil Conservation Service (National Resource Conservation Service) published a Soil Survey of American Samoa in 1984. Selected information derived from this survey provides some useful information for future watershed planning and management (Figure 2-2). Two different soil classifications were identified by the U.S. Soil Conservation Service for lands within the Fagalii watershed (Table 2-1).
TABLE 2-1 SELECTED SOIL CHARACTERISTICS FAGALII WATERSHED
Soil Depth To: Land Use Suitability SCS Soil Unit
Name Typical Slope
(Percent)
Flood Runoff Erosion High Water
(Feet)
Bed Rock
(Inches)
Soil Based WW
Treatment
Subsistence Ag
Potential
3 Fagasa-Ofu silty clays
30-60 None Med to Rapid
Moderate to Severe
>6 20-40 Severe Slope Depth
Moderate
4 Fagasa family-Lithic Hapludolls-Rock outcrop assoc.
70-130 None Very Rapid
Very Severe
>6 20-60 Severe Slope Depth
Limited
Source: U.S. Soil Conservation Service, 1984 Fagasa Family-Lithic Hapludolls-Rock Outcrop Association
The primary soil type in the watershed is known as the as Fagasa family-Lithic Hapludolls-Rock outcrop association (SCS mapping unit 4). These soils occur on considerably steeper slopes within the original shoreline village area, as well as upslope drainage areas. Similarly, the same soils are present northeast of the shoreline village area within the Vaisa Stream drainage.
Since this soil type is a combination of two general soil classifications, soil depths can vary between 20 and 60 inches. The soil represents a combination of silty clay and loam. Since the Fagasa Family-Lithic Hapludolls soil typically occurs on very steep slopes, the potential for surface runoff and erosion are high.


Fagalii, Page 2-4
The cultivation of subsistence crops on these soils is not considered desirable. However, when cultivation in these soils is necessary, care should be exercised to minimize the amount of exposed soil in cultivated areas. When heavier rainfall events occur in this watershed, a significant contribution of soil erosion can be expected from upslope areas of the watershed that contain this soil type. Such erosion can readily influence downstream water quality. The occurrence of these soils typically on steeper slopes carries soil-laden runoff to downslope drainage courses and streams. Fagasa-Ofu Silty Clays Upslope of Leopard Point, the lower northern slopes of Leileia Mountain’s Tuigaava Ridge are primarily characterized by soils that are identified by the U.S. Soil Conservation Service as Fagasa-Ofu Silty Clays (SCS mapping unit 3). The same soils are found in the upper slopes of Lealafaalava Mountain’s Tausina Ridge. These soils occur on steeper slopes in both areas. In addition, the drainage areas immediately downslope of Tuigaava Ridge and Tuasina Ridge each contain unnamed streams that ultimately can transport eroding soil material into the nearshore waters. The soil ranges between 20 to 40-inches in depth. The permeability of this silty clay loam is moderately rapid (2 to 6 inches per hour). The potential for surface runoff from these soils is considered moderate to rapid. However, the potential for erosion is moderate to severe. The U.S. Soil Conservation Service indicates that this soil type is somewhat suitable for the production of subsistence crops. The soil can annually sustain from one to 5 tons per acre of erosion without impacting crop productivity. However, the Soil Conservation Service recommends the use of mulch, crop residues, and cross-slope farming to reduce the potential for soil erosion. Streams Stream Locations Only one of seven streams in the Fagalii watershed is named. Consequently, six of the streams (2A through 2F) have been assigned numbers to facilitate their description and long-term use for other watershed planning purposes. Stream 2A is short, unbranched stream that originates at about 360 feet elevation. This stream, which is only about 0.2 miles in length, drains the seaward face of Tuigaava Ridge. Stream 2B, which contains five tributaries, orginates at about the 600 and 700-foot elevation. This stream drains the northern face of Leileia Mountain and discharges along the shoreline just east of Faialulu Point. Streams 2C and 2D begin about the 640 and 880-foot elevations and drain a portion of the surface runoff from the north slope of Leileia Mountain, as well as the western face of Lealafaalava Mountain. drain. Ultimately, a confluence of these streams occurs just above the shoreline village area before entering the ocean. Vaisa Stream, as well as two streams (Streams 2E and 2F) north of the shoreline village area, carry drainage from the seaward face of Tuasina Ridge. Stream Flows Within the Watershed A single stream flow measurement was made in August 1970 about 600 feet upstream of the stream mouth of Stream 2D. The U.S. Geological Survey identifies this stream as “Fagalii Stream” even though this name is not reflected otherwise. The measurement reflected a discharge of about 0.80
Fagalii, Page 2-5
cubic feet per second (cfs). The U.S.Geological Survey has also estimated a median flow at this location to be 1.06 cfs. Aquatic Fishes and Invertebrates Field surveys of fishes and invertebrates were made by the U.S. Fish and Wildlife Service, Division of Ecological Services, in March-April, 1978 and the U.S. Army Corps of Engineers in August, 1980. An unnamed stream in Fagalii Village (probably stream 2C) was one of 37 streams in American Samoa that was inventoried by representatives of these federal agencies. Results from both field surveys were summarized in an American Samoa Stream Inventory that was published by the U.S. Army Corps of Engineers, Honolulu District, in July, 1981. One point along stream 2C was surveyed. The sampling station (station 17a) was a shallow riffle with cobbles and boulders. The riffle was located approximately 60 feet upstream of the stream mouth at about the five-foot elevation. Three species of gobie fish were observed at station 17a. Abundant populations of mountain bass and eels were documented. Six species of shrimp and two species of mollusks were also observed at station 17a. Surface Water Quality There is some water quality data for one of the two streams that in Fagalii. The water quality characteristics that reflected from this data are described in the discussion concerning groundwater and surface water supplies. Wetlands There are no significant wetlands that are known to be located in the Fagalii watershed. Marine Resources Coral Communities The only marine surveys of the shoreline that fronts Fagalii village were made in 1978 and 1979. The lack of fieldwork in this area may be due to the fact that the shoreline between Faga and Leopard Points lacks a well-defined fringing reef. The primary focus of all available surveys has been the general health of the coral communities. In January, 1978, surveys made by the ASG Office of Marine Resources observed a common presence of the crown-of-thorns starfish in the nearshore waters between Faga Point and Faiaiulu Point. However, damage to coral communities was not evident (AECOS and Aquatic Farms, 1980). By August-September, 1979, only five percent of corals on the upper reef front (between 6 and 33 feet) remained alive. However, no crown-of-thorns starfish were observed (AECOS and Aquatic Farms, 1980).

Fagalii, Page 2-6
Wildlife Resources Bats A fruit bat roosting area is located on the northeast side of the Fagalii watershed in the vicinity of Fagalea Point. A minimum population of 107 bats was estimated by the ASG Department of Marine and Wildlife Resources for FY 1997. This estimate was based upon a combination of exit counts, dawn return counts, and/or boat counts (Utuzurrum, 1998). Shoreline Protection The lack of a significant fringing reef affords limited protection to the shoreline area of Fagalii. An alluvial and coral cobble beach with larger basalt boulders characterize the shoreline. Some coastal erosion has also occurred along portions of the Fagalii shoreline in recent years. In response, the ASCC Land Grant Program has planted milo along the shoreline to help provide some greater stability to the remaining shoreline (Miller, 1996). In March, 1994, Sea Engineering, Inc. and Belt Collins Hawaii published a shoreline inventory report that outlined, in part, ongoing shoreline erosion conditions and related shore protection needs for American Samoa. Sea Engineering, Inc. and Belt Collins Hawaii noted no shoreline conditions in the Poloa watershed that were determined to be “critical”, or “potentially critical”. Groundwater and Surface Water Supplies Groundwater Supply and Quality There are no groundwater supplies that are used or developed in the Fagalii watershed. Surface Water Supply and Quality The shoreline and upper village area of Fagalii rely upon surface water sources for potable drinking water. Streams 2B and 2E, as well as individual roof catchment systems, represent the surface water sources. The stream catchment along stream 2B is situated at about 160 feet above mean sea level. This system supports, at least, a portion of the upper village area. Along Stream 2E, a stream catchment is located at approximately 125-feet above mean sea level. This facility serves the shoreline village area. ASEPA monitors the water quality of one of the two stream catchments in Fagalii on a monthly basis. A review of monthly water quality data of the Fagalii village water system between FY 1994 and FY 1996 indicate that these streams are regularly influenced by bacterial contamination. Total coliform contamination is generally about 80 coliforms per 100 mililiters (ml). Fecal contamination ranges between 25 and 60 colonies per 100 ml. In terms of turbidity, NTU values vary considerably. During FY 1994 and FY1995, turbidity ranged between 0.3 and 2.9. The stream catchments may be subjected to higher levels of turbidity following heavier rainfall periods.

Fagalii, Page 2-7
Proposed Water System Improvements With the potential for increased residential development in the upper Fagalii area, increased contamination of the surface water supply can be expected. In recognition of existing bacterial contamination and the anticipated residential growth of the upper village area, the American Samoa Power Authority has proposed long-term water improvements for the village water system (Figure 2-3). These plans recommend the construction and installation of the following:
• two new groundwater wells that would have a minimum production requirement of 28 gallons per minute;
• disinfection at each groundwater well; • one 65,000 gallon water storage tank; • 1,400-feet of 2-inch PE transmission main from the new wells to the new water storage tank, and, • a fire protection/distribution system and three fire hydrants. The implementation of such plans by the American Samoa Power Authority would, in part, be dependent upon the incorporation of the village system into the ASPA’s overall public water system. In the absence of these improvements, it is recommended that village residents be encouraged to make a greater use of individual roof catchment systems for the collection of raw rain water for drinking, bathing, and laundry purposes. The existing surface supplies could be used for the disposal of wastewater from indoor toilets and general household maintenance. USE OF THE WATERSHED Resident Population Between 1980 and 1990, the resident population of Fagalii Village increased from 112 to 206 residents. Such growth represented an average annual growth rate of about 8.39 percent. Development activity between 1990 and 1995 increased the resident population to about 254 persons. Population trends reflected in the 1990 Census statistics suggest that limited in-migration has occurred in this community between 1980 and 1990. The proportion of residents who were born outside of American Samoa during the 1980-1984 period was about 40 percent. Between 1985 and 1990, the proportion decreased to 18 percent. However, in 1990, the proportion increased to 46 percent; this change in village ethnicity is only slightly greater than the 1980 level. Land Uses Residential The 1990 U.S. Census documented 23 homes in Fagalii. Ninety-one percent of the homes were owner-occupied; one percent were rental units. The remaining five percent were vacant or used as vacation homes by absentee owners. The housing stock expanded considerably during the 1990-1995 period. ASG Building Division records indicate that five new residential building permits were issued during this period. Consequently, the 1995 housing stock in Fagalii includes 28 houses. The inhabited village area includes two residential concentrations. The original village lies between the shoreline and the 50-foot elevation. A second residential area, between the 125 and 275-foot elevation, is situated upland of the shoreline village on the northern slope of Tuigaava Ridge.

Fagalii, Page 2-9
Agriculture
Piggeries
During the April, 1996 survey, two piggeries were documented in the lower Fagalii Village area. A somewhat earlier inventory by the ASG Department of Agriculture in early 1996 is believed to be more representative of the number of piggeries and related pig population. This inventory documented five piggeries that housed a total of 56 pigs.
Subsistence Crop Production
A field survey of the watershed in April, 1996 indicates that agricultural activity in the Fagalii watershed generally included the production of traditional subsistence crops. While no detailed inventory was made of agricultural production, faatoaga were generally located immediately upland of the lower village area, as well as upland of the primary shoreline roadway.
Commercial ASG business license records indicated that there was one commercial enterprise based in Fagalii in 1995. No building permits were issued for any new commercial facilities during the 1990-1995 period. The existing commercial enterprise was a locally-owned bus company. It is suspected that local residents make consumer purchases for convenience items in nearby Amanave where village stores are located. Grocery shopping and other retail shopping probably is made in Leone, Pavaivai, Nuuuli, or Fagatogo. Industrial No light industrial operations are based in Fagalii. Public Facilities The ASG Department of Education offers an early childhood education program in Fagalii. This program provided educational opportunities for 11 younger children in September, 1994. Elementary school-aged children attend Taputapu Elementary School in Poloa. High school students, however, are bussed to Leone High School in Leone. Population characteristics for Fagalii in 1990 suggest that approximately seven percent of the village population is three and four years of age. Elementary school-aged children (5 and 13 years old) include about 26 percent of the village population; high school students represented about 10 percent of the population. Use of the Nearshore Waters Nearshore Fishing An American Samoa Subsistence Fishing Survey conducted by the University of Hawaii Sea Grant Program in the summer of 1992 involved onsite interviews on selected days with shoreline users who were participating in fishing activities during that period. The results of the survey revealed that there is some use of the nearshore waters of Fagalii. Some 8 to 18 persons were observed fishing. Fishing methods employed were diving, gleaning, use of rod and reel, and hand-in-line in a paopao (canoe). More recently, Chief Pua, a member of Fagalii’s traditional village council, indicated that up to about six residents use the nearshore on any given day of the week. Most fishing in the nearshore waters

Fagalii, Page 2-10
occurs between April and September, or when calmer sea conditions prevail (Pua, 1996). Consequently, no significant use of the nearshore waters is made for subsistence or recreational fishing. RESOURCE MANAGEMENT ISSUES Future Land Uses to the Year 2015 Residential Considerable residential expansion is expected to gradually occur in Fagalii during the next 20 years. Anticipated growth will be slightly greater than the annual rate of residential growth (about 4 percent per year) that occurred between 1990 and 1995. Future residential expansion will primarily occur within the growing new residential area that is mauga of the original shoreline residential area. Within this area, there are 27 potential housesites. It is believed that one existing trail will be extended to provide access to developable lands immediately mauga of this growing upland residential area.
Despite the potential availability of developable residential lands, future residential construction in Fagalii is somewhat constrained by the presence of steeper slopes throughout most of the village Census area. However, the attractive and more remote setting of this community is expected to continually attract greater in-migration from the continental United States, Hawaii, and other international areas until the supply of developable land is depleted.
During the next 20 years, ASPA believes that potential development opportunities and constraints will generate the following sequence and volume of residential construction.
1996-2000 Seven new single-family homes between the 150 and 350 feet above mean sea level.
2001-2005 Seven new single-family homes between the 150 and 350 feet above mean sea level.
2006-2010 Six new single-family homes between the 150 and 350 feet above mean sea level.
2011-2015 Seven new single-family homes between the 150 and 350 feet above mean sea level.
The cumulative effect of this prospective residential growth is that the village housing stock will increase to roughly 55 housing units in the year 2015. During the same period, it is believed that the average household size will have gradually decreased to approximately 7.76 persons per household. It is expected that the future village population will include about 427 persons in the year 2015. Agriculture The present level of subsistence agriculture is also expected to increase even though the per capita consumption of subsistence crops should decline. The continued westernization of the American Samoa population will increase the demand for imported foods. Commercial Future commercial facility expansion in Fagalii is not anticipated even though a few developable sites are available along the Tutuila’s primary roadway. Other consumer shopping will continue to occur outside of the village where greater commercial facilities and services are available. At the same time, the anticipated increase in resident population will encourage the establishment of various home-based occupations. These enterprises will likely include one technical service operations and/or a home-based company that sells and distributes various commercial products on a wholesale and retail basis. Industrial

Fagalii, Page 2-11
The gradual increase in resident population is expected to attract one small, home-based enterprise of an industrial nature, e.g., auto repair business. However, the construction of new industrial facilities is not anticipated. Public Facilities The application of 1990 population characteristics to the anticipated 2015 village population suggest increased student enrollments in future early childhood, elementary education, and high school programs within and outside of Fagalii. Anticipated student enrollments from the village population are expected to be as follows in the year 2015:
• early childhood education 30 students • elementary school 111 students • high school 43 students Impact of Future Population Growth Upon Water Consumption and Waste Generation The significance of increased residential and population growth in the watershed will be an increase in Fagalii’s total volume of wastewater and solid waste generation. By the year 2015, wastewater generation is forecasted to rise from 11,848 gallons per day to 24,164 gallons per day (American Samoa Power Authority, 1996).
A greater resident population will also consume more potable water. The average day demand for water consumption in the year 2015 is anticipated to be 34,520 gallons per day (gpd). Such demand is more than double the total estimated consumption in 1995 (16,926 gpd).
Flood Potential A flood insurance study of American Samoa and related flood insurance rate maps were published by the U.S. Federal Emergency Management Agency (FEMA) in 1991. The study evaluated selected geographical locations throughout the Territory. Hydrologic and hydraulic analyses that were presented in the study were made by the U.S. Army Corps of Engineers, Pacific Ocean Division. However, no specific analysis was apparently made of any of the streams in the Fagalii watershed. Inland Flood Potential The flood insurance rate map for the west coast of Tutuila indicates the entire Fagalii watershed has been designated by FEMA as “zone x”. This designation indicates that the area is outside of the 100-year floodplain (Federal Emergency Management Agency, 1991). In essence, FEMA is suggesting that the flood hazard potential in this watershed is limited. Coastal Flood Hazard The flood insurance rate map for the shoreline of the Fagalii watershed indicates that there is a coastal flood hazard along the shoreline of the watershed. A potential 100-year flood is anticipated to generate flood levels approximately three feet above mean sea level (MSL) in these areas.

Fagalii, Page 2-12
Stormwater Runoff/Sedimentation and the Relationship to Surface Water Quality Heavier rainfall periods, steeper inland slopes, and more erosive soils in the Fagalii watershed regularly contribute to periodic erosion and the related transport of sediments into the six streams of the watershed. Ultimately, this natural erosion process carries a portion of these sediments into the nearshore waters that adjoin the watershed, especially during medium to higher flow stream conditions. Natural erosion from the undeveloped, upslope areas of the watershed is believed to be the primary cause of sedimentation in local streams, as well as downstream sedimentation of the nearshore waters. All drainage areas of the watershed are impacted by natural erosion and downstream sedimentation. Secondarily, the construction of ASG’s primary shoreline roadway between the 150 and 450-foot elevation clearly altered the prior natural slope of the watershed. When saturated, upslope soils above the primary roadway will often subside because natural erosion processes typically transport soil material in a manner that attempts to restore the original topographic slope. As a result, existing roadway cuts, which were required to build the road, generate frequent landslides following heavier rainfall periods. Some erosion may also be occurring from some faatoaga areas that are upslope of the upper Fagalii area. During heavier rainfall periods, some erosion probably occurs and causes some sedimentation of Streams 2B and 2C. Urban runoff also occurs in the lower Fagalii area. In this area, a greater density of residences and other community facilities is present along Stream 2D. Heavier rains that regularly fall upon impermeable surfaces of buildings and intermittent paved area carry storm runoff and some domestic garbage into Stream 2D. Such conditions were observed during the April, 1996 field survey. A future watershed management concern is the anticipated growth of the upper Fagalii village area where future residential growth in expected to occur in the vicinity of the 150-300-foot elevation. This area primarily contains Fagasa-Ofu silty clay soils that have a moderate to severe potential for both surface runoff and erosion. Without careful siting and clearing of residential house sites, increased erosion and downstream sedimentation can be expected to occur within the Stream 2B drainage. The potential downstream discharge of silt-laden surface runoff in this drainage could ultimately increase the volume of sedimentation into the nearshore waters near Faiaiulu Point. Nearshore Water Quality and the Marine Environment Turbidity and Sedimentation While the nearshore waters that adjoin the watershed are impacted by natural sedimentation and urban runoff, nearshore water quality is also influenced significantly be wave action and nearshore currents. Consequently, coral communities in the nearshore marine environment may be less influenced by sedimentation that impacts other watersheds with more protected embayments. Nevertheless, increased sedimentation into the nearshore waters is viewed as an important resource management concern. Coral communities are significantly dependent upon the availability of light and related photosynthesis, and occasional periods of significant turbidity and sedimentation do not promote long-term coral nutrition, growth, reproduction, and depth distribution (Richmond, 1993). When corals fertilize, they are free-swimming. Consequently, they need a good location to settle and make a good attachment. With significant soil deposition, sediments can physically interfere with the recruitment of coral larvae (Richmond, 1993; Dashbach, 1996).

Fagalii, Page 2-13
Coral communities are an important component of the overall ecology of the nearshore waters that adjoin the Fagalii watershed. They provide shelter to fish, invertebrates, and other marine organisms, as well as a supplemental food source for Fagalii residents. Nutrient Inputs A nutrient contribution is also occurring through the continued use of septic tanks, cesspools, or other soil-based, wastewater treatment systems in the watershed. In addition, some of the piggeries may also generating nutrient-enriched discharges into local stream. These sources of nutrients are also accompanied by some bacterial contamination from these discharges. While the total volume of wastewater generation from the watershed is limited, the discharges are concentrated in the inhabited village area where housing densities are between four and five housing units per acre. Local soils are generally inadequate to provide effective treatment. The long-term input of turbid and nutrient-enriched waters into the nearshore waters represents an important concern. These inputs are potentially detrimental to the quality because they can adversely change the composition of the nearshore marine environment. However, the degree of impact upon water quality is also highly dependent upon currents and water exchange within the nearshore environment. As the population of the watershed grows, nutrient and bacterial inputs will only increase. Aside from these resource management considerations, the future use of the nearshore waters for fishing, swimming and general recreation will eventually represent a more significant public health concern unless practical steps are made to reduce potential nearshore water contamination. It is preferable for Fagalii to be incorporated into the ASPA wastewater collection system. However, the limited population of the west end of Tutuila will likely continue to make this system expansion unfeasible. In the absence of this reality, inhabited village areas in the Fagalii watershed that are unsuitable for soil-based, wastewater treatment should be more specifically identified. As recommended in the ASPA Utilities Master Plan, this identification process should be based upon a more detailed sanitation survey of more densely inhabited areas in the shoreline and upland village areas. This survey would evaluate existing wastewater treatment practices, soil characteristics, the location and density of land uses, the distance to surface water supplies and the nearshore waters, topography, and other related factors. Using the conclusions and recommendations associated with this evaluation, ASPA and other participating Project Notification and Review System (PNRS) agencies will be better able to:
• require the use of septic tanks and leachfields that provide a sufficient amount of additional soil-based treatment;
• provide greater technical assistance to building permit applicants; and, if necessary, • deny building applications in land areas that are unsuitable for soil-based treatment systems. Long-Term Monitoring The future monitoring of the nearshore waters is necessary and should be combined with water quality monitoring of Streams 2B, 2C, 2D, and 2E. Turbidity and sedimentation are the primary stresses to the coral communities in the nearshore waters of these embayments. However, future levels bacterial contamination and nutrient inputs should also be documented to help ensure future public safety and evaluate potential stresses to the fringing coral reef communities. In addition, the ASG Department of Marine and Wildlife Resources should monitor the coral communities along the fringing reef front between Faga Point and Faialualu Point at least once every three years. Long-term monitoring of this site should also include an evaluation of the impact of sedimentation and turbidity that already influences the nearshore marine environment.

Fagalii, Page 2-14
Groundwater and Surface Supplies The development of a groundwater supply and related ASPA satellite water system is recommended. In the absence of these improvements, it is recommended that village residents be encouraged to make a greater use of individual roof catchment systems for the collection of rain water for drinking, bathing, food preparation, and laundry purposes. The existing surface supplies could be used for the disposal of wastewater from indoor toilets and general household maintenance. MANAGEMENT NEEDS AND RECOMMENDATIONS The primary focus of future resource management in the Fagalii watershed should be to:
• develop a groundwater supply for potable water uses in Fagalii; • reduce the amount of natural erosion and sedimentation within the watershed; and, • install more effective soil-based treatment systems for wastewater disposal to support anticipated
residential development in the upland village area. Representatives of participating public agencies should make periodic visits to the watershed to observe, document, and monitor selected resource conditions, determine potential methods of correcting a potential hazard or undesirable conditions, share potential solutions with designated residents of Fagalii, and encourage the participation of traditional leaders and village residents in the implementation of resource management solutions. The scope of issues that should be addressed by each agency in the field is summarized in Table 2-2. The general focus of recommended technical assistance is also identified. The experience and insights of agency representatives will determine the specific methodology to be used in the field. TABLE 2-2 RECOMMENDED FOCUS OF FUTURE TECHNICAL ASSISTANCE FAGALII WATERSHED
Participating Public Agency
Resource Management Issue
Focus of Technical Assistance
ASEPA Facilitate a coordinated resource management effort within the watershed.
1. Coordinate overall watershed management activities. 2. Hold periodic meetings with participating ASG and federal agencies to discuss, prioritize, and schedule resource management activities. 3. Coordinate program efforts with local traditional leaders and/or designated resident of the watershed. 4. Make annual assessment of resource management program.
ASEPA Monitor water quality of Streams 2B, 2C, 2D, and 2E, as well as the nearshore waters.
Measure changes in and total/fecal bacteria, total suspended solids, turbidity, and nutrients on a quarterly basis.
Continued – next page TABLE 2-2 (continued) RECOMMENDED FOCUS OF FUTURE TECHNICAL ASSISTANCE FAGALII WATERSHED
Participating Resource Management Focus of Technical Assistance

Fagalii, Page 2-15
Public Agency Issue ASPA/ASEPA Perform a detailed
evaluation of community sanitation problems associated with the use of soil-based treatment systems.
1. Survey inhabited village areas in Fagalii. 2. Evaluate existing treatment practices, soil characteristics, location and density of land uses, the distance to water supplies and nearshore waters, topography, and other factors. 3. Require use of septic tanks and leachfields that provide sufficient amounts of additional soil-based treatment; or, deny building applications in areas unsuitable for soil-based treatment.
ASEPA Conserve surface water supplies
1. Identify village surface water supplies that are actively used. 2. Revise American Samoa GIS to delineate 100-foot buffers around each surface supply. 3. Restrict land uses within designated buffers.
ASPA Develop new groundwater supply in Fagalii and establish an ASPA satellite water system.
1. Meet with traditional village leaders to consider the development of two new groundwater wells. 2. If desired by village leaders, secure funding for water system design and construction. 3. Design water system improvements. 4. Construct proposed improvements.
ASEPA Reduce village exposure to potential waterborne diseases
Encourage greater use of individual water catchment systems until ASPA water improvements are made.
ASCZM/DOC Detain stormwater runoff in future residential and commercial areas.
Where undesirable stormwater discharges are anticipated, require the use of onsite drywells for new residential and commercial facilities in Fagalii.
DPW Maintain culverts along the primary shoreline roadway
1. Establish a periodic storm culvert maintenance program. Consider use of village labor to supplement DPW heavy equipment.
2. Clean debris and other material blocking culverts. ASDOC Monitor changes in
population and land use Annually map type and location of land uses in village and estimate resident population.
ASCC Land Grant Program
Reduce sedimentation from agricultural activities
1. Determine locations where upslope agricultural activities may be generating some sedimentation. 2. Encourage soil conservation methods with resident growers of subsistence crops.
ASG Dept of Marine/ Wildlife Resources
Sustain healthy marine communities in nearshore waters
Monitor changes in coral coverage, fish habitat, diversity and other characteristics (used by Green) of the reef front between Faga Point and Faiaiulu Point approximately once every three years.
Source: Pedersen Planning Consultants, 1998

Maloata, Page 3-1
MALOATA Watershed 03 GEOGRAPHY The Maloata watershed is a well-defined narrow valley that represents the Maloata Stream drainage. The floor of the valley broadens near the coast and the stream waters flow into the head of Maloata Bay. The watershed contains approximately 1.08 square miles of land (Figure 3-1). Upslope of the Maloata Stream drainage, the watershed is characterized by steeper mountain ridges known as Tuasina, Fugalei, and Tuatafa, as well as the summit of Lealafaalava Mountain at about 1,160 foot contour. The apex of the watershed lies begins at West Tutuila’s upland central plateau which is situated at approximately 1,200 feet above mean sea level. The nearshore waters of Maloata Bay represent a moderate-sized embayment. A fringing reef in the Bay extends ranging from 145 feet to 475 feet north of the shoreline and affords considerable protection to the resources of the watershed. RESOURCES OF THE WATERSHED Soils The U.S. Soil Conservation Service (National Resource Conservation Service) published a Soil Survey of American Samoa in 1984. Selected information derived from this survey provides some useful information for future watershed planning and management (Figure 3-2). Six different soil classifications were identified by the U.S. Soil Conservation Service for lands within the Maloata watershed (Table 3-1). TABLE 3-1 SELECTED SOIL CHARACTERISTICS MALOATA WATERSHED Soil Depth To: Land Use Suitability
SCS Soil Unit
Name Typical Slope
(Percent)
Flood Runoff Erosion High Water (Feet)
Bed Rock
(Inches)
Soil Based WW
Treatment
Subsistence Ag
Potential
1 Aua very stony silty clay loam
15-30 None Med-ium
Mod-erate
>6 <60 Severe Slope
Moderate
2 Aua very stony silty clay loam
30-60 None Rapid Severe >6 >60 Severe Slope
Poor
3 Fagasa-Ofu silty clays
30-60 None Med to Rapid
Mod to Severe
>6 20-40 Severe Slope Depth
Moderate
4 Fagasa family-Lithic Hapludolls-Rock outcrop assoc.
70-130 None Very Rapid
Very Severe
>6 20-60 Severe Slope Depth
Limited
19 Oloava silty clay loam
6-12 None Slow Slight >6 >60 Severe Filter Good
20 Oloava silty clay loam
12-25 None Slow to Med
Slight to Mod
>6 >60 Severe Filter Slope
Good
Source: U.S. Soil Conservation Service, 1984
< INSERT FIGURE 3-1 >


Maloata, Page 3-4
Aua Very Stony Silty Clay Loam (15 to 30 percent slopes) From the mouth of Maloata Stream, these soils extend inland for roughly 1,000 feet from the shoreline. These soils (SCS mapping unit 1) are found in the Maloata Stream drainage, as well as on adjoining developed lands that contain three shoreline residences and a laboratory. These soils typically occur up to about 60 inches in depth. The permeability of these soils ranges between 2 and 6 inches per hour. The potential for runoff or erosion from the Aua soils is believed to be moderate (U.S. Soil Conservation Service, 1984). While moderately suited for agricultural production, the Soil Conservation advises that the stony and erosive characteristics of these soils may limit production. However, the U.S. Soil Conservation Service estimates that this soil can annually sustain up to 5 tons per acre of erosion without impacting crop productivity (U.S. Soil Conservation Service, 1984). While the erosive characteristics of this soil generally may not significantly impact subsistence crop productivity, the erosive quality of the soil can be a significant contributor to sedimentation in downslope streams and the nearshore waters. The general characteristics of these Aua soils are also undesirable for individual wastewater disposal systems (U.S. Soil Conservation Service, 1984) The soils contain a significant amount of larger stones that typically hamper installation and adequate soil treatment. While possible, it is highly unlikely that the wastewater discharges from the septic tanks or cesspools that serve three existing shoreline residences is significantly impacting nearshore water quality. Aua Very Stony Silty Clay Loam (30 to 60 percent slopes) Within the Maloata Stream drainage, the primary soil that lies between 1,000 and 2,400 feet of the shoreline are identified by the U.S. Soil Conservation Service as Aua very stony Silty Clay Loam on 30 to 60 percent slopes (SCS mapping unit 2). A portion of an existing banana plantation, seaward of the primary shoreline roadway, probably includes this type of soil. The Aua soils range between seven to 60 inches in depth. The permeability of these soils (between 2 and 6 inches per hour) is moderately rapid. For watershed management purposes, it is important to note that these Aua soils have a high potential for runoff and erosion. This Aua soil is not recommended for agricultural production because of the stoniness of the soil, the high erosion potential, and hazards associated with subsistence crop cultivation on steeper slopes. However, when cultivation in these soils is necessary, the use of a mulch or ground cover is recommended to reduce soil erosion in cultivated areas. During an April, 1996 survey of this watershed, Pedersen Planning Consultants observed the wise use of trimmed banana leaves by the Gurr family to cover exposed soils in a cultivated banana plantation. The U.S. Soil Conservation Service estimates that this soil can annually sustain up to 5 tons per acre of erosion without impacting crop productivity (U.S. Soil Conservation Service, 1984). While the erosive characteristics of this soil generally may not significantly impact subsistence crop productivity, the erosive quality of the soil can be a significant contributor to sedimentation in downslope streams and the nearshore waters. The general characteristics of these Aua soils are also undesirable for individual wastewater disposal systems (U.S. Soil Conservation Service, 1984) The soils contain a significant amount of larger stones that hamper installation and adequate soil treatment. Should additional residential development be considered by the Gurr family in the future, it should be recognized that inadequate wastewater treatment in these soils could decrease the water quality of stream in Maloata Stream. Fagasa-Ofu Silty Clays

Maloata, Page 3-5
In the vicinity of Lealafaalava Mountain, portions of the upper Maloata watershed (between the 800 and 1,100-foot elevation, contain some Fagasa-Ofu Silty Clays (SCS mapping unit 3). The soil ranges between 20 to 40-inches in depth. The permeability of this silty clay loam is moderately rapid (2 to 6 inches per hour). The potential for surface runoff from these soils is considered moderate to rapid. However, the potential for erosion is moderate to severe. The U.S. Soil Conservation Service indicates that this soil type is somewhat suitable for the production of subsistence crops. The soil can annually sustain from one to 5 tons per acre of erosion without impacting crop productivity. However, the Soil Conservation Service recommends the use of mulch, crop residues, and cross-slope farming to reduce the potential for soil erosion. The portion of the upper watershed that contains these soils drains into the upper branch of Matavai Stream. Consequently, potential soil erosion from this area can impact downstream water quality. Fagasa Family-Lithic Hapludolls-Rock Outcrop Association Adjoining land areas throughout most of the remaining watershed contain deep, well-drained soils on steep mountain ridges and slopes. The U.S. Soil Conservation Service identifies these soils as part of the Fagasa family-Lithic Hapludolls-Rock outcrop association (SCS mapping unit 4). This soil type is common and characterizes most of the steep, upland slopes along Tutuila’s north and west coast. Since this soil type is a combination of two general soil classifications, soil depths can vary between 20 and 60 inches. The soil represents a combination of silty clay and loam. Since the Fagasa Family-Lithic Hapludolls soil typically occurs on very steep slopes, the potential for surface runoff and erosion are high. The cultivation of subsistence crops on these soils is not considered desirable. However, when cultivation in these soils is necessary, care should be exercised to minimize the amount of exposed soil in cultivated areas. When heavier rainfall events occur in this watershed, a significant contribution of soil erosion can be expected from undeveloped upslope areas of the watershed that contain this soil type. Natural runoff from steeper slopes in the watershed carries water, sediments, and organic debris to downslope drainage courses and Maloata Stream. Such erosion can readily influence downstream water quality. Oloava Silty Clay Loam (6 to 12 Percent Slopes) Oloava Silty Clay Loam (SCS mapping unit 19) soils are located near the 1,200-foot contour along portions of the central mountain plateau of West Tutuila. In a typical cross section, this soil is very deep, well-drained, and extends up to 60 inches in depth. The surface is a dark-brown, silty clay loam. Soft, weathered cinders are typically present between 12 to 40 inches in depth. However, the depth to weathered cinders sometimes extends to 60 inches or more. The permeability of the Oloava soil is moderately rapid, i.e., 2 to 6 inches per hour, through the surface layer. However, permeability becomes very rapid, i.e., 6 to 20 inches per hour, through the cinder material that occurs between 12 to 60 inches in depth (U.S. Soil Conservation Service, 1984). The rate of stormwater runoff through these Oloava soils is typically slow. The potential for water erosion is considered slight (U.S. Soil Conservation Service, 1984). This soil is well-suited to the production of subsistence crops. The U.S. Soil Conservation Service estimates that this soil can annually sustain up to two tons per acre of erosion without impacting crop productivity. The limited erosion potential exhibited by these soils can be minimized through the use

Maloata, Page 3-6
of mulches, hedgerow planting, crop residues, and other ground covers (U.S. Soil Conservation Service, 1984). Residential development on these Oloava soils is not considered desirable. Site development can expose the highly permeable cinder layer and contaminate local groundwater supplies. The use of onsite wastewater disposal systems can also contaminate ground water because soil-based treatment would typically be too rapid for adequate treatment (U.S. Soil Conservation Service, 1984). Oloava Silty Clay Loam (12 to 25 Percent Slopes) Oloava Silty Clay Loam (SCS mapping unit 20) soils are located near the 1,200-foot contour along portions of the central mountain plateau of West Tutuila. In a typical cross section, this soil is very deep, well-drained, and extends up to 60 inches in depth. The surface is a dark-brown, silty clay loam. Soft, weathered cinders are typically present between 12 to 40 inches in depth. However, the depth to weathered cinders sometimes extends to 60 inches or more. The permeability of the Oloava soil is moderately rapid, i.e., 2 to 6 inches per hour, through the surface layer. However, permeability becomes very rapid, i.e., 6 to 20 inches per hour, through the cinder material that occurs between 12 to 60 inches in depth (U.S. Soil Conservation Service, 1984). The rate of stormwater runoff through these Oloava soils is typically slow. The potential for water erosion is considered slight (U.S. Soil Conservation Service, 1984). This soil is well-suited to the production of subsistence crops. The U.S. Soil Conservation Service estimates that this soil can annually sustain up to two tons per acre of erosion without impacting crop productivity (U.S. Soil Conservation Service, 1984). The limited erosion potential exhibited by these soils can be minimized through the use of mulches, hedgerow planting, crop residues, and other ground covers.
Residential development is not desirable on these soils. Site development can expose the highly permeable cinder layer and contaminate local groundwater supplies. The use of onsite wastewater disposal systems can also contaminate ground water because soil-based treatment would typically be too rapid for adequate treatment. Streams Stream Locations Maloata Stream is the only stream in the watershed and extends approximately 5.2 miles from about the 1,140-foot elevation to the shoreline. The stream flows throughout the year and is the only fresh-water discharge to Maloata Bay. Approximately nine tributaries flow into Maloata Stream. Seven of the nine tributaries begin in the upper slopes of the watershed between the 800 and 1,200-foot elevation. Two lower drainages that are located downslope of Tuasina Ridge begin at about the 600-foot elevation.

Maloata, Page 3-7
Stream Flows Within the Watershed Between 1959 and 1975, a low-flow, partial-record station (No. 16925000) was located approximately 0.4 mile upstream of the stream mouth. Available data from the flow station provided 8 measurements of stream flow. These measurements enabled the U.S. Geological Survey to estimate a median flow of 3.30 cubic feet per second at this stream gage location (Wong, 1996). Aquatic Fishes and Invertebrates Field surveys of fishes and invertebrates were made by the U.S. Fish and Wildlife Service, Division of Ecological Services, in March-April, 1978 and the U.S. Army Corps of Engineers in August, 1980. Maloata Stream was one of 37 streams in American Samoa that was inventoried by representatives of these federal agencies. Results from both field surveys were summarized in an American Samoa Stream Inventory that was published by the U.S. Army Corps of Engineers, Honolulu District, in July, 1981. Three points along Maloata Stream were surveyed. These sampling stations included a stony riffle located approximately 50 feet upstream of the stream mouth (station 25a), about 1,000 feet upstream of the stream mouth (station 25b) near the 40-foot contour, and roughly 2,000 feet upstream from the shoreline (station 25c) at about the 120-foot elevation. Abundant populations of gobie fishes were observed at all three stations. Mountain bass were found at stations 25a and 25b. Eels were documented only at stations 25a where they were abundant. Five species of shrimp were common at station 25c; only one specie of shrimp was observed at station 25a. One to three species of mollusks were observed at all three stations. Surface Water Quality Streams Water quality data from two samples collected from Maloata Stream in 1985 indicate somewhat elevated levels of total nitrogen which is due, in part, by higher nitrate+nitrite levels (Table 3-2). Turbidity and total suspended solids levels (TSS) from these two samples were also notably elevated. TABLE 3-2 AVAILABLE WATER QUALITY DATA MALOATA STREAM MAY, 1985
Water Quality Parameter TN TKN NO3+NO2 TP Turbidity TSS pH Total Coliform Date (µg/l) (µg/l) (µg/l) (µg/l) (ntu) (mg/l) (#/100 ml) 05/02/85 -- 220 -- 77 17 276 -- -- 05/08/85 330 180 210 60 -- -- -- --
Source: ASEPA, 1995 Discussions with Peter Gurr, one of several family members who own the lands of the watershed, believes that natural sedimentation from steeper upslope areas is the primary cause of higher turbidity levels in Maloata Stream. However, turbidity levels in the Stream are variable. In recent years, the prevalent turbid surface water in the primary stream course encouraged Gurr and his family to develop a new stream catchment on a tributary that is situated south of the main stream

Maloata, Page 3-8
and upslope of the primary roadway. The improvement has eliminated the need for filtering of his surface water supply (Gurr, 1996). Elevated nutrient levels observed in the past may, in part, be a consequence of past chemical applications on a banana plantation that is situated on the southwest side of the Stream. Nearshore Waters No data is known to be available for the nearshore waters of Maloata Bay. Wetlands No wetlands are known to be located in the Maloata watershed. Marine Resources Coral Communities Historical studies of coral communities in the nearshore waters of Tutuila do not suggest that the coral communities in Maloata are significant in terms of coral abundance, diversity or live coral cover (Maragos, Hunter, and Meier, 1994). However, coral communities are a significant component of the overall ecology of Maloata Bay. Corals provide shelter to fish, invertebrates, and other marine organisms that represent a source of supplemental food to residents. The coral communities in Maloata were surveyed and documented in, at least, 1978, 1979 and 1992. While different marine biologists made these field investigations, a general comparison of available data indicates that some recovery has occurred on the reefs slopes between Maloata Bay and Faga Point.
1978-1979
In January, 1978, the crown-of-thorns starfish were common the on the forereef slopes between Maloata and Faga Point, but coral damage was not evident. In August-September, 1979, only 10 percent of the corals on the upper reef front, between 6 to 33 feet in depth, remained alive. However, no crown-of-thorns starfish were observed (Aecos and Aquatic Farms, 1980). 1992
In 1992, Maragos, Hunter, and Meier observed between 5 to 10 percent coral coverage in shallow nearshore waters (about 6 meters in depth) and between one and five percent coverage at about 18 meters in depth (Maragos, Hunter, and Meier, 1994).
Giant Clams The nearshore waters of the Bay also contain one of the Territory’s 20 faisua farming sites. This site was established by the Gurr family that is participating in the Territory’s Giant Clam Project. The program was designed by the ASG Department of Marine and Wildlife to create small business opportunities for the residents of American Samoa.

Maloata, Page 3-9
The faisua farm was established by the Gurr family in early 1995. The farm was developed by the family to initially ascertain the potential feasibility of raising faisua in Maloata Bay. The long-term vision of the Gurr family is that the project will possibly provide some limited income for younger children in the family since faisua is marketable. At the present time, faisua are collected by family members to provide an occasional food source and gifts for some guests who visit the watershed (Gurr, 1996). The faisua farm is adversely impacted by periodic increases in sedimentation of the Bay since faisua cannot grow adequately if they are covered by mud or sand. In addition, some unauthorized harvest of the faisua is also suspected by one or more the fishing companies that frequent Maloata Bay for fishing purposes. Wildlife Resources Some four years of data have been collected for forest birds in the Maloata watershed. The survey area is located south of Tuatafa Ridge (Solek, 1996). Shoreline Protection The fringing reef provides some physical protection from occasional storm waves. The coral reef dissipates the amount of wave energy that otherwise would enter this embayment if the fringing reef was not present. Consequently, the long-term viability of the reef is extremely important to the protection of existing homes, as well as any future shoreline development and related land uses. Groundwater and Surface Water Supplies Groundwater Supply and Quality There are no groundwater wells in the Maloata watershed. Surface Water Supply and Quality As stated earlier, the Gurr family presently relies upon surface water supplies from a branch of Maloata Stream that is situated south of the main stream and upslope of the primary roadway. The Gurrs do not filter or disinfect this surface supply (Gurr, 1996). Proposed Water System Improvements ASPA’s draft Utility System Master Plan does not include any recommendations for the development of new groundwater wells or a community wastewater system. The present resident population of the watershed discourages any economical private or public investment unless a significant health hazard becomes evident. Should the anticipated population growth within the watershed be realized, it is recommended that:
• the development of a small community wastewater system be evaluated by the Gurr family and/or ASPA;
• a water treatment system be installed that would filter and disinfect surface water supplies. Perennial flows from Maloata Stream will likely provide a substantive volume of potential potable water supply. However, soil characteristics present at the lower elevations of the watershed cannot provide adequate soil-based treatment for larger volumes of wastewater.

Maloata, Page 3-10
USE OF THE WATERSHED Resident Population Between 1980 and 1990, the resident population of Maloata Village increased from 13 to 16 residents. Such growth represented an average annual growth rate of about 2.31 percent. Between 1990 and 1995 the resident population increased to about 26 persons. The 1990 Census documented three homes in Maloata and identified these units as owner-occupied units. More recent discussions with Peter Gurr, a part-owner and resident of Maloata, estimates that 14 residents resided in Maloata in 1995 (Gurr, 1996). Land Uses Residential The Maloata watershed is unique because it is the only watershed on privately-owned land in American Samoa. The Gurr family has constructed three homes in the watershed. One home is situated adjacent to the primary roadway at about the 120-foot elevation; two other residences are located along the Maloata Bay shoreline. One of the residences is used primarily as a guesthouse for extended family visitors. Agricultural Faatoaga are situated on steeper slopes upslope of the primary roadway to the village, as well as more moderate slopes downslope of the roadway. The faatoaga within the watershed consists primarily of bananas, breadfruit, and coconut. Some limited pasture area for a few horses has also been established at about the 20-foot elevation. Commercial The Gurr family also has established some additional commercial activity behind the small coastal plain that fronts the shoreline. A greenhouse and small laboratory have been developed to support the commercial growth of selected tropical, ornamental plants, e.g., orchids. These products are generally transported to other Pacific Island markets. It is suspected that local residents make consumer purchases in nearby Amanave where village stores are located. Grocery shopping and other retail shopping probably is made in Leone, Pavaiai, Nuuuli, or Fagatogo. Industrial No light industrial operations are based in Maloata. Public Facilities The ASG Department of Education does not offer an early childhood education program in Maloata. Elementary school-aged children attend Taputapu Elementary School in Poloa. High school students are bussed to Leone High School in Leone.

Maloata, Page 3-11
Use of the Nearshore Waters Nearshore Fishing Discussions with a Gurr family representative in April, 1996 indicate that most all of the fishing in the nearshore waters is almost entirely recreational (Gurr, 1996). Subsistence fishing has declined significantly since the late 1970’s because Maloata residents are now primarily dependent upon the cash economy for local food purchases (Gurr, 1996). In 1996, Maloata residents generally did not use the nearshore waters for fishing during the week. On Saturdays, not more than four residents typically used the Bay for fishing. The traditional non-use of nearshore waters on Sunday continues to be respected. An American Samoa Subsistence Fishing Survey was conducted by the University of Hawaii Sea Grant Program in the summer of 1992. This survey involved onsite interviews with shoreline users who were participating in fishing activities on selected days during that period. The results of the survey revealed, in part, that there is some use of the nearshore waters in Maloata. Some 10 to 13 persons were documented fishing on the reef. Fishing methods that were observed included rod and reel, hand-and-line fishing from a paopao, diving, and gleaning. RESOURCE MANAGEMENT ISSUES Future Land Uses to the Year 2015 Residential During the 1996-2015 period, a considerable increase in resident population is expected. By the year 2015, the future population of Maloata is anticipated to rise to about 75 persons (American Samoa Power Authority, 1996). The growth in population is expected to result from the anticipated development of future visitor accommodations. Such a development will require the housing of onsite employees and may also encourage the return of other extended family members. Agriculture In addition, a greater resident population and related visitor population will likely increase the present level of subsistence agriculture in the watershed even though the per capita consumption is expected to decline. Commercial Future commercial facility expansion in Maloata is not anticipated because future commercial facilities will be incorporated into the small resort complex. Such commercial activities will include a small gift shop, a convenience store, and a charter boat operation. Hotel and Visitor Accommodations
In the early 1990s, the Gurr family made application to the American Samoa Government for the development of a 300-room hotel facility at Maloata. This proposal indicates the general intention of the landowner. However, the denial of this earlier application is expected to prompt the Gurr family to resubmit a future application for a significantly smaller resort facility.
Maloata, Page 3-12
It is anticipated that the future lodge will accommodate not more than 80 guest rooms. Guests will be transported to and from the hotel via vans since limited area is available to support vehicular parking. Key personnel and some other operations personnel associated with the hotel will reside at Maloata. It is expected that the hotel will be developed between 2001 and 2005.
Industrial The development of any industrial activity would no complement the anticipated hotel complex. The existing landowner and/or potential hotel investors would not be expected to permit any industrial uses on developable lands adjacent to the anticipated hotel site. Public Facilities Population characteristics for Maloata in 1990 suggest that approximately 13 percent of the village population is three and four years of age. Elementary school-aged children (5 and 13 years old) include about 25 percent of the village population; high school students represented about 13 percent of the population. The application of 1990 population characteristics to the anticipated 2015 village population suggest increased student enrollments in future early childhood, elementary education, and high school programs outside of Maloata. Anticipated student enrollments from the village population are expected to be as follows in the year 2015:
• early childhood education 10 students • elementary school 19 students • high school 10 students Impact of Future Population Growth Upon Water Consumption and Waste Generation The significance of future population growth to watershed management will be an increased generation of wastewater and solid wastes, as well as increased consumer demands for potable water. Potable water demands will eventually prompt requirements for filtering and disinfection in order to provide a quality water supply to new residents and visitors. Increased wastewater generation will increase the potential contamination of nearshore waters unless steps are taken by the Gurr family to provide some form of secondary treatment. In 1995, average daily wastewater generation in Maloata was about 1,231 gallons per day. By the year 2015, wastewater generation is expected to increase to approximately 7,391 gallons per day (ASPA, 1996). In terms of potable water demand, average day demand is estimated to increase from approximately 1,758 gallons per day (gpd) in 1995 to 10,559 gpd in the year 2015. Flood Potential A flood insurance study of American Samoa and related flood insurance rate maps were published by the U.S. Federal Emergency Management Agency (FEMA) in 1991. The study evaluated selected geographical locations throughout the Territory. Hydrologic and hydraulic analyses presented in the study were made by the U.S. Army Corps of Engineers, Pacific Ocean Division. However, no analysis was made of Maloata Stream. Frequent flooding is known to occur along where it crosses Maloata Stream. A “Texas culvert” was developed at this location by the ASG Department of Public Works. The culvert permits surface stream flows to flow over the roadway and continue downstream. A small v-shaped channel,

Maloata, Page 3-13
combined with a sloped roadway surface, permits water to flow in this manner. This approach to stormwater drainage was apparently made to reduce the costs that otherwise would have been incurred through the installation of larger culverts underneath the primary roadway (Nelson, 1996). Inland Flood Potential The flood insurance rate map for the west coast of Tutuila indicates the entire Maloata watershed has been designated by FEMA as “zone x”. This designation indicates that the area is outside of the 100-year floodplain (Federal Emergency Management Agency, 1991). In essence, FEMA is suggesting that the flood hazard potential in this watershed is limited. Coastal Flood Hazard The flood insurance rate map for the shoreline of the Maloata watershed indicates that there is a coastal flood hazard along the shoreline of the watershed. A potential 100-year flood is anticipated to generate flood levels approximately three feet above mean sea level (MSL) in these areas. Stormwater Runoff/Sedimentation and the Relationship to Surface Water Quality Rainfall, steeper inland slopes, and more erosive soils in the watershed regularly contribute to the periodic transport of sediments into Maloata Stream. Ultimately, this natural sedimentation process eventually carries a portion of these sediments and other organic material into Maloata Bay. The relatively undeveloped Maloata watershed provides an instructive lesson concerning watersheds in American Samoa. It teaches us that the natural erosion and sedimentation process is a significant contributor to nearshore water pollution in American Samoa. While natural sedimentation is a primary contributor of sedimentation, there is no question that the construction of ASG’s primary shoreline roadway has helped increased the amount of erosion in the Maloata watershed. Man-made cuts made between the 200 and 400-foot elevation were made by the American Samoa Government to construct this roadway. Surface runoff carries soil-laden water on the soils that characterize the steeper slopes upslope of the primary roadway. When saturated, upslope soils above the primary roadway will often subside because natural sediment deposition processes typically transport soil material in a manner that restores original topographic slope. In essence, the existing cuts into the slope generate frequent landslides following heavier rainfall periods. Evidence of this process is demonstrated by the occasional presence of soil material on the primary roadway surface after heavier rains. Agricultural activities in the Malaota watershed produce little sedimentation because:
• only limited lands have been cleared and devoted to plantation activity; and, • the Gurr family uses some best management practices in its faatoaga areas. The use of desirable management practices were observed in a banana faatoaga that is situated seaward of the primary roadway between the 25 and 50-foot elevation. Trimmed banana leaves and other organic material are intentionally left on the ground in this faatoaga to help deter potential soil erosion and the potential loss of nutrients in the soil. Further, the faatoaga is situated in a small depression and bermed along the banks of the Maloata Stream to further reduce any potential erosion. Urban runoff within the watershed is extremely limited because only a few homes and are located within the Territory’s only privately-owned watershed. Consequently, little to no impact is generated upon by the few impermeable surfaces, e.g., metal building roofs, that are found in the watershed.

Maloata, Page 3-14
Nearshore Water Quality and the Marine Environment Natural sedimentation generated from heavier rainfall events, erosive upland slopes, and related landslides periodically discharge a significant volume of sediment and other contaminants in the nearshore waters of Maloata Bay. Since coral communities are significantly dependent upon the availability of light and related photosynthesis, occasional periods of significant turbidity within Maloata Bay do not promote long-term coral nutrition, growth, reproduction, and depth distribution (Richmond, 1993). When corals fertilize, they are free-swimming. Consequently, they need a good location to settle and make a good attachment. With significant soil deposition, sediments can physically interfere with the recruitment of coral larvae (Richmond, 1993; Dashbach, 1996). Coral communities are an important component of the overall ecology of Maloata Bay. They provide shelter to fish, invertebrates, and other marine organisms, as well a supplemental food source for the Gurr family. In addition, the fringing reef margin provides some physical protection from occasional storm waves. The coral reef dissipates the amount of wave energy that otherwise would enter this embayment if the fringing reef was not present. Groundwater and Surface Supplies No monitoring of the surface supply is being made by the Gurr family or the American Samoa Environmental Protection Agency. While the Gurr family has not encountered any symptoms of water-borne diseases, it is recommended that ASEPA collect and analyze quarterly bacteriological samples from this surface supply. MANAGEMENT NEEDS AND RECOMMENDATIONS The primary focus of future resource management in the Maloata watershed will be to: • learn more about the dynamics of natural sedimentation within the watershed. The relatively undeveloped condition of this watershed lends itself to future research into the dynamics of natural sedimentation and its impact upon downstream surface water quality. Knowledgeable members of the Gurr family also afford an opportunity to obtain important land use information that will be extremely useful for long-term monitoring and understanding of American Samoa’s watersheds. Representatives of participating public agencies should make periodic visits to the watershed to observe, document, and monitor selected resource conditions, determine potential methods of correcting a potential hazard or undesirable conditions, share potential solutions with a designated Gurr family resident, and encourage their participation in the implementation of resource management solutions. The scope of issues that should be addressed by each agency in the field is summarized in Table 3-3. The general focus of recommended technical assistance is also identified. The experience and insights of agency representatives would determine the specific methodology to be used in the field.
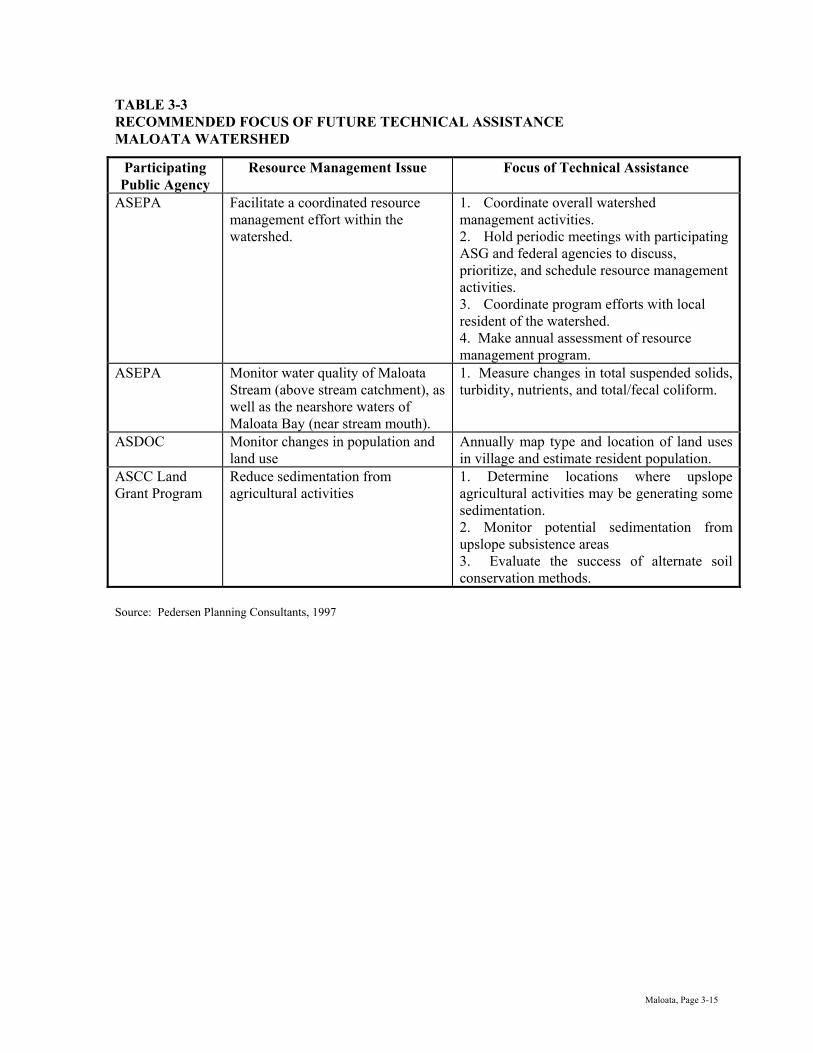
Maloata, Page 3-15
TABLE 3-3 RECOMMENDED FOCUS OF FUTURE TECHNICAL ASSISTANCE MALOATA WATERSHED
Participating Public Agency
Resource Management Issue Focus of Technical Assistance
ASEPA Facilitate a coordinated resource management effort within the watershed.
1. Coordinate overall watershed management activities. 2. Hold periodic meetings with participating ASG and federal agencies to discuss, prioritize, and schedule resource management activities. 3. Coordinate program efforts with local resident of the watershed. 4. Make annual assessment of resource management program.
ASEPA Monitor water quality of Maloata Stream (above stream catchment), as well as the nearshore waters of Maloata Bay (near stream mouth).
1. Measure changes in total suspended solids, turbidity, nutrients, and total/fecal coliform.
ASDOC Monitor changes in population and land use
Annually map type and location of land uses in village and estimate resident population.
ASCC Land Grant Program
Reduce sedimentation from agricultural activities
1. Determine locations where upslope agricultural activities may be generating some sedimentation. 2. Monitor potential sedimentation from upslope subsistence areas 3. Evaluate the success of alternate soil conservation methods.
Source: Pedersen Planning Consultants, 1997

Fagamalo, Page 4-1
FAGAMALO Watershed 04 GEOGRAPHY The Fagamalo watershed is situated along the northwest coast of the Island of Tutuila. The watershed extends approximately 1.3 miles along the shoreline between Square Head point and Niutulua Points. The upper slopes of the watershed are enclosed by the mountain ridges known as Tuatafa, Manunu Ridge, and Taufanua (Figure 4-1). The watershed encompasses approximately 0.8 square mile of land area. RESOURCES OF THE WATERSHED Soils The U.S. Soil Conservation Service (National Resource Conservation Service) published a Soil Survey of American Samoa in 1984. Selected information derived from this survey provides some useful information for future watershed planning and management (Figure 4-2). Four different soil classifications were identified by the U.S. Soil Conservation Service for lands within the Fagamalo watershed (Table 4-1). TABLE 4-1 SELECTED SOIL CHARACTERISTICS FAGAMALO WATERSHED Soil Depth To: Land Use Suitability
SCS Soil Unit
Name Typical Slope
(Percent)
Flood Runoff Erosion High Water (Feet)
Bed Rock
(Inches)
Soil Based WW
Treatment
Subsistence Ag
Potential
2 Aua very stony silty clay loam
30-60 None Rapid Severe >6 >60 Severe Slope Poor
3 Fagasa-Ofu silty clays
30-60 None Med to Rapid
Mod to Severe
>6 20-40 Severe Slope Depth
Moderate
4 Fagasa family-Lithic Hapludolls-Rock outcrop assoc.
70-130 None Very Rapid
Very Severe
>6 20-60 Severe Slope Depth
Limited
20 Oloava silty clay loam
12-25 None Slow to Med
Slight to Mod
>6 >60 Severe Filter Slope
Good
Source: U.S. Soil Conservation Service, 1984 Aua Very Stony Silty Clay Loam (30 to 60 percent slopes) In the vicinity of Fagamalo Village and the adjoining faatoaga areas upslope of the Village, soils were generally classified as Aua very stony silty clay loam (SCS mapping unit 2). This area generally includes the Matavai Stream drainage between the shoreline and the 500-foot elevation. The Aua soils range between seven to 60 inches in depth. With its clay content, the permeability of these soils is moderately rapid. For watershed management purposes, it is important to note that these Aua soils have a moderate susceptibility to sheet and rill erosion. The U.S. Soil Conservation Service estimates that this soil can annually sustain up to 5 tons per acre of erosion without impacting crop
< INSERT FIGURE 4-1 >
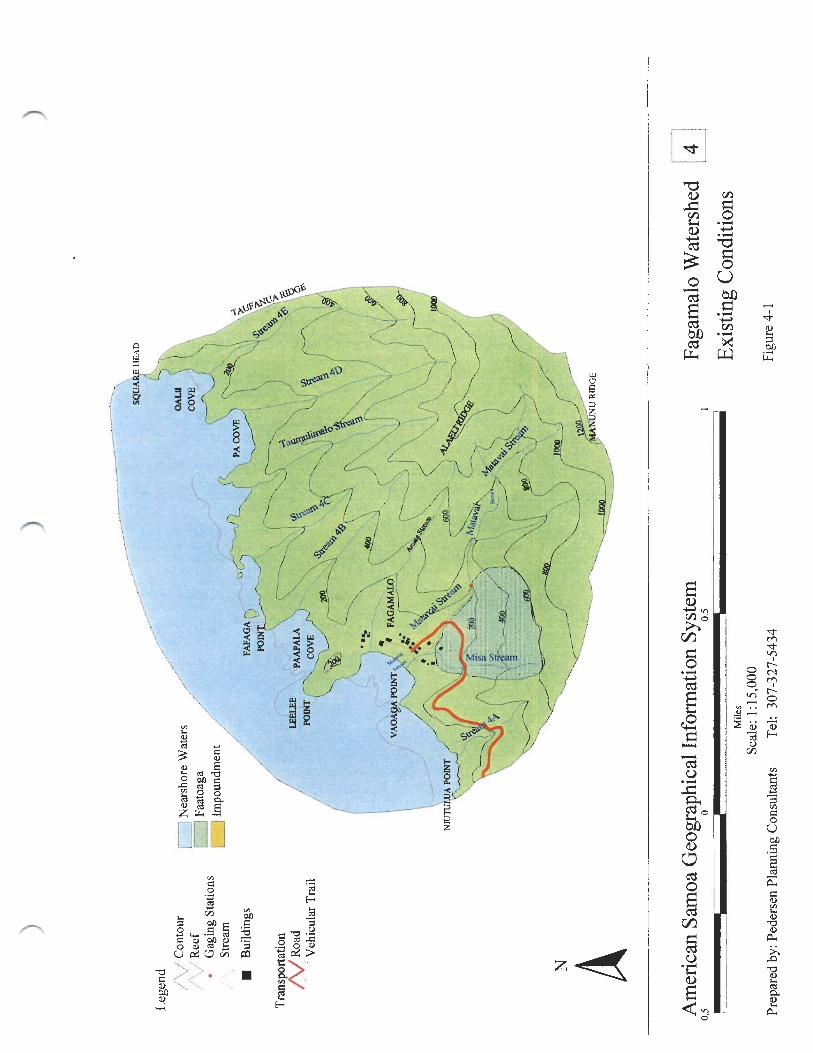


Fagamalo, Page 4-4
productivity (U.S. Soil Conservation Service, 1984). While the erosive characteristics of this soil generally may not significantly impact subsistence crop productivity, the erosive quality of the soil can be a significant contributor to sedimentation in downslope streams and the nearshore waters. Within the inhabited village area, the general characteristics of Aua soils are also undesirable for individual wastewater disposal systems (U.S. Soil Conservation Service, 1984) The soils contain a significant amount of larger stones that hamper installation and adequate soil treatment. If inadequate treatment occurs in these soils, effluent discharges from septic tanks in Fagamalo Village could impact the water quality of stream bodies that flow through the Village. As more septic tank installations occur, the significance of potential stream contamination grows. Fagasa-Ofu Silty Clays A limited part of the upper Fagamalo watershed, between the 700 and 1,100-foot elevation, contains some Fagasa-Ofu Silty Clays (SCS mapping unit 3). The soil ranges between 20 to 40-inches in depth. The permeability of this silty clay loam is moderately rapid (2 to 6 inches per hour). The potential for surface runoff from these soils is considered moderate to rapid. However, the potential for erosion is moderate to severe. The U.S. Soil Conservation Service indicates that this soil type is somewhat suitable for the production of subsistence crops. The soil can annually sustain from one to 5 tons per acre of erosion without impacting crop productivity. However, the Soil Conservation Service recommends the use of mulch, crop residues, and cross-slope farming to reduce the potential for soil erosion. The portion of the upper watershed that contains these soils drains into the upper branch of Matavai Stream. Consequently, potential soil erosion from this area can impact downstream water quality. Fagasa Family-Lithic Hapludolls-Rock Outcrop Association Adjoining land areas throughout the remaining watershed contain deep, well-drained soils on steep mountain ridges and slopes. The U.S. Soil Conservation Service identifies these soils as part of the Fagasa family-Lithic Hapludolls-Rock outcrop association (SCS mapping unit 4). This soil type is common and characterizes most of the steep, upland slopes along Tutuila’s north and west coast. Since this soil type is a combination of two general soil classifications, soil depths can vary between 20 and 60 inches. The soil represents a combination of silty clay and loam. Since the Fagasa Family-Lithic Hapludolls soil typically occurs on very steep slopes, the potential for surface runoff and erosion are high. The cultivation of subsistence crops on these soils is not considered desirable. However, when cultivation in these soils is necessary, care should be exercised to minimize the amount of exposed soil in cultivated areas. When heavier rainfall events occur in this watershed, a significant contribution of soil erosion can be expected from upslope areas of the watershed that contain this soil type. Such erosion can readily influence downstream water quality. The occurrence of these soils typically on steeper slopes carries soil-laden runoff to downslope drainage courses and streams. Oloava Silty Clay Loam (12 to 25 Percent Slopes) Oloava Silty Clay Loam (SCS mapping unit 20) soils are located upslope of Matavai Stream near the 1,200-foot contour. These soils are found along portions of the central mountain plateau of West Tutuila. In a typical cross section, this soil is very deep, well-drained, and extends up to 60 inches in depth. The surface is a dark-brown, silty clay loam. Soft, weathered cinders are typically present between 12

Fagamalo, Page 4-5
to 40 inches in depth. However, the depth to weathered cinders sometimes extends to 60 inches or more. The permeability of the Oloava soil is moderately rapid, i.e., 2 to 6 inches per hour, through the surface layer. However, permeability becomes very rapid, i.e., 6 to 20 inches per hour, through the cinder material that occurs between 12 to 60 inches in depth (U.S. Soil Conservation Service, 1984). The rate of stormwater runoff through these Oloava soils is typically slow. The potential for water erosion is considered slight (U.S. Soil Conservation Service, 1984). This soil is well-suited to the production of subsistence crops. The U.S. Soil Conservation Service estimates that this soil can annually sustain up to two tons per acre of erosion without impacting crop productivity (U.S. Soil Conservation Service, 1984). The limited erosion potential exhibited by these soils can be minimized through the use of mulches, hedgerow planting, crop residues, and other ground covers. Residential development is not desirable on these soils. Site development can expose the highly permeable cinder layer and contaminate local groundwater supplies. The use of onsite wastewater disposal systems can also contaminate ground water because soil-based treatment would typically be too rapid for adequate treatment. Streams Stream Locations The Fagamalo watershed includes eight streams. These stream courses include:
• Matavai Stream and its tributary (Misa Stream); • Amate Stream; • Taumulimalo Stream; and, • five unnamed streams (Streams 4A through 4E).
Matavai Stream begins near the 1,100-foot contour. This drains surface runoff from the steeper slopes downslope of Manunu Ridge, Alaeli Ridge, and Tuatafa Ridge. Matavai Stream merges with Misa Stream, which transports a portion of runoff from Tuatafa Ridge, at approximately 35 feet above mean sea level. The shoreline discharge of Matavai Stream occurs on the south side of the embayment that fronts Fagamalo Village. Amate Stream originates just below the 800-foot elevation. This stream transports drainage from the south side of Alaeli Ridge. Its shoreline discharge occurs on the north side of Fagamalo Village. The headwaters of Taumulimalo Stream are situated near the 720-foot contour. This stream courses descends down steeper slopes of the watershed to its shoreline discharge west of Pa Cove. The five unnamed streams in the Fagamalo watershed are situated northeast and south of the inhabited Fagamalo Village area. These stream courses are relatively short and unbranched. The streams generally flow through a steep ravine and empty into one of several small coves along the coast, e.g., Oalii, Pa, and Paapala . It is believed that these streams each provide intermittent discharges to the nearshore waters.

Fagamalo, Page 4-6
Stream Flows Within the Watershed Matavai Stream is the only stream that flows throughout the year and ultimately discharges all flows into the nearshore waters of Fagamalo Bay (Loa, 1996). Between 1959 and 1974, a low-flow, partial-record station (No. 16924000) was located on Matavai Stream, approximately 0.3 mile upstream from the mouth. This station provided eight measurements of stream flow. The U.S. Geological Survey used these stream flow records to estimate a median flow of 0.61 cubic feet per second at this stream location (Wong, 1996). Misa Stream, a tributary to Matavai Stream, is characterized by intermittent flow. Amate Stream also flows intermittently, but storm flows occasionally discharge into the ocean (Loa, 1996). Taumulimalo Stream and the five unnamed streams (4A through 4E) likely flow intermittently. Aquatic Fishes and Invertebrates Field surveys of fishes and invertebrates were made by the U.S. Fish and Wildlife Service, Division of Ecological Services, in March-April, 1978 and the U.S. Army Corps of Engineers in August, 1980. Matavai Stream, Amate Stream, and Taumulimalo Stream were three of 37 streams in American Samoa that were inventoried by representatives of these federal agencies. Results from both field surveys were summarized in an American Samoa Stream Inventory that was published by the U.S. Army Corps of Engineers, Honolulu District, in July, 1981. Matavai Stream was surveyed in a stony riffle (station 18a) located about 50 feet from the shoreline. Amate Stream was surveyed approximately 50 feet upstream of the shoreline on a shallow riffle (station 19a). A visual survey was made above a terminal waterfall near the stream’s point of shoreline discharge (station 35a). Two species of gobie fish were observed along Matavai Stream (station 18a). A common abundance of eels were also documented. Six species of shrimp were common at station 18a; two of the shrimp species were abundant. Two species of mollusks were also observed along Matavai Stream. Along Amate Stream, only one gobie fish specie was documented (station 19a). Eels were more prevalent. Four species of shrimp were occasional or common in abundance. Only one specie of mollusk was observed which was common in abundance. No vertebrate or invertebrate species were documented near the terminus of Taumulimalo Stream (station 35a). Surface Water Quality No surface water quality data is known to be available for streams in the Fagamalo watershed or the adjoining nearshore waters. Wetlands No wetlands are believed to be located in the Fagamalo watershed. Marine Resources Coral Communities A fringing inner reef community extends approximately 100 feet seaward of the Fagamalo Village shoreline.
Fagamalo, Page 4-7
The coral communities in Fagamalo were surveyed and documented in, at least, 1979, 1992, and 1994-1995. While different marine biologists made these field investigations, a general comparison of available data indicates that the amount of coral coverage on the reef flat has probably declined considerably. 1978-1979
In 1979, a 5 to10 percent coral coverage was documented on Fagamalo’s inner reef flat by Aecos and Aquatic Farms biologists. On the middle reef, coverage approached 25 percent, but decreased to five percent on the outer reef flat (Aecos and Aquatic Farms, 1980). 1992
In 1992, Maragos, Hunter, and Meier surveyed the reef front seaward of Fagamalo Village. Biologists observed less than one percent coral coverage in shallow nearshore waters (about 6 meters in depth), as well as deeper waters at about 18 meters (Maragos, Hunter, and Meier, 1994). 1995
The 1995 study of various coral reefs throughout the Samoan Archipelago included, in part, some onsite investigations of the fringing reef front on the east side of the bay that fronts Fagamalo Village. The study focused primarily upon the quantification of reef fish diversity and selected habitat characteristics. Data obtained from field surveys, which were conducted in this area between November, 1994 and November, 1995, indicate that the existing fringing reef has a low coral cover (less than 20 percent). The number of species observed was equal or greater than 150 species; this diversity was considered “high” in comparison with other selected sites in American and Western Samoa. Fish density ranged between 5,000 and 9,999 individuals per ha; fish biomass ranged between 500 and 999 kilograms per ha.
Wildlife Resources Forest Birds A 1986 Survey of the Forest Birds of American Samoa recorded the number of birds observed on the islands of Tutuila, Ofu, Olosega, and Tau, during 8-minute counts in July, 1986 (Table 4-2).
Shoreline Protection The fringing reef margin provides some physical protection from occasional storm waves. The coral reef dissipates some of the wave energy that otherwise would approach the shoreline if the fringing reef was not present. In March, 1994, Sea Engineering, Inc. and Belt Collins Hawaii published a shoreline inventory report that outlined, in part, ongoing shoreline erosion conditions and related shore protection needs for American Samoa. However, the shoreline that fronts Fagamalo Village was not surveyed by Sea Engineering, Inc. and Belt Collins Hawaii.

Fagamalo, Page 4-8
TABLE 4-2 FOREST BIRD SURVEY RESULTS NATIVE FOREST AND NON-FOREST BIRDS JULY, 1986
Species Tutuila Ofu Olosega Tau Total Tahiti Petrel 0 - - 1 1White-tailed Tropicbird 154 11 27 234 426Red-footed Booby 22 - - - 22Great Frigatebird 1 - - - 1Reef Heron 1 0 0 0 1Red Junglefowl 527 17 0 26 570Banded Rail 163 22 16 75 276Spotless Crake - - - 1 1Purple Swamphen 10 4 0 15 29Blue-gray Noddy 1 0 0 0 1Brown Noddy 65 1 0 359 425Black Noddy 0 11 0 5 16White Tern 331 88 17 60 496Many-colored Fruit Dove 10 0 0 2 12Purple-capped Fruit Dove 3,107 104 33 1,176 4,420Pacific Pigeon 207 15 8 282 512Blue-crowned Lory - 65 79 533 677Common Barn Owl 2 0 0 0 2White-rumped Swiftlet 441 348 13 284 1,086Collared Kingfisher 136 43 14 95 288Red-vented Bulbul 95 - - - 95Fiji Shrikebill - 1 9 93 103Wattled Honeyeater 3,748 875 457 2,779 7,859Cardinal Honeyeater 621 - - - 621Polynesian Starling 296 41 3 146 486Samoan Starling 1,647 253 91 929 2,920Total Birds Recorded 11,585 1,899 767 7,095 21,346Notes: A dash (-) indicates the species is not resident on the island surveyed.
Source: Engbring and Ramsey, 1989 Groundwater and Surface Water Supplies Groundwater Supply and Quality There are no groundwater wells in the watershed. Surface Water Supply and Quality Fagamalo Village presently relies upon surface water supplies from Matavai Stream. The stream catchment is generally located upslope of the stream on the mauga side of primary shoreline roadway. The water quality of the village water system is monitored by ASEPA on a monthly basis. Available laboratory results for the 1993-1995 period indicate that this surface supply contains some bacterial contamination. For example, monthly monitoring records for FY 1995 indicate average fecal coliform levels of greater than 60 colonies per 100 milliliters and greater than 80 colonies of total coliform.

Fagamalo, Page 4-9
Turbidity levels are generally less than 5 NUT. However, the monthly maximum was 24.5 NTU for the October, 1993-July, 1994 period (ASEPA, 1994). One of at least three piggeries dispersed throughout the village may be causing some contamination of Matavai Stream, Amate, and Misa Streams. The input of bacteria and nutrients into Matavai Stream should continue to be an ongoing consideration of ASEPA and the ASG Department of Health since Fagamalo Village is dependent upon this surface water source for a potable water supply. In addition, a portion of the fresh water in all three streams recharges to Tutuila’s groundwater supply. Proposed Water System Improvements ASPA’s draft Utility Master Plan calls for the development and installation of:
• two new groundwater wells that would ultimately produce a supply of, at least, 16 gallons per minute;
• disinfection at each of the proposed groundwater wells; • a new 50,000 gallon water storage tank; • approximately 300 feet of 4-inch PVC transmission main from the new wells to the new water
tank, or to distribution; • a fire protection/distribution system that will consist of a 6-inch tank discharge line from the tank
to the village shoreline road, a 6-inch fire protection main along the shoreline road, and a new 2 inch distribution system;
• three fire hydrants; as well as, • service laterals and meters. Such improvements will virtually eliminate potential health hazards that can be realized through the use of contaminated surface water supplies. ASPA plans to locate the future groundwater wells north and south of the primary shoreline roadway, as well as upslope of areas that are anticipated for future residential expansion (Figure 4-3). Since the use of cesspools and septic systems for household wastewater disposal is expected to continue in the long term, the contamination of future groundwater supplies would be remote as long as planned wells are located upslope of future residential development. USE OF THE WATERSHED Resident Population In 1990, approximately 92 persons resided in Fagamalo Village, an increase from the 1980 population of 68 residents. Such growth represented an annual growth rate of about 3.53 percent. Informal discussions with High Chief Loa in April, 1996 suggest that the present population of the village is 96 people. Such an increase suggests only limited population growth.. Informal discussions with High Chief Loa in April, 1996 provide considerable insight to population growth that was experienced by Fagamalo Village between 1990 and 1995. High Chief Loa indicates that substantial population growth occurred in Fagamalo between 1990 and 1995. However, a significant decline in population occurred in 1996 because many younger residents apparently left Fagamalo to pursue employment and education opportunities outside of American Samoa.


Fagamalo, Page 4-11
Land Uses Residential The lands of Fagamalo village are used almost exclusively for residential purposes. Existing land uses were primarily residential. In 1995, an estimated 14 homes were located in Fagamalo. Agriculture A 1996 survey of piggeries by the ASG Department of Agriculture indicates that there are two piggeries in the village; the combined pig population is about 13 pigs. One of the piggeries is situated close to Matavai Stream. Faatoaga are situated on steeper slopes that are south and upslope of Fagamalo Village. The faatoaga consist primarily of coconut, breadfruit, and banana production. Commercial In 1995, the only commercial enterprise in Fagamalo was one locally-owned bus company. Industrial In 1995, no light industrial operations were based in Fagamalo. Public Facilities The ASG Department of Education offers an early childhood education program in Fagamalo. This program provided educational opportunities for six younger children in September, 1994.
Elementary school-aged children attend Taputapu Elementary School in Poloa. High school students, however, are bussed to Leone High School in Leone. Community Facilities One local church was situated along the north side of the village adjacent to Amate Stream. Use of the Nearshore Waters Nearshore Fishing An American Samoa Subsistence Fishing Survey was conducted by the University of Hawaii Sea Grant Program in the summer of 1992. This survey involved onsite interviews with shoreline users who were participating in fishing activities on selected days during that period. The results of the survey revealed, in part, that there is some use of the nearshore waters in Fagamalo. Some 12 to 15 people were documented fishing. Fishing methods that were observed included gleaning, pole, rod and reel, spear, as well as hand and line from a ppaaooppaaoo.. IInn AApprriill,, 11999966,, CChhiieeff LLooaa rreeppoorrtteedd tthhaatt aabboouutt ffiivvee ppeerrssoonnss iinn tthhee vviillllaaggee rreegguullaarrllyy uussee tthhee nneeaarrsshhoorree wwaatteerrss ffoorr ffiisshhiinngg ppuurrppoosseess.. Bathing and General Water Recreation Most all residents in Fagamalo Village use the nearshore waters for bathing and general water recreation (Loa, 1996). RESOURCE MANAGEMENT ISSUES

Fagamalo, Page 4-12
Future Land Uses to the Year 2015 Residential During the 1996-2015 period, a considerable increase in resident population is expected. By the year 2015, the future population of Fagamalo is anticipated to rise to about 248 persons (American Samoa Power Authority, 1996). Fagamalo is expected to remain as one of the more remote village communities on the Island of Tutuila. Residential uses will likely predominate future land uses since Fagamalo is distant from other Tutuila communities. It is anticipated that the beautiful, remote setting of Fagamalo will gradually attract increased in-migration from Hawaii, the continental United States, and other international areas until the availability of developable residential land is depleted (ASPA, 1996). Residents will primarily seek cash employment outside of this village. Secondarily, future residents can also be expected to rely somewhat upon marine resources that can be harvested from the nearshore waters, or subsistence foods that can be cultivated in the faatoaga areas of this watershed. Pedersen Planning Consultants forecasts that future residential expansion in Fagamalo will eventually include a total of about 26 housing units in the year 2015. New home construction is anticipated within and immediately mauga of the existing shoreline community. An additional house site is also expected between the 75 and 100-foot elevation (ASPA, 1996). Agriculture A greater resident population will likely sustain the present level of subsistence agriculture in the watershed even though the per capita consumption is expected to decline. Commercial Future commercial facility expansion in Fagamalo is not anticipated. Other consumer shopping will continue to occur outside of the village where greater commercial facilities and services are available. At the same time, the anticipated increase in resident population will encourage the establishment of various home-based occupations. These enterprises will likely include one village grocery/retail store. Industrial The gradual increase in resident population is not expected to attract any small, home-based enterprise of an industrial nature because of the limited demand for such services. Consequently, the construction of new industrial facilities is not anticipated. Public Facilities Population characteristics for Fagamalo in 1990 suggest that approximately five percent of the village population is three and four years of age. Elementary school-aged children (5 and 13 years old) include about 25 percent of the village population; high school students represented about 11 percent of the population. The application of 1990 population characteristics to the anticipated 2015 village population suggest increased student enrollments in future early childhood, elementary education, and high school programs within and outside of Fagamalo. Anticipated student enrollments from the village population are expected to be as follows in the year 2015: • early childhood education 12 students • elementary school 62 students • high school 27 students

Fagamalo, Page 4-13
Impact of Future Population Upon Water Consumption and Waste Generation The significance of future population growth to watershed management will be an increased generation of wastewater and solid wastes. In 1995, average daily wastewater generation in Fagamalo Village was about 7,279 gallons per day. By the year 2015, wastewater generation by a more populated Fagamalo Village is expected to increase to approximately 14,003 gallons per day (ASPA, 1996). The consumption of potable water will also increase with a growing population. The American Samoa Power Authority (ASPA) estimates that the average day demand for water in Fagamalo was about 10,398 gallons in 1995. By the year 2015, ASPA anticipates that the average demand will increase to roughly 20,004 gpd. Flood Potential A flood insurance study of American Samoa and related flood insurance rate maps were published by the U.S. Federal Emergency Management Agency (FEMA) in 1991. The study evaluated selected geographical locations throughout the Territory. Hydrologic and hydraulic analyses that were presented in the study were made by the U.S. Army Corps of Engineers, Pacific Ocean Division. However, a more detailed analysis was made of Matavai Stream and Misa Stream in the Fagamalo watershed. Inland Flood Potential The Federal Emergency Management Agency (FEMA) calculated the size of drainage areas and estimated 100-year peak discharges for two streams in the Fagamalo watershed (Table 4-3):
TABLE 4-3 ANTICIPATED 100-YEAR PEAK DISCHARGES SELECTED STREAMS IN THE FAGAMALO WATERSHED
Flooding Source and Location Drainage Area
(Square Miles)
100-Year Peak Discharge
{cubic feet per second (cfs)}
Matavai Stream At mouth
Above confluence with Misa Stream
0.25 0.21
740630
Misa Stream Above confluence with Matavai Stream
0.05 160
Source: Federal Emergency Management Agency (FEMA), 1991 The inland flood potential that would be generated from a 100-year flood would generally impact the lower reaches of Matavai Stream and Misa Stream which are located on the south end of Fagamalo Village. About five homes could be affected in this area. Misa Stream also flows through a larger faatoaga that extends between the 35 and 600-foot contour. Significant accumulations of organic material were observed along lower portions of Matavai and Misa Stream during the April, 1996 field survey. It is believed that this organic material represents fallen trees and other material that eroded during earlier periods of heavier rainfall, as well as organic material that may have been discarded from upslope plantations. A short and long-term management requirement is the periodic removal of this material from stream courses in the inhabited village area.

Fagamalo, Page 4-14
Otherwise, accumulations of some larger organic material can reduce the discharge capacity of local streams and cause unnecessary flooding. The remaining areas of the watershed have been designated by FEMA as “zone x”. This designation indicates that these areas are outside of the 100-year floodplain (Federal Emergency Management Agency, 1991). In essence, FEMA is suggesting that the flood hazard potential in these areas are limited. In the long-term, the anticipated number of housing units in Fagamalo will almost double the existing housing stock by the year 2015. Such development will increase the amount of impermeable surfaces within the Village. Surface runoff in the inhabited village area will increase and may increase the flood potential on the south side of Fagamalo Village. Consequently, the future development of residential and commercial facilities should be discouraged within the 100-year flood plain area along Matavai Stream and Misa Stream. Coastal Flood Hazard The flood insurance rate map for the shoreline of the Fagamalo watershed indicates that there is a coastal flood hazard along the shoreline of the watershed. A potential 100-year flood is anticipated to generate flood levels approximately three feet above mean sea level (MSL) in these areas. Stormwater Runoff/Sedimentation and the Relationship to Surface Water Quality Rainfall, steeper inland slopes, and more erosive soils in the watershed regularly contribute to the periodic transport of turbid waters into Fagamalo Bay. It is suspected that this natural sedimentation process primarily occurs via the perennial flows of Matavai Stream. Almost all of the soils in the watershed have a severe potential for erosion. Significant sedimentation is also believed to be generated somewhat from faatoaga areas that are situated upslope of Fagamalo Village. The primary plantation area is located on the south side of Fagamalo Village between the 35 and 600-foot contour. Highly erosive soils also occur within the plantation area. Misa Stream probably carries most of the sediments from upslope plantation areas into Matavai Stream. ASG Land Grant personnel should provide technical assistance to local residents working in the faatoaga to encourage the use of appropriate soil conservation methods. Other streams in the watershed may receive some limited sedimentation from faatoaga that are situated near the top of Alaeli Ridge. Otherwise, these streams flow through undeveloped drainage areas that also contain highly erosive soils. Impermeable building roofs and paved surfaces generate sheet flow within the inhabited village area. Ultimately, frequent runoff from these sources regularly discharge sediments, solid waste materials, and other domestic garbage into Matavai, Amate, and Misa streams. The detention of stormwater runoff from local stream is very desirable, but generally unfeasible because of a limited coastal plain in the Fagamalo Village area. It is recommended that drywells be encouraged in conjunction with all new residential and commercial construction to enable some

Fagamalo, Page 4-15
detention and recharge of stormwater flows. The spreading of coral rubble around the perimeter of future homes should also be encouraged to afford some limited percolation of stormwater runoff. In contrast, impermeable, concrete surfaces should be discouraged as they only increase the volume of runoff from the inhabited village area. Nearshore Water Quality and the Marine Environment The cumulative impact of natural sedimentation, upslope agricultural activities, heavier rainfall events, and general urban runoff can potentially discharge a significant volume of sediment and other contaminants in the nearshore water that front Fagamalo Village and the adjoining shoreline. Natural berms, comprised of coral fragments and basaltic rubble, were observed by Pedersen Planning Consultants at the mouths of Matavai Stream and Amate Streams on April 17, 1996. Onsite observations indicated that these natural berms were probably formed by current patterns and wave action within the nearshore waters. When present, these berms provide a valuable natural filter for contaminants that are discharged downstream by stormwater and lower perennial flows. Without the berms, a greater volume of contaminants will discharge directly into the nearshore waters of Fagamalo Bay. Despite the presence of natural berms at the mouths of Matavai Stream and Amate Stream, the High Chief of Fagamalo village indicates that a significant sediment plume is usually evident in the nearshore waters after heavier rains, e.g., 4 hours of continued rainfall, occur in the watershed. Consequently, increased sedimentation into the nearshore waters is viewed as an important resource management concern. Coral communities are significantly dependent upon the availability of light and related photosynthesis, and occasional periods of significant turbidity and sedimentation do not promote long-term coral nutrition, growth, reproduction, and depth distribution (Richmond, 1993). When corals fertilize, they are free-swimming. Consequently, they need a good location to settle and make a good attachment. With significant soil deposition, sediments can physically interfere with the recruitment of coral larvae (Richmond, 1993; Dashbach, 1996). Coral communities are an important component of the overall ecology of the nearshore waters that adjoin the Fagamalo watershed. They provide shelter to fish, invertebrates, and other marine organisms, as well as a supplemental food source for Fagamalo residents. Nutrient Inputs A nutrient contribution is also occurring through the continued use of septic tanks, cesspools, or other soil-based, wastewater treatment systems in the watershed. In addition, some of the piggeries in the Village may also discharging nutrient-enriched effluent into local stream. These sources of nutrients are also accompanied by some bacterial contamination from these discharges. While the total volume of wastewater generation from the watershed is limited, the discharges are concentrated in the inhabited village area where housing densities are between two and four housing units per acre. Local soils are generally inadequate to provide effective treatment. The long-term input of turbid and nutrient-enriched waters into the nearshore waters represents an important concern. These inputs are potentially detrimental to the quality because they can adversely change the composition of the nearshore marine environment. However, the degree of impact upon water quality is also highly dependent upon currents and water exchange within the nearshore environment. As the population of the watershed grows, nutrient and bacterial inputs will only increase. Aside from these resource management considerations, the future use of the nearshore waters for fishing,

Fagamalo, Page 4-16
swimming and general recreation will eventually represent a more significant public health concern unless practical steps are made to reduce potential nearshore water contamination. Since Fagamalo will probably never be connected to the ASPA wastewater system, areas within Fagamalo Village that are unsuitable for soil-based, wastewater treatment should be more specifically identified. As recommended in the ASPA Utilities Master Plan, this identification process should be based upon a more detailed sanitation survey of more densely inhabited areas in the shoreline and upland village areas. This survey would evaluate existing wastewater treatment practices, soil characteristics, the location and density of land uses, the distance to surface water supplies and the nearshore waters, topography, and other related factors. Using the conclusions and recommendations associated with this evaluation, ASPA and other participating Project Notification and Review System (PNRS) agencies will be better able to:
• require the use of septic tanks and leachfields that provide a sufficient amount of additional soil-based treatment;
• provide greater technical assistance to building permit applicants; and, if necessary, • deny building applications in land areas that are unsuitable for soil-based treatment systems. Long-Term Monitoring The future monitoring of the nearshore waters is necessary and should be combined with water quality monitoring of Matavai Stream and Amate Stream. Turbidity and sedimentation are the primary stresses to the coral communities in the nearshore waters of these embayments. However, future levels bacterial contamination and nutrient inputs should also be documented to help ensure future public safety and evaluate potential stresses to the fringing coral reef communities. In addition, the ASG Department of Marine and Wildlife Resources should monitor the coral communities along the fringing reef front at least once every three years. Long-term monitoring of this site should also include an evaluation of the impact of sedimentation and turbidity that already influences the nearshore marine environment. Groundwater and Surface Supplies The development of a groundwater supply and related ASPA satellite water system is recommended. In the absence of these improvements, it is recommended that village residents be encouraged to make a greater use of individual roof catchment systems for the collection of rain water for drinking, bathing, food preparation, and laundry purposes. The existing surface supplies could be used for the disposal of wastewater from indoor toilets and general household maintenance. MANAGEMENT NEEDS AND RECOMMENDATIONS The primary focus of future resource management in the Fagamalo watershed should be to:
• develop a groundwater supply for potable water uses in Fagamalo Village; • encourage the use of drywells for all new residential and commercial construction, as well as the
placement of coral rubble around the perimeter of future structures to help reduce the discharge of urban runoff into Matavai Stream;
• encourage the clearing and collection of debris in lower Matavai and Misa Stream drainages to reduce potential flood damages.
• reduce the amount of erosion from plantation areas; and, • install more effective soil-based treatment systems for wastewater disposal to support anticipated
residential development in the upland village area. Representatives of participating public agencies should make periodic visits to the watershed to observe, document, and monitor selected resource conditions, determine potential methods of

Fagamalo, Page 4-17
correcting a potential hazard or undesirable conditions, share potential solutions with designated residents of Fagamalo, and encourage the participation of traditional leaders and village residents in the implementation of resource management solutions. The scope of issues that should be addressed by each agency in the field is summarized in Table 4-4. The general focus of recommended technical assistance is also identified. The experience and insights of agency representatives will determine the specific methodology to be used in the field. TABLE 4-4 RECOMMENDED FOCUS OF FUTURE TECHNICAL ASSISTANCE FAGAMALO WATERSHED
Participating Public Agency
Resource Management Issue
Focus of Technical Assistance
ASEPA Facilitate a coordinated resource management effort within the watershed.
1. Coordinate overall watershed management activities. 2. Hold periodic meetings with participating ASG and federal agencies to discuss, prioritize, and schedule resource management activities. 3. Coordinate program efforts with local traditional leaders and/or designated resident of the watershed. 4. Make annual assessment of resource management program.
ASEPA Monitor water quality of Matavai Stream, Amate Stream, as well as the nearshore waters.
Measure changes in and total/fecal bacteria, total suspended solids, turbidity, and nutrients on a quarterly basis.
ASPA/ASEPA Perform a detailed evaluation of community sanitation problems associated with the use of soil-based treatment systems.
1. Survey inhabited village areas in Fagamalo. 2. Evaluate existing treatment practices, soil characteristics, location and density of land uses, the distance to water supplies and nearshore waters, topography, and other factors. 3. Require use of septic tanks and leachfields that provide sufficient amounts of additional soil-based treatment; or, deny building applications in areas unsuitable for soil-based treatment.
ASPA Develop new groundwater supply in Fagamalo and establish an ASPA satellite water system.
1. Meet with traditional village leaders to consider the development of two new groundwater wells.
2. If desired by village leaders, secure funding for water system design and construction.
3. Design water system improvements. 4. Construct proposed improvements.
Continued – next page

Fagamalo, Page 4-18
TABLE 4-4 (continued) RECOMMENDED FOCUS OF FUTURE TECHNICAL ASSISTANCE FAGAMALO WATERSHED
Participating Public Agency
Resource Management Issue
Focus of Technical Assistance
ASEPA Reduce village exposure to potential waterborne diseases
Encourage greater use of individual water catchment systems until ASPA water improvements are made.
ASEPA Conserve surface water supplies
1. Identify village surface water supplies that are actively used. 2. Revise American Samoa GIS to delineate 100-foot buffers around each surface supply. 3. Restrict land uses within designated buffers.
ASCZM/DOC Detain stormwater runoff in future residential and commercial areas.
Encourage the use of onsite drywells, as well as the spreading of coral rubble around the perimeter of all new residential and commercial facilities in Fagamalo.
DPW Maintain culverts along the primary shoreline roadway
1. Establish a periodic storm culvert maintenance program. Consider use of village labor to supplement DPW heavy equipment. 2. Clean debris and other material blocking culverts.
ASDOC Monitor changes in population and land use
Annually map type and location of land uses in village and estimate resident population.
ASCC Land Grant Program
Reduce sedimentation from agricultural activities
1. Determine locations where upslope agricultural activities may be generating some sedimentation. 2. Encourage soil conservation methods with resident growers of subsistence crops.
ASG Dept. of Marine/Wildlife Resources
Sustain healthy marine communities in nearshore waters
Monitor changes in coral coverage, fish habitat, diversity and other characteristics (used by Green) of the reef front between Vaoaga Point and Leelee Point approximately once every three years.
Source: Pedersen Planning Consultants, 1998

Aoloau Sisifo, Page 5-1
AOLOAU SISIFO Watershed 05 GEOGRAPHY The Aoloau Sisifo (West Aoloau) watershed is a remote, uninhabited drainage basin that is located along Tutuila’s northwest coast (Figure 5-1). The basin encompasses roughly 0.62 square miles of land area. The western boundary of the watershed is Taufanua Ridge. Manunu Ridge, which extends from about the 1,200-foot elevation to Mataututele Point, represents the east and inland boundary of the watershed. Steeper slopes over 40 percent characterize virtually all of the watershed. Along the shoreline, the watershed extends approximately 2.9 miles between Square Head Point and Matautele Point. Two coves, Laloniu and Nuuooti, are separated geographically by Tolotolooleoti Point. RESOURCES OF THE WATERSHED Soils The U.S. Soil Conservation Service (National Resource Conservation Service) published a Soil Survey of American Samoa in 1984. Selected information derived from this survey provides some useful information for future watershed planning and management (Figure 5-2). Three different soil classifications were identified by the U.S. Soil Conservation Service for lands within the Aoloau Sisifo watershed (Table 5-1). TABLE 5-1 SELECTED SOIL CHARACTERISTICS AOLOAU SISIFO WATERSHED
Soil Depth To: Land Use Suitability SCS Soil Unit
Name Typical Slope
(Percent)
Flood Runoff Erosion High Water (Feet)
Bed Rock
(Inches)
Soil Based WW
Treatment
Subsistence Ag
Potential
3 Fagasa-Ofu silty clays
30-60 None Medium to Rapid
Moderate to Severe
>6 20-40 Severe Slope Depth
Moderate
4 Fagasa family-Lithic Hapludolls-Rock outcrop assoc.
70-130 None Very Rapid
Very Severe
>6 20-60 Severe Slope Depth
Limited
20 Oloava silty clay loam
12-25 None Slow to Med
Slight to Mod
>6 >60 Severe Filter Slope
Good
Source: U.S. Soil Conservation Service, 1984 Fagasa-Ofu Silty Clays Along the east flank of Manunu Ridge, portions of the upper watershed (between the 200 and 600-foot elevation, contain some Fagasa-Ofu Silty Clays (SCS mapping unit 3). The soil ranges between 20 to 40-inches in depth. The permeability of this silty clay loam is moderately rapid (2 to 6 inches per hour). The potential for surface runoff from these soils is considered moderate to rapid. However, the potential for erosion is moderate to severe.
< FIGURE 5-1 >


Aoloau Sisifo, Page 5-4
The U.S. Soil Conservation Service indicates that this soil type is somewhat suitable for the production of subsistence crops. The soil can annually sustain from one to 5 tons per acre of erosion without impacting crop productivity. However, the Soil Conservation Service recommends the use of mulch, crop residues, and cross-slope farming to reduce the potential for soil erosion. At the present time, soil erosion via subsistence agriculture is not a potential since this area is uninhabited and generally inaccessible to nearby Fagamalo residents except by boat. The portion of the upper watershed that contains these soils drains into the Stream 5B. Consequently, potential soil erosion from this area can impact downstream water quality. Fagasa Family-Lithic Hapludolls-Rock Outcrop Association Land areas throughout most of the watershed contain deep, well-drained soils on steep mountain ridges and slopes. The U.S. Soil Conservation Service identifies these soils as part of the Fagasa family-Lithic Hapludolls-Rock outcrop association (SCS mapping unit 4). This soil type is common and characterizes most of the steep, upland slopes along Tutuila’s north and west coast. Since this soil type is a combination of two general soil classifications, soil depths can vary between 20 and 60 inches. The soil represents a combination of silty clay and loam. Since the Fagasa Family-Lithic Hapludolls soil typically occurs on very steep slopes, the potential for surface runoff and erosion are high. The cultivation of subsistence crops on these soils is not considered desirable. However, when cultivation in these soils is necessary, care should be exercised to minimize the amount of exposed soil in cultivated areas. When heavier rainfall events occur in this watershed, a significant contribution of soil erosion can be expected from the undeveloped upslope areas of the watershed that contain this soil type. Natural runoff from steeper slopes in the watershed carries water, sediments, and organic debris to the three downslope drainage courses.. Such erosion can readily influence downstream water quality. Oloava Silty Clay Loam (12 to 25 Percent Slopes) Oloava Silty Clay Loam (SCS mapping unit 20) soils are located along the upper slopes of the watershed near the 1,200-foot contour. These soils are found along portions of the central mountain plateau of West Tutuila, as well as Manunu Ridge. In a typical cross section, this soil is very deep, well-drained, and extends up to 60 inches in depth. The surface is a dark-brown, silty clay loam. Soft, weathered cinders are typically present between 12 to 40 inches in depth. However, the depth to weathered cinders sometimes extends to 60 inches or more. The permeability of the Oloava soil is moderately rapid, i.e., 2 to 6 inches per hour, through the surface layer. However, permeability becomes very rapid, i.e., 6 to 20 inches per hour, through the cinder material that occurs between 12 to 60 inches in depth (U.S. Soil Conservation Service, 1984). The rate of stormwater runoff through these Oloava soils is typically slow. The potential for water erosion is considered slight (U.S. Soil Conservation Service, 1984). This soil is well-suited to the production of subsistence crops. The U.S. Soil Conservation Service estimates that this soil can annually sustain up to two tons per acre of erosion without impacting crop productivity (U.S. Soil Conservation Service, 1984). The limited erosion potential exhibited by these soils can be minimized through the use of mulches, hedgerow planting, crop residues, and other ground covers.

Aoloau Sisifo, Page 5-5
Residential development is not desirable on these soils. Site development can expose the highly permeable cinder layer and contaminate local groundwater supplies. The use of onsite wastewater disposal systems can also contaminate ground water because soil-based treatment would typically be too rapid for adequate treatment. Streams The watershed includes Vaiolefuga Stream and two unnamed streams (Streams 5A and 5B). Vaiolefuga Stream drains surface flows from Manunu Ridge. The drainage course is along the east slope of Taufanua Ridge and ultimately discharges into the west side of Nuuooti Cove. Stream 5A, which originates about 800-feet above mean sea level, drains a portion of the surface flows from the east flank of Manunu Ridge. The drainage course is steep; topographic slopes average 40 percent to the shoreline. Stream 5B begins at about the 1,080-foot contour and drains most of the surface flow from Manunu Ridge’s east flank. The stream contains three branches and ultimately discharges into Laloniu Cove. Surface Water Quality There is no surface water quality data available for the streams in the watershed, as well as the nearshore waters that adjoin the watershed. Wetlands No wetlands are located in the Aoloau Sisifo watershed. Marine Resources Coral Communities Since the early 1970’s, several surveys have been made of coral communities at various embayments and nearshore water areas along the coast of Tutuila. No coral surveys have been conducted by the American Samoa Government or other private consultants along the shoreline of the Aoloau Sisifo watershed. Consequently, the general status of coral communities is unknown. Wildlife Resources Bats Fruit bat roosting areas are located along the steep slopes upland of Nuuooti Cove and Tolotolooleoti Point. In FY 1997, the ASG Department of Marine and Wildlife Resources estimated a minimum population of 700 fruit bats at Nuuooti Cove and 300 fruit bats at Tolotolooleoti Point. These estimates were based upon a combination of exit counts, dawn return counts, and/or boat counts in FY 1997 (Utzurrum, 1998). The availability of these wildlife resources, the remote nature of this watershed, and its general inaccessibility lend itself to the establishment of a coastal wildlife sanctuary between Nuuomanu Rock and Tolotolooleoti Point. However, this designation should be discussed with selected traditional leaders of the Island of Tutuila to ensure that the proposed sanctuary will not interfere with any shoreline recreational uses. If not, draft legislation should be forwarded to the Fono for their review, consideration, and adoption. Forest Birds

Aoloau Sisifo, Page 5-6
A 1986 Survey of the Forest Birds of American Samoa recorded the number of birds observed on the islands of Tutuila, Ofu, Olosega, and Tau, during 8-minute counts in July, 1986 (Table 5-2).
TABLE 5-2 FOREST BIRD SURVEY RESULTS NATIVE FOREST AND NON-FOREST BIRDS JULY, 1986
Species Tutuila Ofu Olosega Tau Total Tahiti Petrel 0 - - 1 1White-tailed Tropicbird 154 11 27 234 426Red-footed Booby 22 - - - 22Great Frigatebird 1 - - - 1Reef Heron 1 0 0 0 1Red Junglefowl 527 17 0 26 570Banded Rail 163 22 16 75 276Spotless Crake - - - 1 1Purple Swamphen 10 4 0 15 29Blue-gray Noddy 1 0 0 0 1Brown Noddy 65 1 0 359 425Black Noddy 0 11 0 5 16White Tern 331 88 17 60 496Many-colored Fruit Dove 10 0 0 2 12Purple-capped Fruit Dove 3,107 104 33 1,176 4,420Pacific Pigeon 207 15 8 282 512Blue-crowned Lory - 65 79 533 677Common Barn Owl 2 0 0 0 2White-rumped Swiftlet 441 348 13 284 1,086Collared Kingfisher 136 43 14 95 288Red-vented Bulbul 95 - - - 95Fiji Shrikebill - 1 9 93 103Wattled Honeyeater 3,748 875 457 2,779 7,859Cardinal Honeyeater 621 - - - 621Polynesian Starling 296 41 3 146 486Samoan Starling 1,647 253 91 929 2,920Total Birds Recorded 11,585 1,899 767 7,095 21,346Notes: A dash (-) indicates the species is not resident on the island surveyed.
Source: Engbring and Ramsey, 1989 Shoreline Protection The fringing coral reef in the nearshore waters that adjoin the watershed is limited. Where present, the reef affords some protection to the shoreline as the reef dissipates some incoming wave energy. Groundwater and Surface Water Supplies There are no developed groundwater wells or surface water supplies in the Aoloau Sisifo watershed since the watershed is uninhabited. USE OF THE WATERSHED Resident Population

Aoloau Sisifo, Page 5-7
The Aoloau Sisifo watershed is uninhabited. Land Use There are no man-made structures located inside this watershed. It is also unlikely that any occasional use of the watershed is made for recreational purposes Use of the Nearshore Waters Nearshore Fishing Since the watershed is uninhabited, it is doubtful that any use is made of the nearshore waters for fishing. It is possible, however, that some boat fishermen from the nearby village of Fagamalo might occasionally bring a boat into Nuuooti or Laloniu Cove for some limited fishing activity. RESOURCE MANAGEMENT ISSUES Future Land Uses to the Year 2015 The present inaccessibility of this watershed and steeper slopes of the watershed suggest that no residential growth or agricultural uses will occur in the Aoloau Sisifo watershed to the year 2015. Road construction would be extremely costly. Further, there are no suitable areas for residential development even if vehicular access was developed. Impact of Future Population Growth Upon Water Consumption and Waste Generation No new resident population is anticipated in the watershed that would increase drinking water consumption and the generation of wastewater. Flood Potential A flood insurance study of American Samoa and related flood insurance rate maps were published by the U.S. Federal Emergency Management Agency (FEMA) in 1991. The study evaluated selected geographical locations throughout the Territory. Hydrologic and hydraulic analyses presented in the study were made by the U.S. Army Corps of Engineers, Pacific Ocean Division. However, no specific analysis was made of Vaiolefuga Stream and the two unnamed streams (Streams 5A and 5B) in the Aoloau Sisifo watershed. Inland Flood Potential The flood insurance rate map for the west coast of Tutuila indicates the entire Aoloau Sisifo watershed has been designated by FEMA as “zone x”. This designation indicates that the area is outside of the 100-year floodplain (Federal Emergency Management Agency, 1991). In essence, FEMA is suggesting that the flood hazard potential in this watershed is limited.

Aoloau Sisifo, Page 5-8
Coastal Flood Hazard The flood insurance rate map for the shoreline of the Aoloau Sisifo watershed indicates that there is a coastal flood hazard along the shoreline of the watershed. A potential 100-year flood is anticipated to generate flood levels approximately two feet above mean sea level (MSL) in these areas. Stormwater Runoff/Sedimentation and the Relationship to Surface Water Quality Heavier rainfall periods, steeper inland slopes, and more erosive soils in the Aoloau Sisifo watershed probably contribute to periodic erosion of some soils in the upper watershed. Ultimately, this natural erosion process carries a portion of these sediments into the nearshore waters that adjoin the watershed, especially during medium to higher flow stream conditions. Natural erosion from the undeveloped, upslope areas of the watershed is the only source of sedimentation in local streams, as well as the potential downstream sedimentation of the nearshore waters. All drainage areas of the watershed are believed to be impacted by natural erosion and downstream sedimentation. Any future land uses in the watershed would only increase erosion in the watershed because of highly erosive characteristics of all soils in the watershed. Consequently, it is recommended that future land uses would be limited to resource conservation and recreation. However, no structural development would be authorized in the watershed. Nearshore Water Quality and the Marine Environment The nearshore waters that adjoin the watershed are likely impacted by natural sedimentation, as well as wave action and nearshore currents. Despite the likely influence of natural sedimentation, it is believed that wave action and nearshore currents are the primary influences upon nearshore water quality. Groundwater and Surface Water Supplies There are no significant management issues associated with these resources. There are no developed groundwater or surface water supplies. No future development or use of groundwater and surface water resources is anticipated since the watershed is expected to remain uninhabited. MANAGEMENT NEEDS AND RECOMMENDATIONS The primary focus of future resource management in the Aoloau Sisifo watershed will be to:
• monitor future changes in land use; • limit future land uses in the watershed to watershed conservation and recreation. • restrict structural development in the watershed; • establish a wildlife sanctuary in Nuuooti Cove between Nuuomanu Rock and Tolotolooleoti Point
if this designation does not significantly impact shoreline recreation and other potential land uses along the northwest coast of Tutuila.
Representatives of participating public agencies should make periodic visits to the watershed to observe, document, and monitor selected resource conditions, and determine methods of correcting a potential hazard or undesirable conditions. The scope of issues that should be addressed by each agency in the field is summarized in Table 5-3. The general focus of recommended technical assistance is also identified. The experience and insights of agency representatives will determine the specific methodology to be used in the field.

Aoloau Sisifo, Page 5-9
TABLE 5-3 RECOMMENDED FOCUS OF FUTURE TECHNICAL ASSISTANCE AOLOAU SISIFO WATERSHED
Participating Public Agency
Resource Management Issue
Focus of Technical Assistance
ASEPA Facilitate a coordinated resource management effort within the watershed.
1. Coordinate overall watershed management activities. 2. Hold periodic meetings with participating ASG and federal agencies to discuss, prioritize, and schedule resource management activities. 3. Coordinate program efforts with local traditional leaders and/or designated resident of the watershed. 4. Make annual assessment of resource management program.
ASDOC Restrict land uses other than recreation, watershed conservation, and a wildlife sanctuary
Restrict structural development in the watershed.
ASDOC Monitor changes in population and land use
Annually map type and location of land uses in village and estimate resident population.
ASDMWR Establish a wildlife sanctuary between Nuuomanu Rock and Tolotolooleoti Point
1. Hold discussions with selected traditional leaders of Tutuila to discuss potential wildlife conservation designation and existing land uses. 2. Determine if a potential sanctuary designation will significantly impact shoreline recreation and other potential land uses along northwest coast of Tutuila. 3. If no significant impact is determined, prepare draft legislation for the Fono that would establish the wildlife sanctuary.
Source: Pedersen Planning Consultants, 1998

Aoloau Sasae, Page 6-1
AOLOAU SASAE Watershed 06 GEOGRAPHY The Aoloau Sasae (East Aoloau) watershed is a remote drainage along the north coast of Tutuila. This watershed encompasses approximately 2.05 square miles of land area (Figure 6-1). The watershed is defined by Manunu Ridge and the north slope of Milomilo Mountain. The inland apex of the watershed occurs near the 1,300-foot elevation on the northwest side of Faleselau Ridge. Consequently, the watershed includes several homes that are located in both Aoloau Village and Aasu Village. The shoreline of the watershed extends about 1.5 miles between Mataututele Point and Siliaga Point. Aoloau Bay represents the only embayment along the shoreline. This embayment fronts the original village of Aoloautuai (Old Aoloau), which is now uninhabited. RESOURCES OF THE WATERSHED Soils The U.S. Soil Conservation Service (National Resource Conservation Service) published a Soil Survey of American Samoa in 1984. Selected information derived from this survey provides some useful information for future watershed planning and management (Figure 6-2). Five different soil classifications were identified by the U.S. Soil Conservation Service for lands within the Aoloau Sasae watershed (Table 6-1). TABLE 6-1 SELECTED SOIL CHARACTERISTICS AOLOAU SASAE WATERSHED Soil Depth To: Land Use Suitability
SCS Soil Unit
Name Typical Slope
(Percent)
Flood Runoff Erosion High Water (Feet)
Bed Rock
(Inches)
Soil Based WW
Treatment
Subsistence Ag
Potential
1 Aua very stony silty clay loam
15-30 None Med-ium
Mod-erate
>6 <60 Severe Slope
Moderate
2 Aua very stony silty clay loam
30-60 None Rapid Severe <6 <60 Severe Slope
Poor
4 Fagasa family-Lithic Hapludolls-Rock outcrop assoc.
70-130 None Very Rapid
Very Severe
>6 20-60 Severe Slope Depth
Limited
19 Oloava silty clay loam
6-12 None Slow Slight >6 >60 Severe Filter Good
20 Oloava silty clay loam
12-25 None Slow to Med
Slight to Mod
>6 >60 Severe Filter Slope
Good
Source: U.S. Soil Conservation Service, 1984


Aoloau Sasae, Page 6-4
Aua Very Stony Silty Clay Loam (15 to 30 percent slopes) These soils (SCS mapping unit 1) extend inland about 650 from the shoreline and encompass most of the former Aoloautuai Village area. These soils typically occur up to about 60 inches in depth. The permeability of these soils ranges between 2 and 6 inches per hour. The potential for runoff or erosion from the Aua soils is believed to be moderate (U.S. Soil Conservation Service, 1984). While moderately suited for agricultural production, the Soil Conservation advises that the stony and erosive characteristics of these soils may limit production. However, the U.S. Soil Conservation Service estimates that this soil can annually sustain up to 5 tons per acre of erosion without impacting crop productivity (U.S. Soil Conservation Service, 1984). While the erosive characteristics of this soil generally may not significantly impact subsistence crop productivity, the erosive quality of the soil can be a significant contributor to sedimentation in downslope streams and the nearshore waters. The general characteristics of these Aua soils are also undesirable for individual wastewater disposal systems (U.S. Soil Conservation Service, 1984) The soils contain a significant amount of larger stones that typically hamper installation and adequate soil treatment. Aua Very Stony Silty Clay Loam (30 to 60 percent slopes) The steeper slopes behind the former village area, between the 200 and 400-foot elevation, are characterized by soils identified as Aua very stony Silty Clay Loam on 30 to 60 percent slopes (SCS mapping unit 2). The Aua soils range between seven to 60 inches in depth. The permeability of these soils (between 2 and 6 inches per hour) is moderately rapid. For watershed management purposes, it is important to note that these Aua soils have a high potential for runoff and erosion. This Aua soil is not recommended for agricultural production because of the stoniness of the soil, the high erosion potential, and hazards associated with subsistence crop cultivation on steeper slopes. However, when cultivation in these soils is necessary, the use of a mulch or ground cover is recommended to reduce soil erosion in cultivated areas. The U.S. Soil Conservation Service estimates that this soil can annually sustain up to 5 tons per acre of erosion without impacting crop productivity (U.S. Soil Conservation Service, 1984). While the erosive characteristics of this soil generally may not significantly impact subsistence crop productivity, the erosive quality of the soil can be a significant contributor to sedimentation in downslope streams and the nearshore waters. The general characteristics of these Aua soils are also undesirable for individual wastewater disposal systems (U.S. Soil Conservation Service, 1984) The soils contain a significant amount of larger stones that hamper installation and adequate soil treatment. Fagasa Family-Lithic Hapludolls-Rock Outcrop Association Land areas throughout most of the watershed contain deep, well-drained soils on steeper mountain ridges and slopes. The U.S. Soil Conservation Service identifies these soils as part of the Fagasa family-Lithic Hapludolls-Rock outcrop association (SCS mapping unit 4). This soil type is common and characterizes most of the steep, upland slopes along Tutuila’s north and west coast. Since this soil type is a combination of two general soil classifications, soil depths can vary between 20 and 60 inches. The soil represents a combination of silty clay and loam. Since the Fagasa Family-Lithic Hapludolls soil typically occurs on very steep slopes, the potential for surface runoff and erosion are high.

Aoloau Sasae, Page 6-5
The cultivation of subsistence crops on these soils is not considered desirable. However, when cultivation in these soils is necessary, care should be exercised to minimize the amount of exposed soil in cultivated areas. When heavier rainfall events occur in this watershed, a significant contribution of soil erosion can be expected from the undeveloped upslope areas of the watershed that contain this soil type. Natural runoff from steeper slopes in the watershed carries water, sediments, and organic debris to downslope drainage courses.. Such erosion can readily influence downstream water quality. Oloava Silty Clay Loam (6 to 12 Percent Slopes Oloava Silty Clay Loam (SCS mapping unit 19) can be found at the upper end of the Aoloau Sasae watershed near the 1,200-foot elevation. These soils are located in a small area on the west side of Milomilo Mountain. In a typical cross section, this soil is very deep, well-drained, and extends up to 60 inches in depth. The surface is a silty clay loam. However, a mid-layer between 12 to 40 inches in depth is often characterized by soft, weathered cinders. Greater depths contain more gravel mixed with the sandy loam. The permeability of the Oloava soil is moderately rapid above the mid-layer (2 to 6 inches per hour) . However, permeability becomes very rapid (6 to 20 inches per hour) through the cinder material between about 12 to 40 inches in depth. This soil is well-suited to the production of subsistence crops. The U.S. Soil Conservation Service estimates that this soil can annually sustain up to two tons per acre of erosion without impacting crop productivity (U.S. Soil Conservation Service, 1984). The limited erosion potential exhibited by these soils can be minimized through the use of mulches, hedgerow planting, crop residues, and other ground covers. Residential development is not desirable on these soils. Site development can expose the highly permeable cinder layer and contaminate local groundwater supplies. The use of onsite wastewater disposal systems can also contaminate ground water because soil-based treatment would typically be too rapid for adequate treatment. Oloava Silty Clay Loam (12 to 25 Percent Slopes) Oloava Silty Clay Loam (SCS mapping unit 20) can be found at the upper end of the Aoloau Sasae watershed in the vicinity of Faleselau Ridge. In a typical cross section, this soil is very deep, well-drained, and extends up to 60 inches in depth. The surface is a silty clay loam. However, a mid-layer between 12 to 40 inches in depth is often characterized by soft, weathered cinders. Greater depths contain more gravel mixed with the sandy loam. The permeability of the Oloava soil is moderately rapid above the mid-layer (2 to 6 inches per hour) . However, permeability becomes very rapid (6 to 20 inches per hour) through the cinder material between about 12 to 40 inches in depth. The potential for runoff is slight to medium while erosion potential is slight to moderate (U.S. Soil Conservation Service, 1984). This soil is well-suited to the production of subsistence crops. The U.S. Soil Conservation Service estimates that this soil can annually sustain up to two tons per acre of erosion without impacting crop productivity (U.S. Soil Conservation Service, 1984). The limited erosion potential exhibited by these soils can be minimized through the use of mulches, hedgerow planting, crop residues, and other ground covers.

Aoloau Sasae, Page 6-6
Residential development is not desirable on these soils. Site development can expose the highly permeable cinder layer and contaminate local groundwater supplies. The use of onsite wastewater disposal systems can also contaminate ground water because soil-based treatment would typically be too rapid for adequate treatment. Streams Stream Locations The Aoloau Sasae watershed is characterized by six drainages: Vaisa Stream, Vailolo Stream, and four unnamed streams. Vaisa Stream originates at the 1,200-foot elevation near the upper plateau of west Tutuila. This drainage carries surface flows from west slopes of Faleselau Ridge, as well as the steeper slopes northeast of West Tutuila’s central plateau. Several tributaries join the main stem of the stream before its discharge into Aoloau Bay. Vailolo Stream begins near the 1,000-foot contour along the west slopes of Milomilo Mountain. This stream drains a portion of the runoff from the Faleselau Ridge and west slopes of Milomilo Mountain. Vailolo Stream discharges along the shoreline of Aoloau Bay. Four unnamed streams, 6A, 6B, 6C, and 6D, flow through steeper ravines that are located along the north slope of Milomilo Mountain. Each of these streams discharge along the shoreline east of Aoloau Bay. Stream Flows Within the Watershed A low-flow, partial-record station was located on Vaisa Stream (No. 16922000) between 1959 and 1974. The Vaisa Stream gage was located about 0.4 mile upstream of the shoreline. Nine measurements of stream flow enabled the U.S. Geological Survey to estimate a median flow of 3.60 cubic feet per second (cfs). During the same period, nine stream flow measurements were also made along Vailolo Stream. The Vailolo gage (No. 16923000) was situated approximately 0.3 mile upstream from the shoreline. U.S. Geological Survey used stream flow records to estimate a median flow of 0.70 cfs (Wong, 1996). During the April, 1996 survey, the pulenuu of Aoloaufou indicated that Vailolo Stream flows throughout the year. Aquatic Fishes and Invertebrates Field surveys of fishes and invertebrates were made by the U.S. Fish and Wildlife Service, Division of Ecological Services, in March-April, 1978 and the U.S. Army Corps of Engineers in August, 1980. Vaisa Stream was one of 37 streams in American Samoa that were inventoried by representatives of these federal agencies. Results from both field surveys were summarized in an American Samoa Stream Inventory that was published by the U.S. Army Corps of Engineers, Honolulu District, in July 1981. Vaisa Stream was surveyed at the mouth of the stream along Aoloau Bay (station 11a). Four species of gobie fish and two species of mountain bass were observed at station 11a. One species of gobie fish was abundant. Four species of shrimp were also identified; one shrimp species was abundant. One abundant species of mollusk was also recorded at the mouth of the Vaisa Stream Surface Water Quality
There is no surface water quality data available for the streams in the watershed, as well as the nearshore waters that adjoin the watershed.

Aoloau Sasae, Page 6-7
Wetlands
No wetlands are located in the Aoloau Sasae watershed. Marine Resources Coral Communities
Since the early 1970’s, several surveys have been made of coral communities at various embayments and nearshore water areas along the coast of Tutuila. No coral surveys have been conducted by the American Samoa Government or other private consultants along the shoreline of the Aoloau Sasae watershed. Consequently, the general status of coral communities is unknown. Wildlife Resources
A fruit bat roost has historically been located in the northeast part of the watershed near Siliaga Point. Field observations made by the American Samoa Department of Marine and Wildlife Resources in FY 1997 recorded no fruit bat population in the vicinity of Siliaga Point (Utzurrum, 1998). Shoreline Protection
A fringing reef extends approximately 200 to 400 feet from the shoreline of Aoloau Bay and the adjoining shoreline of the watershed. The fringing reef affords some natural protection as the reef dissipates some incoming wave energy. Groundwater and Surface Water Supplies
There are no groundwater wells or surface water supplies located in the Aoloau Sasae watershed. USE OF THE WATERSHED Resident Population
A small portion of the Aoloaufou Village and Aasu Village population reside in the Faleselau Ridge area. This resident population is discussed in the context of the entire Aoloaufou Village population in the Aasu watershed (watershed 7) evaluation. Land Use
There are roughly 14 homes in the Faleselau Ridge area that are part of Aoloaufou and Aasu. The residences along the west side of the primary shoreline roadway are within Aoloaufou Village; the homes on the east side of the primary shoreline roadway are located within a part of Aasu Village. Use of Nearshore Waters Nearshore Fishing
Shoreline fishing in the nearshore waters is limited. During the April, 1996 field survey, the pulenuu of Aoloaufou reported that some shoreline fishing occurs along the shoreline of Aoloau Bay. Since access to Aoloau Bay requires about two to three hours of walking, few fishermen seek the opportunity. RESOURCE MANAGEMENT ISSUES Future Land Uses to the Year 2015 The present inaccessibility to this watershed and steeper slopes of the watershed suggest that no residential growth or agricultural uses will occur downslope of Faleselau Ridge. Some potential growth will occur on the northwest and southeast sides of the primary shoreline roadway. This

Aoloau Sasae, Page 6-8
anticipated growth is described more fully in the Aasu watershed evaluation. This evaluation includes discussions for both Aoloaufou Village and Aasu Village. Flood Potential A flood insurance study of American Samoa and related flood insurance rate maps were published by the U.S. Federal Emergency Management Agency (FEMA) in 1991. The study evaluated selected geographical locations throughout the Territory. Hydrologic and hydraulic analyses presented in the study were made by the U.S. Army Corps of Engineers, Pacific Ocean Division. However, no specific analysis was made of Vaisa Stream, Vailolo Stream, or the other four unnamed streams (6A through 6D). Inland Flood Potential The flood insurance rate map for the west coast of Tutuila indicates the entire Aoloau Sisifo watershed has been designated by FEMA as “zone x”. This designation indicates that the area is outside of the 100-year floodplain (Federal Emergency Management Agency, 1991). In essence, FEMA is suggesting that the flood hazard potential in this watershed is limited. Coastal Flood Hazard The flood insurance rate map for the shoreline of the Aoloau Sasae watershed indicates that there is a coastal flood hazard along the shoreline of the watershed. A potential 100-year flood is anticipated to generate flood levels approximately three feet above mean sea level (MSL) in these areas. Stormwater Runoff/Sedimentation and the Relationship to Surface Water Quality Heavier rainfall periods, steeper inland slopes, and more erosive soils in the Aoloau Sasae watershed probably contribute to periodic erosion of some soils in the upper watershed. Ultimately, this natural erosion process carries a portion of these sediments into the nearshore waters that adjoin the watershed, especially during medium to higher flow stream conditions. Natural erosion from the undeveloped, upslope areas of the watershed is the only source of sedimentation in local streams, as well as the potential downstream sedimentation of the nearshore waters. All drainage areas of the watershed are believed to be impacted by natural erosion and downstream sedimentation. While desirable, there are no significant opportunities for stormwater detention. Some detention likely occurs in the lower Vaisa Stream drainage. In order to ensure that other new sources of sedimentation do not occur in the watershed, it is recommended that future land uses in the watershed will be limited to watershed conservation and recreation. One significant exception would be Faleselau Ridge where residential and some agricultural activities already occur.

Aoloau Sasae, Page 6-9
Nearshore Water Quality and the Marine Environment The nearshore waters that adjoin the watershed are likely impacted by natural sedimentation, as well as wave action and nearshore currents. Despite the likely influence of natural sedimentation, it is believed that wave action and nearshore currents are the primary influences upon nearshore water quality. MANAGEMENT NEEDS AND RECOMMENDATIONS The primary focus of future resource management in the Aoloau Sasae watershed will be to:
• monitor future changes in land use; • limit future land uses in the watershed to watershed conservation and recreation. • restrict structural development in watershed areas downslope of Faleselau Ridge; Representatives of participating public agencies should make periodic visits to the watershed to observe, document, and monitor selected resource conditions, and determine methods of correcting a potential hazard or undesirable conditions. The scope of issues that should be addressed by each agency in the field is summarized in Table 6-2. The general focus of recommended technical assistance is also identified. The experience and insights of agency representatives will determine the specific methodology to be used in the field. TABLE 6-2 RECOMMENDED FOCUS OF FUTURE TECHNICAL ASSISTANCE AOLOAU SASAE WATERSHED
Participating Public Agency
Resource Management Issue
Focus of Technical Assistance
ASEPA Facilitate a coordinated resource management effort within the watershed.
1. Coordinate overall watershed management activities. 2. Hold periodic meetings with participating ASG and federal agencies to discuss, prioritize, and schedule resource management activities. 3. Coordinate program efforts with local traditional leaders and/or designated resident of the watershed. 4. Make annual assessment of resource management program.
ASDOC Reduce potential for new sources of sedimentation in the watershed.
1. With the exception of Faleselau Ridge, restrict land uses to recreation and watershed conservation. 2. Limit structural development to structures that support shoreline recreation.
ASDOC Monitor changes in population and land use
Annually map type and location of land uses in village and estimate resident population.
Source: Pedersen Planning Consultants, 1998
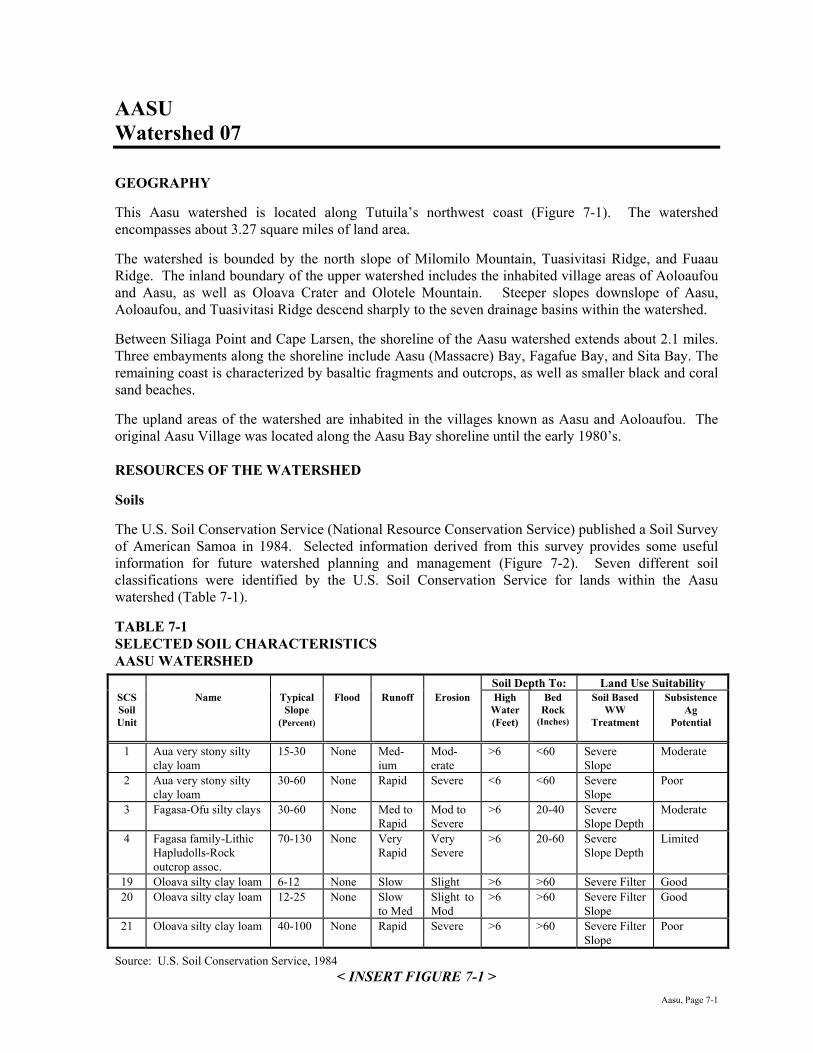
Aasu, Page 7-1
AASU Watershed 07 GEOGRAPHY This Aasu watershed is located along Tutuila’s northwest coast (Figure 7-1). The watershed encompasses about 3.27 square miles of land area. The watershed is bounded by the north slope of Milomilo Mountain, Tuasivitasi Ridge, and Fuaau Ridge. The inland boundary of the upper watershed includes the inhabited village areas of Aoloaufou and Aasu, as well as Oloava Crater and Olotele Mountain. Steeper slopes downslope of Aasu, Aoloaufou, and Tuasivitasi Ridge descend sharply to the seven drainage basins within the watershed. Between Siliaga Point and Cape Larsen, the shoreline of the Aasu watershed extends about 2.1 miles. Three embayments along the shoreline include Aasu (Massacre) Bay, Fagafue Bay, and Sita Bay. The remaining coast is characterized by basaltic fragments and outcrops, as well as smaller black and coral sand beaches. The upland areas of the watershed are inhabited in the villages known as Aasu and Aoloaufou. The original Aasu Village was located along the Aasu Bay shoreline until the early 1980’s. RESOURCES OF THE WATERSHED Soils The U.S. Soil Conservation Service (National Resource Conservation Service) published a Soil Survey of American Samoa in 1984. Selected information derived from this survey provides some useful information for future watershed planning and management (Figure 7-2). Seven different soil classifications were identified by the U.S. Soil Conservation Service for lands within the Aasu watershed (Table 7-1). TABLE 7-1 SELECTED SOIL CHARACTERISTICS AASU WATERSHED
Soil Depth To: Land Use Suitability SCS Soil Unit
Name Typical Slope
(Percent)
Flood Runoff Erosion High Water (Feet)
Bed Rock
(Inches)
Soil Based WW
Treatment
Subsistence Ag
Potential
1 Aua very stony silty clay loam
15-30 None Med-ium
Mod-erate
>6 <60 Severe Slope
Moderate
2 Aua very stony silty clay loam
30-60 None Rapid Severe <6 <60 Severe Slope
Poor
3 Fagasa-Ofu silty clays 30-60 None Med to Rapid
Mod to Severe
>6 20-40 Severe Slope Depth
Moderate
4 Fagasa family-Lithic Hapludolls-Rock outcrop assoc.
70-130 None Very Rapid
Very Severe
>6 20-60 Severe Slope Depth
Limited
19 Oloava silty clay loam 6-12 None Slow Slight >6 >60 Severe Filter Good 20 Oloava silty clay loam 12-25 None Slow
to Med Slight to Mod
>6 >60 Severe Filter Slope
Good
21 Oloava silty clay loam 40-100 None Rapid Severe >6 >60 Severe Filter Slope
Poor
Source: U.S. Soil Conservation Service, 1984 < INSERT FIGURE 7-1 >


Aasu, Page 7-4
Aua Very Stony Silty Clay Loam (15 to 30 percent slopes) This soil (SCS mapping unit 1) is found only along and behind a portion of the Sita Bay shoreline. These soils typically occur up to about 60 inches in depth. The permeability of these soils ranges between 2 and 6 inches per hour. The potential for runoff or erosion from the Aua soils is believed to be moderate (U.S. Soil Conservation Service, 1984). While moderately suited for agricultural production, the Soil Conservation advises that the stony and erosive characteristics of these soils may limit production. However, the U.S. Soil Conservation Service estimates that this soil can annually sustain up to 5 tons per acre of erosion without impacting crop productivity (U.S. Soil Conservation Service, 1984). While the erosive characteristics of this soil generally may not significantly impact subsistence crop productivity, the erosive quality of the soil can be a significant contributor to sedimentation in downslope streams and the nearshore waters. The general characteristics of these Aua soils are also undesirable for individual wastewater disposal systems (U.S. Soil Conservation Service, 1984) The soils contain a significant amount of larger stones that typically hamper installation and adequate soil treatment. Aua Very Stony Silty Clay Loam (30 to 60 percent slopes) Aua very stony Silty Clay Loam on 30 to 60 percent slopes (SCS mapping unit 2) characterizes the lower, steep slopes of Aasu and Leaveave Stream, and unnamed streams that discharge into Sita Bay. The soils generally are located between the shoreline and the 400-foot elevation. The Aua soils range between seven to 60 inches in depth. The permeability of these soils (between 2 and 6 inches per hour) is moderately rapid. For watershed management purposes, it is important to note that these Aua soils have a high potential for runoff and erosion. This Aua soil is not recommended for agricultural production because of the stoniness of the soil, the high erosion potential, and hazards associated with subsistence crop cultivation on steeper slopes. However, when cultivation in these soils is necessary, the use of a mulch or ground cover is recommended to reduce soil erosion in cultivated areas. The U.S. Soil Conservation Service estimates that this soil can annually sustain up to 5 tons per acre of erosion without impacting crop productivity (U.S. Soil Conservation Service, 1984). While the erosive characteristics of this soil generally may not significantly impact subsistence crop productivity, the erosive quality of the soil can be a significant contributor to sedimentation in downslope streams and the nearshore waters. The general characteristics of these Aua soils are also undesirable for individual wastewater disposal systems (U.S. Soil Conservation Service, 1984) The soils contain a significant amount of larger stones that hamper installation and adequate soil treatment. Fagasa Family-Lithic Hapludolls-Rock Outcrop Association Land areas throughout most of the upper watershed contain deep, well-drained soils on steeper mountain ridges and slopes. The U.S. Soil Conservation Service identifies these soils as part of the Fagasa family-Lithic Hapludolls-Rock outcrop association (SCS mapping unit 4). This soil type is common and characterizes most of the steep, upland slopes along Tutuila’s northwest coast. Since this soil type is a combination of two general soil classifications, soil depths can vary between 20 and 60 inches. The soil represents a combination of silty clay and loam. Since the Fagasa Family-Lithic Hapludolls soil typically occurs on very steep slopes, the potential for surface runoff and erosion are high.

Aasu, Page 7-5
The cultivation of subsistence crops on these soils is not considered desirable. However, when cultivation in these soils is necessary, care should be exercised to minimize the amount of exposed soil in cultivated areas. When heavier rainfall events occur in this watershed, a significant contribution of soil erosion can be expected from the undeveloped upslope areas of the watershed that contain this soil type. Natural runoff from steeper slopes in the watershed carries water, sediments, and organic debris to downslope drainage courses. Such erosion can readily influence downstream water quality. Oloava Silty Clay Loam (6 to 12 Percent Slopes) Oloava Silty Clay Loam (SCS mapping unit #19) can be found within and immediately downslope of Aoloaufou and Aasu between the 1,200 and 1,300-foot elevation. In a typical cross section, this soil is very deep, well-drained, and extends up to 60 inches in depth. The surface is a silty clay loam. However, a mid-layer, between 12 to 40 inches in depth, is often characterized by soft, weathered cinders. Greater depths contain more gravel mixed with the sandy loam. The permeability of the Oloava soil is moderately rapid above the mid-layer (2 to 6 inches per hour). However, permeability becomes very rapid (6 to 20 inches per hour) through the cinder material between about 12 to 40 inches in depth. This soil is well-suited to the production of subsistence crops. The U.S. Soil Conservation Service estimates that this soil can annually sustain up to two tons per acre of erosion without impacting crop productivity (U.S. Soil Conservation Service, 1984). The limited erosion potential exhibited by these soils can be minimized through the use of mulches, hedgerow planting, crop residues, and other ground covers. Residential development is not desirable on these soils. Site development can expose the highly permeable cinder layer and contaminate local groundwater supplies. The use of onsite wastewater disposal systems can also contaminate ground water because soil-based treatment would typically be too rapid for adequate treatment. Oloava Silty Clay Loam (12 to 25 Percent Slopes) Oloava Silty Clay Loam (SCS mapping unit 20) can also be found at the upper elevations of the Aasu watershed. In a typical cross section, this soil is very deep, well-drained, and extends up to 60 inches in depth. The surface is a silty clay loam. However, a mid-layer between 12 to 40 inches in depth is often characterized by soft, weathered cinders. Greater depths contain more gravel mixed with the sandy loam. The permeability of the Oloava soil is moderately rapid above the mid-layer (2 to 6 inches per hour). However, permeability becomes very rapid (6 to 20 inches per hour) through the cinder material between about 12 to 40 inches in depth. The potential for runoff is slight to medium while erosion potential is slight to moderate (U.S. Soil Conservation Service, 1984). This soil is well-suited to the production of subsistence crops. The U.S. Soil Conservation Service estimates that this soil can annually sustain up to two tons per acre of erosion without impacting crop productivity (U.S. Soil Conservation Service, 1984). The limited erosion potential exhibited by these soils can be minimized through the use of mulches, hedgerow planting, crop residues, and other ground covers. Residential development is not desirable on these soils. Site development can expose the highly permeable cinder layer and contaminate local groundwater supplies. The use of onsite wastewater disposal systems can also contaminate ground water because soil-based treatment would typically be too rapid for adequate treatment.
Aasu, Page 7-6
Oloava Silty Clay Loam (40 to 100 Percent Slopes) A small area of Oloava Silty Clay Loam (SCS mapping unit 21) is generally located in the vicinity of Olotele Mountain between the 1,000 and 1,200-foot elevation. In a typical cross section, this soil is very deep, well-drained, and extends up to 60 inches in depth. The surface is a silty clay loam. However, a mid-layer between 12 to 40 inches in depth is often characterized by soft, weathered cinders. Greater depths contain more gravel mixed with the sandy loam. These characteristics indicate why portions of Olotele Mountain have historically been used as a source of cinder for various construction projects. The permeability of the Oloava soil is moderately rapid above the mid-layer (2 to 6 inches per hour). However, permeability becomes very rapid (6 to 20 inches per hour) through the cinder material between about 12 to 40 inches in depth. The potential for runoff is rapid; erosion potential is severe (U.S. Soil Conservation Service, 1984). This soil is not suited for the production of subsistence crops. The U.S. Soil Conservation Service encourages the planting of permanent vegetation to reduce the potential of erosion. If subsistence agricultural uses are already in place, it is recommended that soil erosion be minimized through hedgerow planting, as well as the application of crop residues and other ground covers. Residential development is not desirable on these soils. Site development can expose the highly permeable cinder layer and contaminate local groundwater supplies. The use of onsite wastewater disposal systems can also contaminate ground water because soil-based treatment would typically be too rapid for adequate treatment. Fagasa-Ofu Silty Clays A small area of Fagasa-Ofu Silty Clays (SCS mapping unit 3) is located along the upper elevations of Tuasivitasi Ridge. The soil ranges between 20 to 40-inches in depth. The permeability of this silty clay loam is moderately rapid (2 to 6 inches per hour). The potential for surface runoff from these soils is considered moderate to rapid. However, the potential for erosion is moderate to severe. The U.S. Soil Conservation Service indicates that this soil type is somewhat suitable for the production of subsistence crops. The soil can annually sustain from one to 5 tons per acre of erosion without impacting crop productivity. However, the Soil Conservation Service recommends the use of mulch, crop residues, and cross-slope farming to reduce the potential for soil erosion. Streams Stream Locations There are six streams and related drainageways within the watershed. Each of these streams discharge into the nearshore waters that adjoin the watershed. Stream 7A originates at about the 800-foot elevation. This stream, which extends about 0.6 mile, carries surface runoff from the northeast slope of Milomilo Mountain. Stream discharges enter the southwest side of Massacre Bay. Aasu Stream, which contains six tributaries, drains the south and east slopes of Milomilo Mountain. Two of the six branches are fed, in part, by fresh-water springs. The 3.9-mile stream course meanders through steeper slopes from about the 1,200-foot elevation to the Massacre Bay shoreline. The stream ultimately flows through the former village area and discharges along the south side of Massacre Bay.

Aasu, Page 7-7
Leaveave Stream begins at an elevation of approximately 1,240 feet and extends 4.7 miles to the shoreline. The stream receives surface runoff from both the villages of Aoloaufou and Aasu, as well as surface drainage from the west side of Tuasivitasi Ridge. From a water quality perspective, it is significant to note that the headwaters of the stream are within about 200 feet of lower Aasu village. The drainage area of the stream also flows through steeper slopes of the watershed. Before its discharge into the shoreline of Fagafue Bay, the stream is characterized by a long narrow floodplain on the southwest side Fagafue Bay. Stream 7B originates at about 760 fee above mean sea level. The course flows about 0.6 mile through steeper slopes along the east side of Vesitau Ridge. Discharges from the stream occur along the east shoreline of Fagafue Bay. The headwaters of Stream 7C also begin about the 760-foot elevation. Surface runoff from the northwest side Taumata Mountain is carried by the stream for about 0.5 mile. This point of discharge is located just west of Ogegasa Point. Surface runoff from the north side of Taumata Mountain is transported by Stream 7D, which contains two branches. Their confluence is located at about the 160-foot contour. Stream 7D discharges along south shoreline of Sita Bay. Stream Flows Within the Watershed
Aasu Stream
Three water flow gages have historically been operated on the Aasu Stream system. One of the gages was a continuous-record gage.
Between 1960 and 1990, long-term streamflow information was obtained from a continuous-record gage (No. 16920500) that was located at the Aasu Stream mouth. This data enabled the U.S. Geological Survey to estimate a median flow of approximately 4.10 cfs at the stream mouth.
A low-flow partial-record station (No. 16920000), which was situated about 0.5 mile upstream from the Aasu Stream mouth, provided 26 intermittent measurements between 1959 and 1990. Median flow calculations by the U.S. Geological Survey estimated a median flow of 2.85 cfs.
A low-flow partial-record station (No. 16919800) provided 10 measurements of the upper Aasu Stream drainage between 1960 and 1974. This gage was located 0.3 mile north of the village of Aoloaufou. Based upon this information, the U.S. Geological Survey estimated a median flow of 0.24 cfs (Wong, 1996).
Aasu, Page 7-8
Leaveave Stream
Three low-flow partial-record gages have also been operated on the Leaveave Stream system. Gauging station no. 16919000 was situated on the main channel approximately 0.6 mile upstream from the mouth. Two gages (No. 16919200 and 16919400) were also installed on a bank below the main channel gage.
The main channel gage was read 22 times between 1959 and 1990. Such data provided the statistical basis for the U.S. Geological Survey to estimate a median flow of 2.40 cfs for the main channel, about 0.6 mile upstream of the Stream mouth.
The two tributary gages were read 9 times between 1960 and 1975. This information suggested median flows of 0.40 cfs at gaging station 16919200 and 0.21 cfs at station 16919400 (Wong, 1996).
Aquatic Fishes and Invertebrates Field surveys of fishes and invertebrates were made by the U.S. Fish and Wildlife Service, Division of Ecological Services, in March-April, 1978 and the U.S. Army Corps of Engineers in August, 1980. Aasu Stream and Leaveave Stream were two of 37 streams in American Samoa that were inventoried by representatives of these federal agencies. Results from both field surveys were summarized in an American Samoa Stream Inventory that was published by the U.S. Army Corps of Engineers, Honolulu District, in July 1981. Aasu Stream was surveyed at two locations. Station 1a was a stony riffle located about 100 feet upstream from the stream mouth. Station 1b was situated near the headwaters of Aasu Stream at about the 840-foot elevation. Leaveave Stream was also surveyed at two sampling locations. Station 2a was located approximately 25 feet upstream of the shoreline. Station 2b was situated near the headwaters of an unnamed tributary near Aolaufou and the 1,240 feet elevation. Four species of gobie fish and two species of mountain bass were observed near the mouth of the Aasu Stream (station 1a). In contrast, no gobie fishes or mountain bass were recorded near the headwaters (station 1b). Eels were found at both sampling locations. Four to six species of shrimp were documented at stations 1a and 1b; however, a greater abundance was observed near the headwaters of Aasu Stream. Two species of mollusks were also observed near the stream mouth while only mollusk specie was found near the headwaters of Aasu Stream. Along Leaveave Stream, two gobie fish species were documented near the shoreline (station 2a). One abundant gobie was documented near the headwaters (station 2b). Mountain bass was observed at station 2a, but none were located at station 2b. Eels were also documented; a greater abundance was observed near the headwaters.
Surface Water Quality Streams Available water quality data for the streams in the watershed include two intermittent samplings in 1970 and 71 (Table 7-2). These results indicate highly elevated levels of total coliform along Aasu Stream. While providing a clear indication of significant bacterial contamination, such information has limited value since the precise sampling location is unknown. TABLE 7-2
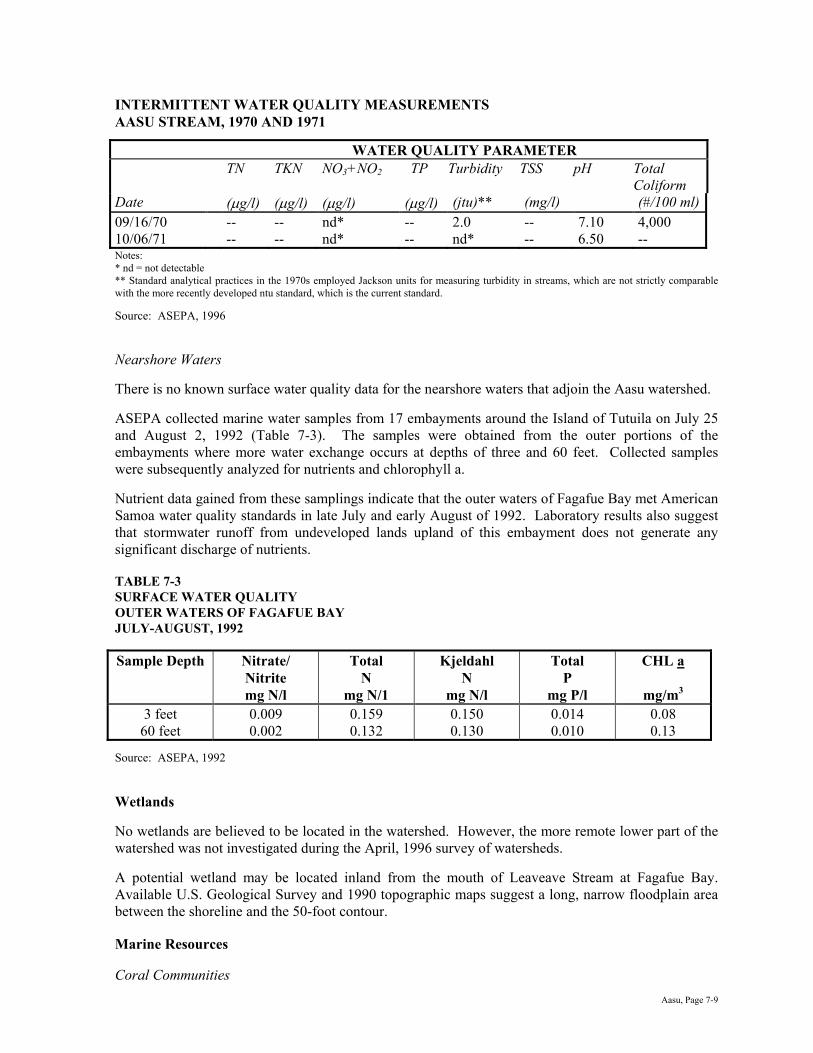
Aasu, Page 7-9
INTERMITTENT WATER QUALITY MEASUREMENTS AASU STREAM, 1970 AND 1971
WATER QUALITY PARAMETER TN TKN NO3+NO2 TP Turbidity TSS pH Total
Coliform Date (µg/l) (µg/l) (µg/l) (µg/l) (jtu)** (mg/l) (#/100 ml)09/16/70 -- -- nd* -- 2.0 -- 7.10 4,000 10/06/71 -- -- nd* -- nd* -- 6.50 -- Notes: * nd = not detectable ** Standard analytical practices in the 1970s employed Jackson units for measuring turbidity in streams, which are not strictly comparable with the more recently developed ntu standard, which is the current standard. Source: ASEPA, 1996 Nearshore Waters There is no known surface water quality data for the nearshore waters that adjoin the Aasu watershed. ASEPA collected marine water samples from 17 embayments around the Island of Tutuila on July 25 and August 2, 1992 (Table 7-3). The samples were obtained from the outer portions of the embayments where more water exchange occurs at depths of three and 60 feet. Collected samples were subsequently analyzed for nutrients and chlorophyll a. Nutrient data gained from these samplings indicate that the outer waters of Fagafue Bay met American Samoa water quality standards in late July and early August of 1992. Laboratory results also suggest that stormwater runoff from undeveloped lands upland of this embayment does not generate any significant discharge of nutrients. TABLE 7-3 SURFACE WATER QUALITY OUTER WATERS OF FAGAFUE BAY JULY-AUGUST, 1992
Sample Depth Nitrate/ Nitrite mg N/l
Total N
mg N/1
Kjeldahl N
mg N/l
Total P
mg P/l
CHL a
mg/m3
3 feet 0.009 0.159 0.150 0.014 0.08 60 feet 0.002 0.132 0.130 0.010 0.13
Source: ASEPA, 1992 Wetlands No wetlands are believed to be located in the watershed. However, the more remote lower part of the watershed was not investigated during the April, 1996 survey of watersheds. A potential wetland may be located inland from the mouth of Leaveave Stream at Fagafue Bay. Available U.S. Geological Survey and 1990 topographic maps suggest a long, narrow floodplain area between the shoreline and the 50-foot contour. Marine Resources Coral Communities
Aasu, Page 7-10
A fringing coral reef is found in the nearshore waters of Massacre Bay, Fagafue Bay, Sita Bay, and portions of the adjoining coastline. Since the late 1970’s, various private consultants have carried out field investigations of reef conditions in these areas. In a cumulative sense, available survey information provides suggests that:
• The growth of corals at Massacre Bay appears to have remained generally stable between 1979 and 1992.
• The growth of coral communities in Fagafue Bay may have declined somewhat during the 1980-1995 period. This could be an indication that surface discharges from Leaveave Stream may be generating increased sedimentation of Fagafue Bay.
• The abundance and coverage of coral communities at Cape Larsen increased during the 1982-1988 period.
Massacre Bay to Siliaga Point
Comparative surveys of the crown-of-thorns starfish outbreak were made at various shoreline locations on the Island of Tutuila in 1978 and 1979. These surveys were performed by the American Samoa Office of Marine Resources, as well as Birkeland and Randall. Surveys in the vicinity of Massacre Bay revealed no significant infestation or coral damage in January, 1978 along the forereef slopes between Aasu Village and Siliaga Point. By September, 1979, about 90 percent of the corals on the upper reef remained at depths of 6 to 33 feet (2 to 10 meters) and few crown-of-thorns starfish were observed.
Field surveys made for The American Coral Reef Inventory, which was published in 1980, indicates that the corals on the inner reef of Massacre Bay were sparse in 1979. However, coral cover on the mid-reef increased to about 20 percent. West of the middle reef area, coral coverage increased up to 90 percent (AECOS and Aquatic Farms, 1980).
The coral communities at Massacre Bay were observed again in 1982, 1985, and 1988 by Birkeland and Randall. Survey transects were made at 6-10 feet, as well as 20 feet. Similar to Fagafue Bay, coral abundance and coverage generally increased at Massacre Bay during 1982 and 1985, but declined slightly in 1988. Coral coverage at 6-10 feet increased from about 60 to almost 89 percent between 1982 and 1985, and declined sharply to 45 percent in 1988. In contrast, coral coverage at 20 feet increased substantially from almost 61 percent in 1982, 92 percent in 1985, to 127 percent in 1988. Field investigations were also made at Massacre Bay by Maragos, Hunter, and Meier in 1992. These marine ecologists primarily surveyed the outer reef margin and reef slopes of fringing reef of Massacre Bay. A one percent coral coverage was observed in shallow nearshore waters of about six meters in depth. In contrast, 25 percent coverage was noted at about 18 meters. High specie richness was also determined as some 53 different coral species were observed. Fagafue Bay
A fringing reef characterizes the shoreline of Fagafue Bay. In 1979, surveys made in conjunction with the assessment of the crown-of-thorns outbreak indicated that the Bay was “....one of the only areas along the north coast of Tutuila besides Sita Bay where corals appear virtually untouched by the crown-of-thorns starfish” (AECOS and Aquatic Farms, 1980). Southwest of Fagatiale Point, coral coverage ranged between 25 and 50 percent. Greater coral coverage was observed in the northwest part of the Bay at a depth of 30 feet (9 meters)

Aasu, Page 7-11
The coral communities at Fagafue Bay were investigated in 1982, 1985, and 1988 by Birkeland and Randall. Survey transects were made at 6-10 feet, as well as 20 feet. Coral abundance and coverage generally increased at Fagafue Bay during 1982 and 1985, but declined slightly in 1988. Coral coverage at 6-10 feet increased from 80 to almost 86 percent between 1982 and 1985, and diminished to 33 percent in 1988. At 20 feet, coral coverage declined from 115 percent in 1982, 98 percent in 1985, and almost 94 percent in 1988. More recently, a 1996 study of various coral reefs throughout the Samoan Archipelago included, in part, some onsite investigations of the fringing reef front on the eastern side of Fagafue Bay. The study focused primarily upon the quantification of coral communities, the abundance and diversity of reef fish, and selected habitat characteristics.
Data obtained from field surveys, which were conducted in this area between November, 1994 and November, 1995, indicate that the existing fringing reef at Fagafue Bay has a low coral cover (less than 20 percent). The number of species observed represented less than 100 species and was considered “low” compared to other sites on Tutuila, Manua, and Western Samoa. Fish density was considered “moderate” (between 5,000 and 9,999 individuals per ha). Fish biomass was determined to be “low” and less than 500 kilograms per ha (Green, 1996). Ogegasa Point and Fagatiale Point
Between Fagafue and Sita Bays, Birkeland and Randall observed no crown-of-thorns starfish in January, 1978. Just west of Ogegasa Point, a 75 percent coral coverage over a limestone bboottttoomm wwaass ddooccuummeenntteedd bbyy DDaahhll ssoommeettiimmee dduurriinngg tthhee 11997777--11997799 ppeerriioodd.. Sita Bay
In 1979, marine ecologists from AECOS and Aquatic Farms observed abundant and luxuriant coral growth along the reef face on the east side of Sita Bay. The American Samoa Coral Reef Inventory notes that the corals in this location were “....among the lushest in American Samoa” (AECOS and Aquatic Farms, 1980). Coral coverage was determined to be near 100 percent. Consequently, Sita Bay was largely unaffected by the crown-of-thorns starfish outbreak experienced in other portions of the Aasu watershed. Faleoteine Point to Cape Larsen
During an August/September, 1979 survey, representatives of the American Samoa Government, Office of Marine Resources surveyed the area noted that “....about 85 percent of corals on the bottom...” off Faleoteine Point were living. Only a few crown-of-thorns starfish were present.
Between Agalua Rock and Cape Larsen, Birkeland and Randall observed no crown-of-thorns starfish in January, 1978. However, the prior presence of the starfish was suspected because many dead corals were found in this area. The coral communities at Cape Larsen were again examined in 1982, 1985, and 1988 by Birkeland and Randall. Survey transects were made at 6-10 feet, as well as 20 feet. Coral abundance and coverage increased at Cape Larsen during the 1982-1988 period. Coral coverage at 6-10 feet increased from almost 11 percent in 1982, 14 percent in 1985, to almost 35 percent in 1988. At 20 feet, coral coverage rose from seven percent in 1982, 22 percent in 1985, and almost 30 percent in 1988.
Wildlife Resources

Aasu, Page 7-12
Fruit bat roosts are located in the northeast part of the watershed in the vicinity of Cape Larsen and Tafaga Cove, as well as Fagafue Bay. In FY 1997, the ASG Department of Marine and Wildlife Resources estimated a minimum population of 1,500 fruit bats at Fagafue Bay and 230 fruit bats in the vicinity of Larsen Bay and Tafaga Cove. These estimates were based upon a combination of exit counts, dawn return counts, and/or boat counts in FY 1997 (Utzurrum, 1998). Shoreline Protection The fringing reefs provide some limited protection to the shoreline areas of the Aasu watershed. However, the coastline of the watershed is influenced primarily by wave action and nearshore currents, as well as occasional storm waves. The influence of these factors is evidenced, in part, by past shoreline erosion in the former shoreline village of Aasu (Aecos and Aquatic Farms, 1980). Groundwater and Surface Water Supplies Groundwater Supply and Quality The inhabited villages of Aoloaufou and Aasu rely upon the ASPA water system for potable drinking water. Two groundwater wells associated with region 4 of the water system are located in Aasu. These wells are known as Aasu #128 and Aasu #129 (ASPA, 1996). The American Samoa Power Authority, Water Division, regularly monitors the groundwater quality of ASPA’s primary water system. These analyses include the measurement of total and fecal coliform bacteria, turbidity, organic and inorganic chemicals, and radioactivity. The water quality parameters examined by ASPA include those outlined by the National Primary Drinking Water Regulations (Primary Regulations) which are required by the U.S. Safe Drinking Water Act. “Though pesticides and insecticides such as Paraquat, Diazinon, and Malathion are commonly used in American Samoa, groundwater studies conducted by ASEPA and the U.S. Geological Survey have not found any residues in the groundwater supply. ASEPA representatives report that the treated water supply is in compliance with the Primary Regulations (Wiegman, 1994)” (ASPA, 1996). The concentration of chloride at all wells is also monitored on a weekly basis. Maximum levels for chlorine that are outlined in the Secondary Regulations of the National Primary Drinking Water Regulations require a concentration of not more than 250 milligrams per liter. While these regulations are not mandatory, they represent an operational objective of the ASPA Water Division. Available data from August, 1994 indicate that the chloride level at Aasu #128 and Aasu #129 were well within the recommended standard of 250 milligrams per liter. Surface Water Supply and Quality In April 1996, the pulenuu of Aloaufou indicated that a stream catchment was used before the ASPA primary water system was established. However, no surface supplies are used by Aoloaufou or Aasu.

Aasu, Page 7-13
Proposed Water System Improvements The long-term plans associated with development, expansion, operation and maintenance of the ASPA primary water system are outlined in ASPA’s Utility System master plan. The plan includes no specific system improvements within the Aasu watershed. USE OF THE WATERSHED Resident Population The two inhabited areas of the watershed include the villages of Aoloaufou and Aasu, which are situated at the upper end of the watershed. Between 1980 and 1990, Aoloaufou’s resident population grew from about 398 to 544 persons. Such growth represented an average annual growth rate of about 3.67 percent. The 1995 estimate for Aoloaufou remained at 544 persons since ASG building permit records indicated no new residential ccoonnssttrruuccttiioonn ((AASSPPAA,, 11999966)).. In Aasu, the 1990 population was 341 persons. Pedersen Planning Consultants estimates that the 1995 resident population was approximately 434 persons. The growth in Aasu’s resident population primarily reflected the development of 14 new homes during the 1990-1995 period. Land Uses Residential
Aoloaufou
In 1990, the 1990 U.S. Census documented 73 homes in Aoloau village census area. Approximately 83 percent of the homes were owner-occupied; 10 percent were rental units. Approximately eight percent of the housing units were vacant or used as vacation homes by absentee owners.
The housing stock did not expand during the 1990-1995 period. No ASG building permits were issued for new housing starts. Consequently, the 1995 housing stock included approximately 73 homes. Aasu
In 1990, the 1990 U.S. Census documented 45 homes in Aasu village census area. Approximately 98 percent of the homes were owner-occupied; two percent were rental units. None of the housing units were vacant or used as vacation homes by absentee owners.
The housing stock expanded considerably during the 1990-1995 period. Approximately 14 building permits were issued for new housing starts. Consequently, the 1995 housing stock included approximately 59 homes.
Commercial Aoloaufou
In 1995, there were approximately 13 commercial enterprises that operated in Aoloau. These enterprises included seven bus and trucking companies, 3 grocery stores, one laundromat, one photography business, one landscaping business, as well as a pig farm and pig feed distributor. No new commercial facility building permits were issued by the American Samoa Government during the 1990-1995 period. A November, 1994 inspection of the village confirmed that no new commercial facilities had been constructed during this period.

Aasu, Page 7-14
Aasu
In 1995, there were approximately four commercial enterprises that operated in Aasu. These enterprises included two retail stores, one laundromat, and one grocery store. No new commercial facility building permits were issued by the American Samoa Government during the 1990-1995 period.
Industrial In 1995, no industrial companies were established in either Aoloaufou or Aasu Village. Public Facilities
Aoloaufou
No early childhood education, elementary or high school facilities are located in the Village. Elementary school students attend Siliaga Elementary School in Aoloau. High school students are bussed to Leone High School. Aasu
The early childhood education program in Aasu provides educational opportunities for younger children in the village. In September, 1994, this program was attended by about 37 children from the village.
Elementary school students attend Siliaga Elementary School in Aoloau. High school students are bussed to Leone High School.
Use of the Nearshore Waters Nearshore Fishing Some fishing takes place in the embayments of the Aasu watershed. However, fishing in the nearshore waters is believed to be limited. The pulenuu of Aoloaufou reported in April, 1996 that some residents of Aasu and Aoloaufou will occasionally walk down to Massacre Bay for a day or weekend of fishing. Greater subsistence fishing took place in Massacre Bay when the shoreline village area of Aasu remained populated. However, the relocation of shoreline residents to the upper inhabited area of Aasu in the early 1980’s significantly changed the amount of fishing activity in the Bay. Fishing activity in Sita Bay may occur in the deeper nearshore waters. Access to these waters requires a fishing boat. It is believed that some boat fishermen from Fagasa occasionally travel to the area from nearby Fagasa Bay. Otherwise, the lack of vehicular and pedestrian access from the northwest side of Fagasa Bay restricts the use of Sita Bay for fishing activity. Between Sita Bay and Massacre Bay, the lack of vehicular and pedestrian access limits any occasional fishing activity to boat fishing. A sandy beach at Fagafue Bay provides boaters with an opportunity to conveniently access the shoreline. However, it is believed that shoreline fishing activity in Fagafue Bay rarely occurs. RESOURCE MANAGEMENT ISSUES Future Land Uses to the Year 2015

Aasu, Page 7-15
Residential Aoloaufou
Future residential expansion in the Village is expected to be moderate. The village is situated in a cooler environment, which is unattractive to most residents born and raised on the Island of Tutuila. However, many American Samoans born and raised in the continental United States probably are refreshed by the slightly cooler temperatures. Consequently, most of Aoloau’s future in-migrants are expected to be American Samoans who are relocating or returning from the continental United States.
There is considerable developable land on moderate slopes, which potentially could accommodate substantially greater development. However, future residential development during the next 20 years is expected to be limited to the construction of about 39 new homes on the south side of the primary access road and 12 homes on the west side of the access road near Faleselau Ridge.
Future residential expansion is expected to include primarily single family housing. Such development will occur along existing dirt trails, a few trail extensions, and new trails south and west of the primary two-lane access road through Aoloau.
During the next 20 years, ASPA believes that such development will more specifically generate the following sequence and volume of residential construction.
1996-2000 12 single family homes south of the primary two-lane roadway. Three single family homes west of the primary two-lane roadway.
2001-2005 Nine single family homes south of the primary two-lane roadway. Three single family homes west of the primary two-lane roadway.
2006-2010 Six single family homes south of the primary two-lane roadway. Three single family homes west of the primary two-lane roadway.
2011-2015 12 single family homes south of the primary two-lane roadway. Three single family homes west of the primary two-lane roadway.
The cumulative effect of this prospective residential growth is that the housing stock will expand to about 124 housing units in the year 2015. During the same period, it is believed that the average household size will have gradually decreased to approximately 6.73 persons per household. In the year 2015, the future village population is expected to include about 835 persons. Aasu
Future residential expansion in the Village is expected to be moderate. The village is situated in a cooler environment, which is unattractive to most residents born and raised on the Island of Tutuila. However, many American Samoans born and raised in the continental United States probably are refreshed by the slightly cooler temperatures available in this community. Consequently, most of Aasu’s future in-migrants, who have extended family connections to Aasu, are expected to be American Samoans who are relocating or returning from the continental United States.
There is considerable developable land on moderate slopes downslope of the inhabited village area that could accommodate substantially greater development. Much of this land is used for faatoaga purposes. The use of subsistence crops from the faatoaga is expected to diminish gradually as the resident population becomes less dependent upon subsistence crops. This trend will eventually lead to the conversion of some faatoaga lands to residential purposes.

Aasu, Page 7-16
During the next 20 years, however, future residential expansion is expected to occur along three existing dirt trails north of the primary access road to Aasu. In addition, some infilling will take place on the east side of the primary access road near Faleselau Ridge. These potential development opportunities are expected to generate the following sequence and volume of residential construction.
1996-2000 12 single family homes north of the primary two-lane roadway. Three single family homes east of the primary two-lane roadway.
2001-2005 12 single family homes north of the primary two-lane roadway. Three single family homes east of the primary two-lane roadway.
2006-2010 Seven single family homes north of the primary two-lane roadway.
2011-2015 12 single family homes north of the primary two-lane roadway. Three single family homes east of the primary two-lane roadway.
The cumulative effect of this prospective residential growth is that the housing stock will increase to about 111 housing units in the year 2015. During the same period, it is believed that the average household size will have gradually decreased to approximately 6.28 persons per household. Consequently, it is anticipated that the village population in the year 2015 will include about 698 persons.
Commercial Aoloaufou
Commercial enterprises in Aoloau are expected to focus upon providing convenience items to local consumers. However, most other retail shopping by local residents will probably be made in Pavaiai, Nuuuli, or the Pago Pago Bay Area. Nevertheless, three new retail stores are expected to be constructed along the primary access road through Aoloau and Aasu between 2001 and 2005; each store will employ an average of two persons.
Secondarily, a growth in home occupations will also provide a wide-variety of professional and technical services. Ten new home occupations of this nature will likely be established between 1996 and the year 2005. Aasu
Similar to Aoloau, commercial enterprises in Aasu will continue to focus upon providing convenience items to local consumers. Most other retail shopping by local residents will probably be made in Pavaiai, Nuuuli, Pavaiai, or the Pago Pago Bay Area. Nevertheless, three new retail convenience stores are expected to be constructed along the primary access road through Aasu and Aoloau between 2006 and 2010; each store will employ an average of two persons.
Secondarily, a growth in home occupations will also provide a wide-variety of professional and technical services. Five new home occupations of this nature will probably be established between 1996 and the year 2005.
Industrial Anticipated increases in resident population will attract a few home-based activities of an industrial nature. During the 2011-2015 period, it is expected that a small steel fabrication shop will be established in Aasu. In Aoloaufou, no new industrial facilities are anticipated. Public Facilities

Aasu, Page 7-17
Aoloaufou
Population characteristics for Aoloau in 1990 suggest that approximately six percent of the village population is three and four years of age. Elementary school-aged children (5 and 13 years old) include about 22 percent of village population; high school students represented only 10 percent of the population.
The application of these population characteristics to the anticipated 2015 village population suggest increased student enrollments in the local early childhood and elementary education programs, as well as the high school facilities outside of Aoloau. Anticipated student enrollments from the village population are expected to be as follows in the year 2015:
• early childhood education 50 students • elementary school 184 students • high school 84 students Aasu
Population characteristics for Aasu in 1990 suggest that approximately seven percent of the village population is three and four years of age. Elementary school-aged children (5 and 13 years old) include about 21 percent of village population; high school students represented only 10 percent of the population.
The application of these population characteristics to the anticipated 2015 village population suggest increased student enrollments in the local early childhood program, as well as the elementary and high school facilities outside of Aasu. Anticipated student enrollments from the village population are expected to be as follows in the year 2015:
• early childhood education 49 students • elementary school 146 students • high school 70 students
Impact of Future Population Growth Upon Water Consumption and Waste Generation Aoloaufou Wastewater generation in Aoloaufau is expected to rise from about 43,298 gallons per day (gpd) in 1995 to 58,875 gpd in the year 2015 (American Samoa Power Authority, 1996). The American Samoa Power Authority (ASPA) estimates that the average day demand for water in Aoloaufau was about 61,854 gallons in 1995. By the year 2015, ASPA anticipates that the average demand will increase to roughly 84,107 gpd.

Aasu, Page 7-18
Aasu Future population growth and changes in land use in the Aasu watershed will increase the volume of future wastewater and solid wastes that are generated by local residents. Wastewater generation, for example, is expected to rise from about 12,101 gallons per day (gpd) in 1995 to 47,911 gpd in the year 2015 (American Samoa Power Authority, 1996). The consumption of potable water will also increase with a growing population. The American Samoa Power Authority (ASPA) estimates that the average day demand for water in Aasu was about 17,287 gallons in 1995. By the year 2015, ASPA anticipates that the average demand will increase to roughly 68,444 gpd. Flood Potential A flood insurance study of American Samoa and related flood insurance rate maps were published by the U.S. Federal Emergency Management Agency (FEMA) in 1991. The study evaluated selected geographical locations throughout the Territory. Hydrologic and hydraulic analyses presented in the study were made by the U.S. Army Corps of Engineers, Pacific Ocean Division. However, no specific analysis was made of either Aasu Stream or Leaveave Stream in the Aasu watershed. Inland Flood Potential The flood insurance rate map for the west coast of Tutuila indicates the entire Aasu watershed has been designated by FEMA as “zone x”. This designation indicates that the area is outside of the 100-year floodplain (Federal Emergency Management Agency, 1991). In essence, FEMA is suggesting that the flood hazard potential in this watershed is limited. Coastal Flood Hazards The flood insurance rate map for the shoreline of the Aasu watershed indicates that there is a coastal flood hazard along the shoreline of the watershed. A potential 100-year flood is anticipated to generate flood levels approximately three feet above mean sea level (MSL) in these areas. In addition, the U.S. Army Corps of Engineers has also estimated that a 100-year tsunami would generate an inundation level of approximately 2.7 feet above mean sea level in the vicinity of Cape Larsen (U.S. Army Corps of Engineers, 1980). Stormwater Runoff/Sedimentation and the Relationship to Surface Water Quality In terms of future watershed management, Aasu and Leaveave Streams are of primary concern because these surface water resources are the primary mode of transportation for sediments and other contaminants to the nearshore waters of the northern coast. The quality of surface water discharge in these streams is also an important consideration because of the high potential for recharge into the Island of Tutuila’s basal aquifer. Much of the Aasu watershed consists of remote, undeveloped lands that are expected to remain undeveloped to the year 2015. However, the location of the villages of Aoloaufou and Aasu near the top of the watershed will continue to exert a growing influence upon the volume of runoff and sedimentation into Aasu and Leaveave Stream.

Aasu, Page 7-19
Urban Runoff It is believed that urban runoff from impermeable surfaces in the Aoloaufou and Aasu represents the primary source of surface runoff in the Aasu watershed. During heavier rainfall periods, surface runoff is evident along the primary roadway. Surface drainage from the south and west side of Aoloaufou village generally flows east toward the primary roadway. The natural gradient associated with the roadway transport flows through two primary locations of Aasu Village which, for the most part, is downslope of Aoloaufou and the primary roadway. One path of the stormwater flows carry surface runoff from the northern portion of Aoloaufou village underneath and across the surface of the primary roadway to Aasu Stream which originates just north of Aasu Village. A 12-inch culvert underneath the primary roadway in this area frequently clogs with debris during or following heavier rainfall periods. When this occurs, stormwater flows across the roadway and temporarily ponds on the roadway surface. Nevertheless, this runoff eventually flows to Aasu Stream. Surface runoff is generated from stormwater flows from the lower portions of Aoloaufou village, Olotele Mountain, and Oloava Crater. These flows are generally transported downslope via ditches along vehicular trails that are west of the primary road. Ultimately, these flows are carried to the surface of the primary roadway that serves Aasu and Aoloaufou. Lined and unlined drainage ditches on the west side of the road, as well as the primary roadway surface, carry these flows to a second drainage point near the south end of the village. One of two forks of Leaveave Stream ultimately carries this surface runoff to lower portions of Leaveave Stream. The majority of the surface runoff from Aasu village is believed to be carried by Leaveave Stream. Many Aasu residents have constructed raised concrete berms along the edge of the primary roadway to prevent runoff, which is carried along the primary roadway, from flooding their homes. In recognition of the flood potential in Aasu, the U.S. Federal Highway Administration is planning to design two infiltration or recharge wells along the primary roadway to permit the recharge of stormwater into Tutuila’s aquifer and, at the same time, reduce sedimentation of Leaveave Stream. It is anticipated that federal funds will be provided to the American Samoa Government, Department of Public Works, for the construction of the recharge or infiltration well (Tingley, 1996). Erosion In the upper watershed, erosion also takes place within the urbanized village areas of Aoloaufou and Aasu. During the April, 1996 field survey, one small land slide was observed in Aasu along the east side of the primary roadway. Some limited sedimentation was also observed from the two smaller cinder quarries that are situated on the east side of Olotele Mountain. However, the quarry located on the northeast side of Olotele Mountain was developed into a bowl-like depression that greatly helped reduce the amount of potential turbid water that was generated from quarry operations. Heavier rainfall periods, steeper inland slopes, and more erosive soils in the Aasu watershed, between the shoreline and the 1,200-foot contour, regularly contribute to periodic erosion the related transport of sediments into Aasu and Leaveave Streams, as well as the other drainages of the watershed. Ultimately, this natural erosion process carries a portion of these sediments into the nearshore waters of Massacre Bay, Fagafue Bay, Sita Bay.
Aasu, Page 7-20
Nearshore Water Quality and the Marine Environment
The nearshore waters that adjoin the watershed are believed to be impacted primarily by wave action and nearshore water currents. However, natural sedimentation from steeper slopes in the watershed, combined with urban runoff from Aoloaufou and Aasu, clearly contribute to some sedimentation of the nearshore waters. It is questionable how significantly sedimentation influences coral communities between Massacre Bay and Cape Larsen. The longer stream lengths of both Aasu and Leaveave Stream afford considerable opportunity for sediments to settle out in occasional stream depressions along the Aasu and Leaveave Stream courses.
The configuration of Fagafue Bay suggests that the coral communities in this embayment could be more vulnerable to the influence of surface runoff from the Aasu watershed. While no site visit was made at Fagafue Bay in April, 1996, recent studies by Green et al between November, 1994 and November, 1995 indicate that the nearshore water quality of the Bay was poor and that diminished water quality was due to sedimentation. This conclusion was further supported by Green’s 1994-1995 survey results, which recorded a “low” coral coverage of less than 20 percent.
At the same time, the long narrow flood plain at the head of Fagafue Bay (a possible wetland) likely provides an important opportunity for the deposition of sediments along the lower portion of Leaveave Stream. While some deposition is likely occurring, it is clear that the volume of sedimentation from Leaveave Stream is sufficient enough to generate significant impacts on nearshore water quality. Groundwater and Surface Supplies
A future watershed management concern related to groundwater quality is the anticipated growth of the upper Aasu village, east of the primary roadway. This area primarily contains Oloava silty clay loam soils that are not suitable for the use of onsite wastewater disposal systems and related soil-based treatment. Beginning at about 12 inches in depth, these soils are characterized by a highly permeable cinder layer that does not afford adequate treatment of wastewater.
It is recommended that a minimum 100-foot setback from existing groundwater wells should be established by ASPA to help ensure the maintenance of desirable groundwater quality. The cumulative impact of anticipated residential development, combined with the construction of onsite wastewater disposal systems, could adversely impact groundwater quality. MANAGEMENT NEEDS AND RECOMMENDATIONS The primary focus of future resource management in the Aasu watershed should be to:
• detain urban runoff and related sedimentation in the villages of Aoloaufou and Aasu to permit recharge into the Tutuila’s aquifer and reduce downstream sedimentation;
• maintain desirable water quality for the existing groundwater wells in Aasu; and, • encourage effective septic tank design and construction in the immediate vicinity of ASPA
groundwater wells.
Representatives of participating public agencies should make periodic visits to the watershed to observe, document, and monitor selected resource conditions, determine potential options for correcting potential resource management concerns, share potential solutions with designated residents of Aoloaufou and Aasu, and encourage implementation of resource management solutions by both villages.
The scope issues that should be addressed by each agency in the field are summarized in Table 7-4. The general focus of recommended technical assistance is also identified. The experience and insights of agency representatives would determine the specific methodology to be used in the field. TABLE 7-4 RECOMMENDED FOCUS OF FUTURE TECHNICAL ASSISTANCE AASU WATERSHED

Aasu, Page 7-21
Participating Public Agency
Resource Management Issue
Focus of Technical Assistance
ASEPA Facilitate a coordinated resource management effort within the watershed.
1. Coordinate overall watershed management activities. 2. Hold periodic meetings with participating ASG and federal agencies to discuss, prioritize, and schedule resource management activities. 3. Coordinate program efforts with local traditional leaders and/or designated resident of the watershed. 4. Make annual assessment of resource management program.
Monitor long-term water quality of the upper and lower reaches of Aasu and Leaveave Stream.
Measure changes in total suspended solids and turbidity at two sampling locations on Aasu and Leaveave Streams.
ASPA Encourage effective septic tank design and construction.
1. Closely monitor proposed septic tank installations for the area east of Faleselau Ridge and the primary roadway to Aoloaufou and Aasu. 2. When appropriate, require alternate designs and construction criteria for effluent drainfields.
Sustain the groundwater quality of the two ASPA wells in Aasu
Require a building setback of, at least, 100 feet from ASPA wells #128 and 129.
ASDOC Monitor changes in population and land use
Annually map type and location of land uses in village and estimate resident population.
ASDPW Detain urban runoff from Aoloaufou and Aasu, and recharge the aquifer
Construct proposed infiltration wells along the east side of the primary roadway. Use recommended design plans developed by the U.S. Federal Highway Administration.
ASCC, Land Grant Program
Reduce sedimentation from agricultural activities in Aasu and Aoloaufou
Determine locations where agricultural activities may be generating some sedimentation. Encourage soil conservation methods with resident growers of subsistence crops.
Reduce sedimentation from residential development
Encourage use of best management practices in the siting and location of homes in the north part of Aasu and Aoloaufou, as well as the growth of desirable ground covers.
ASG Dept. of Marine/Wildlife Resources
Sustain healthy marine communities in nearshore waters
Once every 3 years, monitor changes in coral coverage, fish habitat, diversity in Massacre Bay and Fagafue Bay.
Source: Pedersen Planning Consultants, 1997

Fagasa, Page 8-1
FAGASA Watershed 08 GEOGRAPHY The Fagasa watershed is bounded by Fuaau Ridge, Leele Mountain, and Fatifati Mountain. This watershed encompasses approximately 1.35 square miles of land area (Figure 8-1). The highest elevation in the watershed is the summit of Leele Mountain that is situated at about 1,732 feet above mean sea level. Steeper slopes below the mountain ridges form a steep drainage area that contains several streams. Two smaller coastal plains, Fagatele and Fagalea, are the location of two older villages which now comprise the village of Fagasa. Along the shoreline, this watershed extends from Cape Larsen to Lalofutu Point. Most of the shoreline is contained within Fagasa Bay. Five of the streams in the watershed discharge into Fagasa Bay. RESOURCES OF THE WATERSHED Soils The U.S. Soil Conservation Service (National Resource Conservation Service) published a Soil Survey of American Samoa in 1984. Selected information derived from this survey provides some useful information for future watershed planning and management (Figure 8-2). Five different soil classifications were identified by the U.S. Soil Conservation Service for lands within the Fagasa watershed (Table 8-1). TABLE 8-1 SELECTED SOIL CHARACTERISTICS FAGASA WATERSHED Soil Depth To: Land Use Suitability
SCS Soil Unit
Name Typical Slope
(Percent)
Flood Runoff Erosion High Water (Feet)
Bed Rock
(Inches)
Soil Based WW
Treatment
Subsistence Ag
Potential
1 Aua very stony silty clay loam
15-30 None Med Med >6 <60 Severe Slope Moderate
2 Aua very stony silty clay loam
30-60 None Rapid Severe <6 <60 Severe Slope Poor
4 Fagasa family-Lithic Hapludolls-Rock outcrop assoc.
70-130 None Very Rapid
Very Severe
>6 20-60 Severe Slope Depth
Limited
9 Leafu silty clay 0-3 Occ Slow Slight 3-5 >60 Severe Flood Wet
Moderate
34 Urban Land-Ngedebus complex
0-30 A.None L.Occ
A.Slow- Med L. Slow
A.Slight -Mod L. Slight
A. >6 L. 3-5
>60 Severe A. Slope L. Flood Wet
Limited
Notes: 1. A.= Aua- found on mountain foot slopes 6-30 percent 2. L.= Leafu- found on coastal plains & valley floors 0-6 percent Source: U.S. Soil Conservation Service, 1984
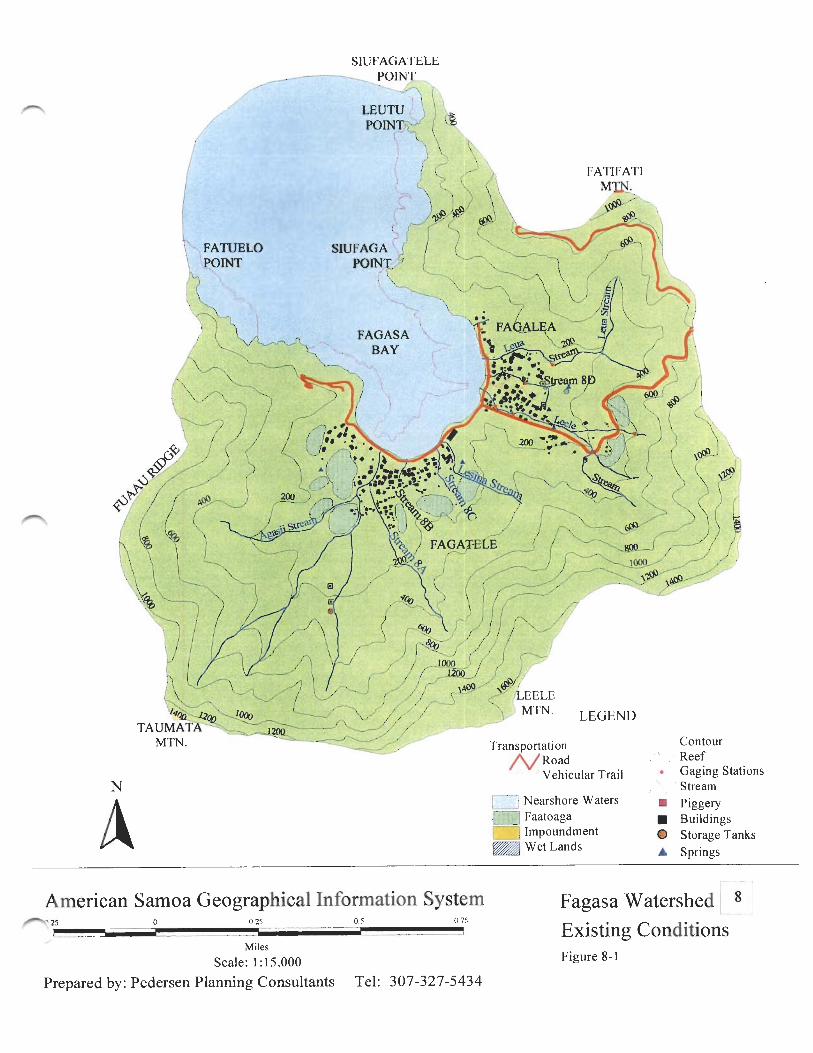

Fagasa, Page 8-4
Aua Very Stony Silty Clay Loam (15 to 30 percent slopes) In Fagatele, this soil type (SCS mapping unit 1) extends between about 500 to 1,500 feet inland from the Fagasa Bay shoreline. This soil is present in the vicinity of Agasii Stream drainage and begins at about the 25-foot elevation. These soils typically occur up to about 60 inches in depth. The permeability of these soils ranges between 2 and 6 inches per hour. The potential for runoff or erosion from the Aua soils is believed to be moderate (U.S. Soil Conservation Service, 1984). While moderately suited for agricultural production, the U.S. Soil Conservation Service estimates that this soil can annually sustain up to 5 tons per acre of erosion without impacting crop productivity (U.S. Soil Conservation Service, 1984). However, the U.S. Soil Conservation Service also advises that the stony and erosive characteristics of these soils may limit production. While its erosive characteristics generally may not significantly impact subsistence crop productivity, the erosive quality of the soil can be a significant contributor to sedimentation in downslope streams and the nearshore waters. The general characteristics of these Aua soils are also undesirable for individual wastewater disposal systems (U.S. Soil Conservation Service, 1984). The soils contain a significant amount of larger stones that typically hamper installation and provide inadequate soil treatment. While possible, it is highly unlikely that the wastewater discharges from the septic tanks or cesspools that serve three existing shoreline residences is significantly impacting nearshore water quality. Aua Very Stony Silty Clay Loam (30 to 60 percent slopes) Below the 600-foot contour, a portion of each stream drainage in the Fagasa watershed contains this soil type (SCS mapping unit 2). In the Fagalea area, this soil occurs in the upper portion of the existing residential area and begins at about the 150-foot elevation. In Fagatele, the Aua very stony silty clay loam is found upland of Aua (SCS mapping unit #) and Leafu soils (SCS mapping unit 9) that characterize the adjoining lower slopes (Figure 8-2). The Aua soils range between seven to 60 inches in depth. The permeability of these soils (between 2 and 6 inches per hour) is moderately rapid. For watershed management purposes, it is important to note that these Aua soils have a high potential for runoff and erosion. This Aua soil is not recommended for agricultural production because of the stoniness of the soil, the high erosion potential, and hazards associated with subsistence crop cultivation on steeper slopes. However, when cultivation in these soils is necessary, the use of a mulch or ground cover is recommended to reduce soil erosion in cultivated areas. The U.S. Soil Conservation Service estimates that this soil can annually sustain up to 5 tons per acre of erosion without impacting crop productivity (U.S. Soil Conservation Service, 1984). While the erosive characteristics of this soil generally may not significantly impact subsistence crop productivity, the erosive quality of the soil can be a significant contributor to sedimentation in downslope streams and the nearshore waters. The general characteristics of these Aua soils are also undesirable for individual wastewater disposal systems (U.S. Soil Conservation Service, 1984). The soils contain a significant amount of larger stones that hamper installation and provide inadequate soil treatment. Fagasa Family-Lithic Hapludolls-Rock Outcrop Association Upland land areas throughout most of the remaining watershed contain deep, well-drained soils on steep mountain ridges and slopes. The U.S. Soil Conservation Service identifies these soils as part of

Fagasa, Page 8-5
the Fagasa family-Lithic Hapludolls-Rock outcrop association (SCS mapping unit 4). This soil type is common and characterizes most of the steep, upland slopes along Tutuila’s north coast. Since this soil type is a combination of two general soil classifications, soil depths can vary between 20 and 60 inches. The soil represents a combination of silty clay and loam. Since the Fagasa Family-Lithic Hapludolls soil typically occurs on very steep slopes, the potential for surface runoff and erosion are high. The cultivation of subsistence crops on these soils is not considered desirable. However, when cultivation in these soils is necessary, care should be exercised to minimize the amount of exposed soil in cultivated areas. When heavier rainfall events occur in this watershed, a significant contribution of soil erosion can be expected from undeveloped upslope areas of the watershed that contain this soil type. Natural runoff from steeper slopes in the watershed carries water, sediments, and organic debris to downslope drainage courses and streams. Such erosion can readily influence downstream water quality. Leafu Stony Silty Clay (0 to 3 percent slopes) Northwest of Agasii stream, a smaller area upslope of Leaatele School contains Leafu stony silty clay soil (SCS mapping unit 9). This soil is a deep soil that typically extends up to 60 inches in depth. Its permeability ranges between 2 and 6 inches per hour. Runoff from these soils is generally slow and the potential for soil erosion is limited. However, these soils are typically subject to brief periods of flooding after heavier rainfall periods. These soils are somewhat suitable for subsistence agriculture. However, this land use is constrained by occasional periods of flooding and general soil wetness. The U.S. Soil Conservation Service estimates that this soil can annually sustain up to 5 tons per acre of erosion without impacting crop productivity (U.S. Soil Conservation Service, 1984). Consequently, the use of these lands for subsistence agriculture is not likely to generate significant downslope erosion. The use of these Leafu soils for residential purposes is not recommended by the U.S. Soil Conservation Service because of its inherent flood potential. The same characteristics also hamper the use of these soils for septic tank systems and related soil-based treatment. Urban Land-Aua-Leafu Complex (0 to 30 percent slopes) Most of the inhabited shoreline and village areas of Fagasa are characterized by these soils. Within the Fagalea area, these soils (SCS mapping unit 34) extends 500 to 1,000 feet inland from the Fagasa Bay shoreline. In Fagatele, the soils extend about 300 to 500 feet from the shoreline. This soil type represents a combination of Aua and Leafu soils. These soils typically are found at depths of 60 inches or more. The permeability of this soil is moderately rapid and ranges between 2 and six inches per hour. The soil has limited to moderate potential for runoff. The erosion potential is slight to moderate. This soil has limited potential for subsistence agriculture. The U.S. Soil Conservation Service estimates that this soil can annually sustain up to 5 tons per acre of erosion without impacting crop productivity (U.S. Soil Conservation Service, 1984). Consequently, the use of these lands for subsistence agriculture is not likely to generate significant downslope erosion. The use of these soils for septic tank systems and related soil-based wastewater treatment is not desirable. A higher composition of larger rock fragments, combined with moderately rapid permeability, does not promote effective wastewater treatment.
Fagasa, Page 8-6
Streams Stream Locations There are eight streams in the watershed; four of the streams are unnamed stream courses (Figure 8-1). All of the streams, except 8B, discharge into the inner part of Fagasa Bay. Agasii Stream, streams 8A, 8B, and 8C, as well as Lesina Stream all flow through the village of Fagatele. The headwaters for all of these streams occur at or below 600 feet. Lesina Stream flows perennially (Amoeualogo, 1996). Leele Stream, stream 8D, and Leua Stream flow through the villages of Fagalea before entering Fagasa Bay. Leele and Leua Streams discharge throughout the year. Stream 8D flows occasionally after heavier rainfall events (Amoeualogo, 1996). Stream Flows Within the Watershed A total of four gages have been operated on streams in the watershed. A continuous-record gage (USGS No. 16917500) was stationed on Leele Stream, approximately 200 feet upstream of the mouth, between 1966 to 1976. The same station was used a partial-record gage between 1977 to 1990. Available stream flow records enabled the U.S. Geological Survey to estimate a median flow of approximately 0.65 cubic feet per second (cfs) at this location. About 0.2 mile upstream from the Leele Stream mouth, a partial-record gage (USGS No. 16917000) provided data that enabled the U.S. Geological Survey to estimate a median flow of 0.62 cfs (Wong, 1996). A low-flow, partial-record station (USGS No. 16918000) was also located on Lesina Stream about 0.1 mile upstream from the Stream mouth. Ten measurements of stream flow at this station were recorded between 1959 and 1965. These measurements were used by the U.S. Geological Survey to estimate a median flow 0.02 cfs at this gage station (Wong, 1996). A low-flow, partial-record station (USGS No. 16916000) was located on Leau Stream approximately 0.2 mile upstream from the Stream mouth. The 18 measurements of stream flow, which were obtained between 1959 and 1975, enabled the U.S. Geological Survey to estimate a median flow of 0.14 cfs at this gage location (Wong, 1996). Aquatic Fishes and Invertebrates Field surveys of fishes and invertebrates were made by the U.S. Fish and Wildlife Service, Division of Ecological Services, in March-April, 1978 and the U.S. Army Corps of Engineers in August, 1980. Leele Stream and Agasii Stream were two of 37 streams in American Samoa that was inventoried by representatives of these federal agencies. Results from both field surveys were summarized in an American Samoa Stream Inventory that was published by the U.S. Army Corps of Engineers, Honolulu District, in July, 1981. Leele Stream
Leele Stream was surveyed in a stony riffle (station 20a) located immediately upstream of a bridge along the shoreline roadway to Fagasa Village. The bridge is situated at about the 10-foot elevation.
Three species of gobie fish and two species of mountain bass were observed along Leele Stream (station 20a). An abundant population of eels was also documented. Five species of shrimp were observed at station 20a; one of the shrimp species was abundant. Two species of crabs were reported to be occasional in abundance. One specie of mollusks was common in abundance. It was also noted that the concrete invert underneath the bridge impeded the normal migration of some aquatic species within Leele Stream.

Fagasa, Page 8-7
Agasii Stream
Agasii Stream was surveyed in a shallow riffle located about 50 feet upstream from the Fagasa Bay shoreline (station 21a).
Two species of gobie fish and two species of mountain bass were identified at station 21a. One species of gobie fish and one species of mountain bass were abundant. Three common and three occasional species of shrimp were also recorded. One abundant species of mollusk was also documented.
Surface Water Quality Streams
Two random samples were made of the waters in Leele Stream (Table 8-2). The analysis included an examination of four water quality parameters. Both samples indicated extremely high levels of coliform bacteria.
TABLE 8-2 RANDOM WATER QUALITY SAMPLINGS LEELE STREAM
Water Quality Parameter TN TKN NO3+NO2 TP Turbidity TSS pH Total Coliform Date (µg/l) (µg/l) (µg/l) (µg/l) (jtu)** (mg/l) (#/100 ml) 08/04/70 -- -- nd* -- 2.0 -- 7.50 18,000 09/13/70 -- -- nd* -- 2.0 -- 6.90 8,000 Notes: * “nd” is an indication that no trace of nitrates were detected. ** Standard analytical practices in the 1970s used Jackson units for measuring turbidity in streams. This standard is not strictly comparable
with the more recently developed ntu standard.
Source: ASEPA, 1996 Nearshore Waters In the nearshore water of Fagasa Bay, random water quality samples were collected from three locations in Fagasa Bay sometime in early 1995 (Table 8-3). This data suggests that the water quality of Fagasa Bay was good at the time of sampling. Otherwise, this information has limited value. TABLE 8-3 RAMDOM WATER QUALITY SAMPLES FAGASA BAY 1995
Parameter Station Fagasa 1 Fagasa 2 Fagasa 3 Geomean Total Nitrogen (µg-N/l)
184
208
194
195.1
Total Kjeldahl N (µg-N/l) 172 193 182 182.1 Nitrate-Nitrite (µg-N/l) 12 15 12 12.9 Total Phosphorus (µg-P/l) 13 12 11 12 Chlorophyll α (µg/L) 0.10 0.10 0.04 0.07 Source: ASEPA, 1996

Fagasa, Page 8-8
ASEPA collected marine water samples from 17 embayments around the Island of Tutuila on July 25 and August 2, 1992. The samples were obtained from the outer portions of the embayments where more water exchange occurs at depths of three and 60 feet. Collected samples were subsequently analyzed for nutrients and chlorophyll a. Nutrient data gained from these samplings indicate that the outer waters of Fagasa Bay met American Samoa water quality standards in late July and early August of 1992 (Table 8-4). Laboratory results also suggest that stormwater runoff from undeveloped lands upland of this embayment does not generate any significant discharge of nutrients. TABLE 8-4 SURFACE WATER QUALITY OUTER FAGASA BAY JULY-AUGUST, 1992
STATION Sample Depth (feet)
Nitrate/ Nitrite mg N/l
Total N
mg N/l
Kjeldahl N
mg N/1
Total P
mg P/1
CHL a
mg/m3
Fagasa Bay 3 60
0.007 0.002
0.153 0.124
0.146 0.122
0.008 0.010
0.34 0.25
Source: ASEPA, 1995 Wetlands There are no significant wetlands that are known to be located in the Fagasa watershed (Whistler, 1976; Biosystems Analysis, 1992). However, a wet area that resembles a taufusi is situated southeast of Leaatele School. The area contains approximately 2.8 acres and is situated between about 12 to 25 feet above mean sea level. This area is fed by surface drainage from Agasii Stream, and does not interchange with nearby marine waters because of its elevation. This wet area was used for some subsistence agriculture in April, 1996. Leafu stony silty clay soils are present in the general vicinity of this wet area. Marine Resources Coral Communities A fringing reef fronts most of shoreline along Fagasa Bay. The fringing reef inside the bay generally extends between Siufaga Point and Saafelo Point. Various private consultants have made various field investigations of the fringing reef in this area since the late 1970’s. In a cumulative sense, available survey information provides suggests that:
• The growth of coral communities in Fagasa Bay has not been significant during the 1979-1995 period.
• The growth of corals at Fagasa Bay appears to have been stressed by diminished water quality, e.g., turbidity. At the same time, the coral communities have also experienced considerable impact from various hurricanes and other significant storm wave periods. These factors appear to constrain the ability of the reef to recover and become more productive (Green, 1996).
1978-1979
Coral coverage was observed to be nearly absent on the inner reef flat of Fagalea Village (Aecos and Aquatic Farms, 1980). On the outer reef flat (beyond 360 feet from shore, coral coverage varied between 10 and 30 percent. In contrast, coral coverage on the reef margin ranged between 10 and 15 percent (Aecos and Aquatic Farms, 1980).
Fagasa, Page 8-9
In contrast, the inner reef that fronts the Fagatele area extended only 50 to 60 feet from the shoreline. Coral coverage in this area was observed to be only one percent. The middle reef flat, which extended about 150 feet from shore, was characterized by a coral coverage that ranged between one to five percent. Coral coverage increased to about 30 percent near the bottom of the reef face (Aecos and Aquatic Farms, 1980).
During field surveys conducted in 1979, marine biologists from the Aecos and Aquatic Farms team observed turbid water conditions over the inner reef flat in both Fagalea and Fagatele. Underwater visibility was estimated to be about 20 feet over the inner reef flat. Lambert, a member of the Aecos and Aquatic Farms team, also observed a fresh-water lens near Saafelo Point after a heavier rainfall period. Such conditions suggested, in part, the influence of surface discharges from, at least, Agasii Stream, as well as Streams 8A and 8B. 1982, 1985, and 1988
During the month of April in 1982, 1985, and 1988, Birkeland and Randall investigated the coral communities in Fagasa Bay. Survey transects were made at a depths of 6-10 feet, as well as 20 feet.
Field survey data indicated increased coral coverage at 6-10 feet between 1982 and Coral coverage was reported to be almost 17 percent in 1982, declined to almost two percent in 1985 and increased to 61 percent in 1988. Significant increases in coral cover were also reported at 20 feet where coral coverage was almost three percent in 1982, increased to 21 percent in 1985, and rose sharply to 51 percent in 1988 (Birkeland, Randall, and Amesbury, 1990). 1992
Field investigations were also made at Fagasa Bay by Maragos, Hunter, and Meier in 1992. These marine ecologists primarily surveyed the outer reef margin and reef slopes of the fringing reef inside the Bay. A 10 percent coral coverage was observed in shallow nearshore waters of about six meters in depth. In contrast, a 40 percent coverage was noted at about 18 meters. 1995
A recent 1996 study of various coral reefs throughout the Samoan Archipelago included, in part, some onsite investigations of the fringing reef on the east side of Fagasa Bay. The study focused primarily upon the quantification of coral communities, the abundance and diversity of reef fish, and selected habitat characteristics.
In comparison with other sites on Tutuila, Green observed that the fringing reef in Fagasa Bay was in “worse” condition and characterized by diminished water quality. This conclusion was supported by data obtained from field surveys, which were conducted in this area between November, 1994 and November, 1995.
Field observations indicated that the reef front of the fringing reef at Fagasa Bay had a low coral cover (less than 20 percent) at about 10 meters in depth . The number of species observed represented less than 100 species and was considered “low” compared to other sites on Tutuila, Manua, and Western Samoa. Fish density was considered “low”, or less than 5,000 and 9,999 individuals per ha. Fish biomass was determined to be “low” and less than 500 kilograms per ha (Green, 1996).
Shoreline Protection
Despite the presence of a significant fringing reef, the shoreline of Fagasa Bay has been significantly influenced by hurricanes and stormwaves. The shoreline of Fagalea receded significantly between 1966 and 1996.

Fagasa, Page 8-10
Before 1966, the shoreline at Fagalea was about 50 feet seaward of the location observed in April, 1996. In Fagatele, the shoreline was located some 200 feet seaward of the church that is immediately northeast of Lesina Stream (Amoeualogo, 1996).
During the April, 1996 survey, a basaltic shoreline revetment was observed between Leele Stream in Fagalea and Leaatele School in Fagatele. The revetment fronting Fagalea was originally built after the occurrence of Hurricane Ofa in 1990. Unfortunately, Hurricane Val (1991) damaged this revetment and, at the same time, reduced the elevation of the shoreline. Following the occurrence of Hurricane Val, the revetment along the Fagatele shoreline was re-constructed in 1992 (Amoeualogo, 1996).
The presence of additional shoreline damage was also evident in April, 1996 along the shoreline that fronts Leaatele School. The presence of larger rocks and other basaltic material in the nearshore waters strongly suggest that this shoreline has retreated, at least, 50 feet in recent years. Groundwater and Surface Water Supplies Groundwater Supply and Quality
In September, 1995, approximately 42 percent of all village homes were connected to the ASPA satellite water system in Fagasa. This lower connection rate resulted from the fact that distribution was only available to the eastern half of Fagasa. However, this system was recently expanded to provide service to all homes in the village (American Samoa Power Authority, 1996).
The ASPA water system includes the us of two groundwater wells that were constructed in 1991. These wells are located in Fagalea near Stream 8D (between the 50 and 75-foot contour). Surface Water Supply and Quality
An older village water system remains in use for a few residents at the upper end of Fagalea. The village water system provides the village with water that is generally used for the maintenance of piggeries and the washing of cars.
Three vaipuna, or springs, are located in Fagalea near the 150-foot elevation. One of these springs feeds a man-made impoundment that was built by the Fagasa village in the early 1970s.
A second source of water that supports the village water system is Agasii Stream in Fagatele. A stream catchment is located along the stream at about the 20-foot contour. Proposed Water System Improvements
No new plans are anticipated to supplement the overall water system that was recently developed by the American Samoa Power Authority. The new system generally includes the following:
• four groundwater wells; • one 50,000 and one 100,000 gallon storage tanks; • 4 and 6-inch PVC distribution lines. USE OF THE WATERSHED Resident Population
Between 1980 and 1990, the resident population of Fagasa Village increased from 657 to 717 residents. Such growth represented an average annual growth rate of about 0.91 percent. Based upon new residential construction between 1990 and 1995, it is estimated that the 1995 resident population included approximately 1,043 persons.
Population trends reflected in the 1990 Census statistics suggest that significant in-migration has occurred in this community between 1980 and 1990. The proportion of residents who were born outside of the community during the 1980-1984 period was about 14 percent. Between 1985 and

Fagasa, Page 8-11
1990, the proportion increased to 27 percent. However, in 1990, the proportion increased to 39 percent. Discussions with one local resident during a November, 1994 survey suggest that many of the new incoming residents are from Western Samoa. Land Uses
Residential
The 1990 U.S. Census documented 90 homes in Fagasa. Ninety-five percent of the homes were owner-occupied; three percent were rental units. The remaining two percent were vacant or used as vacation homes by absentee owners. The housing stock expanded considerably during the 1990-1995 period after limited growth during the previous decade. ASG Building Division records indicate that 38 new residential building permits were issued during this period. Consequently, the 1995 housing stock in Fagasa included approximately 128 houses.
Agriculture
Agricultural activities in Fagasa include smaller faatoaga in Fagatele and Fagalea. These agricultural areas include the production of typical subsistence crops such as banana, coconut, taro, and breadfruit.
There are, at least, nine piggeries in the watershed. Approximately three piggeries are located in Fagalea; the remaining are situated in Fagatele.
Commercial
In 1995, ASG business license records indicate that there were 20 commercial enterprises based in Fagasa. One of these enterprises was established during the 1990-1995 period.
In 1995, commercial enterprises included five grocery stores, four bus companies, three retail stores, two laundromats, two pool halls, one commercial farm operation, one building contractor, one plumber, and one audio/videotape and one retail store. Industrial
No light industrial operations were based in Fagasa in 1995. Public Facilities
The ASG Department of Education offers early childhood programs in Fagasa and Fagalea. These programs provided educational opportunities for a The ASG Department of Education offers early childhood education programs in combined total of 40 younger children in September, 1994.
Elementary school-aged children attend Leatele Elementary School in Fagasa and Samoana High School in Utulei. Use of Nearshore Waters Nearshore Fishing
Tulafale Tufu Amoeualogo, a member of Fagasa’s traditional village council, indicates that up to about 20 residents use the nearshore on any given day of the week for fishing activities. The primary use of the nearshore waters is for swimming and general recreation.
An American Samoa Subsistence Fishing Survey was conducted by the University of Hawaii Sea Grant Program in the summer of 1992. This survey involved onsite interviews with shoreline users who were participating in fishing activities on selected days during that period. The results of the survey revealed, in part, that there is considerable use of the nearshore waters in Fagasa.
Some 40-50 persons were documented fishing on the Fagasa area reef. Fishing methods observed included diving, throw net, rod-and-reel, pole, gill net, gleaning, spear, and hand-and-line in a paopao.
Fagasa, Page 8-12
RESOURCE MANAGEMENT ISSUES Future Land Uses to the Year 2015 Residential Some residential expansion is expected to occur in Fagasa during the next 20 years. However, the rate of growth will more closely probably resemble the 1980-1990 period because of the lack of developable lands. Steeper slopes that are immediately mauga of the primary residential area will limit the extent of residential construction mauga of the Village. However, the attractiveness of this community will likely continue to bring greater in-migration from the continental United States, Hawaii, and Western Samoa until the supply of developable land is depleted.
Future residential expansion will represent the infilling of two potential housesites and the reconstruction of homes on three vacant foundations in Fagalea between the shoreline and the 25-foot elevation. Infilling can also be expected within the main village of Fagasa where six developable sites are located between 25 and 300 feet above mean sea level. Primary residential growth will likely occur in Fagatele between the 25 and 100-foot elevation; about 19 additional homes sites are feasible in this area.
During the next 20 years, ASPA believes that these potential development opportunities and constraints will generate the following sequence and volume of residential construction.
1996-2000 Two new single family homes in Fagalea between the shoreline and the 25-foot elevation.
One new home will be built within the main village of Fagasa between the 25 and 300-foot elevation.
Six new single family homes will be constructed in Fagatele between the 25 and 100-foot elevation.
2001-2005 Two new single family homes in Fagalea between the shoreline and the 25-foot elevation.
One new home will be built within the main village of Fagasa between the 25 and 300-foot elevation.
Six new single family homes will be constructed in Fagatele between the 25 and 100-foot elevation.
2006-2010 Three new homes will be built within the main village of Fagasa between the 25 and 300-foot elevation.
One new single family home will be constructed in Fagatele between the 25 and 100-foot elevation.
2011-2015 One new single family home in Fagalea between the shoreline and the 25-foot elevation.
One new home will be built within the main village of Fagasa between the 25 and 300-foot elevation.
Six new single family homes will be constructed in Fagatele between the 25 and 100-foot elevation.
The cumulative effect of this prospective residential growth is that the village housing stock will increase to roughly 158 housing units in the year 2015. During the same period, it is believed that the average household size will have gradually decreased to approximately 6.76 persons per household. The anticipated village population in the year 2015 will include about 1,068 persons.
Fagasa, Page 8-13
Agriculture The present level of subsistence agriculture is also expected to increase even though the per capita consumption of subsistence crops should decline. The continued westernization of the American Samoa population will increase the demand for imported foods.
Commercial
Future commercial facility expansion in Fagasa near the shoreline in the Fagatele residential area. It is expected that two additional retail stores will be built in the primary village area by the year 2000. Industrial The gradual increase in resident population is expected to attract one small, home-based enterprise of an industrial nature. However, the construction of new industrial facilities is not anticipated. Public Facilities Population characteristics for Fagasa in 1990 suggest that approximately six percent of the village population is three and four years of age. Elementary school-aged children (5 and 13 years old) include about 23 percent of the village population; high school students represented about ten percent of the population. The application of 1990 population characteristics to the anticipated 2015 village population suggest increased student enrollments in future early childhood, elementary education, and high school programs within and outside of Fagasa. Anticipated student enrollments from the village population are expected to be as follows in the year 2015:
• early childhood education 64 students • elementary school 246 students • high school 107 students Impact of Future Population Growth Upon Water Consumption and Waste Generation The significance of increased residential and population growth in the watershed will be an increase in Fagasa’s total volume of wastewater and solid waste generation. Future wastewater generation is forecasted to rise from 28,718 gallons per day in 1995 to 70,140 gallons per day in the year 2015 (American Samoa Power Authority, 1996).
A greater resident population will also consume more potable water. The average day demand for water consumption in the year 2015 is anticipated to be 100,200 gallons per day (gpd). Such demand is more than double the total estimated consumption in 1995 (41,026 gpd). Flood Potential A flood insurance study of American Samoa and related flood insurance rate maps were published by the U.S. Federal Emergency Management Agency (FEMA) in 1991. The study evaluated selected geographical locations throughout the Territory. Hydrologic and hydraulic analyses presented in the study were made by the U.S. Army Corps of Engineers, Pacific Ocean Division. Leua, Leele, and Agasii Streams were three of numerous streams that were analyzed in this study. Inland Flood Potential The flood insurance rate map for the Fagasa area indicates that a 100-year flood condition will generate considerable inland flooding along each of these streams, as well as stream 8D. However, no base flood elevations were determined for the 100-year flood. The flood insurance rate map for

Fagasa, Page 8-14
Fagasa Bay also indicates that the Agasii Stream culvert that passes underneath the primary shoreline roadway in Fagatele will accommodate a 100-year flood discharge. Aside from the 100-year flood potential, some flooding frequently occurs in the Leaatele School malae following heavier rainfall periods. The cause of this flooding is the occasional blockage of an overflow ditch from the nearby taufusi to the nearshore waters. When these conditions occur, the village aumaga typically remove garbage and organic debris by hand. In some cases, the ASG Department of Public Works removes these materials through the use of a backhoe (Amoeualogo, 1996). Otherwise, the principal of the Leaatele School reported that stormwater runoff usually stay within the banks of existing ditches on the east and west sides of the school. Shoreline areas near the mouth of Leua and Leele Streams are designated by the Federal Emergency Management Agency (FEMA) as “zone x”. This designation indicates that the area is outside of the 100-year floodplain (Federal Emergency Management Agency, 1991). In essence, FEMA is suggesting that the flood hazard potential in these areas are limited. Coastal Flood Hazard The flood insurance rate map for Fagasa Bay indicates that there is a coastal flood hazard through much of the nearshore waters and adjoining shoreline. A potential 100-year flood is estimated to generate flood levels in these areas that will range between three and five feet above mean sea level. Stormwater Runoff/Sedimentation and the Relationship to Surface Water Quality Heavier rainfall periods, steeper inland slopes, and more erosive soils in the Fagasa watershed regularly contribute to periodic erosion the related transport of sediments into the eight streams of the watershed. Ultimately, this natural erosion process carries a portion of these sediments into the nearshore waters that adjoin the watershed, especially during medium to higher flow stream conditions. Natural erosion from the undeveloped, upslope areas of the watershed is believed to be the primary cause of sedimentation in local streams, as well as downstream sedimentation of the nearshore waters. All drainage areas of the watershed are impacted natural erosion and downstream sedimentation. Some erosion may also be occurring from some faatoaga that are upslope of the upper Fagatele and Fagalea areas. During heavier rainfall periods, some erosion probably occurs and causes some sedimentation of all streams except Leua Stream in Fagalea. Urban runoff also occurs in the watershed. The primary source is the new primary roadway that comes into Fagasa from nearby Pago Pago. The roadway, which was completed in 1995, contains a concrete curb on the mauga side of the roadway that contains one-inch drain holes. Drainage collected by the curbs is discharged in Leele Stream at intermittent points along the roadway. The remaining urban runoff is generated from rainfall on impermeable surfaces of buildings and other paved roadway area. Such runoff is discharged throughout the inhabited village areas A future watershed management concern is the location of future residential development in Fagasa. As stated earlier, future residential growth is expected to be limited. However, it is anticipated that future residential construction will primarily occur in Fagatele between the 25 and 100-foot elevation. Such development could generated increased surface runoff and soil erosion. Ultimately, increased runoff and soil erosion would most likely drain to Agasii Stream and contribute to the increased sedimentation of Fagasa Bay. The detention of future stormwater runoff before its discharge to the nearshore waters is desirable. However, potential opportunities are limited. One potential location lies near the back of the Fagatele area. A small wet area, which was used for banana production in April, 1996, may be able to be used
Fagasa, Page 8-15
to detain some stormwater runoff from Agasii Stream. This potential opportunity should be examined through the modeling of potential stormwater flows and the preparation of a conceptual development plan. A second opportunity for the detention of stormwater can be achieved through the required use of drywells for new residential and commercial development where undesirable stormwater discharges are anticipated. The construction of impermeable surfaces, e.g., concrete drive ways, should be discouraged because they do not afford any percolation. In contrast, the spreading of coral rubble around the perimeter of homes provides some limited opportunity for percolation and helps reduce urban runoff. Nearshore Water Quality and the Marine Environment Turbidity and Sedimentation The marine environment of Fagasa Bay is frequently stressed by decreased water quality in the nearshore waters, as well as hurricanes and storm waves. Potential increases in the rate of sedimentation in the nearshore waters will only slow the recovery of the fringing reef in Fagasa Bay. Coral communities are significantly dependent upon the availability of light and related photosynthesis, and occasional periods of significant turbidity and sedimentation do not promote long-term coral nutrition, growth, reproduction, and depth distribution (Richmond, 1993). When corals fertilize, they are free-swimming. Consequently, they need a good location to settle and make a good attachment. With significant soil deposition, sediments can physically interfere with the recruitment of coral larvae (Richmond, 1993; Dashbach, 1996). Coral communities are an important component of the overall ecology of Fagasa Bay. They provide shelter to fish, invertebrates, and other marine organisms, as well a supplemental food source for some Fagasa residents. Nutrient Inputs A nutrient contribution is also occurring through the continued use of septic tanks, cesspools, or other soil-based, wastewater treatment systems in the watershed. In addition, some of the piggeries may also generating nutrient-enriched discharges into local stream. These sources of nutrients are also accompanied by some bacterial contamination from these discharges. While the total volume of wastewater generation from the watershed is limited, the discharges are concentrated in the inhabited village areas of Fagalea and Fagatele where housing densities range between two and five housing units per acre. Local soils are generally inadequate to provide effective treatment. The long-term input of turbid and nutrient-enriched waters into the nearshore waters represents an important concern. These inputs are potentially detrimental to the quality because they can adversely change the composition of the nearshore marine environment. However, the degree of impact upon water quality is also highly dependent upon currents and water exchange within the nearshore environment. As the population of the watershed grows, nutrient and bacterial inputs will only increase. Aside from these resource management considerations, the future use of the nearshore waters for fishing, swimming and general recreation will eventually represent a more significant public health concern unless practical steps are made to reduce potential nearshore water contamination.
Fagasa, Page 8-16
The remote location will not enable Fagasa to be incorporated into the ASPA wastewater collection system. In the absence of this reality, inhabited village areas in the Fagalii watershed that are unsuitable for soil-based, wastewater treatment should be more specifically identified. As recommended in the ASPA Utilities Master Plan, this identification process should be based upon a more detailed sanitation survey of more densely inhabited areas in the shoreline and upland village areas. This survey would evaluate existing wastewater treatment practices, soil characteristics, the location and density of land uses, the distance to surface water supplies and the nearshore waters, topography, and other related factors. Using the conclusions and recommendations associated with this evaluation, ASPA and other participating Project Notification and Review System (PNRS) agencies will be better able to:
• require the use of septic tanks and leachfields that provide a sufficient amount of additional soil-based treatment;
• provide greater technical assistance to building permit applicants; and, if necessary, • deny building applications in land areas that are unsuitable for soil-based treatment systems. Long-Term Monitoring The future monitoring of the nearshore waters is necessary and should be combined with water quality monitoring of Agasii, Lesina, and Leele Streams. Turbidity and sedimentation are the primary stresses to the coral communities in the nearshore waters of these embayments. However, future levels bacterial contamination and nutrient inputs should also be documented to help ensure future public safety and evaluate potential stresses to the fringing coral reef communities. In addition, the ASG Department of Marine and Wildlife Resources should monitor the coral communities along the fringing reef front in the northeast part of Fagasa Bay at least once every three years. Long-term monitoring of this site should also include an evaluation of the impact of sedimentation and turbidity that already influences the nearshore marine environment. Groundwater and Surface Water Supplies The availability of a groundwater supply in the watershed eliminates most significant concerns related to future groundwater and surface water supplies. However, each groundwater well should be conserved through the establishment of a 100-foot setback from each groundwater well and surface water supply in the watershed. MANAGEMENT NEEDS AND RECOMMENDATIONS The primary focus of future resource management in the Fagasa watershed will be to:
• investigate potential opportunities for stormwater detention in Fagatele; • detain urban runoff through the use of drywells in conjunction with the development of new
building structures; • maintain culverts underneath the primary shoreline roadway; • perform detailed sanitation survey of inhabited village areas; • monitor water quality of selected streams and nearshore waters; and, • conserve coral communities. Representatives of participating public agencies should make periodic visits to the watershed to observe, document, and monitor selected resource conditions, determine potential methods of correcting a potential hazard or undesirable conditions, share potential solutions with designated residents of Amanave, and encourage the participation of traditional leaders and village residents in the implementation of resource management solutions.

Fagasa, Page 8-17
The scope of issues that should be addressed by each agency in the field is summarized in Table 8-5. The general focus of recommended technical assistance is also identified. The experience and insights of agency representatives will determine the specific methodology to be used in the field. TABLE 8-5 RECOMMENDED FOCUS OF FUTURE TECHNICAL ASSISTANCE FAGASA WATERSHED
Participating Public Agency
Resource Management Issue
Focus of Technical Assistance
ASEPA Facilitate a coordinated resource management effort within the watershed.
1. Coordinate overall watershed management activities. 2. Hold periodic meetings with participating ASG and federal agencies to discuss, prioritize, and schedule resource management activities. 3. Coordinate program efforts with local traditional leaders and/or designated resident of the watershed. 4. Make annual assessment of resource management program.
ASEPA Monitor water quality of Agasii, Lesina, and Leele Streams, as well as the nearshore waters
Measure changes in and total/fecal bacteria, total suspended solids, turbidity, and nutrients on a quarterly basis.
ASPA/ASEPA Perform a detailed evaluation of community sanitation problems associated with the use of soil-based treatment systems.
1. Survey inhabited village areas in Fagalea and Fagatele. 2. Evaluate existing treatment practices, soil characteristics, location and density of land uses, the distance to water supplies and nearshore waters, topography, and other factors. 3. Require use of septic tanks and leachfields that provide sufficient amounts of additional soil-based treatment; or, deny building applications in areas unsuitable for soil-based treatment.
ASEPA Conserve and enhance potential inland stormwater detention and groundwater recharge opportunities
1. Investigate potential stormwater detention opportunities in Fagatele near Agasii Stream. 2. Model potential stormwater flows and determine detention opportunities. 3. Where feasible, prepare conceptual plans for storm-water detention and estimate order-of-magnitude costs.
ASEPA Conserve surface water supplies
1. Identify village surface water supplies that are actively used. 2. Revise American Samoa GIS to delineate 100-foot buffers around each groundwater and surface supply. 3. Restrict land uses within designated buffers.
ASCZM/DOC Detain stormwater runoff in future residential and commercial areas.
Where undesirable stormwater discharges are anticipated, require the use of onsite drywells for new residential and commercial facilities in Fagasa.
Continued – next page

Fagasa, Page 8-18
TABLE 8-5 (continued) RECOMMENDED FOCUS OF FUTURE TECHNICAL ASSISTANCE FAGASA WATERSHED
Participating Public Agency
Resource Management Issue
Focus of Technical Assistance
ASDPW Maintain culverts along the primary shoreline roadway
1. Establish a periodic storm culvert maintenance program. Consider use of village labor to supplement DPW heavy equipment. 2. Clean debris and other material blocking culverts.
ASDOC Monitor changes in population and land use
Annually map type and location of land uses in village and estimate resident population.
ASCC Land Grant Program
Reduce sedimentation from agricultural activities
1. Determine locations where upslope agricultural activities may be generating some sedimentation. 2. Encourage soil conservation methods with resident growers of subsistence crops.
ASDMWR Sustain healthy marine communities in nearshore waters
Monitor changes in coral coverage, fish habitat, diversity and other characteristics in Fagasa Bay approximately once every three years.
Source: Pedersen Planning Consultants, 1998

Fagatuitui-Vaaogeoge, Page 9-1
FAGATUITUI-VAAOGEOGE Watershed 09 GEOGRAPHY The Fagatuitui-Vaaogeoge is a remote watershed that is situated along the north and northwest slopes of Mount Alava. This watershed contains about 2.0 square miles of land area (Figure 9-1). The upper watershed boundaries generally include Mt. Alava, the northwest slopes of Fatifati Mountain, as well as the mountain ridges known as Faiga, Mauagotula, Siuono, and Polauta. The Fagatuitui-Vaaogeoge watershed is characterized by, at least, 13 steep mountain ridges. Along the shoreline, the watershed extends between Lalofutu Point and an unnamed point of the northeast side of Vaaogeoge Cove. Thirteen stream courses in the watershed drain directly to the nearshore waters along Tutuila’s northern coast. The overall Fagatuitui-Vaaogeoge watershed planning area contains several smaller watersheds. RESOURCES OF THE WATERSHED Soils The U.S. Soil Conservation Service (National Resource Conservation Service) published a Soil Survey of American Samoa in 1984. Selected information derived from this survey provides some useful information for future watershed planning and management (Figure 9-2). Two soil classifications were identified by the U.S. Soil Conservation Service for lands within the Fagatuitui-Vaaogeoge watershed (Table 9-1). TABLE 9-1 SELECTED SOIL CHARACTERISTICS FAGASA WATERSHED
Soil Depth To: Land Use Suitability SCS Soil Unit
Name Typical Slope
(Percent)
Flood Runoff Erosion High Water (Feet)
Bed Rock
(Inches)
Soil Based WW
Treatment
Subsistence Ag
Potential
2 Aua very stony silty clay loam
30-60 None Rapid Severe <6 <60 Severe Slope Poor
4 Fagasa family-Lithic Hapludolls-Rock outcrop assoc.
70-130 None Very Rapid
Very Severe
>6 20-60 Severe Slope Depth
Limited
Source: U.S. Soil Conservation Service, 1984 Aua Very Stony Silty Clay Loam (30 to 60 percent slopes)
Aua very stony Silty Clay Loam on 30 to 60 percent slopes (SCS mapping unit 2) characterizes a very small portion of the watershed. These soils are present in some of the steeper slopes that are situated upslope of Vaaogeoge Cove (between the shoreline and the 400-foot contour). The Aua soils range between seven to 60 inches in depth. The permeability of these soils (between 2 and 6 inches per hour) is moderately rapid. For watershed management purposes, it is important to note that these Aua soils have a high potential for runoff and erosion.


Fagatuitui-Vaaogeoge, Page 9-4
This Aua soil is not recommended for agricultural production because of the stoniness of the soil, the high erosion potential, and hazards associated with subsistence crop cultivation on steeper slopes. However, when cultivation in these soils is necessary, the use of a mulch or ground cover is recommended to reduce soil erosion in cultivated areas. The U.S. Soil Conservation Service estimates that this soil can annually sustain up to 5 tons per acre of erosion without impacting crop productivity (U.S. Soil Conservation Service, 1984). While the erosive characteristics of this soil generally may not significantly impact subsistence crop productivity, the erosive quality of the soil can be a significant contributor to sedimentation in downslope streams and the nearshore waters. The general characteristics of these Aua soils are also undesirable for individual wastewater disposal systems (U.S. Soil Conservation Service, 1984) The soils contain a significant amount of larger stones that hamper installation and adequate soil treatment. Fagasa Family-Lithic Hapludolls-Rock Outcrop Association
Virtually all of the land area of the Fagatuitui-Vaaogeoge watershed contain deep, well-drained soils. The U.S. Soil Conservation Service identifies these soils as part of the Fagasa family-Lithic Hapludolls-Rock outcrop association (SCS mapping unit 4). This soil type is common in the watersheds along Tutuila’s north and northwest coast and characterizes most of the steep, upland slopes.
Since this soil type is a combination of two general soil classifications, soil depths can vary between 20 and 60 inches. The soil represents a combination of silty clay and loam. Since the Fagasa Family-Lithic Hapludolls soil typically occurs on very steep slopes, the potential for surface runoff and erosion are high.
The cultivation of subsistence crops on these soils is not considered desirable. However, when cultivation in these soils is necessary, care should be exercised to minimize the amount of exposed soil in cultivated areas.
When heavier rainfall events occur in this watershed, a significant contribution of soil erosion can be expected from the undeveloped upslope areas of the watershed that contain this soil type. Natural runoff from steeper slopes in the watershed carries water, sediments, and organic debris to downslope drainage courses. Such erosion can readily influence downstream water quality. Streams Stream Locations The watershed contains 13 streams. All of these streams follow relatively straight courses before they discharge into the nearshore waters. There are six unnamed streams (Streams 9A through 9E) between Lalofutu Point and Agapie Cove. Streams 9A and 9B both discharge into Fagatuitui Cove. Discharges from Streams 9C through 9G occur at smaller, unnamed coastal indentations along the shoreline. East of Agapie Cove, Streams F through I, as well as Nuutoga and Vaisa Streams, also discharge along the coast. These stream courses range between 0.4 and 1.4 miles in length. The remaining two streams, Streams J and K, drain directly into Tafeu Cove. Both of these streams extend about 1.0 mile in length before their discharge into the nearshore waters.

Fagatuitui-Vaaogeoge, Page 9-5
Stream Flows Within the Watershed There is no historical information concerning the rate of flow from the 13 streams in the Fagatuitui-Vaaogeoge watershed. Aquatic Fishes and Invertebrates Field surveys of fishes and invertebrates were made by the U.S. Fish and Wildlife Service, Division of Ecological Services, in March-April, 1978 and the U.S. Army Corps of Engineers in August, 1980. Vaisa Stream and an unnamed stream (stream 9J or 9K) were two of 37 streams in American Samoa that were inventoried by representatives of these federal agencies. Results from both field surveys were summarized in an American Samoa Stream Inventory that was published by the U.S. Army Corps of Engineers, Honolulu District, in July, 1981. Vaisa Stream was surveyed in a pool between two falls just upstream of the stream’s shoreline terminus (station 36a). The second unnamed stream (stream 9J or 9k), which discharges into Tafeu Cove, was surveyed in a pool and terminal riffle at the base of a waterfall at about five feet above mean sea level (station 37a). One abundant specie of gobie fish were observed along Vaisa Stream (station 36a). No eels were documented. Two species of shrimp were found at station 36a; one of the shrimp species was abundant. One species of mollusks was also observed along Vaisa Stream. Along the unnamed stream (stream 9J or 9K), two species of gobie fish and one species of mountain bass was documented (station 37a). An occasional abundance of one eel specie was observed. Five species of shrimp were occasional or common in abundance. Only one species of mollusk was reported. Surface Water Quality No historical water quality data is available for the 15 streams in the Fagatuitui-Vaaogeoge watershed. Wetlands No wetlands are located in the watershed. Marine Resources Coral Communities Various private consultants have made occasional field investigations in the nearshore waters of the Fagatuitui-Vaaogeoge watershed since the late 1970’s. In a cumulative sense, available survey information provides suggests that:
• The coral communities that adjoin the watershed were impacted by the crown-of-thorns outbreak in the late 1970s. However, where infestation was documented, significant recovery from this environmental stress occurred within a relatively short period of time.
• Heavier rainfall periods, steeper slopes, and related erosion processes carry basaltic rocks and larger boulders to the nearshore waters of, at least, Agapie Cove.
1977-1978
In late 1977, numerous crown-of-thorns starfish were observed on the fringing reef in Fagatuitui Cove. Only a few crown-of-thorns starfish were observed on the forereef slopes between Mulivaisigano Point and Fagasa Bay by mid-1978. Some crown-of-thorns starfish were also documented in the vicinity of Manofa Rock near Samituutuu Point. However, no

Fagatuitui-Vaaogeoge, Page 9-6
crow-of-thorns starfish were observed on the bottom slopes of Vaaogeoge Cove in June, 1978 (Aecos and Aquatic Farms, 1980).
One year later, about 60 percent of the corals near Muliulu Point were living at depths between 6 to 33 feet (2 to 10 meters) in August-September, 1979 and the presence of crown-of-thorns starfish was sparse. Only five percent of the corals at the same depth were noticed in the vicinity of Manofa Rock. In contrast, about 90 percent of the corals were observed living on the bottom of the nearshore waters in Tafeu Cove between 6 and 33 feet (Aecos and Aquatic Farms, 1980).
1992
Field investigations were also made in Agapie Cove by in 1992. These marine ecologists primarily surveyed the outer reef margin and reef slopes of the fringing reef inside the Bay. Less than one percent coral coverage was observed in shallow nearshore waters of about six meters in depth. In contrast, a 10 to 15 percent coverage was documented at about 18 meters.
The reef slopes at Agapie Cove were described by Maragos, Hunter, and Meier as “….more gradual and coral domes or mounds were reported at depths below 6m to depths of 25m or more…..Accumulations of rounded basalt cobbles and boulders were seen at shallower depths”. 1995
In 1996, Alison Green conducted a study of various coral reefs throughout the Samoan Archipelago. The study focused primarily upon the quantification of coral communities, the abundance and diversity of reef fish, and selected habitat characteristics. However, no marine surveys of the coral reef communities that are adjacent to the Fagatuitui-Vaaogeoge watershed were included in this study.
Wildlife Resources Fruit bat roosts are located along the steep upland slopes of Faiga Ridge and Puaneva Point. In FY 1997, the ASG Department of Marine and Wildlife Resources estimated a minimum population of 100 fruit bats in the vicinity of Faiga Ridge and about 300 fruit bats at Puaneva Point. These estimates were based upon a combination of exit counts, dawn return counts, and/or boat counts in FY 1997 (Utzurrum, 1998). The inclusion of the Fagatuitui-Vaaogeoge and Vatia watersheds into the U.S National Park system in 1988 provided considerable legal protection to this remote wildlife habitat. However, wildlife biologists fear that any public access near roost sites will generate some hunting pressure (Brooke, 1997). Shoreline Protection There is some evidence that, at least, portions of the watershed coastline are significantly influenced by natural coastal erosion processes such as wave action, nearshore currents, and occasional storm waves. “Small streams near Samituutuu Point (Point Nelson) flow in hanging valleys because waves have cut back the coast faster than streams have cut downward” (Aecos and Aquatic Farms, 1980). Unlike many other watersheds on Tutuila, much of the shoreline of this watershed contains no fringing reef.
Fagatuitui-Vaaogeoge, Page 9-7
Groundwater and Surface Water Supplies There are no groundwater wells or surface water sources in the watershed that are used to provide a source of potable water for adjoining village areas. USE OF THE WATERSHED Population The Fagatuitui-Vaaogeoge watershed is uninhabited. Land Uses Steeper upland slopes and limited vehicular access discourage any use of the watershed for residential, agricultural, and other land uses. Use of the Nearshore Waters Nearshore Fishing No information collected during the April, 1996 indicates that any fishing activity occurs in the nearshore waters that adjoin the watershed. Steeper slopes and the lack of vehicular access virtually prohibit and opportunities for shoreline fishing. RESOURCE MANAGEMENT ISSUES Future Land Uses to the Year 2015 Future development and use of the watershed by the resident population of American Samoa is, at best, a remote possibility. Again, steeper slopes will discourage the development of any vehicular or pedestrian access. Consequently, human activities are not expected to influence the resources contained in this watershed. The presence of Mt. Alava at the upper end of watershed will restrict potential impacts, e.g., urban runoff, from the adjoining Pago Pago watershed. Heavier rainfall periods, steeper slopes, and erosive soils will continue to periodically erode soil and rock material on steeper slopes. The natural erosion process will carry a portion of this material to the 15 stream courses in the watershed. Silt-laden runoff and some basaltic material will continue to be discharged into the nearshore waters. Impact of Future Population Growth Upon Water Consumption and Waste Generation Since the watershed is expected to remain uninhabited, no increases in water consumption or waste generation are anticipated. Flood Potential A flood insurance study of American Samoa and related flood insurance rate maps were published by the U.S. Federal Emergency Management Agency (FEMA) in 1991. The study evaluated selected geographical locations throughout the Territory. Hydrologic and hydraulic analyses presented in the study were made by the U.S. Army Corps of Engineers, Pacific Ocean Division. However, no specific analysis was made of any stream in the watershed.

Fagatuitui-Vaaogeoge, Page 9-8
Inland Flood Potential The flood insurance rate map that encompasses the Fagatuitui-Vaaogeoge watershed indicates that the entire watershed has been designated by FEMA as “zone x”. This designation indicates that the area is outside of the 100-year floodplain (Federal Emergency Management Agency, 1991). In essence, FEMA is suggesting that the flood hazard potential in this watershed is limited. Coastal Flood Hazard The flood insurance rate map for the shoreline of the Fagatuitui-Vaaogeoge watershed indicates that there is a coastal flood hazard along the shoreline of the watershed. A potential 100-year flood is anticipated to generate flood levels approximately three feet above mean sea level (MSL) in these areas. MANAGEMENT NEEDS AND RECOMMENDATIONS The primary focus of future resource management in the Fagatuitui-Vaaogeoge watershed will be to:
• monitor future changes in land use; • limit future land uses in the watershed to watershed conservation and recreation; and, • restrict structural development in the watershed. Representatives of participating public agencies should make periodic visits to the watershed to observe, document, and monitor selected resource conditions, and determine methods of addressing any potential hazard or undesirable conditions. The scope of issues that should be addressed by each agency in the field is summarized in Table 9-2. The general focus of recommended technical assistance is also identified. The experience and insights of agency representatives will determine the specific methodology to be used in the field. TABLE 9-2 RECOMMENDED FOCUS OF FUTURE TECHNICAL ASSISTANCE FAGATUITUI-VAAOGEOGE WATERSHED
Participating Public Agency
Resource Management Issue
Focus of Technical Assistance
ASEPA Facilitate a coordinated resource management effort within the watershed.
1. Coordinate overall watershed management activities. 2. Hold periodic meetings with participating ASG and federal agencies to discuss, prioritize, and schedule resource management activities. 3. Coordinate program efforts with local traditional leaders and/or designated resident of the watershed. 4. Make annual assessment of resource management program.
ASDOC Restrict land uses other than recreation and watershed conservation
Restrict structural development in the watershed.
ASDOC Monitor changes in population and land use
Annually map type and location of any land uses in the watershed and estimate any resident population.
Source: Pedersen Planning Consultants, 1998

Vatia, Page 10-1
VATIA Watershed 10 GEOGRAPHY The Vatia watershed is situated along the northern coast of Tutuila. The watershed comprises about 1.89 square miles of land area (Figure 10-1). The upper watershed is bounded by Alava Mountain and Maugaloa Ridge. The west boundary of the watershed includes Siuono Ridge, Mauagotula Peak, and Faiga Ridge. The prominent geographical features that identify the east boundary of the watershed include Matape Hill and Olo Ridge. The Vatia watershed encompasses about four smaller drainage areas, which are separated by mountain ridges known as Polauta, Matavalu, Tiatauala, and Sauma. Along the shoreline, the Vatia watershed extends between the northeast tip of Vaaogeoge Cove and Craggy Point. Vatia Bay is one of two embayments that adjoin the watershed. A smaller embayment is situated between the seaward tip of Sauma Ridge and Craggy Point. Most residents of the watershed live in the shoreline village of Vatia. However, a smaller population resides in the Amalau area near the primary roadway. RESOURCES OF THE WATERSHED Soils The U.S. Soil Conservation Service (National Resource Conservation Service) published a Soil Survey of American Samoa in 1984. Selected information derived from this survey provides some useful information for future watershed planning and management (Figure 10-2) Six different soil classifications were identified by the U.S. Soil Conservation Service for lands within the Vatia watershed (Table 10-1). TABLE 10-1 SELECTED SOIL CHARACTERISTICS VATIA WATERSHED
Soil Depth To: Land Use Suitability SCS Soil Unit
Name Typical Slope
(Percent)
Flood Runoff Erosion High Water (Feet)
Bed Rock
(Inches)
Soil Based WW
Treatment
Subsistence Ag
Potential
1 Aua very stony silty clay loam
15-30 None Med Med >6 <60 Severe Slope Moderate
2 Aua very stony silty clay loam
30-60 None Rapid Severe <6 <60 Severe Slope Poor
4 Fagasa family-Lithic Hapludolls-Rock outcrop assoc.
70-130 None Very Rapid
Very Severe
>6 20-60 Severe Slope Depth
Limited
8 Leafu silty clay 0-3 Occ Slow Slight 3-5 >60 Severe Flood Wet
Moderate
9 Leafu silty clay 0-3 Occ Slow Slight 3-5 >60 Severe Flood Wet
Moderate
34 Urban Land-Ngedebus complex
0-30 A.None L.Occ
A.Slow- Med L. Slow
A.Slight -Mod L. Slight
A. >6 L. 3-5
>60 Severe A. Slope L. Flood Wet
Limited
Notes: 1. A.= Aua- found on mountain foot slopes 6-30 percent 2. L.= Leafu- found on coastal plains & valley floors 0-6 percent Source: U.S. Soil Conservation Service, 1984


Vatia, Page 10-4
Aua Very Stony Silty Clay Loam (15 to 30 percent slopes) Aua very stony silty clay loam soils (SCS mapping unit 1) characterize a smaller inland area on the southeast side of Vatia Bay. More specifically, these soils are situated between Faatafea and Mulivai Stream on slopes that lie upslope of the natural infiltration area. These soils typically occur up to about 60 inches in depth. The permeability of these soils ranges between 2 and 6 inches per hour. The potential for runoff or erosion from the Aua soils is believed to be moderate (U.S. Soil Conservation Service, 1984). While moderately suited for agricultural production, the U.S. Soil Conservation Service estimates that this soil can annually sustain up to 5 tons per acre of erosion without impacting crop productivity (U.S. Soil Conservation Service, 1984). However, the U.S. Soil Conservation Service also advises that the stony and erosive characteristics of these soils may limit production. While the erosive characteristics of this soil generally may not significantly impact subsistence crop productivity, the erosive quality of the soil can be a significant contributor to sedimentation in downslope streams and the nearshore waters. However, the natural infiltration area below these soils may provide a place for the deposition of eroded soil material and the recharge of silt-laden runoff. The general characteristics of these Aua soils are also undesirable for individual wastewater disposal systems (U.S. Soil Conservation Service, 1984). These soils contain a significant amount of larger stones that typically hamper installation and provide inadequate soil treatment. Aua Very Stony Silty Clay Loam (30 to 60 percent slopes) Steeper slopes of the lower watershed contain Aua very stony silty clay loam soils (SCS mapping unit 2). Along the northwest side of Vatia Bay, these soils occur between the shoreline and upslope to about 200 feet above mean sea level. Within the remainder of the Vatia Bay area, these Aua soils are found near the back of inhabited areas, but generally upslope of the inhabited village. The soils typically are found up to about the 200-foot elevation. One exception is the drainage areas associated with Faatafea, Tafu, and Mulivai Stream where the Aua soils extend up to 600-foot contour. In the vicinity of Amalau, the Aua very stony silty clay loam soils are also present between the shoreline and the 600-foot elevation. Most of the inhabited area of Amalau contain these soils. The Aua soils range between seven to 60 inches in depth. The permeability of these soils (between 2 and 6 inches per hour) is moderately rapid. For watershed management purposes, it is important to note that these Aua soils have a high potential for runoff and erosion. This Aua soil is not recommended for agricultural production because of the stoniness of the soil, the high erosion potential, and hazards associated with subsistence crop cultivation on steeper slopes. However, when cultivation in these soils is necessary, the use of a mulch or ground cover is recommended to reduce soil erosion in cultivated areas. The U.S. Soil Conservation Service estimates that this soil can annually sustain up to 5 tons per acre of erosion without impacting crop productivity (U.S. Soil Conservation Service, 1984). While the erosive characteristics of this soil generally may not significantly impact subsistence crop productivity, the erosive quality of the soil can be a significant contributor to sedimentation in downslope streams and the nearshore waters. The general characteristics of these Aua soils are also undesirable for individual wastewater disposal systems (U.S. Soil Conservation Service, 1984). The soils contain a significant amount of larger stones that hamper installation and provide inadequate soil treatment.

Vatia, Page 10-5
Fagasa Family-Lithic Hapludolls-Rock Outcrop Association Steeper upland land areas throughout most of the remaining watershed contain deep, well-drained soils on steep mountain ridges and slopes. The U.S. Soil Conservation Service identifies these soils as part of the Fagasa family-Lithic Hapludolls-Rock outcrop association (SCS mapping unit 4). This soil type is common and characterizes most of the steep, upland slopes along Tutuila’s north coast. Since this soil type is a combination of two general soil classifications, soil depths can vary between 20 and 60 inches. The soil represents a combination of silty clay and loam. Since the Fagasa Family-Lithic Hapludolls soil typically occurs on very steep slopes, the potential for surface runoff and erosion are high. The cultivation of subsistence crops on these soils is not considered desirable. However, when cultivation in these soils is necessary, care should be exercised to minimize the amount of exposed soil in cultivated areas. When heavier rainfall events occur, significant erosion of these soils can be expected from undeveloped upslope areas of the watershed. Natural runoff from steeper slopes in the watershed carries water, sediments, and organic debris to downslope drainage courses and streams. Such erosion can readily influence downstream water quality. Leafu Silty Clay (0 to 3 percent slopes) Leafu silty clay soils (SCS mapping unit 8) are present characterize within a smaller inland area that is southeast of the shoreline between Faatafea and Tafu Stream. This soil is a deep soil that typically extends up to 60 inches in depth. Its permeability ranges between 2 and 6 inches per hour. Runoff from these soils is generally slow and the potential for soil erosion is limited. However, these soils are typically subject to brief periods of flooding during prolonged, heavier rainfall. These soils are moderately suitable for subsistence agriculture. However, this land use is constrained by occasional periods of flooding and general soil wetness. The U.S. Soil Conservation Service estimates that this soil can annually sustain up to 5 tons per acre of erosion without impacting crop productivity (U.S. Soil Conservation Service, 1984). Consequently, the use of these lands for subsistence agriculture is not likely to generate significant downslope erosion. The use of these Leafu soils for residential land uses is not recommended by the U.S. Soil Conservation Service because of the inherent flood potential associated with this soil. The same characteristics also hamper the use of these soils for septic tank systems and related soil-based treatment. Leafu Stony Silty Clay (0 to 3 percent slopes) Leafu stony silty clay soils (SCS mapping unit 9) characterize two areas in the vicinity of Vatia Bay. One area lies inland of the west side of Vatia Bay and is located along the lower slopes of Siuono Ridge within and adjacent to faatoaga areas. This area also includes the lower reaches of the Leafu and Gaoa Stream drainages, between about 350 to 1,000 feet inland of the shoreline. A second area is generally situated on the east side of Vatia Bay between the shoreline and the 20-foot contour. The soil is found in the lower drainage areas of Faatafea, Tafu, and Mulivai Streams within a relatively undeveloped portion of village. The lower elevations of this area represent a portion of a larger, natural infiltration area.
Vatia, Page 10-6
This soil is a deep soil that typically extends up to 60 inches in depth. Its permeability ranges between 2 and 6 inches per hour. Runoff from these soils is generally slow and the potential for soil erosion is limited. However, these soils are typically subject to brief periods of flooding after heavier rainfall periods. These soils are somewhat suitable for subsistence agriculture. However, this land use is constrained by occasional periods of flooding and general soil wetness. The U.S. Soil Conservation Service estimates that this soil can annually sustain up to 5 tons per acre of erosion without impacting crop productivity (U.S. Soil Conservation Service, 1984). Consequently, the use of these lands for subsistence agriculture is not likely to generate significant downslope erosion. The use of these Leafu soils for residential land uses is not recommended by the U.S. Soil Conservation Service because of the inherent flood potential associated with this soil. The same characteristics also hamper the use of these soils for septic tank systems and related soil-based treatment. Urban Land-Aua-Leafu Complex (0 to 30 percent slopes) The south and west shoreline of Vatia Bay are characterized by the Urban Land-Aua-Leafu complex (SCS mapping unit 34). Behind these shoreline areas, this soil extends inland roughly 200 to 350 feet into portions of the Vatia Village area. This soil type represents a combination of Aua and Leafu soils. These soils typically are found at depths of 60 inches or more. The permeability of this soil is moderately rapid and ranges between 2 and six inches per hour. The soil has limited to moderate potential for runoff. The erosion potential is slight to moderate. This soil has limited potential for subsistence agriculture. The U.S. Soil Conservation Service estimates that this soil can annually sustain up to 5 tons per acre of erosion without impacting crop productivity (U.S. Soil Conservation Service, 1984). Consequently, the use of these lands for subsistence agriculture is not likely to generate significant downslope erosion. The use of these soils for septic tank systems and related soil-based wastewater treatment is not desirable. A higher composition of larger rock fragments, combined with moderately rapid permeability, do not promote effective wastewater treatment. Consequently, the cumulative use of septic tanks and cesspools in areas that contain these soils may be making a contribution of nutrients and bacteria into the nearshore waters of Vatia Bay. Streams Stream Locations As stated earlier, there are approximately four distinct drainage areas within the Vatia watershed. These four drainage areas contain a total of nine streams. On the west side of the watershed, Stream 10A originates near the 100-foot contour along the east slopes of Polauta Ridge. This stream drains through the wetland situated on the northwest side of the watershed and, ultimately, discharges into the nearshore waters on southeast side of the wetland. Stream 10B begins at about the 325-foot elevation on the east side of Siuono Ridge. This stream discharges into the nearshore waters of Vatia Bay near the center of the Village. Leafu Stream begins at the top of Faiga Ridge at about 790 feet above mean sea level. Four stream branches join at about the 425-foot contour before their continuation into a relatively straight drainage course into Vatia Bay.

Vatia, Page 10-7
Fagaitoa Stream originates from the north slopes of Mount Alava. Five branches of the stream merge at about the 475-foot elevation. At this point, Fagaitoa Stream becomes Gaoa Stream. The entire Fagaitoa-Gaoa drainage extends about 3.6 miles before the discharge of Gaoa Stream into southwest side of Vatia Bay. Surface runoff from the west side of Matavalu Ridge and the northwest slopes of Maugaloa Ridge drain into Lausaa Stream, which originates at about the 1,200-foot elevation. The main stem and one tributary parallel each other to about the 300-foot contour. From this point, the main stream stem continues to the nearshore waters on the south side of Vatia Bay. Faatafe Stream begins at about the 1,000-foot contour where it receives surface runoff from the east side of Maugaloa Ridge. This stream makes an eventual discharge into Vatia Bay. However, surface flows from the stream flow through the natural lowland area on the south east side of the Vatia Bay. A significant portion of these flows probably infiltrate and recharge local ground water. Tufu Stream and two related branches originate about the 1,200 foot elevation. The combined flows of the stream also flow through the natural lowland area on the southeast side of Vatia Bay. At about the 10-foot contour, a confluence of Tufu and Mulivai Stream occurs in the natural lowland area. Mulivai Stream begins at about 1,200 feet above mean sea level. A west branch of the stream occurs at about the 400-foot elevation. The main stream and the west branch merge at about the 50-foot contour. The combined flows continue through the lowland area before discharging into the nearshore waters of Vatia Bay. Vaiola Stream is a 0.2-mile long stream course that receives surface drainage from the west side of Sauma Ridge. Stream flows discharge into the nearshore waters east of Vatia Bay. An unnamed stream (Stream 10C) in the vicinity of Amalau originates at about the 1,200-foot elevation. This stream and one branch drain surface flows from the east side of Sauma Ridge and Tiatauala Ridge, as well as the west side of Olo Ridge. Tiaiu Fall occurs near the 600-foot elevation. The main stream and its single branch join at about the 300-foot contour. Subsequently, surface drainage flows downslope through the inhabited area of Amalau before discharging into the unnamed embayment that is adjacent to Amalau. Stream Flows Within the Watershed Historical flow measurements made by the U.S. Geological Survey (USGS) have enabled to estimate a median rate of flow for three streams in the Vatia watershed.
Leafu Stream
A low-flow, partial-record station (No. 16914000) located approximately 0.3 mile upstream of the Leafu Stream mouth provided 11 measurements of stream flow between 1958 and 1971. Using these measurements, USGS estimated that the median flow at this location is approximately 0.25 cubic feet per second (cfs). Gaoa Stream
About 0.4 mile upstream of the Gaoa stream mouth, the operation of a low-flow, partial-record station (No. 16913000) provided 8 measurements of stream flow between 1958 and 1971. USGS estimates that the median flow at this gage location is about 0.26 cfs (Wong, 1996). Lausaa Stream
A single flow measurement was made along Lausaa Stream. From this measurement, USGS estimated that the median flow at this gage location is roughly 0.20 cfs (Wong, 1996).

Vatia, Page 10-8
Aquatic Fishes and Invertebrates Field surveys of fishes and invertebrates were made by the U.S. Fish and Wildlife Service, Division of Ecological Services, in March-April, 1978 and the U.S. Army Corps of Engineers in August, 1980. Gaoa Stream and Mulivai Stream were two of 37 streams in American Samoa that were inventoried by representatives of these federal agencies. Results from both field surveys were summarized in an American Samoa Stream Inventory that was published by the U.S. Army Corps of Engineers, Honolulu District, in July, 1981. Gaoa Stream was surveyed at station 33a, which was located along a lower reach of the stream at about 10 feet above mean sea level. Mulivai Stream was surveyed in two locations. Station 34a was situated adjacent to a banana plantation at about the 10-foot elevation. Station 34b was surveyed in a narrow, cobble riffle that was located approximately 250 feet upstream of station 34a. Two species of gobie fish and one species of mountain bass were observed along Gaoa Stream (station 33a). No eels were documented. Five species of shrimp were found at station 33a; one of the shrimp species was abundant. No mollusks were observed. Along Mulivai Stream, two species of gobie fish and one species of mountain bass were documented downstream (station 34a). Further upstream, two abundant species of gobie fish were reported along with two species of mountain bass (station 34b). A common abundance of one eel specie was observed at both downstream and upstream sampling locations. Pipefish was occasionally observed at station 34b while none were observed at the downstream station 34a. Six species of shrimp were noted along the stream; however, only three of the shrimp species were documented at station 34a. No species of mollusk was reported. The U.S. Army Corps of Engineers recorded that the specie diversity at station 34b was higher than the specie diversity documented at all other stream sites observed by the U.S. Fish and Wildlife Service and the U.S. Army Corps of Engineers.
Surface Water Quality Streams In March, 1970, a single water quality sample collected in Leafu Stream. This measurement indicates that turbidity and total coliform levels were elevated at the time of sampling (Table 10-2). No further evaluations can be made from this limited sampling. TABLE 10-2 SINGLE WATER QUALITY MEASURMENT LEAFU STREAM MARCH, 1970
Water Quality Parameter TN TKN NO3+NO2 TP Turbidity TSS pH Total
Coliform Date (µg/l) (µg/l) (µg/l) (µg/l) (jtu)** (mg/l) (#/100 ml) 03/16/70 -- -- 100 -- 25.0 -- 6.90 13,000 Note: ** Jackson units, expressed as “jtu”, were commonly used in the early 1970’s. More recently, jtu has become a frequently used criteria for the measurement of turbidity levels.
Source: ASEPA, 1996

Vatia, Page 10-9
Nearshore Waters ASEPA collected marine water samples from 17 embayments around the Island of Tutuila on July 25 and August 2, 1992. The samples were obtained, at depths of three and 60 feet, from the outer portions of the embayments where more water exchange occurs. Collected samples were subsequently analyzed for nutrients and chlorophyll a. Nutrient data gained from these samplings indicate that the outer waters of Vatia Bay met American Samoa water quality standards in late July and early August of 1992 (Table 10-3). Laboratory results also suggest that stormwater runoff from undeveloped lands upland of Vatia Bay may not generate any significant discharge of nutrients. TABLE 10-3 SURFACE WATER QUALITY OUTER VATIA BAY JULY-AUGUST, 1992
STATION Sample Depth (feet)
Nitrate/ Nitrite mg N/l
Total N
mg N/l
Kjeldahl N
mg N/1
Total P
mg P/1
CHL a
mg/m3
Vatia Bay 3 60
0.006 0.002
0.118 0.116
0.112 0.114
0.007 0.010
0.21 0.86
Source: ASEPA, 1996 Wetlands Coastal Marsh on Northwest Side of Vatia Village A seven-acre wetland is situated adjacent to the northwest side of Vatia Village. This wetland, which was originally identified by Whistler as a coastal marsh, contains approximately seven acres of land area (Whistler, 1976). The cultivation of taro was observed by Whistler in January, 1976. In the Comprehensive Wetlands Management Plan, Biosystems Analysis, Inc. indicated that this marsh was an abandoned taro field that had reverted back to herbaceous vegetation. Field surveys in April, 1996 noted the presence of herbaceous vegetation. However, it was observed that the primary use of the marsh was for subsistence agricultural production. Fresh water in the wetland is received via surface runoff from Siuono and Polauta Ridges, as well as an unnamed stream that is downslope of Siuono Ridge. Along the primary vehicular trail along the shoreline, two existing culverts provide an outlet for the discharge of storm flows to the nearshore waters. One of these culverts is blocked by coral rubble that was transported inshore by Hurricane Val in 1991 (Timai, 1976). During the April, 1996 survey, the last two homes on the northwest side of the village were being influenced by rising flood waters. It was evident from this onsite inspection and informal discussions with the affected resident that the blockage of the road culvert was responsible for the flooding of, at least, two homes on the west side of the shoreline vehicular trail. Cultivated Fresh-Water Wetland A cultivated fresh-water wetland is situated inland of the Faatafe Stream mouth. The wetland contains approximately 15 acres of lowland that are located between four to 20 feet above mean sea level. Some standing water was observed in the wetland during the April, 1996 survey. The wetland is believed to represent an important infiltration area for storm runoff and average stream flows from Faatafe Stream, Tafu Stream, and Mulivai Stream. This wetland enables the deposition of eroded soil material and the recharge of storm water back into the groundwater aquifer. Added

Vatia, Page 10-10
treatment of the stormwater is afforded by some mangrove which are situated near the mouth of Faatafe Stream mouth. Since the lowland is near the edge of the basal aquifer, the recharge of surface runoff that enters the wetland does not make any contribution to potable groundwater supplies. However, the recharge is significant because it reduces sedimentation of the nearshore waters, as well as the flood potential in the east side of Vatia Village. Consequently, an important resource management objective for the Village is to maintain this important stormwater detention and treatment feature, as well as avoid the development of new homes in the wetland. Marine Resources Coral Communities A fringing reef fronts Vatia Bay from Vaiava Strait to the mouth of Vaiola Stream. West of Vaiava Strait, the fringing reef extends to an unnamed point on the northeast side of Vaaogeoge Cove. The existing fringing reef in Vatia Bay extends about 400 to 500 feet from the shoreline. “A remnant of raised reef 8 feet (2.4 m) across project 5 feet (1.5m) above the fringing reef on the eastern side of Vatia Bay. This feature is considered evidence of a former higher stand of sea” (Aecos and Aquatic Farms, 1980). Various private consultants have made various field investigations of the fringing reef in these areas since the late 1970’s. In a cumulative sense, available survey information provides suggests that:
• The coral communities of the fringing reef in Vatia Bay have recovered significantly from the impact of Hurricane Val.
1978-1979
In June, 1978, no crown-of-thorns starfish were documented on the forereef slopes between Vatia School and Pola Islet. In 1979, Aecos and Aquatic Farms observed that the inner reef flat seaward of Vatia School was devoid of live coral. Overgrown dead coral was also documented on a portion of the outer reef flat on the west side of the Bay. It was concluded that this condition was the result of a partial coral kill in 1971-1972.
On the east side of Vatia Bay, 30 to 40 percent of the lower reef slope was covered with live corals at depths between 20 to 52 feet (6 to 16m). In contrast, coral coverage on the upper reef front averaged about 80 percent in August-September, 1979. The presence of the crown-of-thorns starfish was limited (Aecos and Aquatic Farms, 1980). 1992
Field investigations were also made in the northwest part of Vatia Bay by Maragos, Hunter, and Meier in 1992. These marine ecologists primarily surveyed the outer reef margin and reef slopes of the fringing reef inside the Bay. A five to 10 percent coral coverage was observed in shallow nearshore waters of about six meters in depth. In contrast, a 30 percent coverage was noted at about 18 meters.

Vatia, Page 10-11
1995
A recent 1996 study of various coral reefs throughout the Samoan Archipelago included, in part, some onsite investigations of the fringing reef on the east side of Vatia Bay. The study focused primarily upon the quantification of coral communities, the abundance and diversity of reef fish, and selected habitat characteristics.
In comparison with other sites on Tutuila, Green observed that the fringing reef in Vatia Bay was recovering well from Hurricane Val. A rapid increase in coral coverage was occurring; coral coverage in 1995 was three times the coverage that was observed in the Bay in 1994. Green concluded that such growth was primarily the result of encrusting corals. In addition, the establishment of plate and branching corals was documented and were also observed to be growing rapidly. These conclusions were supported by data obtained from coral surveys, which were conducted in the Vatia area between November, 1994 and November, 1995.
Field observations indicated that the reef front of the fringing reef at Vatia Bay contained a coral cover of roughly 40 percent or greater at about 10 meters in depth . The number of fish observed represented roughly 100-149 different species and was considered “moderate” compared to other sites on Tutuila, Manua, and Western Samoa. Fish density was considered “moderate”, or between 5,000 and 9,999 individuals per ha. Fish biomass was determined to be “low” and represented less than 500 kilograms per ha (Green, 1996).
Giant Clams The Giant Clam Project was initiated by the ASG Department of Marine and Wildlife Resources (DMWR) in about 1988. The intention of the program was to help interested residents create a potential small business opportunity that was related to the production of faisua, or giant clams, on local fringing reef communities. “Giant clams (Faisua) are bivalve mollusks belonging to the family Tridacnidae and are related to oysters, mussels, scallops, and other clams. Giant clams are the largest bivalves in the world…There are eight known species of living giant clams (ASG Division of Marine and Wildlife Resources, 1993). These clams live in the shallow clear waters of coral reefs. They can be found in various Pacific Island and Southeast Asian countries such as northern Australia, Papua New Guinea, Indonesia, Malaysia, the Philippine Islands, the Republic of Palau, the Federated States of Micronesia, and the Republic of the Marshall Islands. After construction of a hatchery near Fogagogo, DMWR representatives encouraged local residents to establish faisua farming areas on local fringing reefs. Some 10 operations have been formed in about 10 locations in the nearshore waters that are adjacent to the Island of Tutuila. Three of these operations are located in Vatia Bay. However, DMWR indicates that these operations are not operating on a commercial basis (McConnaughy, 1996). There are five species of giant clams that have been introduced by the Giant Clam Project. These clams include Tridacna derasa, Tridacna maxima, Tridacna squamosa, Hippopus hippopus, and Tridacna gigas. These giant clams naturally spawn between October through December, as well as May and June. When sold to faisua farmers, the giant clams are about one year old. The farmer needs to maintain the giant clams for about 1.5 to 2.0 years in order to obtain a desired six-inch size for potential markets. However, some species, e.g., Tridacna derasa, hippopus, and maxima, require a 2.5 to five year growth period before harvesting (McConnaughy, 1996).

Vatia, Page 10-12
Wildlife Resources Seabirds Pola Islet and the northwest face of Polauta Ridge provide nesting and roosting sites for, at least, the following species of seabirds:
• Great and Lesser frigatebirds; • Red-footed and brown boobies; as well as, • Brown, black and blue-grey noddies.
The U.S. Fish and Wildlife Service believes that this area represents the most important nesting area for seabirds on the Island of Tutuila, and should be designated as a seabird sanctuary (U.S. Fish and Wildlife Service, 1989). The inclusion of the Fagatuitui-Vaaogeoge and Vatia watersheds into the U.S National Park system in 1988 provided considerable legal protection to this remote wildlife habitat. Native Forest Birds and Bats Native forest birds and bat populations are surveyed and recorded by the ASG Department of Marine and Wildlife Resources at 35 stations on the Island of Tutuila (Solek, 1996). One of the survey areas is located in the Amalau area, between about 160 and 800 feet above mean sea level. Amalau represents an important habitat for both bats and forest birds because this area contains significant diversity and an abundant number of species (Solek, 1996). In FY 1997, the ASG Department of Marine and Wildlife Resources estimated a minimum population of 200 fruit bats along Olo Ridge in the Amalau area. These estimates were based upon a combination of exit counts, dawn return counts, and/or boat counts in FY 1997 (Utzurrum, 1998). “Until recently, two roosts were present on Polauta Ridge, north of Vatia. The western most of these sites had a landslide in late 1995 and bats moved to a large roost at Puaneva Point (watershed 9). A temporary roost formed above the waterfalls at Amalau Valley in 1994 but has not been used since that time” (Brooke, 1997). Shoreline Protection Despite the presence of a significant fringing reef, the shoreline of Vatia Bay has historically been influenced by hurricanes, tropical storms, and stormwaves. Between 1840 and 1991, ten hurricanes with sustained winds over 75 miles per hour are believed to have occurred in American Samoa. In contrast, some 42 tropical storms, which were characterized by winds between 40 and 75 miles per hour, occurred in the Territory during the same period (Sea Engineering and Belt Collins Hawaii, 1994). The most recent event that influenced the shoreline was Hurricane Val, which occurred on December 8, 1991. While most homes are situated within 50 to 100 feet behind the shoreline, the Village of Vatia remains vulnerable to potential storm damage. Most homes in the village are located between five to ten feet above mean sea level (Sea Engineering and Belt Collins Hawaii, 1994). During the April, 1996 survey, it was noted that the existing rock-filled gabion was already falling apart on the west side of Mulivai Stream mouth. Continued degradation of the shoreline and adjacent primary shoreline roadway can be expected unless this gabion is repaired or replaced. A scarp was cutting into the primary shoreline roadway on the west side of Vatia Bay near the faifeau’s residence.

Vatia, Page 10-13
Groundwater and Surface Water Supplies Groundwater Supply and Quality There are no known groundwater wells that have been developed or being used in the Vatia watershed. Surface Water Supply and Quality The village of Vatia is reliant upon surface supplies from Leafu and Lausaa Stream. The Leafu Stream intake is located about 125 feet above mean sea level. The intake along Lausaa Stream is situated near the 90-foot contour. Both stream intakes include small impoundments. Otherwise, the village water system contains no water storage facilities. In Amalau, it is believed that existing residences are served by individual roof catchment systems. Some use, however, may also be made of surface supplies from Stream 10 B. The American Samoa Environmental Protection Agency (USEPA) regularly monitors village water supplies on a monthly basis. Available water quality data from FY 1994, FY 1995, and early FY 1996 consistently show significant bacterial contamination from surface supplies. Total coliform levels average greater than 80 colonies; fecal coliforms regularly represent about 75 percent of this contamination. Turbidity levels are typically less than 5 NTU. However, greater turbidity probably occurs during or following periods of heavier rainfall. The continued use of surface supplies from the existing stream supplies and related stream impoundments represents a potential health hazard to Vatia residents. Gastroenteritis-related diseases such as Hepatitis A and salmonellosis can be derived via water-borne transmission. For this reason, it is recommended that Vatia residents use surface supplies from rainwater catchment systems. While some contamination may be obtained from these sources, this source would likely provide considerably better water quality if appropriate systems are maintained. Proposed Water System Improvement A preferred long-term solution is the development of a groundwater supply in the village. Such development should be made in conjunction with ASPA’s development of a satellite water system that would be operated and maintained by ASPA personnel. At the same time, the village water system could be used for non-potable uses. In its Utility System Master Plan, ASPA has outlined various proposed improvements for Vatia Village that would be required to establish a satellite water system. Such improvements would include:
• Development of two or more groundwater wells that would provide, at least, 80 gallons per minute of flow;
• Disinfection at each well; • Construction of a 150,000 gallons water storage tank; • Installation of approximately 1,700 feet of 4-inch PVC transmission main that would connect the
proposed wells to the new storage tank, or to distribution; • Installation of a fire protection system; and, • Installation of service laterals and meters.

Vatia, Page 10-14
USE OF THE WATERSHED Resident Population The two inhabited areas of the watershed include Vatia Village and some limited areas in the vicinity of Amalau. In 1980, the total population of Vatia was estimated to be 394 persons, while in 1990, the total population was estimated to be 608 persons. Such growth represented an average annual growth rate of about 5.43 percent. The population of Vatia increased with the construction of some 25 new residential units between 1990 and 1995. Recent population estimates by Pedersen Planning Consultants indicate that the 1995 population was about 803 persons. Land Uses Residential
There were 73 homes in the village in 1990. All were owner-occupied. Many homes were damaged by Hurricane Val in 1990. However, virtually all of these homes were repaired. In addition, approximately 25 new homes have been built in the village between 1990 and 1995. Consequently, the 1995 housing stock included approximately 98 homes.
Residential housing is primarily concentrated near the inner most indentation of Vatia Bay. Lower density housing is more prevalent on the northwest and southeast sides of the Village. Existing homes consume most all of the undeveloped land that is suitable for residential construction.
An informal shoreline set-back of about 100 to 150 feet is apparently being observed by village leaders for facility construction. It is believed that the informal shoreline setback was made in response to past hurricanes and storm wave inundation inside the village. Agricultural
There are a number of smaller papuaa, or pig enclosures, in Vatia Village. Many of these papuaa are built by local streams. Three or four of the pig pens are connected to septic tanks (Timai, 1996).
The production of subsistence crops occurs on lands that are that adjoin or somewhat upland of the primary residential areas in Vatia and Amalau. In April, 1996, the primary faatoaga areas were located behind the west and southwest portions of the Village. The faatoaga were situated along the lower slopes of Siuono and Polouta ridges. Commercial In 1995, about 15 commercial establishments operated in Vatia. These enterprises included five grocery stores, one flower shop, and one retail store, which were scattered throughout the main village area. Other entrepreneurs were involved in bus transportation, masonry, and commercial tours; these commercial activities were home-based operations. Industrial In 1995, no industrial services were established in Vatia. Public Facilities Mauga-O-Alava Elementary School represents the only public facility in the Village. In September, 1994, 133 students were enrolled at the school. An Early Childhood Education program also operates out of Vatia. The ECE program, which serves children three and four years of age, enrolled 29 children in September, 1994. High school students from the village are bussed to Samoana High.
Vatia, Page 10-15
Use of the Nearshore Waters Nearshore Fishing
An American Samoa Subsistence Fishing Survey was conducted by the University of Hawaii Sea Grant Program in the summer of 1992. This survey involved onsite interviews with shoreline users who were participating in fishing activities on selected days during that period. The results of the survey revealed, in part, that there is considerable use of the nearshore waters of Vatia reef. Some 40-50 persons were documented fishing on the reef. Fishing methods observed included throw net, diving, rod-and-reel, pole, gillnet, gleaning, diving, as well as hand-and-line fishing from a paopao. RESOURCE MANAGEMENT ISSUES Future Land Uses to the Year 2015 Residential
No future encroachment of the shoreline for residential development is envisioned during the next 20 years because of inherent potential dangers associated with tropical storms. The development of about ten homes within the existing village is anticipated between 1996 and the year 2000. An additional 10 homes are expected on upland slopes and undeveloped lands in the southeast side of the village during the same period.
Between 2001 and 2005, further residential expansion will occur on the slopes behind the village. Ten additional homes will be built during this period.
The potential extent of single family development will be realized by the year 2005. Between 2006 and the year 2015, a gradual conversion of single family units to multi-unit apartments will begin to be made to accommodate greater in-migration. Such conversions will result in 20 new housing units between 2006 and 2010 and 25 new housing units between 2011 and 2015.
The cumulative effect of this prospective residential growth is that the housing stock will increase to roughly 173 housing units in the year 2015. During the same period, it is believed that the average household size will have gradually decreased to approximately 7 persons per household. The anticipated village population in the year 2015 will include about 1,210 persons. Commercial As the Pago Pago Harbor area becomes more congested, residents of Vatia will seek more local shopping opportunities to avoid future traffic congestion and busy stores. This general trend will likely begin between the years 2001 and 2005 when the development of two new retail stores is expected. One additional retail outlet is anticipated between 2006 and 2010. Three additional stores will be constructed between 2011 and 2015. Roughly half of these businesses will be established as part of new housing units. Commercial retail activities are expected to be built on the ground floor of a typical two-story housing unit. Several professional services will be operated from the homes of residents. It is envisioned that these services will gradually be established over the next 20 years. Industrial A few industrial services will be established during the next 20 years. However, these services will be smaller, home-based enterprises.

Vatia, Page 10-16
Public Facilities A potential expansion of the Mauga-O-Lava Elementary School is expected to occur. Declining operating funds from the U.S. Government will gradually prompt a consolidation of school facilities in Afono and Vatia to reduce overall operating costs. Pedersen Planning Consultants believes that the consolidation of the Afono and Vatia schools will likely occur between 2001 and 2005. Vatia has more potential land that could be available for future expansion. Population characteristics for Vatia in 1990 suggest that approximately seven and one-half percent of the village population is three and four years of age, 18 percent is elementary school age (ages 5 through 13), and about 13 percent is high school age (14-18). Application of these assumptions to anticipated future population suggests that Vatia will have the following estimated student enrollments in the year 2015:
• early childhood education 86 students • elementary school 205 students • high school 148 students Impact of Future Population Growth Upon Water Consumption and Waste Generation Future population growth and changes in land use in the Vatia watershed will increase the volume of future wastewater and solid wastes that are generated by local residents. Wastewater generation, for example, is expected to rise from about 39,412 gallons per day (gpd) in 1995 to 71,810 gpd in the year 2015 (American Samoa Power Authority, 1996). The consumption of potable water will also increase with a growing population. The American Samoa Power Authority (ASPA) estimates that the average day demand for water in Vatia was about 56,303 gallons in 1995. By the year 2015, ASPA anticipates that the average demand will increase to roughly 102,585 gpd. Flood Potential A flood insurance study of American Samoa and related flood insurance rate maps were published by the U.S. Federal Emergency Management Agency (FEMA) in 1991. The study evaluated selected geographical locations throughout the Territory. Hydrologic and hydraulic analyses that were presented in the study were made by the U.S. Army Corps of Engineers, Pacific Ocean Division. A detailed study was made of several streams in the Vatia watershed. Inland Flood Potential In general, flood profiles developed for the lower reaches of Leafu and Gaoa Streams suggest 100-year flood elevations that would range between five and ten feet above mean sea level. A similar flood range was also estimated for lower reaches of Faatafe and Tafu Stream. Along Mulivai Stream, 100-year flood elevations are expected to range between 5 and 16 feet above mean sea level. The estimated 16-foot base flood elevation is located in the natural lowland area between Tafu and Mulivai Stream. Future residential growth is expected to occur within existing residential areas between the 5 and 10-foot contour, as well as upland areas of the Gaoa Stream drainage. As a result, the future potential for occasional flooding within Vatia Village is greater than most villages in American Samoa The south side of Vatia Village contains a small area near the mouth of the Lausaa Stream drainage that is designated by the Federal Emergency Management Agency (FEMA) as “zone x”. This designation indicates that the area is outside of the 100-year floodplain (Federal Emergency

Vatia, Page 10-17
Management Agency, 1991). In essence, FEMA is suggesting that the flood hazard potential in this area is limited. Coastal Flood Hazards The flood insurance rate map for Vatia Bay indicates that there is a coastal flood hazard through much of the nearshore waters and adjoining shoreline. A potential 100-year flood is estimated to generate flood levels in these areas that will range between three and five feet above mean sea level. However, some of the anticipated residential growth in upland areas may diminish the flood potential because of increased elevation. FEMA has also indicated a base flood 100-year flood elevation of 3.0 feet above mean sea level for the shoreline areas within all of Vatia Bay, as well as the unnamed embayment downslope of the Amalau area. Potential inundation elevations associated with a potential 100-year tsunami event have also been estimated by the U.S. Army Corps of Engineers for the following shoreline locations:
• North of Vaaogeoge Cove – 2.6 feet above mean sea level (MSL); • 1,500 feet southwest of Vaiava Strait – 2.6 feet above MSL; • Shoreline at Matalia Point - 2.6 feet above MSL; • Shoreline at Vaiava Strait – 2.7 feet above MSL; • Shoreline at Vatia – 2.8 feet above MSL; • Shoreline approximately 6,000 feet east of Vatia – 2.8 feet above MSL; Since most of Vatia village is setback from the shoreline, the preceding estimates of potential tsunami flood elevation suggest that Vatia would sustain limited damage from a potential tsunami. However, a few homes in Vatia are situated downslope of the 5-foot contour and could be subjected to anticipated 100-year inundation elevations. Stormwater Runoff/Sedimentation and the Relationship to Surface Water Quality In terms of future watershed management, Leafu and Lausaa Streams are of primary concern because these streams provide a potable water supply to Vatia residents. Potential improvements to the water system will likely be long-term in nature and may remain unacceptable to Vatia Village Council. Consequently, reduced sedimentation should be a primary resource management objective for these streams. All of the streams of the watershed are also important to nearshore water quality. The cumulative impact of natural sedimentation, upslope agricultural activities, heavier rainfall events, and general urban runoff can potentially discharge a significant volume of sediment and other contaminants in the nearshore water that front Vatia Village and the adjoining shoreline. A second resource management objective for the watershed should be to maintain the detention of stormwater runoff in the two wetland areas of the village. Through detention, some downstream sedimentation will continue to settle out in existing wetland areas rather than discharge into the nearshore waters. It is important that leaders of Vatia Village discourage residential development in these areas. Nearshore Water Quality and the Marine Environment Turbidity and Sedimentation The continued discharge of turbid waters and sediments into the nearshore waters of Vatia Bay represents an important resource management concern. Coral communities are significantly dependent upon the availability of light and related photosynthesis, and occasional periods of
Vatia, Page 10-18
significant turbidity and sedimentation do not promote long-term coral nutrition, growth, reproduction, and depth distribution (Richmond, 1993). When corals fertilize, they are free-swimming. Consequently, they need a good location to settle and make a good attachment. With significant soil deposition, sediments can physically interfere with the recruitment of coral larvae (Richmond, 1993; Dashbach, 1996). Coral communities are an important component of the overall ecology of the nearshore waters that adjoin the Vatia watershed. They provide shelter to fish, invertebrates, and other marine organisms. Some of these resources represent a supplemental food source for residents of the watershed. Nutrient Inputs A nutrient contribution is also occurring through the continued use of septic tanks, cesspools, or other soil-based, wastewater treatment systems in the watershed. In addition, most of the piggeries are also generating nutrient-enriched discharges into local stream. These sources of nutrients are also accompanied by some bacterial contamination from these discharges. While the total volume of wastewater generation from the watershed is limited, the discharges are concentrated in the inhabited village area where housing densities are between two and five housing units per acre. Local soils are generally inadequate to provide effective treatment. The long-term input of turbid and nutrient-enriched waters into the nearshore waters represents an important concern. These inputs are potentially detrimental to the quality because they can adversely change the composition of the nearshore marine environment. However, the degree of impact upon water quality is also highly dependent upon currents and water exchange within the nearshore environment. As the population of the watershed grows, nutrient and bacterial inputs will only increase. Aside from these resource management considerations, the future use of the nearshore waters for fishing, swimming and general recreation will eventually represent a more significant public health concern unless practical steps are made to reduce potential nearshore water contamination. The more remote location of Vatia will likely continue the use of soil-based treatment systems for wastewater disposal. For this reason, village areas in Vatia that are unsuitable for soil-based, wastewater treatment should be more specifically identified. As recommended in the ASPA Utilities Master Plan, this identification process should be based upon a more detailed sanitation survey of more densely inhabited areas such as Vatia. This survey would evaluate existing wastewater treatment practices, soil characteristics, the location and density of land uses, the distance to surface water supplies and the nearshore waters, topography, and other related factors. Using the conclusions and recommendations associated with this evaluation, ASPA and other participating Project Notification and Review System (PNRS) agencies will be better able to:
• require the use of septic tanks and leachfields that provide a sufficient amount of additional soil-based treatment;
• provide greater technical assistance to building permit applicants; and, if necessary, • deny building applications in land areas that are unsuitable for soil-based treatment systems. Long-Term Monitoring
The future monitoring of the selected stream in the watershed is necessary and should be combined with water quality monitoring of the nearshore waters. Turbidity and sedimentation are the primary stresses to the coral communities in the nearshore waters of these embayments. However, future levels bacterial contamination and nutrient inputs should also be documented to help ensure future public safety and evaluate potential stresses to the fringing coral reef communities.

Vatia, Page 10-19
In addition, the ASG Department of Marine and Wildlife Resources should monitor the coral communities along the reef front of Vatia Bay at least once every three years. Long-term monitoring of this site should also include an evaluation of the impact of sedimentation and turbidity that already influences the nearshore marine environment. Groundwater and Surface Water Supplies
The development of a groundwater supply in the watershed is needed to avoid future risks to public health in Vatia. In the absence of improvements outlined in the draft ASPA Utilities Master Plan, Vatia Village should be encouraged to use individual roof catchment systems for drinking water and other potable uses.
The village water system should continue to be maintained for non-potable uses, as well as an emergency water supply. MANAGEMENT NEEDS AND RECOMMENDATIONS
The primary focus of future resource management in the Vatia watershed will be to:
• Discontinue use of Leafu and Lausaa Streams for potable water uses and begin use of rainwater catchment systems until groundwater wells can be developed by ASPA;
• Increase the function of the two existing wetland areas in Vatia Village which detain runoff and reduce the discharge of sediments into Vatia Bay;
• perform a detailed evaluation of sanitation problems in all residential and commercial areas; • conserve stream catchments associated with the village water system; • maintain culverts underneath the primary shoreline roadway; • conserve bat and seabird habitat; and, • conserve coral communities.
Representatives of participating public agencies should make periodic visits to the watershed to 1) observe, document, and monitor selected resource conditions, 2) determine potential methods of correcting potential hazards or undesirable conditions, 3) share potential solutions with designated residents of Vatia, and 4) encourage the participation of village leaders and residents in resource management solutions.
The scope of issues that should be addressed by each agency in the field is summarized in Table 10-4. The general focus of recommended technical assistance is also identified. The experience and insights of agency representatives will determine the specific methodology to be used in the field.

Vatia, Page 10-20
TABLE 10-4 RECOMMENDED FOCUS OF FUTURE TECHNICAL ASSISTANCE VATIA WATERSHED
Participating Public Agency
Resource Management Issue
Focus of Technical Assistance
ASEPA Facilitate a coordinated resource management effort within the watershed.
1. Coordinate overall watershed management activities. 2. Hold periodic meetings with participating ASG and federal agencies to discuss, prioritize, and schedule resource management activities. 3. Coordinate program efforts with local traditional leaders and/or designated resident of the watershed. 4. Make annual assessment of resource management program.
ASEPA Monitor water quality of Lausaa and Leafu Streams, as well as the nearshore waters
1. Measure changes in and total/fecal bacteria, sedimentation, and nutrients on a quarterly basis.
ASPA/ASEPA Perform a detailed evaluation of community sanitation problems associated with the use of soil-based treatment systems.
1. Survey existing residential and commercial areas of Vatia Village. 2. Evaluate existing treatment practices, soil characteristics, location and density of land uses, the distance to water supplies and nearshore waters, topography, and other factors. 3. Require use of septic tanks and leachfields that provide sufficient amounts of additional soil-based treatment; or, deny building applications in areas unsuitable for soil-based treatment.
ASPA Develop new satellite water system in Vatia.
1. Meet with traditional village leaders to consider the development of a satellite water system. 2. If desired by village leaders, secure funding for water system design and construction. 3. Design water system improvements. 4. Construct proposed improvements.
ASEPA Reduce potential health risks associated with surface water supplies
Encourage the use of individual roof catchment systems for drinking water and other potable uses until proposed ASPA improvements can be developed.
ASEPA Increase the function of existing wetlands for stormwater detention
1. Investigate opportunities for stormwater detention at the two wetlands in Vatia. 2. Model stormwater flows for 2,10,50 and 100-year storm events. 3. Prepare conceptual plans to enhance wetland functions, particularly for stormwater detention. 4. Prepare order-of-magnitude costs for proposed improvements. 5. Coordinate required improvements with traditional Village leaders.
Continued – next page
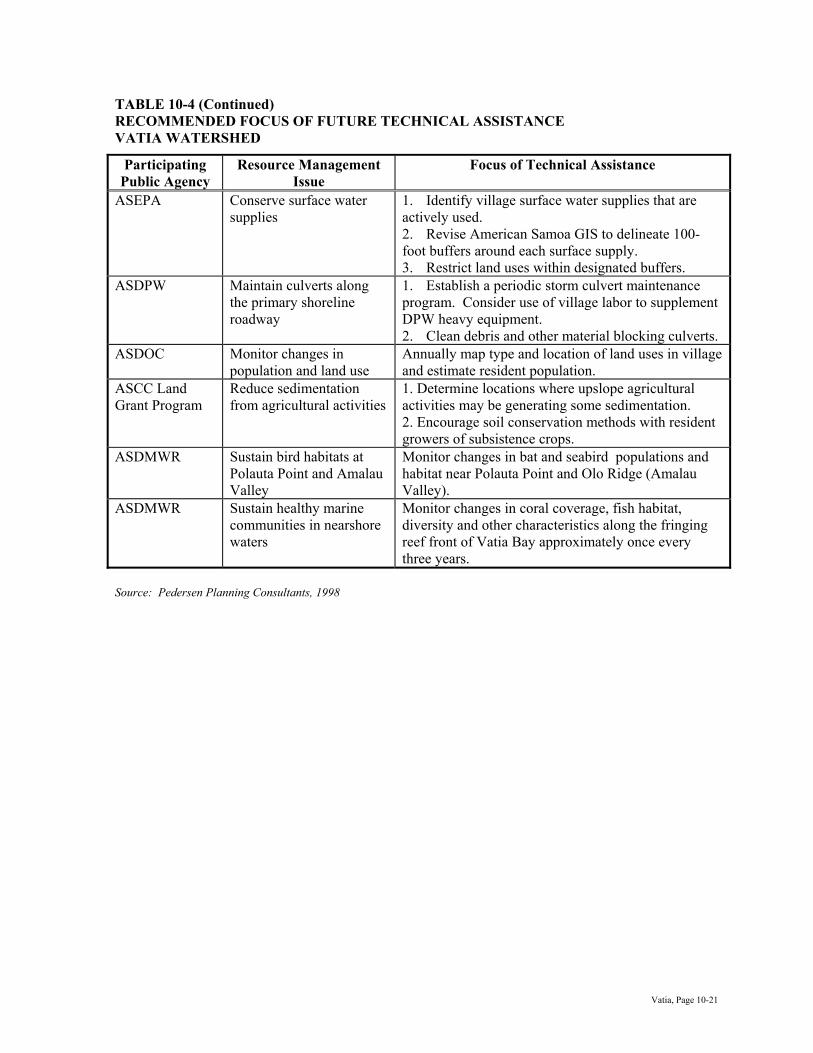
Vatia, Page 10-21
TABLE 10-4 (Continued) RECOMMENDED FOCUS OF FUTURE TECHNICAL ASSISTANCE VATIA WATERSHED
Participating Public Agency
Resource Management Issue
Focus of Technical Assistance
ASEPA Conserve surface water supplies
1. Identify village surface water supplies that are actively used. 2. Revise American Samoa GIS to delineate 100-foot buffers around each surface supply. 3. Restrict land uses within designated buffers.
ASDPW Maintain culverts along the primary shoreline roadway
1. Establish a periodic storm culvert maintenance program. Consider use of village labor to supplement DPW heavy equipment. 2. Clean debris and other material blocking culverts.
ASDOC Monitor changes in population and land use
Annually map type and location of land uses in village and estimate resident population.
ASCC Land Grant Program
Reduce sedimentation from agricultural activities
1. Determine locations where upslope agricultural activities may be generating some sedimentation. 2. Encourage soil conservation methods with resident growers of subsistence crops.
ASDMWR Sustain bird habitats at Polauta Point and Amalau Valley
Monitor changes in bat and seabird populations and habitat near Polauta Point and Olo Ridge (Amalau Valley).
ASDMWR Sustain healthy marine communities in nearshore waters
Monitor changes in coral coverage, fish habitat, diversity and other characteristics along the fringing reef front of Vatia Bay approximately once every three years.
Source: Pedersen Planning Consultants, 1998

Afono, Page 11-1
AFONO Watershed 11 GEOGRAPHY The Afono watershed is located along Tutuila’s northeast coast (Figure 11-1) and encompasses about 1.29 square miles. The west boundary of the watershed is Olo Ridge. The inland boundary or top of the watershed includes the northern slopes of North, South, and Sinaopioa Mountain. These mountains peak between 1,600 to 1,700 feet above mean sea level. The east boundary of the Afono watershed includes the north and west slopes of Tagau Mountain, as well as the west slopes of Palapala Mountain. Along the shoreline, the Afono watershed extends between Craggy Point and Tapisi Point. The primary embayment in the watershed is Afono Bay. Anapeapea Cove is situated on the east side of Afono Bay. A smaller embayment is located between Vainuu Point and Tapisi Point. The Village of Afono is the only inhabited area of the watershed. An uninhabited village area, known as Oa, is located adjacent to the smaller embayment between Vainuu Point and Tapisi Point. RESOURCES OF THE WATERSHED Soils The U.S. Soil Conservation Service (National Resource Conservation Service) published a Soil Survey of American Samoa in 1984. Selected information derived from this survey provides some useful information for future watershed planning and management (Figure 11-2). Four different soil classifications were identified by the U.S. Soil Conservation Service for lands within the Afono watershed (Table 11-1). TABLE 11-1 SELECTED SOIL CHARACTERISTICS AFONO WATERSHED Soil Depth To: Land Use Suitability
SCS Soil Unit
Name Typical Slope
(Percent)
Flood Runoff Erosion High Water (Feet)
Bed Rock
(Inches)
Soil Based WW
Treatment
Subsistence Ag
Potential
2 Aua very stony silty clay loam
30-60 None Rapid Severe <6 <60 Severe Slope Poor
4 Fagasa family-Lithic Hapludolls-Rock outcrop assoc
70-130 None Very Rapid
Very Severe
>6 20-60 Severe Slope Depth
Limited
9 Leafu silty clay 0-3 Occ Slow Slight 3-5 >60 Severe Flood Wet
Moderate
34 Urban Land-Ngedebus complex
0-30 A.None L.Occ
A.Slow to Med L. Slow
A.Slight to Mod L. Slight
A. >6 L. 3-5
>60 Severe A. Slope L. Flood Wet
Limited
Notes: 1. A.= Aua- found on mountain foot slopes 6-30 percent 2. L.= Leafu- found on coastal plains & valley floors 0-6 percent Source: U.S. Soil Conservation Service, 1984
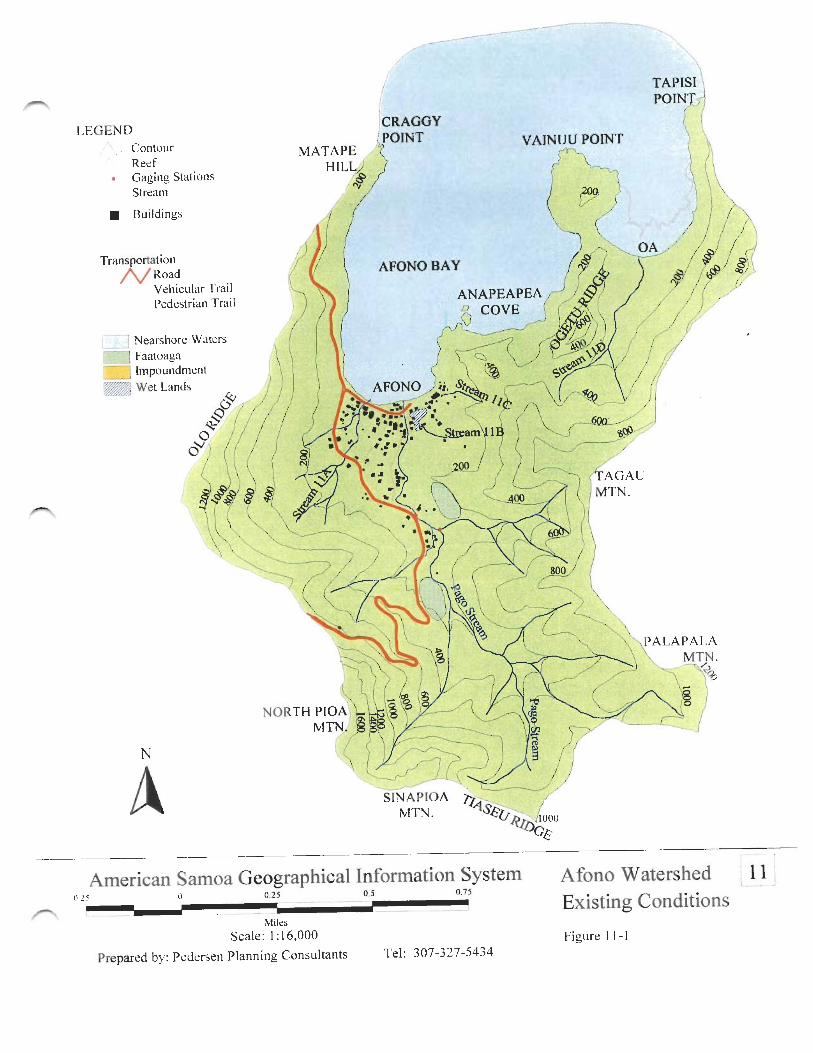


Afono, Page 11-4
Aua Very Stony Silty Clay Loam (30 to 60 percent slopes) Aua very stony Silty Clay Loam on 30 to 60 percent slopes (SCS mapping unit 2) is a prominent soil that characterizes all stream drainages in the watershed. The soils extend from the shoreline of Afono Bay to about the 750-foot elevation. The Aua soils range between seven to 60 inches in depth. The permeability of these soils (between 2 and 6 inches per hour) is moderately rapid. For watershed management purposes, it is important to note that these Aua soils have a high potential for runoff and erosion. This Aua soil is not recommended for agricultural production because of the stoniness of the soil, the high erosion potential, and hazards associated with subsistence crop cultivation on steeper slopes. However, when cultivation in these soils is necessary, the use of a mulch or ground cover is recommended to reduce soil erosion in cultivated areas. The U.S. Soil Conservation Service estimates that this soil can annually sustain up to 5 tons per acre of erosion without impacting crop productivity (U.S. Soil Conservation Service, 1984). While the erosive characteristics of this soil generally may not significantly impact subsistence crop productivity, the erosive quality of the soil can be a significant contributor to sedimentation in downslope streams and the nearshore waters. The general characteristics of these Aua soils are also undesirable for individual wastewater disposal systems (U.S. Soil Conservation Service, 1984) The soils contain a significant amount of larger stones that hamper installation and adequate soil treatment. Fagasa Family-Lithic Hapludolls-Rock Outcrop Association Steeper upland land areas throughout most of the remaining watershed contain deep, well-drained soils on steep mountain ridges and slopes. The U.S. Soil Conservation Service identifies these soils as part of the Fagasa family-Lithic Hapludolls-Rock outcrop association (SCS mapping unit 4). This soil type is common and characterizes most of the steep, upland slopes along Tutuila’s north coast. Since this soil type is a combination of two general soil classifications, soil depths can vary between 20 and 60 inches. The soil represents a combination of silty clay and loam. Since the Fagasa Family-Lithic Hapludolls soil typically occurs on very steep slopes, the potential for surface runoff and erosion are high. The cultivation of subsistence crops on these soils is not considered desirable. However, when cultivation in these soils is necessary, care should be exercised to minimize the amount of exposed soil in cultivated areas. When heavier rainfall events occur, significant erosion of these soils can be expected from undeveloped upslope areas of the watershed. Natural runoff from steeper slopes in the watershed carries water, sediments, and organic debris to downslope drainage courses and streams. Such erosion can readily influence downstream water quality. Leafu Stony Silty Clay (0 to 3 percent slopes) Leafu stony silty clay soils (SCS mapping unit 9) characterize the lands near the mouth of the small embayment between Vainuu Point and Tapisi Point. This soil is a deep soil that typically extends up to 60 inches in depth. Its permeability ranges between 2 and 6 inches per hour. Runoff from these soils is generally slow and the potential for soil erosion is limited. However, these soils are typically subject to brief periods of flooding after heavier rainfall periods.

Afono, Page 11-5
These soils are somewhat suitable for subsistence agriculture. However, this land use is constrained by occasional periods of flooding and general soil wetness. The U.S. Soil Conservation Service estimates that this soil can annually sustain up to 5 tons per acre of erosion without impacting crop productivity (U.S. Soil Conservation Service, 1984). Consequently, the use of these lands for subsistence agriculture is not likely to generate significant downslope erosion. The use of these Leafu soils for residential land uses is not recommended by the U.S. Soil Conservation Service because of the inherent flood potential associated with this soil. The same characteristics also hamper the use of these soils for septic tank systems and related soil-based treatment. The inherent flood potential of these soils may explain why the former village of Oa is now uninhabited. Urban Land-Aua-Leafu Complex (0 to 30 percent slopes) Most of the shoreline Afono Village area is characterized by the Urban Land-Aua-Leafu complex (SCS mapping unit 34). This soil type represents a combination of Aua and Leafu soils. These soils typically are found at depths of 60 inches or more. The permeability of this soil is moderately rapid and ranges between 2 and six inches per hour. The soil has limited to moderate potential for runoff. The erosion potential is slight to moderate. This soil has limited potential for subsistence agriculture. The U.S. Soil Conservation Service estimates that this soil can annually sustain up to 5 tons per acre of erosion without impacting crop productivity (U.S. Soil Conservation Service, 1984). Consequently, the use of these lands for subsistence agriculture is not likely to generate significant downslope erosion. The use of these soils for septic tank systems and related soil-based wastewater treatment is not desirable. A higher composition of larger rock fragments, combined with moderately rapid permeability, do not promote effective wastewater treatment. Consequently, the cumulative use of septic tanks and cesspools in areas that contain these soils may be making a contribution of nutrients and bacteria into the nearshore waters of Afono Bay. Streams Stream Locations
Pago Stream
The primary drainage is Pago Stream, which extends approximately 4.3 miles from Sinaopioa Mountain to the shoreline. Two branches receive surface runoff from the east slopes of North and South Pioa Mountain. The east side of Olo Ridge also drains into two other branches that originate about 600-feet above mean sea level.
Surface drainage from the west side of Palapala Mountain drain into Pago Stream between the 250 and 275-foot contour. The west slope of Tagau Mountain also drains into another four branches of Pago Stream. Stream 11A
Stream 11A and three tributaries begins on the lower, east slopes of Olo Ridge. The main stem of Stream 11A ultimately discharges into the southwest part of Afono Bay. Stream 11B
Stream 11B originates about the 50-foot contour and drains into a nearby area of wet, saturated soils. Past wetland studies for American Samoa do not indicate that this area

Afono, Page 11-6
represents a wetland. The stream course for Stream 11B, which is situated east of Pago Stream, drains surface runoff from the northwest slopes of Tagau Mountain. Stream 11C
Stream 11C begins near the 175-foot elevation on the east side of Afono Village. This stream discharges to the nearshore waters on the southeast side of Afono Bay. Stream 11D
Stream 11D is an unbranched stream, which flows into an unnamed embayment at Oa. The stream originates about the 600-foot elevation where it receives surface drainage from the north slope of Tagau Mountain. The drainage area extends approximately 0.6 mile before discharging into the nearshore waters that adjoin Oa Village.
Stream Flows Within the Watershed A continuous-record gage (No. 16912000) was located on Pago Stream approximately 0.3 mile upstream from the stream mouth between 1958 and 1990. These measurements enabled the U.S. Geological Survey to estimate a median flow of 1.40 cubic feet per second (cfs). During the 1958-1990 period, a maximum discharge of 1,350 cfs was recorded on July 5, 1969; a minimum of 0.10 cfs was measured on September 29, 1989 (Wong, 1996). A low-flow partial-record station (No. 16911000) placed on a west tributary of Pago Stream provided 11 measurements between 1959 and 1975. The measurements were used by U.S. Geological Survey to estimate a median flow of 0.28 cfs (Wong, 1996). Aquatic Fishes and Invertebrates Field surveys of fishes and invertebrates were made by the U.S. Fish and Wildlife Service, Division of Ecological Services, in March-April, 1978 and the U.S. Army Corps of Engineers in August, 1980. Pago Stream in Afono was one of 37 streams in American Samoa that were inventoried by representatives of these federal agencies. Results from both field surveys were summarized in an American Samoa Stream Inventory that was published by the U.S. Army Corps of Engineers, Honolulu District, in July, 1981. Two points along Pago Stream were surveyed. These sampling stations included a stony riffle about 150 feet upstream of the shoreline (station 4a), and a riffle located just below the U.S. Geological Survey gaging station at about the 40-foot elevation (station 4b). Three species of gobie fishes and two species of mountain bass were observed at station 4a. No eels were documented at the downstream station. Two shrimp species were also present; one of these species was abundant. At station 4b, two abundant gobie fishes and two mountain bass species were recorded. No eels were present. Four species of shrimp were also observed; one species was abundant. Only one species of mollusk was noted at the upstream station. Surface Water Quality
Streams In late 1995, ASEPA initiated a more detailed evaluation of selected streams in Afono, Asili, and Leone to better ascertain the source of sedimentation that impacts surface water quality in the nearshore marine environment. Monitoring included the weekly collection of water quality samples from stream locations adjacent to developed lands, a faatoaga, and undeveloped lands. Subsequent laboratory analyses were made for total suspended solids, turbidity, total nitrogen, and total

Afono, Page 11-7
phosphorus. Selected monitoring locations were chosen, in part, because of the availability of long-term stream flow data for these streams (Wiegman, 1996). In Afono, surface water quality data was collected from three locations along Pago Stream between October and December, 1995, as well as in April and May, 1996 (Table 11-2). Available data also suggests that greater sediments were detected at the stream location adjacent to the village residential area. The monitoring sites that were adjacent to a plantation and undeveloped lands contained somewhat lower levels of TSS. Total nitrogen levels were well within the ASEPA water quality criterion of 300 µg-N/l between October and December, 1995. However, total phosphorus levels exceeded the geometric mean criterion of 90 µg-P/l at all three stations (Table 11-3). It is also important to note that higher nutrient values were again derived from the monitoring site adjacent to village residential land uses. Similar data will be required over a longer time period to make reasonable conclusions concerning the source of sedimentation in these villages. TABLE 11-2 WATER QUALITY MONITORING PAGO STREAM OCTOBER, 1995-MAY, 1996
Stations AFO1R AFO2PL AFO3UND TSS Turb- TN TP TSS Turb- TN TP TSS Turb- TN TP
Date (mg/L)
idity (NTU)
(mg/L)
(mg/L)
(mg/L)
idity (NTU)
(mg/L)
(mg/L)
(mg/L)
idity (NTU)
(mg/L)
(mg/L)
10/31/95 4.5 3.0 2.9 1.0 3.7 1.5 11/2/95 5.0 5.1 4.1 3.0 3.2 2.0 11/7/95 5.0 3.6 3.0 1.4 4.0 1.5 11/9/95 5.0 5.0 4.0 3.2 2.0 2.6 11/14/95 0.50 1.0 0.2 0.9 0.2 0.8 11/21/95 3.0 4.0 0.075 0.053 2.0 3.0 0.113 0.051 1.0 2.0 0.083 0.05211/24/95 4.0 8.6 0.132 0.067 3.0 8.2 0.109 0.058 3.0 6.4 0.156 0.09511/28/95 8.0 5.2 0.245 0.157 7.0 4.4 0.145 0.138 4.0 1.2 0.123 0.14011/30/95 5.0 0.0 0.157 0.145 2.0 1.3 0.100 0.142 2.0 1.2 0.097 0.14212/5/95 1.0 1.7 0.091 0.174 1.0 0.9 0.303 0.154 0.0 0.8 0.069 0.15412/7/95 1.0 1.1 0.264 0.201 1.0 0.9 0.113 0.181 1.0 0.8 0.110 0.17712/11/95 0.213 0.196 0.179 0.198 0.196 0.19712/12/95 2.0 0.6 0.213 0.196 2.0 0.5 0.179 0.198 1.0 0.4 0.196 0.19712/14/95 2.0 3.0 1.0 0.5 0.0 0.0 12/20/95 1.0 1.4 0.289 0.187 1.0 1.4 0.204 0.174 0.0 2.4 0.201 0.17712/21/95 0.159 0.174 0.140 0.174 0.151 0.18412/25/95 0.334 0.191 0.119 0.155 0.167 0.17912/28/95 0.412 0.218 0.240 0.243 0.299 0.2354/23/95 0.011 3.1 0.005 3.0 0.05 2.9 4/25/95 0.002 2.2 0.009 2.1 0.008 2.0 4/30/95 0.013 3.0 0.009 3.9 0.009 2.7 5/2/96 0.009 2.1 0.005 1.5 0.002 1,4
Notes: Station AFO1R is located adjacent to developed lands, Station AFO2PL is located adjacent to a plantation or faatoaga, and Station AFO3UND is located adjacent to undeveloped lands.
Source: ASEPA, 1996

Afono, Page 11-8
TABLE 11-3 SUMMARY OF NUTRIENT DATA PAGO STREAM OCTOBER-DECEMBER, 1995
Parameter Station Grand AF-01-R AF-02-P AF-03-UND Geomean Total Nitrogen (µg-N/l) 182.9 154.2 133.0 155.4 Nitrate-Nitrite (µg-N/l) 51.5 43.4 33.6 42.2 Total Phosphorus (µg-P/l) 150.3 125.9 142.8 139.3
Source: Aecos, 1996 Nearshore Waters ASEPA also collected marine water samples from 17 embayments around the Island of Tutuila on July 25 and August 2, 1992. The samples were obtained from the outer portions of the embayments where more water exchange occurs at depths of three and 60 feet. Collected samples were subsequently analyzed for nutrients and chlorophyll a. Nutrient data gained from these samplings indicate that the outer waters of Afono Bay met American Samoa water quality standards in late July and early August of 1992 (Table 11-4). Laboratory results also suggest that stormwater runoff from undeveloped lands upslope of Afono Bay may not generate any significant discharge of nutrients. TABLE 11-4 SURFACE WATER QUALITY OUTER AFONO BAY JULY-AUGUST, 1992
STATION Sample Depth (feet)
Nitrate/ Nitrite mg N/l
Total N
mg N/l
Kjeldahl N
mg N/1
Total P
mg P/1
CHL a
mg/m3
Afono Bay 3 60
0.002 <0.001
0.136 0.140
0.134 0.140
0.008 0.007
0.28 0.20
Source: ASEPA, 1995 Nearshore water quality measurements were made at two nearshore locations in Afono Bay (Table 11-5) in early 1995 (AECOS, 1995). While these data cannot be strictly compared with the Pago Stream measurements (Table 11-2), it is interesting to note that total nitrogen values are quite similar for both environments while both nitrate+nitrite and total phosphorus levels are noticeably lower in the marine samples. Otherwise, the water quality values for the nearshore waters of Afono Bay do not indicate any evidence of environmental degradation.

Afono, Page 11-9
TABLE 11-5 RANDOM NEARSHORE WATER QUALITY MEASUREMENTS AFONO BAY EARLY 1995
Parameter Station Afono
1 Afono 2
Total Nitrogen (µg-N/l) 147 172 Total Kjeldahl N (µg-N/l) 138 157
Nitrate-Nitrite (µg-N/l) 9 15 Total Phosphorus (µg-P/l) 16 11
Chlorophyll α (µg/l) 0.02 0.07
Source: Aecos, 1995 Wetlands No wetlands are located in the Afono watershed. This finding is consistent with wetland investigations made by Whistler in 1976 and Biosystems Analysis, Inc. in 1992. Marine Resources Coral Communities A fringing reef fronts Afono Bay, Anapeapea Cove, as well as the embayment that adjoins Oa Village area. The reef extends between 200 and 550 feet from the shoreline. The reef is semi-protected from open ocean conditions. Various private consultants have made various field investigations of the fringing reef in these areas since the late 1970’s. In a cumulative sense, available survey information provides suggests that:
• The growth of coral communities in Afono Bay has not been significant during the 1979-1992 period.
• The growth of corals at Afono Bay appears to be continually stressed by diminished water quality, e.g., turbidity.
1978-1979
Lush coral coverage (roughly 90 percent coverage) was observed by Aecos and Aquatic Farms in 1979 on the upper reef front that is seaward of Gatia Point. The lush coral coverage extended to a depth of about 40 feet (12 m). Table and staghorn corals were most abundant.
A three percent coral coverage was documented on the reef flat of Afono Bay (Aecos and Aquatic Farms, 1980).
Small patch reefs were observed in the nearshore waters that are adjacent to the former village of Oa. These reefs extended from a depth of about 30 feet to near the surface. A fringing reef was also documented 1992
Field investigations were also made in Afono Bay by Maragos and Hunter in April, 1992. These marine ecologists primarily surveyed the outer reef margin and reef slopes of the fringing reef inside the Bay. Less than one- percent coral coverage was observed in shallow
Afono, Page 11-10
nearshore waters of about six meters in depth. Similarly, a one- percent coverage was noted at about 18 meters (Maragos, Hunter, and Meier, 1994).
Giant Clams The Giant Clam Project was initiated by the ASG Department of Marine and Wildlife Resources (DMWR) in about 1988. The intention of the program was to help interested residents create a potential small business opportunity that was related to the production of faisua, or giant clams, on local fringing reef communities. “Giant clams (Faisua) are bivalve mollusks belonging to the family Tridacnidae and are related to oysters, mussels, scallops, and other clams. Giant clams are the largest bivalves in the world…There are eight known species of living giant clams (ASG Division of Marine and Wildlife Resources, 1993). These clams live in the shallow clear waters of coral reefs. They can be found in various Pacific Island and Southeast Asian countries such as northern Australia, Papua New Guinea, Indonesia, Malaysia, the Philippine Islands, the Republic of Palau, the Federated States of Micronesia, and the Republic of the Marshall Islands. After construction of a hatchery near Fogagogo, DMWR representatives encouraged American Samoa residents to establish faisua-farming areas on local fringing reefs. Some 10 operations have been formed in about 10 locations in the nearshore waters that are adjacent to the Island of Tutuila. One of these operations is located in Afono Bay. However, DMWR indicates that this operation is not operating on a commercial basis (McConnaughy, 1996). There are five species of giant clams that have been introduced by the Giant Clam Project. These clams include Tridacna derasa, Tridacna maxima, Tridacna squamosa, Hippopus hippopus, and Tridacna gigas. These giant clams naturally spawn between October through December, as well as May and June. When sold to faisua farmers, the giant clams are about one year old. The farmer needs to maintain the giant clams for about 1.5 to 2.0 years in order to obtain a desired six-inch size for potential markets. However, some species, e.g., Tridacna derasa, hippopus, and maxima, require a 2.5 to five year growth period before harvesting (McConnaughy, 1996). Shoreline Protection The shoreline of Afono Bay has historically been influenced by hurricanes, tropical storms, and storm waves. Between 1840 and 1991, ten hurricanes with sustained winds over 75 miles per hour are believed to have occurred in American Samoa. In contrast, some 42 tropical storms, which were characterized by winds between 40 and 75 miles per hour, occurred in the Territory during the same period (Sea Engineering and Belt Collins Hawaii, 1994). The most recent event that influenced the shoreline was Hurricane Val, which occurred on December 8, 1991. Significant erosion was evident on the southeast portion of the shoreline that fronts Afono Village in May, 1996. Coconut trees were undermined; some fallen trees were in the nearshore waters. Similar conditions were noted by Sea Engineering in 1994. The crest elevation of the revetment is approximately 12 feet above mean sea level (Sea Engineering and Belt Collins Hawaii, 1994). Existing structures along the shoreline are situated between 30 to 50 feet of the existing shoreline. Consequently, they are vulnerable to potential erosion.
Afono, Page 11-11
Wildlife Resources There are two shoreline caves located at Anapeapea Cove. Both caves were identified by Aecos and Aquatic Farms as the only know nesting sites for the white-rumped swiftlet. However, the presence of this bird habitat was not confirmed by representatives from the ASG Department of Marine and Wildlife Resources in May, 1996. Fruit bat roosting areas are located in the vicinity Oa and Vainuu Point. In FY 1997, the ASG Department of Marine and Wildlife Resources estimated a minimum population of 409 fruit bats in this area. These estimates were based upon a combination of exit counts, dawn return counts, and/or boat counts in FY 1997 (Utzurrum, 1998). Groundwater and Surface Water Supplies Groundwater Supply and Quality There are no groundwater wells in the Afono watershed. Surface Water Supply and Quality Afono Village operates its own village water system. The system presently serves about 89 residences. Some residents supplement this water supply with rainwater catchment systems that collect raw water from the roofs of buildings . The existing stream source that serves the village water system is located about 0.8 mile upstream of the Pago Stream mouth. A stream intake and related impoundment diverts about 0.06 cfs from Pago Stream for the operation of the water system (Wong, 1996). Distribution of this supply to Afono Village is made through the use of 2.5-inch and smaller piping (American Samoa Power Authority, 1996). The American Samoa Environmental Protection Agency (USEPA) regularly monitors village water supplies on a monthly basis. Available water quality data from FY 1994, FY 1995, and early FY 1996 consistently show significant bacterial contamination from Afono’s surface water supplies. Total coliform levels range from 50 to greater than 80 colonies; fecal coliforms regularly represent about 75 percent of this contamination. Turbidity levels are typically less than 1.6 NTU. However, greater turbidity probably occurs during or following periods of heavier rainfall. Proposed Water System Improvements A preferred long-term solution is the development of a groundwater supply in the village. Such development should be made in conjunction with ASPA’s development of a satellite water system that would be operated and maintained by ASPA personnel. At the same time, the village water system could be used for non-potable uses. In its Utility System Master Plan, ASPA has outlined various proposed improvements for Afono Village that would be required to establish a satellite water system. Such improvements would include:
• Development of two or more groundwater wells that would provide, at least, 40 gallons per minute of flow;
• Disinfection at each well; • Construction of a 85,000 gallon water storage tank; • Installation of approximately 400 feet of 4-inch PVC transmission main that would connect the
proposed wells to the new storage tank;

Afono, Page 11-12
• Installation of a fire protection and distribution system; and, • Installation of service laterals and meters. USE OF THE WATERSHED Resident Population Between 1980 and 1990, the resident population of Afono increased from 284 to 434 persons. By 1995, the construction of some 20 new homes increased the population to an estimated 586 residents. During the 1980-1995 period, the population has grown at a rate of roughly 2.3 percent per year. This modest growth rate reflects an in-migration of residents from Hawaii and the continental United States. However, this in-migration is countered by the out-migration of many residents to Hawaii, the continental United States, and New Zealand (Faleseu, 1996). Land Uses Residential Almost all residential housing in Afono represents single family housing units. One recently-constructed two-story home includes about four units. In 1990, there were 69 housing units in Afono. During the past four years, about 20 new homes have been built. The 1995 housing stock is estimated to include 89 homes. Most of the housing is concentrated near the shoreline where the original village, the existing elementary school, and traditional meeting places are located. The construction of paved vehicular access from Aua in the early 1980’s, the lack of developable lands within the village, and the spectacular views at higher elevations have encouraged more recent residential growth along the primary vehicular access road from Aua. Commercial In 1995, there are nine commercial enterprises that were based in Afono. These included one village grocery store, four other retail stores; one of the stores also contained a laundromat in the same facility. The remaining enterprises represented commercial bus operators. In the period from 1990-95, no new commercial businesses were established in Afono. Industrial No industrial enterprises were located in Afono Village in 1995. Public Facilities Public facilities in Afono include an elementary school and an early childhood education (ECE) program. The ECE program enrolled 32 students in October, 1994. Also in that period, Afono Elementary School had a student enrollment of 111. High school students from the village are bussed to either Samoana or Fagaitua High Schools. Use of the Nearshore Waters Nearshore Fishing About five to six residents typically use Afono Bay for subsistence fishing activity each day (Sua, Faleseu, and Tuiafono, 1996). Several persons were observed fishing in Afono Bay during the May, 1996 survey.

Afono, Page 11-13
An American Samoa Subsistence Fishing Survey was conducted by the University of Hawaii Sea Grant Program in the summer of 1992. This survey involved onsite interviews with shoreline users who were participating in fishing activities on selected days during that period. The results of the survey revealed, in part, that there is considerable use of the nearshore waters along the reefs of Afono Village. Some 30-40 people were documented using various fishing methods during the 1992 survey. Fishing methods observed included gleaning, diving, pole, hand-in-line in a paopao (canoe), and rod-and-reel. RESOURCE MANAGEMENT ISSUES Future Land Uses to the Year 2015 Residential Potential residential expansion will occur within the original village area and other potential homesites along the main vehicular access road from Aua. By the year 2000, it is believed that three of the remaining six housesites in the main village and the adjacent slopes on the west side of the village will be developed for single family homes. Between 2001 and 2005, ASPA believes that an additional four homes will be developed at higher elevations along the main vehicular access from Aua. Three additional single family houses will be constructed in the main village between 2006 and 2010. Four additional homes will be developed along the main access road from Aua between 2011 and 2015; however, these units will represent either two two-story duplexes or one four-unit apartment building. By the year 2010, village leaders and aigas will recognize that future residential expansion in the village will likely have to be accommodated by multi-unit buildings and/or the conversion of existing single family units into duplexes. While immensely different from past housing trends, this future concept will facilitate the return of American Samoans in the continental U.S. and Hawaii to Afono. At the same time, the transition to this style of housing will retain the traditional allocation of residential space by designated family leaders to other extended family members. The cumulative effect of this prospective residential growth is that the housing stock will increase to roughly 103 housing units in the year 2015. During the same period, it is believed that the average household size will gradually decrease to approximately 5.62 persons per household. Consequently, the 2015 village population is expected to include about 579 persons. Agriculture Despite modest increases in population, the present level of subsistence agriculture is also expected to remain about the same as production in 1996. A decline in the per capita consumption of subsistence crops is anticipated. In addition, the continued westernization of the American Samoa population will likely increase the demand for imported foods. Commercial Limited land area is available for future commercial expansion. Future population growth in the village will not significantly increase retail trade opportunities. However, returning American Samoans may eventually bring some professional services in the community that will likely be operated from their homes. During the next 20 years, ASPA believes that future commercial facility expansion will occur. Such expansion will include the renovation and expansion of existing retail stores. In some cases, renovation may result in the construction of a two-story commercial building.

Afono, Page 11-14
Industrial The operation of two or three home-based industrial enterprises, e.g., welder, is anticipated to the year 2015. Public Facilities Anticipated reductions in U.S. Government revenues will likely encourage a consolidation of the elementary schools at Afono and Vatia. It is anticipated that the consolidation will result in the transportation of Afono students to Vatia where greater lands may be available for school expansion. Population characteristics for Afono in 1990 suggest that approximately five percent of the village population is three and four years of age, 24.5 percent is elementary school age (ages 5 through 13), and about 11 percent is high school age (14-18). Application of these assumptions to anticipated future population suggests that Afono will generate the following estimated student enrollments in the year 2015:
• early childhood education 29 students • elementary school 142 students • high school 64 students Impact of Future Population Growth Upon Water Consumption and Waste Generation The significance of an anticipated modest increase in population and residential development in the watershed will impact future demands for potable water and the generation of wastewater. The average day demand for water consumption in the year 2015 is anticipated to be 50,557 gallons per day (gpd). Such demand is only 19 percent greater than the total estimated consumption in 1995 (42,345 gpd). Future wastewater generation is forecasted to rise from 29,642 gallons per day in 1995 to only 35,390 gallons per day in the year 2015 (American Samoa Power Authority, 1996). The limited increases in water demand and wastewater generation are expected because only limited residential expansion is expected. Anticipated declines in the average household size will also accompany future residential growth. Flood Potential A flood insurance study of American Samoa and related flood insurance rate maps were published by the U.S. Federal Emergency Management Agency (FEMA) in 1991. The study evaluated selected geographical locations throughout the Territory. Hydrologic and hydraulic analyses that were presented in the study were made by the U.S. Army Corps of Engineers, Pacific Ocean Division. However, no specific analysis was made of Pago Stream or other streams in the Afono watershed. Inland Flood Potential The flood insurance rate map for the west coast of Tutuila indicates the entire Afono watershed has been designated by FEMA as “zone x”. This designation indicates that the area is outside of the 100-year floodplain (Federal Emergency Management Agency, 1991). In essence, FEMA is suggesting that the flood hazard potential in this watershed is limited. Coastal Flood Hazard The flood insurance rate map for the shoreline of the Afono watershed indicates that there is a coastal flood hazard along the shoreline of the watershed. A potential 100-year flood is anticipated to generate flood levels approximately three feet above mean sea level (MSL) in these areas.
Afono, Page 11-15
In addition, the U.S. Army Corps of Engineers has also estimated a 100-year tsunami inundation level of approximately 2.8 feet above mean sea level (MSL) along the Afono Bay shoreline, as well as in the vicinity of Tapisi Point (U.S. Army Corps of Engineers, 1980). Existing buildings along the Afono Bay shoreline are generally built on sites that are about 10 feet above MSL. While the estimated 100-year tsunami wave would not impact these structures, wave runup that is generated from the tsunami could possibly flood these buildings. The potential tsunami elevations at Tapisi Point have little significance unless future development occurs along the shoreline. Stormwater Runoff/Sedimentation and the Relationship to Surface Water Quality Steeper upland slopes, erosive soils, and heavier rainfall events generate surface runoff in the upper Afono watershed. Surface runoff carries silt-laden materials that drains into Pago Stream. This natural sedimentation process is believed to be primarily responsible for the discharge of sediments into Afono Bay. The natural sedimentation process that is generated from surface runoff on steeper, undeveloped slopes will only continue. The primary roadway from neighboring Aua Village provides paved vehicular access from the Pago Pago Bay area. Existing terrain required the American Samoa Government to build this roadway on steep mountain slopes. Man-made cuts were made along these steeper slopes. Today, surface runoff carries soil-laden water on the soils that characterize the steeper slopes upslope of the primary roadway. When saturated, upslope soils above the primary roadway will often subside because natural sediment deposition processes typically transport soil material in a manner that restores original topographic slope. In essence, existing roadway cut into steeper slopes generates frequent landslides following heavier rainfall periods. Evidence of this process was observed along the primary roadway during the May, 1996 field survey. Following heavier rainfall, a landslide occurred between the 800-900-foot contour that covered the roadway cut and spilled across the roadway. Ultimately, silt-laden runoff discharges into Pago Stream. Agricultural activities in the Afono watershed also produce some discharges of sedimentation into Pago Stream. Existing agricultural areas, or faatoaga, are generally located south, east and west of the inhabited village area. The Aua and Fagasa soils in these areas have high runoff and/or erosion potential. Consequently, surface runoff from existing agricultural areas likely discharges some sediments into Pago Stream. The cumulative impact of natural sedimentation, upslope agricultural activities, heavier rainfall events, and general urban runoff will continue to discharge a significant volume of sediment and other contaminants in Pago Stream and the nearshore waters of Afono Bay. Consequently, any feasible opportunities for stormwater detention should be pursued. The construction of a small detention pond on the southeast side of Afono Village could help detain stormwater runoff and encourage the deposition of sediments that otherwise impact nearshore water quality. A low area, containing about 0.5 acre of land, is located about 100 feet east of Pago Stream. However, the construction of a detention pond in this wet area would require the relocation of two or three households. A detention pond upslope of the existing stream intake is not believed to be feasible because of steeper slopes.

Afono, Page 11-16
Nearshore Water Quality and the Marine Environment Turbidity and Sedimentation The continued discharge of turbid waters and sediments into the nearshore waters of Afono Bay represents an important resource management concern. Coral communities are significantly dependent upon the availability of light and related photosynthesis, and occasional periods of significant turbidity and sedimentation do not promote long-term coral nutrition, growth, reproduction, and depth distribution (Richmond, 1993). When corals fertilize, they are free-swimming. Consequently, they need a good location to settle and make a good attachment. With significant soil deposition, sediments can physically interfere with the recruitment of coral larvae (Richmond, 1993; Dashbach, 1996). Coral communities are an important component of the overall ecology of the nearshore waters that adjoin the Afono watershed. They provide shelter to fish, invertebrates, and other marine organisms. Some of these resources represent a supplemental food source for residents of the watershed. Nutrient Inputs A nutrient contribution is also occurring through the continued use of septic tanks, cesspools, or other soil-based, wastewater treatment systems in the watershed. In addition, some piggeries in the Village may also be generating nutrient-enriched discharges into local stream. These sources of nutrients are also accompanied by some bacterial contamination from these discharges. While the total volume of wastewater generation from the watershed is limited, the discharges are concentrated in the inhabited village area where housing densities are between two and six housing units per acre. Local soils are generally inadequate to provide effective treatment. The long-term input of turbid and nutrient-enriched waters into the nearshore waters represents an important concern. These inputs are potentially detrimental to the quality because they can adversely change the composition of the nearshore marine environment. However, the degree of impact upon water quality is also highly dependent upon currents and water exchange within the nearshore environment. As the population of the watershed grows, nutrient and bacterial inputs will only increase. Aside from these resource management considerations, the future use of the nearshore waters for fishing, swimming and general recreation will eventually represent a more significant public health concern unless practical steps are made to reduce potential nearshore water contamination. The more remote location of Afono will likely continue the use of soil-based treatment systems for wastewater disposal. For this reason, the inhabited village areas in Afono that are unsuitable for soil-based, wastewater treatment should be more specifically identified. As recommended in the ASPA Utilities Master Plan, this identification process should be based upon a more detailed sanitation survey of more densely inhabited areas such as Afono. This survey would evaluate existing wastewater treatment practices, soil characteristics, the location and density of land uses, the distance to surface water supplies and the nearshore waters, topography, and other related factors. Using the conclusions and recommendations associated with this evaluation, ASPA and other participating Project Notification and Review System (PNRS) agencies will be better able to:
• require the use of septic tanks and leachfields that provide a sufficient amount of additional soil-based treatment;
• provide greater technical assistance to building permit applicants; and, if necessary, • deny building applications in land areas that are unsuitable for soil-based treatment systems.

Afono, Page 11-17
Long-Term Monitoring The future monitoring of the selected stream in the watershed is necessary and should be combined with water quality monitoring of the nearshore waters. Turbidity and sedimentation are the primary stresses to the coral communities in the nearshore waters in Afono Bay. However, future levels bacterial contamination and nutrient inputs should also be documented to help ensure future public safety and evaluate potential stresses to the fringing coral reef communities. In addition, the ASG Department of Marine and Wildlife Resources should monitor the coral communities along the reef front of Afono Bay at least once every three years. Long-term monitoring of this site should also include an evaluation of the impact of sedimentation and turbidity that already influences the nearshore marine environment. Groundwater and Surface Supplies The maintenance of desirable water quality in Pago Stream is an important concern because this stream provides a potable water supply to Afono residents. The development of a proposed groundwater supply and the related establishment of an ASPA satellite water system may represent a long-term improvement given the cost of improvements and possible misgivings of the Afono Village Council. The development of a groundwater supply is important to sustain the future public health of this community. The continued use of surface supplies from the existing stream supplies and related stream impoundments represent a potential health hazard to Afono residents. Gastroenteritis-related diseases such as Hepatitis A and salmonellosis can be derived via water-borne transmission. Consequently, reduced turbidity and sedimentation of Pago Stream should be a primary resource management objective for the Afono watershed. In the absence of the proposed groundwater supplies, it is recommended that Afono residents be encouraged to use surface supplies from individual rainwater catchment systems. While some limited contamination may be obtained from these sources, these surface supplies will provide considerably better water quality if systems are appropriately maintained. The village water catchment should be conserved with the establishment of a 100-foot setback from the impoundment. These supplies should be used and made available for non-potable uses, as well as an emergency drinking water source. MANAGEMENT NEEDS AND RECOMMENDATIONS The primary focus of future resource management in the Afono watershed will be to:
• Discontinue use of Pago Stream for drinking water. Begin use of rainwater catchment systems until groundwater wells and a satellite water system can be developed by ASPA.
• perform a detailed evaluation of sanitation problems in all residential and commercial areas; • conserve stream catchments associated with the village water system; • maintain culverts underneath the primary shoreline roadway; • conserve bird habitat; and, • conserve coral communities. Representatives of participating public agencies should make periodic visits to the watershed to 1) observe, document, and monitor selected resource conditions, 2) determine potential methods of correcting potential hazards or undesirable conditions, 3) share potential solutions with designated residents of Afono, and 4) encourage the participation of village leaders and residents in resource management solutions.

Afono, Page 11-18
The scope of issues that should be addressed by each agency in the field is summarized in Table 11-6. The general focus of recommended technical assistance is also identified. The experience and insights of agency representatives will determine the specific methodology to be used in the field. TABLE 11-6 RECOMMENDED FOCUS OF FUTURE TECHNICAL ASSISTANCE AFONO WATERSHED
Participating Public Agency
Resource Management Issue
Focus of Technical Assistance
ASEPA Facilitate a coordinated resource management effort within the watershed.
1. Coordinate overall watershed management activities. 2. Hold periodic meetings with participating ASG and federal agencies to discuss, prioritize, and schedule resource management activities. 3. Coordinate program efforts with local traditional leaders and/or designated resident of the watershed. 4. Make annual assessment of resource management program.
ASEPA Continue monitoring of Pago Stream, as well as the nearshore waters
Measure changes in and total/fecal bacteria, total suspended solids, turbidity and nutrients on a quarterly basis.
ASPA/ASEPA Perform a detailed evaluation of community sanitation problems associated with the use of soil-based treatment systems.
1. Survey existing residential and commercial areas of Afono Village. 2. Evaluate existing treatment practices, soil characteristics, location and density of land uses, the distance to water supplies and nearshore waters, topography, and other factors. 3. Require use of septic tanks and leachfields that provide sufficient amounts of additional soil-based treatment; or, deny building applications in areas unsuitable for soil-based treatment.
ASPA Develop new satellite water system in Afono.
1. Meet with traditional village leaders to consider the development of a satellite water system. 2. If desired by village leaders, secure funding for water system design and construction. 3. Design water system improvements. 4. Construct proposed improvements.
ASEPA Reduce potential health risks associated with surface water supplies
1. Encourage the use of individual roof catchment systems for drinking water and other potable uses until proposed ASPA improvements can be developed.
ASEPA Conserve surface water supplies
1. Identify village surface water supplies that are actively used. 2. Revise American Samoa GIS to delineate 100-foot buffers around each surface supply. 3. Restrict land uses within designated buffers.
ASDPW Maintain culverts along the primary shoreline roadway
1. Establish a periodic storm culvert maintenance program. Consider use of village labor to supplement DPW heavy equipment. 2. Clean debris and other material blocking culverts.
(Continued – next page)

Afono, Page 11-19
TABLE 11-6 (Continued) RECOMMENDED FOCUS OF FUTURE TECHNICAL ASSISTANCE AFONO WATERSHED
Participating Public Agency
Resource Management Issue
Focus of Technical Assistance
ASDOC Monitor changes in population and land use
Annually map type and location of land uses in village and estimate resident population.
ASCC Land Grant Program
Reduce sedimentation from agricultural activities
1. Determine locations where upslope agricultural activities may be generating some sedimentation. 2. Encourage soil conservation methods with resident growers of subsistence crops.
ASDMWR Sustain bird habitats in the vicinity of Oa and Vainuu Point.
Monitor changes in bird populations in the vicinity of Oa and Vainuu Point.
ASDMWR Sustain healthy marine communities in nearshore waters
Monitor changes in coral coverage, fish habitat, diversity and other characteristics along the fringing reef front of Afono Bay approximately once every three years.
Source: Pedersen Planning Consultants, 1998

Masefau, Page 12-1
MASEFAU Watershed 12 GEOGRAPHY The Masefau watershed is located in the eastern half of the Island of Tutuila. The watershed comprises about 1.42 square miles of land area (Figure 12-1). A series of mountains and related volcanic ridges form the upland boundary of the Masefau watershed. Vainuu Mountain is situated northeast of Masefau village just upslope of the shoreline. Tagau Mountain is the upland boundary in the southwest portion of the watershed. Palapala Mountain, which rises about 1, 178 feet above mean sea level, forms the southern boundary of the watershed. Etemuli Mountain and its connecting ridges continue along the southern boundary of the watershed. The mountain ridges of the upland boundary begin to descend in elevation at Filiae Mountain (834 feet above MSL) and continue to Utuloa Ridge (upland of Tiapea Point) near the east boundary of the watershed. Along the shoreline, the watershed is situated between Tapisi Point and Tiapea Point. Masefau Bay is a large embayment that lies between these two points. Agasa Strait is a natural channel between the northeast part of the watershed and the smaller, offshore islet known as Nuusetoga. Fagalua Cove is situated between Lepua Point and the northerly descending slopes of Vainuu Mountain. Steep upland slopes characterize the Masefau watershed. Four streams discharge into the nearshore waters of Masefau Bay. Talaloa and Tagau Stream empty into a large wetland area before discharging into the ocean. The wetland is situated on the mountain side of the shoreline village area. Masefau Village is a shoreline community that lies along Masefau Bay. An upland residential area known as Utuloa is situated near the southeast, upland boundary of the watershed at about the 600-foot contour. RESOURCES OF THE WATERSHED Soils The U.S. Soil Conservation Service (National Resource Conservation Service) published a Soil Survey of American Samoa in 1984. Selected information derived from this survey provides some useful information for future watershed planning and management (Figure 12-2). Eight different soil classifications were identified by the U.S. Soil Conservation Service for lands within the Masefau watershed (Table 12-1). Aua Very Stony Silty Clay Loam (15 to 30 percent slopes) Aua very stony silty clay loam soils (SCS mapping unit 1) are present on the southeast side of Masefau Village. This soil type generally occurs between the shoreline and some 900 feet inland. These soils typically occur up to about 60 inches in depth. The surface layer is a dark brown and stony, silty clay loam that extends to about seven inches below ground elevation. The subsoil represents approximately 11 inches of dark brown stony clay loam. The lower subsoil contains some 42 inches of a very stony, dark brown and very dark, grayish-brown clay loam (U.S. Soil Conservation Service, 1984). The permeability of these soils ranges between 2 and 6 inches per hour. The potential for runoff or erosion from these Aua soils is believed to be moderate (U.S. Soil Conservation Service, 1984).


Masefau, Page 12-4
TABLE 12-1 SELECTED SOIL CHARACTERISTICS MASEFAU WATERSHED Soil Depth To: Land Use Suitability
SCS Soil Unit
Name Typical Slope
(Percent)
Flood Runoff Erosion High Water (Feet)
Bed Rock
(Inches)
Soil Based WW
Treatment
Subsistence Ag
Potential
1 Aua very stony silty clay loam
15-30 None Medium Mod-erate
>6 <60 Severe Slope Moderate
2 Aua very stony silty clay loam
30-60 None Rapid Severe <6 <60 Severe Slope Poor
3 Fagasa-Ofu silty clays
30-60 None Med to Rapid
Mod to Severe
>6 20-40 Severe Slope Depth
Moderate
4 Fagasa family-Lithic Hapludolls-Rock outcrop assoc
70-130 None Very Rapid
Very Severe
>6 20-60 Severe Slope Depth
Limited
8 Leafu silty clay 0-3 Occ Slow Slight 3-5 >60 Severe Flood Wet
Moderate
9 Leafu silty clay 0-3 Occ Slow Slight 3-5 >60 Severe Flood Wet
Moderate
13 Negerungor Variant mucky peat
0-1 Freq Very Slow
Slight +1, -1 >60 Severe Flood Ponding Filter
Poor
35 Urban Land-Ngedebus complex
0-5 Occ. Brief
Slow Slight >3.5 >60 Severe Flood Wet Pool Filter
Poor
Source: U.S. Soil Conservation Service, 1984 Continued from page 12-1: Aua Very Stony Silty Clay Loam (15 to 30 percent slopes) While moderately suited for agricultural production, the U.S. Soil Conservation Service estimates that this soil can annually sustain up to 5 tons per acre of erosion without impacting crop productivity (U.S. Soil Conservation Service, 1984). However, the U.S. Soil Conservation Service also advises that the stony and erosive characteristics of these soils may limit production. While the erosive characteristics of this soil generally may not significantly impact subsistence crop productivity, the erosive quality of the soil can be a significant contributor to sedimentation in downslope streams and the nearshore waters. The general characteristics of these Aua soils are also undesirable for individual wastewater disposal systems (U.S. Soil Conservation Service, 1984). These soils contain a significant amount of larger stones that typically hamper installation and provide inadequate soil treatment. Aua Very Stony Silty Clay Loam (30 to 60 percent slopes) Steeper slopes of the lower watershed contain Aua very stony silty clay loam soils (SCS mapping unit 2). In general, these soils primarily occur between the 200 and 600-foot elevation. They are also lie immediately upslope of the north and south sides of the Masefau wetland. The Aua soils range between seven to 60 inches in depth. The permeability of these soils is between 2 and 6 inches per hour and considered to be moderately rapid. For watershed management purposes, it is important to note that these Aua soils have a high potential for runoff and erosion. This Aua soil is not recommended for agricultural production because of the stoniness of the soil, the high erosion potential, and hazards associated with subsistence crop cultivation on steeper slopes. However, when cultivation in these soils is necessary, the use of a mulch or ground cover is recommended to reduce soil erosion in cultivated areas (U.S. Soil Conservation Service, 1984).

Masefau, Page 12-5
The U.S. Soil Conservation Service estimates that this soil can annually sustain up to 5 tons per acre of erosion without impacting crop productivity (U.S. Soil Conservation Service, 1984). While the erosive characteristics of this soil generally may not significantly impact subsistence crop productivity, the erosive quality of the soil can be a significant contributor to sedimentation in downslope streams and the nearshore waters. The Aua soils are also undesirable for individual wastewater disposal systems (U.S. Soil Conservation Service, 1984). The Aua soils contain a significant amount of larger stones that hamper installation and provide inadequate soil treatment. Fagasa-Ofu Silty Clays Significant portions of the upper watershed are characterized by Fagasa-Ofu silty clay soils (SCS mapping unit 3). These soils are present on the north and east slopes of Filiae Mountain, the southeast and northwest slopes of Etemuli Mountain, the north and west slopes of Palapala Mountain, and the east slopes of Tagau Mountain. The soil ranges between 20 to 40-inches in depth. As its name implies, this soil type represents the intermingling of two primary soils: Fagasa silty clay and Ofu silty clay. Higher elevations may also include some smaller areas of Aua very stony, silty, clay loam. The permeability of these soils is moderately rapid (2 to 6 inches per hour). The potential for surface runoff from these soils is considered moderate to rapid. However, the potential for erosion is moderate to severe (U.S. Soil Conservation Service, 1984). The U.S. Soil Conservation Service indicates that these soils are somewhat suitable for the production of subsistence crops. These soils can annually sustain from one to 5 tons per acre of erosion without impacting crop productivity. However, the Soil Conservation Service recommends the use of mulch, crop residues, and cross-slope farming to reduce the potential for soil erosion. Fagasa Family-Lithic Hapludolls-Rock Outcrop Association Steeper upland land areas throughout most of the remaining watershed contain deep, well-drained soils on steep mountain ridges and slopes. The U.S. Soil Conservation Service identifies these soils as part of the Fagasa family-Lithic Hapludolls-Rock outcrop association (SCS mapping unit 4). This soil type is common near the shoreline of Masefau Bay and the higher elevations of the watershed. Since this soil type is a combination of two general soil classifications, soil depths can vary between 20 and 60 inches. The soil represents a combination of silty clay and loam. Since the Fagasa Family-Lithic Hapludolls soil occurs on steeper slopes, the potential for surface runoff and erosion are high. The cultivation of subsistence crops on these soils is not considered desirable. However, when cultivation in these soils is necessary, care should be exercised to minimize the amount of exposed soil in cultivated areas. When heavier rainfall events occur, significant erosion of these soils can be expected from undeveloped upslope areas of the watershed. Natural runoff from steeper slopes in the watershed carries water, sediments, and organic debris to downslope drainage courses and streams. Such erosion can readily influence downstream water quality. Leafu Silty Clay (0 to 3 percent slopes) The fresh-water marsh area of the Masefau wetland primarily contains Leafu silty clay soils (SCS mapping unit 8). These soils are found roughly 1,700 to 2,500 feet inland from the Masefau Bay shoreline.

Masefau, Page 12-6
This soil typically extends up to 60 inches in depth. Its permeability ranges between 2 and 6 inches per hour. Runoff from these soils is generally slow and the potential for soil erosion is limited. However, these soils are typically subject to brief periods of flooding during prolonged, heavier rainfall. These soils are moderately suitable for subsistence agriculture. However, this land use is constrained by occasional periods of flooding and general soil wetness. The U.S. Soil Conservation Service estimates that this soil can annually sustain up to 5 tons per acre of erosion without impacting crop productivity (U.S. Soil Conservation Service, 1984). Consequently, the use of these lands for subsistence agriculture is not likely to generate significant downslope erosion. The use of these Leafu soils for residential land uses is not recommended by the U.S. Soil Conservation Service because of the inherent flood potential associated with this soil. The same characteristics also hamper the use of these soils for septic tank systems and related soil-based treatment. Leafu Stony Silty Clay (0 to 3 percent slopes) The lower end of the Talaloa Stream drainage that discharges into the Masefau wetland contains Leafu stony silty clay soils (SCS mapping unit 9). This soil is a deep soil that typically extends up to 60 inches in depth. The surface layer (approximately 13 inches thick) represents a dark brown, stony, and silty clay. The subsoil, which extends about 31 inches, retains the general characteristics of the surface layer but becomes mottled. The substratum extends to a depth of 60 inches or more and generally resembles the characteristics of the subsoil. The permeability of this Leafu soil ranges between 2 and 6 inches per hour. Runoff from this soil is generally slow and the potential for soil erosion is limited. However, these soils are typically subject to brief periods of flooding after heavier rainfall periods (U.S. Soil Conservation Service, 1984). These soils are somewhat suitable for subsistence agriculture. However, this land use is somewhat constrained by occasional periods of flooding and general soil wetness. The U.S. Soil Conservation Service estimates that this soil can annually sustain up to 5 tons per acre of erosion without impacting crop productivity (U.S. Soil Conservation Service, 1984). Consequently, the use of these lands for subsistence agriculture is not likely to generate significant downslope erosion and sedimentation. The use of these Leafu soils for residential land uses is not recommended by the U.S. Soil Conservation Service because of the inherent flood potential associated with this soil. The same characteristics also hamper the use of these soils for septic tank systems and related soil-based treatment of wastewater effluent. Ngerungor Variant Mucky Peat Ngerungor variant mucky peat (SCS mapping unit #13) generally occurs within the mangrove swamp portion of the Masefau wetland area that is situated on the mountain side of the village. This soil type extends approximately 400 to 1,200 feet inland from the shoreline. Soil samples collected in early 1990 indicate that a portion of the adjoining freshwater marsh also contain some mucky peat. This poorly drained organic soil is characteristic of a coastal swamp environment in American Samoa and is typically covered by water. Water levels over the soils in the Masefau wetland fluctuate with tidal variations throughout the year. The surface layer of the soil, which comprises a very dark, mucky peat, is about four inches thick. A very dark, grayish- brown layer of peat extends between 4 and 17 inches below ground elevation. The

Masefau, Page 12-7
underlying soil contains very dark brown peat to a depth of 60 inches or more (U.S. Soil Conservation Service, 1984). Ngerungor variant mucky peat is formed in organic material that is derived primarily from decomposing mangrove roots and litter. The permeability ranges from between six to 20 inches per hour. Runoff is very slow; the hazard of water erosion is slight (U.S. Soil Conservation Service, 1984). Urban land-Ngedebus complex Urban land-Ngedebus complex soils (SCS mapping unit 35) characterizes most of the lands in the immediate vicinity of Masefau’s shoreline village area. These soils generally comprise coral fragments, sand, cinders and other material that have been graded or filled to support residential, commercial and public facilities in the village area. This soil type extends roughly 200 and 600 feet inland from the shoreline. The Ngedebus soil extends to a depth of 60 inches or more. The surface layer, which extends about 4 inches below ground elevation, typically contains light, brownish-gray and brown sand. The underlying material is characterized by pale brown and light yellow, brown sand. The permeability of Ngedebus soil ranges between six and 20 inches per hour. Surface drainage on this soil is generally slow, and the hazard of potential soil erosion is slight. In some places the soil is subject to occasional, brief periods of flooding during prolonged, heavy rainfall or during high tide (U.S. Soil Conservation Service, 1984). These soils are generally suitable to support residential and commercial development in areas that are protected from flooding. However, this soil is poorly suited in unprotected areas. In recent years, portions of village shoreline have been subjected to flooding that was generated by Hurricane Ofa in 1990 and Hurricane Val in 1991 (U.S. Army Corps of Engineers, 1994). Where moderate to higher housing densities occur, the U. S. Natural Resources Conservation Service recommends the use of community sewage systems prevent the potential contamination of groundwater and surface water supplies. Lower housing densities are present throughout Masefau village; the greatest concentration of homes is found on the north side of the village. Streams Stream Locations Talaloa Stream and its five unnamed branches represent the primary drainage in the watershed that discharges surface flows into Masefau Bay. This drainage area receives surface flows from the east slopes of Tagau Mountain and the north slopes of Palapala Mountain. The Talaloa Stream drainage also receives surface flow input from Tagau Stream that joins Talaloa Stream inside the Masefau wetland. A portion of the combined flows ultimately empty into the nearshore waters of Masefau Bay after their detention within the Masefau wetland. The remaining flows infiltrate the local groundwater aquifer, become absorbed by wetland plants via transpiration, or dissipate through evaporation. An unnamed stream along the northeast slopes of Tagau Mountain (Stream 12A) originates at about the 200-foot elevation. This stream discharges into the nearshore waters of Fagalua Cove. One unnamed stream (Stream 12B) transports surface flows from the south slopes of Etemuli Mountain to the southern shoreline of Masefau Bay. The point of discharge occurs near the east end of Masefau village.
Masefau, Page 12-8
Surface flows from the north side of Filiae Mountain are carried to the nearshore waters of Masefau Bay via three unnamed streams (Streams 12C, 12D, and 12E). These stream begin between the 600 and 800-foot contour. Two unnamed stream (Streams 12 F and 12G) are situated on the west side of Utuloa Ridge (near Tiapea Point). These stream originate between 400 and 520 feet above mean sea level and carry surface drainage on the north side of Utuloa Ridge to the nearshore waters on the east side of Masefau Bay. Stream Flows Within the Watershed Two water flow gages have historically been operated within the Talaloa Stream drainage. A low-flow, partial-record station (No. 16909500) was installed on Talaloa Stream (approximately 0.5 mile from the stream mouth) between 1958 and 1975, and provided 14 stream flow measurements. These records enabled the U.S. Geological Survey to estimate a median flow of 0.43 cubic feet per second (cfs) for Talaloa Stream (Wong, 1996). Along Tagau Stream, a low-flow partial-record station (No. 16910000) was located about 0.4 mile from the stream mouth and provided 10 measurements between 1958 and 1975. These measurements were used by U.S. Geological Survey to calculate an estimated median flow of 0.12 cfs (Wong, 1996). Aquatic Fishes and Invertebrates Field surveys of fishes and invertebrates were made by the U.S. Fish and Wildlife Service, Division of Ecological Services, in March-April, 1978 and the U.S. Army Corps of Engineers in August, 1980. Talaloa Stream was one of 37 streams in American Samoa that were inventoried by representatives of these federal agencies. Results from both field surveys were summarized in an American Samoa Stream Inventory that was published by the U.S. Army Corps of Engineers, Honolulu District, in July, 1981. Two points along Talaloa Stream were surveyed. Station 26a was located immediately upstream of the shoreline. Station 26b was situated roughly 2,000 feet upstream from station 26a at an elevation of approximately 20 feet on Tagau Stream, a tributary to Talaloa Stream. In the vicinity of the shoreline, one species of gobie fish and one species of mountain bass were observed at station 26a. No eels were documented at the downstream station. One shrimp species was also present. No mollusks were observed. At station 26b, one abundant gobie fish and one mountain bass species were recorded. One occasional species of eels was present. Five species of shrimp were also observed; one species was abundant. Only one species of mollusk was noted at the upstream station. Surface Water Quality Streams A one-time, surface water quality sample was collected from Talaloa Stream on September 12, 1970 (STORET, 1996). The laboratory results from this sampling only reveal that coliform bacteria levels were considerably elevated on the date of sampling (Table 12-2).

Masefau, Page 12-9
TABLE 12-2 SURFACE WATER QUALITY SAMPLE RESULTS TALALOA STREAM SEPTEMBER 12, 1970
Water Quality Parameter TN TKN NO3+NO2 TP Turbidity TSS pH Total Coliform Date (µg/l) (µg/l) (µg/l) (µg/l) (jtu)** (mg/l) (#/100 ml) 09/12/70 -- -- nd* -- 1.0 -- 6.90 23,000
Notes: * nd = not detectable **Turbidity results are expressed in jtu (Jackson units) rather than ntu, which is more commonly used in recent years. Source: U.S. EPA (STORET), 1996 Nearshore Waters ASEPA collected marine water samples from 17 embayments around the Island of Tutuila on July 25 and August 2, 1992 (Table 12-3). The samples were obtained from the outer portions of the embayments where more water exchange occurs at depths of three and 60 feet. Collected samples were subsequently analyzed for nutrients and chlorophyll a. Nutrient data gained from these samplings indicate that the outer waters of Masefau Bay met American Samoa water quality standards in late July and early August of 1992. Laboratory results also suggest that stormwater runoff from undeveloped lands upland of Masefau Bay may not generate any significant discharge of nutrients. TABLE 12-3 SURFACE WATER QUALITY OUTER MASEFAU BAY JULY-AUGUST, 1992
Sample Depth (Feet)
Nitrate/Nitrite Mg N/l
Total N
mg N/l
Kjeldahl N
mg N/l
Total P
mg P/l
CHL a
mg/m3
3 0.001 0.140 0.139 0.008 0.18 60 <0.001 0.136 0.136 0.013 0.07
Source: ASEPA, 1995 Two surface samples were collected from the nearshore waters of Masefau Bay in early 1995. The levels for nitrate-nitrite and chlorophyll α suggest favorable nearshore water quality (Table 12-4). TABLE 12-4 SURFACE WATER QUALITY SAMPLE RESULTS UNKNOWN DATE IN 1995
Parameter Station Masefau 1 Masefau 2 Total Nitrogen (µg-N/l) 209 163 Total Kjeldahl N (µg-N/l) 193 148 Nitrate-Nitrite (µg-N/l) 16 15 Total Phosphorus (µg-P/l) 11 12 Chlorophyll α (µg-P/l) 0.10 0.14
Source: AECOS, 1995

Masefau, Page 12-10
During a field survey of the watershed in early May, 1996, Chief Fautanu of Masefau Village noted that some turbidity of the nearshore waters occurs following periods of heavier rainfall. Occasional sedimentation of the Bay is more likely generated from the discharge of turbid surface flows from the five streams east of the Talaloa Stream drainage. It is believed that most of the sediments in the Talaloa drainage settle out during their detention within the Masefau wetland. Wetlands Type and Size of the Masefau Wetland Mangrove swamp and freshwater marsh characterize the Masefau wetland. The entire wetland encompasses approximately 42.3 acres. About 18.4 acres of the wetland represent mangrove. Fresh-water swamp covers some 13.2 acres of the wetland. The remaining 10.7 acres consist of fresh-water streams (Biosystems Analysis, Inc., 1992). Mangrove Swamp The wetland originates at the mouth of Talaloa Stream, which discharges into Masefau Bay. The mangrove swamp portion of the wetland is situated immediately adjacent to the shoreline and the village road. The swamp’s opening to Masefau Bay enables the discharge of some surface flows from the Talaloa Stream drainage to the nearshore waters of Masefau Bay. The mangrove swamp extends about 2,400 feet inland. “The dominant species in the disturbed portion of the mangrove swamp are oriental mangrove saplings growing from the roots of dead trees. Epiphyte species also grow from the dead mangrove tree trunks. Around the periphery of the disturbed mangrove is the undisturbed mangrove swamp dominated by the tree species Tahitian chestnut, ifi, and beach hibiscus, fau. The dominant herbaceous plants are red ginger and Diplazium proliferum” (Biosystems Analysis, Inc., 1992). The Comprehensive Wetlands Management Plan for American Samoa noted that the most unique feature about the mangrove swamp is that most all of the trees in the mangrove swamp have died. However, trees in the northern portion of the mangrove swamp remain alive and generally undisturbed. Similar conditions were observed by Pedersen Planning Consultants during the survey of the Masefau watershed in May, 1996. Fresh-Water Swamp The freshwater marsh is contiguous with and immediately inland from the mangrove swamp. The marsh extends inland to where the terrain steepens and the streams become confined to narrow channels. This freshwater marsh was once used for the cultivation of taro. However, this area has been abandoned for several years and is overgrown with Job’s tears and other uncultivated herbaceous plants (Biosystems Analysis, Inc., 1992). Marine Resources Coral Communities A fringing reef extends from Agasa Strait to the southeast side of Masefau Bay. “A remnant of raised reef projecting above the fringing reef in Masefau Bay is considered evidence of a former higher stand of sea” (Aecos and Aquatic Farms, 1980). Available aerial photography from 1989 suggests that the reef margin extends up to 1,000 feet in the southeast part of Masefau Bay. Near the central part of the main village area, the fringing reef is about 200 feet from the reef margin and adjacent channels to the offshore waters. The fringing reef margin

Masefau, Page 12-11
extends about 600 feet from Masefau Bay’s western shoreline, and increases to about 800 feet within Agasa Strait. Various private consultants have made various field investigations of the fringing reef in these areas since the late 1970’s. In a cumulative sense, available survey information provides suggests that:
• The growth of coral communities in Masefau Bay was adversely impacted by the outbreak of crown-of-thorns starfish between late 1978 and 1979.
• A portion of the inner reef flat in Masefau Bay has been stressed by diminished water quality, e.g., turbidity, near the mouth of Talaloa Stream.
• Coral communities have probably experienced some impact from various hurricanes and other significant storm wave periods.
• Despite past stresses to coral communities, the coral communities appeared to be making a reasonably fast recovery in 1995.
1978-1979
From its review of 1971 aerial photography, Aecos and Aquatic Farms noted evidence of scars on the inner and mid-reef off the eastern end of Masefau Village where sand was dredged in the late 1960’s.
The fringing reef flat along the southern part of Masefau Bay is characterized primarily by rubble and sand. Portions of the inner reef flat along the southern part of Masefau Bay were characterized by a considerable cover of brown algae and some seagrass. Less than five percent of the inner reef flat was covered by live coral; the middle reef flat contained around ten percent coral coverage.
“A layer of dark, silty-sand covers the inner reef flat off the central and northern parts of Masefau village….Reef flat waters away from the influence of Talaloa Stream are clear and visibility underwater may be as much as 50 feet on the inner reef” (Aecos and Aquatic Farms, 1980).
The outer reef flat, which extended about 300 to 400 feet offshore, was characterized by irregularly-consolidated limestone and some areas of sand, gravel or rubble. The rubble tracts of the outer reef flat were characterized by few corals. Fleshy algae, e.g., Padina, sp., covered up to 60 percent of these areas. Live corals covered less than five percent of the bottom of the reef margin.
Field surveys that were performed by Birkland and Randall in June 1978 documented no crown-of-thorns starfish on the forereef slopes between Tiapea Point and Masefau Village. However, the occurrence of the crown-of-thorns starfish between late 1978 and 1979 had a significant impact upon, at least, portions of Masefau’s fringing reef.
Only 15 percent of corals on the eastern portion of the upper reef front (at depths of 6 to 33 feet) remained alive by August and September, 1979. The crown-of-thorns starfish and larger patches of dead coral were observed on the reef front of the northwest part of the Bay. During the same period, approximately 60 percent of corals on the upper reef front of the northern bay remained alive. Coral coverage on the overall reef front was about 50 percent. At least 44 coral species characterized the reef flat and reef front throughout Masefau Bay.
Abundant coral was documented along the narrow reef that extended on the southeast side of Nu’usetoga Rock. Coral coverage was typically about 60 percent in this area; in some areas, coral coverage on the bottom ranged between 80 and 100 percent. Most corals were alive except along the sides of depressions. However, the presence of the crown-of-thorns starfish are evident and observed to be actively feeding (Aecos and Aquatic Farms, 1980).

Masefau, Page 12-12
On the north side of Asaga Strait, coral coverage on the upper reef face was only about five percent. Where branching Acropora occurred, coral coverage increased to about 10 percent.
No beaches or fringing reefs characterize the coastline between Lepua Point and Tapisi Point. In June 1978, crown-of-thorns starfish were observed between Asaga Strait and Lepua Point on the coral bottoms adjacent to points of land. By August and September 1979, only about 20 percent of corals on the upper reef off Lepua Point (between 6 and 33 feet in depth) remained alive (Aecos and Aquatic Farms, 1980). 1982, 1985, and 1988
During the month of April in 1982, 1985, and 1988, Birkeland and Randall investigated the coral communities inside Masefau Bay, as well as outside the Bay in the vicinity of Asaga Strait. The transects were made at depths of 6 to 10 feet and 20 feet. TABLE 12-5 CORAL COVERAGE WITHIN AND OUTSIDE OF MASEFAU BAY 1982, 1985, AND 1988
Location Year Depth
(feet) Coral Coverage
(Percent) Inside Masefau Bay 1982 6-10 12.31 1985 03.69 1988 08.70 1982 20 32.85 1985 66.08 1988 02.80 Asaga Strait 1982 6-10 41.94 1985 28.44 1988 15.60 1982 20 02.59 1985 03.30 1988 23.20
Source: Birkeland, Randall, and Amesbury, 1990. Field surveys revealed variable levels of coral coverage. Inside Masefau Bay, coral coverage was approximately 12 percent in 1982, but declined to almost four percent in 1985 and almost nine percent in 1988. At a depth of 20 feet, coral coverage increased dramatically to 66 percent in 1985, but declined significantly to almost three percent in 1988. In the vicinity of Agasa Strait, coral coverage declined from almost 42 percent in 1982 to less than 16 percent in 1988. A reversed trend was evident at 20 feet where a limited coral coverage of less than three percent in 1982 increased to 23 percent in 1988. 1992
Field investigations were also made in at Masefau Bay by Maragos, Hunter, and Meier in 1992. Similar to other parts of northeast Tutuila, coral reefs were absent from exposed, northern-facing coastal areas. Less than one percent live, coral cover was observed at a depth of 6 meters, but increased to about five percent at a depth of 18 meters.

Masefau, Page 12-13
1995
A 1996 study of various coral reefs throughout the Samoan Archipelago included the performance of one transect along the reef front within the southeast part of Masefau Bay. The study focused primarily upon the quantification of coral communities, the abundance and diversity of reef fish, and selected habitat characteristics.
Field observations indicated that coral coverage was between 20 and 39 percent. Coral colony sizes were documented to be “most small, some medium, few large” (Green, 1996). Green also observed that the recovery of coral communities at Masefau Bay was reasonably fast over the 1994-1995 period.
Fish species richness was reported to be “moderate”, or between 100 and 149 species. The density of fish that were observed ranged between 5,000 and 9,999 individuals per hectare (ha). Fish biomass was reported to be “low”, and represented less than 500 kilograms per ha (Green, 1996).
Wildlife Resources “Nu’usetoga Islet is a possible roosting and nesting site for the reef heron. The reef heron is a resident seabird that is uncommon in American Samoa” (Aecos and Aquatic Farms, 1980). Shoreline Protection The shoreline road in Masefau Village has historically received considerable damage from past hurricanes. Most all of the shoreline in Masefau Bay that fronts the inhabited village area is lined with revetments, gabion walls, or other shore protection. More recently, shore protection structures have been constructed to protect parts of the new shoreline road that was reconstructed in 1994. The primary basaltic revetment begins on the southeast side of the Bay and continues along the shoreline to the west side of Masefau Village. Construction of this revetment was prompted by significant damage to Masefau Elementary School that was generated by Hurricane Val in December, 1991. The revetment was constructed with 1.3 to 2.5-ton basaltic, boulders and contains a crest elevation of 7 feet above mean sea level. Northeast of the elementary school, additional rock revetment from this project was placed along the shoreline up to about four feet above mean sea level (Sea Engineering, Inc. and Belt Collins Hawaii, 1994). The shoreline of the northwest part of the village remains unprotected. Most of the homes and other structures in this area are situated between the 5 and 10-foot contour. While this area is vulnerable to potential damage, potential storm damage is less because of the higher shoreline elevations. Groundwater and Surface Water Supplies Groundwater Supply and Quality Groundwater from the Talaloa Stream drainage is primarily used personal bathing, laundry, and the watering of animals (Fautanu, 1996). Residents do not use the groundwater supply for drinking purposes because of an unfavorable taste. It is believed that groundwater quality is impacted by the proximity of existing groundwater wells to the fresh-water marsh portion of the Masefau wetland that likely contains considerable organic material. The groundwater supply is obtain from two groundwater wells that are located along the lower end of the Talaloa Stream drainage on the southwest side of the Masefau wetland.

Masefau, Page 12-14
During field investigations of the watershed in May, 1996, The wells were each operating at approximately 85 psi and delivering supply to the storage tank. ASPA estimates that these of these wells can yield an estimated 60 gallons per minute of water supply. The groundwater wells are connected to the new 100,000 gallon tank that was constructed near the shoreline village roadway in 1996. Surface Water Supply and Quality A fresh-water spring is located along Tagau Stream on the west side of the fresh-water marsh. The spring is connected to a 4-inch PVC distribution line that serves the Masefau Village area. Spring water is used by all residents for drinking water (Fautanu, 1996). Available water quality information for FY 1994 through FY 1996 suggest rather consistent, elevated levels of fecal coliform contamination. Fecal coliform levels range between 50 and 60 colonies per 100 mililiters (ASEPA, 1994, 1995, and 1996). Proposed Water System Improvements No additional system improvements are anticipated through, at least, the year 2015. The existing storage tank is expected to serve the potable water needs and some basic fire protection requirements (ASPA, 1995). USE OF THE WATERSHED Resident Population Masefau Village is the only inhabited area of the Masefau watershed. In 1980 the total population was 320 persons, and in 1990, the total population was 389 persons. Such growth represented an average annual growth rate of about 2.16 percent. The population of Masefau increased with the construction of 27 new houses between 1990 and 1995. Recent population estimates indicated that the 1995 population was about 515 persons. Population trends reflected in the 1990 Census statistics suggest that some in-migration occurred in this community between 1980 and 1990. The proportion of residents who were born outside of American Samoa during the 1980-1984 period was about 28 percent. Between 1985 and 1990, this same proportion increased to 35 percent. In 1990, the proportion increased slightly to 29 percent. These statistics suggest that Masefau is probably a more stable community that has experienced limited in or out-migration. Land Uses Residential The 1990 U.S. Census documented 47 homes in Masefau Village. This includes several homes that are situated in the Masefau Village Census area, which includes several homes that are located in upland areas outside of Masefau Village. Ninety-two percent of the homes in the Masefau Village Census area were owner-occupied; two percent were rental units. Six percent were vacant or used by owners for vacation homes. ASG Building Division records indicate that 13 building permits were issued for new residential structures from 1990 through 1994. Consequently, the 1995 housing stock included approximately 60 houses.

Masefau, Page 12-15
Agriculture Various piggeries are located within the primary village area. In May, 1996, at least two piggeries were located immediately adjacent to the north side of the Masefau wetland. One or more piggeries were also situated along the southern margins of the wetland. Agricultural activities in the Masefau watershed included the maintenance and harvesting of subsistence crops from faatoaga, or agricultural areas, that are situated within and upland of Masefau Village. The faatoaga typically include the production of bananas, breadfruit, and taro. Commercial In 1995, ASG business license records indicate that ten commercial enterprises were based in Masefau. One building permit was issued for one new commercial facility during the 1990-1995 period. Commercial enterprises included five transportation companies, one general retail store, one village grocery store, a laundromat, one fast-food operation, and a landscaping contractor.. Industrial In 1995, no industrial operations were based in Masefau. Public Facilities The ASG Department of Education offers an early childhood education program in Masefau. In September, 1994, 15 younger students were enrolled in this program. Elementary school-aged children attend Masefau Elementary in Masefau. The school had a student enrollment of 94 students in September, 1994. High school students are bussed to Fagaitua High School in Fagaitua. Use of the Nearshore Waters Nearshore Fishing An American Samoa Subsistence Fishing Survey conducted by the University of Hawaii Sea Grant Program in the summer of 1992 involved onsite interviews on selected days with shoreline users who were participating in fishing activities during that period. The results of the survey revealed that there is considerable use of the near-shore waters in the reefs off Masefau. Some 23 to 33 persons were documented fishing on the reef seaward of Masefau Village. Fishing methods observed included the use of rod-and-reel, throw net, gill net, gleaning, hand-in-line, as well as hand-in-line in a paopao. During a May 8, 1996 field survey of the watershed, Pedersen Planning Consultants observed approximately 10 persons who were pole fishing on the reef flat. Pole fishing likely takes place on other parts of the fringing reef, as well as deeper waters near the center of the Bay. However, such activity was not confirmed with traditional leaders of Masefau Village. During lower tide and calm sea conditions, the southwestern to western side of Nuusetoga Islet is accessible across a reef platform from Tutuila. Villagers from Masefau may occasionally pole fish in the Asaga Strait from the Masefau Bay side of the reef.

Masefau, Page 12-16
RESOURCE MANAGEMENT ISSUES Future Land Uses to the Year 2015 Residential During the next 20 years, it is anticipated that future residential growth will average about 2.5 percent per year. Such growth will be slightly greater than the average annual residential growth that occurred between 1980 and 1990 (2.2 percent), but considerably less than the five percent annual growth from 1990 through 1994. The lack of developable lands and related flood potential of the large wetland in Masefau will limit future residential expansion. However, future growth will gradually continue until the supply of all developable lands in the Village are depleted. Should residential demands exceed the anticipated amount of growth, a greater infill of the Masefau wetland area would be required since all other developable lands will be in use. Future residential expansion is anticipated in three locations within the overall Masefau village Census area. It is believed that all developable lands in both of these areas will be developed during the next 20-year period. Several homes are already located along the steep road access to Masefau Village. Between the 300 and 600-foot elevation, it is believed that there are seven additional housesites. Future residents will continue to be attracted to this area because of the scenic views and the closer proximity to the south side of Tutuila. The narrow coastal plain on the southeast side of Masefau’s larger inland valley can accommodate about three more single family homes. This assumes that the present residential density between the shoreline and the 50-foot elevation would remain about the same. The larger inland valley and related wetland area can accommodate a significant amount of housing if a greater portion of the wetland was filled. However, it is believed that the Village leadership recognizes the importance of the wetland for stormwater retention and the recharge of the Tutuila’s basal lens. Consequently, it is anticipated that only 20 additional homes will be built along the fringe of the wetland. Such development will occur along the north and south sides of the wetland which are already accessible via existing dirt trails. During the next 20 years, ASPA believes that these potential development opportunities and constraints will generate the following sequence and volume of residential construction.
1996-2000 One new single family home along the narrow coastal plain (between the shoreline and 50-foot elevation) on the southeast side of Masefau’s larger inland valley.
Three new single family homes along the main access road to Masefau between the 300 and 600-foot elevation.
Five new single family homes along the fringe of Masefau’s larger inland valley.
2001-2005 One new single family home along the narrow coastal plain (between the shoreline and 50-foot elevation) on the southeast side of Masefau’s larger inland valley.
Two new single family homes along the main access road to Masefau between the 300 and 600-foot elevation.
Four new single family homes along the fringe of Masefau’s larger inland valley.
2006-2010 One new single family home along the narrow coastal plain (between the shoreline and 50-foot elevation) on the southeast side of Masefau’s larger inland valley.

Masefau, Page 12-17
Two new single family homes along the main access road to Masefau between the 300 and 600-foot elevation.
Four new single family homes along the fringe of Masefau’s larger inland valley.
2011-2015 Seven new single family homes along the fringe of Masefau’s larger inland valley. The cumulative effect of this prospective residential growth is that the village housing stock will increase to roughly 90 housing units in the year 2015. During the same period, it is believed that the average household size will have gradually decreased to approximately 7.33 persons per household. It is anticipated that the future village population will include about 660 persons in the year 2015. Commercial Limited commercial facility expansion is anticipated during the next 20 years due to the lack of developable land. However, the establishment of second laundromat with ten washers, as well as an additional retail store is expected during the 2001-2005 period. The start-up of two home-based occupations that will provide technical or professional services is expected between 2001 and 2005. Two additional home-based enterprises are anticipated .during the 2006-2010 period.. Three additional home-based businesses are expected between 2011 and 2015. Industrial Despite modest increases in future resident population, no additional light industrial operations or facilities are anticipated during the next 20 years. The lack of developable land that would be suitable for industrial activities is the primary constraint to future industrial development in this community. Public Facilities Population characteristics for Masefau in 1990 suggest that approximately eight percent of the village population is three and four years of age. Elementary school-aged children (5 and 13 years old) include about 19 percent of the village population; high school students represented about 13 percent of the population. The application of 1990 population characteristics to the anticipated 2015 village population suggest increased student enrollments in future early childhood, elementary education, and high school programs within and outside of Masefau. Anticipated student enrollments from the village population are expected to be as follows in the year 2015:
• early childhood education 53 students • elementary school 25 students • high school 86 students Impact of Future Population Growth Upon Water Consumption and Waste Generation Future population growth and changes in land use in the Masefau watershed will increase the volume of future wastewater and solid wastes that are generated by local residents. Wastewater generation, for example, is expected to rise from about 26,499 gallons per day (gpd) in 1995 to 41,572 gpd in the year 2015 (American Samoa Power Authority, 1996). The consumption of potable water will also increase with a growing population. The American Samoa Power Authority (ASPA) estimates that the average day demand for water in Masefau was about 37,855 gallons in 1995. By the year 2015, ASPA anticipates that the average demand will increase to roughly 59,388 gpd.

Masefau, Page 12-18
Flood Potential A flood insurance study of American Samoa and related flood insurance rate maps were published by the U.S. Federal Emergency Management Agency (FEMA) in 1991. The study evaluated selected geographical locations throughout the Territory. Hydrologic and hydraulic analyses that were presented in the study were made by the U.S. Army Corps of Engineers, Pacific Ocean Division. No detailed study was made of any streams in the Masefau watershed. Inland Flood Potential Inland areas of the Masefau watershed have been designated by the Federal Emergency Management Agency (FEMA) as “zone x.” This designation indicates that the area is outside of the 100-year floodplain. In essence, FEMA is suggesting that the flood hazard potential is limited. Coastal Flood Hazard The flood insurance rate map for the shoreline of the Masefau watershed indicates that there is a coastal flood hazard along the shoreline of the watershed. A potential 100-year flood is anticipated to generate flood levels of approximately three feet above mean sea level (MSL) along all shoreline areas within Masefau Bay, Fagalua Cove, and Nuusetoga Island. Potential 100-year tsunami elevations have also been estimated by the U.S. Army Corps of Engineers for the following shoreline locations:
• Shoreline at Tiapea Point – 2.8 feet above mean sea level (MSL); • Shoreline at Masefau – 2.8 feet above MSL; • Nuusetoga Island – 2.8 feet above MSL; and, • Shoreline at Tapisi Point – 2.8 feet above MSL. The portions of Masefau Village that are less than 3.0 feet above mean sea level are presently protected by shoreline revetment that provide protection from stormwaves and wave runup between 4 and 7 feet above MSL. Consequently, only limited areas of Masefau Village appear to have significant exposure to potential storm waves and tsunami inundation. Stormwater Runoff/Sedimentation and the Relationship to Surface Water Quality Storm runoff from the Talaloa Stream drainage and other streams that discharge into Masefau Bay periodically generate some turbidity within Masefau Bay. Chief Fautanu indicates that these conditions primarily occur after heavier rainfall periods. Historical observations from marine biologists also suggest that runoff from the Talaloa drainage may contribute a significant amount of turbidity of the Bay despite the presence of the Masefau wetland. While available surface water quality data is very limited, it is suspected that surface water quality in the Bay is generally good. The Masefau wetland provides a large area for the deposition of sediments from stormwater runoff and the absorption of nutrients from adjoining piggery operations. The continued function of the Masefau wetland is an essential component of the watershed that needs to maintained and enhanced to ensure desirable surface water quality in the Bay. Sediments transported via the Talaloa Stream drainage will continue to settle out through their detention in the wetland before surfaced runoff is discharged into the nearshore waters. The size of the Masefau wetland is believed to be more than adequate to support added runoff that may be generated from future residential development. However, this capability should be verified through the computer modeling of selected areas that drain into the Masefau wetland.

Masefau, Page 12-19
It is important that leaders of Masefau Village discourage any residential development that encroaches on the margins of the existing wetland, or significantly impairs the water quality of the wetland. An arbitrary limit of the number of piggeries that discharge into the wetland should be considered in close consultation with traditional leaders of the village. The future collection and analysis of water quality samples from within the wetland and the adjoining nearshore waters would also enable ASEPA to monitor the functionality and effectiveness of the Masefau wetland, as well as monitor the impact of surface water discharges upon ASPA’s two groundwater wells. Nearshore Water Quality and the Marine Environment Turbidity and Sedimentation The nearshore waters that adjoin the watershed are likely impacted by natural sedimentation, urban runoff, inadequately treated wastewater from cesspools and septic tanks, a limited discharge of piggery wastes, as well as wave action and nearshore currents in Masefau Bay. It is believed that natural sedimentation, as well as wave action and nearshore currents are presently the primary influences upon nearshore water quality. Coral communities are significantly dependent upon the availability of light and related photosynthesis, and occasional periods of significant turbidity and sedimentation do not promote long-term coral nutrition, growth, reproduction, and depth distribution (Richmond, 1993). When corals fertilize, they are free-swimming. Consequently, they need a good location to settle and make a good attachment. With significant soil deposition, sediments can physically interfere with the recruitment of coral larvae (Richmond, 1993; Dashbach, 1996). Coral communities are an important component of the overall ecology of the nearshore waters that adjoin the Masefau watershed. They provide shelter to fish, invertebrates, and other marine organisms. Some of these resources represent a supplemental food source for residents of Masefau. Nutrient Inputs In the future, a greater impact is expected from increased nutrient inputs. The input of nutrients into the nearshore waters of Masefau Bay will be derived primarily from increased residential development, the use of septic tanks and effluent drainfields, and the general inability of all soils in the watershed to support soil-based wastewater treatment. Consequently, increased nutrient contributions to Masefau Bay should be an important resource management consideration. In this regard, the continued functionality of the Masefau wetland remains as the most practical opportunity for maintaining desirable water quality in the nearshore waters. The long-term input of turbid and nutrient-enriched waters into the nearshore waters represents an important concern. These inputs are potentially detrimental to the quality because they can adversely change the composition of the nearshore marine environment. However, the degree of impact upon water quality is also highly dependent upon currents and water exchange within the nearshore environment. As the population of the watershed grows, nutrient and bacterial inputs will only increase. Aside from these resource management considerations, the future use of the nearshore waters for fishing, swimming and general recreation will eventually represent a more significant public health concern unless practical steps are made to reduce potential nearshore water contamination.

Masefau, Page 12-20
It is recommended that the inhabited village areas in Masefau that are unsuitable for soil-based, wastewater treatment should be more specifically identified. As recommended in the ASPA Utilities Master Plan, this identification process should be based upon a more detailed sanitation survey of more densely inhabited areas such as Masefau. This survey would evaluate existing wastewater treatment practices, soil characteristics, the location and density of land uses, the distance to surface water supplies and the nearshore waters, topography, and other related factors. Using the conclusions and recommendations associated with this evaluation, ASPA and other participating Project Notification and Review System (PNRS) agencies will be better able to:
• require the use of septic tanks and leachfields that provide a sufficient amount of additional soil-based treatment;
• provide greater technical assistance to building permit applicants; and, if necessary, • deny building applications in land areas that are unsuitable for soil-based treatment systems. Long-Term Monitoring The future monitoring of water quality in the nearshore waters of Masefau Bay is necessary for long-term resource management. The nearshore waters should be monitored, at least, in the vicinity of the Masefau wetland discharge, as well as along the east side of the Bay. Turbidity and sedimentation are presently the primary stresses to the coral communities in the nearshore waters in Masefau Bay. However, future levels bacterial contamination and nutrient inputs should also be documented to help ensure future public safety and evaluate potential stresses to the fringing coral reef communities. In addition, the ASG Department of Marine and Wildlife Resources should monitor the coral communities along the reef front of Masefau Bay at least once every three years. Long-term monitoring of this site should also include an evaluation of the impact of turbidity, sedimentation, and nutrients that already influence the nearshore marine environment. GROUNDWATER AND SURFACE WATER SUPPLIES The spring catchment source that is preferred by Masefau residents regularly contains elevated levels of fecal contamination. In addition, this source will likely not provide the volume of surface water that will be needed to support future village demands for drinking water and other potable uses. As stated earlier, the collection of surface water quality studies in the Masefau wetland may provide some insights concerning possible influences upon groundwater quality. It is suspected that the two groundwater wells were situated too close to the margin of the Masefau wetland; organic material from the adjoining wetland is apparently influencing, at least, the taste of groundwater supplies that are produced from the two wells. While these wells are cased, fractured rock in the substrata may enable hydrogen sulfide and/or other undesired chemical compounds into the well. Comparative water quality samplings of the spring catchment and the two groundwater wells should be carried out to better pinpoint the difference in water quality from these sources. Some additional treatment of the groundwater supplies, or the development of wells in a more favorable upland location, should be considered by ASPA to help encourage village use of these supplies. MANAGEMENT NEEDS AND RECOMMENDATIONS The primary focus of future resource management in the Masefau watershed will be to:
• Maintain the functionality of the Masefau wetland to detain future stormwater flows. • Discourage residential development along the north and south margins of the Masefau wetland. • Relocate existing groundwater wells to an upland location, or treat existing sources to improve the
quality of this drinking water source. • Encourage Masefau residents to use groundwater supplies for their source of drinking water.

Masefau, Page 12-21
• Encourage the establishment of an arbitrary limit on the number of piggeries that discharge into the Masefau wetland and local streams.
• Monitor water quality in the Masefau wetland, as well as selected sites in the nearshore waters of Masefau Bay.
• Conserve bird habit on Nuusetoga Islet. • Conserve coral communities. Representatives of participating public agencies should make periodic visits to the watershed to observe, document, and monitor selected resource conditions, determine potential methods of correcting a potential hazard or undesirable conditions, share potential solutions with a designated resident of Masefau, and encourage the participation of traditional village leaders and residents in resource management solutions. The scope of issues that should be addressed by each agency in the field is summarized in Table 12-6. The general focus of recommended technical assistance is also identified. The experience and insights of agency representatives will determine the specific methodology to be used in the field. TABLE 12-6 RECOMMENDED FOCUS OF FUTURE TECHNICAL ASSISTANCE MASEFAU WATERSHED
Participating Public Agency
Resource Management Issues Focus of Technical Assistance
ASEPA Facilitate a coordinated resource management effort within the watershed.
1. Coordinate overall watershed management activities. 2. Hold periodic meetings with participating ASG and federal agencies to discuss, prioritize, and schedule resource management activities. 3. Coordinate program efforts with local traditional leaders and/or designated resident of the watershed. 4. Make annual assessment of resource management program.
ASEPA Monitor and compare the water quality of Talaloa and Tagau Streams, the Masefau wetland, as well as the nearshore waters
Measure changes in and total/fecal bacteria, total suspended solids, nutrients, and selected organic compounds, on a quarterly basis.
ASEPA Reduce nutrient discharges into Masefau wetland and local streams.
1. Encourage traditional village leaders to establish an arbitrary limit on the number of piggeries that discharge into the Masefau wetland or local streams. 2. Encourage the location of future piggeries away from these water bodies. 3. Provide traditional leaders with construction plans for treating effluent from local piggeries.
ASPA Evaluate options to improve the drinking water quality of Masefau’s groundwater supplies.
1. Consider possible treatment options for the two existing groundwater wells on the south side of the Masefau wetland. 2. If treatment is not feasible, evaluate and select a new upland location for two new groundwater wells. 3. If necessary, construct two new groundwater wells.
Continued – next page

Masefau, Page 12-22
TABLE 12-6 (Continued) RECOMMENDED FOCUS OF FUTURE TECHNICAL ASSISTANCE MASEFAU WATERSHED
Participating Public Agency
Resource Management Issues
Focus of Technical Assistance
ASPA/ASEPA Perform a detailed evaluation of community sanitation problems associated with the use of soil-based treatment systems.
1. Survey existing residential and commercial areas of Masefau Village. 2. Evaluate existing treatment practices, soil characteristics, location and density of land uses, the distance to water supplies and nearshore waters, topography, and other factors. 3. Require use of septic tanks and leachfields that provide sufficient amounts of additional soil-based treatment; or, deny building applications in areas unsuitable for soil-based treatment.
ASDOC Monitor changes in population and land use
Annually map type and location of land uses in village and estimate resident population.
ASDOC/ CZMP
Maintain the function of existing wetlands for stormwater detention
Monitor land uses and other potential wetland changes that might impede wetland functions. Coordinate required improvements with ASEPA and traditional Village leaders.
ASCC Land Grant Program
Reduce sedimentation from agricultural activities
1. Determine locations where upslope agricultural activities may be generating some sedimentation. 2. Encourage soil conservation methods with resident growers of subsistence crops.
ASG Dept of Marine and Wild-life Resources
Sustain bird habitat on Nuusetoga Islet.
1. Monitor changes in bird populations and habitat. 2. Encourage the conservation of wildlife resources with traditional leaders of Masefau.
ASG Dept of Marine and Wildlife Resources
Sustain health marine communities in nearshore waters
Monitor changes in coral coverage, fish habitat, diversity and other characteristics (used by Green) in Masefau Bay approximately once every three years.
Source: Pedersen Planning Consultants, 1998
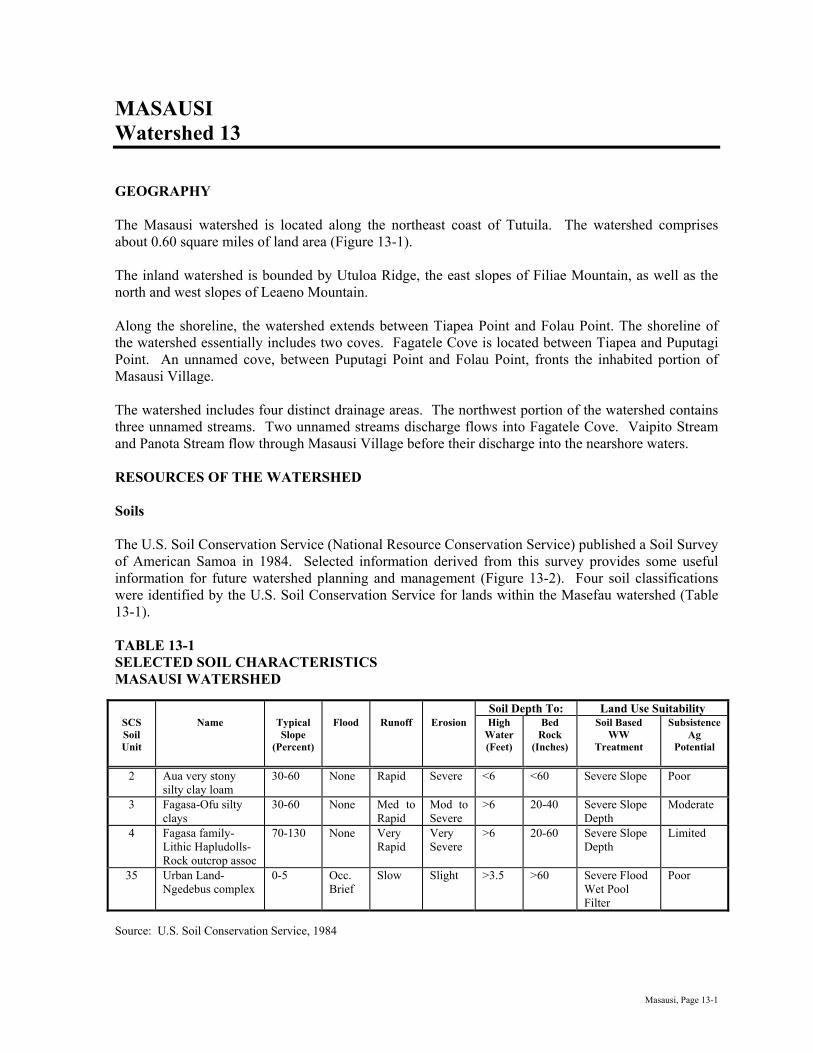
Masausi, Page 13-1
MASAUSI Watershed 13 GEOGRAPHY The Masausi watershed is located along the northeast coast of Tutuila. The watershed comprises about 0.60 square miles of land area (Figure 13-1). The inland watershed is bounded by Utuloa Ridge, the east slopes of Filiae Mountain, as well as the north and west slopes of Leaeno Mountain. Along the shoreline, the watershed extends between Tiapea Point and Folau Point. The shoreline of the watershed essentially includes two coves. Fagatele Cove is located between Tiapea and Puputagi Point. An unnamed cove, between Puputagi Point and Folau Point, fronts the inhabited portion of Masausi Village. The watershed includes four distinct drainage areas. The northwest portion of the watershed contains three unnamed streams. Two unnamed streams discharge flows into Fagatele Cove. Vaipito Stream and Panota Stream flow through Masausi Village before their discharge into the nearshore waters. RESOURCES OF THE WATERSHED Soils The U.S. Soil Conservation Service (National Resource Conservation Service) published a Soil Survey of American Samoa in 1984. Selected information derived from this survey provides some useful information for future watershed planning and management (Figure 13-2). Four soil classifications were identified by the U.S. Soil Conservation Service for lands within the Masefau watershed (Table 13-1). TABLE 13-1 SELECTED SOIL CHARACTERISTICS MASAUSI WATERSHED Soil Depth To: Land Use Suitability
SCS Soil Unit
Name Typical Slope
(Percent)
Flood Runoff Erosion High Water (Feet)
Bed Rock
(Inches)
Soil Based WW
Treatment
Subsistence Ag
Potential
2 Aua very stony silty clay loam
30-60 None Rapid Severe <6 <60 Severe Slope Poor
3 Fagasa-Ofu silty clays
30-60 None Med to Rapid
Mod to Severe
>6 20-40 Severe Slope Depth
Moderate
4 Fagasa family-Lithic Hapludolls-Rock outcrop assoc
70-130 None Very Rapid
Very Severe
>6 20-60 Severe Slope Depth
Limited
35 Urban Land-Ngedebus complex
0-5 Occ. Brief
Slow Slight >3.5 >60 Severe Flood Wet Pool Filter
Poor
Source: U.S. Soil Conservation Service, 1984
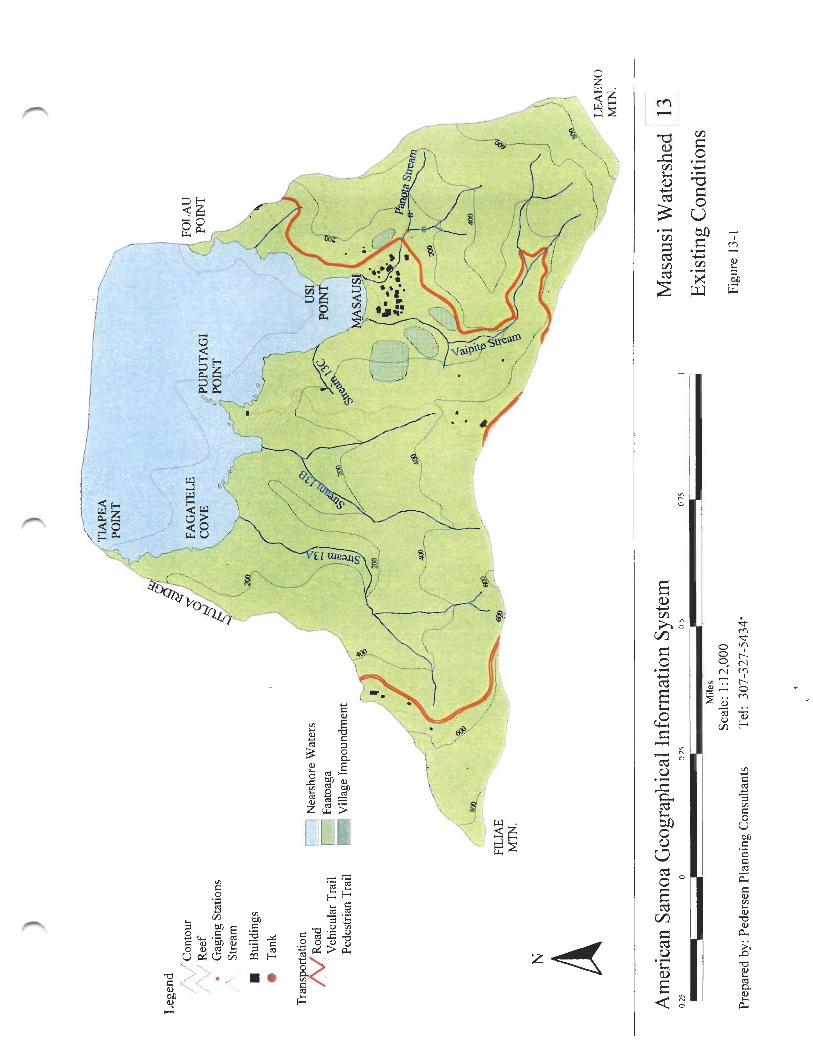


Masausi, Page 13-4
Urban Land-Ngedebus Complex Soils known as Urban land-Ngedebus complex (SCS mapping unit 35) are found in the vicinity of Masausi Village. These soils extend up to 300 to 400 feet inland from the shoreline. The urban land consists of areas that have been developed for homes, commercial buildings, a village church, and other structures. Much of the area has been leveled and filled with coral fragments, sand, cinders and other material. This soil type includes smaller areas of poorly drained soils that are adjacent to Vaipito Stream and Panota Stream. The Ngedebus soil extends to a depth of 60 inches or more. The surface layer, which extends about 4 inches below ground elevation, typically contains light, brownish-gray and brown sand. The underlying material is characterized by pale brown and light yellow, brown sand. The permeability of Ngedebus soil ranges between six and 20 inches per hour. Surface drainage on this soil is generally slow, and the hazard of potential soil erosion is slight. In some places the soil is subject to occasional, brief periods of flooding during prolonged, heavy rainfall or during high tide (U.S. Soil Conservation Service, 1984). These soils are generally suitable to support residential and commercial development in areas that are protected from flooding. However, this soil is poorly suited in unprotected areas. Where moderate to higher housing densities occur, the U. S. Natural Resources Conservation Service recommends the use of community sewage systems prevent the potential contamination of groundwater and surface water supplies. Lower housing densities are present throughout Masausi Village. The greatest concentration of homes is situated immediately inland of the shoreline at about 10 feet above mean sea level. Aua Very Stony Silty Clay Loam (30 to 60 percent slopes) A smaller area within the east part of the Masausi watershed contains Aua very stony silty clay loam (SCS mapping unit 2). The Aua soils range between seven to 60 inches in depth. The permeability of these soils (between 2 and 6 inches per hour) is moderately rapid. For watershed management purposes, it is important to note that these Aua soils have a high potential for runoff and erosion. This Aua soil is not recommended for agricultural production because of the stoniness of the soil, the high erosion potential, and hazards associated with subsistence crop cultivation on steeper slopes. However, when cultivation in these soils is necessary, the use of a mulch or ground cover is recommended to reduce soil erosion in cultivated areas. The U.S. Soil Conservation Service estimates that this soil can annually sustain up to 5 tons per acre of erosion without impacting crop productivity (U.S. Soil Conservation Service, 1984). While the erosive characteristics of this soil generally may not significantly impact subsistence crop productivity, the erosive quality of the soil can be a significant contributor to sedimentation in downslope streams and the nearshore waters. The general characteristics of these Aua soils are also undesirable for individual wastewater disposal systems (U.S. Soil Conservation Service, 1984) The soils contain a significant amount of larger stones that hamper installation and adequate soil treatment. Fagasa-Ofu Silty Clays Much of the upland areas in the Masausi watershed are characterized by Fagasa-Ofu silty clay soils (SCS mapping unit 3).
Masausi, Page 13-5
The soil ranges between 20 to 40 inches in depth. The permeability of this silty clay loam is moderately rapid (2 to 6 inches per hour). The potential for surface runoff from these soils is considered moderate to rapid. However, the potential for erosion is moderate to severe. The U.S. Soil Conservation Service indicates that this soil type is somewhat suitable for the production of subsistence crops. The soil can annually sustain from one to 5 tons per acre of erosion without impacting crop productivity. However, the Soil Conservation Service recommends the use of mulch, crop residues, and cross-slope farming to reduce the potential for soil erosion. Fagasa Family-Lithic Hapludolls-Rock Outcrop Association Between the shoreline and the 400-foot contour, steeper slopes contain soils known as the Fagasa family-Lithic Hapludolls-Rock outcrop association (SCS mapping unit 4). This soil type is also common and characterizes most of the steeper, upland slopes along Tutuila’s north coast. Since this soil type is a combination of two general soil classifications, soil depths can vary between 20 and 60 inches. The soil represents a combination of silty clay and loam. Since the Fagasa Family-Lithic Hapludolls soil typically occurs on very steep slopes, the potential for surface runoff and erosion is high. The cultivation of subsistence crops on these soils is not considered desirable. However, when cultivation in these soils is necessary, care should be exercised to minimize the amount of exposed soil in cultivated areas. When heavier rainfall events occur, significant erosion of these soils can be expected from undeveloped upslope areas of the watershed. Natural surface runoff from steeper slopes in the watershed carries water, sediments, and organic debris to downslope drainage courses and streams. Such erosion can readily influence downstream water quality. Streams Stream Locations Two streams and three related tributaries transport surface flows that ultimately discharge into the nearshore waters of Fagatele Cove between Tiapea Point and Puputagi Point. These streams originate on upland slopes between 440 and 720 feet above mean sea level. Two of the streams, Vaipito and Panota, flow through the village of Masausi and discharge into the nearshore waters. Vaipito Stream and one tributary originate at approximately 500-525 feet above mean sea level. Panota Stream begins at about the 450-foot contour. On the west side of Masausi Village, the stream bed of Vaipito Stream is predominantly characterized by basaltic fragments and consolidated rock near its shoreline discharge. In contrast, the drainage course of Panota Stream within the Village is primarily a grass swale. Field observations made by Pedersen Planning Consultants during a survey of the watershed in May, 1996 indicate that the sandy beach at both stream mouths likely provides some filtering of stream-carried sediments during low and medium flow conditions. Streamflows Within the Watershed During the May, 1996 survey of the watershed, PPC also had an informal discussion with Sam Tuinei, a resident of Masausi for over 25 years. Mr. Tuinei indicates that Vaipito and Panota streams flow throughout the year. Two water flow gages, which historically have been operated on two streams in this watershed, provide some indication of past stream flow in the east part of the Masausi watershed, as well as the
Masausi, Page 13-6
statistical basis for the calculation of median flows. A low-flow partial-record station (No. 16908000) on Vaipito Stream, approximately 0.3 mile upstream from the stream mouth, provided 13 measurements between 1958 and 1975. These measurements enabled the U.S. Geological Survey to estimate a median flow of 0.07 cubic feet per second (cfs) for Vaipito Stream. Twelve measurements were taken from a low-flow, partial-record station (No. 16907000) on Panota Stream, about 0.2 mile upstream from the stream mouth, between 1958 and 1975. These measurements were used by the U.S. Geological Survey which estimated the median stream flow of Panota Stream to be 0.07 cfs (Wong, 1996). Surface Water Quality No surface water quality data is available for any streams in the watershed, as well as the nearshore waters that adjoin the watershed. Wetlands No significant wetlands are located in the Masausi watershed. Marine Resources Coral Communities About 500 feet seaward off of Masausi Village extends a fringing reef. Various private consultants have made various field investigations of the fringing reef in this area since the late 1970’s. In a cumulative sense, available survey information provided suggests that:
• The growth of coral communities was adversely impacted by an outbreak of crown-of-thorns starfish in 1978.
• By 1979, much of the fringing reef’s forereef slope had recovered from the crown-of-thorns starfish outbreak in 1978.
1978-1979
In 1979, a former ASG fisheries biologist of the American Samoa Government, Richard Wass, observed that the abundance of crown-of-thorns starfish on the forereef slopes between Puputagi Point to Motusaga Point (located adjacent to the Sailele watershed) observed in June 1978, had steadily declined to only a few individual species.
In the vicinity of Folau Point, about 20 percent of corals were alive on the upper reef front at depths of 6 to 33 feet (2 to 10 m) were alive in August-September 1979. During this period, ASG marine biologist Richard Wass noted the common presence of the crown-of-thorns starfish in this area. 1992
Field investigations were also made in at Masausi Bay by Maragos, Hunter, and Meier in 1992. Marine ecologists noted a narrow and continuous fringing reef that was adjacent to the shoreline. Larger coral reef mounds were located offshore. 1995
A recent 1996 study of was made various coral reefs throughout the Samoan Archipelago. The study focused primarily upon the quantification of coral communities, the abundance and diversity of reef fish, and selected habitat characteristics. However, this study and related

Masausi, Page 13-7
marine surveys in 1995 did not include any investigations of coral reefs in the nearshore waters that adjoin the Masausi watershed.
Wildlife Resources No significant wildlife habitat is known to be located in this watershed. Shoreline Protection The shoreline that fronts Masausi village contains a stable sandy pocket beach that extends about 500 feet. Pronounced headlands protect the bay from all but direct northerly waves (Sea Engineering, Inc. and Belt Collins Hawaii, 1994). Existing homes in the Village are located, at least, 100 feet behind the shoreline at elevations greater than 10 feet above mean sea level. Consequently, potential storm wave damage to buildings in the Village is generally limited. Alluvial pebble deltas were observed at the Vaipito and Panota Stream mouths in 1993 along with scattered basalt boulders on the reef. These conditions were indicative of severe wave action and some flooding. The shoreline that fronts Masausi Village has historically been influenced by hurricanes, tropical storms, and storm waves. Between 1840 and 1991, ten hurricanes with sustained winds over 75 miles per hour are believed to have occurred in American Samoa. In contrast, some 42 tropical storms, which were characterized by winds between 40 and 75 miles per hour, occurred in the Territory during the same period (Sea Engineering and Belt Collins Hawaii, 1994). Groundwater and Surface Drinking Water Supplies Groundwater Supply and Quality There are no groundwater wells in the Masausi watershed. However, ASPA estimates that the groundwater recharge to the Masausi aquifer is approximately 200,000 gallons per day (ASPA, 1995). Surface Water Supply and Quality Masausi Village obtains its potable water supplies from a village water system. However, residents sometimes haul water from Laulii when lower stream flows are inadequate to meet village needs. Panota Stream and an adjoining, unnamed Stream branch provide a surface water supply to the Village. Each of these surface supplies contains a small, man-made containment; water collected from these impoundments is connected and stored within a 10,000 gallon, concrete storage tank. Available water quality data from FY 1994 through FY 1996 indicates that this surface water source contains significant bacterial contamination. Total coliform levels are typically greater than 80 colonies per 100 ml. About 75 percent of this bacteria regularly represents fecal contamination. Elevated turbidity levels are also evident from this surface water source. In FY 1995 and 1996, turbidity usually ranged between 0.3 and 0.9 NTU. Considerably higher levels were recorded in FY 1994; during that year, turbidity levels ranged between 0.9 and 2.6 NTU. Proposed Water System Improvements The draft ASPA Utility Master Plan proposes to develop two groundwater wells in Masausi that can produce approximately 14 gallons per minute. Disinfection facilities would be provided for each well via the use of a sodium hypochlorate solution (ASPA, 1995). Other proposed system improvements include the construction and installation of the following:

Masausi, Page 13-8
• a 50,000-gallons storage tank, • approximately 300 feet of new water transmission line, • a fire protection/distribution system, • three fire hydrants; and, • service laterals and meters.
USE OF THE WATERSHED Resident Population Between 1980 and 1990, the resident population of Masausi Village increased from 107 to 157 residents. Such growth represented an average annual growth rate of about 4.67 percent. Development activity between 1990 and 1995 increased resident population to about 192 persons. Other available 1990 Census statistics indicate that the increased population is likely due to the increased in-migration of new residents from Hawaii, the continental United States, or Western Samoa. However, a long-time resident of the Village also observed in May, 1996 that a growing number of children now reside in the village (Tuinei, 1996). Land Uses Residential There were 24 homes located in Masausi in 1990. Visual observations of the village by Pedersen Planning Consultants in October, 1994 indicated the addition of five more homes. The expansion of the housing stock was also confirmed by ASG Building Division records. Consequently, the 1995 housing stock in the village in 1995 was 29 residences. Agriculture In May, 1996, there are about five faatoaga that are situated between the 50 and 250-foot contour. These agricultural areas are situated upslope of Masausi Village. Four of these areas are located south or southwest of the Village. The fourth area is located east of Masausi near the north side of Panota Stream. Two or three piggeries were observed within or immediately upslope of Masausi Village in May, 1996. Each piggery contained several pigs (Tuinei, 1996). Commercial One commercial grocery store was located in the village in 1995. However, the limited population of the village is insufficient to support most commercial retail operations. Industrial In 1995, no industrial services were operating in the community. Public Facilities The Elementary Childhood Education program served approximately nine students in 1995. However, there is no public facility supports this program as children are taught in local homes. The future residential population is not expected to warrant the construction of any elementary school facilities. Elementary school students are bussed to Masefau Elementary School. High school students from the village are bussed to Fagaitua High School.

Masausi, Page 13-9
Use of the Nearshore Waters Nearshore Fishing During the May 1996 survey, it was learned that between 2 and 8 persons fish the nearshore waters each day (Tuinei, 1996). An American Samoa Subsistence Fishing Survey was conducted by the University of Hawaii Sea Grant Program in the summer of 1992. This survey involved onsite interviews with shoreline users who were participating in fishing activities on selected days during that period. The results of the survey revealed, in part, that there is some use of the nearshore waters in the reefs off Masausi. About 7-9 persons were documented fishing on the reef. Fishing methods observed included the use of rod-and-reel, throw net, gill net, gleaning, diving, pole, as well as hand-in-line in a paopao (canoe). Swimming and General Water Recreation Some 10 to 20 residents use the nearshore waters each day for swimming and general water recreation (Tuinei, 1996). RESOURCE MANAGEMENT ISSUES Future Land Uses to the Year 2015 Residential Future residential expansion is expected to include two additional dwelling units within the main village and two other homes on steeper slopes during the 1996-2000 period. Between 2001 and 2005, two more single family homes will probably be constructed within the main village. Three additional homes are expected to be built adjacent to the access road from Fagaitua. The lack of commercial services and public facilities will probably not encourage residential growth beyond 2005. The cumulative effect of this prospective residential growth is that the housing stock will increase to roughly 38 housing units in the year 2015. During the same period, it is believed that the average household size will have gradually decreased to approximately 5.66 persons per household In 1995, the 2015 village population will likely include about 215 persons. Commercial During the next 20 years, the limited population of the village will continue to discourage commercial expansion. A new retail store can be expected during the 2001-2005 period. This facility will likely represent the ground floor of a new residential building, or the conversion of an existing house to a two-story building. Other professional services may emerge as home-based businesses. However, such services will be marketable to businesses in other parts of Tutuila. Industrial No industrial facilities are expected to be developed during the 1996-2015 period. Public Facilities Population characteristics for Masausi in 1990 suggest that approximately eight percent of the village population is between three and four years of age; and about 19 percent are of elementary school age (ages 5 through 13). About 13 percent of the resident population are probably high school age (14-18 years old).

Masausi, Page 13-10
Application of these assumptions to anticipated future population suggests that Masausi may have the following estimated student enrollments in the year 2015:
• early childhood education 17 students • elementary school 40 students • high school 29 students Consequently, the anticipated incoming population will likely not generate any significant school enrollment that would prompt the development of a new school in this community. Impact of Future Population Growth Upon Water Consumption and Waste Generation Future population growth and changes in land use in the Masausi watershed will increase the volume of future wastewater and solid wastes that are generated by local residents. Wastewater generation, for example, is expected to rise from about 8,970 gallons per day (gpd) in 1995 to 12,194 gpd in the year 2015 (American Samoa Power Authority, 1996). The consumption of potable water will also increase with a growing population. The American Samoa Power Authority (ASPA) estimates that the average day demand for water in Masausi was about 12,814 gallons in 1995. By the year 2015, ASPA anticipates that the average demand will increase to roughly 17,420 gpd. Flood Potential A flood insurance study of American Samoa and related flood insurance rate maps were published by the U.S. Federal Emergency Management Agency (FEMA) in 1991. The study evaluated selected geographical locations throughout the Territory. Hydrologic and hydraulic analyses that were presented in the study were made by the U.S. Army Corps of Engineers, Pacific Ocean Division. However, no detailed study was made of the streams in the Masausi watershed. Inland Flood Potential All inland of the Masausi watershed have been designated by the Federal Emergency Management Agency (FEMA) as “zone x.” This designation indicates that the area is outside of the 100-year floodplain. In essence, FEMA is suggesting that the flood hazard potential is limited. During the May, 1996 field survey, Pedersen Planning Consultants observed evidence of some flooding along the cinder/coral trail that enters the village from the primarily shoreline roadway. The village has built a small drainage ditch on the east side of the cinder/coral trail to facilitate the drainage of stormwater flows that apparently occur on the trail. Coastal Flood Hazards The flood insurance rate map for the Masausi watershed indicates that there is a coastal flood hazard along the entire shoreline of the watershed. A potential 100-year flood is estimated to generate flood levels of about three feet above mean sea level. A potential 100-year tsunami event is expected to inundate the shoreline near Tiapea Point approximately 2.8 feet above mean sea level (MSL) along (Federal Emergency Management Agency, 1991). Buildings in Masausi Village begin at about 8 to 10 feet above mean sea level. Consequently, existing structures would probably sustain limited or no damage from the inundation associated with a potential, 100-year tsunami.

Masausi, Page 13-11
Stormwater Runoff/Sedimentation and the Relationship to Surface Water Quality Heavier rainfall periods, steeper inland slopes, and more erosive soils in the Masausi watershed regularly contribute to periodic erosion and the related transport of sediments into Vaipito and Panota Streams. Ultimately, this natural erosion process carries a portion of these sediments into the nearshore waters that adjoin the watershed, especially during medium to higher flow stream conditions. Natural erosion from the undeveloped, upslope areas of the watershed is believed to be the primary cause of sedimentation in local streams, as well as downstream sedimentation of the nearshore waters. All drainage areas of the watershed are impacted by natural erosion and downstream sedimentation. Secondarily, the construction of ASG’s primary shoreline roadway between the 300 and 400-foot elevation clearly altered the prior natural slope of the watershed. When saturated, upslope soils above the primary roadway will often subside because natural erosion processes typically transport soil material in a manner that attempts to restore the original topographic slope. As a result, existing roadway cuts, which were required to build the road, generate frequent landslides following heavier rainfall periods. Some limited erosion may also be occurring from some faatoaga areas that are upslope of the inhabited village area. During heavier rainfall periods, some erosion probably occurs and causes some the transport of sediments into Vaipito Stream. However, no significant areas within existing agricultural areas were observed to be barren or exposed during the May, 1996 survey. Consequently, the contribution of sedimentation from faatoaga areas is believed to be limited. Urban runoff also occurs in the Masausi Village area. Impermeable surfaces, e.g., concrete and metal roofs, generate increased surface runoff. However, the impact of this runoff is mitigated considerably by the use of coral rubble and basaltic cinder material around the perimeter of residences, commercial facilities, and the local church. Substantial stormwater flow apparently occurs in the upper parts of Vaipito Stream drainage. A long-time village resident believes that a significant portion of the stormwater flow infiltrates into an area, upland of the village, that contains fractured basaltic rock (Tuinei, 1996). Such infiltration may be providing important protection to the inhabited village area. In essence, the infiltration of upslope stormwater flows may be reducing potential flood damages to the inhabited village area. Since future residential growth is expected to be limited, future watershed management should confirm and locate where stormwater flows presently infiltrate into fractured basaltic rock. Once the location is identified, Masausi Village leaders should be encouraged not to develop this upland area. The importance of this area should be clearly explained and shown to local traditional leaders. A second area where future stormwater flows may be detained is adjacent to the village church on the east side of Vaipito Stream. A small area on the ocean side of the church could eventually be developed to help detain stormwater flow in order that sediments could settle out before their discharge into the nearshore waters. The potential reduction in sediments that is gained from this opportunity may not justify the cost. This can be determined through the monitoring of water quality just upstream of the Vaipito Stream mouth. If there is evidence of regular, significant sedimentation, a conceptual plan and order-of-magnitude cost estimate should be developed to ascertain the feasibility of this potential stormwater detention facility. Nearshore Water Quality and the Marine Environment The nearshore waters that adjoin the watershed are impacted by natural sedimentation, urban runoff, a limited discharge of piggery wastes, as well as wave action and nearshore currents in the unnamed

Masausi, Page 13-12
cove that fronts Masausi Village. Natural sedimentation, as well as wave action and nearshore currents, are probably the primary influences upon nearshore water quality. While limited residential expansion is anticipated, future resource management should continue to monitor the potential impact of sedimentation upon the water quality of the nearshore waters. Coral communities are significantly dependent upon the availability of light and related photosynthesis, and occasional periods of significant turbidity and sedimentation do not promote long-term coral nutrition, growth, reproduction, and depth distribution (Richmond, 1993). When corals fertilize, they are free-swimming. Consequently, they need a good location to settle and make a good attachment. With significant soil deposition, sediments can physically interfere with the recruitment of coral larvae (Richmond, 1993; Dashbach, 1996). Coral communities are an important component of the overall ecology of the nearshore waters that adjoin the Masausi watershed. They provide shelter to fish, invertebrates, and other marine organisms. Some of these resources represent a supplemental food source for residents of Masausi. Groundwater and Surface Water Supplies The proposed development of two new groundwater wells by ASPA is desirable to eliminate long-term exposure to bacterial contamination of the Masausi’s surface water supplies. However, limited funding and development priorities may require these proposals to be long-term improvements. In the absent of these improvements, Masausi Village residents should be encouraged by ASEPA to make an expanded use of individual rainwater catchment systems for each household. Such use will negate the need for hauling water from Laulii. Technical assistance to the village should be made to new residents of the village to promote the use of practical maintenance measures that will enhance potable water quality. MANAGEMENT NEEDS AND RECOMMENDATIONS The primary focus of future resource management in the Masausi watershed will be to:
• Confirm and locate where stormwater flows presently infiltrate into fractured basaltic rock above the village.
• Discourage land use development in the infiltration area above Masausi Village. The importance of this area should be clearly explained and shown to local traditional leaders.
• Monitor the water quality along Vaipito Stream to determine the level of potential sedimentation in the Stream.
• If needed, investigate the feasibility of developing a potential stormwater detention facility on the ocean side of the village church near the mouth of Vaipito Stream
• Encourage the expanded use of rainwater catchment systems until groundwater wells can be developed by ASPA.
Representatives of participating public agencies should make periodic visits to the watershed to 1) observe, document, and monitor selected resource conditions, 2) determine potential methods of correcting a potential hazard or undesirable conditions, 3) share potential solutions with a designated resident of Masausi, and 4) encourage the participation of traditional village leaders and residents in resource management solutions. The scope of issues that should be addressed by each agency in the field is summarized in Table 13-2. The general focus of recommended technical assistance is also identified. The experience and insights of agency representatives will determine the specific methodology to be used in the field.

Masausi, Page 13-13
TABLE 13-2 RECOMMENDED FOCUS OF FUTURE TECHNICAL ASSISTANCE MASAUSI WATERSHED
Participating Public Agency
Resource Management Issue
Focus of Technical Assistance
ASEPA Facilitate a coordinated resource management effort within the watershed.
1. Coordinate overall watershed management activities. 2. Hold periodic meetings with participating ASG and federal agencies to discuss, prioritize, and schedule resource management activities. 3. Coordinate program efforts with local traditional leaders and/or designated resident of the watershed. 4. Make annual assessment of resource management program.
ASEPA Monitor water quality of Vaipito and Panota Streams, as well as the nearshore waters
Measure changes in and total/fecal bacteria, total suspended solids, and nutrients on a quarterly basis
ASPA Develop new satellite water system in Masausi.
1. Meet with traditional village leaders to consider the development of a satellite water system. 2. If desired by village leaders, secure funding for water system design and construction. 3. Design water system improvements. 4. Construct proposed improvements.
ASEPA Reduce potential health risks associated with long-term use of contaminated surface supplies.
In the absence of a new groundwater supply, encourage the expanded use of individual rainwater catchment systems by each household
DPO Monitor changes in population and land use
Annually map type and location of land uses in village and estimate resident population.
ASDPW Reduce potential discharge of silt-laden runoff into unnamed cove that fronts Masausi Village.
1. If warranted, model 2,10,50 and 100 year stormwater flows for Vaipito Stream. 2. Design one small detention pond on the east side of Vaipito Stream on the sami side of the village church. 3. Construct one detention pond between the 5 and 10-foot elevation.
ASCC Land Grant Program
Reduce sedimentation from agricultural activities
1. Determine locations where upslope agricultural activities may be generating some sedimentation. 2. Encourage soil conservation methods with resident growers of subsistence crops.
ASG Dept. of Marine and Wildlife Resources
Sustain health marine communities in nearshore waters
Monitor changes in coral coverage, fish habitat, diversity and other characteristics (used by Green) approximately every three years.
Source: Pedersen Planning Consultants, 1997

Sailele, Page 14-1
SAILELE Watershed 14 GEOGRAPHY The Sailele watershed is located along the northeast coast of Tutuila Island. The watershed comprises about .26 square miles of land area (Figure 14-1). The inland boundaries include the northwest and northeast slopes of Leaeno Mountain, as well as the northeast slopes of Leila Mountain. Lemafa Ridge is prominent in the east part of the watershed as it separates two drainages within the overall watershed. The watershed extends along the shoreline between Folau Point and Motusaga Point. Taligai Cove lies between Leanaopou Point and Malo Point. The inhabited village area extends for about 1,900 feet along the shoreline between Malo and Motusaga Point. Three separate drainages comprise the Sailele watershed. A small drainage on the East Side of the watershed contains one unnamed stream and a related tributary that empty into the nearshore waters at Taligai Cove. Aonoi Stream and an unnamed stream in the central part of the watershed represent the primary drainage area in the watershed. Aonoi Stream flows through the inhabited village area and discharges into the nearshore waters along the shoreline. A third drainage area on the West Side of the watershed is characterized by steeper slopes and one small stream, between Leanamanu Point and Motusaga Point. The unnamed stream is situated between the shoreline and the 125-foot contour, and discharges surface flows to the shoreline. RESOURCES OF THE WATERSHED Soils The U.S. Soil Conservation Service (National Resource Conservation Service) published a Soil Survey of American Samoa in 1984. Selected information derived from this survey provides some useful information for future watershed planning and management (Figure 14-2). Four different soil classifications were identified by the U.S. Soil Conservation Service for lands within the Sailele watershed (Table 14-1). TABLE 14-1 SELECTED SOIL CHARACTERISTICS SAILELE WATERSHED Soil Depth To: Land Use Suitability
SCS Soil Unit
Name Typical Slope
(Percent)
Flood Runoff Erosion High Water (Feet)
Bed Rock
(Inches)
Soil Based WW
Treatment
Subsistence Ag
Potential
2 Aua very stony silty clay loam
30-60 None Rapid Severe <6 <60 Severe Slope Poor
3 Fagasa-Ofu silty clays
30-60 None Med to Rapid
Med to Severe
>6 20-40 Severe Slope Depth
Moderate
4 Fagasa family-Lithic Hapludolls-Rock outcrop assoc
70-130 None Very Rapid
Very Severe
>6 20-60 Severe Slope Depth
Limited
35 Urban land-Ngedebus complex
0-5 Occ. Brief
Slow Slight >3.5 >60 Severe Flood Wet Pool Filter
Poor
Source: U.S. Soil Conservation Service, 1984


Sailele, Page 14-4
Urban Land-Ngedebus Complex Urban land-Ngedebus complex (SCS mapping unit 35) soils are found in the vicinity of Sailele Village. These soils extend 150 to 400 feet inland from the shoreline. The urban land consists of areas that are used for homes, commercial buildings, a village church, and other structures. Much of the area has been leveled and filled with coral fragments, sand, cinders and other material. The Ngedebus soil extends to a depth of 60 inches or more. The surface layer, which extends about 4 inches below ground elevation, typically contains light, brownish-gray and brown sand. The underlying material is characterized by pale brown and light yellow, brown sand. The permeability of Ngedebus soil ranges between six and 20 inches per hour. Surface drainage on this soil is generally slow, and the hazard of potential soil erosion is slight. In some places the soil is subject to occasional, brief periods of flooding during prolonged, heavy rainfall or during high tide (U.S. Soil Conservation Service, 1984). These soils are generally suitable to support residential and commercial development in areas that are protected from flooding. However, this soil is poorly suited in unprotected areas. Where moderate to higher housing densities occur, the U. S. Natural Resources Conservation Service recommends the use of community sewage systems prevent the potential contamination of groundwater and surface water supplies. Lower housing densities are present throughout Sailele Village. The greatest concentration of homes is situated immediately inland of the shoreline between 10 and 25 feet above mean sea level. Aua Very Stony Silty Clay Loam (30 to 60 percent slopes) The Aonio Stream drainage primarily contains Aua very stony silty clay loam (SCS mapping unit 2). These soils extend from about the 25 to 600-foot contour. The Aua soils range between seven to 60 inches in depth. The permeability of these soils (between 2 and 6 inches per hour) is moderately rapid. For watershed management purposes, it is important to note that these Aua soils have a high potential for runoff and erosion. This Aua soil is not recommended for agricultural production because of the stoniness of the soil, the high erosion potential, and hazards associated with subsistence crop cultivation on steeper slopes. However, when cultivation in these soils is necessary, the use of a mulch or ground cover is recommended to reduce soil erosion in cultivated areas. The U.S. Soil Conservation Service estimates that this soil can annually sustain up to 5 tons per acre of erosion without impacting crop productivity (U.S. Soil Conservation Service, 1984). While the erosive characteristics of this soil generally may not significantly impact subsistence crop productivity, the erosive quality of the soil can be a significant contributor to sedimentation in downslope streams and the nearshore waters. The general characteristics of these Aua soils are also undesirable for individual wastewater disposal systems (U.S. Soil Conservation Service, 1984) The soils contain a significant amount of larger stones that hamper installation and adequate soil treatment. Fagasa-Ofu Silty Clays Upland slopes between Folau Point and the West Side of Sailele watershed are characterized, in part, by Fagasa-Ofu silty clay soils (SCS mapping unit 3). These soils lie primarily between the 200 and 400-foot elevation.

Sailele, Page 14-5
The soil ranges between 20 to 40 inches in depth. The permeability of this silty clay loam is moderately rapid (2 to 6 inches per hour). The potential for surface runoff from these soils is considered moderate to rapid. However, the potential for erosion is moderate to severe. The U.S. Soil Conservation Service indicates that this soil type is somewhat suitable for the production of subsistence crops. The soil can annually sustain from one to 5 tons per acre of erosion without impacting crop productivity. However, the Soil Conservation Service recommends the use of mulch, crop residues, and cross-slope farming to reduce the potential for soil erosion. Fagasa Family-Lithic Hapludolls-Rock Outcrop Association The east and west coastline of the watershed, as well as the steeper slopes above the 400-foot contour contain soils known as the Fagasa family-Lithic Hapludolls-Rock outcrop association (SCS mapping unit 4). This soil type is also common and characterizes most of the steeper, upland slopes along Tutuila’s north coast. This soil type is a combination of two general soil classifications; consequently, soil depths can vary between 20 and 60 inches. The soil represents a combination of silty clay and loam. Since the Fagasa Family-Lithic Hapludolls soil typically occurs on very steep slopes, the potential for surface runoff and erosion is high. The cultivation of subsistence crops on these soils is not considered desirable. However, when cultivation in these soils is necessary, care should be exercised to minimize the amount of exposed soil in cultivated areas. When heavier rainfall events occur, significant erosion of these soils can be expected from undeveloped upslope areas of the watershed. Natural surface runoff from steeper slopes in the watershed carries water, sediments, and organic debris to downslope drainage courses and streams. Such erosion can readily influence downstream water quality. Streams Stream Locations An unnamed stream on the East Side of Sailele village, Stream 14A, is located between the shoreline and the 325-foot contour. This stream, which discharges into Taligai Cove, flows throughout the year (Saifoloi, 1996). Aonoi Stream and an unnamed tributary flow through the center of the watershed and discharge into an unnamed cove between Malo and Leanamanu Point. Stream flow along this stream is intermittent and flows only following moderate to heavy rainfall (Saifoloi, 1996). The unnamed stream that is located on the west Side of the watershed (Stream 14B), between Leanamanu Point and Motusaga Point, flows only occasionally. This water body receives upland surface flows from the west Side of Lemafa Ridge. This drainage course, which extends up to the 150-foot elevation, discharges into the nearshore waters that adjoin the watershed. Stream Flows Within the Watershed There is no streamflow data for any streams in the Sailele watershed.

Sailele, Page 14-6
Surface Water Quality No surface water quality data is available for any of the streams in the Sailele watershed, or the nearshore waters that adjoin the watershed. Available satellite photography that was taken by the U.S. National Oceanographic and Atmospheric Administration (NOAA) on June 18, 1994 indicate the presence of limited turbidity in the surface waters between the shoreline and the fringing reef. During the June 12-18, 1994 period, only 23 millimeters of rainfall (approximately 0.9 inch) was recorded at NOAA’s monitoring station at nearby Tula (Mefford, 1998). A correlation of these rainfall records with available satellite photography on June 18, 1994 suggest that lower flow stream conditions in the Sailele watershed probably have little influence upon nearshore water quality. However, significant turbidity and some sedimentation within the nearshore waters may be generated during medium and higher streamflow conditions. Wetlands There are no significant wetlands in the Sailele watershed. Marine Resources Coral Communities Available aerial photography from 1989 suggests that the fringing reef that fronts Sailele Village extends between 400 and 950 feet seaward of the shoreline. The only known documented surveys of coral communities were completed during the 1978-1979 period. No coral surveys of the reef area were made in 1992 or 1995. In a cumulative sense, available survey information provided suggests that:
• The growth of coral communities was adversely impacted by an outbreak of crown-of-thorns starfish in 1978.
• By 1979, much of the fringing reef’s forereef slope had recovered from the crown-of-thorns starfish outbreak in 1978.
1978-1979
The crown-of-thorns starfish on the forereef slopes from Motusaga Point to Puputagi Point (adjoins Masausi watershed) was abundant in June 1978. However, in 1979, a former ASG fisheries biologist of the American Samoa Government, Richard Wass, observed that the starfish had steadily declined to only a few individual species.
Wildlife Resources Historical observations in the late 1970’s suggest that the blue-gray noddy may be an uncommon resident seabird between Malo Point and Folau Point (AECOS and Aquatic Farms, 1979). Shoreline Protection The Sailele shoreline is directly exposed to northern swells and storm waves. Evidence of a more severe wave climate is demonstrated by the limited presence of silt and sand upon the reef flat. The shoreline that fronts Sailele Village has historically been influenced by hurricanes, tropical storms, and storm waves. Between 1840 and 1991, ten hurricanes with sustained winds over 75 miles per hour are believed to have occurred in American Samoa. Some 42 tropical storms, which were

Sailele, Page 14-7
characterized by winds between 40 and 75 miles per hour, occurred in the Territory during the same period (Sea Engineering and Belt Collins Hawaii, 1994). The access road to Sailele was extensively damaged by both Ofa and Val in 1990 and 1991. Several homes in the Village were also severely damaged by Hurricane Ofa in 1990 (Saifoloi, 1996). In May, 1996, Pedersen Planning Consultants observed that buildings within Sailele Village are situated between 10 and 25 feet above mean sea level. Clearly, historical storm damages have encouraged residents to informally establish a desirable set-back from the shoreline. In March, 1994, Sea Engineering, Inc. and Belt Collins Hawaii published a shoreline inventory report that outlined, in part, ongoing shoreline erosion conditions and related shore protection needs for American Samoa. However, Sea Engineering, Inc. and Belt Collins Hawaii did not note any conditions in the Sailele watershed that were determined to be “critical”, or “potentially critical”. Groundwater and Surface Water Drinking Supplies Groundwater Supply and Quality Sailele Village contains one of ASPA’s satellite water systems. Sailele well #130 is situated on the upland side of the inhabited village area. ASPA produces about 9,000 gallons per day from this groundwater supply (ASPA, 1995). In May, 1996, Pedersen Planning Consultants observed small piggeries that were located on the east (20 feet) and west (within 100 feet) sides of the ASPA well. Village residents use the water from this well for toilets, bathing, and laundry purposes (Saifoloi, 1996). Chlorinated ground water samples collected from Sailele well #130 on July 5, 1989 (USGS, 1994; STORET, 1996) revealed no coliform bacteria contamination, but did exceed the USEPA's maximum contaminant level (MCL) for trihalomethanes, dissolved solids and chloride concentrations. The trihalomethane contamination probably resulted from chlorination of the well water; the mixing with seawater likely caused the elevated dissolved solids and chloride levels. No evidence of contamination by metals, pesticides, or volatile organic compounds, other than trihalomethanes, was found. Surface Water Supply and Quality Sailele Village relies upon a stream catchment for their drinking water. The stream catchment is situated just upslope of Taligai Cove at about the 50-foot elevation. The catchment is adjacent to the primary shoreline roadway. Water in the stream is apparently fed by a fresh-water spring. Available water quality data for FY 1994 suggests that there is no bacterial contamination of this surface supply. This was due to the regular application of chlorine to the surface supply. The collection and analysis of water samples from this fresh-water source was apparently discontinued by ASEPA in FY 1995. Proposed Water System Improvements In its draft Utility Master Plan, ASPA proposes the development of a second groundwater well approximately 300 feet upslope of its existing groundwater well. Such a location will keep the groundwater supply from potential bacterial contamination that is presently generated by nearby piggeries. The increased distance from the shoreline should help 1) locate the well in an area where the basal aquifer is thicker; and, 2) reduce undesirable levels of chloride that are produced at the existing groundwater well. Upon completion, this improvement will enable ASPA to encourage Sailele residents to use groundwater for drinking and other potable uses. Other proposed improvements include the construction and installation of:

Sailele, Page 14-8
• a new 50,000 gallon water storage tank; • approximately 600 feet of new transmission main between well 130, the new well, and the new
storage tank; • PVC main for a fire protection system; and, • three fire hydrants. ASPA also proposes to establish 100-foot sanitary control area around each groundwater well in the village. This setback will prohibit public access to reduce any potential well contamination. USE OF THE WATERSHED Resident Population Sailele Village is the primary residential area in the Sailele watershed. Several persons reside in two homes that are located outside of the Village on the west side of the watershed. In 1990, the total resident population in the watershed was 130 persons, an increase of 13 persons from 1980. Such growth represented an average annual growth rate of about 1.11 percent. The population of Sailele increased with the construction of four new houses between 1990 and 1995. Recent population estimates prepared for ASPA’s draft Utility Master Plan indicated that the 1995 resident population was about 156 persons. Population trends reflected in the 1990 Census suggest that some in-migration has occurred in Sailele between 1980 and 1990. The proportion of residents who were born outside of American Samoa during the 1980-1984 period was about 25 percent. Between 1985 and 1990, the proportion increased to 39 percent. In 1990, the proportion increased slightly to 40 percent. These statistics suggest that Sailele has experienced the arrival of two or three families not born in the community and/or the departure of native residents. Land Uses Residential The 1990 U.S. Census documented 17 homes in Sailele Village. All of the homes were owner-occupied; none were rental units. ASG Building Division records indicate that four new residential building permits were issued from 1990 through 1994. Consequently, the 1995 housing stock includes approximately 21 houses. Agriculture During its May, 1996 field survey, Pedersen Planning Consultants learned that there were four piggeries in the village (Saifoloi, 1996). Two of the piggeries were observed on the east and west side of the ASPA groundwater well. Commercial ASG business license records indicate that there were three commercial enterprises in Sailele in 1995. One building permit was issued for one new commercial facility during the 1990-1995 period. Existing commercial enterprises included one transportation company, one general retail store, and one village grocery store. Industrial In 1995, no industrial operations were based in Sailele.

Sailele, Page 14-9
Public Facilities The ASG Department of Education does not offer an early childhood education program in Sailele. Elementary school-aged children attend Masefau Elementary in Masefau. High school students are bussed to Fagaitua High School in Fagaitua. Consequently, there are no public facilities in Sailele. Use of the Nearshore Waters Nearshore Fishing Siasi Saifoloi, a faifeau from one of two churches in Sailele, indicated in May, 1996 that about two to four persons use the nearshore waters each day for fishing. Some fishing is made for octopus. An American Samoa Subsistence Fishing Survey was conducted by the University of Hawaii Sea Grant Program in the summer of 1992. This survey involved onsite interviews with shoreline users who were participating in fishing activities on selected days during that period. The results of the survey revealed, in part, that there is some use of the nearshore waters in the reefs off Sailele. Some 8-20 persons were documented fishing on the reef seaward of Sailele Village. Fishing methods that were observed included the use of rod and reel, throw net, gleaning, diving, pole, as well as the use of hook-and-line from a paopao. Swimming Approximately 20 persons each day use the nearshore waters for a combination of swimming, bathing, and general recreation. RESOURCE MANAGEMENT ISSUES Future Land Uses to the Year 2015 Residential The lack of developable lands will limit future residential expansion in Sailele. However, future growth will continue until the supply of all developable lands in the Village are depleted. Future residential expansion is anticipated in two locations of Sailele Village. It is believed that all developable lands in both of these areas will be developed by the year 2015. Within the existing shoreline village area, it is believed that approximately nine potential housesites are available between the shoreline and the 50-foot elevation. The primary roadway that leads down to the Village from Fagaitua contains two potential housesites between the 100 and 400-foot elevation. Pedersen Planning Consultants believes that these potential development opportunities and constraints will generate the following sequence and volume of residential construction.
1996-2000 Four new single family homes in the main village between the shoreline and the shoreline and the 50-foot elevation.
2001-2005 Two new single family homes along the main access road to Sailele between the 100 and 400-foot elevation.
Two new single family homes in the main village between the shoreline and the shoreline and the 50-foot elevation.
2006-2010 No new residential construction except for home replacements, extensions, and additions.

Sailele, Page 14-10
2011-2015 Three new single family homes in the main village between the shoreline and the shoreline and the 50-foot elevation.
The cumulative effect of this prospective residential growth is that the village housing stock will increase to roughly 32 housing units in the year 2015. During the same period, it is believed that the average household size will have gradually decreased to approximately 6.34 persons per household. It is anticipated that the future village population will include about 203 persons in the year 2015. Commercial Limited commercial facility expansion is anticipated during the next 20 years due to the lack of developable land. However, the establishment of one laundromat is expected during the 1996-2000 period. The start-up of two home-based occupations is anticipated between 2001 and 2005, 1996 and the year 2000. Three additional home-based enterprises are anticipated between 2011 and 2015. Industrial Despite modest increases in future resident population, no additional light industrial operations or facilities are anticipated during the next 20 years. The lack of developable land that would be suitable for industrial activities is the primary constraint to future industrial development in this community. Public Facilities No construction of public facilities is expected through the year 2015. However, limited population growth in Sailele will impact public facilities in other nearby villages. Population characteristics for Sailele in 1990 suggest that approximately five percent of the village population is three and four years of age. Elementary school-aged children (5 and 13 years old) include about 24 percent of the village population; high school students represented about 13 percent of the population. The application of 1990 population characteristics to the anticipated 2015 village population suggest increased student enrollments in future early childhood, elementary education, and high school programs outside of Sailele. Anticipated student enrollments from the village population are expected to be as follows in the year 2015:
• early childhood education 10 students • elementary school 49 students • high school 26 students Impact of Future Population Growth Upon Water Consumption and Waste Generation Future population growth and changes in land use in the Sailele watershed will increase the volume of future wastewater and solid wastes that are generated by local residents. Wastewater generation, for example, is expected to rise from about 4,123 gallons per day (gpd) in 1995 to 12,041 gpd in the year 2015 (American Samoa Power Authority, 1996). The consumption of potable water will also increase with a growing population. The American Samoa Power Authority (ASPA) estimates that the average day demand for water in Sailele was about 5,890 gallons in 1995. By the year 2015, ASPA anticipates that the average demand will increase to roughly 17,201 gpd.

Sailele, Page 14-11
Flood Potential A flood insurance study of American Samoa and related flood insurance rate maps were published by the U.S. Federal Emergency Management Agency (FEMA) in 1991. The study evaluated selected geographical locations throughout the Territory. Hydrologic and hydraulic analyses that were presented in the study were made by the U.S. Army Corps of Engineers, Pacific Ocean Division. However, no detailed study was made of the streams in the Sailele watershed. Inland Flood Potential All inland of the areas of the Sailele watershed have been designated by the Federal Emergency Management Agency as “zone x.” This designation indicates that the areas are outside of the 100-year floodplain (Federal Emergency Management Agency, 1991). In essence, FEMA is suggesting that the flood hazard potential in these areas is limited. Coastal Flood Hazards The flood insurance rate map for the shoreline of the Sailele watershed indicates that there is a coastal flood hazard along the entire shoreline of the watershed. A potential 100-year flood is estimated to generate flood levels in this area of three feet above mean sea level (MSL). A potential 100-year tsunami inundation level has been estimated by the U.S. Army Corps of Engineers for Leanaopou Point. A potential tsunami is estimated to generate a flood elevation of 2.8 feet above mean sea level (MSL) in this area. Buildings in Sailele Village are located between 10 and 25 feet above mean sea level. Consequently, existing structures would probably sustain limited or no damage from a potential 100-year tsunami inundation. Stormwater Runoff/Sedimentation and the Relationship to Surface Water Quality Heavier rainfall periods, steeper inland slopes, and more erosive soils in the Sailele watershed regularly contribute to periodic erosion and the related transport of sediments into Aonoi Stream and other unnamed streams in the watershed. Ultimately, this natural erosion process carries a portion of these sediments into the nearshore waters that adjoin the watershed, especially during medium to higher flow stream conditions.. Natural erosion from the undeveloped, upslope areas of the watershed is believed to be the primary cause of sedimentation in local streams, as well as downstream sedimentation of the nearshore waters. All drainage areas of the watershed are impacted by natural erosion and downstream sedimentation. Urban runoff also occurs in Sailele Village area. Impermeable surfaces, e.g., concrete and metal roofs, generate increased surface runoff. However, the impact of this runoff is mitigated considerably by the use of coral rubble and basaltic cinder material around the perimeter of residences, commercial facilities, and the local church. Nearshore Water Quality and the Marine Environment The nearshore waters that adjoin the Sailele watershed are impacted by natural sedimentation, urban runoff, a limited discharge of piggery wastes, as well as wave action and nearshore currents. Natural sedimentation, as well as wave action and nearshore currents, are probably the primary influences upon nearshore water quality. The direct exposure of the Sailele shoreline to northerly swells and wave action probably help diminish the impact of natural sedimentation and likely maintain desirable surface water quality in the nearshore waters. The periodic sampling and analysis of the nearshore waters by ASEPA would help confirm the preliminary conclusions about nearshore water quality. The quality of the nearshore waters is essential to maintaining a productive marine environment.
Sailele, Page 14-12
Coral communities are significantly dependent upon the availability of light and related photosynthesis, and occasional periods of significant turbidity and sedimentation do not promote long-term coral nutrition, growth, reproduction, and depth distribution (Richmond, 1993). When corals fertilize, they are free-swimming. Consequently, they need a good location to settle and make a good attachment. With significant soil deposition, sediments can physically interfere with the recruitment of coral larvae (Richmond, 1993; Dashbach, 1996). Coral communities are an important component of the overall ecology of the nearshore waters that adjoin the Sailele watershed. They provide shelter to fish, invertebrates, and other marine organisms. Some of these resources represent a supplemental food source for residents of Sailele. Groundwater and Surface Drinking Water Supplies The proposed development of a new groundwater well is important in Sailele Village is important to ensure long-term public health and reduced exposure to bacterial contamination. Future resource management should encourage traditional leaders and residents of Sailele to use groundwater resources once they are improved by ASPA. In the absence of a new groundwater supply, there are two practical options:
• Sailele Village can continue to use its surface supply as long as it is disinfected; or, • Sailele residents can be encouraged to construct and use rain water from individual rainwater
catchment systems. It is recommended that all land uses in the vicinity of existing and future groundwater wells should be setback, at least, 100 feet from the water supplies to ensure that future groundwater wells are not impacted by contaminants from piggeries, localized flooding, or other potential contaminants. The setback should be adopted by the traditional village leaders of Sailele and encouraged by ASG resource managers. In the long-term, the village water system should be maintained for only non-potable water uses, as well as an emergency drinking water supply. MANAGEMENT NEEDS AND RECOMMENDATIONS The primary focus of future resource management in the Sailele watershed will be to:
• Develop a second groundwater well to provide a long-term groundwater supply. • Continue the use of the village water system for drinking water as long as surface supplies are
disinfected, or construct and use individual rainwater catchment systems. • Encourage the establishment of a 100-foot setback from all groundwater and surface water
supplies. • Periodically monitor nearshore water quality to confirm the effectiveness of wave action and
nearshore currents to sustain desirable levels of water quality. Representatives of participating public agencies should make periodic visits to the watershed to 1) observe, document, and monitor selected resource conditions, 2) determine potential methods of correcting a potential hazard or undesirable conditions, 3) share potential solutions with a designated resident of Sailele, and 4) encourage the participation of traditional village leaders and residents in resource management solutions. The scope of issues that should be addressed by each agency in the field is summarized in Table 14-2. The general focus of recommended technical assistance is also identified. The experience and insights of agency representatives will determine the specific methodology to be used in the field.

Sailele, Page 14-13
TABLE 14-2 RECOMMENDED FOCUS OF FUTURE TECHNICAL ASSISTANCE SAILELE WATERSHED
Participating Public Agency
Resource Management Issue
Focus of Technical Assistance
ASEPA Facilitate a coordinated resource management effort within the watershed
1. Coordinate overall watershed management activities. 2. Hold periodic meetings with participating ASG and federal agencies to discuss, prioritize, and schedule resource management activities. 3. Coordinate program efforts with local traditional leaders and/or designated resident of the watershed. 4. Make annual assessment of resource management program.
ASEPA Monitor water quality of nearshore waters
Measure changes in and total/fecal bacteria, total suspended solids, and nutrients on an annual basis.
ASPA Develop new groundwater supply in Sailele
1. Meet with traditional village leaders to consider the development of a new groundwater well. 2. If desired by village leaders, secure funding for water system design and construction. 3. Design water system improvements. 4. Construct proposed improvements.
ASEPA Reduce potential health risks from long-term exposure to bacterial contamination
1. Continue to use village water system for drinking water as long as it is regularly disinfected; or, 2. Construct and use rain water from individual roof catchment systems.
ASEPA Conserve groundwater and surface water supplies
Encourage traditional leaders to establish a 100-foot setback from all groundwater and surface water supplies in the watershed.
ASDOC Monitor changes in population and land use
Annually map type and location of land uses in village and estimate resident population.
Source: Pedersen Planning Consultants, 1997

Aoa, Page 15-1
AOA Watershed 15 GEOGRAPHY The Aoa watershed is located in northeast Tutuila. The watershed comprises about 0.85 square miles of land area (Figure 15-1). The upland watershed is bounded by the steeper slopes of Leaeno Mountain, Leila Mountain, Olomoana Mountain, and Afimuao Ridge. Patupatu Ridge also defines the central portion of the upland watershed. Along the shoreline, the Aoa watershed lies between Motusaga Point and Solo Point. The shoreline and nearshore waters that adjoin the watershed are contained almost entirely within Aoa Bay. Five streams and three tributaries associated with the Vaitolu Stream drainage characterize the Aoa Bay watershed. The west part of the watershed contains Vaitolu Stream, its three tributaries, and one unnamed stream that discharge into the southwest part of Aoa Bay. Lepa Stream, which originates on the southeast side of Patupatu Ridge, becomes Tapua Stream at about the 200-foot contour. Tapua Stream empties into a larger wetland before its discharge into the nearshore waters. Puna Stream and Laoulu Stream are located in the east part of the watershed; only Laoulu Stream discharges into the nearshore waters of Aoa Bay. Aoa Village is located on a narrow coastal plain bounded on three sides by steeper mountain ridges. Two residential areas in the watershed include the main portion of Aoa Village and the Faalefu area. The Faalefu area lies adjacent to the southwest part of Aoa Bay. In a traditional sense, these residential areas actually represent two former traditional villages that historically have combined into one village. RESOURCES OF THE WATERSHED Soils The U.S. Soil Conservation Service (National Resource Conservation Service) published a Soil Survey of American Samoa in 1984. Selected information derived from this survey provides some useful information for future watershed planning and management (Figure 15-2). Six different soil classifications were identified by the U.S. Soil Conservation Service for lands within the Aoa watershed (Table 15-1). Urban Land-Ngedebus Complex Urban land-Ngedebus complex soils (SCS mapping unit 35) characterizes most of Aoa’s inhabited village area. These soils generally comprise coral fragments, sand, cinders and other material that have been graded or filled to support residential, commercial and public facilities in the village area. This soil type extends roughly 100 to 400 feet inland from the shoreline. The Ngedebus soil extends to a depth of 60 inches or more. The surface layer, which extends about 4 inches below ground elevation, typically contains light, brownish-gray and brown sand. The underlying material is characterized by pale brown and light yellow, brown sand. The permeability of Ngedebus soil ranges between six and 20 inches per hour. Surface drainage on this soil is generally slow, and the hazard of potential soil erosion is slight. In some places, the soil is subject to occasional, brief periods of flooding during prolonged, heavy rainfall or during high tide (U.S. Soil Conservation Service, 1984).


Aoa, Page 15-4
TABLE 15-1 SELECTED SOIL CHARACTERISTICS AOA WATERSHED
Soil Depth To: Land Use Suitability SCS Soil Unit
Name Typical Slope
(Percent)
Flood Runoff Erosion High Water (Feet)
Bed Rock
(Inches)
Soil Based WW
Treatment
Subsistence Ag
Potential
1 Aua very stony silty clay loam
15-30 None Med-ium
Mod-erate
>6 <60 Severe Slope Moderate
2 Aua very stony silty clay loam
30-60 None Rapid Severe <6 <60 Severe Slope Poor
3 Fagasa-Ofu silty clays
30-60 None Med to Rapid
Med to Severe
>6 20-40 Severe Slope Depth
Moderate
4 Fagasa family-Lithic Hapludolls-Rock outcrop assoc
70-130 None Very Rapid
Very Severe
>6 20-60 Severe Slope Depth
Limited
9 Leafu stony silty clay
0-3 0cc Slow Slight 3-5 >60 Severe Flood Wet
Moderate
35 Urban land-Ngedebus complex
0-5 Occ. Brief
Slow Slight >3.5 >60 Severe Flood Wet Pool Filter
Poor
Source: U.S. Soil Conservation Service, 1984 Continued from page 15-1: Urban Land-Ngedebus Complex These soils are generally suitable to support residential and commercial development in areas that are protected from flooding. However, this soil is poorly suited in unprotected areas. In recent years, portions of village shoreline have been subjected to flooding that was generated by Hurricane Val in 1991 (U.S. Army Corps of Engineers, 1994). Where moderate to higher housing densities occur, the U. S. Natural Resources Conservation Service recommends the use of community sewage systems prevent the potential contamination of groundwater and surface water supplies. Lower housing densities are present throughout Aoa village; the greatest concentration of homes is found in the main portion of Aoa Village behind the southeast side of Aoa Bay. Leafu Stony Silty Clay (0 to 3 percent slopes) The Aoa wetland area, Faalefu, and portions of the main Aoa village area (the lower Puna Stream drainage) are characterized by Leafu stony silty clay soils (SCS mapping unit 9). This soil is a deep soil that typically extends up to 60 inches in depth. Its permeability ranges between 2 and 6 inches per hour. Runoff from these soils is generally slow and the potential for soil erosion is limited. However, these soils are typically subject to brief periods of flooding after heavier rainfall periods. These soils are somewhat suitable for subsistence agriculture. However, this land use is constrained by occasional periods of flooding and general soil wetness. The U.S. Soil Conservation Service estimates that this soil can annually sustain up to 5 tons per acre of erosion without impacting crop productivity (U.S. Soil Conservation Service, 1984). Consequently, the use of these lands for subsistence agriculture is not likely to generate significant downslope erosion. The use of these Leafu soils for residential land uses is not recommended by the U.S. Soil Conservation Service because of the inherent flood potential associated with this soil. The same characteristics also hamper the use of these soils for septic tank systems and related soil-based treatment.

Aoa, Page 15-5
Aua Very Stony Silty Clay Loam (30 to 60 percent slopes) The upper elevations of the main village area, as well as lands between the 200 and 400-foot elevation, primarily contain Aua very stony silty clay loam soils (SCS mapping unit 2). The Aua soils range between seven to 60 inches in depth. The permeability of these soils (between 2 and 6 inches per hour) is moderately rapid. For watershed management purposes, it is important to note that these Aua soils have a high potential for runoff and erosion. This Aua soil is not recommended for agricultural production because of the stoniness of the soil, the high erosion potential, and hazards associated with subsistence crop cultivation on steeper slopes. However, when cultivation in these soils is necessary, the use of a mulch or ground cover is recommended to reduce soil erosion in cultivated areas. The U.S. Soil Conservation Service estimates that this soil can annually sustain up to 5 tons per acre of erosion without impacting crop productivity (U.S. Soil Conservation Service, 1984). While the erosive characteristics of this soil generally may not significantly impact subsistence crop productivity, the erosive quality of the soil can be a significant contributor to sedimentation in downslope streams and the nearshore waters. However, the Aoa wetland provides a natural filter for turbid surface runoff that is carried by Tapua and Vaitolu Streams. The general characteristics of these Aua soils are also undesirable for individual wastewater disposal systems (U.S. Soil Conservation Service, 1984). The soils contain a significant amount of larger stones that hamper installation and provide inadequate soil treatment. Aua Very Stony Silty Clay Loam (15 to 30 percent slopes) A small area of Aua very stony silty clay loam soils (SCS mapping unit 1) are present along the lower slopes of Patupatu Ridge, as well as along and east of Lepa Stream. These soils typically occur up to about 60 inches in depth. The permeability of these soils ranges between 2 and 6 inches per hour. The potential for runoff or erosion from the Aua soils is believed to be moderate (U.S. Soil Conservation Service, 1984). While moderately suited for agricultural production, the U.S. Soil Conservation Service estimates that this soil can annually sustain up to 5 tons per acre of erosion without impacting crop productivity (U.S. Soil Conservation Service, 1984). However, the U.S. Soil Conservation Service also advises that the stony and erosive characteristics of these soils may limit production. While the erosive characteristics of this soil generally may not significantly impact subsistence crop productivity, the erosive quality of the soil can be a significant contributor to sedimentation in downslope streams and the nearshore waters. However, the Aoa wetland provides a place for the deposition of eroded soil material and the recharge of silt-laden runoff. The general characteristics of these Aua soils are also undesirable for individual wastewater disposal systems (U.S. Soil Conservation Service, 1984). These soils contain a significant amount of larger stones that typically hamper installation and provide inadequate soil treatment. Fagasa Family-Lithic Hapludolls-Rock Outcrop Association Steeper upland land areas throughout most of the remaining watershed contain deep, well-drained soils on steep mountain ridges and slopes. The U.S. Soil Conservation Service identifies these soils as part of the Fagasa family-Lithic Hapludolls-Rock outcrop association (SCS mapping unit 4). This soil type is common and characterizes most of the steep, upland slopes along Tutuila’s north coast.

Aoa, Page 15-6
Since this soil type is a combination of two general soil classifications, soil depths can vary between 20 and 60 inches. The soil represents a combination of silty clay and loam. Since the Fagasa Family-Lithic Hapludolls soil typically occurs on very steep slopes, the potential for surface runoff and erosion are high. The cultivation of subsistence crops on these soils is not considered desirable. However, when cultivation in these soils is necessary, care should be exercised to minimize the amount of exposed soil in cultivated areas. When heavier rainfall events occur, significant erosion of these soils can be expected from undeveloped upslope areas of the watershed. Natural runoff from steeper slopes in the watershed carries water, sediments, and organic debris to downslope drainage courses and streams. Such erosion can readily influence downstream water quality. Fagasa-Ofu Silty Clays A small portion of the upper Vaitolu Stream drainage is characterized by Fagasa-Ofu silty clay soils (SCS mapping unit 3). The soil ranges between 20 to 40-inches in depth. As its name implies, this soil type represents the intermingling of two primary soils: Fagasa silty clay and Ofu silty clay. Higher elevations may also include some smaller areas of Aua very stony, silty, clay loam. The permeability of these soils is moderately rapid (2 to 6 inches per hour). The potential for surface runoff from these soils is considered moderate to rapid. However, the potential for erosion is moderate to severe (U.S. Soil Conservation Service, 1984). The U.S. Soil Conservation Service indicates that these soils are somewhat suitable for the production of subsistence crops. These soils can annually sustain from one to 5 tons per acre of erosion without impacting crop productivity. However, the Soil Conservation Service recommends the use of mulch, crop residues, and cross-slope farming to reduce the potential for soil erosion. Streams Stream Locations As stated earlier, the Aoa watershed contains five streams and three tributaries. A short, steep unnamed stream along the northeast slopes of Leila Mountain (Stream 15A) originates at about 200 feet above mean sea level. This drainage extends about 700 feet before its discharge in the nearshore waters that adjoin the Faalefu area. Vaitolu Stream begins at about the 675-foot elevation, continues downstream along the west side of the Aoa wetland, and ultimately discharges into the nearshore waters that are east of the Faalefu area. Lepa Stream, which begins at about 580-feet above mean sea level, is a tributary to Tapua Stream. Tapua Stream carries stream flows through the Aoa wetland along the east side of the fresh-water marsh. Puna Stream and an unnamed tributary begin are located on the east side of the watershed and situated upslope of the main village. Puna Stream begins at about the 400-foot contour. Surface flows are carried downstream to the Aoa wetland. A second stream course on the east side of the watershed is Laoulu Stream. This stream, which originates at about 225 feet above mean sea level, discharges into the nearshore waters on the east side of Aoa Bay

Aoa, Page 15-7
Streamflows Within the Watershed A continuous-record gage (No. 16906000) was located on Vaitolu Stream, about 0.5 mile upstream from the stream mouth, between 1965 and 1971. Recorded measurements enabled the U.S. Geological Survey to calculate a median flow of approximately 0.08 cubic feet per second (cfs). Extremes for the period of record were a maximum discharge of 804 cfs on December 19, 1962 and a minimum of “no flow” at various times between 1964 and 1966. Stream flow along a right bank tributary to Vaitolu Stream was measured four times in 1968 and 1969. The estimated median flow from this stream was 0.20 cfs. Stream flow at a second location, which was located about 250 feet above stream gage no. 16906000, was recorded on nine occasions in 1968 and 1969. Recorded measurements led U.S. Geological Survey to estimate a median flow of 0.17 cfs (Wong, 1996). A low-flow, partial-record station (No. 16905000) was located along Lepa Stream, approximately 0.5 mile upstream from the Tapua Stream mouth between 1958 and 1975. Twenty-two measurements were used by the U.S. Geological Survey to estimate a median flow of 0.11 cfs (Wong, 1996). Taua Taua, puleaoga of Aoa Elementary School, reported that Puna Stream does not flow all of the time (Taua, 1996). A low-flow, partial-record station (No. 16904000) on Laoulu Stream, approximately 0.2 mile upstream from the mouth, provided 11 measurements between 1958 and 1968. The U.S. Geological Survey estimated a median flow of 0.03 cfs on the basis of these measurements (Wong, 1996). Laoulu Stream flows part of the year, particularly during the December-February period when rainfall is greater (Taua, 1996). Aquatic Fishes and Invertebrates Field surveys of fishes and invertebrates were made by the U.S. Fish and Wildlife Service, Division of Ecological Services, in March-April, 1978 and the U.S. Army Corps of Engineers in August, 1980. Laoulu Stream and Lepa Stream were two of 37 streams in American Samoa that were inventoried by representatives of these federal agencies. Results from both field surveys were summarized in an American Samoa Stream Inventory that was published by the U.S. Army Corps of Engineers, Honolulu District, in July, 1981. Laoulu Stream was surveyed in a shallow riffle at the stream mouth (station 9a). Lepa Stream, a tributary to Tapua Stream, included a mangrove swamp on the southeast side of Olomoana Elementary School (station 10a) and at an upstream location (below a primary road culvert) about the 230-foot above mean sea level (station 10b). At Laoulu Stream, one species of gobie fish and one species of mountain bass were observed at station 9a. No eels were documented near the stream mouth. No eels were noted. Five shrimp species were also present; one of these species was abundant. Along the lower reach of Lepa Stream (station 10a), one specie of gobie fish was recorded. However, no mountain bass was documented. One abundant species of eel was identified. No shrimp or mollusks were also observed. The upstream location (station 10b) contained no gobie fish or mountain bass. An occasional abundance of eels was documented. One common specie of shrimp was recorded, but no mollusks were identified. It was also noted that the benthic habitat at station 10b had been significantly modified by the installation of drainage culverts underneath the primary roadway to Aoa Village.

Aoa, Page 15-8
Surface Water Quality There is no historical surface water quality data that is available for the streams and wetland in the Aoa watershed, or the nearshore waters that adjoin the watershed. Wetlands The Aoa wetland comprises approximately 23.5 acres that includes mangrove swamp, fresh-water marsh, and disturbed fresh-water wetland. The wetland is fed by fresh-water flows from Puna Stream and Tapua Stream, as well as tidal flows that enter from the Tapua Stream mouth. The freshwater marsh contains a deep pond that is covered by dense vegetation” (Biosystems Analysis, Inc., 1992). During a May, 1996 field survey of the watershed, Pedersen Planning Consultants observed ponded surface water in the disturbed wetland along the upper reaches of Tapua Stream, as well as the growing residential area between the primary road and the east side of Tapua Stream. “Three fingers of tidal mangrove swamp extend inland from the mouth of Tapua Stream. The center finger follows the main channel of the stream approximately 300 feet inland and the western finger follows a tributary inland to the west, tapering off approximately 1,100 feet inland. At this point, the tributary merges with a lush, flooded freshwater marsh situated at the base of Patupatu Ridge. The third finger of mangrove extends a short distance inland along a tributary to the east of Tapua Stream. This tributary receives freshwater flow from Puna Stream, which drains from the hills further to the east, and flows under the main village road. The remaining portion of the wetland, the area inland from the mangrove and east of the freshwater marsh, is a freshwater wetland area that has been disturbed by land clearing and village development “(Biosystems Analysis, Inc., 1992). From a historical perspective, Whistler observed a mangrove forest inland of the elementary school in Aoa in 1976. Whistler estimated that the mangrove area contained about four acres (Whistler, 1976). In terms of vegetation, the mangrove swamp at Aoa primarily contains oriental mangrove, red mangrove, and beach hibiscus. The outer margin of the mangrove is bordered by hibiscus with banana trees. Vegetation within the freshwater marsh is primarily characterized by paragrass, Fimbrisylis autumnalis, and Ludwigia octovalis. The disturbed freshwater wetland area includes scattered patches of beach hibiscus with an herbaceous layer of grasses (Biosystems Analysis, Inc., 1992). In terms of future management, the traditional leaders of Aoa need to be advised of the potential consequences of continued residential development in the disturbed fresh-water wetland area. Higher stormwater flows could generate potential flood damage to homes and structures within this area. Future development should be encouraged on other developable lands within Aoa Village to ensure the long-term functionality of the Aoa wetland. Future development in the Aoa wetland is not recommended. Marine Resources Coral Communities Available aerial photography and related mapping from 1989 indicate that a fringing reef extends between 300 to 1,200 feet from the Aoa Bay shoreline. The inner bay contains extensive sand flats. Various private consultants have made field investigations of the fringing reef in this area since the late 1970’s. In a cumulative sense, available survey information suggests that:
• A significant infestation by the crown-of-thorns starfish was evident on the fringing reef of Aoa Bay in 1978.
• In 1992, coral coverage along the reef front ranged from less than 1 percent at a depth of 6 meters to 25 percent coverage at a depth of 18 meters.

Aoa, Page 15-9
• In 1995, coral coverage along the reef front was reported to be less than 20 percent.
1978-1979 In May, 1978, the largest aggregation of the crown-of-thorns starfish on the coral reefs of Tutuila was observed in Aoa Bay and nearby Onenoa Bay. Over 25 percent of the starfish that were removed and buried during a territorial-wide bounty program were obtained from the fringing reef in Aoa Bay (Aecos and Aquatic Farms, 1980).
During this period, coral was absent from the reef flat within 330 feet of the shoreline. Elsewhere on the flat, coral coverage was about 15 percent. Coral-covered boulders covered up to half of the bottom. A sparse algal cover on dead coral heads was present (Aecos and Aquatic Farms, 1980).
Coral coverage was low from 655 to 900 feet offshore. Very little coral was observed between 655 and 740 feet offshore. However, coral coverage increased to 20 percent where depth increased. Along the upper reef front, only about 15 percent of the coral remained alive in June, 1978 (Aecos and Aquatic Farms, 1980). 1982, 1985, and 1988
During the month of April in 1982, 1985, and 1988, Birkeland and Randall investigated the coral communities in Aoa Bay. Survey transects were made at a depths of 6-10 feet, as well as 20 feet.
Field survey data revealed a general increase in coral coverage at 6-10 feet between 1982 and Coral coverage was documented to be three percent in 1982 and increased to almost 19 percent in 1985 and about 12 percent in 1988. Continued signs of coral recovery were also evident at 20 feet where coral coverage was one percent in 1982, increased to almost four percent in 1985, and rose to nine percent in 1988 (Birkeland, Randall, and Amesbury, 1990).
1992
Field investigations were also made in at Masefau Bay by Maragos, Hunter, and Meier in 1992. Live stony coral cover in Aoa Bay was reported to be less than one percent at a depth of 6 meters, and approximately 25 percent coverage at a depth of 18 meters.
A large coral reef mound was situated offshore, and may have represented the younger stage of a growing reef (Maragos, Hunter, and Meier, 1994). 1995
A 1995 survey of various coral reefs throughout the Samoan Archipelago included the performance of five transects on the reef front along the east side of Aoa Bay. The study focused primarily upon the quantification of coral communities, the abundance and diversity of reef fish, and selected habitat characteristics.
Field observations indicated that coral coverage at Aoa was less than 20 percent. Fish species richness ranged between 100 and 149 species. Fish density included between 5,000 and 9,999 individuals. Fish biomass was less than 500 kilograms per ha (Green, 1996).
Wildlife Resources Native forest birds and bat populations are surveyed and recorded by the ASG Department of Marine and Wildlife Resources at 35 stations on the Island of Tutuila (Solek, 1996). Two of the survey areas are located in the Aoa watershed. One area is situated on the northeast slopes of Leila Mountain between the shoreline and the 400-foot elevation. The second survey area lies on the east side of Aoa Bay between the shoreline and Afimuao Ridge.

Aoa, Page 15-10
The northwest face of Motusaga Point represents a habitat area for a colony of blue-grey terns. In addition, Aoa is particularly an important habitat for bats (Solek, 1996). Bat roosts are located in the vicinity of Olomoana Mountain. The ASG Department of Marine and Wildlife Resources estimated a minimum population of 293 fruit bats in this area in FY 1997. These estimates were based upon exit counts made by ASG wildlife biologists. Shoreline Protection Aoa Bay has direct exposure to northerly waves. However, the fringing reef helps reduce the amount of wave energy that approaches the shoreline of the watershed. Despite the presence of a significant fringing reef, the shoreline of Aoa Bay has historically been influenced by hurricanes, tropical storms, and stormwaves. Between 1840 and 1991, ten hurricanes with sustained winds over 75 miles per hour are believed to have occurred in American Samoa. In contrast, some 42 tropical storms, which were characterized by winds between 40 and 75 miles per hour, occurred in the Territory during the same period (Sea Engineering and Belt Collins Hawaii, 1994). The most recent event that influenced the shoreline was Hurricane Val, which occurred on December 8, 1991. Olomoana Elementary School in Aoa was damaged by both wind and waves that were associated with this storm (Taua, 1996). On the west side of Aoa Bay, loose basalt rock walls provide some protection to the existing coral trail and homes in the Faalefu area. The coral trail is located only two feet above the high tide line in some places. A few residential and commercial buildings are situated between the five and 10-foot contour. Shoreline protection from storm waves is provided along the central portion of the Bay by shoreline revetment that was designed by the U.S. Army Corps of Engineers. The shoreline area that fronts Olomoana Elementary School is protected by a double layer of heavier armor stone that ranges between 700 and 1,200 pounds. The crest elevation of this revetment is about 10 feet above mean sea level. The road and school, which are behind the revetment, are approximately five feet below the crest elevation. In 1993, Sea Engineering, Inc. observed coconut tree roots in the foreshore seaward of the high tide line along the southeast side of Aoa Bay. Similar conditions were again documented by Pedersen Planning Consultants in May, 1996. This condition is an indication of shoreline erosion. Such erosion may eventually impact existing guest fales that are situated along this portion of the shoreline. Groundwater and Surface Drinking Water Supplies Groundwater Supply and Quality
Aoa is one of ASPA’s eleven satellite water systems. This system includes two groundwater wells (ASPA wells 151 and 152) that were drilled to a depth of 34 feet. These wells are situated along the east margin of the disturbed fresh-water marsh and the west side of the primary roadway to the village. During construction of these wells, substrata conditions prevented ASPA from establishing a positive well seal with its drilling equipment (ASPA, 1995).
ASPA believes that surface water from the adjoining Aoa wetland is entering these wells. Such infiltration is subjecting the groundwater supply to increased turbidity and undesirable odors during or following heavier rainfall periods (ASPA, 1995). Surface Water Supply and Quality
A stream catchment is located along an unnamed branch of Vaitolu Stream at about the 275-foot contour. Some villagers use this surface water as a source for drinking water. One local resident indicates that the unnamed stream sometimes carries no flow. In addition, there is no faatoaga above the stream catchment that might otherwise generate some suspended solids into this water supply.

Aoa, Page 15-11
A second stream catchment is located along the upper reach of Lepa Stream near the 400-foot contour. This catchment, which was observed by Pedersen Planning Consultants in November, 1999, is likely the primary surface water source for Aoa Village. A 1.5-inch transmission line carries surface water from this source to all or portion of Aoa Village. Historical water quality measurements from FY 1994 indicate that one of these surface water sources was disinfected by Aoa village. No bacterial contamination was found in monthly water quality samples in FY 1994. Chlorine concentrations ranged between 0.0 and 0.4 mg/l (ASEPA, 1995). It is unknown whether or not this supply continues to be disinfected. Proposed Water System Improvements In its draft Utilities Master Plan, ASPA proposes to construct two new groundwater wells along Vaitolu Stream at about 50 feet above mean sea level (Figure 15-3). Other proposed improvements include:
• The renovation of wells 151 and 152; • Installation of chlorination equipment at well 152; • Construction of a new 55,000 gallon water storage tank; • Maintenance and continued use of the existing 65,000 gallon water storage tank; • Installation of pump control telemetry system; • Installation of approximately 600 feet of 4-inch PVC transmission main between the new wells
and the new storage tank; • Installation of approximately 2,200 feet of 6-inch PVC main between the new storage tank and
shoreline that fronts the Faalefu area; and, • The construction of a fire protection system near the Aoa Bay shoreline. USE OF THE WATERSHED Resident Population Between 1980 and 1990, the resident population of Aoa Village increased from 304 to 491 residents. Such growth represented an average annual growth rate of about 6.15 percent. Development activity between 1990 and 1995 increased resident population to about 660 persons. Population trends reflected in 1990 Census statistics suggest that considerable in-migration has occurred in this community between 1980 and 1990. The proportion of residents who were born outside of American Samoa during the 1980-1984 period was about 20 percent. Between 1985 and 1990, the proportion rose to 50 percent. In 1990, the proportion declined to 41 percent. These statistics suggest that Aoa has been influenced by a significant amount of in-migration by persons who were born outside of American Samoa and/or the out-migration of native residents. The potential for these migration patterns is not surprising because almost half the village housing stock is rental housing. It is believed that persons and families who are living in rental housing units in American Samoa are more mobile than longer term residents who were born in the community. Land Uses Residential The 1990 U.S. Census documented 65 homes in Aoa Village. Fifty-one percent of the homes were owner-occupied; 49 percent were rental units. ASG Building Division records indicate that 25 new residential building permits were issued from 1990 through 1994. Consequently, the 1995 housing stock included approximately 90 houses.
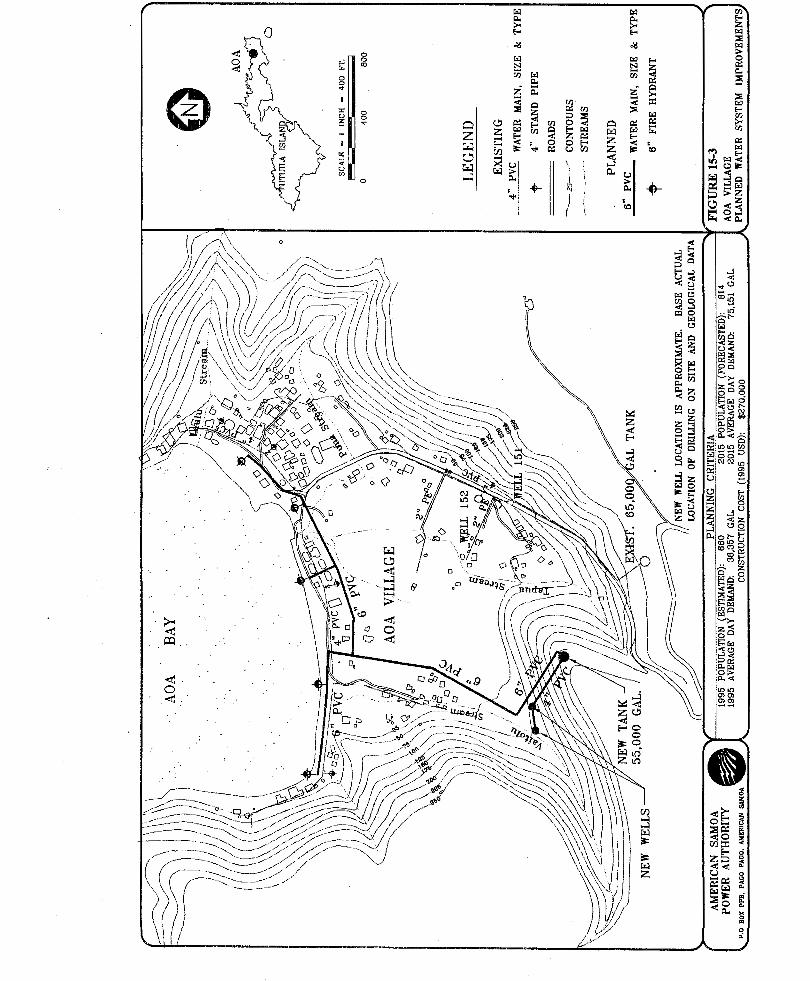

Aoa, Page 15-13
Agriculture During a May 1996, Pedersen Planning Consultants observed six primary faatoaga, or agricultural areas, where most agricultural production was taking place.
• Three areas upslope of the Faalefu area between about the 25 and 250-foot contour; • Two faatoaga south and southeast of Aoa Village; and, • One faatoaga on the north side of Laoulu Stream between the 50 and 150-foot elevation. Commercial
In 1995, ASG business license records indicate that there were seven commercial enterprises based in Aoa. No building permits were issued for any new commercial facilities during the 1990-1995 period. Commercial enterprises included three bus companies, one grocery store, one general retail store, one toy vending machine distributor, and one food catering business. Industrial
No industrial operations were based in Aoa in 1995. Despite modest increases in future resident population, no additional light industrial operations or facilities are anticipated during the next 20 years. The lack of developable land that would be suitable for industrial activities is the primary constraint to future industrial development in this community. Public Facilities
The ASG Department of Education offers an early childhood education program in Aoa. Twenty-eight young students were enrolled in this program in September 1994. Elementary school-aged children attend Olomoana Elementary School in Aoa. In September 1994, 119 students attended this facility. High school students are bussed to Fagaitua High School in Fagaitua. Use of the Nearshore Waters Nearshore Fishing
Informal discussions with a local resident suggest that up to 20 persons per day use the nearshore waters in Aoa Bay for fishing purposes (Mika, 1996).
An American Samoa Subsistence Fishing Survey was conducted by the University of Hawaii Sea Grant Program in the summer of 1992. This survey involved onsite interviews with shoreline users who were participating in fishing activities on selected days during that period. The results of the survey revealed, in part, that there is some use of the nearshore waters in the reefs off Aoa. Some 13-20 persons were documented fishing on the reef seaward of Aoa Village. Fishing methods that were observed included the use of rod-and-reel, throw net, gill net, diving, pole, as well as hand-in-line from a paopao. Swimming and General Recreation
One local resident indicates that some 40 to 50 residents use the nearshore waters of Aoa Bay for swimming and general recreation (Mika, 1996). RESOURCE MANAGEMENT ISSUES
Future Land Uses to the Year 2015
Residential
During the next 20 years, it is anticipated that future residential growth will average of about two percent per year. Such growth will be significantly less than the average annual residential growth that occurred between 1980 and 1990 (about six percent), and considerably less than the seven percent annual growth from 1990 through 1994.

Aoa, Page 15-14
Future residential expansion is constrained primarily by the presence of saturated clay soils and wetland that are situated between Vaitolu Stream and the main access road to the Village (U.S. Department of Agriculture, Soil Conservation Service, 1982). This area contains a significant amount of vacant land that otherwise is very developable for residential purposes. Consequently, future residential expansion will primary include the infilling of existing residential areas. Future residential expansion is anticipated in four locations within Aoa village. It is believed that all developable lands within these areas will be developed during the next 20 years. ASPA also suspects that some lands that are unsuitable for residential development will also be used unless such development is curtailed by traditional village leaders. Between Vaitolu Stream and the main access road to the Village, it is believed that 10 additional homes will be constructed in this area despite the presence of saturated Leafu silty clay soils that are subjected to occasional flooding. Onsite observations of the Village by Pedersen Planning Consultants in November, 1994 and May, 1996 indicate that most recent residential construction has occurred in the disturbed fresh-water marsh that is on the west side of the main vehicular access to Aoa. In Faalefu, there are six marginal housesites along the east and west sides of Vaitolu Stream that likely will be developed. Recent construction activity suggests that further residential expansion is already occurring in this area. The central shoreline area between Faalefu and the main Aoa Village contains four developable housesites that are generally suitable for development. However, saturated soils are found west and south of this area. The main village of Aoa includes 14 potential housesites between the shoreline and the 50-foot elevation. The development potential in this area are vacant lands within the existing residential area. During the next 20 years, ASPA believes that these potential development opportunities and constraints will generate the following sequence and volume of residential construction. 1996-2000 Four new single family homes in the fresh-water marsh area west of the main access
road.
Six new single family homes in the main village of Aoa.
2001-2005 Three new single family homes in Faalefu along the shoreline.
Two new single family homes in the central shoreline area between Faalefu and the main village of Aoa.
Four new single family homes in the fresh-water marsh area west of the main access road.
One new single family home in the main village of Aoa.
2006-2010 Two new single family homes in the central shoreline area between Faalefu and the main village of Aoa.
Two new single family homes in the fresh-water marsh area west of the main access road.
Three new single family homes in the main village of Aoa.
2011-2015 Six new homes on the east and West Side of Vaitolu Stream in Faalefu.
Four new single family homes in the main village of Aoa. The cumulative effect of this prospective residential growth is that the village housing stock will increase to roughly 127 housing units in the year 2015. During the same period, it is believed that the average household size will have gradually decreased to approximately 6.26 persons per household. Consequently, the future village population is expected to include about 795 persons in the year 2015.

Aoa, Page 15-15
Commercial Limited commercial facility expansion is anticipated during the next 20 years due to the lack of developable land. However, the start-up of one laundromat is expected during the 1996-2000 period. Two additional retail stores are expected to be established between 2001 and 2005. The establishment of three home-based occupations is expected between 2001 and 2005. Industrial Despite modest increases in future resident population, no additional light industrial operations or facilities are anticipated during the next 20 years. The lack of developable land that would be suitable for industrial activities is the primary constraint to future industrial development in this community. Public Facilities Population characteristics for Aoa in 1990 suggest that approximately six percent of the village population is three and four years of age. Elementary school-aged children (5 and 13 years old) include about 23 percent of the village population; high school students represented about eight percent of the population. The application of 1990 population characteristics to the anticipated 2015 village population suggest increased student enrollments in future early childhood, elementary education, and high school programs within and outside of Aoa. Anticipated student enrollments from the village population are expected to be as follows in the year 2015:
• early childhood education 48 students • elementary school 183 students • high school 64 students Impact of Future Population Growth Upon Water Consumption and Waste Generation The significance of increased residential and population growth in the watershed will be an increase in Aoa’s total volume of wastewater and solid waste generation. Future wastewater generation is forecasted to rise from 25,450 gallons per day in 1995 to 52,606 gallons per day in the year 2015 (American Samoa Power Authority, 1996).
A greater resident population will also consume more potable water. The average day demand for water consumption in the year 2015 is anticipated to be 75,151 gallons per day (gpd). Such demand is more than double the total estimated consumption in 1995 (36,357 gpd). Flood Potential A flood insurance study of American Samoa and related flood insurance rate maps were published by the U.S. Federal Emergency Management Agency (FEMA) in 1991. The study evaluated selected geographical locations throughout the Territory. Hydrologic and hydraulic analyses that were presented in the study were made by the U.S. Army Corps of Engineers, Pacific Ocean Division. However, no detailed study was made of the streams in the Aoa watershed. Inland Flood Potential All inland areas south of the shoreline of the Aoa watershed have been designated by the Federal Emergency Management Agency (FEMA) as “zone x.” This designation indicates that the area is outside of the 100-year floodplain. In essence, FEMA is suggesting that the flood hazard potential is limited.

Aoa, Page 15-16
Coastal Flood Hazards The flood insurance rate map for Aoa Bay indicates that there is a coastal flood hazard through much of the nearshore waters and adjoining shoreline. A potential 100-year flood is estimated to generate flood levels in these areas of three feet above mean sea level. Potential 100-year tsunami inundation elevations have also been estimated by the U.S. Army Corps of Engineers for two shoreline locations in the Aoa watershed. A potential tsunami is estimated to generate a flood elevation of 2.8 feet above mean sea level (MSL) at both Solo Point and the Aoa Bay shoreline. Most buildings at Aoa Village and Faalefu area are located above the 5-foot elevation. Consequently, the inhabited village area would probably sustain limited damage from a potential 100-year tsunami inundation. Stormwater Runoff/Sedimentation and the Relationship to Surface Water Quality Storm runoff from the Vaitolu Stream and Laoulu Stream drainages likely generate increased turbidity and sedimentation within Masefau Bay. These conditions primarily occur during or following after heavier rainfall periods. It is believed that natural sedimentation is the primary source of downstream sedimentation. The American Samoa Community College (ASCC) Land Grant Program monitored and documented the volume of sedimentation that was being derived from faatoaga areas within the Puna Stream drainage. This monitoring occurred on selected days between August and November, 1995, as well as January through March, 1996 (Palesoo, 1996). Field and laboratory results indicated that limited sedimentation is being generated from upslope agricultural areas in this drainage. Consequently, agricultural activities on upland slopes probably generates limited sedimentation into Aoa Bay. Surface runoff from the Lepa-Tapua Stream drainage is discharged into the Aoa wetland. The wetland affords the deposition of sediments that are carried downstream with turbid stormwater flows. The continued function of the Aoa wetland is an essential component of the watershed that needs to maintained and enhanced to ensure desirable surface water quality in Aoa Bay. Sediments transported via the Lepa-Tapua Stream drainage will continue to settle out through their detention in the wetland before surfaced runoff is discharged into the nearshore waters. However, further development is the disturbed fresh-water marsh area on the west side of the main road to Aoa Village will only reduce the size and effectiveness of the Aoa wetland. The size of the Aoa wetland is probably more than adequate to support added runoff that may be generated from future residential development. However, this capability should be verified through the computer modeling of selected areas that drain into the Aoa wetland. It is important that leaders of Aoa Village discourage any residential development that encroaches on the margins of the existing wetland, or significantly impairs the water quality of the wetland. The future collection and analysis of water quality samples from within the wetland and the adjoining nearshore waters would also enable ASEPA to monitor the functionality and effectiveness of the Aoa wetland, as well as monitor the impact of surface water discharges upon ASPA’s two groundwater wells. Nearshore Water Quality and the Marine Environment The nearshore waters that adjoin the watershed are somewhat impacted by natural sedimentation, urban runoff, inadequately treated wastewater from cesspools and septic tanks, a limited discharge of piggery wastes, as well as wave action and nearshore currents in Aoa Bay. It is believed that natural sedimentation from upland slopes, as well as wave action and nearshore currents, are presently the primary influences upon nearshore water quality.

Aoa, Page 15-17
Turbidity and Sedimentation Coral communities are significantly dependent upon the availability of light and related photosynthesis, and occasional periods of significant turbidity and sedimentation do not promote long-term coral nutrition, growth, reproduction, and depth distribution (Richmond, 1993). When corals fertilize, they are free-swimming. Consequently, they need a good location to settle and make a good attachment. With significant soil deposition, sediments can physically interfere with the recruitment of coral larvae (Richmond, 1993; Dashbach, 1996). Coral communities are an important component of the overall ecology of the nearshore waters that adjoin the Aoa watershed. They provide shelter to fish, invertebrates, and other marine organisms. Some of these resources represent a supplemental food source for residents of Aoa. Nutrient Inputs In future years, a greater impact can be expected from increased wastewater discharges. This impact will stem from increased residential development and the general inability of all soils in the watershed to support soil-based wastewater treatment. These inputs are potentially detrimental to the quality because they can adversely change the composition of the nearshore marine environment. However, the degree of impact upon water quality is also highly dependent upon currents and water exchange within the nearshore environment. Nevertheless, increased nutrient contributions to Aoa Bay should be an important resource management consideration. As the population of the watershed grows, nutrient and bacterial inputs will only increase. Aside from these resource management considerations, the future use of the nearshore waters for fishing, swimming and general recreation will eventually represent a more significant public health concern unless practical steps are made to reduce potential nearshore water contamination. The continued function of the Aoa wetland remains as the most practical opportunity for maintaining desirable water quality in the nearshore waters. It is recommended that the inhabited village areas in Aoa that are unsuitable for soil-based, wastewater treatment should be more specifically identified. As recommended in the ASPA Utilities Master Plan, this identification process should be based upon a more detailed sanitation survey of more densely inhabited areas such as Aoa. This survey would evaluate existing wastewater treatment practices, soil characteristics, the location and density of land uses, the distance to surface water supplies and the nearshore waters, topography, and other related factors. Using the conclusions and recommendations associated with this evaluation, ASPA and other participating Project Notification and Review System (PNRS) agencies will be better able to:
• require the use of septic tanks and leachfields that provide a sufficient amount of additional soil-based treatment;
• provide greater technical assistance to building permit applicants; and, if necessary, • deny building applications in land areas that are unsuitable for soil-based treatment systems. Long-Term Monitoring The future monitoring of water quality in the nearshore waters of Aoa Bay is necessary for long-term resource management. The nearshore waters should be monitored, at least, in the vicinity of the Aoa wetland discharge, the stream mouths of Laoulu Stream and Stream 15A, and the outer bay. Turbidity and sedimentation are presently the primary stresses to the coral communities in the nearshore waters in Aoa Bay. However, future levels bacterial contamination and nutrient inputs should also be documented to help ensure future public safety and evaluate potential stresses to the fringing coral reef communities.
Aoa, Page 15-18
In addition, the ASG Department of Marine and Wildlife Resources should monitor the coral communities along the reef front of Aoa Bay at least once every three years. Long-term monitoring of this site should also include an evaluation of the impact of turbidity, sedimentation, and nutrients that already influence the nearshore marine environment. Groundwater and Surface Water Supplies New groundwater supplies are needed upland of the Aoa wetland near the 50-foot contour to gain desirable water quality that will encourage use of groundwater for drinking and food preparation purposes. Until these improvements are made by ASPA, the surface supplies from Vaitolu Stream should continue to be used as long as these supplies are regularly chlorinated. MANAGEMENT NEEDS AND RECOMMENDATIONS The primary focus of future resource management in the Aoa watershed will be to:
• Maintain the functionality of the Aoa wetland to detain future stormwater flows, treat cesspool and piggery discharges, and conserve nearshore water quality.
• Discourage further residential development in the disturbed fresh-water marsh that is located between the main road to the village and the east side of Tapua Stream.
• Develop new groundwater wells to an upland location above the Aoa wetland as recommended by ASPA.
• Chlorinate surface water supplies from Vaitolu Stream until groundwater wells are developed near the 50-foot contour.
• Encourage Aoa residents to use groundwater supplies for their source of drinking water once new groundwater sources are developed.
Representatives of participating public agencies should make periodic visits to the watershed to observe, document, and monitor selected resource conditions, determine potential methods of correcting a potential hazard or undesirable conditions, share potential solutions with a designated resident of Aoa, and encourage participation of traditional leaders and village residents in resource management solutions. The scope of issues that should be addressed by each agency in the field is summarized in Table 15-2. The general focus of recommended technical assistance is also identified. The experience and insights of agency representatives will determine the specific methodology to be used in the field.

Aoa, Page 15-19
TABLE 15-2 RECOMMENDED FOCUS OF FUTURE TECHNICAL ASSISTANCE AOA WATERSHED
Participating Public Agency
Resource Management Issue
Focus of Technical Assistance
ASEPA Facilitate a coordinated resource management effort within the watershed
1. Coordinate overall watershed management activities. 2. Hold periodic meetings with participating ASG and federal agencies to discuss, prioritize, and schedule resource management activities. 3. Coordinate program efforts with local traditional leaders and/or designated resident of the watershed. 4. Make annual assessment of resource management program.
ASEPA Monitor water quality of Vaitolu, Laoulu, Lepa, and Tapua Streams, as well as the nearshore waters
Measure changes in and total/fecal bacteria, total suspended solids, turbidity, and nutrients on a quarterly basis
ASPA Develop new groundwater sources above the Aoa wetland, as well as other proposed water system improvements.
1. Design groundwater wells and other water system improvements. 2. Construct proposed improvements.
ASDOC Monitor changes in population and land use
Annually map type and location of land uses in village and estimate resident population.
ASDPO/ Coastal Zone Management Program
Maintain the function of existing wetlands for stormwater detention, wastewater treatment, and conserving water quality.
Monitor land uses and other potential wetland changes that might impede wetland functions. Coordinate desirable restriction upon land development with ASEPA and traditional Village leaders.
ASCC Land Grant Program
Reduce sedimentation from agricultural activities
1. Determine locations where upslope agricultural activities may be generating some sedimentation. 2. Encourage soil conservation methods with resident growers of subsistence crops.
ASG Dept. of Marine and Wildlife Resources
Sustain bird habitat on the northwest side of Motusaga Point, as well as the bat population on the east and west sides of Aoa Bay.
Monitor changes in bird populations and habitat. Coordinate any undesired land uses in upland areas with ASEPA.
ASG Dept. of Marine and Wildlife Resources
Sustain health of marine communities in nearshore waters
Monitor changes in coral coverage, fish habitat, diversity and other characteristics along reef front of Aoa Bay approximately once every three years.
Source: Pedersen Planning Consultants, 1997

Onenoa, Page 16-1
ONENOA Watershed 16 GEOGRAPHY The Onenoa watershed is located near the northeast tip in the northern portion of Tutuila. The watershed comprises about 0.3 square mile of land area (Figure 16-1). The inland Onenoa watershed is bounded by four upland ridges that are on the north side of Oloamoana Mountain. The peak of Olomoana Mountain, which is located at the 1,074 feet above mean sea level, represents the apex of the watershed. The west Side of the watershed is delineated by Afimuao Ridge and Lefao Ridge. The east Side of the watershed is defined by Maugaleoo Ridge, Lefutu Ridge, and Lefao Ridge. Along the shoreline, the watershed lies between Solo Point and Papaloa Point. A small unnamed embayment fronts the Village of Onenoa. The watershed contains three streams that discharge into the nearshore waters that adjoin the Onenoa watershed. Two of the streams flow through or adjacent to the primary village area of Onenoa. The third stream flows through the Ogefao area, a smaller residential area on the east Side of the watershed that historically represented a separate traditional village. It is believed that Onenoa and Ogefao represent a fale lua that is now consolidated and known as Onenoa Village. RESOURCES OF THE WATERSHED Soils The U.S. Soil Conservation Service (National Resource Conservation Service) published a Soil Survey of American Samoa in 1984. Selected information derived from this survey provides some useful information for future watershed planning and management (Figure 16-2). Four different soil classifications were identified by the U.S. Soil Conservation Service for lands within the Onenoa watershed (Table 16-1). TABLE 16-1 SELECTED SOIL CHARACTERISTICS ONENOA WATERSHED
Soil Depth To: Land Use Suitability SCS Soil Unit
Name Typical Slope
(Percent)
Flood Runoff Erosion High Water (Feet)
Bed Rock
(Inches)
Soil Based WW
Treatment
Subsistence Ag
Potential
2 Aua very stony silty clay loam
30-60 None Rapid Severe <6 <60 Severe Slope Poor
3 Fagasa-Ofu silty clays
30-60 None Med to Rapid
Mod to Severe
>6 20-40 Severe Slope Depth
Moderate
4 Fagasa family-Lithic Hapludolls-Rock outcrop assoc
70-130 None Very Rapid
Very Severe
>6 20-60 Severe Slope Depth
Limited
35 Urban Land-Ngedebus complex
0-5 Occ. Brief
Slow Slight >3.5 >60 Severe Flood Wet Pool Filter
Poor
Source: U.S. Soil Conservation Service, 1984


Onenoa, Page 16-4
Urban Land-Ngedebus Complex Urban land-Ngedebus complex soils (SCS mapping unit 35) characterize the primary village area in Onenoa. These soils extend up to 300 to 400 feet inland from the shoreline. The urban land consists of areas that have been developed for homes, commercial buildings, a village church, and other structures. Much of the area has been leveled and filled with coral fragments, sand, cinders and other material. The Ngedebus soil extends to a depth of 60 inches or more. The surface layer, which extends about 4 inches below ground elevation, typically contains light, brownish-gray and brown sand. The underlying material is characterized by pale brown and light yellow, brown sand. The permeability of Ngedebus soil ranges between six and 20 inches per hour. Surface drainage on this soil is generally slow, and the hazard of potential soil erosion is slight. In some places the soil is subject to occasional, brief periods of flooding during prolonged, heavy rainfall or during high tide (U.S. Soil Conservation Service, 1984). These soils are generally suitable to support residential and commercial development in areas that are protected from flooding. However, this soil is poorly suited in unprotected areas. Building structures within Onenoa Village are located between about 12 and 50 feet above mean sea level. Where moderate to higher housing densities occur, the U. S. Natural Resources Conservation Service recommends the use of community sewage systems prevent the potential contamination of groundwater and surface water supplies. Lower housing densities are present throughout Onenoa Village. Aua Very Stony Silty Clay Loam (30 to 60 percent slopes) The Ogefau residential area, the lower slopes of Afimuao Ridge, and lower portions of the Vaisa Stream drainage contain Aua very stony silty clay loam soils (SCS mapping unit 2). The Aua soils range between seven to 60 inches in depth. The permeability of these soils (between 2 and 6 inches per hour) is moderately rapid. For watershed management purposes, it is important to note that these Aua soils have a high potential for runoff and erosion. This Aua soil is not recommended for agricultural production because of the stoniness of the soil, the high erosion potential, and hazards associated with subsistence crop cultivation on steeper slopes. However, when cultivation in these soils is necessary, the use of a mulch or ground cover is recommended to reduce soil erosion in cultivated areas. The U.S. Soil Conservation Service estimates that this soil can annually sustain up to 5 tons per acre of erosion without impacting crop productivity (U.S. Soil Conservation Service, 1984). While the erosive characteristics of this soil generally may not significantly impact subsistence crop productivity, the erosive quality of the soil can be a significant contributor to sedimentation in downslope streams and the nearshore waters. The general characteristics of these Aua soils are also undesirable for individual wastewater disposal systems (U.S. Soil Conservation Service, 1984). The soils contain a significant amount of larger stones that hamper installation and provide inadequate soil treatment. Fagasa Family-Lithic Hapludolls-Rock Outcrop Association Most of the steeper upland slopes in the Onenoa watershed contain deep, well-drained soils known as Fagasa family-Lithic Hapludolls-Rock outcrop association (SCS mapping unit 4).

Onenoa, Page 16-5
Since this soil type is a combination of two general soil classifications, soil depths can vary between 20 and 60 inches. The soil represents a combination of silty clay and loam. Since the Fagasa Family-Lithic Hapludolls soil typically occurs on very steep slopes, the potential for surface runoff and erosion are high. The cultivation of subsistence crops on these soils is not considered desirable. However, when cultivation in these soils is necessary, care should be exercised to minimize the amount of exposed soil in cultivated areas. When heavier rainfall events occur, significant erosion of these soils can be expected from undeveloped upslope areas of the watershed. Natural runoff from steeper slopes in the watershed carries water, sediments, and organic debris to downslope drainage courses and streams. Such erosion can readily influence downstream water quality. Fagasa-Ofu Silty Clays The upper slopes along Maugaleoo Ridge, Lefutu Ridge, Lefao Ridge, and the upper end of Vaisa Stream drainage contain soils that are identified by the U.S. Soil Conservation Service as Fagasa-Ofu Silty Clays (SCS mapping unit 3). The soil ranges between 20 to 40-inches in depth. The permeability of this silty clay loam is moderately rapid (2 to 6 inches per hour). The potential for surface runoff from these soils is considered moderate to rapid. However, the potential for erosion is moderate to severe. The U.S. Soil Conservation Service indicates that this soil type is somewhat suitable for the production of subsistence crops. The soil can annually sustain from one to 5 tons per acre of erosion without impacting crop productivity. However, the Soil Conservation Service recommends the use of mulch, crop residues, and cross-slope farming to reduce the potential for soil erosion. Streams Stream Locations Afimuao Stream and an unnamed tributary originate at about 520-feet above mean sea level. This drainage receives surface runoff from the east slopes of Afimuao Ridge and the north slope of Olomoana Mountain. The stream course flows along the west side of Onenoa Village before its discharge into the nearshore waters. Vaisa Stream begins approximately 640 feet above mean sea level. The Vaisa Stream drainage receives surface runoff from the north slope of Maugaleoo Ridge. An unnamed tributary also carries flows from the northwest side of Lefutu Ridge to its confluence with the Vaisa Stream. A third, unnamed stream (Stream 16A) flows originates about the 330-foot contour. This stream course crosses the primary shoreline roadway and passes through the Ogefao area before its discharge near Papaloa Point. Stream Flows Within the Watershed During a May, 1996 survey of the watershed, informal discussions with High Talking Chief Fau Lelea indicate that all streams in the watershed flow throughout the year. Four low-flow, partial record gages have historically been established on two streams in the Onenoa watershed. A low-flow, partial-record station (No. 16903000) on Afimuao Stream was established approximately 0.2 mile upstream from the stream mouth. Eighteen measurements between 1958 and 1976 enabled the U.S. Geological Survey to estimate a median flow of 0.07 cfs (Wong, 1996) for Afimuao Stream.

Onenoa, Page 16-6
A low-flow, partial-record station (No. 16902000) was installed on the right fork of Vaisa Stream, about 100 feet upstream from the stream mouth. Ten measurements between 1958 and 1971 led the U.S. Geological Survey to estimate a median flow of 0.04 cfs. Roughly 0.1 mile upstream from the Vaisa Stream mouth, another low-flow, partial-record station (No. 16902500) provided 10 stream flow measurements between 1964 and 1976. This data was used by the U.S. Geological Survey to estimate a median stream flow of 0.25 cfs. Eleven measurements along the left fork of Vaisa Stream, approximately 0.1 mile upstream from the stream’s confluence with its right fork, were made between 1958 and 1969. Available stream flow data from another low-flow, partial-record station (No. 16901000) enabled U.S. Geological Survey to estimate a median flow of 0.18 cfs (Wong, 1996). Surface Water Quality Streams There is no historical surface water quality data that is available for the fresh-water streams in the Onenoa watershed. Nearshore Waters ASEPA collected marine water samples from 17 embayments around the Island of Tutuila on July 25 and August 2, 1992 (Table 16-2). The samples were obtained from the outer portions of the embayments where more water exchange occurs at depths of three and 60 feet. Collected samples were subsequently analyzed for nutrients and chlorophyll a. Nutrient data gained from these samplings indicate that the waters seaward of Onenoa met American Samoa water quality standards in late July and early August of 1992. Laboratory results also suggest that stormwater runoff from undeveloped lands upland of Onenoa may not generate any significant discharge of nutrients. TABLE 16-2 SURFACE WATER QUALTITY OUTER ONENOA BAY JULY-AUGUST, 1992
Sample Depth (feet)
Nitrate/Nitrite Mg N/l
Total N
mg N/l
Kjeldahl N
mg N/l
Total P
mg P/l
CHL a
mg/m3
3 60
<0.001 <0.001
0.154 0.109
0.154 0.109
0.008 0.008
0.18 0.19
Source: ASEPA, 1995 Wetlands There are no significant wetlands in the Onenoa watershed. Marine Resources Coral Communities The fringing reef seaward of the Onenoa Village extends between 100 and 400 feet seaward of the shoreline. Satellite photography from June, 1994 clearly delineates an ava through this reef that affords boat access to the deeper waters near the reef margin, as well as deeper offshore waters.

Onenoa, Page 16-7
Various private consultants have made field investigations of the fringing reef in this area since the late 1970’s. In a cumulative sense, available survey information provided suggests that:
• An outbreak of crown-of-thorns starfish significantly impacted the fringing coral reef between Solo Point and Papaloa Point about 1978.
• Many dead corals were present in this area in 1992; however, active signs of coral recolonization were also evident.
1978-1979
In May, 1978, the largest aggregation of the crown-of-thorns starfish on the coral reefs of Tutuila was observed in Onenoa Bay and nearby Aoa Bay. Over 50 percent of the starfish that were removed and buried during a territorial-wide bounty program were obtained from the fringing reef that fronts Onenoa Village (Aecos and Aquatic Farms, 1980).
In June, 1978, the crown-of-thorns starfish was common on forereef slopes between Papaloa Point and the Nuutele Rocks (seaward of the Ogefao area).
“Corals were being eaten particularly at the base of large limestone mounds, while shallow surfaces were relatively free of starfish. Although present at depths as shallow as six feet, Acanthaster was most concentrated at depths between 20 and 30 feet. The starfish had presumably moved into the shallow regions from deeper water, although the proportion of live versus dead coral heads in deeper areas was greater than in shallow reef areas” (Aecos and Aquatic Farms, 1980).
By August-September, 1979, only about five percent of the corals remained alive east of Papaloa Point.
Coral coverage on the inner reef platform (southwest of the ava) was observed to be about one percent. West of the ava, coral coverage was close to 10 percent on the outer reef. However, about 90 percent of the outer reef flat remained alive with few starfish being present (Aecos and Aquatic Farms, 1980). 1982, 1985, and 1988
During the month of April in 1982, 1985, and 1988, Birkeland and Randall investigated the coral communities in Onenoa Bay. Survey transects were made at a depths of 6-10 feet, as well as 20 feet.
Field survey data indicated increased coral coverage at 6-10 feet between 1982 and coral coverage was reported to be almost six percent in 1982, increased to nine percent in 1985 and rose to almost 11 percent in 1988. Consistent increases in coral cover were also documented at 20 feet where coral coverage was two percent in 1982 and increased to approximately eight percent in 1985 and 1988 (Birkeland, Randall, and Amesbury, 1990). 1992
Field investigations in the nearshore waters that adjoin Onenoa Village were also made by Maragos, Hunter, and Meier in 1992. This area exhibited many dead corals, but also showed active signs of coral recolonization, e.g., many smaller, live colonies. Living coral pockets were concentrated on elevated ridges or mounds. Very few loose or unattached corals remained alive.
The percent of live stony coral was estimated to be less than one percent at a depth of six meters. Greater coverage of about 10 percent was observed at a depth of 18 meters.
Onenoa, Page 16-8
1996
In 1996, Alison Green completed a study of various coral reefs throughout the Samoan Archipelago. The study focused primarily upon the quantification of coral communities, the abundance and diversity of reef fish, and other selected habitat characteristics. However, no marine surveys of the coral reef communities that are adjacent to the Onenoa watershed were included in this study.
Wildlife Resources
No significant wildlife habitat is known to be located in this watershed. Shoreline Protection
The unnamed embayment that fronts Onenoa Village is exposed to northerly swells and storm waves. The fringing reef in this embayment helps dissipate some of the energy that is associated with incoming waves.
Despite the presence of a significant fringing reef, the shoreline of this embayment has historically been influenced by hurricanes, tropical storms, and stormwaves. Between 1840 and 1991, ten hurricanes with sustained winds over 75 miles per hour are believed to have occurred in American Samoa. In contrast, some 42 tropical storms, which were characterized by winds between 40 and 75 miles per hour, occurred in the Territory during the same period (Sea Engineering and Belt Collins Hawaii, 1994).
Some shoreline erosion is evident along the shoreline. The exposure of coconut tree roots provides an indication of some ongoing erosion of the shoreline and/or past storm damage (Sea Engineering and Belt Collins Hawaii, 1994).
The setback of existing building away from the shoreline also helps provide some shoreline protection. In May, 1996, Pedersen Planning Consultants noted that existing buildings were located between about 12 and 50 feet above mean sea level. Virtually no flooding has occurred in the Village in recent history. One house on the east side of Vaisa Stream that is located about 25 feet above mean sea level was flooded in 1969 (Lelea, 1996). Groundwater and Surface Drinking Water Supplies Groundwater Supply and Quality
There are no groundwater resources used by the village for any purpose. No available data exists that any groundwater wells have ever been drilled in the Village. Surface Water Supply and Quality
Onenoa Village relies upon two surface water resources for drinking and other potable water uses. The Village uses surface water from a fresh-water spring along Vaisa Stream that is located at approximately 175 feet above mean sea level. A second source along the main stream (at about the 125-foot contour) is used as a source of water for washing clothes.
Available water quality data for the FY 1994-1996 period indicate regular bacterial contamination, as well as some turbidity. Roughly 75 percent of the bacterial contamination represented fecal coliforms. Proposed Water System Improvements
In its draft Utility Master Plan, ASPA recommends the design and construction of a new village water system. The proposed system would include the development of two or more groundwater wells along Afimuao Stream and Vaisa Stream that would need to provide a minimum production of about 16 gallons per minute. Disinfection of the groundwater supply would be provided for each well. Other proposed improvements would include:

Onenoa, Page 16-9
• The construction of one 55,000 gallon water storage tank; • The installation of approximately 600 feet of transmission main from the well near Afimuao
Stream well to distribution, and some 200 feet of PE pipe from the new well near Vaisa Stream to the new water storage tank;
• Installation of a fire protection/distribution system; and, • The installation of service laterals and water meters. USE OF THE WATERSHED Resident Population Residential growth in Onenoa was virtually stagnant between 1980 and 1990. The resident population of Onenoa Village decreased from 140 to 136 residents. The average annual decline in growth was about –0.29 percent. However, from 1990 through 1994, the community has experienced considerable growth. The estimated 1995 population represents approximately 200 persons. Despite recent growth, the lack of available developable land, the presence of a dirt trail from nearby Tula Village, and no elementary school are factors that have probably discouraged increased development within the village. The village’s reliance upon a surface stream catchment system for a potable water supply may also have discouraged others. Population trends reflected in the 1990 Census statistics suggest that significant in-migration has occurred in this community between 1980 and 1990. The proportion of residents who were born outside of American Samoa during the 1980-1984 period was about 12 percent. Between 1985 and 1990, the proportion increased to 25 percent. In 1990, the proportion further increased to 36 percent. It appears that residential growth in this village is resulting primarily from the influx of new persons who were born outside of American Samoa. Land Uses Residential
The 1990 U.S. Census documented 16 homes in Onenoa. Eighty-eight percent of the homes were owner-occupied; six percent were rental units. The remaining six percent were vacant or used as vacation homes by absentee owners.
The housing stock expanded considerably during the 1990-1995 period. ASG Building Division records indicate that eight residential building permits were issued for new residential structures during this period. Consequently, the 1995 housing stock in Onenoa includes 24 houses.
Most houses in the Village are one-story single family units. Homes are typically set back bout 100 feet from the shoreline to accommodate a shoreline coral trail and provide some protection from occasional storm waves. Agriculture
During a May, 1996 watershed survey, five agricultural production areas were observed by Pedersen Planning Consultants on the south and east side of the village. These areas were generally located upland of Onenoa Village between the 75 and 125-foot contour. Commercial
In 1995, two commercial enterprises operated in the Village. These enterprises included combination grocery and variety store, as well as one ice cream/ice cake shop. Industrial
No industrial operations are located in Onenoa in 1995.

Onenoa, Page 16-10
Public Facilities The ASG Department of Education offers an early childhood education (ECE) in Onenoa. The ECE program, which serves children three and four years of age, provided educational opportunities to four children in September, 1994. Elementary school students attend Matatula Elementary School in Tula. High school students attend Fagaitua High School in Fagaitua. Use of the Nearshore Waters Nearshore Fishing High Talking Chief Lela indicated during the May, 1996 field survey that approximately five to ten persons per day use the nearshore waters for fishing. An American Samoa Subsistence Fishing Survey was conducted by the University of Hawaii Sea Grant Program in the summer of 1992. This survey involved onsite interviews with shoreline users who were participating in fishing activities on selected days during that period. The results of the survey revealed, in part, that there is some use of the nearshore waters in the reefs off Onenoa. Twenty persons were documented fishing on the reef. Fishing methods that were observed included the use of rod and reel, throw net, gill net, spear, diving, gleaning, hand-in-line, as well as hand-in-line from a paopao. Swimming/Bathing No residents presently use the nearshore waters for swimming, bathing, or general recreation (Lela, 1996). RESOURCE MANAGEMENT ISSUES Future Land Uses to the Year 2015 Residential Some residential expansion can be expected in the near future. However, the anticipated rate of 2.5 percent per year will be significantly less than the more recent residential expansion that occurred from 1990 through 1994. Construction of a new two-lane paved roadway to Tula was completed in 1996. This development, combined with good village sanitation and a scenic setting, are expected to gradually attract the development of 12 more homes during the next 20 years. During the next 20 years, ASPA believes that these potential development opportunities and constraints will generate the following sequence and volume of residential construction.
1996-2000 Three new single family homes on moderate slopes between the 25 and 75-foot elevation.
2001-2005 Three new single family homes on moderate slopes between the 25 and 75-foot elevation.
2006-2010 Three new single family homes on moderate slopes between the 25 and 75-foot elevation.
2011-2015 Three new single family homes on moderate slopes between the 25 and 75-foot elevation.

Onenoa, Page 16-11
The cumulative effect of this prospective residential growth is that the village housing stock will increase to roughly 36 housing units in the year 2015. During the same period, it is believed that the average household size will have gradually decreased to approximately 7.13 persons per household. Consequently, the future village population is expected to include about 257 persons in the year 2015. Commercial The limited population in this village is inadequate to support additional enterprises in Onenoa. However, a gradual increase in population may bring a few home-based services and generate an expansion of the present general store. Between 2001 and 2005, it is anticipated that two home-based technical services will begin operation. During the 2006-2010 period, two additional home-based sales enterprises will also open. Industrial The influx of new residents is expected to bring one home-based industrial service, e.g., part-time welder, during the 1996-2000 period. However, the development of new industrial facilities is not anticipated. Public Facilities Population characteristics for Onenoa in 1990 suggest that approximately one percent of the village population is three and four years of age, 19 percent is elementary school age (5-13), and 14 percent is high school age (14-18 years old). Application of these assumptions to the anticipated future population suggests that Onenoa will generate the following student enrollments in the year 2015:
• early childhood education 3 students • elementary school 49 students • high school 36 students Impact of Future Population Growth Upon Water Consumption and Waste Generation Future population growth and changes in land use in the Onenoa watershed will increase the volume of future wastewater and solid wastes that are generated by local residents. Wastewater generation, for example, is expected to rise from about 9,322 gallons per day (gpd) in 1995 to 14,482 gpd in the year 2015 (American Samoa Power Authority, 1996). The consumption of potable water will also increase with a growing population. The American Samoa Power Authority (ASPA) estimates that the average day demand for water in Onenoa was about 13,317 gallons in 1995. By the year 2015, ASPA anticipates that the average demand will increase to roughly 20,688 gpd. Flood Potential A flood insurance study of American Samoa and related flood insurance rate maps were published by the U.S. Federal Emergency Management Agency (FEMA) in 1991. The study evaluated selected geographical locations throughout the Territory. Hydrologic and hydraulic analyses that were presented in the study were made by the U.S. Army Corps of Engineers, Pacific Ocean Division. A detailed study was not made of the streams in the Onenoa watershed. Inland Flood Potential All inland areas of the Onenoa watershed have been designated by the Federal Emergency Management Agency (FEMA) as “zone x.” This designation indicates that these areas are outside of the 100-year floodplain. In essence, FEMA is suggesting that the flood hazard potential is limited.

Onenoa, Page 16-12
Coastal Flood Hazards The flood insurance rate map for Onenoa indicates that a potential 100-year flood is estimated to generate a flood levels of approximately three feet above mean sea level. Since all building structures in the Village are located above the 12-foot contour, the potential for flooding in the village is presently limited. Potential inundation levels associated with a 100-year tsunami have also been estimated by the U.S. Army Corps of Engineers for two locations in the Onenoa watershed. At Solo Point, a potential 100-year tsunami is estimated to generate an inundation level of 2.8 feet above mean sea level (MSL). A similar event at Papaloa Point is estimated to generate a 100-year inundation level of 2.7 feet above MSL. Stormwater Runoff/Sedimentation and the Relationship to Surface Water Quality Heavier rainfall periods, steeper inland slopes, and more erosive soils in the Onenoa watershed regularly contribute to periodic erosion and the related transport of sediments into Vaisa Stream, Afimuao Stream, and the unnamed stream (Stream 16A) on the east side of the watershed. Ultimately, this natural erosion process carries a portion of these sediments into the nearshore waters that adjoin the watershed, especially during medium to higher flow stream conditions. Natural erosion from the undeveloped, upslope areas of the watershed is believed to be the primary cause of sedimentation in local streams, as well as downstream sedimentation of the nearshore waters. Some limited erosion may also be occurring from some faatoaga areas that are upslope of the inhabited village area. During heavier rainfall periods, some erosion probably occurs and causes some the transport of sediments into Vaisa Stream and Afimuao Stream. However, no significant areas within existing agricultural areas were observed to be barren or exposed during the May, 1996 survey. Consequently, the contribution of sedimentation from faatoaga areas is believed to be limited. Urban runoff also occurs in the Onenoa Village area. Impermeable surfaces, e.g., concrete and metal roofs, generate increased surface runoff. However, the impact of this runoff is mitigated considerably by the use of coral rubble and basaltic cinder material around the perimeter of residences, commercial facilities, and the local church. Potential opportunities for the future detention of stormwater flows in the Onenoa watershed appear to be limited. Steeper slopes and limited land area near stream discharge locations hamper the construction of any smaller detention ponds. Nearshore Water Quality and the Marine Environment The nearshore waters that adjoin the watershed are impacted by natural sedimentation, urban runoff, as well as wave action and nearshore currents in the unnamed embayment that fronts Onenoa Village. Natural sedimentation, as well as wave action and nearshore currents, are probably the primary influences upon nearshore water quality. While limited residential expansion is anticipated, future resource management should continue to monitor the potential impact of sedimentation upon the water quality of the nearshore waters. Coral communities are significantly dependent upon the availability of light and related photosynthesis, and occasional periods of significant turbidity and sedimentation do not promote long-term coral nutrition, growth, reproduction, and depth distribution (Richmond, 1993). When corals fertilize, they are free-swimming. Consequently, they need a good location to settle and make a good attachment. With significant soil deposition, sediments can physically interfere with the recruitment of coral larvae (Richmond, 1993; Dashbach, 1996).

Onenoa, Page 16-13
Coral communities are an important component of the overall ecology of the nearshore waters that adjoin the Masausi watershed. They provide shelter to fish, invertebrates, and other marine organisms. Some of these resources represent a supplemental food source for residents of Onenoa. Groundwater and Surface Drinking Water Supplies The proposed development of two or more new groundwater wells will eventually lead to the use of groundwater resources for drinking and other potable uses. However, the level of anticipated potable water consumption is not believed to be significant in light of the expected resident population. Prior to the development of new groundwater wells and a related village water system, each household in Onenoa Village should be encouraged by ASEPA to make an expanded use of individual rainwater catchment systems in light of the present level of bacterial contamination in existing surface water sources. Technical assistance to the village should particularly be directed to new residents of the village. Such efforts should promote the use of practical maintenance measures that will enhance potable water quality and minimize undesirable sources of potential water contamination . MANAGEMENT NEEDS AND RECOMMENDATIONS The primary focus of future resource management in the Onenoa watershed will be to:
• Discourage the continued use of Vaisa Stream for potable water uses. Encourage use of individual roof catchment systems until groundwater wells can be developed by ASPA.
• Begin long-term monitoring of nearshore water quality to promote long-term health of the fringing reef that adjoins Onenoa Village.
Representatives of participating public agencies should make periodic visits to the watershed to 1) observe, document, and monitor selected resource conditions, 2) determine potential methods of correcting a potential hazard or undesirable conditions, 3) share potential solutions with a designated resident of Onenoa, and 4) encourage the participation of traditional leaders and village residents in resource management solutions. The scope of issues that should be addressed by each agency in the field is summarized in Table 16-3. The general focus of recommended technical assistance is also identified. The experience and insights of agency representatives will determine the specific methodology to be used in the field.

Onenoa, Page 16-14
TABLE 16-3 RECOMMENDED FOCUS OF FUTURE TECHNICAL ASSISTANCE ONENOA WATERSHED
Participating Public Agency
Resource Management Issue
Focus of Technical Assistance
ASEPA Facilitate a coordinated resource management effort within the watershed
1. Coordinate overall watershed management activities. 2. Hold periodic meetings with participating ASG and federal agencies to discuss, prioritize, and schedule resource management activities. 3. Coordinate program efforts with local traditional leaders and/or designated resident of the watershed. 4. Make annual assessment of resource management program.
ASEPA Monitor water quality of Afimuao and Vaisa Streams, as well as the nearshore waters
1. Measure changes in total/fecal bacteria, sedimentation, and nutrients on a quarterly basis. 2. Make annual assessment of resource management program..
ASEPA Improve the quality of drinking water.
1. Encourage the expanded use of household water catchment systems until new groundwater wells can be developed by ASPA.
2. Provide technical assistance to village residents concerning the maintenance of water catchment systems.
ASPA Develop new village water system in Onenoa
1. Meet with traditional village leaders to consider the development of a satellite water system.
2. If desired by village leaders, secure funding for water system design and construction. 3. Design water system improvements. 4. Construct proposed improvements.
ASDOC Monitor changes in population and land use
Annually map type and location of land uses in village and estimate resident population.
ASCC Land Grant Program
Reduce sedimentation from agricultural activities
1. Determine locations where upslope agricultural activities may be generating some sedimentation. 2. Encourage soil conservation methods with resident growers of subsistence crops.
ASG Dept. of Marine and Wildlife Resources
Sustain health of marine communities in nearshore waters
Monitor changes in coral coverage, fish habitat, diversity and other characteristics along the reef front approximately once every three years.
Source: Pedersen Planning Consultants, 1998
Tula, Page 17-1
TULA Watershed 17 GEOGRAPHY The Tula watershed is located on the northeast tip of the Island of Tutuila. The watershed comprises about 0.6 square mile of land area (Figure 17-1). The watershed contains a series of basaltic, mountain ridges that were formed by historical volcanic flows from Olomoana Mountain. The west boundary of the watershed includes the summit of Olomoana Mountain, which rises approximately 1,074 feet above mean sea level, as well as Lefutu Ridge and Lefao Ridge. The south boundary of the watershed is defined by Maugaleoo Ridge and Tapepe Ridge. Fusi Ridge is situated near the center of the watershed. Toiloto Ridge and Saililagi Ridge in the southeast part of the Tula watershed form a separate drainage area within the overall watershed. The actual northeast tip of Tutuila, Cape Matatula also represents the northeast corner of the Tula watershed. Along the shoreline, the watershed extends between Papaloa Point and Maliuga Point. Two coastal indentations adjoin the watershed. On the north side of the watershed, one coastal indentation occurs between Papaloa Point and Cape Matatula. A second indentation is located between the Cape Matatula and Maliuga Point. Within this indentation, a small unnamed cove lies between Pisiula Point and Fagasa Point. The Tula watershed contains three streams that discharge into the nearshore waters that adjoin the watershed. Maupua Stream in situated the north part of the watershed. Vailoa Stream and its three, unnamed tributaries flow through the central part of the watershed; Vailoa Stream pass through Tula Village and a small wetland area before its discharge into the nearshore waters. In the southeast part of the watershed, Sinavevela Stream flows between Saililagi Ridge and Tapepe Ridge before its discharge into the nearshore waters north of Maliuga Point. RESOURCES OF THE WATERSHED Soils The U.S. Soil Conservation Service (National Resource Conservation Service) published a Soil Survey of American Samoa in 1984. Selected information derived from this survey provides some useful information for future watershed planning and management (Figure 17-2). Six different soil classifications were identified by the U.S. Soil Conservation Service for lands within the Tula watershed (Table 17-1). Urban Land-Ngedebus Complex Urban land-Ngedebus complex soils (SCS mapping unit 35) characterizes most all of Tula’s inhabited village area. For example, the Maupua area, just north of the primary village area, does not contain these soils. These soils generally comprise coral fragments, sand, cinders and other material that have been graded or filled to support residential, commercial and public facilities in the village area. This soil type extends roughly 100 to 800 feet inland from the shoreline that fronts the primary village area. Ngedebus soil extends to a depth of 60 inches or more. The surface layer, which extends about 4 inches below ground elevation, typically contains light, brownish-gray and brown sand. The underlying material is characterized by pale brown and light yellow, brown sand. The permeability of Ngedebus soil ranges between six and 20 inches per hour. Surface drainage on this soil is generally
RMHart
Note
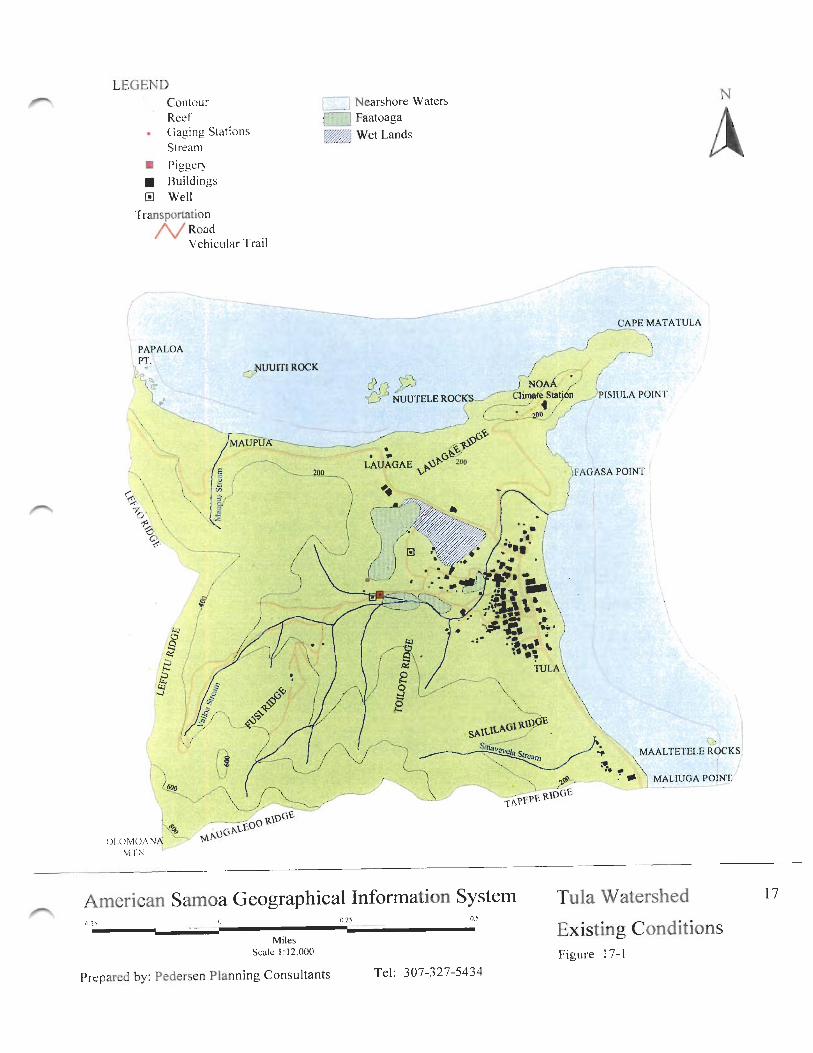

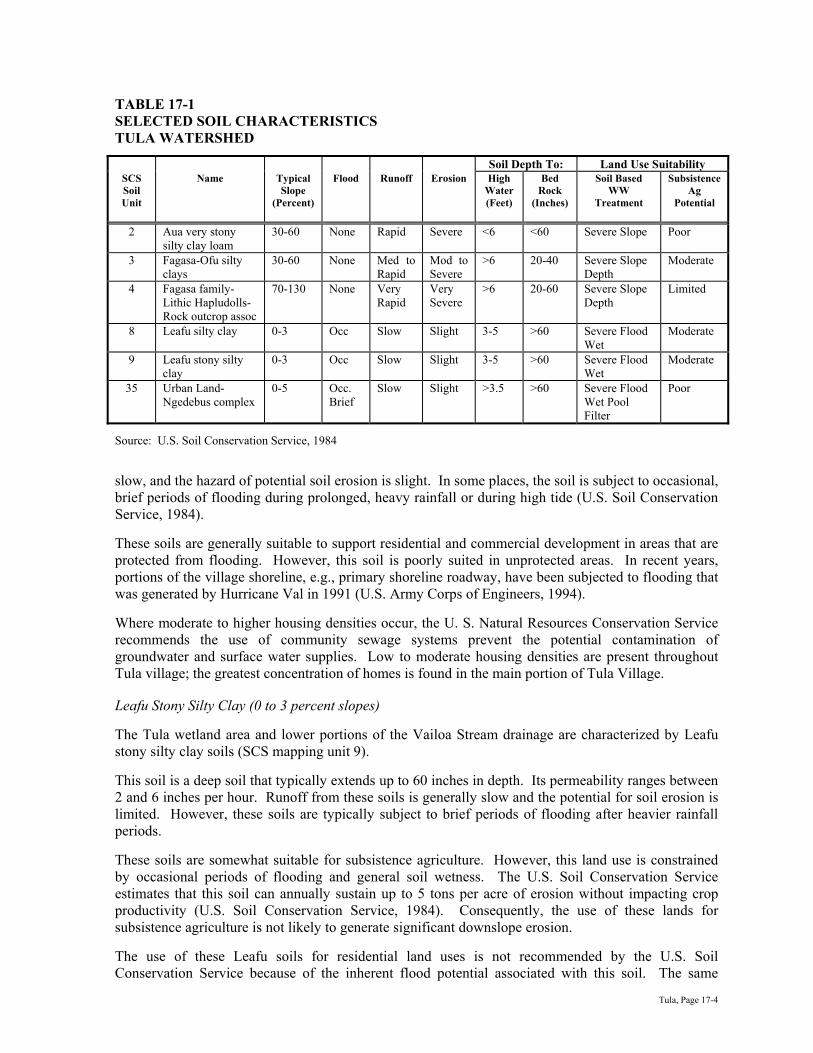
Tula, Page 17-4
TABLE 17-1 SELECTED SOIL CHARACTERISTICS TULA WATERSHED
Soil Depth To: Land Use Suitability SCS Soil Unit
Name Typical Slope
(Percent)
Flood Runoff Erosion High Water (Feet)
Bed Rock
(Inches)
Soil Based WW
Treatment
Subsistence Ag
Potential
2 Aua very stony silty clay loam
30-60 None Rapid Severe <6 <60 Severe Slope Poor
3 Fagasa-Ofu silty clays
30-60 None Med to Rapid
Mod to Severe
>6 20-40 Severe Slope Depth
Moderate
4 Fagasa family-Lithic Hapludolls-Rock outcrop assoc
70-130 None Very Rapid
Very Severe
>6 20-60 Severe Slope Depth
Limited
8 Leafu silty clay 0-3 Occ Slow Slight 3-5 >60 Severe Flood Wet
Moderate
9 Leafu stony silty clay
0-3 Occ Slow Slight 3-5 >60 Severe Flood Wet
Moderate
35 Urban Land-Ngedebus complex
0-5 Occ. Brief
Slow Slight >3.5 >60 Severe Flood Wet Pool Filter
Poor
Source: U.S. Soil Conservation Service, 1984 slow, and the hazard of potential soil erosion is slight. In some places, the soil is subject to occasional, brief periods of flooding during prolonged, heavy rainfall or during high tide (U.S. Soil Conservation Service, 1984). These soils are generally suitable to support residential and commercial development in areas that are protected from flooding. However, this soil is poorly suited in unprotected areas. In recent years, portions of the village shoreline, e.g., primary shoreline roadway, have been subjected to flooding that was generated by Hurricane Val in 1991 (U.S. Army Corps of Engineers, 1994). Where moderate to higher housing densities occur, the U. S. Natural Resources Conservation Service recommends the use of community sewage systems prevent the potential contamination of groundwater and surface water supplies. Low to moderate housing densities are present throughout Tula village; the greatest concentration of homes is found in the main portion of Tula Village. Leafu Stony Silty Clay (0 to 3 percent slopes) The Tula wetland area and lower portions of the Vailoa Stream drainage are characterized by Leafu stony silty clay soils (SCS mapping unit 9). This soil is a deep soil that typically extends up to 60 inches in depth. Its permeability ranges between 2 and 6 inches per hour. Runoff from these soils is generally slow and the potential for soil erosion is limited. However, these soils are typically subject to brief periods of flooding after heavier rainfall periods. These soils are somewhat suitable for subsistence agriculture. However, this land use is constrained by occasional periods of flooding and general soil wetness. The U.S. Soil Conservation Service estimates that this soil can annually sustain up to 5 tons per acre of erosion without impacting crop productivity (U.S. Soil Conservation Service, 1984). Consequently, the use of these lands for subsistence agriculture is not likely to generate significant downslope erosion. The use of these Leafu soils for residential land uses is not recommended by the U.S. Soil Conservation Service because of the inherent flood potential associated with this soil. The same

Tula, Page 17-5
characteristics also hamper the use of these soils for septic tank systems and related soil-based treatment. Leafu Silty Clay (0 to 3 percent slopes) Leafu silty clay soils (SCS mapping unit 8) are found in a small area near Maliuga Point. It is suspected that these soils may be present within a portion of the small existing residential area that is west and north of Maliuga Point. This soil typically extends up to 60 inches in depth. Its permeability ranges between 2 and 6 inches per hour. Runoff from these soils is generally slow and the potential for soil erosion is limited. However, these soils are typically subject to brief periods of flooding during prolonged, heavier rainfall. These soils are moderately suitable for subsistence agriculture. However, this land use is constrained by occasional periods of flooding and general soil wetness. The U.S. Soil Conservation Service estimates that this soil can annually sustain up to 5 tons per acre of erosion without impacting crop productivity (U.S. Soil Conservation Service, 1984). Consequently, the use of these lands for subsistence agriculture is not likely to generate significant downslope erosion. The use of these Leafu soils for residential land uses is not recommended by the U.S. Soil Conservation Service because of the inherent flood potential associated with this soil. The same characteristics also hamper the use of these soils for septic tank systems and related soil-based treatment. Aua Very Stony Silty Clay Loam (30 to 60 percent slopes) Steeper slopes of the lower watershed, between the 200 and 400 foot contour, primarily contain Aua very stony silty clay loam soils (SCS mapping unit 2). These soils also occur on moderate slopes in a smaller area that is north of the primary village area, the Vailoa Stream mouth, and Fagasa Point. The Aua soils range between seven to 60 inches in depth. The permeability of these soils (between 2 and 6 inches per hour) is moderately rapid. For watershed management purposes, it is important to note that these Aua soils have a high potential for runoff and erosion. This Aua soil is not recommended for agricultural production because of the stoniness of the soil, the high erosion potential, and hazards associated with subsistence crop cultivation on steeper slopes. However, when cultivation in these soils is necessary, the use of a mulch or ground cover is recommended to reduce soil erosion in cultivated areas. The U.S. Soil Conservation Service estimates that this soil can annually sustain up to 5 tons per acre of erosion without impacting crop productivity (U.S. Soil Conservation Service, 1984). While the erosive characteristics of this soil generally may not significantly impact subsistence crop productivity, the erosive quality of the soil can be a significant contributor to sedimentation in downslope streams and the nearshore waters. The general characteristics of these Aua soils are also undesirable for individual wastewater disposal systems (U.S. Soil Conservation Service, 1984). The soils contain a significant amount of larger stones that hamper installation and provide inadequate soil treatment. Fagasa Family-Lithic Hapludolls-Rock Outcrop Association Steeper upland land areas throughout most of the remaining watershed contain deep, well-drained soils on steep mountain ridges and slopes. The U.S. Soil Conservation Service identifies these soils as part of the Fagasa family-Lithic Hapludolls-Rock outcrop association (SCS mapping unit 4).

Tula, Page 17-6
Since this soil type is a combination of two general soil classifications, soil depths can vary between 20 and 60 inches. The soil represents a combination of silty clay and loam. Since the Fagasa Family-Lithic Hapludolls soil typically occurs on very steep slopes, the potential for surface runoff and erosion are high. The cultivation of subsistence crops on these soils is not considered desirable. However, when cultivation in these soils is necessary, care should be exercised to minimize the amount of exposed soil in cultivated areas. When heavier rainfall events occur, significant erosion of these soils can be expected from undeveloped upslope areas of the watershed. Natural runoff from steeper slopes in the watershed carries water, sediments, and organic debris to downslope drainage courses and streams. Such erosion can readily influence downstream water quality. Fagasa-Ofu Silty Clays Soils along the upper elevations of mountain ridges in the watershed are primarily characterized by soils that are identified by the U.S. Soil Conservation Service as Fagasa-Ofu Silty Clays (SCS mapping unit 3). The soil ranges between 20 to 40-inches in depth. The permeability of this silty clay loam is moderately rapid (2 to 6 inches per hour). The potential for surface runoff from these soils is considered moderate to rapid. However, the potential for erosion is moderate to severe. The U.S. Soil Conservation Service indicates that this soil type is somewhat suitable for the production of subsistence crops. The soil can annually sustain from one to 5 tons per acre of erosion without impacting crop productivity. However, the Soil Conservation Service recommends the use of mulch, crop residues, and cross-slope farming to reduce the potential for soil erosion. Streams Stream Locations Maupua Stream is a short, stream that drains surface runoff from the East Side of Lefao Ridge and the north side of Lefutu Ridge. The stream originates at about the 225-foot contour and discharges into the nearshore waters that lie east of Papaloa Point. Vailoa Stream is the largest stream in the watershed and contains four tributaries. The main stream course begins at about 385 feet above mean sea level. Before its discharge into the nearshore waters, the stream passes through the southwest part of Tula Village. At least one man-made swale carries surface runoff through the middle of the Village to the east margin of the Tula wetland. Subsequently, the stream discharges into the nearshore waters. Otherwise, sheet flows from the lower Vailoa Stream drainage appear to flow southwest to northeast through the more inland parts of the Village; in May 1996, these flows generated some localized flooding. The general field survey in May 1996 observed one primary man-made drainage course, i.e., grass swale, that generally flows from south to north. This drainage course appeared to coincide with the direction of surface flows from one, unnamed branch of Vailoa Stream between Saililagi and Toiloto Ridge. Stormwater flowing in the grass swale channel ultimately discharged into Vailoa Stream, but did not empty into the Tula wetland. A more detailed field investigation is needed to confirm the presence of one or more man-made drainage courses within Tula Village to better understand flood potential within the village, and evaluate potential stormwater detention opportunities. Sinavevela Stream, which is situated between Saililagi Ridge and Tapepe Ridge, originates about the 375-foot elevation. This stream drains both ridges, as well as the east slope of Maugaleoo Ridge.

Tula, Page 17-7
Stream Flows Within the Watershed One low-flow, partial-record station (No. 16900000) was installed and operated on Vailoa Stream, approximately 0.6 mile upstream from the mouth, between 1958 and 1965. Data from nine measurements at this station enabled the U.S. Geological Survey to estimate a median flow 0.02 cubic feet per second (Wong, 1996). Aquatic Fishes and Invertebrates Field surveys of fishes and invertebrates were made by the U.S. Fish and Wildlife Service, Division of Ecological Services, in March-April, 1978 and the U.S. Army Corps of Engineers in August, 1980. Vailoa Stream was one of 37 streams in American Samoa that was inventoried by representatives of these federal agencies. Results from both field surveys were summarized in an American Samoa Stream Inventory that was published by the U.S. Army Corps of Engineers, Honolulu District, in July, 1981. Vailoa Stream was surveyed near the 80-foot elevation. It is believed that the sampling location crossed the existing direct trail to the NOAA Climate Station north of main village area (station 32a). No fish were observed at station 32a. Three species of shrimp were identified that were common in abundance. Biologists noted that the stream did not reach the nearshore waters; sampling also was made during very low flow conditions. Surface Water Quality There is no historical surface water quality data that is available for the fresh-water streams and wetland in the Tula watershed, or the nearshore waters that adjoin the watershed. No surface water quality data is available for any of the streams in the Tula watershed, or the nearshore waters that adjoin the watershed. However, available satellite photography that was taken by the U.S. National Oceanographic and Atmospheric Administration (NOAA) on June 18, 1994 indicate the presence of no significant turbidity in the surface waters between the shoreline and the fringing reef. During the June 12-18, 1994 period, only 23 millimeters of rainfall (approximately 0.9 inch) was recorded at NOAA’s monitoring station which is situated just upslope of the Tula’s primary village area (Mefford, 1998). A correlation of these rainfall records with available satellite photography on June 18, 1994 suggest that lower flow stream conditions in the Tula watershed probably have little influence upon nearshore water quality. However, some increased turbidity and sedimentation within the nearshore waters may be generated during medium and higher streamflow conditions. Wetlands The Tula wetland is situated on the north side of Tula Village and comprises approximately eight acres of land area. In 1992, Biosystems Analysis, Inc. identified this area as “…a ruderal freshwater wetland that is predominantly an herbaceous marsh”. In 1976, Whistler reported that this area was not a wetland because of the type of plant species that were present. He concluded that this area was a former coastal marsh. Existing topographic maps, based upon 1989 aerial photography, indicate that the wetland is bisected by a dirt trail that connects to the primary shoreline roadway, as well as the village interior. The wetland connects to Vailoa Stream via two 4 x 8-foot culverts underneath the primary shoreline roadway. During the May, 1996 survey, Pedersen Planning Consultants observed that the primary road that is located on the north side of the wetland also contains new drainage inlets that direct stormwater into the Tula wetland.

Tula, Page 17-8
Aerial photographs from 1961 were reviewed by Biosystems Analysis, Inc. to calculate changes in the size of the wetland. Biosystems Analysis concluded that the wetland at Tula was “….once dominated by trees and would have been characterized as a freshwater swamp. Much of the area has been cleared but it still supports freshwater herbaceous plants and small, scattered stands of trees and dead snags. The largest stand of trees occupies the upper (western) end of the wetland” (Biosystems Analysis, Inc., 1992). Spreading day flower, sesesele, and sour paspalum are the predominant plant species in the fresh-water marsh. Banana and coconut trees, as well as smaller patches of beach hibiscus, are scattered among these and other herbaceous plants. Hibiscus is also prominent along the west margin of the wetland. A banana plantation is located on the south side of the wetland. Marine Resources Coral Communities Available aerial photography from 1989 suggests that the width of the fringing reef in the nearshore waters ranges considerably. Between Papaloa Point and Cape Matatula, the fringing reef extends between 50 and 450 feet from the shoreline. South of Cape Matatula, the width of the fringing reefs extends between 200 and 1,100 feet wide to Maliuga Point. The most recent surveys of this reef were completed in 1978 and 1979. Available survey information provided suggests that coral communities between Nuutele Rocks and Papaloa Point were significantly affected by the crown-of-thorns starfish outbreak in 1978. However, the starfish was uncommon between Cape Matatula and Maliuga Point. A large population of crown-of-thorns starfish was observed on the forereef slopes between Nuutele Rocks and Papaloa Point in June, 1978. Live coral was abundant among aggregations of the starfish. By August and September, 1979, only a small percentage of corals on the upper reef front remained alive (Aecos and Aquatic Farms, 1980). In the vicinity of Cape Matatula, living corals were observed at depths of 6 to 33 feet in August and September, 1979. The crown-of-thorns starfish was uncommon during the same period. The crown-of-thorns starfish was not observed on the forereef slopes off Tula Village in early and mid-1978. This starfish was also sparse on the upper reef front at depths of 6 to 33 feet in August/September 1979. In this area, about 70 percent of the coral heads were alive. Wildlife Resources No significant wildlife habitat is known to be located in this watershed. Shoreline Protection Papaloa Point to Cape Matatula The coastal area between Papaloa Point and Cape Matatula is exposed to northerly swells and storm waves. The fringing reef in the nearshore waters helps dissipate some of the energy that is associated with incoming waves. Despite the presence of a significant fringing reef, the shoreline of this embayment has historically been influenced by hurricanes, tropical storms, and stormwaves. Between 1840 and 1991, ten hurricanes with sustained winds over 75 miles per hour are believed to have occurred in American Samoa. In contrast, some 42 tropical storms, which were characterized by winds between 40 and 75 miles per hour, occurred in the Territory during the same period (Sea Engineering and Belt Collins Hawaii, 1994).

Tula, Page 17-9
The shoreline contains a coral and basaltic cobble beach on the east side of Papaloa Point. Otherwise, the shoreline is characterized by basaltic rock. The area contains only few building structures that are situated between 10 and 20 feet above mean sea level. No shoreline protection facilities have been constructed along the shoreline. Cape Matatula to Maliuga Point A 2,000–foot long sand beach, with scattered coral fragments is evident along the shoreline that fronts Tula Village. Loose coral boulder walls provide some limited protection to the elementary school and few residences behind the north end of the beach. In recent years, Hurricane Val generated significant damage to the primary shoreline roadway, particularly south of Tula Village. In the vicinity of Maliuga Point, Sea Engineering observed that “…there is “an unprotected reach approximately 200 feet long in front of a church and basketball court. Fallen coconut trees and undermined patches of grass are evidence of a relatively recent 10-foot retreat in the shoreline. An active 4-foot high erosion scarp is present, consisting easily of erodable sand and coral fragments. The scarp is within three feet of the road in places” (Sea Engineering, Inc. and Belt Collins Hawaii, 1994). Groundwater and Surface Drinking Water Supplies Groundwater Supply and Quality ASPA operates a satellite water system in Tula Village. This system, which was completed in 1990, consists of three groundwater wells (ASPA wells 40, 104, and 108), a 19,000 gallon water storage tank, and a 4-inch distribution system. Ground water samples collected from Tula well #104 on July 5, 1989 and well #108 on May 3, 1989 (USGS, 1993; STORET, 1996) showed no evidence of colliform bacteria. The groundwater wells continue to be chlorinated through the use of batched solution of liquid bleach and water. The May, 1989 sample for well #108 did exceed the USEPA's maximum contaminant level (MCL) for trihalomethanes that likely resulted from chlorination of the well water. However, no evidence of contamination by major ions, metals, pesticides, or volatile organic compounds, other than trihalomethanes, was found. During the May, 1996 survey, a sizeable dump area of solid waste material was discovered on the south side of ASPA wells #40 and #108. While the dump is somewhat downslope of the wells, its close proximity to the wells could lead to the potential introduction of contaminants into the groundwater supplies, as well as the surface water resources of Vailoa Stream. Surface Water Supply and Quality Tula Village no longer uses surface water resources in the watershed for drinking water or other potable water uses. Proposed Water System Improvements The draft ASPA Utilities Master Plan calls for an upgrade of the existing satellite water system to accommodate future water demands in Tula. The Plan indicates that there is a need to conduct a leak detention survey of the Village, as well as the construction and installation of the following improvements:
• Construct two new groundwater wells upslope of existing wells within the Vailoa Stream drainage area (Figure 17-3);
• Install chlorination equipment at each new well;


Tula, Page 17-11
• Construct a 90,000 gallon water storage tank and abandon the existing storage tank; • Construct 800 feet of 4-inch PVC transmission main between the new wells and the new storage
tank; • Construct 2,800 feet of 6-inch PVC main between the new storage tank and the village shoreline; • Install 1,000 feet of 6-inch PVC branches to new fire hydrants. USE OF THE WATERSHED Resident Population Between 1980 and 1990, the resident population of Tula Village increased from 347 to 423 residents. Such growth represented an average annual growth rate of about 2.19 percent. Development activity between 1990 and 1995 increased resident population to about 564 persons. Land Uses Residential The 1990 Census documented 62 housing units in Tula. About 87 percent of the housing units are owner-occupied. Rental units include about 10 percent of the housing stock; the remainder of the homes are vacant or vacation homes for owners living outside of the village. ASG Building Division records indicate that 15 building permits were issued for new residential housing in Tula. Consequently, the 1995 housing stock includes about 77 houses. The primary residential concentration is located near the center of the Village adjacent to Vailoa Stream. Agriculture During the May, 1996 survey, agricultural production was observed in several footage that were situated in the vicinity of Tula Village. The largest agricultural production area is located on the west side of the Tula wetland between about the 25 and 100-foot contour. Two piggeries were documented along the south side of the Village near the bottom of Toiloto Ridge and Saililagi Ridge. Commercial In 1995, eight commercial enterprises were based in Tula. Half of these businesses were retail stores; the remainder of these enterprises represented bus transportation services. Industrial No industrial operations are located in Tula in 1995. Public Facilities The ASG Department of Education does not offer an early childhood education program in Tula. Elementary school-aged children attend Matatula Elementary School in Tula. This facility is in poor condition and incurred significant damage during Hurricane Val in December, 1991. Nevertheless, the September, 1994 enrollment at Matatula Elementary was 267 students. High school students attend Fagaitua High School in nearby Fagaitua Village.

Tula, Page 17-12
Use of the Nearshore Waters Nearshore Fishing A 30-year resident of Tula, Tau Haro, observed in May, 1996 that about 20 to 30 people per day fish the nearshore waters that adjoin the Tula watershed from Monday through Friday. However, on a typical Saturday, fishing in the nearshore waters diminishes to about 10 persons per day. He noted that local residents consume a significant amount of fish, which is in contrast to most villages on Tutuila. An American Samoa Subsistence Fishing Survey was conducted by the University of Hawaii Sea Grant Program in the summer of 1992. This survey involved onsite interviews with shoreline users who were participating in fishing activities on selected days during that period. The results of the survey revealed, in part, that there is considerable use of the nearshore waters in the reefs off Tula. Some 30-40 persons were documented fishing on the reef seaward of Tula Village. Fishing methods that were observed included the use of rod and reel, spear, gleaning, and hook-and-line. Swimming/Bathing About 20 persons use the nearshore waters for swimming and general recreation. RESOURCE MANAGEMENT ISSUES Future Land Uses to the Year 2015 Residential Between 1990 and 1995, residential expansion occurred at an average annual rate of almost five percent. ASPA believes that the 1996-2020 period will grow at a significantly lower rate of about 1.2 percent per year. Virtually all lands within the existing residential area, which is adjacent to the primary shoreline roadway, has already been developed. Future development is expected to move upland along existing dirt trails. During the next 20 years, ASPA believes that about 19 homes will be built upland of the existing village in the following anticipated sequence of development.
1996-2000 Five new single family homes inland of the existing residential area between the 15 and 25-foot elevation.
2001-2005 Five new single family homes inland of the existing residential area between the 15 and 25-foot elevation.
2006-2010 Four new single family homes inland of the existing residential area between the 15 and 25-foot elevation.
2011-2015 Five new single family homes inland of the existing residential area between the 15 and 25-foot elevation.
The cumulative effect of this prospective residential growth is that the village housing stock will increase to roughly 96 housing units in the year 2015. During the same period, it is believed that the average household size will have gradually decreased to approximately 6.26 persons per household. Consequently, the future village population is expected to include an estimated 601 persons in the year 2015.

Tula, Page 17-13
Commercial Limited commercial facility expansion is anticipated during the next 20 years. Some renovation and expansion of existing commercial buildings will likely occur to respond to growing village demands for imported foods and other household amenities. It is anticipated that two retail stores will be constructed between 2006-2010.
Hotel and Visitor Accommodations
During the early 1990’s, a local entrepreneur proposed to build a 100-room hotel facility between Papaloa Point and the main village area. Two small water storage tanks were built upon an undeveloped property on the upland side of the primary shoreline roadway. However, financing was never obtained for the project.
No hotel facility that contains 100 rooms appears to be feasible at this location. The hotel site does not have direct access to a sandy beach.
The views and general shoreline setting of this site are desirable. The development of a smaller bed and breakfast operation that contains between three and 10 rooms is believed to be a more reasonable investment. Bed and breakfast patrons are typically more experienced travelers that are attracted to unique settings even if they are distant from the Airport, commercial shopping areas, restaurants, and public services. It is believed that a seven room bed and breakfast operation will be established in this location between 2006 and 2010.
Industrial Despite modest increases in future resident population, no additional light industrial operations or facilities are anticipated during the next 20 years. The lack of developable land that would be suitable for industrial activities is the primary constraint to future industrial development in this community. Public Facilities Population characteristics for Tula in 1990 suggest that approximately eight percent of the village population is between three and four years of age. Elementary school-aged children (5 and 13 years old) include about 21 percent of the village population; high school students represented about 12 percent of the population. The application of 1990 population characteristics to the anticipated 2015 village population suggest increased student enrollments in future early childhood, elementary education, and high school programs outside of Tula. Anticipated student enrollments from the village population are expected to be as follows in the year 2015:
• early childhood education 48 students • elementary school 126 students • high school 72 students Impact of Future Population Growth Upon Water Consumption and Waste Generation Future population growth and changes in land use in the Tula watershed will increase the volume of future wastewater and solid wastes that are generated by local residents. Wastewater generation, for example, is expected to rise from about 29,646 gallons per day (gpd) in 1995 to 39,165 gpd in the year 2015 (American Samoa Power Authority, 1996). The consumption of potable water will also increase with a growing population. The American Samoa Power Authority (ASPA) estimates that the average day demand for water in Tula was about 42,352 gallons in 1995. By the year 2015, ASPA anticipates that the average demand will increase to roughly 55,950 gpd.

Tula, Page 17-14
Flood Potential A flood insurance study of American Samoa and related flood insurance rate maps were published by the U.S. Federal Emergency Management Agency (FEMA) in 1991. The study evaluated selected geographical locations throughout the Territory. Hydrologic and hydraulic analyses that were presented in the study were made by the U.S. Army Corps of Engineers, Pacific Ocean Division. A detailed study was apparently made of the lower Vailoa Stream drainage in the Tula watershed. Inland Flood Potential Much of Tula Village is identified as a potential 100-year flood hazard area. In general, flood profiles developed for the lower reaches of Vailoa Stream indicate potential 100-year flood elevations of approximately 10 feet above mean sea level. This potential flood elevation nears the elevation of Matatula Elementary School. The Tula wetland is situated between 7 and 8 feet above mean sea level; the overflow of this area could impact adjoining residences. The remaining upland and shoreline areas of the Tula watershed have been designated by the Federal Emergency Management Agency (FEMA) as “zone x.” This designation indicates that the area is outside of the 100-year floodplain. In essence, FEMA is suggesting that the flood hazard potential is limited in these areas. Coastal Flood Hazards The flood insurance rate map for the Tula watershed indicates that there is a coastal flood hazard through much of the nearshore waters and adjoining shoreline. A potential 100-year flood is estimated to generate flood levels between two and three feet above mean sea level. Three foot coastal flood levels are identified for the shoreline between Cape Matatula and Papaloa Point. The coastal waters that front Tula Village are given a 100-year flood potential of two feet above mean sea level. Potential 100-year tsunami elevations have also been estimated by the U.S. Army Corps of Engineers for the following shoreline locations:
• Shoreline at Papaloa Point: 2.7 feet above mean sea level (MSL); • Shoreline at Pisiula Point (Cape Matatula): 2.5 feet above MSL; and, • Shoreline at Maliuga Point – 2.4 feet above mean sea level (MSL); Since the villages are set back from the shoreline, the preceding estimates of potential tsunami flood elevations suggest that communities would sustain limited damage from the inundation associated with a potential 100-year tsunami. Stormwater Runoff/Sedimentation and the Relationship to Surface Water Quality Storm runoff from Maupua Stream, Vailoa Stream, and Sinavevela Stream likely generate some increased turbidity and sedimentation levels in the nearshore waters that adjoin the Tula watershed. These conditions primarily occur during or following after heavier rainfall periods. It is believed that natural sedimentation is the primary source of downstream sedimentation in the watershed. Portions of the surface runoff from the Vailoa Stream drainage are discharged into the Tula wetland. The wetland affords the deposition of sediments that are carried downstream with turbid stormwater flows. For this reason, ASEPA should investigate potential opportunities to divert a greater proportion of the stormwater in the Vailoa Stream drainage into the Tula wetland. The capability of the Tula wetland to accommodate additional runoff should be verified through the computer modeling of, at least, the Vailoa Stream drainage.

Tula, Page 17-15
It is also important that traditional leaders of Tula Village be encouraged to restrict any further filling of the wetland for residential development. During a survey of the watershed in May, 1998, Pedersen Planning Consultants observed that copra and other material had been used to fill the northeast side of the Tula wetland. Nearshore Water Quality and the Marine Environment The nearshore waters that adjoin the watershed are somewhat impacted by natural sedimentation, urban runoff, inadequately treated wastewater from cesspools and septic tanks, a limited discharge of piggery wastes, as well as wave action and nearshore currents. It is believed that natural sedimentation from upland slopes, as well as wave action and nearshore currents, are presently the primary influences upon nearshore water quality in the Tula watershed. While all of these influences are expected to continue, greater impact is expected from increased wastewater discharges. This impact will stem from increased residential development and the general inability of all soils in the watershed to adequately support soil-based wastewater treatment. Consequently, increased nutrient contributions to the nearshore waters should be an important resource management consideration. In this regard, the continued functionality of the Tula wetland remains as the most practical opportunity for maintaining desirable water quality in the nearshore waters. Coral communities are significantly dependent upon the availability of light and related photosynthesis, and occasional periods of significant turbidity and sedimentation do not promote long-term coral nutrition, growth, reproduction, and depth distribution (Richmond, 1993). When corals fertilize, they are free-swimming. Consequently, they need a good location to settle and make a good attachment. With significant soil deposition, sediments can physically interfere with the recruitment of coral larvae (Richmond, 1993; Dashbach, 1996). Coral communities are an important component of the overall ecology of the nearshore waters that adjoin the Tula watershed. They provide shelter to fish, invertebrates, and other marine organisms. Some of these resources represent a supplemental food source for residents of Tula. Groundwater and Surface Water Supplies The quality of groundwater supplies of the Tula watershed can be improved through the immediate relocation of the existing solid waste dump near ASPA wells #40 and #108, or the establishment of a solid waste transfer station in a suitable distance away from the wells. In the long term, long-term water quality and future water consumption demands can be addressed through the development of two, new groundwater wells at higher elevations within the Vailoa Stream drainage. MANAGEMENT NEEDS AND RECOMMENDATIONS The primary focus of future resource management in the Tula watershed will be to:
• Increase the function of the Tula wetland area and evaluate the potential opportunity to direct a greater proportion of stormwater flows from the Vailoa Stream drainage into the wetland.
• Increase sanitation in the vicinity of ASPA’s groundwater wells through the relocation of the existing solid waste dump and/or the establishment of a solid waste transfer station.
Representatives of participating public agencies should make periodic visits to the watershed to observe, document, and monitor selected resource conditions, determine potential methods of correcting a potential hazard or undesirable conditions, share potential solutions with a designated resident of Tula, and encourage the village’s implementation of resource management solutions.

Tula, Page 17-16
The scope of issues that should be addressed by each agency in the field is summarized in Table 17-2. The general focus of recommended technical assistance is also identified. The experience and insights of agency representatives will determine the specific methodology to be used in the field. TABLE 17-2 RECOMMENDED FOCUS OF FUTURE TECHNICAL ASSISTANCE TULA WATERSHED
Participating Public Agency
Resource Management Issue
Focus of Technical Assistance
ASEPA Facilitate a coordinated resource management effort within the watershed.
1. Coordinate overall watershed management activities. 2. Hold periodic meetings with participating ASG and federal agencies to discuss, prioritize, and schedule resource management activities. 3. Coordinate program efforts with local traditional leaders and/or designated resident of the watershed. 4. Make annual assessment of resource management program.
ASPA Upgrade the satellite water system in Tula
1. Design plans for new groundwater wells and other water system improvements. 2. Construct proposed improvements.
ASDPW Reduce potential contaminants to groundwater supplies
Remove all solid waste material that has dumped in the vicinity of ASPA wells 40 and 108 in conjunction with labor from Tula Village
ASDOC Monitor changes in population and land use
Annually map type and location of land uses in village and estimate resident population.
ASDOC/CZMP/ASEPA
Increase the function of the existing wetland for stormwater detention
1. Evaluate feasibility of directing greater proportion of stormwater flows from Vailoa Stream to the wetland. 2. Monitor land uses and other potential wetland changes that might impede wetland functions. 3. Discourage filling of Tula wetland for residential purposes. 4. Coordinate desired improvements with traditional Village leaders.
ASCC Land Grant Program
Reduce sedimentation from agricultural activities
1. Determine locations where upslope agricultural activities may be generating some sedimentation. 2. Encourage soil conservation methods with resident growers of subsistence crops.
ASG Dept. of Marine and Wildlife Resources
Sustain health of marine communities in nearshore waters
Monitor changes in coral coverage, fish habitat, diversity and other characteristics along the reef front approximately once every three years.
Source: Pedersen Planning Consultants, 1997

Alao, Page 18-1
ALAO Watershed 18 GEOGRAPHY The Alao watershed is located along the East Coast of Tutuila. The watershed comprises about 0.52 square mile of land area (Figure 18-1). The apex of the Aloa watershed is Olomoana Mountain that rises approximately 1,074 feet above mean sea level. The north and east boundaries of the inland watershed include Maugaleoo Ridge and Tapepe Ridge. Fatutea Ridge actually bisects the Mulivaitele drainage. The south inland boundary of the watershed includes the southeast slopes of Olomoana Mountain and Motusaga Ridge. Along the shoreline, the watershed lies between Maliuga Point and Lealaeli Hill. Otherwise, no embayments or coves characterize the shoreline of the watershed. The Alao watershed contains four stream drainages. Each of these drainages discharge into one of two wetlands in the watershed. However, Vaimumu and Mulivaitele Stream are the only streams in the watershed that ultimately discharge into the nearshore waters. RESOURCES OF THE WATERSHED Soils The U.S. Soil Conservation Service (National Resource Conservation Service) published a Soil Survey of American Samoa in 1984. Selected information derived from this survey provides some useful information for future watershed planning and management (Figure 18-2). Five different soil classifications were identified by the U.S. Soil Conservation Service for lands within the Alao watershed (Table 18-1). TABLE 18-1 SELECTED SOIL CHARACTERISTICS ALAO WATERSHED
Soil Depth To: Land Use Suitability SCS Soil Unit
Name Typical Slope
(Percent)
Flood Runoff Erosion High Water (Feet)
Bed Rock
(Inches)
Soil Based WW
Treatment
Subsistence Ag
Potential
2 Aua very stony silty clay loam
30-60 None Rapid Severe <6 <60 Severe Slope Poor
3 Fagasa-Ofu silty clays
30-60 None Med to Rapid
Mod to Severe
>6 20-40 Severe Slope Depth
Moderate
4 Fagasa family-Lithic Hapludolls-Rock outcrop assoc
70-130 None Very Rapid
Very Severe
>6 20-60 Severe Slope Depth
Limited
8 Leafu silty clay 0-3 Occ Slow Slight 3-5 >60 Severe Flood Wet
Moderate
35 Urban Land-Ngedebus complex
0-5 Occ. Brief
Slow Slight >3.5 >60 Severe Flood Wet Pool Filter
Poor
Source: U.S. Soil Conservation Service, 1984


Alao, Page 18-4
Urban Land-Ngedebus Complex Urban land-Ngedebus complex soils (SCS mapping unit 35) characterizes much of Alao’s inhabited village area and the shoreline area that fronts the watershed. These soils extend about 300 feet inland from the entire shoreline of the watershed. These soils generally comprise coral fragments, sand, cinders and other material that have been graded or filled to support residential, commercial and public facilities in the village area. The Ngedebus soil extends to a depth of 60 inches or more. The surface layer, which extends about 4 inches below ground elevation, typically contains light, brownish-gray and brown sand. The underlying material is characterized by pale brown and light yellow, brown sand. The permeability of Ngedebus soil ranges between six and 20 inches per hour. Surface drainage on this soil is generally slow, and the hazard of potential soil erosion is slight. In some places, the soil is subject to occasional, brief periods of flooding during prolonged, heavy rainfall or during high tide (U.S. Soil Conservation Service, 1984). These soils are generally suitable to support residential and commercial development in areas that are protected from flooding. However, this soil is poorly suited in unprotected areas. In recent years, portions of the village shoreline, e.g., north end of Alao Village, have been subjected to flooding that was generated by Hurricane Val in 1991. Where moderate to higher housing densities occur, the U. S. Natural Resources Conservation Service recommends the use of community sewage systems prevent the potential contamination of groundwater and surface water supplies. Lower housing densities are present throughout Alao Village; the greatest concentration of homes is found between the lower end of the Vaimanu Stream and Mulivaitele Stream drainages. Leafu Silty Clay (0 to 3 percent slopes) Leafu silty clay soils (SCS mapping unit 8) are present in the two taufusi areas in the watershed, as well as the inland portions of the Aloa watershed. This soil is a deep soil that typically extends up to 60 inches in depth. Its permeability ranges between 2 and 6 inches per hour. Runoff from these soils is generally slow and the potential for soil erosion is limited. However, these soils are typically subject to brief periods of flooding during prolonged, heavier rainfall. These soils are moderately suitable for subsistence agriculture. However, this land use is constrained by occasional periods of flooding and general soil wetness. The U.S. Soil Conservation Service estimates that this soil can annually sustain up to 5 tons per acre of erosion without impacting crop productivity (U.S. Soil Conservation Service, 1984). Consequently, the use of these lands for subsistence agriculture is not likely to generate significant downslope erosion. The use of these Leafu soils for residential land uses is not recommended by the U.S. Soil Conservation Service because of the inherent flood potential associated with this soil. The same characteristics also hamper the use of these soils for septic tank systems and related soil-based treatment. Fagasa Family-Lithic Hapludolls-Rock Outcrop Association Steeper upland land areas throughout most of the remaining watershed contain deep, well-drained soils on steep mountain ridges and slopes. The U.S. Soil Conservation Service identifies these soils as part of the Fagasa family-Lithic Hapludolls-Rock outcrop association (SCS mapping unit 4).

Alao, Page 18-5
Since this soil type is a combination of two general soil classifications, soil depths can vary between 20 and 60 inches. The soil represents a combination of silty clay and loam. Since the Fagasa Family-Lithic Hapludolls soil typically occurs on very steep slopes, the potential for surface runoff and erosion are high. The cultivation of subsistence crops on these soils is not considered desirable. However, when cultivation in these soils is necessary, care should be exercised to minimize the amount of exposed soil in cultivated areas. When heavier rainfall events occur, significant erosion of these soils can be expected from undeveloped upslope areas of the watershed. Natural runoff from steeper slopes in the watershed carries water, sediments, and organic debris to downslope drainage courses and streams. Such erosion can readily influence downstream water quality. Aua Very Stony Silty Clay Loam (30 to 60 percent slopes) A small land area along an unnamed, north fork of the Mulivaitele Stream contains Aua very stony silty clay loam soils (SCS mapping unit 2). The same soil is also located in another small area upland of the wetland on the north side of Alao Village. The Aua soils range between seven to 60 inches in depth. The permeability of these soils (between 2 and 6 inches per hour) is moderately rapid. For watershed management purposes, it is important to note that these Aua soils have a high potential for runoff and erosion. This Aua soil is not recommended for agricultural production because of the stoniness of the soil, the high erosion potential, and hazards associated with subsistence crop cultivation on steeper slopes. However, when cultivation in these soils is necessary, the use of a mulch or ground cover is recommended to reduce soil erosion in cultivated areas. The U.S. Soil Conservation Service estimates that this soil can annually sustain up to 5 tons per acre of erosion without impacting crop productivity (U.S. Soil Conservation Service, 1984). While the erosive characteristics of this soil generally may not significantly impact subsistence crop productivity, the erosive quality of the soil can be a significant contributor to sedimentation in downslope streams and the nearshore waters. The general characteristics of these Aua soils are also undesirable for individual wastewater disposal systems (U.S. Soil Conservation Service, 1984). These soils contain a significant amount of larger stones that hamper installation and provide inadequate soil treatment. Fagasa-Ofu Silty Clays Along the upper slopes associated with Vaialili Stream drainage, there are soils that are identified by the U.S. Soil Conservation Service as Fagasa-Ofu Silty Clays (SCS mapping unit 3). The soil ranges between 20 to 40-inches in depth. The permeability of this silty clay loam is moderately rapid (2 to 6 inches per hour). The potential for surface runoff from these soils is considered moderate to rapid. However, the potential for erosion is moderate to severe. The U.S. Soil Conservation Service indicates that this soil type is somewhat suitable for the production of subsistence crops. The soil can annually sustain from one to 5 tons per acre of erosion without impacting crop productivity. However, the Soil Conservation Service recommends the use of mulch, crop residues, and cross-slope farming to reduce the potential for soil erosion.

Alao, Page 18-6
Streams Stream Locations Vaimumu Stream, which is situated in the northeast part of the watershed, originates about 245-feet above mean sea level. A wetland located on the north side of Aloa Village receives stormwater from this drainage prior to its discharge into the nearshore waters. A combination of groundwater and surface water from Fatutea Spring, Alili Spring and an unnamed tributary on the northeast side of Fatutea Ridge generate a surface discharge of fresh water into the Mulivaitele Stream drainage. A segment of this drainage forms or passes along the east margin of the taufusi on the west side of Alao Village. The overflows from the wetland on the west side of Alao Village also drain into Mulivaitele Stream. Mulivaitele Stream continues through the central part of the Village and ultimately discharges into the nearshore waters. Vaifusi Stream begins at about the 250-foot contour on the west side of Alao Village. This stream empties into the taufusi on the west side of Alao Village. Vaialili Stream originates about 680 feet above mean sea level and is joined by an shorter tributary along the south side of Alili Ridge. These combined flows discharge into the wetland on the west side of Alao Village. Stream Flows Within the Watershed Between 1958 and 1976, two low-flow, partial-record stations were located on tributaries of Mulivaitele Stream. One station along Vaialili Stream (No. 16965000) was situated approximately 0.2 mile upstream from the confluence with Vaifusi Stream. Data from 18 measurements enabled the U.S. Geological Survey to estimate a median flow of 0.08 cubic feet per second (cfs). A second station along Vaifusi Stream (No. 16966000), about 400 feet upstream of the stream mouth, provided 17 measurements between 1958 and 1975. Data gained from these measurements led the U.S. Geological Survey to estimate a median flow of 0.02 cfs (Wong, 1996). Surface Water Quality Streams Surface water quality data was collected by ASEPA for the village water system in FY 1994. Stream samples were collected from either Vaialili Stream or Vaifusi Stream. Available data suggests that one or both of these streams have historically been characterized by moderate to higher levels of bacterial contamination (35 to 80 total coliforms per 100 ml) and considerable turbidity (from 1.0 to 2.4 NTU). No water quality data exists beyond January, 1995. Nearshore Waters No surface water quality data is available for the nearshore waters that adjoin the Alao watershed. Wetlands Fresh-Water Marsh North of Village A fresh-water marsh is located at the north end of Alao Village. The marsh, as stated earlier, receives surface runoff from the Vaimumu Stream drainage. Standing water was observed in the marsh in May 1996.
Alao, Page 18-7
Primary herbaceous plant species within the freshwater marsh include Ludwigia octovalis, and sour paspalum. The outer fringes of the marsh contain beach hibiscus, fau, as well as banana and coconut trees (Biosystems Analysis, Inc., 1992). Existing residential development on the north side of Alao Village is located on the east margins of the wetland. Such development somewhat impedes the effectiveness of the wetland. Traditional leaders of Alao should be encouraged to curtail residential expansion in this area to ensure the long-term functions of this wetland. Fresh-Water Wetland West of Village A second taufusi, or wetland, on the west side of Alao Village represents a fresh-water wetland. Whistler documented an extensive cultivation of taro in 1976. Biosystems Analysis, Inc. noted in 1992 that this wetland was used for taro cultivation, as well as the presence of willow primrose. However, no evidence of taro cultivation was observed by Pedersen Planning Consultants in May 1996. Further, local traditional leaders from Alao indicated that this taufusi has not been used for taro production since about 1985 (Puaauli and Puaauli, 1996). The marsh on the west side of the Village contained little water in May, 1996. The lack of drainage into the taufusi may be the result of the alteration and re-routing of natural drainage courses into this wetland. This wetland may be showing some early signs of eutrophication. Importance to Flood Control and the Reduction of Downstream Sedimentation Both wetlands in Alao provide important functions in the watershed environment:
• The detention of stormwater flows and reducing flood potential within Alao Village; and, • The settlement, deposition, and filtering of sediments from upland stormwater flows before their
discharge into the nearshore waters. Marine Resources Coral Communities The fringing reef that adjoins the watershed ranges between 500 to 700 feet seaward of the shoreline. The most recent survey of this reef was made in August-September, 1979. During that period, a sparse concentration of the crown-of-thorns starfish was observed in the upper reef front (at depths of 6 to 33 feet) off Maliuga Point. Approximately 75 percent of the corals were alive (Aecos and Aquatic Farms, 1980). Wildlife Resources The rare Australian gray duck has occasionally been sighted in the vicinity of Maliuga Point (Aecos and Aquatic Farms, 1980). Shoreline Protection From the month of June through November, the coastal area between Maliuga Point and Matuli Point is predominantly exposed to easterly and southeasterly waves that are generated by prevailing tradewinds. From December through May, wave exposure primarily is from the northeast, east, and southeast. The fringing reef in the nearshore waters helps dissipate some of the energy that is associated with incoming waves.
Alao, Page 18-8
Despite the presence of a significant fringing reef, the shoreline of this embayment has historically been influenced by hurricanes, tropical storms, and stormwaves. Between 1840 and 1991, ten hurricanes with sustained winds over 75 miles per hour are believed to have occurred in American Samoa. In contrast, some 42 tropical storms, which were characterized by winds between 40 and 75 miles per hour, occurred in the Territory during the same period (Sea Engineering and Belt Collins Hawaii, 1994). The shoreline was most recently influenced by higher winds associated with Hurricane Val in December, 1991. At the shore on the north end of Alao Village, the sand and coral shoreline contains an erosion scarp that is identifiable by undercut coconut trees with exposed roots (Sea Engineering and Belt Collins Hawaii, 1994). Because of its proximity to the primary shoreline roadway, potential beach stabilization measures are necessary and require further evaluation by the ASG Department of Public Works. A two-foot grouted wall is located in front of Aloa Village. This wall extends about 850 feet along the shoreline and supports an existing sidewalk (Sea Engineering and Belt Collins Hawaii, 1994). At the south end of Alao Village (just north of Lealaeli Hill), an erosion scarp in the backshore of the shoreline is undermining the concrete sidewalk that is located near the primary shoreline roadway. While a loose coral and basaltic wall has been constructed along the sidewalk, further evaluations of this erosion problem need to be made by the ASG Department of Public Works. The cove located between Lealaeli Hill and Matuli Point contains a small pocket beach. Along the backshore of the beach, a loose rock wall that provides some protection to two housing units (Sea Engineering and Belt Collins Hawaii, 1994). Groundwater and Surface Water Supplies Groundwater Supply and Quality ASPA operates and maintains a satellite water system in Alao Village. This system includes two groundwater wells (ASPA wells #161 and 162). Well 161 is chlorinated. Both wells produce approximately 18 gallons per minute, or about 16,000 gallons per day. Well #161 contained elevated levels of chloride in August, 1994. The installation of a smaller 2 horsepower pump by ASPA in October, 1994 resulted in a significant reduction of chlorides (ASPA, 1995). Surface Water Supply and Quality Alao Village maintains a surface water system that is occasionally used by residents as a drinking water supply. The village water system includes two stream catchments. One stream catchment is located along Vaialili Stream at about the 100-foot contour. A second catchment is situated along Vaifusi Stream approximately 75 feet above mean sea level. Prior to the establishment of new groundwater wells in Alao, available water quality data from FY 1994 suggests that the village system has historically been characterized by moderate to higher levels of bacterial contamination (35 to 80 total coliforms per 100 ml) and considerable turbidity (from 1.0 to 2.4 NTU). No water quality data exists beyond January, 1995. Proposed Water System Improvements In its draft Utility Master Plan, ASPA desires that Alao Village rely entirely upon ground water as its source for drinking water and other potable uses. To accomplish this objective, ASPA recommends the following water system improvements (Figure 18-3):

Alao, Page 18-10
• Construction of a new groundwater well; • Installation of chlorination equipment at well 162 and the new well; • Installation of a pump control telemetry system; • Construction of approximately 1,000 feet of 4-inch PVC transmission main between the existing
4-inch distribution main and the 100,000 gallon storage tank, as well as between the new well and 100,000 gallon storage tank;
• Construction of approximately 1,400 feet of 6-inch main between the storage tank and the 6-inch main along the primary shoreline roadway;
• Construction of approximately 700 feet of 6-inch main along the primary shoreline roadway to connect the existing 6-inch mains together; and,
• Installation of seven fire hydrants. USE OF THE WATERSHED Resident Population Between 1980 and 1990, the resident population of Alao Village increased from 264 to 463 residents. This growth represented an average annual growth rate of about 7.5 percent. Development activity between 1990 and 1995 increased resident population to about 649 persons. Land Uses Residential The 1990 Census documented 61 homes in Alao Village. All homes were owner-occupied; none were rental units. The Village is situated primarily along the west side of the primary shoreline roadway. Most of the homes are located behind the center of the beach. Residential densities are about two units per acre. ASG Building Division records indicate that 27 building permits were issued for new residential structures from 1990 and 1994. Consequently, the 1995 housing stock included approximately 88 housing units. Agriculture There are, at least, five areas of agricultural production in the Alao watershed that primarily include subsistence crops such as banana, breadfruit, and taro. These areas include:
• Three faatoaga north of Alao Village. • One agricultural area on the west side of wetland west of the Village; • One agricultural area south of Vaea Hill Only one piggery operation was observed in May, 1996 along the north side of Mulivaitele Stream (east of the wetland). However, local chiefs indicate that there are eight to ten piggeries along Vaifusi Stream and the lower slopes of Fatutea Ridge. Each piggery contains only a few pigs (Puaauli and Puaauli, 1996). ASEPA should re-survey the Vaifusi Stream drainage to ensure that well 162 is not being contaminated by any piggery wastes. In the event that any piggery wastes may be impacting the groundwater quality of well 162, the ASG Department of Agriculture should provide technical, onsite guidance to appropriate family representatives.

Alao, Page 18-11
Commercial In 1995, there were seven commercial enterprises that operated in Alao Village. Two of the establishments were village stores; the remaining five operated bus or taxi services. Industrial In 1995, no industrial services operated in Alao Village. Public Facilities The ASG Department of Education offers an early childhood education program in Alao. In September, 1994, this program was attended by 25 younger children. Elementary school-aged children attend Olomoana Elementary School in Aoa. High school students attend Fagaitua High School in Fagaitua. Use of the Nearshore Waters Nearshore Fishing Informal discussions with two local matai indicate that about two or three people use the nearshore waters for shoreline fishing each day. An additional two to three people harvest fish from the nearshore waters via diving underwater with spears (Puaauli and Puaauli, 1996). An American Samoa Subsistence Fishing Survey was conducted by the University of Hawaii Sea Grant Program in the summer of 1992. This survey involved onsite interviews with shoreline users who were participating in fishing activities on selected days during that period. The results of the survey revealed, in part, that there is some use of the nearshore waters in the reefs off Alao. Some 18-28 persons were documented fishing on the reef seaward of Alao Village. Fishing methods that were observed included the use of rod and reel, gill net, throw net, hook-and-line, gleaning, and diving. Swimming and General Recreation An average of 10 people use the nearshore waters for swimming, bathing and general recreation. About one to three times per month, two people usually visit the Village and use the nearshore waters on Sundays for board surfing (Puaauli and Puaauli, 1996). RESOURCE MANAGEMENT ISSUES Future Land Uses to the Year 2015 Residential Some residential expansion is expected to occur in Alao during the next 20 years. It is anticipated that future residential growth will average about 2.4 percent per year. Such growth will be significantly less than the average annual residential growth that occurred between 1980 and 1990 (7.5 percent), and considerably less than the annual rate of growth, i.e., 6 percent, from 1990 through 1994. Future residential expansion in Alao is hampered by fairly significant surface drainage, wetland areas, and related saturated soils. Future residential expansion is anticipated in three locations. ASPA believes that these developable lands will be gradually developed during the 1996-2015 period.

Alao, Page 18-12
Potential residential expansion is possible at the south end of the Village. About 21 single family units could be developed within the existing faatoaga (plantation) which is situated upland of the existing residential area. Such a development would require the construction of a dirt trail system west of the primary shoreline roadway. The upland portions of the central village also contain a deep valley that can accommodate about seven housing units. Most of this area is presently devoted to faatoaga activities. The central part of the Village is situated between Vaea Hill and Vaimanu Stream below the 25-foot elevation. Within this area, the development of 15 additional housesites appears feasible despite constraints posed by drainage courses. At the north end of the village, lands are generally unsuitable for residential development. Saturated soils are more productive for taro production and other subsistence farming. The amount of developable land area in this village will continue to make it attractive for future residential development. However, the availability of land in this village will likely depend upon villagers’ reliance upon subsistence crops for consumption. The anticipated residential development in the faatoaga assumes that existing and future village residents will gradually rely less upon subsistence crops for consumption. It is believed that the in-migration of American Samoans from the continental United States and Hawaii, as well as rapidly changing lifestyle patterns, will significantly reduce the demand for land that can be cultivated for subsistence purposes. At the same time, it is assumed that a minority of residents will continue their participation in subsistence agriculture. During the next 20 years, ASPA believes that these potential development opportunities and constraints will generate the following sequence and volume of residential construction.
1996-2000 Three new single new single family homes at the south end of the Village between the shoreline and the 25-foot elevation.
Seven new single family homes in the central village area between Vaea Hill and Vaimanu Stream (between shoreline and 25-foot elevation).
Three new single family homes upland of the central village and northwest of Taufusi Marsh (between 30 and 50-foot elevation).
2001-2005 One new single new single family home at the south end of the Village between the shoreline and the 25-foot elevation.
Eight new single family homes in the central village area between Vaea Hill and Vaimanu Stream (between shoreline and 25-foot elevation).
One new single family home upland of the central village and northwest of Taufusi Marsh (between 30 and 50-foot elevation).
2006-2010 Eight new single new single family homes at the south end of the Village between the shoreline and the 25-foot elevation.
Two new single family homes upland of the central village and northwest of Taufusi Marsh (between 30 and 50-foot elevation).
2011-2015 Nine new single new single family homes at the south end of the Village between the shoreline and the 25-foot elevation.
One new single family home upland of the central village and northwest of Taufusi Marsh (between 30 and 50-foot elevation).
The cumulative effect of this prospective residential growth is that the village housing stock will increase to roughly 131 housing units in the year 2015. During the same period, it is believed that the average household size will have gradually decreased to approximately 6.29 persons per household. Consequently, the future village population is expected to include about 824 persons.

Alao, Page 18-13
Commercial Future commercial development will result from a gradual increase in resident population. It is believed that one laundromat and one retail store will be established during the 2001-2005 period. Two additional retail establishments are expected to begin operations by the 2011-2015 period. Industrial A few industrial services, e.g., auto repair, may be established as part-time home occupations. By the year 2000, it is anticipated that one new home-based enterprise will begin operation. Between 2011 and 2015, two additional home-based businesses are expected to be established. None of the anticipated industrial activities, however, will result in the construction of any industrial facilities in the community. Public Facilities Population characteristics for Alao in 1990 suggest that approximately five percent of the village population is three and four years of age. Elementary school-aged children (5 and 13 years old) include about one percent of the village population; high school students represented about ten percent of the population. The application of 1990 population characteristics to the anticipated 2015 village population suggest increased student enrollments in future early childhood, elementary education, and high school programs within and outside of Alao. Anticipated student enrollments from the village population are expected to be as follows in the year 2015:
• early childhood education 41 students • elementary school 8 students • high school 82 students
Impact of Future Population Growth Upon Water Consumption and Waste Generation Future population growth and changes in land use in the Alao watershed will increase the volume of future wastewater and solid wastes that are generated by local residents. Wastewater generation, for example, is expected to rise from about 8,166 gallons per day (gpd) in 1995 to 47,922 gpd in the year 2015 (American Samoa Power Authority, 1996). The consumption of potable water will also increase with a growing population. The American Samoa Power Authority (ASPA) estimates that the average day demand for water in Alao was about 11,666 gallons in 1995. By the year 2015, ASPA anticipates that the average demand will increase to roughly 68,460 gpd. Flood Potential A flood insurance study of American Samoa and related flood insurance rate maps were published by the U.S. Federal Emergency Management Agency (FEMA) in 1991. The study evaluated selected geographical locations throughout the Territory. Hydrologic and hydraulic analyses that were presented in the study were made by the U.S. Army Corps of Engineers, Pacific Ocean Division. A detailed study was made of Mulivaitele Stream. Inland Flood Potential Flood profiles that were developed for the lower reaches of Mulivaitele Stream suggest that 100-year flood levels may range between 10 and 40 feet above mean sea level (MSL). Because Mulivaitele Stream flows through the more inhabited central village area, a 100-year flood could cause significant damage to property and buildings in the central and south part of Alao Village.

Alao, Page 18-14
Coastal Flood Hazards The flood insurance rate map for the Alao watershed indicates that there is a coastal flood hazard along the shoreline and adjoining nearshore waters. A potential 100-year flood is estimated to generate flood levels of two feet above mean sea level in these areas. A potential 100-year tsunami elevation has been estimated by the U.S. Army Corps of Engineers for Maliuga Point. It is estimated that a tsunami would generate a flood elevation of 2.4 feet above MSL. It is not likely that significant damage would occur since most buildings along the shoreline are situated are located between the five and 10-foot contour. Stormwater Runoff/Sedimentation and the Relationship to Surface Water Quality Storm runoff from the four streams in the Alao watershed likely generate some increased turbidity and sedimentation levels in the nearshore waters. These conditions primarily occur during or following after heavier rainfall periods. It is believed that natural sedimentation is the primary source of downstream sedimentation in the watershed. All surface runoff carried by the four streams are initially discharged into one of two wetlands in Alao. These wetlands afford the deposition of sediments that are carried downstream with turbid stormwater flows. At the same time, local matai indicate that there is a considerable amount of sheet flow from Fatutea Ridge that never drains into the wetland west of the Village. These stormwater flows often generate localized flooding in portions of the central village area. Traditional leaders indicate that the diversion of stormwater flows from Fatutea Ridge away from the wetlands results from the alteration and rerouting of natural drainage courses. In this context, ASEPA should investigate potential opportunities to divert a greater proportion of the stormwater into the wetland that is located west of Alao Village. The capability of this wetland to accommodate additional runoff should also be verified through the computer modeling of the entire Mulivaitele Stream drainage. The future collection and analysis of water quality samples from within the wetland and the adjoining nearshore waters would also enable ASEPA to monitor the functionality and effectiveness of both wetlands in the Alao watershed. Nearshore Water Quality and the Marine Environment The nearshore waters that adjoin the watershed are somewhat impacted by natural sedimentation, urban runoff, inadequately treated wastewater from cesspools and septic tanks, the discharge of piggery wastes, as well as wave action and nearshore currents. It is believed that natural sedimentation from upland slopes, as well as wave action and nearshore currents, are presently the primary influences upon nearshore water quality in the Alao watershed. While all of these influences are expected to continue, greater impact is expected from increased wastewater discharges. This impact will stem from increased residential development and the general inability of all soils in the watershed to adequately support soil-based wastewater treatment. Consequently, increased nutrient contributions to the nearshore waters should be an important resource management consideration. The continued functionality of the two wetlands in Alao remains as the most practical opportunity for maintaining desirable water quality in the nearshore waters. Coral communities are significantly dependent upon the availability of light and related photosynthesis, and occasional periods of significant turbidity and sedimentation do not promote long-term coral nutrition, growth, reproduction, and depth distribution (Richmond, 1993).
Alao, Page 18-15
When corals fertilize, they are free-swimming. Consequently, they need a good location to settle and make a good attachment. With significant soil deposition, sediments can physically interfere with the recruitment of coral larvae (Richmond, 1993; Dashbach, 1996). Coral communities are an important component of the overall ecology of the nearshore waters that adjoin the Alao watershed. They provide shelter to fish, invertebrates, and other marine organisms. Some of these resources represent a supplemental food source for residents of Alao. Groundwater and Surface Water Supplies Existing piggeries along Vaifusi Stream should be inspected by ASEPA to evaluate whether or not piggery wastes are influencing the groundwater quality of ASPA well 162. This survey should be correlated with historical water quality data for this well. Should any improvement in waste management be discovered, the ASG Department of Agriculture should, as stated earlier, provide technical assistance to the families that operate piggeries in this area. Residents of Alao who continue to use water from surface water catchment for drinking water and food preparation should be encouraged to construct and use rainwater from individual roof catchment systems. With proper maintenance and occasional chlorination, these systems typically provide a considerably better water quality. MANAGEMENT NEEDS AND RECOMMENDATIONS The primary focus of future resource management in the Alao watershed will be to:
• Discontinue use of surface water catchments for drinking water and other potable water uses. Encourage the use of individual roof catchment systems by households that make use of surface water resources for drinking and other potable uses.
• Develop an improved satellite water system for Alao Village. • Maintain the function of the two existing wetland areas in Alao Village which detain runoff and
reduce the discharge of sediments into the adjoining nearshore waters. Representatives of participating public agencies should make periodic visits to the watershed to 1) observe, document, and monitor selected resource conditions, 2) determine potential methods of correcting a potential hazard or undesirable conditions, 3) share potential solutions with a designated resident of Alao, and 4) encourage participation of traditional leaders and village residents in resource management solutions. The scope of issues that should be addressed by each agency in the field is summarized in Table 18-2. The general focus of recommended technical assistance is also identified. The experience and insights of agency representatives will determine the specific methodology to be used in the field.

Alao, Page 18-16
TABLE 18-2 RECOMMENDED FOCUS OF FUTURE TECHNICAL ASSISTANCE ALAO WATERSHED
Participating Public Agency
Resource Management Issue
Focus of Technical Assistance
ASEPA Facilitate a coordinated resource management effort within the watershed
1. Coordinate overall watershed management activities. 2. Hold periodic meetings with participating ASG and federal agencies to discuss, prioritize, and schedule resource management activities. 3. Coordinate program efforts with local traditional leaders and/or designated resident of the watershed. 4. Make annual assessment of resource management program.
ASPA Develop an improved satellite water system in Alao
1. Design water system improvements. 2. Construct proposed improvements.
ASEPA Reduce potential public health risk associated with bacterial contamination of surface supplies
1. Encourage the construction and use of individual roof catchment systems for households that use stream catchment systems for drinking water and food preparation. 2. If needed, provide technical assistance to local residents concerning construction and maintenance of individual roof catchment systems.
ASDOC Monitor changes in population and land use
Annually map type and location of land uses in village and estimate resident population.
ASEPA/ASDOC/ASCZMP
Increase the functionality of existing wetlands for stormwater detention and the deposition of sediments
1. Monitor land uses and other potential wetland changes that might impede wetland functions. 2. Investigate potential opportunities to divert more stormwater from the slopes of Fatutea Ridge into the wetland west of Alao Village. 3. Model the Mulivaitele Stream drainage and determine its capability to handle increased stormwater flows. 4. Coordinate required improvements with ASEPA and traditional Village leaders.
ASCC Land Grant Program
Reduce sedimentation from agricultural activities
1. Determine locations where upslope agricultural activities may be generating some sedimentation. 2. Encourage soil conservation methods with resident growers of subsistence crops.
ASG Dept. of Marine and Wildlife Resources
Sustain health of marine communities in nearshore waters
Monitor changes in coral coverage, fish habitat, diversity and other characteristics (used by Green) approximately every three years.
Source: Pedersen Planning Consultants, 1997

Auasi, Page 19-1
AUASI Watershed 19 GEOGRAPHY The Auasi watershed is located in the southeast part of the Island of Tutuila. The watershed comprises almost 0.4 square mile of land area (Figure 19-1). The northwest boundary of the Auasi watershed is the summit of Olomoana Mountain; the summit is located approximately 1,074 feet above mean sea level. The southeast slopes of Olomoana Mountain, as well as Motusaga Ridge form the northeast boundary of the watershed. Maugaele Ridge defines the western boundary of the inland watershed. Two smaller ridges comprise the central portion of the watershed. Within these general boundaries, Taugasega Ridge lies immediate upland of the Aganoa residential area near the southwest corner of the watershed. Tiatele Ridge is situated upland of Auasi Village and east of Leafu Stream at about the 340-foot contour. Along the shoreline, the Auasi watershed extends between Matuli Point and Taulaotoga Rock, which is located south of Maugaele Ridge. Faasavaliga Point and the headlands that are east of Vaisa Stream separate the traditional villages of Auasi and Utumea. Discussions with High Chief Fonoti Galu in 1977 indicate that the U.S. Geological Survey misnamed this coastal feature as Maatulaumea Point during (McCoy, 1977). A coastal indentation lies between Taulaotoga Rock and Faasavaliga Point. Auasi Harbor is situated within this coastal area. Three drainages are located within the Auasi watershed. An unnamed stream flows along the East Side of Taugasega Ridge and discharges into the nearshore waters on the north side of Taugamalama Point. Leafu Stream and two unnamed tributaries flow in defined drainage courses along the southern slopes of Olomoana Mountain, and ultimately drain into the nearshore waters. The Vaisa Stream drainage is east of Leafu Stream and carries runoff from Tiatele and Motusaga Ridge through Auasi Village and into the nearshore waters. RESOURCES OF THE WATERSHED Soils The U.S. Soil Conservation Service (National Resource Conservation Service) published a Soil Survey of American Samoa in 1984. Selected information derived from this survey provides some useful information for future watershed planning and management (Figure 19-2). Five different soil classifications were identified by the U.S. Soil Conservation Service for lands within the Auasi watershed (Table 19-1). Urban Land-Ngedebus Complex Urban land-Ngedebus complex soils (SCS mapping unit 35) characterizes much of the inhabited village areas of Utumea and Auasi. These soils extend about 200 to 300 feet inland from the shoreline that fronts these villages. These soils generally comprise coral fragments, sand, cinders and other material that have been graded or filled to support residential, commercial and public facilities in the village areas. The Ngedebus soil extends to a depth of 60 inches or more. The surface layer, which extends about 4 inches below ground elevation, typically contains light, brownish-gray and brown sand. The underlying material is characterized by pale brown and light yellow, brown sand. The permeability of


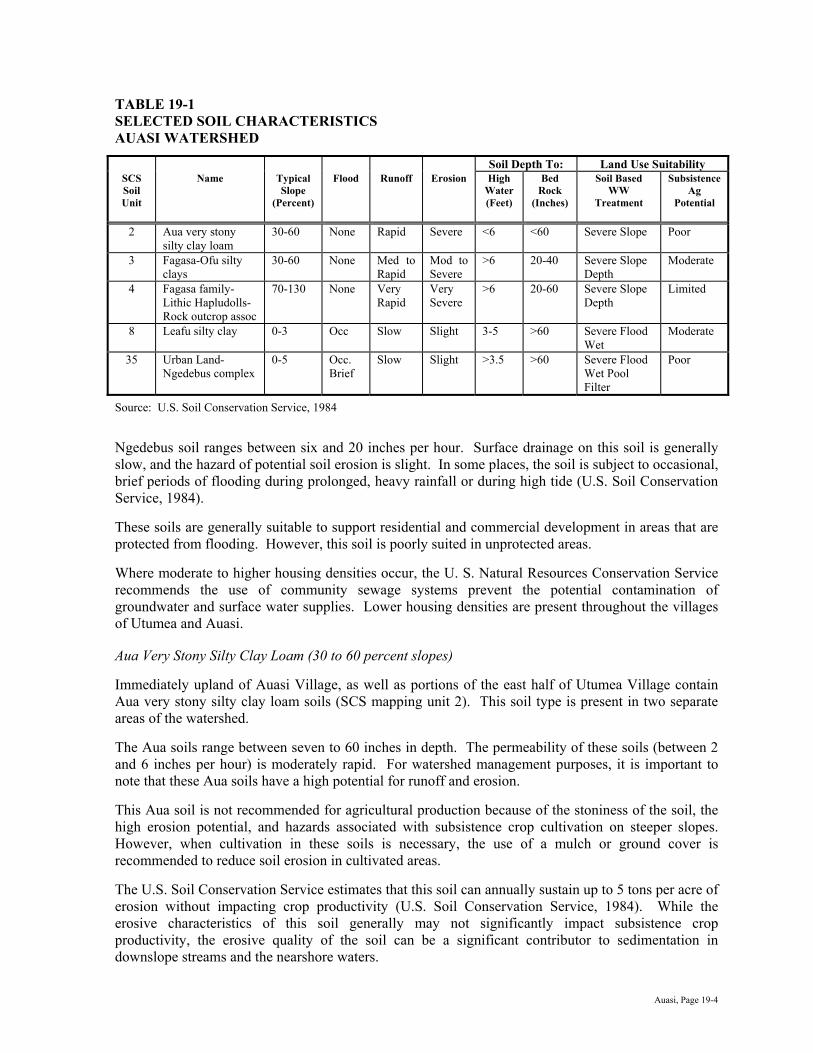
Auasi, Page 19-4
TABLE 19-1 SELECTED SOIL CHARACTERISTICS AUASI WATERSHED
Soil Depth To: Land Use Suitability SCS Soil Unit
Name Typical Slope
(Percent)
Flood Runoff Erosion High Water (Feet)
Bed Rock
(Inches)
Soil Based WW
Treatment
Subsistence Ag
Potential
2 Aua very stony silty clay loam
30-60 None Rapid Severe <6 <60 Severe Slope Poor
3 Fagasa-Ofu silty clays
30-60 None Med to Rapid
Mod to Severe
>6 20-40 Severe Slope Depth
Moderate
4 Fagasa family-Lithic Hapludolls-Rock outcrop assoc
70-130 None Very Rapid
Very Severe
>6 20-60 Severe Slope Depth
Limited
8 Leafu silty clay 0-3 Occ Slow Slight 3-5 >60 Severe Flood Wet
Moderate
35 Urban Land-Ngedebus complex
0-5 Occ. Brief
Slow Slight >3.5 >60 Severe Flood Wet Pool Filter
Poor
Source: U.S. Soil Conservation Service, 1984 Ngedebus soil ranges between six and 20 inches per hour. Surface drainage on this soil is generally slow, and the hazard of potential soil erosion is slight. In some places, the soil is subject to occasional, brief periods of flooding during prolonged, heavy rainfall or during high tide (U.S. Soil Conservation Service, 1984). These soils are generally suitable to support residential and commercial development in areas that are protected from flooding. However, this soil is poorly suited in unprotected areas. Where moderate to higher housing densities occur, the U. S. Natural Resources Conservation Service recommends the use of community sewage systems prevent the potential contamination of groundwater and surface water supplies. Lower housing densities are present throughout the villages of Utumea and Auasi. Aua Very Stony Silty Clay Loam (30 to 60 percent slopes) Immediately upland of Auasi Village, as well as portions of the east half of Utumea Village contain Aua very stony silty clay loam soils (SCS mapping unit 2). This soil type is present in two separate areas of the watershed. The Aua soils range between seven to 60 inches in depth. The permeability of these soils (between 2 and 6 inches per hour) is moderately rapid. For watershed management purposes, it is important to note that these Aua soils have a high potential for runoff and erosion. This Aua soil is not recommended for agricultural production because of the stoniness of the soil, the high erosion potential, and hazards associated with subsistence crop cultivation on steeper slopes. However, when cultivation in these soils is necessary, the use of a mulch or ground cover is recommended to reduce soil erosion in cultivated areas. The U.S. Soil Conservation Service estimates that this soil can annually sustain up to 5 tons per acre of erosion without impacting crop productivity (U.S. Soil Conservation Service, 1984). While the erosive characteristics of this soil generally may not significantly impact subsistence crop productivity, the erosive quality of the soil can be a significant contributor to sedimentation in downslope streams and the nearshore waters.

Auasi, Page 19-5
The general characteristics of these Aua soils are also undesirable for individual wastewater disposal systems (U.S. Soil Conservation Service, 1984). The soils contain a significant amount of larger stones that hamper installation and provide inadequate soil treatment. Leafu Silty Clay (0 to 3 percent slopes) Leafu silty clay soils (SCS mapping unit 8) characterize a portion of the lands on the north side of Utumea Village, as well as the adjoining lower slopes of Motusaga Ridge. This soil is a deep soil that typically extends up to 60 inches in depth. Its permeability ranges between 2 and 6 inches per hour. Runoff from these soils is generally slow and the potential for soil erosion is limited. However, these soils are typically subject to brief periods of flooding during prolonged, heavier rainfall. These soils are moderately suitable for subsistence agriculture. However, this land use is constrained by occasional periods of flooding and general soil wetness. The U.S. Soil Conservation Service estimates that this soil can annually sustain up to 5 tons per acre of erosion without impacting crop productivity (U.S. Soil Conservation Service, 1984). Consequently, the use of these lands for subsistence agriculture is not likely to generate significant downslope erosion. The use of these Leafu soils for residential land uses is not recommended by the U.S. Soil Conservation Service because of the inherent flood potential associated with this soil. The same characteristics also hamper the use of these soils for septic tank systems and related soil-based treatment. Fagasa Family-Lithic Hapludolls-Rock Outcrop Association Steeper upland land areas throughout most of the remaining watershed contain deep, well-drained soils on steeper mountain ridges and slopes. The U.S. Soil Conservation Service identifies these soils as part of the Fagasa family-Lithic Hapludolls-Rock outcrop association (SCS mapping unit 4). Since this soil type is a combination of two general soil classifications, soil depths can vary between 20 and 60 inches. The soil represents a combination of silty clay and loam. Since the Fagasa Family-Lithic Hapludolls soil typically occurs on very steep slopes, the potential for surface runoff and erosion are high. The cultivation of subsistence crops on these soils is not considered desirable. However, when cultivation in these soils is necessary, care should be exercised to minimize the amount of exposed soil in cultivated areas. When heavier rainfall events occur, significant erosion of these soils can be expected from undeveloped upslope areas of the watershed. Natural runoff from steeper slopes in the watershed carries water, sediments, and organic debris to downslope drainage courses and streams. Such erosion can readily influence downstream water quality. Fagasa-Ofu Silty Clays Most of the upland Leafu Stream drainage, as well as the upland slopes of Motusaga Ridge and Tiatele Ridge, contain soils that are identified by the U.S. Soil Conservation Service as Fagasa-Ofu Silty Clays (SCS mapping unit 3). The soil ranges between 20 to 40-inches in depth. The permeability of this silty clay loam is moderately rapid (2 to 6 inches per hour). The potential for surface runoff from these soils is considered moderate to rapid. However, the potential for erosion is moderate to severe.
Auasi, Page 19-6
The U.S. Soil Conservation Service indicates that this soil type is somewhat suitable for the production of subsistence crops. The soil can annually sustain from one to 5 tons per acre of erosion without impacting crop productivity. However, the Soil Conservation Service recommends the use of mulch, crop residues, and cross-slope farming to reduce the potential for soil erosion. Streams Stream Locations A short unnamed stream (Stream 19A) originates at approximately 325 feet above mean sea level on the east side of Taugasega Ridge. This stream receives surface runoff from the southeast slopes of Maugaele Ridge and Taugasega Ridge. Stream flows are discharge into the nearshore waters on the northeast side of Taugamalama Point. Leafu Stream begins on the south slope of Olomoana Mountain at about the 800-foot contour. Upland of Auasi Village and the northwest side of Tiatele Ridge, two unnamed branches of Leafu Stream connect to the main stream course. At about 125 feet above mean sea level, the Leafu Stream drainage returns to one stream course that descends through the lower elevations of Auasi Village before its discharge into the nearshore waters. Vaisa Stream is a short stream course that begins upslope of Auasi Village at about the 300-foot elevation. This drainage receives surface runoff from Tiatele Ridge and Motusaga Ridge and carries drainage through Auasi Village before its discharge into the nearshore waters. Stream Flows Within the Watershed A low-flow, partial-record station (No. 16964000) was installed approximately 0.2 mile upstream from the Leafu Stream mouth between 1958 and 1985. Twenty measurements that were made during this period enabled the U.S. Geological Survey to estimate a median flow of 0.12 cubic feet per second (cfs). A local resident reported in May, 1996 that Leafu Stream flows are perennial. A continuous- record station (No. 16963900) at the same location, between 1972 and 1986, provided data that led the U.S. Geological Survey to estimate a median flow of 0.11 cfs (Wong, 1996). Stream 19A, which flows along the east side of Taugasega Ridge, is characterized by intermittent flows. The stream carries a limited amount of runoff (Masaniai, 1996). Aquatic Fishes and Invertebrates Field surveys of fishes and invertebrates were made by the U.S. Fish and Wildlife Service, Division of Ecological Services, in March-April, 1978 and the U.S. Army Corps of Engineers in August, 1980. Leafu Stream was one of 37 streams in American Samoa that was inventoried by representatives of these federal agencies. Results from both field surveys were summarized in an American Samoa Stream Inventory that was published by the U.S. Army Corps of Engineers, Honolulu District, in July, 1981. Leafu Stream was surveyed in a rocky riffle that was located just upland of a bridge along the primary shoreline roadway (station 14a). The sampling location was situated near the 10-foot elevation. One species of gobie fish was observed at station 14a. However, no mountain bass or eels were identified. One species of shrimp were also documented. However, no mollusks were reported.
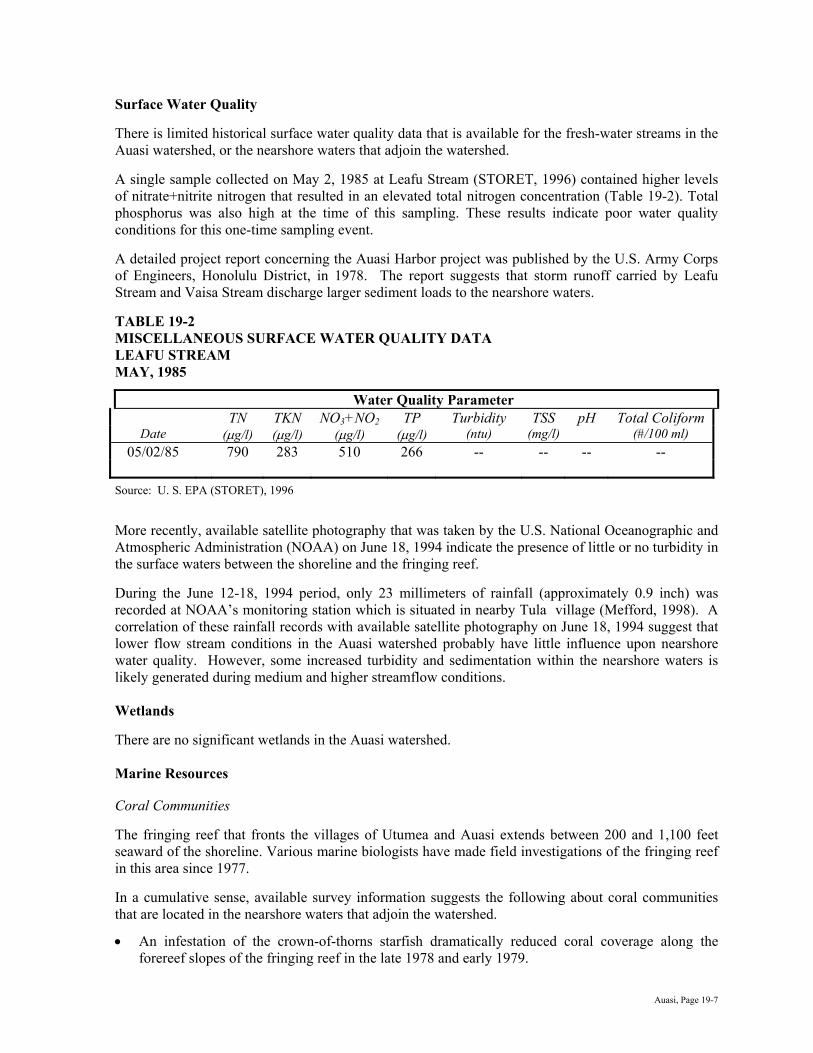
Auasi, Page 19-7
Surface Water Quality There is limited historical surface water quality data that is available for the fresh-water streams in the Auasi watershed, or the nearshore waters that adjoin the watershed. A single sample collected on May 2, 1985 at Leafu Stream (STORET, 1996) contained higher levels of nitrate+nitrite nitrogen that resulted in an elevated total nitrogen concentration (Table 19-2). Total phosphorus was also high at the time of this sampling. These results indicate poor water quality conditions for this one-time sampling event. A detailed project report concerning the Auasi Harbor project was published by the U.S. Army Corps of Engineers, Honolulu District, in 1978. The report suggests that storm runoff carried by Leafu Stream and Vaisa Stream discharge larger sediment loads to the nearshore waters. TABLE 19-2 MISCELLANEOUS SURFACE WATER QUALITY DATA LEAFU STREAM MAY, 1985
Water Quality Parameter TN TKN NO3+NO2 TP Turbidity TSS pH Total Coliform
Date (µg/l) (µg/l) (µg/l) (µg/l) (ntu) (mg/l) (#/100 ml) 05/02/85 790 283 510 266 -- -- -- --
Source: U. S. EPA (STORET), 1996 More recently, available satellite photography that was taken by the U.S. National Oceanographic and Atmospheric Administration (NOAA) on June 18, 1994 indicate the presence of little or no turbidity in the surface waters between the shoreline and the fringing reef. During the June 12-18, 1994 period, only 23 millimeters of rainfall (approximately 0.9 inch) was recorded at NOAA’s monitoring station which is situated in nearby Tula village (Mefford, 1998). A correlation of these rainfall records with available satellite photography on June 18, 1994 suggest that lower flow stream conditions in the Auasi watershed probably have little influence upon nearshore water quality. However, some increased turbidity and sedimentation within the nearshore waters is likely generated during medium and higher streamflow conditions. Wetlands There are no significant wetlands in the Auasi watershed. Marine Resources Coral Communities The fringing reef that fronts the villages of Utumea and Auasi extends between 200 and 1,100 feet seaward of the shoreline. Various marine biologists have made field investigations of the fringing reef in this area since 1977. In a cumulative sense, available survey information suggests the following about coral communities that are located in the nearshore waters that adjoin the watershed.
• An infestation of the crown-of-thorns starfish dramatically reduced coral coverage along the forereef slopes of the fringing reef in the late 1978 and early 1979.

Auasi, Page 19-8
• The fringing reef at Auasi has also been influenced by wave action associated by occasional storms.
1977-1979
The northeast edge of an ava near Maatulaumea Point, which provides boat access to Auasi Harbor, was observed to be densely covered by corals in 1977. However, coral coverage was not evident where the ava merged with a reef flat that contained silty rubble and basalt boulders (Aecos and Aquatic Farms, 1980).
Coral cover on the inner reef, which extended to about 100 feet offshore from the northeast side of Auasi Beach, was characterized by a coral coverage of less than five percent in 1977. However coral coverage along the inner reef that adjoined the southwest side of Auasi Beach ranged between 10 and 40 percent (Aecos and Aquatic Farms, 1980).
Coral coverage on the middle and outer reef platform was common, but quite variable. Less than 5 percent coral coverage was observed on the outer reef off that was seaward of the western side of Auasi Beach. Between 10 and 30 percent coverage was common seaward of the southwest end of the beach near Taugamalama Point. Well-developed corals, which provided between 25 to 40 percent coverage, were documented on the outer reef near the ava that leads to Auasi Harbor. Seaward of Maatulaumea Point, coral cover ranged between 10 and 20 percent. Some to 490 to 590 feet offshore, a distinct assemblage of wave-resistant corals were observed along the outermost reef flat and reef margin (Aecos and Aquatic Farms, 1980).
In early and mid-1978, the reef slopes off Auasi were characterized by well-developed coral growth. The crown-of-thorns starfish was not evident along the forereef slopes of the fringing reef. By August and September, 1979, the starfish was numerous; only 50 percent of the corals remained alive in October, 1979 (Aecos and Aquatic Farms, 1980) .
East of Maatulaumea Point, abundant crown-of-thorns starfish were also documented along the upper reef front that is seaward of Utumea Village. Approximately 50 percent of the corals in this area remained alive (Aecos and Aquatic Farms, 1980). 1982, 1985, and 1988
During the month of April in 1982, 1985, and 1988, Birkeland and Randall investigated the coral communities seaward of Matuli Point. Survey transects were made at a depths of 6-10 feet, as well as 20 feet.
Field survey data revealed a decline in coral coverage at 6-10 feet between 1982 and 1985. An even greater variability in coral coverage was observed at 20 feet where coral coverage was almost eight percent in 1982, increased to 41 percent in 1985, and declined to almost 11 percent in 1988 (Birkeland, Randall, and Amesbury, 1990). 1992
Field investigations were also made of Auasi by Maragos, Hunter, and Meier in 1992. Aerial photographs, which were taken in April 1992, indicated that sheets and tracks of dead coral rubble were common on the outer reef flat that is seaward of Auasi Village. The marine ecologists concluded that the rubble was most likely deposited by large waves during recent storms.
Coral coverage was estimated to be less than 10 percent along the reef front. Less coverage was observed at shallow depths.

Auasi, Page 19-9
Shoreline Protection
The construction of the existing Auasi Harbor was completed in 1981. The Harbor includes a 25,000 square-foot turning basin, and a docking area eight feet deep. The Harbor is protected by a 125-foot long breakwater, a 165-foot long exterior revetment, and a 450-foot long jetty on the west side of the channel. The Corps of Engineers constructed a rock revetment east of the harbor in order to stem erosion reportedly linked to construction of the harbor (Sea Engineering, Inc. and Belt Collins Hawaii, 1994).
West of Auasi Harbor, there is a 300-foot long revetment of basalt boulders that average about 2 feet in diameter. This revetment was constructed to reduce erosion that was caused by construction of the harbor (Sea Engineering, Inc. and Belt Collins Hawaii, 1994).
At Utumea, the shoreline is unprotected by any man-made or engineered structures. The fringing reef affords some shoreline protect as wave energy is somewhat dissipated by the reef.
Shoreline erosion is evident along portions of the primary shoreline roadway in Utumea. Such erosion is within several feet of the roadway. Such erosion should be regularly monitored by the ASG Department of Public Works. A conceptual plan should be developed by the Department for improvements that might slow the rate of erosion in this area. A second option is to accept ongoing erosion and prepare plans for the eventual realignment of the primary roadway through Utumea. Groundwater and Surface Water Supplies
Groundwater Supply and Quality
There are no groundwater supplies that are being used by Auasi Village or Utumea Village. Surface Water Supply and Quality
Both Auasi and Utumea share a village water system that relies upon surface water from Leafu Stream in Auasi. A surface impoundment is situated at approximately the 150-foot elevation.
Available water quality records from ASEPA for the FY 1994-1996 period indicate significant bacterial contamination and highly variable levels of turbidity. Total Coliform levels frequently reached 80 colonies per 100 ml; about 75 percent of the bacteria represent fecal contamination. Turbidity levels exceeded 2.0 NTU during FY 1994, but steadily declined to under 1.0 NTU after January, 1995.
Otherwise, the water quality of the village system generally meets the maximum contaminant level requirements of the Primary Drinking Water Regulations for all contaminants (ASPA, 1995). Proposed Water System Improvements
In its draft Utility Master Plan, the American Samoa Power Authority (ASPA) desires to operate one satellite water system that will serve both Auasi and Utumea. It is possible that ground water supplies from both Auasi and Utumea will be required to support the average day demand of both villages through the year 2015. In this context, ASPA proposes the following system improvements to establish a shared satellite water system:
• Develop two or more groundwater wells. The total production requirement for these wells is estimated to be approximately 15 gallons per minute.
• Provide disinfection facilities at each well. • Construct a 65,000 gallon water storage tank. • Construct approximately 600 feet of 2-inch transmission main from a new well(s) at Auasi to a 6-
inch main along the primary shoreline roadway in Auasi, as well as from the new well in Utumea to the new storage tank.
• Install a fire protection/distribution system. • Install four fire hydrants. • Install service laterals and water meters.

Auasi, Page 19-10
USE OF THE WATERSHED Resident Population
Auasi
Between 1980 and 1990, the resident population of Auasi Village declined from 177 to 122 residents. Such growth represented an average annual decline of about 3 percent. Development activity between 1990 and 1995 increased resident population to about 150 persons. These estimates assume that Aganoa represents a portion of Auasi Village
Population trends reflected in the 1990 Census statistics suggest that limited in-migration has occurred in this community between 1980 and 1990. The proportion of residents who were born outside of American Samoa during the 1980-1984 period was about 36 percent. Between 1985 and 1990, the proportion increased to 34 percent. In 1990, the proportion increased slightly to 41 percent. These statistics suggest that Auasi has not been significantly influenced by the in-migration of persons born outside of American Samoa or the out-migration of existing residents. Utumea East
Between 1980 and 1990, the resident population of Utumea Village increased from 47 to 57 residents. Such growth represented an average annual growth rate of about two percent. Development activity between 1990 and 1995 increased the resident population to an estimated 70 persons. Population trends reflected in the 1990 Census statistics suggest that little in-migration has occurred in this community between 1980 and 1990. The proportion of residents who were born outside of American Samoa during the 1980-1984 period was about 33 percent. Between 1985 and 1990, the proportion increased to 38 percent. However, in 1990, the proportion dropped slightly to 37 percent. ASPA believes that the limited change in the amount of in-migration suggests that Utumea Village is a more stable community where native residents are remaining in the community.
Land Uses Residential The 1990 U.S. Census documented 19 homes in the Auasi village Census area. Eighty-four percent of the homes were owner-occupied; 16 percent were rental units. ASG Building Division records indicate that five new residential building permits were issued from 1990 through 1994. Consequently, the 1995 housing stock includes approximately 24 houses. The 1990 Census indicates that 10 homes were present in Utumea Village in 1990. Eighty percent of the homes were owner-occupied; ten percent were rental units. An additional ten percent were vacant or used by owners as vacation homes. ASG Building Division records indicate that two building permits were issued for new residential buildings from 1990 through 1994. Consequently, the 1995 housing stock included approximately 12 housing units. Agriculture
Auasi
In May 1996, there were about four to five, small family piggeries in Auasi. Each papuaa contained approximately one or two pigs for family consumption (Masaniai, 1996).

Auasi, Page 19-11
Five faatoaga, upland of Auasi Village, were observed during the May, 1996 survey. These areas were generally located between 20 and 250 feet above mean sea level. Utumea
There were approximately four piggeries in the village in May, 1996 (Etimani, 1996).
One faatoaga area was situated immediately upland of the Village. This faatoaga included the production of banana and coconut.
Commercial ASG business license records indicate that there were three commercial enterprises based in Auasi in 1995. No building permits were issued for any new commercial facilities during the 1990-1995 period. Existing commercial enterprises included one laundromat, one transportation company, and one general retail store. In Utumea Village, no commercial enterprises were in operation in 1995. Industrial In 1995, no industrial operations were based in Auasi. One industrial operation was based in Utumea Village. This operation, which represented a home-based business, cleaned chemical products and probably serviced clients throughout the Island of Tutuila. Public Facilities Auasi Harbor was constructed in 1981. The Harbor includes a 25,000 square-foot turning basin and a docking area. The Harbor provides shelter for a few, smaller fishing craft. In addition, other smaller private boats from nearby Aunuu Island and one or more ASG vessels use the Harbor to gather and deliver passenger for trips to and from Aunuu. The ASG Department of Education does not offer an early childhood education program in Auasi. Elementary school-aged children attend Alofau Elementary in Alofau. High school students are bussed to Fagaitua High School in Fagaitua. The ASG Department of Education does not offer an early childhood education program in Utumea. Elementary school-aged children attend Matatula Elementary School in Tula. High school students attend Fagaitua High School in Fagaitua. Use of the Nearshore Waters Nearshore Fishing An American Samoa Subsistence Fishing Survey was conducted by the University of Hawaii Sea Grant Program in the summer of 1992. This survey involved onsite interviews with shoreline users who were participating in fishing activities on selected days during that period. The results of the survey revealed, in part, that there is some use of the nearshore waters in the reefs off Auasi and Utumea. Some 12-16 persons were documented fishing on the reef seaward of Auasi Village during the survey period. Fishing methods that were observed included the use of rod-and-reel, throw net, pole, gleaning, and diving.
Auasi, Page 19-12
In the nearshore waters off Utumea, some 9-14 persons were documented fishing during the survey period. Fishing methods observed there included gleaning, rod-and-reel, throw net, pole, and diving. More recently, it has been observed that up to 20 persons per day fish in the nearshore waters that adjoin Auasi Village. Pole fishing occurs primarily during lower tide conditions; spear fishing is more prominent during higher tide conditions (Masaniai, 1996). A portion of the fishing activity in this area probably represents residents from Aunuu who may pass the time as they await marine transportation to Aunuu. Swimming As many 50 persons per day use the protected waters inside Auasi Harbor for swimming and general recreation (Masaniai, 1996). Similar to fishing, a significant proportion of this activity may include residents from Aunuu who await marine transportation back to Aunuu. A long-time resident of Utumea also indicates that persons who wish to go swimming make use of the waters inside Auasi Harbor rather than use the nearshore waters that front Utumea Village (Etimani, 1996). RESOURCE MANAGEMENT ISSUES Future Land Uses to the Year 2015 Residential
Auasi
During the next 20 years, it is anticipated that future residential growth will average of about 2.5 percent per year in Auasi. Such growth will be significantly greater than the average annual residential growth that occurred between 1980 and 1990 (less than one percent), but considerably less than the five percent annual growth from 1990 through 1994.
Future residential expansion is anticipated in two locations of the Auasi village Census area. It is believed that all developable lands in both of these areas will be developed during the next 20-year period.
In Aganoa, five potential housesites are available within an existing faatoaga area that is immediately inland of the existing residential area. Faatoaga activities in this area are expected to slowly convert to greater residential use and a diminished production of traditional crops.
In the main village of Auasi, there are seven potential housesites between the shoreline and the 50-foot elevation.
During the next 20 years, ASPA believes that these potential development opportunities and constraints will generate the following sequence and volume of residential construction.
1996-2000 Four new single family homes in the main village of Auasi between shoreline and 50-foot elevation.
2001-2005 Three new single family homes in the main village of Auasi between shoreline and 50-foot elevation.
One new single family home in Aganoa between shoreline and 25-foot elevation.
2006-2010 No new residential construction except for home replacements, extensions, and additions.
Auasi, Page 19-13
2011-2015 Four new single family homes in Aganoa between shoreline and 25-foot elevation.
The cumulative effect of this prospective residential growth is that Auasi and Aganoa villages housing stock will increase to roughly 36 housing units in the year 2015. During the same period, it is believed that the average household size will have gradually decreased to approximately 5.32 persons per household. Consequently, the future village population is expected to include about 192 persons in the year 2015.
Utumea
There is some area upland of Utumea Village that appears to be developable for future residential expansion. About 26 single family units could be accommodated in an existing faatoaga area (immediately upland of the village) that is presently used for the cultivation of coconut, bananas, and the operation of some piggeries for subsistence purposes. Pedersen Planning Consultants estimates that 80 percent of this developable land for Utumea Village will eventually be developed for residential housing. This estimate is based upon the assumption that about 17 housing units will be built between 1996 and 2015, but the production of some subsistence crops will remain. Further, incoming American Samoans, who were not born in this community, will eventually predominate the village population. With this trend, potential residents from the continental United States will have less dependence upon the consumption of traditional crops.
During the next 20 years, ASPA believes that these potential development opportunities and constraints will generate the following sequence and volume of residential construction for Utumea.
1996-2000 3 housing units behind the existing residential area, but below the 25-foot elevation.
2001-2005 3 housing units behind the existing residential area, but below the 25-foot elevation.
2006-2010 5 housing units behind the existing residential area, but below the 25-foot elevation.
2011-2015 6 housing units behind the existing residential area, but below the 25-foot elevation.
The cumulative effect of this prospective residential growth is that the Utumea Village housing stock will increase to roughly 29 housing units in the year 2015. During the same period, it is believed that the average household size will have gradually decreased to approximately 5.25 persons per household. Consequently, the future village population is expected to include about 152 persons in the year 2015.
Commercial No commercial facility expansion is anticipated in Auasi during the next 20 years due to the lack of developable land. However, the establishment of four home-based occupations is expected between 1996 and the year 2000. An additional five home-based enterprises are anticipated between 2001 and 2005. An increased residential population in Utumea will eventually generate one new village grocery store between 2011 and 2015.

Auasi, Page 19-14
Industrial Despite modest increases in future resident population, no additional light industrial operations or facilities are anticipated in Auasi or Utumea during the next 20 years. The lack of developable land that would be suitable for industrial activities is the primary constraint to future industrial development in this community. Public Facilities
Auasi
Population characteristics for Auasi in 1990 suggest that approximately three percent of the village population is three and four years of age. Elementary school-aged children (5 and 13 years old) include about 19 percent of the village population; high school students represented about ten percent of the population.
The application of 1990 population characteristics to the anticipated 2015 Auasi Village population suggest increased student enrollments in future early childhood, elementary education, and high school programs outside of Auasi. Anticipated student enrollments from the village population are expected to be as follows in the year 2015:
• early childhood education 6 students • elementary school 36 students • high school 19 students
Utumea
Population characteristics for Utumea Village in 1990 suggest that approximately five percent of the village population is three and four years of age. Elementary school-aged children (5 and 13 years old) include about 23 percent of the village population; high school students represented about two percent of the population.
The application of 1990 population characteristics to the anticipated 2015 village population suggest increased student enrollments in future early childhood, elementary education, and high school programs outside of Utumea. Anticipated student enrollments from the village population are expected to be as follows in the year 2015:
• early childhood education 8 students • elementary school 35 students • high school 3 students
Impact of Future Population Growth Upon Water Consumption and Waste Generation Future population growth and changes in land use in the Auasi watershed will increase the volume of future wastewater and solid wastes that are generated by local residents. Wastewater generation, for example, is expected to rise from about 4,827 gallons per day (gpd) in 1995 to 9,962 gpd in Utumea Village in the year 2015. Wastewater generation in Auasi Village is expected to increase from 7,707 gpd in 1995 to11,651 gpd in 2015 (American Samoa Power Authority, 1996). The consumption of potable water will also increase with a growing population. The American Samoa Power Authority (ASPA) estimates that the average day demand for water in Utumea Village was about 6,895 gallons in 1995. By the year 2015, ASPA anticipates that the average demand will increase to roughly 14,231 gpd in Utumea East. The average day demand for water in Auasi is anticipated to increase from 11,010 gpd in 1995 to 16,644 gpd in 2015

Auasi, Page 19-15
Flood Potential A flood insurance study of American Samoa and related flood insurance rate maps were published by the U.S. Federal Emergency Management Agency (FEMA) in 1991. The study evaluated selected geographical locations throughout the Territory. Hydrologic and hydraulic analyses that were presented in the study were made by the U.S. Army Corps of Engineers, Pacific Ocean Division. No detailed study was made of the streams in the Auasi watershed, or the nearshore waters that adjoin of the watershed. Inland Flood Potential All inland areas of the Auasi watershed have been designated by the Federal Emergency Management Agency (FEMA) as “zone x.” This designation indicates that the area is outside of the 100-year floodplain. In essence, FEMA is suggesting that the flood hazard potential is limited. During the May, 1996 field survey, a resident of Auasi Village reported that stormwater occasionally enters her home along on the east side of Leafu Stream. The elevation of her home is about 12 feet above mean sea level. Some ponding also occurs in front of the homes of the west side of Auasi (Masaniai, 1996) Coastal Flood Hazards The flood insurance rate map for the Auasi watershed indicates that there is a coastal flood hazard along the shoreline and adjoining nearshore waters. A potential 100-year flood is estimated to generate flood levels in these areas of three feet above mean sea level. Potential 100-year tsunami elevations have also been estimated by the U.S. Army Corps of Engineers for one location in the Auasi watershed. A potential tsunami is estimated to generate a 100-year flood level of 2.5 feet above mean sea level (MSL) in the vicinity of Matuli Point (Figure 19-2). Stormwater Runoff/Sedimentation and the Relationship to Surface Water Quality Storm runoff from Leafu, Vaisa, and Stream 19A likely generate some increased turbidity and sedimentation levels in the nearshore waters that adjoin the Auasi watershed. These conditions primarily occur during or following after heavier rainfall periods. It is believed that natural sedimentation and sedimentation from upland faatoaga represent the primary sources of downstream sedimentation in the watershed. The opportunities for the future detention of stormwater flows in the watershed are limited. A small low area is located on the west side of Leafu Stream between the 10 and 13-foot contour. This area encompasses about 0.5 acre and fronts three homes on the west side of Leafu Stream. As stormwater flows flow downstream through Auasi, it is possible that the flows could be diverted southwest to this potential detention area before stream flows discharge into the nearshore waters. In view of this opportunity, ASEPA should investigate the potential opportunity to divert a greater proportion of the stormwater from the Leafu Stream drainage into the low area southwest of Leafu Stream. The capability of this area to accommodate additional runoff should be verified through the computer modeling of the Leafu Stream drainage. Nearshore Water Quality and the Marine Environment Onsite observations, available aerial photography and historical marine surveys suggest that the design and configuration of Auasi Harbor enables a desirable flushing of nearshore waters inside the Harbor. Nearshore water quality in the vicinity of the Harbor and the adjoining ava appear to be desirable.
Auasi, Page 19-16
The nearshore waters that adjoin the watershed are somewhat impacted by natural sedimentation, upland agricultural activities, urban runoff, inadequately treated wastewater from cesspools and septic tanks, a limited discharge of piggery wastes, as well as wave action and nearshore currents. It is believed that natural sedimentation from upland slopes and upland agricultural activities represent the primary influences upon nearshore water quality in the Auasi watershed. Each of these influences is expected to continue. Periodic monitoring of total suspended solids and nutrients in the nearshore waters that front Auasi Village is recommended to help identify any significant stresses to the marine environment. Coral communities are significantly dependent upon the availability of light and related photosynthesis, and occasional periods of significant turbidity and sedimentation do not promote long-term coral nutrition, growth, reproduction, and depth distribution (Richmond, 1993). When corals fertilize, they are free-swimming. Consequently, they need a good location to settle and make a good attachment. With significant soil deposition, sediments can physically interfere with the recruitment of coral larvae (Richmond, 1993; Dashbach, 1996). Coral communities are an important component of the overall ecology of the nearshore waters that adjoin the Auasi watershed. They provide shelter to fish, invertebrates, and other marine organisms. Some of these resources represent a supplemental food source for residents of Auasi. Groundwater and Surface Water Supplies The development of potential groundwater supplies from the Auasi watershed may address both long-term water supply needs and ensure improved groundwater quality. Elevated levels of bacterial contamination from the village water system are undesirable. ASEPA should encourage the construction and use of individual roof catchment systems until adequate groundwater supplies can be developed. The chlorination of surface water supplies at existing stream catchments should also be encouraged since village residents will likely continue to use these resources. MANAGEMENT NEEDS AND RECOMMENDATIONS The primary focus of future resource management in the Auasi watershed will be to:
• Discontinue use of Leafu Stream waters for potable water uses. Regularly chlorinate surface water supplies at existing stream catchments until use is discontinued.
• Construct and begin use of individual roof catchment systems until groundwater wells can be developed by ASPA.
• Establish a satellite water system, which uses a groundwater supply, that serves both Auasi and Utumea.
• Investigate potential opportunities for limited stormwater detention southwest of Leafu Stream. • Monitor nearshore water quality to help identify any significant stresses to the marine
environment. Representatives of participating public agencies should make periodic visits to the watershed to observe, document, and monitor selected resource conditions, determine potential methods of correcting a potential hazard or undesirable conditions, share potential solutions with a designated resident of Auasi, and encourage the village’s implementation of resource management solutions.

Auasi, Page 19-17
The scope of issues that should be addressed by each agency in the field is summarized in Table 19-3. The general focus of recommended technical assistance is also identified. The experience and insights of agency representatives will determine the specific methodology to be used in the field. TABLE 19-3 RECOMMENDED FOCUS OF FUTURE TECHNICAL ASSISTANCE AUASI WATERSHED
Participating Public Agency
Resource Management Issue
Focus of Technical Assistance
ASEPA Facilitate a coordinated resource management effort within the watershed
1. Coordinate overall watershed management activities. 2. Hold periodic meetings with participating ASG and federal agencies to discuss, prioritize, and schedule resource management activities. 3. Coordinate program efforts with local traditional leaders and/or designated resident of the watershed. 4. Make annual assessment of resource management program.
ASEPA Monitor water quality of Leafu Stream, Vaisa Stream, and Stream 19A, as well as the nearshore waters
Measure changes in and total/fecal bacteria, total suspended solids, turbidity, and nutrients on a quarterly basis.
ASPA Develop a new shared, satellite water system that serves both Auasi and Utumea.
1. Meet with traditional village leaders to consider the development of a satellite water system. 2. If desired by village leaders, secure funding for water system design and construction. 3. Design water system improvements. 4. Construct proposed improvements.
ASEPA Reduce potential public health risk associated with bacterial contamination of surface supplies
1. In the absence of proposed groundwater supplies, encourage the construction and use of individual roof catchment systems for households that use stream catchment systems for drinking water and food preparation. 2. If needed, provide technical assistance to local residents concerning construction and maintenance of individual roof catchment systems. 3. Regularly chlorinate surface water supplies at existing stream catchments.
ASEPA Reduce discharge of sediments into nearshore waters
1. Investigate the potential opportunity to divert a greater proportion of the stormwater runoff from the Leafu Stream drainage into the low area southwest of Leafu Stream. 2. Verify the capability of this area to accommodate additional runoff via computer modeling of the Leafu Stream drainage. 3. If feasible, prepare conceptual design plans and estimate order-of-magnitude costs. 4. Construct proposed improvements.
Continued – next page

Auasi, Page 19-18
TABLE 19-3 (Continued) RECOMMENDED FOCUS OF FUTURE TECHNICAL ASSISTANCE AUASI WATERSHED
Participating Public Agency
Resource Management Issue
Focus of Technical Assistance
DPO Monitor changes in population and land use
Annually map type and location of land uses in village and estimate resident population.
ASCC Land Grant Program
Reduce sedimentation from agricultural activities
1. Determine locations where upslope agricultural activities may be generating some sedimentation. 2. Encourage soil conservation methods with resident growers of subsistence crops.
ASG Dept. of Marine and Wildlife Resources
Sustain health of marine communities in nearshore waters
Monitor changes in coral coverage, fish habitat, diversity and other characteristics (used by Green) approximately every three years.
Source: Pedersen Planning Consultants, 1997

Amouli, Page 20-1
AMOULI Watershed 20 GEOGRAPHY The Amouli watershed is located along the southeast coast of the Island of Tutuila. The watershed comprises almost 0.8 square mile of land area (Figure 20-1). The upland boundaries include Maugaele Ridge, the southwest slopes of Olomoana Mountain, the Lemafa Saddle along the primary roadway to Aoa Village, the southeast slopes of Patupatu Ridge, and Leauga Ridge. Leoo Ridge is situated immediately upland of the Amouli Village and southwest of the Lemafa Saddle. Along the shoreline, the west boundary of the watershed is located at Sinatau Point. Taulaotoga Rock, which is located south of Maugaele Ridge, represents the watershed’s east boundary. A small, broad embayment fronts Amouli Village between Falaseeitoafa Point and Matautuele Point. Nuuolemoa Cove is situated between Matalesolo Point and Leva Point. Nuuoleniu Cove lies between Sinatau Point and Leva Point. There are eight streams in the Amouli watershed. Six drainage systems empty into the nearshore waters that adjoin the Amouli watershed. Amouli Village is the primary, inhabited village area. Siufaga and Fogaau represent two, smaller residential areas that are southwest of the main village of Amouli. In a traditional sense, these areas are now united and considered as one village. RESOURCES OF THE WATERSHED Soils The U.S. Soil Conservation Service (National Resource Conservation Service) published a Soil Survey of American Samoa in 1984. Selected information derived from this survey provides some useful information for future watershed planning and management (Figure 20-2). Five different soil classifications were identified by the U.S. Soil Conservation Service for lands within the Amouli watershed (Table 20-1). Urban Land-Ngedebus Complex Urban land-Ngedebus complex soils (SCS mapping unit 35) are found along the shoreline of the main village, as well as the residential areas of Siufaga and Fogaau. The same soil is found in the east half of Amouli Village and the lower Televai Stream drainage. These soils generally comprise coral fragments, sand, cinders and other material that have been graded or filled to support residential, commercial and public facilities in the village areas. The Ngedebus soil extends to a depth of 60 inches or more. The surface layer, which extends about 4 inches below ground elevation, typically contains light, brownish-gray and brown sand. The underlying material is characterized by pale brown and light yellow, brown sand. The permeability of Ngedebus soil ranges between six and 20 inches per hour. Surface drainage on this soil is generally slow, and the hazard of potential soil erosion is slight. In some places, the soil is subject to occasional, brief periods of flooding during prolonged, heavy rainfall or during high tide (U.S. Soil Conservation Service, 1984). These soils are generally suitable to support residential and commercial development in areas that are protected from flooding. However, this soil is poorly suited in unprotected areas.


Amouli, Page 20-4
TABLE 20-1 SELECTED SOIL CHARACTERISTICS AMOULI WATERSHED
Soil Depth To: Land Use Suitability SCS Soil Unit
Name Typical Slope
(Percent)
Flood Runoff Erosion High Water (Feet)
Bed Rock
(Inches)
Soil Based WW
Treatment
Subsistence Ag
Potential
1 Aua very stony silty clay loam
15-30 None Med Med >6 <60 Severe Slope Moderate
2 Aua very stony silty clay loam
30-60 None Rapid Severe <6 <60 Severe Slope Poor
3 Fagasa-Ofu silty clays
30-60 None Med to Rapid
Med to Severe
>6 20-40 Severe Slope Depth
Moderate
4 Fagasa family-Lithic Hapludolls-Rock outcrop assoc
70-130 None Very Rapid
Very Severe
>6 20-60 Severe Slope Depth
Limited
34 Urban land-Aua-Leafu complex
0-30 A.None L. Occ
A. Slow to Med
A.Slight to Mod L.slight
A.>6 L.3-5
>60 Severe A. Slope L. Flood Wet
Limited
35 Urban Land-Ngedebus complex
0-5 Occ. Brief
Slow Slight >3.5 >60 Severe Flood Wet Pool Filter
Poor
Notes:: A.= Aua- found on mountain foot slopes 6-30 percent L.= Leafu- found on coastal plains & valley floors 0-6 percent
Source: U.S. Soil Conservation Service, 1984 Where moderate to higher housing densities occur, the U. S. Natural Resources Conservation Service recommends the use of community sewage systems prevent the potential contamination of groundwater and surface water supplies. Lower housing densities are present throughout Amouli, Siufaga, and Fogaau. Urban Land-Aua-Leafu Complex (0 to 30 percent slopes) Southwest of Leoo Ridge, the lower portions of the Laloi and Fusiloa drainages and adjacent residential area contain soils known as Urban Land-Aua-Leafu complex (SCS mapping unit 34). This soil type represents a combination of Aua and Leafu soils. These soils typically are found at depths of 60 inches or more. The permeability of this soil is moderately rapid and ranges between 2 and six inches per hour. The soil has limited to moderate potential for runoff. The erosion potential is slight to moderate. This soil has limited potential for subsistence agriculture. The U.S. Soil Conservation Service estimates that this soil can annually sustain up to 5 tons per acre of erosion without impacting crop productivity (U.S. Soil Conservation Service, 1984). Consequently, the use of these lands for subsistence agriculture is not likely to generate significant downslope erosion. The use of these soils for septic tank systems and related soil-based wastewater treatment is not desirable. A higher composition of larger rock fragments, combined with moderately rapid permeability, do not promote effective wastewater treatment. Aua Very Stony Silty Clay Loam (30 to 60 percent slopes) Steeper slopes immediately upland of Matautuele Point contain Aua very stony silty clay loam soils (SCS mapping unit 2). This soil is also found along the Fusiloa drainage and portions of the lower Laloi Stream drainage. A small area northwest of Leva Point is also characterized by these Aua soils.

Amouli, Page 20-5
The Aua soils range between seven to 60 inches in depth. The permeability of these soils (between 2 and 6 inches per hour) is moderately rapid. For watershed management purposes, it is important to note that these Aua soils have a high potential for runoff and erosion. This Aua soil is not recommended for agricultural production because of the stoniness of the soil, the high erosion potential, and hazards associated with subsistence crop cultivation on steeper slopes. However, when cultivation in these soils is necessary, the use of a mulch or ground cover is recommended to reduce soil erosion in cultivated areas. The U.S. Soil Conservation Service estimates that this soil can annually sustain up to 5 tons per acre of erosion without impacting crop productivity (U.S. Soil Conservation Service, 1984). While the erosive characteristics of this soil generally may not significantly impact subsistence crop productivity, the erosive quality of the soil can be a significant contributor to sedimentation in downslope streams and the nearshore waters. The general characteristics of these Aua soils are also undesirable for individual wastewater disposal systems (U.S. Soil Conservation Service, 1984). These soils contain a significant amount of larger stones that hamper installation and provide inadequate soil treatment. Aua Very Stony Silty Clay Loam On the east edge of the watershed, a small area of Aua very stony silty clay loam (SCS soil mapping unit 1) is found on both sides of the primary shoreline roadway. These soils typically occur up to about 60 inches in depth. The permeability of these soils ranges between 2 and 6 inches per hour. The potential for runoff or erosion from the Aua soils is believed to be moderate (U.S. Soil Conservation Service, 1984). While moderately suited for agricultural production, the U.S. Soil Conservation Service estimates that this soil can annually sustain up to 5 tons per acre of erosion without impacting crop productivity (U.S. Soil Conservation Service, 1984). However, the U.S. Soil Conservation Service also advises that the stony and erosive characteristics of these soils may limit production. While the erosive characteristics of this soil generally may not significantly impact subsistence crop productivity, the erosive quality of the soil can be a significant contributor to sedimentation in downslope streams and the nearshore waters. The general characteristics of these Aua soils are also undesirable for individual wastewater disposal systems (U.S. Soil Conservation Service, 1984). These soils contain a significant amount of larger stones that typically hamper installation and provide inadequate soil treatment. Fagasa Family-Lithic Hapludolls-Rock Outcrop Association With the exception of the upper slopes along stream drainages, steeper upland land areas throughout much of the remaining watershed contain deep, well-drained soils on steep mountain ridges and slopes. The U.S. Soil Conservation Service identifies these soils as part of the Fagasa family-Lithic Hapludolls-Rock outcrop association (SCS mapping unit 4). Since this soil type is a combination of two general soil classifications, soil depths can vary between 20 and 60 inches. The soil represents a combination of silty clay and loam. Since the Fagasa Family-Lithic Hapludolls soil typically occurs on very steep slopes, the potential for surface runoff and erosion are high. The cultivation of subsistence crops on these soils is not considered desirable. However, when cultivation in these soils is necessary, care should be exercised to minimize the amount of exposed soil in cultivated areas.

Amouli, Page 20-6
When heavier rainfall events occur, significant erosion of these soils can be expected from undeveloped upslope areas of the watershed. Natural runoff from steeper slopes in the watershed carries water, sediments, and organic debris to downslope drainage courses and streams. Such erosion can readily influence downstream water quality. Fagasa-Ofu Silty Clays Fagasa-Ofu Silty Clays (SCS mapping unit 3) are situated in, at least, three parts of the Amouli watershed:
• north of Nuuolemaa Cove; • north of Amouli Village along both sides of the primary shoreline roadway to Aoa, as well as
much of the upper Televai-Tuavaa Stream drainage; and, • and some of the upland slopes along the south side of Patupatu Ridge. The soil ranges between 20 to 40 inches in depth. The permeability of this silty clay loam is moderately rapid (2 to 6 inches per hour). The potential for surface runoff from these soils is considered moderate to rapid. However, the potential for erosion is moderate to severe. The U.S. Soil Conservation Service indicates that this soil type is somewhat suitable for the production of subsistence crops. The soil can annually sustain from one to 5 tons per acre of erosion without impacting crop productivity. However, the Soil Conservation Service recommends the use of mulch, crop residues, and cross-slope farming to reduce the potential for soil erosion. Streams Stream Locations The northeast part of the watershed includes the Televai Stream drainage. The main stream course originates at about 560 feet above mean sea level. Three other tributaries drain surface water runoff from Maugaele Ridge and Leauga Ridge. In addition, Tuavaa Stream carries surface runoff from the east side of Leoo Ridge and the primary road to Aoa. On the upland side of the main village area, a main stream course continues along the east side of the upland road to Aoa Village and, ultimately, discharges into the nearshore waters. A smaller stream course in the northeast part of the watershed (Stream 20C) is also located on the south side of Leauga Ridge. This unnamed stream begins at approximately 225 feet above mean sea level and discharges into the nearshore waters east of the main village area (north of the Matautuele Point). The northwest part of the watershed includes Fusiloa Streams and Laloi Stream. These streams ultimately drain into a man-made channel in the Siufaga area that discharges into the nearshore waters. The man-made channel is believed to be the lower end of the Laloi Stream drainage. Fusiloa Stream originates at about the 400-foot contour. A related tributary joins the main stream course about 105 feet above mean sea level. The main stream course divides into two smaller drainage course between 15 and 20 feet above mean sea level. Both courses drain into the lower man-made channel in the Siufaga area. Laloi Stream begins at about the 425-foot elevation. This stream course and an associated tributary carry stream flows into the west side of Siufaga and continue its flow through the man-made channel to the nearshore waters. Siufaga Stream is located on the west side of Siufaga and just north of Fogaau. This short stream course originates about 290 feet mean sea level and discharges into the nearshore waters north of Falaseeitoafa Point.

Amouli, Page 20-7
Stream 20B is situated northwest and upslope of Matalesolo Point and begins at approximately 325 feet above mean sea level. This stream discharges into the nearshore waters on the west side of Matalesolo Point. In the southwest part of the watershed, Auvaipe Stream and Auvaiola Stream each begin at the 375-foot elevation and flow parallel to one another until their discharge into the nearshore waters of Nuuolemaa Cove. Along the East Side of Avapui Ridge, an unnamed stream (Stream 20A) begins at approximately 320 feet above mean sea level and empties into the adjacent Nuuoleniu Cove. Stream Flows Within the Watershed A low-flow, partial-record station (No. 16963000) was established on Televai Stream between 1958 and 1975, approximately 0.1 mile upstream from Tuavaa Stream confluence (Wong, 1996). Some 20 measurements from this station enabled the U.S. Geological Survey to estimate a median flow of 0.11 cubic feet per second (cfs). One measurement was made along Fusiloa Stream in 1971. With this limited data, the U.S. Geological Survey estimated a median flow of 0.13 cfs (Wong, 1996). A low-flow, partial-record station (No. 16962000) on Laloi Stream, approximately 0.2 mile upstream from Fusiloa Stream, provided 16 measurements between 1958 and 1974. These measurements led the U.S. Geological Survey to calculate an estimated median flow of 0.03 cfs (Wong, 1996). Aquatic Fishes and Invertebrates Field surveys of fishes and invertebrates were made by the U.S. Fish and Wildlife Service, Division of Ecological Services, in March-April, 1978 and the U.S. Army Corps of Engineers in August, 1980. Laloi Stream was one of 37 streams in American Samoa that was inventoried by representatives of these federal agencies. Results from both field surveys were summarized in an American Samoa Stream Inventory that was published by the U.S. Army Corps of Engineers, Honolulu District, in July, 1981. Laloi Stream was surveyed in three locations. Station 8a was located in a terminal estuary at about 10 feet above mean sea level. Station 8b was situated at the confluence of Laloi Stream and Fusiloa Stream. Station 8c was located in a small gravel riffle that was located just upland of the village impoundment at about the 160-foot elevation. Only one mollusk was identified at the terminal estuary. Otherwise, no fishes or other invertebrates were observed at station 8a. No fishes were documented at station 8b. However, four shrimp species of shrimp were reported; one of the species was abundant. One eel was identified above the village impoundment (station 8c). Otherwise, no other fish or invertebrates were recorded at station 8c. Surface Water Quality Streams No surface water quality data is available for the streams in the Amouli watershed.
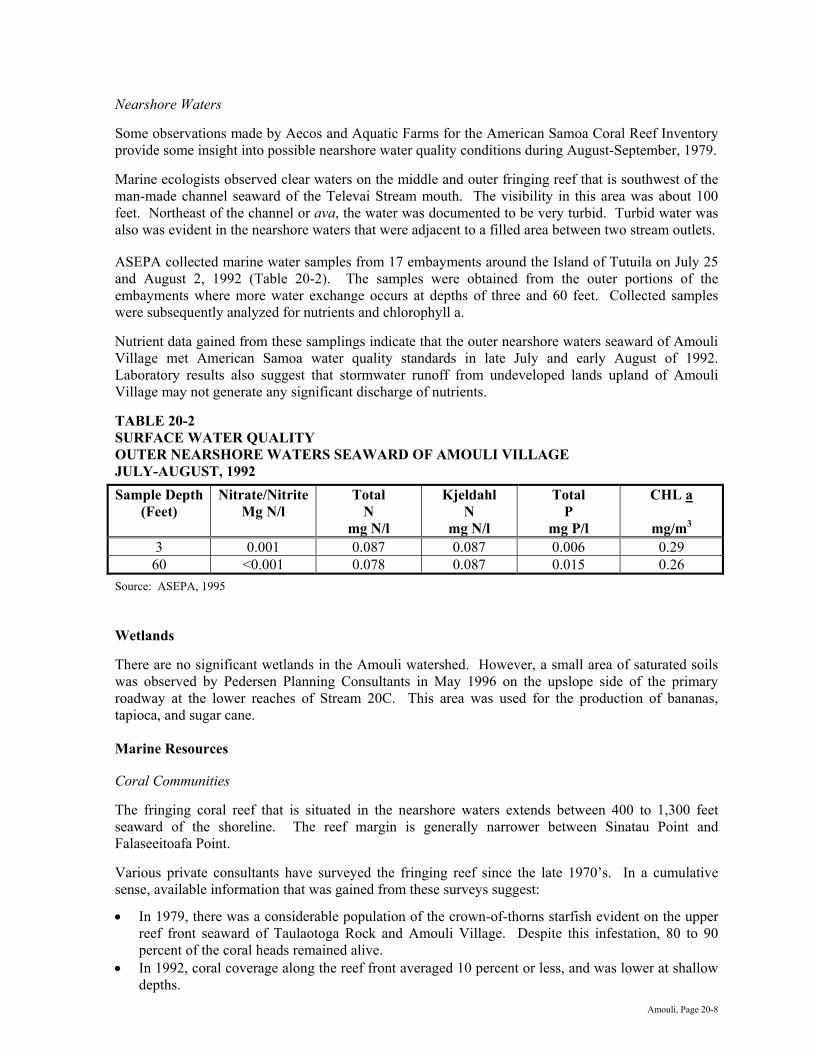
Amouli, Page 20-8
Nearshore Waters Some observations made by Aecos and Aquatic Farms for the American Samoa Coral Reef Inventory provide some insight into possible nearshore water quality conditions during August-September, 1979. Marine ecologists observed clear waters on the middle and outer fringing reef that is southwest of the man-made channel seaward of the Televai Stream mouth. The visibility in this area was about 100 feet. Northeast of the channel or ava, the water was documented to be very turbid. Turbid water was also was evident in the nearshore waters that were adjacent to a filled area between two stream outlets. ASEPA collected marine water samples from 17 embayments around the Island of Tutuila on July 25 and August 2, 1992 (Table 20-2). The samples were obtained from the outer portions of the embayments where more water exchange occurs at depths of three and 60 feet. Collected samples were subsequently analyzed for nutrients and chlorophyll a. Nutrient data gained from these samplings indicate that the outer nearshore waters seaward of Amouli Village met American Samoa water quality standards in late July and early August of 1992. Laboratory results also suggest that stormwater runoff from undeveloped lands upland of Amouli Village may not generate any significant discharge of nutrients. TABLE 20-2 SURFACE WATER QUALITY OUTER NEARSHORE WATERS SEAWARD OF AMOULI VILLAGE JULY-AUGUST, 1992
Sample Depth (Feet)
Nitrate/Nitrite Mg N/l
Total N
mg N/l
Kjeldahl N
mg N/l
Total P
mg P/l
CHL a
mg/m3
3 0.001 0.087 0.087 0.006 0.29 60 <0.001 0.078 0.087 0.015 0.26
Source: ASEPA, 1995 Wetlands There are no significant wetlands in the Amouli watershed. However, a small area of saturated soils was observed by Pedersen Planning Consultants in May 1996 on the upslope side of the primary roadway at the lower reaches of Stream 20C. This area was used for the production of bananas, tapioca, and sugar cane. Marine Resources Coral Communities The fringing coral reef that is situated in the nearshore waters extends between 400 to 1,300 feet seaward of the shoreline. The reef margin is generally narrower between Sinatau Point and Falaseeitoafa Point. Various private consultants have surveyed the fringing reef since the late 1970’s. In a cumulative sense, available information that was gained from these surveys suggest:
• In 1979, there was a considerable population of the crown-of-thorns starfish evident on the upper reef front seaward of Taulaotoga Rock and Amouli Village. Despite this infestation, 80 to 90 percent of the coral heads remained alive.
• In 1992, coral coverage along the reef front averaged 10 percent or less, and was lower at shallow depths.

Amouli, Page 20-9
• In 1995, coral coverage along the reef front less than 20 percent.
1978-1979
Between Sinatau Point and Falaseeitoafa Point, spur-and-groove formations were observed on the outer margin of the reef.
The fringing reef that fronts the main village area lies between Falaseeitoafa Point and Matautuele Point. During this period, marine ecologists observed that the inner reef flat, which is adjacent to the southwest end of Amouli Village, transitioned from primarily sand to increasing portions of basalt rubble along the shore toward Matautele Point. Seaward of the Televai Stream mouth, inner reef areas shoreward of a man-made channel (ava), contained rubble and consolidated limestone that was mixed with silty, sand to a depth of three feet. Coral cover in this area ranged between five and ten percent (Aecos and Aquatic Farms, 1980).
A sand deposit extended from the mouth of Televai Stream to the deeper man-made channel. The reef flat inside Matautuele Point contained a rubble bottom that consisted of a mixture of volcanic and limestone fragments. No corals were evident in nearshore rubble areas that were seaward of the northeast part of Amouli Village (Aecos and Aquatic Farms, 1980).
Seaward of the inner reef, the relatively flat bottom was mostly rubble at depths of three to four feet. The bottom shoaled to one to two feet over extensive mid-reef rubble tracts. . Coral cover along the middle reef flat ranged between 10 to 15 percent at depths of three to four feet (Aecos and Aquatic Farms, 1980).
An outer reef platform of consolidated limestone, with rubble tracts, extended to an elevated reef margin and a reef face with spur-and-groove development (Aecos and Aquatic Farms, 1980).
An ava, approximately 50 feet wide, indented the seaward face of the fringing reef. This channel generally aligned with the mouth of Televai Stream. The channel bottom was littered with sand-scoured boulders and rubble (Aecos and Aquatic Farms, 1980).
The outer reef flat northeast of the ava was characterized by consolidated limestone pavement that contained scattered, loose flat boulders. Live corals covered about 10 percent of the outer reef platform (Aecos and Aquatic Farms, 1980).
In August-September, 1979, an abundance of crown-of-thorns starfish was observed on the upper reef front (at depths of six to 33 feet) that is seaward of Amouli Village and Taulaotoga Rock. However, 80 to 90 percent of the coral heads remained alive (Aecos and Aquatic Farms, 1980). 1992
Field investigations were made at Amouli by Maragos, Hunter, and Meier in 1992. This team of scientists noted that the fringing reef at Amouli is an ocean facing reef slope habitat.
Along the reef front, coral coverage averaged 10 percent or less and was lower at shallow depths. Sheets and tracks of dead coral rubble were evident on the outer reef flats. Biologists believed that these conditions were generated by larger waves during recent storms. 1995
A 1995 survey of various coral reefs throughout the Samoan Archipelago included Amouli Village. The study focused primarily upon the quantification of coral communities, the abundance and diversity of reef fish, and selected habitat characteristics.
Amouli, Page 20-10
Five transects were made along the reef front within the small, broad embayment that fronts the main village of Amouli. The transects began approximately 20 meters west of the main ava into Amouli and continued in a westerly direction.
Coral coverage was documented to be less than 20 percent.
Fish species richness was estimated to range between 100 and 149 species. Fish density along the transects ranged between 5,000 to 9,999 individuals per ha. Fish biomass was reported to be less than 500 kilograms per ha.
Wildlife Resources In the 1980 Coral Reef Inventory, Aecos and Aquatic Farms, noted that the blue-gray noddy, a seabird uncommon in American Samoa, roosts and nests southwest of Fogaau near Matalesolo Point. Shoreline Protection and Erosion Marginal shoreline protection is present along the shoreline between Falaseeitoafa Point and Matautuele Point. This protection includes loosely, dumped gravel and boulders, as well as 6-foot high wall (Sea Engineering, Inc. and Belt Collins Hawaii, 1994). During a May 1996 survey, Pedersen Planning Consultants observed that a significant amount of shoreline erosion was evident along the western half of the Amouli Village shoreline. A retreat of about 25 feet was as close as two feet to the primary shoreline roadway. Should this treat continue, it will clearly impact the foundation of the shoreline roadway. Sea Engineering, Inc. also noted a three to four-foot scarp that was cut into the vegetated backshore north of Matautuele Point. This erosion was also within two to three feet of the primary shoreline roadway. Scattered boulders have been dumped along the scarp, but offer little protection (Sea Engineering, Inc., and Belt Collins Hawaii, 1994). Groundwater and Surface Drinking Water Supplies Groundwater Supply and Quality There are no developed groundwater wells in Amouli Village or the surrounding watershed. In 1995, ASPA estimated that there is a potential groundwater recharge to the Amouli aquifer of about 200,000 gallons per day. Population and water demand forecasts that were developed for ASPA in 1995 suggest that the potential groundwater yield is marginally adequate to meet the demands of Amouli Village through the year 2015. Surface Water Supply and Quality Two fresh-water springs supply a village water system that relies entirely upon these surface supplies. Existing springs are located along Fusiloa and Tuavaa Stream. Available water quality data from FY 1994 through FY 1996 indicate that existing surface supplies contain elevated levels of coliform contamination. Roughly 50 to 75 percent of all coliform contamination represents fecal coliforms. Turbidity levels ranged between 0.3 and 0.6 NTU in FY 1995 and FY 1996. However, considerably higher turbidity levels, which ranged between 1.1 and 2.9 NTU, were documented by ASEPA during FY 1994.

Amouli, Page 20-11
Proposed Water System Improvements In its draft Utility Master Plan, ASPA desires to establish a groundwater supply in Amouli Village. However, it is concerned that the potential groundwater recharge of 200,000 gallons per day may be inadequate to supply anticipated water demands. In this context, ASPA recommends the development of two groundwater wells that each would produce 30 gallons per minute (gpm). Spring water sources may be used to supplement the groundwater supply near the year 2015. Other ASPA proposals in the draft Utility Master Plan include the following system improvements:
• Potential renovation of existing spring sources if well yields are inadequate to meet future demands;
• Disinfection facilities at each well; • Construction of a 100,000 gallon storage tank; • Installation of approximately 400 feet of 4-inch PVC transmission main from the new wells to the
new storage tank; • Installation of a new fire protection/distribution system and five fire hydrants; and, • Installation of service laterals and water meters. USE OF THE WATERSHED Resident Population Between 1980 and 1990, the resident population of Amouli Village increased from 363 to 463 residents. Such growth represented an average annual growth rate of about 2.7 percent. Development activity between 1990 and 1995 increased resident population to about 664 persons. Population trends reflected in the 1990 Census statistics suggest that some in-migration has occurred in Amouli between 1980 and 1990. The proportion of residents who were born outside of American Samoa during the 1980-1984 period was about 31 percent. Between 1985 and 1990, the proportion increased to 38 percent. In 1990, the proportion remained at 38 percent. ASPA believes that these statistics suggest a greater stability in the community’s resident population which apparently is not characterized by any significant out or in-migration. However, a seven percent annual increase from 1990 through 1994 may signal a new influx of persons who were born outside of American Samoa. Land Uses Residential The 1990 U.S. Census documented 68 homes in the Amouli village Census area. Seventy-five percent of the homes were owner-occupied; 18 percent were rental units. An additional seven percent of the housing stock was vacant or was used as a vacation home by the owner. ASG Building Division records indicate that 25 new residential building permits were issued from 1990 through 1994 in Amouli. Consequently, the 1995 housing stock includes approximately 93 houses. Agriculture Piggeries were observed in both Siufaga and the main village area of Amouli in May, 1996. One piggery in Siufaga was located between the lower Laloi Stream and Fusiloa Stream drainages. Two piggeries were documented along the lower Televai Stream drainage. In the Siufaga area, one faatoaga was observed in May, 1996 on the north side of Siufaga Stream between the 50 and 100-foot contour. On the southeast side of Amouli Village, a small area,

Amouli, Page 20-12
immediately upland of the primary shoreline roadway and the mouth of Stream 20C, contained some production of bananas, taro, and sugar cane. Commercial In 1995, ASG business license records indicated that there were about seven commercial enterprises based in the Amouli village Census area. No building permits were issued for any new commercial facilities during the 1990-1995 period. Commercial enterprises included two grocery stores, one general retail store, two bus companies, one electrical contractor, and one catering equipment rental company. Industrial In 1995, no industrial operations were based in Amouli. Public Facilities The ASG Department of Education offers an early childhood education program in Amouli. In September, 1994, this program was attended by 26 younger children. Elementary school-aged children attend either Alofau Elementary in Alofau or Masefau Elementary School in Masefau. High school students are bussed to Fagaitua High School in Fagaitua. Use of the Nearshore Waters Nearshore Fishing An informal discussion with High Talking Chief Pepa Fuata indicates that about 20 to 30 people per day use the nearshore waters for fishing (Fuata, 1996). An American Samoa Subsistence Fishing Survey was conducted by the University of Hawaii Sea Grant Program in the summer of 1992. This survey involved onsite interviews with shoreline users who were participating in fishing activities on selected days during that period. The results of the survey revealed, in part, that there is considerable use of the nearshore waters in the reefs off Amouli. Some 20-30 persons were documented fishing on the reef seaward of Amouli Village. Fishing methods that were observed included the use of rod-and-reel, throw net, pole, gill net, gleaning, diving, and hand-and-line in a paopao. Swimming In May, 1996, HTC Fuata also reported that up to 50 people that use the nearshore waters for swimming and general recreation. RESOURCE MANAGEMENT ISSUES Future Land Uses to the Year 2015 Residential Some residential expansion is expected to occur in the Amouli village Census area during the next 20 years. It is anticipated that future residential growth will be an average of about 1.9 percent per year. Such growth will be slightly less than the average annual residential growth that occurred between 1980 and 1990 (2.7 percent), but considerably less than the seven percent annual growth from 1990 through 1994. The anticipated decline in the rate of residential growth is due to the lack of developable lands and drainage considerations that influence the location of future residential construction within the community.

Amouli, Page 20-13
Future residential expansion is anticipated in three locations of the Amouli village Census area. During the next 20 years, it is anticipated that all of the residential development opportunities in each area will be exercised. In Siufaga, there are 15 potential housesites are available within the existing residential area. Some of this area is currently used for faatoaga and will gradually convert to greater residential use with the departure from traditional foods. In the main village of Amouli, there are 14 potential housesites that could be developed between the shoreline and the 50-foot elevation. Some of these sites are within the existing residential area; most however, are located immediately upslope of the existing village, as well as east of Televai Stream. Eight additional housesites that are feasible for future residential development are located along the road to Aoa Village. These sites are situated on the east and west side of the road between the 175 and 350-foot elevation. During the next 20 years, ASPA believes that these potential development opportunities and constraints will generate the following sequence and volume of residential construction.
1996-2000 Four new single family homes in Siufaga shoreline and 50-foot elevation.
Two new single family homes along road to Aoa between 175 and 350-foot elevation.
Seven new single family homes within and immediately upslope of Amouli village between shoreline and 50-foot elevation
2001-2005 Four new single family homes in Siufaga shoreline and 50-foot elevation.
Two new single family homes along road to Aoa between 175 and 350-foot elevation.
Seven new single family homes within and immediately upslope of Amouli village between shoreline and 50-foot elevation
2006-2010 Three new single family homes in Siufaga shoreline and 50-foot elevation.
Two new single family homes along road to Aoa between 175 and 350-foot elevation.
2011-2015 Four new single family homes in Siufaga shoreline and 50-foot elevation.
Two new single family homes along road to Aoa between 175 and 350-foot elevation. The cumulative effect of this prospective residential growth is that the village housing stock will increase to roughly 130 housing units in the year 2015. During the same period, it is believed that the average household size will have gradually decreased to approximately 6.09 persons per household. Consequently, the future village population is estimated to include about 792 persons in the year 2015. Commercial Limited commercial facility expansion is anticipated in Amouli due to the lack of developable land. However, some potential commercial expansion is expected near the intersection of Tutuila’s primary shoreline roadway and the road to Aoa. The establishment of a laundromat is expected to be built between 1996 and the year 2000. ASPA also believes that two additional retail stores will be constructed between 2001 and 2005. Industrial Despite modest increases in future resident population, no additional light industrial operations or facilities are anticipated during the next 20 years in Amouli. The lack of developable land that would be suitable for industrial activities is the primary constraint to future industrial development in this community.
Amouli, Page 20-14
Public Facilities Population characteristics for Amouli in 1990 suggest that approximately six percent of the village population is three and four years of age. Elementary school-aged children (5 and 13 years old) include about 11 percent of the village population; high school students represented about 15 percent of the population. The application of 1990 population characteristics to the anticipated 2015 village population suggest increased student enrollments in future early childhood, elementary education, and high school programs within and outside of Amouli. Anticipated student enrollments from the village population are expected to be as follows in the year 2015:
• early childhood education 48 students • elementary school 87 students • high school 119 students Impact of Future Population Growth Upon Water Consumption and Waste Generation Future population growth and changes in land use in the Amouli watershed will increase the volume of future wastewater and solid wastes that are generated by local residents. Wastewater generation, for example, is expected to rise from about 30,955 gallons per day (gpd) in 1995 to 45,942 gpd in the year 2015 in Amouli Village (American Samoa Power Authority, 1996). The consumption of potable water will also increase with a growing population. The American Samoa Power Authority (ASPA) estimates that the average day demand for water in Amouli was about 44,222 gallons in 1995. By the year 2015, ASPA anticipates that the average demand will increase to roughly 65,632 gpd. Flood Potential A flood insurance study of American Samoa and related flood insurance rate maps were published by the U.S. Federal Emergency Management Agency in 1991. The study evaluated selected geographical locations throughout the Territory. Hydrologic and hydraulic analyses that were presented in the study were made by the U.S. Army Corps of Engineers, Pacific Ocean Division. A detailed analysis was made of three streams in the Amouli watershed. Inland Flood Potential The U.S. Army Corps of Engineers estimated that a 100-year peak discharge at the mouth of Televai Stream would be approximately 770 cfs. This discharge is expected to generate flood levels about 13 feet above mean sea level. The tributary of Televai Stream that carries surface runoff from the northwest side of Leauga Ridge was also examined by the U.S. Army Corps of Engineers. The 100-year peak discharge for this tributary was estimated to be 30 cfs. The unnamed stream (Stream 20C) that is situated east of the main village area is estimated to have a 100-year peak discharge of 130 cfs at its stream mouth. This discharge is expected to generate a flood level of 15 feet above mean sea level in the same area. Other portions of the watershed, which are north, east and west of the Amouli, Siufaga, and Fogaau areas have been designated “zone x” by the Federal Emergency Management Agency. This designation indicates that the area is outside of the 100-year flood plain consequently flood hazard potential in these areas is limited.
Amouli, Page 20-15
Coastal Flood Hazards The flood insurance rate map for the Amouli watershed indicates that there is a coastal flood hazard through much of the shoreline. A potential 100-year flood is estimated to generate base flood elevations of 3.0 feet above mean sea level along shoreline areas. Potential tsunami elevations have been estimated by the U.S. Army Corps of Engineers for two shoreline locations in the Amouli watershed:
• Shoreline at Sinatau Point: 3.3 feet above mean sea level (MSL) • Shoreline just west of Matautuele Point: 2. 7 feet above MSL Stormwater Runoff/Sedimentation and the Relationship to Surface Water Quality Storm runoff from the six streams that discharge storm runoff along the shoreline generate some increased turbidity and sedimentation levels in the nearshore waters that adjoin the Amouli watershed. These conditions primarily occur during or following after heavier rainfall periods. It is believed that natural sedimentation is the primary source of downstream sedimentation in the watershed. Portions of the surface runoff from the Laloi-Fusiloa Stream drainage are discharged into a man-made channel at the lower end of Laloi Stream. During a low flow condition in early May, 1996, a turbid discharge was being released into the nearshore waters. Consequently, the channel appears to help detain lower flows, but local soils apparently provide little filtering of the sediments carried downstream. In the lower Fusiloa Stream drainage, the stream divides into two drainage courses before entering Laloi Stream and the man-made channel. ASEPA should investigate the potential opportunity to construct a detention pond, with a controlled release, along these drainage courses between the 20 and 30-foot contour. If feasible, the detention pond could help detain stormwater flows before their discharge into the nearshore waters. Nearshore Water Quality and the Marine Environment Turbidity and Sedimentation The nearshore waters that adjoin the watershed are impacted by natural sedimentation, urban runoff, inadequately treated wastewater from cesspools and septic tanks, a limited discharge of piggery wastes, as well as wave action and nearshore currents. It is believed that natural sedimentation from upland slopes, as well as wave action and nearshore currents, are presently the primary influences upon nearshore water quality in the Amouli watershed. Coral communities are significantly dependent upon the availability of light and related photosynthesis, and occasional periods of significant turbidity and sedimentation do not promote long-term coral nutrition, growth, reproduction, and depth distribution (Richmond, 1993). When corals fertilize, they are free-swimming. Consequently, they need a good location to settle and make a good attachment. With significant soil deposition, sediments can physically interfere with the recruitment of coral larvae (Richmond, 1993; Dashbach, 1996). Coral communities are an important component of the overall ecology of the nearshore waters that adjoin the Amouli watershed. They provide shelter to fish, invertebrates, and other marine organisms. Some of these resources represent a supplemental food source for residents of Amouli.

Amouli, Page 20-16
Nutrient Inputs In future years, a greater impact can be expected from increased wastewater discharges. This impact will stem from increased residential development and the general inability of all soils in the watershed to support soil-based wastewater treatment. These inputs are potentially detrimental to the quality because they can adversely change the composition of the nearshore marine environment. However, the degree of impact upon water quality is also highly dependent upon currents and water exchange within the nearshore environment. Nevertheless, increased nutrient contributions to the nearshore waters should be an important resource management consideration. As the population of the watershed grows, nutrient and bacterial inputs will only increase. Aside from these resource management considerations, the future use of the nearshore waters for fishing, swimming and general recreation will eventually represent a more significant public health concern unless practical steps are made to reduce potential nearshore water contamination. It is recommended that the inhabited village areas in Amouli that are unsuitable for soil-based, wastewater treatment should be more specifically identified. As recommended in the ASPA Utilities Master Plan, this identification process should be based upon a more detailed sanitation survey of more densely inhabited areas such as Amouli Village. This survey would evaluate existing wastewater treatment practices, soil characteristics, the location and density of land uses, the distance to surface water supplies and the nearshore waters, topography, and other related factors. Using the conclusions and recommendations associated with this evaluation, ASPA and other participating Project Notification and Review System (PNRS) agencies will be better able to:
• require the use of septic tanks and leachfields that provide a sufficient amount of additional soil-based treatment;
• provide greater technical assistance to building permit applicants; and, if necessary, • deny building applications in land areas that are unsuitable for soil-based treatment systems. Long-Term Monitoring The future monitoring of water quality in the nearshore waters seaward of Amouli Village is necessary for long-term resource management. The nearshore waters should be monitored, at least, in the vicinity of the stream mouths of Tuavaa Stream and Laloi Stream, and at some point on the fringing reef flat. Turbidity and sedimentation are presently the primary stresses to the coral communities in the nearshore waters seaward of Amouli Village. However, future levels bacterial contamination and nutrient inputs should also be documented to help ensure future public safety and evaluate potential stresses to the fringing coral reef communities. In addition, the ASG Department of Marine and Wildlife Resources should monitor the coral communities along the reef front seaward of Amouli Village at least once every three years. Long-term monitoring of this site should also include an evaluation of the impact of turbidity, sedimentation, and nutrients that already influence the nearshore marine environment. Groundwater and Surface Water Supplies In the long term, long-term water quality and future water consumption demands can be addressed through the development of two, new groundwater wells at higher elevations within the Laloi Stream drainage. The potential location of these wells should be identified to traditional leaders of Amouli Village to help ensure that these areas are generally reserved for the future development of groundwater supplies. In the short-term, ASEPA should encourage the construction and use of household water catchment systems until adequate groundwater supplies can be developed. Elevated levels of bacterial contamination from the village water system only increase the potential for gastroenteritis-related illnesses and do not promote improved public health.

Amouli, Page 20-17
In order to conserve groundwater and surface water sources, it is recommended that a 100-foot buffer should be established around existing stream catchments, as well as future groundwater wells in the watershed. Traditional leaders of Amouli Village should be encouraged to designate these recommended setbacks and provide guidance to village residents. Existing stream catchment systems should be regularly chlorinated until their use is discontinued. MANAGEMENT NEEDS AND RECOMMENDATIONS The primary focus of future resource management in the Amouli watershed will be to:
• Discontinue use of surface supplies for potable water uses. Existing stream catchment systems should be regularly chlorinated until their use is discontinued.
• Begin use of individual roof catchment systems until groundwater wells can be developed by ASPA.
• Reserve locations for future groundwater well development. • Investigate potential stormwater detention opportunities along the lower Fusiloa Stream drainage. • Conserve coral communities in the nearshore waters. Representatives of participating public agencies should make periodic visits to the watershed to 1) observe, document, and monitor selected resource conditions, 2) determine potential methods of correcting a potential hazard or undesirable conditions, 3) share potential solutions with a designated resident of Amouli, and 4) encourage traditional village leaders and residents to participate in resource management solutions. The scope of issues that should be addressed by each agency in the field is summarized in Table 20-3. The general focus of recommended technical assistance is also identified. The experience and insights of agency representatives will determine the specific methodology to be used in the field.
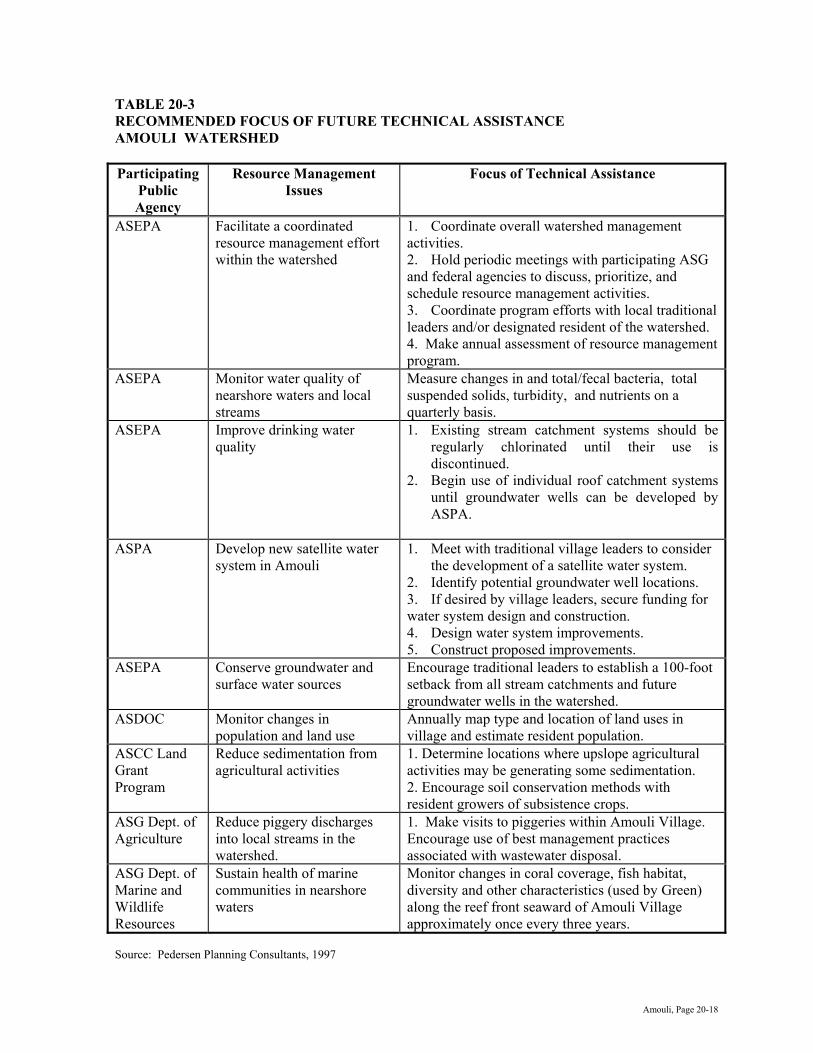
Amouli, Page 20-18
TABLE 20-3 RECOMMENDED FOCUS OF FUTURE TECHNICAL ASSISTANCE AMOULI WATERSHED Participating
Public Agency
Resource Management Issues
Focus of Technical Assistance
ASEPA Facilitate a coordinated resource management effort within the watershed
1. Coordinate overall watershed management activities. 2. Hold periodic meetings with participating ASG and federal agencies to discuss, prioritize, and schedule resource management activities. 3. Coordinate program efforts with local traditional leaders and/or designated resident of the watershed. 4. Make annual assessment of resource management program.
ASEPA Monitor water quality of nearshore waters and local streams
Measure changes in and total/fecal bacteria, total suspended solids, turbidity, and nutrients on a quarterly basis.
ASEPA Improve drinking water quality
1. Existing stream catchment systems should be regularly chlorinated until their use is discontinued.
2. Begin use of individual roof catchment systems until groundwater wells can be developed by ASPA.
ASPA Develop new satellite water
system in Amouli 1. Meet with traditional village leaders to consider
the development of a satellite water system. 2. Identify potential groundwater well locations. 3. If desired by village leaders, secure funding for water system design and construction. 4. Design water system improvements. 5. Construct proposed improvements.
ASEPA Conserve groundwater and surface water sources
Encourage traditional leaders to establish a 100-foot setback from all stream catchments and future groundwater wells in the watershed.
ASDOC Monitor changes in population and land use
Annually map type and location of land uses in village and estimate resident population.
ASCC Land Grant Program
Reduce sedimentation from agricultural activities
1. Determine locations where upslope agricultural activities may be generating some sedimentation. 2. Encourage soil conservation methods with resident growers of subsistence crops.
ASG Dept. of Agriculture
Reduce piggery discharges into local streams in the watershed.
1. Make visits to piggeries within Amouli Village. Encourage use of best management practices associated with wastewater disposal.
ASG Dept. of Marine and Wildlife Resources
Sustain health of marine communities in nearshore waters
Monitor changes in coral coverage, fish habitat, diversity and other characteristics (used by Green) along the reef front seaward of Amouli Village approximately once every three years.
Source: Pedersen Planning Consultants, 1997

Fagaitua, Page 21-1
FAGAITUA Watershed 21 GEOGRAPHY The Fagaitua watershed is located in the southeast part of the Island of Tutuila. The watershed comprises about 1.88 square miles of land area (Figure 21-1). The watershed is delineated by the peaks and steeper slopes of Palapala Mountain, Etemuli Mountain, Filiae Mountain, Leaeno Mountain, and Leauga Ridge. Distinct mountain ridges that are downslope of the mountain peaks include Maugaleoo Ridge on the north side of Auto Village and Palapala Ridge (southwest of Fagaitua Village). Maugaoalii Ridge separates the villages of Fagaitua and Pagai. Filimaoi Ridge lies between Pagai Village and Alofau Village. The Fagaitua watershed is located between Faasouga Point (on the southwest side of Auto Village) and by Sinatau Point. The major coastal feature is Fagaitua Bay, which extends along the shoreline between these two points. The watershed contains approximately 12 drainage areas that discharge into the nearshore waters of Fagaitua Bay.
• Four streams are situated in the vicinity of Alofau Village between Lifalifa Point and Asasama Point.
• Punaomanuia Stream is located between Filimaoi Ridge and Maugaoalii Ridge and flows through Pagai Village.
• Four streams drain steeper mountain slopes that are upland of Fagaitua Village. • Two streams are situated between Palapala Ridge and Maugaleoo Ridge near the Amaua and
Afulei areas. • Along the northeast slopes of Palapala Mountain, Muliolevai Stream flows downslope through the
village of Auto before discharging into the nearshore waters. RESOURCES OF THE WATERSHED Soils The U.S. Soil Conservation Service (National Resource Conservation Service) published a Soil Survey of American Samoa in 1984. Selected information derived from this survey provides some useful information for future watershed planning and management (Figure 21-2). Six different soil classifications were identified by the U.S. Soil Conservation Service for lands within the Fagaitua watershed (Table 21-1). Urban Land-Ngedebus Complex Urban land-Ngedebus complex soils (SCS mapping unit 35) are generally present in the inhabited areas and shoreline of all villages in the watershed except Pagai Village, the east end of Fagaitua Village, and the north end of Auto Village. These soils generally comprise coral fragments, sand, cinders and other material that have been graded or filled to support residential, commercial and public facilities in the village areas.
The Ngedebus soil extends to a depth of 60 inches or more. The surface layer, which extends about 4 inches below ground elevation, typically contains light, brownish-gray and brown sand. The underlying material is characterized by pale brown and light yellow, brown sand. The permeability of Ngedebus soil ranges between six and 20 inches per hour. Surface drainage on this soil is generally


Fagaitua, Page 21-4
TABLE 21-1 SELECTED SOIL CHARACTERISTICS FAGAITUA WATERSHED
Soil Depth To: Land Use Suitability SCS Soil Unit
Name Typical Slope
(Percent)
Flood Runoff Erosion High Water (Feet)
Bed Rock
(Inches)
Soil Based WW
Treatment
Subsistence Ag
Potential
1 Aua very stony silty clay loam
15-30 None Med Med >6 <60 Severe Slope Moderate
2 Aua very stony silty clay loam
30-60 None Rapid Severe <6 <60 Severe Slope Poor
3 Fagasa-Ofu silty clays
30-60 None Med to Rapid
Med to Severe
>6 20-40 Severe Slope Depth
Moderate
4 Fagasa family-Lithic Hapludolls-Rock outcrop assoc
70-130 None Very Rapid
Very Severe
>6 20-60 Severe Slope Depth
Limited
34 Urban land-Aua-Leafu complex
0-30 A.None L. Occ
A.Slow to Med
A.Slightto Mod L.Slight
A.>6 L.3-5
>60 Severe A. Slope L. Flood Wet
Limited
35 Urban Land-Ngedebus complex
0-5 Occ. Brief
Slow Slight >3.5 >60 Severe Flood Wet Pool Filter
Poor
Notes: A.= Aua- found on mountain foot slopes 6-30 percent L.= Leafu- found on coastal plains & valley floors 0-6 percent Source: U.S. Soil Conservation Service, 1984 slow, and the hazard of potential soil erosion is slight. In some places, the soil is subject to occasional, brief periods of flooding during prolonged, heavy rainfall or during high tide (U.S. Soil Conservation Service, 1984). These soils are generally suitable to support residential and commercial development in areas that are protected from flooding. However, this soil is poorly suited in unprotected areas. Where moderate to higher housing densities occur, the U. S. Natural Resources Conservation Service recommends the use of community sewage systems prevent the potential contamination of groundwater and surface water supplies. Lower housing densities are present throughout Pagai, Utusia, Amaua, and Afulei. However, moderate to higher densities occur in the villages of Auto, Fagaitua, and Alofau. Urban Land-Aua-Leafu Complex (0 to 30 percent slopes) Four areas in the Fagaitua watershed are characterized by soils known as the Urban Land-Aua-Leafu complex (SCS mapping unit 34).
• The first area is in the northern half of Auto Village; • The east end of Fagaitua Village; • Pagai Village and most of the Punaomanuia Stream drainage; and • Lower portions of Fogaliliniu Stream drainage and the lower half of an unnamed drainage in
Alofau that flows past the south side of the Elementary School. This soil type represents a combination of Aua and Leafu soils. These soils typically are found at depths of 60 inches or more. The permeability of this soil is moderately rapid and ranges between 2 and six inches per hour. The soil has limited to moderate potential for runoff. The erosion potential is slight to moderate.
Fagaitua, Page 21-5
This soil has limited potential for subsistence agriculture. The U.S. Soil Conservation Service estimates that this soil can annually sustain up to 5 tons per acre of erosion without impacting crop productivity (U.S. Soil Conservation Service, 1984). Consequently, the use of these lands for subsistence agriculture is not likely to generate significant downslope erosion. The use of these soils for septic tank systems and related soil-based wastewater treatment is not desirable. A higher composition of larger rock fragments, combined with moderately rapid permeability, do not promote effective wastewater treatment. Consequently, the cumulative use of septic tanks and cesspools in areas that contain these soils may be making a significant contribution of nutrients and bacteria into the nearshore waters of Fagaitua Bay. Aua Very Stony Silty Clay Loam (15 to 30 percent slopes) Aua very stony silty clay loam soils (SCS mapping unit 1) are characteristic in two areas of the watershed.
• Upland from the north end of Amaua Village; and, • The lower portion of the Auvai Stream drainage that is located northwest of Fagaitua High School. These soils typically occur up to about 60 inches in depth. The permeability of these soils ranges between 2 and 6 inches per hour. The potential for runoff or erosion from the Aua soils is believed to be moderate (U.S. Soil Conservation Service, 1984). While moderately suited for agricultural production, the U.S. Soil Conservation Service estimates that this soil can annually sustain up to 5 tons per acre of erosion without impacting crop productivity (U.S. Soil Conservation Service, 1984). However, the U.S. Soil Conservation Service also advises that the stony and erosive characteristics of these soils may limit production. While the erosive characteristics of this soil generally may not significantly impact subsistence crop productivity, the erosive quality of the soil can be a significant contributor to sedimentation in downslope streams and the nearshore waters. However, the natural infiltration area below these soils may provide a place for the deposition of eroded soil material and the recharge of silt-laden runoff. The general characteristics of these Aua soils are also undesirable for individual wastewater disposal systems (U.S. Soil Conservation Service, 1984). These soils contain a significant amount of larger stones that typically hamper installation and provide inadequate soil treatment. Aua Very Stony Silty Clay Loam (30 to 60 percent slopes) Areas that contain Aua very stony silty clay loam soils (SCS mapping unit 2) are scattered throughout the watershed. These soils are prevalent along the steeper slopes of several drainages in the watershed, as well as on steeper slopes southeast of Cape Fogausa. The Aua soils range between seven to 60 inches in depth. The permeability of these soils (between 2 and 6 inches per hour) is moderately rapid. For watershed management purposes, it is important to note that these Aua soils have a high potential for runoff and erosion. This Aua soil is not recommended for agricultural production because of the stoniness of the soil, the high erosion potential, and hazards associated with subsistence crop cultivation on steeper slopes. However, when cultivation in these soils is necessary, the use of a mulch or ground cover is recommended to reduce soil erosion in cultivated areas. The U.S. Soil Conservation Service estimates that this soil can annually sustain up to 5 tons per acre of erosion without impacting crop productivity (U.S. Soil Conservation Service, 1984). While the erosive characteristics of this soil generally may not significantly impact subsistence crop productivity, the erosive quality of the soil can be a significant contributor to sedimentation in downslope streams and the nearshore waters.

Fagaitua, Page 21-6
The general characteristics of these Aua soils are also undesirable for individual wastewater disposal systems (U.S. Soil Conservation Service, 1984). These soils contain a significant amount of larger stones that hamper installation and provide inadequate soil treatment. Fagasa Family-Lithic Hapludolls-Rock Outcrop Association Steeper upland land areas throughout most of the remaining watershed contain deep, well-drained soils on steep mountain ridges and slopes. The U.S. Soil Conservation Service identifies these soils as part of the Fagasa family-Lithic Hapludolls-Rock outcrop association (SCS mapping unit 4). Since this soil type is a combination of two general soil classifications, soil depths can vary between 20 and 60 inches. The soil represents a combination of silty clay and loam. Since the Fagasa Family-Lithic Hapludolls soil typically occurs on very steep slopes, the potential for surface runoff and erosion are high. The cultivation of subsistence crops on these soils is not considered desirable. However, when cultivation in these soils is necessary, care should be exercised to minimize the amount of exposed soil in cultivated areas. When heavier rainfall events occur, significant erosion of these soils can be expected from undeveloped upslope areas of the watershed. Natural runoff from steeper slopes in the watershed carries water, sediments, and organic debris to downslope drainage courses and streams. Such erosion can readily influence downstream water quality. Fagasa-Ofu Silty Clays Soils along the west side of Leaeno Mountain, the upper Tialu Stream drainage, and the west side of Leauga Ridge are identified by the U.S. Soil Conservation Service as Fagasa-Ofu Silty Clays (SCS mapping unit 3). The soil ranges between 20 to 40-inches in depth. The permeability of this silty clay loam is moderately rapid (2 to 6 inches per hour). The potential for surface runoff from these soils is considered moderate to rapid. However, the potential for erosion is moderate to severe. The U.S. Soil Conservation Service indicates that this soil type is somewhat suitable for the production of subsistence crops. The soil can annually sustain from one to 5 tons per acre of erosion without impacting crop productivity. However, the Soil Conservation Service recommends the use of mulch, crop residues, and cross-slope farming to reduce the potential for soil erosion. Streams Stream Locations The watershed contains approximately 12 drainage areas that discharge into the nearshore waters of Fagaitua Bay.
Alofau Village Area
In the vicinity of Alofau Village, there are three streams that discharge into the nearshore waters.
On the south side of the Village, an unnamed stream (Stream 21A) drains surface runoff from the west slopes of Leauga Ridge.
Nuu Stream and one tributary carry runoff from the northwest slope of Leauga Ridge; this stream course originates about 175 feet above mean sea level.

Fagaitua, Page 21-7
An unnamed stream (Stream 21B) and two tributaries establish, which begin near the 400-foot contour, carry surface runoff near the center of Alofau Village and flows past the south side of the Elementary School before its shoreline discharge south of the village malae.
Fogalilimu Stream drains a portion of the surface runoff from the southwest side of Leaeno Mountain and the south side of Filimaoi Ridge. This stream flows through the north end of Alofau; a defined stream course is evident until about 15 feet above mean sea level. Smaller drainage ditches likely carry surface runoff to an existing box culvert under the primary shoreline roadway. Pagai Village
Punaomanuia Stream and one tributary are located upland of Pagai Village between Filimaoi Ridge and Maugaoalii Ridge. This stream, which originates near the 500-foot contour, transports surface runoff from the southwest slopes of Leaeno Mountain and the two lower mountain ridges. Punaomanuia Stream and its tributary join in the upper part of the inhabited village area and drain through smaller channels and ditches to the nearshore waters. Fagaitua Village Area
Four streams drain the steeper mountain slopes that are upland of Fagaitua Village.
Along the northwest side of Maugaoalii Ridge, Tialu Stream is situated along the west side of the primary road to Masefau, Masausi, and Sailele. The stream begins at about the 340-foot elevation. Surface and stormwater runoff appear to pond in a lower area on the northwest side of the primary shoreline roadway and the primary road to Masefau, Masausi and Sailele before discharging into the nearshore waters.
Vaialufai Stream carries runoff from the steeper mountain ridges between Filiae Mountain and Leaeno Mountain. This stream originates about 475 feet above mean sea level. This drainage transports flows through the east side of Fagaitua Village before its discharge into the nearshore waters. Runoff from Vaialufai Stream also ponds in the same lower area near the lower end of the Tialu Stream drainage.
Siapapa Stream originates near the 500-foot contour and is situated immediately upland of Fagaitua High School. This stream carries runoff from the southeast slopes of Filiae Mountain. As the stream course enters Fagaitua Village, it flows along the east side of the high School. A smaller man-made ditch carries the runoff through the adjoining residential area to the shoreline.
The largest drainage in the Fagaitua Village area is Auvai Stream. This drainage consists of the main Auvai Stream course and seven tributaries. Auvai Stream transports surface runoff from the northeast slopes of Etemuli Mountain, the north side of Palapala Ridge, and the south slopes of Filiae Mountain. Stream flows continue through the west side of Fagaitua before it discharges into the nearshore waters north of Tolisi Point. Amaua and Afulei Area
Two drainages are situated between Palapala Ridge and Maugaleoo Ridge near the Amaua and Afulei areas.
An unnamed stream (Stream 21C) and six tributaries transport surface runoff from the southeast slopes of Etemuli Mountain. This stream originates about the 900-foot contour and eventually passes through the central part of Amaua Village before its shoreline discharge.
Afulei Stream and three tributaries lie east of Maugaleoo Ridge. This drainage begins at about the 860-foot elevation and carries runoff from the south slopes of Etemuli. The stream course passes through the Afulei area and ultimately empties into the nearshore waters that are south of Anapeapea Point.
Fagaitua, Page 21-8
Muliolevai Stream originates about the 950-foot elevation. This stream drains surface runoff from the southeast slopes of Palapala Mountain and the southwest slopes of Maugaleoo Ridge. Auto Village Area
Along the northeast slopes of Palapala Mountain, Muliolevai Stream drainage begins at approximately 925 feet above mean sea level. The main stream course and six tributaries carry runoff downslope through the village of Auto before discharging into the nearshore waters.
Stream Flows Within the Watershed While 12 drainages contribute surface runoff into Fagaitua Bay, stream flows from only one stream in the entire watershed have been recorded. However, in May 1996, residents and traditional leaders from the Fagaitua watershed area also provided some insights related to general stream flow characteristics.
Alofau Village Area
Nuu Stream flows intermittently. Stream flows occasionally generate some localized flooding (Lee, 1996).
A low flow condition was observed in May, 1996 along the unnamed stream (Stream 21C) that passes the south side of the Elementary School. Some trash accumulation in the stream was also constraining stream flow.
Fogaliliniu Stream apparently flows throughout the year (Lee, 1996). A low-flow condition was observed by Pedersen Planning Consultants on May 4, 1996. An adjoining mangrove wetland, immediately upland of the Stream, provides some filtering and limited detention of surface runoff. Pagai Village
Stream flow from Panoamanuia Stream flows into a small depression and wet area that is adjacent to the inhabited area of the village. Lower and medium stream flows likely detain in this areas before their discharge into the nearshore waters that adjoin the lower coastal plain. However, higher stream flows are discharge rapidly into the adjoining nearshore waters (Silila, 1996).
Fagaitua Village Area
In May 1996, low flow conditions were observed along Tialu Stream, Vaialufai Stream, Siapapa Stream, and Auvai Stream. Amaua and Afulei Area
The unnamed stream (Stream 21C) that passes through Amaua Village flows intermittently. The stream discharge is frequently blocked during lower flow conditions. This condition was documented in May 1996. However, during higher flow conditions, the stream mouth usually opens to the nearshore waters (Tavai, 1996). Auto Village
A low-flow, partial-record station (No. 16961000) was established on Muliolevai Stream (upslope of Auto Village), approximately 0.5 mile upstream from the stream mouth, between 1958 and 1976. Sixteen measurements of stream flow that were recorded during this period led the U.S. Geological Survey to estimate a median flow of 0.48 cubic feet per second (Wong, 1996).

Fagaitua, Page 21-9
Aquatic Fishes and Invertebrates Field surveys of fishes and invertebrates were made by the U.S. Fish and Wildlife Service, Division of Ecological Services, in March-April, 1978 and the U.S. Army Corps of Engineers in August, 1980. Auvai Stream was one of 37 streams in American Samoa that was inventoried by representatives of these federal agencies. Results from both field surveys were summarized in an American Samoa Stream Inventory that was published by the U.S. Army Corps of Engineers, Honolulu District, in July, 1981. Auvai Stream was surveyed in two locations. Station 16a was located in a shallow run underneath a bridge along the primary shoreline roadway. Station 16b was situated near an upstream confluence with an unnamed tributary of Auvai Stream that was located at about the 40-foot elevation. Near the shoreline, only one specie of gobie fish was identified. Four species of shrimp were also recorded at station 16a. Otherwise, no other invertebrates were observed at station 16a. Two species of gobie fish were documented upstream at station 16b. Seven species of shrimp were also reported; one of the species was abundant. Surface Water Quality Streams No known data is available concerning the surface water quality of streams in the Fagaitua watershed. Nearshore Waters
1979
Field surveys conducted for the 1980 Coral Reef Inventory also provide some limited insights concerning water quality on the West Side of Fagaitua Bay. Marine biologists observed an underwater visibility of about 75 feet on the fringing reef northeast of Faasouga Point. In contrast, the biologists concluded that suspended matter seaward of the Muliolevai Stream mouth kept the nearshore waters turbid and generated decreased visibility. Water circulation shoreward of the ava at Auto Village was believed to be restricted because of noticeably warmer and more murky waters (Aecos and Aquatic Farms, 1980).
Seaward of Alofau Village, marine biologists also noted that underwater visibility in the nearshore waters was about 20 feet during an August-September, 1979 survey. Visibility increased to about 30 feet seaward of the dredged section of reef, and increased to 40 feet at the reef margin. Along the reef front, the limit of visibility was approximately 60 feet (Aecos and Aquatic Farms, 1980). 1992
ASEPA collected marine water samples from 17 embayments around the Island of Tutuila on July 25 and August 2, 1992. The samples were obtained from the outer portions of the embayments where more water exchange occurs at depths of three and 60 feet. Collected samples were subsequently analyzed for nutrients and chlorophyll a.
Nutrient data gained from these samplings indicate that the outer waters of Fagaitua Bay met American Samoa water quality standards in late July and early August of 1992 (Table 21-2). Laboratory results also suggest that stormwater runoff from undeveloped lands upland of Fagaitua Bay may not generate any significant discharge of nutrients.

Fagaitua, Page 21-10
TABLE 21-2 SURFACE WATER QUALITY OUTER FAGAITUA BAY JULY-AUGUST, 1992
Sample Depth (feet)
Nitrate/ Nitrite Mg N/l
Total N
Mg N/l
Kjeldahl N
Mg N/l
Total P
Mg P/l
CHL a
Mg/m3
3 60
<0.001 <0.001
0.132 0.087
0.132 0.087
0.011 0.005
0.53 0.34
Source: ASEPA, 1995
1995
Two water samples were collected from the nearshore waters of Fagaitua Bay in early 1995 (AECOS, 1995). These samples were analyzed for nutrient concentrations; laboratory results are presented in Table 21-3.
TABLE 21-3 RANDOM SAMPLE FROM NEARSHORE WATERS FAGAITUA BAY EARLY, 1995
Parameter Station Fagaitua 1 Fagaitua 2 Total Nitrogen (µg-N/l) 99 146 Total Kjeldahl N (µg-N/l) 82 133 Nitrate-Nitrite (µg-N/l) 17 13 Total Phosphorus (µg-P/l) 12 12 Chlorophyll α (µg/l) 0.17 0.17
Source: AECOS, 1995 The nutrient values from this random sampling in Fagaitua Bay are comparable with similar measurements in other embayments on the Island of Tutuila. The laboratory results do not indicate any evidence of significant degradation. A correlation with data from the outer waters of Fagaitua Bay is not possible since the depth and location the 1995 sampling is not available.
Wetlands Alofau At the northern end of the village of Alofau, a small mangrove swamp that comprises about two acres of land area is located near the mouth of Fogalilimu Stream. The swamp is situated at about six to seven feet above mean sea level. “Most of this wetland is disturbed and contains a mix of patchy vegetation, open water, and exposed sand flats…Red mangrove, beach hibiscus, and swamp fern dominate the vegetation within the mangrove swamp. A narrow strip of sedge extends along the western side of the wetland” (Biosystems Analysis, Inc., 1992).

Fagaitua, Page 21-11
This wetland area represents a continued opportunity for stormwater detention and the conservation of a mangrove swamp environment. Traditional leaders of Alofau should be encouraged to carefully select future lands for residential expansion. Future residential expansion would ideally not encroach upon the existing wetland. Existing piggeries should also be relocated to facilitate the effective uses of the wetland. Pagai
A portion of the inhabited village area at Pagai is located on a small, lower coastal plain that is downslope of the primary shoreline roadway. A small wetland area or swamp, which contains approximately 2.5 acres, is situated adjacent to about 10 homes and the adjoining shoreline. A portion of this wetland contains mangrove.
Sheet flow from upland slopes and drainage from Panoamanuia Stream discharge into this wetland before surface runoff is discharged into the nearshore waters. As stated earlier, discussions with a local resident in May, 1996 indicate that this wetland detains low to medium flows; higher stream flows discharge rapidly into the nearshore waters (Silila, 1996). Consequently, this wetland reduces the potential flooding in the lower part of Pagai Village, and likely settles out sediments during low to medium flow conditions.
Because of the importance of this wetland, it is important that traditional leaders of this village be encouraged to carefully select lands for future residential expansion. Any future expansion would desirably not encroach upon the existing wetland. Marine Resources Coral Communities Fagaitua Bay is the second largest embayment on the Island of Tutuila. The fringing reef within the Bay is extensive and generally extends between 1,000 to 1,500 feet seaward of the shoreline. The fringing reef in Fagaitua Bay is indented by several channels, or ava, that provide boat access to the villages of Auto, Amaua, Fagaitua Village, Pagai, and Alofau. Various private consultants have made field investigations of the fringing reefs in these areas since the late 1970’s. In a cumulative sense, the available survey information suggests that:
• Reduced water circulation in the nearshore waters seaward of Muliolevai Stream mouth (adjacent to Auto Village) may be limiting the development of corals in this area.
• In early 1978, the reef front between Asasama Point and Auto Village was reportedly infested by the crown-of-thorns starfish.
• A crown-of-thorns starfish infestation also occurred seaward of Alofau in 1978. An older fisherman from Alofau reported that this infestation was the first significant evidence of starfish in this area since 1916.
• In April 1992, photographs and aerial overflights indicated a common occurrence of sheets and tracks of dead coral rubble on the outer reef flats. Biologists believed that the dead coral rubble was probably deposited by larger waves that occurred during recent storms.
• The 1996 Status of Coral Reefs of the Samoa Archipelago report indicated that a rapid increase in coral cover at Fagaitua occurred between 1994 and 1996. This growth was facilitated by encrusting corals and favorable water quality.
1978-1979
North of Faasouga Point, coral coverage was about 50 percent along the sides of a channel on the inner reef flat. Coral coverage along the channel reduces to about five percent coverage about 200 feet from the shoreline.
Fagaitua, Page 21-12
Seaward of Auto Village, the fringing reef extended approximately 600 feet offshore. The bottom of the middle reef was characterized primarily by rubble. The outer reef flat comprised more consolidated rubble and limestone pavement at depths of one to two feet (Aecos and Aquatic Farms, 1980).
“The fringing reef northeast of Muliovlevai Stream mouth and the ava is about 300 feet across. Extensive rubble flats extend offshore to a narrow zone of consolidated limestone near the reef margin. Inshore areas northeast of the ava consist of rubble covered by sand and silty-sand. Northeast of the ava, between 75 to 150 feet offshore, coral wheels up to 2 feet across high and 6 feet are separated by areas of unconsolidated rubble” (Aecos and Aquatic Farms, 1980).
Seaward of the Muliolevai Stream mouth, coral coverage was observed to about 10 percent. Coral wheels were documented between 75 and 150 feet offshore. Dead coral heads represented approximately 50 percent of the bottom cover. Marine biologists observed that reduced water circulation in this area may have limited the development of corals in the nearshore waters (Aecos and Aquatic Farms, 1980).
Coral coverage on the outer reef platform was less than five percent in August and September, 1979. Some crown-of-thorns starfish were discovered feeding on corals, but there was no evidence of any recent, massive predation on coral communities (Aecos and Aquatic Farms, 1980). This contrasts to earlier reports of significant infestation of the reef front between Auto Village and Asasama Point in early 1978.
Seaward of Amaua, the reef flat that is seaward of a nearshore channel contained a coral coverage of up to 75 percent. On the middle reef flat, corals accounted for approximately 15 percent of the cover.
In contrast to other parts of Fagaitua Bay, the reef that fronts Fagaitua Village is situated in waters that are considerably more protected. Extensive amounts of coral were observed along the middle reef where depths ranged between 0.9 and 3.0 feet. Biologists noted that:
“Large thickets of Acropora formosa 50 to 100 feet across rise to near the surface in a lagoon off the western side of Fagaitua Village. This growth is apparently of recent development, as the lagoon was barren in 1974 and only scattered patches of staghorn Acropora (totaling about 10% cover) were seen in 1978” (Aecos and Aquatic Farms, 1980).
The reef front that is seaward of Fagaitua Village sloped to a depth of about 65 feet within 330 feet of the reef margin. Reef slopes are characterized by a low-profile spur-and-groove system.
Juvenile crown-of-thorns starfish were documented on the Fagaitua reef flat in August, 1977. The evidence of dead coral patches in late 1978 attested to the earlier predation by the crown-of-thorns starfish. Prior to the 1977-1978 infestation, earlier studies reported a coral coverage that ranged between 40 and 60 percent along the inner and middle reef flat areas west of Vaialufai Stream mouth (Aecos and Aquatic Farms, 1980). However, in late 1978, coral cover neared 100 percent on the middle reef flat that was almost 500 feet from the shoreline (Aecos and Aquatic Farms, 1980).
Between Asanama and Lifalifa Point, biologists noted in late 1979 that that the prior dredging of Alofau reef was discontinued in late 1970. A causeway that once extended onto the reef was removed to improve water circulation. Remnants of the causeway, which were about 15 feet across, were exposed at low tides (Aecos and Aquatic Farms, 1980).
The middle of the reef flat seaward of the dredged area was covered primary by white sand and some rubble. Depths in this area generally ranged between two and four feet, but some dredged areas contained depths that ranged between 10 and 20 feet deep. The outer reef flat shoals contained a bottom that was composed almost entirely of rubble.

Fagaitua, Page 21-13
Coral cover on Alofau reef was documented to be up to 30 percent in August-September, 1979. Less that one percent cover was evident on the shallow outer reef flat. Coral cover along the reef margin was variable and primarily contained wave-resistant species of Acropora.
In August-September, 1979, the reef front at Alofau was nearly devoid of live coral. However, about 30 percent of the corals on the upper reef front remained alive at depths between six and 33 feet.
Biologists also noted a discussion with an older fisherman, who apparently resided in the Fagaitua watershed. The fisherman recalled that the crown-of-thorns starfish was abundant on both the reef flat and reef front of Alofau in 1916, but was not common again until 1978.
In early 1978, a few crown-of-thorns starfish were reported on the forereef slopes seaward of Sinatau Point. However, the crown-of-thorns starfish was not evident. 1992
Field investigations were also made in at Fagaitua Bay by Maragos, Hunter, and Meier in 1992. Surveys within the Fagaitua watershed examined the fringing reef that is adjacent to Auto, central Fagaitua, and Alofau.
Aerial overflights and photographs, which were taken in April 1992, indicated that sheets and tracks of dead coral rubble were common on the outer reef flats. These biologists concluded that the dead coral rubble was likely deposited by larger waves during recent storms. Overall coral coverage averaged 10 percent or less and was lower at shallow depths.
Seaward of Auto, coral coverage on the fringing reef was observed to be one to five percent at depths of 6 meters. However, coral coverage increased to 5 percent at 18 meters.
In the central part of Fagaitua Bay that fronts Fagaitua Village, coral coverage was less than one percent at the six meter depth. Coral coverage increased to between one and five percent at the 18-meter depth.
Coral coverage seaward of Alofau Village was less than one percent at 6 meters. However, coral cover ranged from one to five percent at the 18 meter depth. 1995
A 1995 survey of various coral reefs throughout the Samoan Archipelago included a survey of the fringing reef front that fronts Fagaitua Village. The transects began approximately 20 meters west of the main ava and continued west. The study focused primarily upon the quantification of coral communities, the abundance and diversity of reef fish, and selected habitat characteristics.
Field observations at Fagaitua Bay indicate that coral coverage was observed to be “low”, or less than 20 percent coverage. At the same time, Green concludes that the recent recovery of corals in the aftermath of Hurricane Val was significant. Coral coverage increased from an average of about 13 percent in 1994 to approximately 39 percent in 1996. The rapid increase in coral cover at Fagaitua was credited primarily to encrusting corals, as well as favorable water quality (Green, 1996).
Between 100 and 149 species were documented at the Fagaitua survey site. Fish density was also observed to range between 5,000 and 9,999 individuals per ha while fish biomass ranged between 500 and 999 kilograms per ha.

Fagaitua, Page 21-14
Wildlife Resources Aecos and Aquatic Farms noted that two caves are found along the shoreline between the villages of Auto and Amaua. One cave measures 40 feet wide, 15 feet high, and about 15 feet deep. The floor has a shallow sand layer. U.S. Marines originally built a series of concrete steps (about 5 feet) up to the cave entrance. A larger cave known as Anapeapea is situated at Anapeapea Point, which is southwest of Amaua Village. The entrance to the cave measures about 40 feet high and 40 feet wide. The black noddy, a resident seabird uncommon in American Samoa, is reported to nest on Anapeapea Point. Sheath-tailed bats roost in caves at Anapeapea Point (Aecos and Aquatic Farms, 1980) Shoreline Protection At Auto Village, rocks ranging between 6 inches and 2.5 feet in diameter have been dumped on the shoreline to provide some shoreline protection. During the May, 1996 survey, significant shoreline erosion that was evident along the east side of the Village generated significant damage to the foundation of the shoreline roadway. Ongoing erosion had already removed soil and foundation material from, at least, 10 feet of the primary shoreline roadway in the vicinity of Afulei Stream mouth. A collapse of the roadway surface appeared imminent. Sea Engineering, Inc. and Belt Collins Hawaii documented a deteriorating loose rock revetment along the shoreline at Amaua Village in 1994. However, Pedersen Planning Consultants observed that this revetment was not present in May, 1996. The shoreline had retreated some 25 feet inland of the former revetment. A deteriorating revetment is situated between the west side of Tolisi Point and the east end of Utusia Village. Otherwise, this shoreline is afforded some protection by the fringing reef that dissipates some of the incoming wave energy. The shoreline of Fagaitua Village is characterized by a loose, deteriorating rock revetment of piled rocks that average about one foot in diameter. The revetment is in poor condition throughout the reach, and the rocks are slumping onto the foreshore (Sea Engineering, Inc. and Belt Collins Hawaii, 1994). On the lower coastal plain of Pagai Village, a 10 foot high loose revetment of rocks is located along the east side of the beach that fronts Pagai. This revetment was damaged by Hurricane Val in December, 1991 (Silila, 1996). Rock-filled metal containers are along the center of the beach (Sea Engineering, Inc. and Belt Collins Hawaii, 1994). Marginal shoreline protection exists along most of the shoreline that fronts Alofau Village. Existing shoreline protection includes a combination of piled rocks, construction debris, gabions, and vertical concrete walls. The central part of the Alofau Village shoreline contains approximately 100 feet of unprotected shoreline where a sand beach is present (Sea Engineering, Inc. and Belt Collins Hawaii, 1994). Groundwater and Surface Water Supplies Groundwater Supply and Quality All villages in the Fagaitua watershed are served by ASPA’s primary water system. Consequently, residents of the watershed are dependent upon the groundwater supplies that are used to support the ASPA system. Within the Fagaitua watershed, there is one groundwater well that produces a portion of the groundwater supply to the overall ASPA system.

Fagaitua, Page 21-15
During the May, 1996 survey, this groundwater well was observed on the northwest side of Fagaitua Village. The well is situated some 700 feet northwest of Fagaitua High School at about the 75-foot elevation. Available water quality records suggest the presence of a second groundwater well in the vicinity of Alofau; however, this well is not part of the ASPA system. Ground water samples were collected from Alofau well #32 on July 5, 1989 (USGS, 1994; STORET, 1996). The sample revealed no trace of coliform bacteria or trihalomethanes, but did exceed the USEPA's maximum contaminant level (MCL) for dissolved solids and chloride concentration. The elevated chloride levels suggest a mixing of ground water with sea water near the margin of the basal aquifer. No evidence of contamination by metals, pesticides, or volatile organic compounds was detected in the sample. Surface Water Supply and Quality In April 1986, M&E Pacific made a survey of existing village water systems on the Island of Tutuila. Two systems were identified in the Fagaitua watershed. Since the ASPA water system was extended to Alofau Village and the other villages of the Fagaitua watershed in 1996, some stream catchment systems may remain in operation. However, it is believed that the use of these surface supplies is primarily for non-potable uses. A stream catchment is located upstream of Auto Village along Muliolevai Stream at about the 325-foot elevation. These surface supplies serve Avaio, Auto, Afulei, Amaua, Utusia, Fagaitua, and Pagai. A second village water system in the Fagaitua watershed is located in Alofau. A stream catchment is located along Stream 21 B at about the 350-foot contour. The same system is also supplied by a fresh-water spring that is located upslope and northeast of Nuu Stream. Historical data suggests from the 1981-1986 period indicates that the Alofau and Auto water systems contained moderate coliform contamination. Laboratory results indicated a median of 39 coliforms per 100 milliliters for the Alofau system during the 1981-1986 period (M&E Pacific, 1987). The Auto system was characterized by a median of 69 coliforms per 100 mililiters during the same period. More recently, available data collected by ASEPA in FY 1994 indicates that generally comparable water quality was detected in both village water systems. Proposed Water System Improvements The draft Utilities Master Plan, prepared by ASPA consultants in 1995, calls for the construction of the following improvements in the Fagaitua watershed area:
• Construct a 100,000-gallon water storage tank in the vicinity of Auto Village to provide adequate water storage for the villages between Laulii and Fagaitua.
• Construct a 100,000-gallon water storage tank in the vicinity of Alofau Village to provide adequate water storage for the villages of Alofau and Pagai.
USE OF THE WATERSHED Resident Population
Auto
Between 1980 and 1990, the resident population of Auto Village increased from 201 to 255 residents. Such growth represented an average annual growth rate of about 2.7 percent. Development activity between 1990 and 1995 increased resident population to about 348 persons.

Fagaitua, Page 21-16
Population trends reflected in the 1990 Census statistics for Auto Village suggest that some in-migration has occurred in this community between 1980 and 1990. The proportion of residents who were born outside of American Samoa during the 1980-1984 period was about 22 percent. Between 1985 and 1990, the proportion increased to 31 percent. However, in 1990, the proportion dropped slightly to 30 percent. ASPA believes that the rise in number of residents who were born outside of American Samoa suggests a modest in-migration from American Samoans who were originally born in the continental United States. Amaua
Between 1980 and 1990, the resident population of Amaua Village increased from 90 to 128 residents. Such growth represented an average annual growth rate of about 4.2 percent. Development activity between 1990 and 1995 increased resident population to about 170 persons.
Population trends for Amaua Village reflected in the 1990 Census statistics suggest that some in-migration has occurred in this community between 1980 and 1990. The proportion of residents who were born outside of American Samoa during the 1980-1984 period was about 13 percent. Between 1985 and 1990, the proportion increased to almost 20 percent. However, in 1990, the proportion more than doubled to almost 48 percent. Fagaitua
Between 1980 and 1990, the resident population of Fagaitua Village increased from 422 to 455 residents. Such growth represented an average annual growth rate of almost 0.8 percent. Development activity between 1990 and 1995 increased resident population to about 610 persons.
Population trends for Fagaitua Village reflected in the 1990 Census statistics suggest that some in-migration has occurred in this community between 1980 and 1990. The proportion of residents who were born outside of American Samoa during the 1980-1984 period was about 17 percent. Between 1985 and 1990, the proportion increased to 33 percent. However, in 1990, the proportion dropped slightly to 32 percent. ASPA believes that the rise in number of residents who were born outside of American Samoa primarily reflects a modest in-migration from American Samoans who were originally born in the continental United States. Pagai
The resident population of Pagai in 1990 was 107 residents. Census data for 1980 was not available. Development activity between 1990 and 1995 increased resident population to about 144 persons.
Population trends reflected in the 1990 Census statistics suggest that significant in-migration has occurred in this community between 1980 and 1990. The proportion of residents who were born outside of American Samoa during the 1980-1984 period was about 15 percent. Between 1985 and 1990, the proportion increased to 48 percent. By 1990, almost 51 percent of village residents were born outside of American Samoa. The increased proportion of residents born outside of American Samoa suggests that this community has been influenced by considerable out-migration and/or the out-migration of former residents.
Alofau
Between 1980 and 1990, the resident population of Alofau Village increased from 418 to 458 residents. Such growth represents an average annual growth rate of about 0.9 percent. Development activity between 1990 and 1995 increased resident population to about 557 persons.

Fagaitua, Page 21-17
Land Uses Residential
Auto
The 1990 U.S. Census documented 33 homes in Auto Village. Ninety-four percent of the homes were owner-occupied; three percent were rental units. An additional three percent of the housing stock was vacant or is used as a vacation home by the owner.
ASG Building Division records for Auto indicate that 12 new residential building permits were issued from 1990 through 1994. Consequently, the 1995 housing stock included approximately 45 houses.
Amaua
The 1990 U.S. Census documented 19 homes in Amaua Village. Ninety-five percent of the homes were owner-occupied; five percent were rental units.
ASG Building Division records indicate that seven new residential building permits were issued from 1990 through 1994 for Amaua. Consequently, the 1995 housing stock included approximately 26 houses. Fagaitua
The 1990 U.S. Census documented 77 homes in Fagaitua Village. Eighty-six percent of the homes were owner-occupied; six percent were rental units. An additional eight percent of the housing stock was vacant or was used as a vacation home by the owner.
ASG Building Division records indicate that 21 new residential building permits were issued from 1990 through 1994 for Fagaitua. Consequently, the 1995 housing stock included approximately 98 houses. Pagai
The 1990 U.S. Census documented 18 homes in Pagai Village. Ninety-four of the homes were owner-occupied; six percent of the houses were rental units.
ASG Building Division records indicate that seven new residential building permits were issued from 1990 through 1994. Consequently, the 1995 housing stock included approximately 25 houses. Alofau
The 1990 U.S. Census documented 71 homes in Alofau Village. Ninety-seven percent of the homes were owner-occupied; three percent were rental units.
ASG Building Division records indicate that 18 new residential building permits were issued from 1990 through 1994 in Alofau Village. Consequently, the 1995 housing stock included approximately 89 houses.
Agriculture Piggeries
One larger piggery and one smaller piggery are located at the lower end of Fogalilimu Stream in Alofau. While large, only several pigs were observed in the piggery, which is situated within the upper portion of the Alofau wetland.
In Fagaitua, High Talking Chief Siliga reported that there are about six piggeries in Fagaitua Village. Each piggery contains about four to five pigs (Siliga, 1996).
Fagaitua, Page 21-18
Subsistence Crop Production
Several agricultural production areas are scattered throughout the Fagaitua watershed. These faatoaga typically include the production of traditional crops such as bananas, breadfruit, and taro. During the May, 1996, faatoaga areas were observed in the following general locations:
• Immediately upland of Sinatau Point between the 200 and 300-foot elevation; • Due east of Uea Point and immediately upslope of the primary shoreline roadway; • The south side of Alofau Village on the south side of Nuu Stream; • Two faatoaga on the north side of the Elementary School in Alofau; • On the south side of Pagai Village upslope of the primary shoreline roadway; • Northeast and north of Pagai Village between the 100 and 300-foot contour; • At least two production areas in Fagaitua Village along the lower Auvai Stream drainage; • The upland portion of the inhabited Utusia Village area; and, • Upland of the north and west sides of Auto Village.
Commercial
Auto
In 1995, ASG business license records indicate that there were about eight commercial enterprises based in Auto. One new building permit was issued for a new commercial facility during the 1990-1995 period. Commercial enterprises included two grocery stores, one general retail store, a local bus company, a pool hall, and a video store. Two additional home-based businesses included a tax and accounting service and a radio paging service. Amaua
ASG business license records indicate that there was one commercial enterprise based in Amaua in 1995. No new building permits were issued for any new commercial facilities during the 1990-1995 period. The existing commercial enterprise included one bus company. Fagaitua
ASG business license records indicate that there were about six commercial enterprises based in Fagaitua in 1995. One new building permit was issued for a new commercial facility during the 1990-1995 period. Commercial enterprises included two grocery stores, one general retail store, three bus companies, and one building material supplier. Pagai
ASG business license records indicate that there were two commercial enterprises based in Pagai in 1995. However, no building permits were issued for any new commercial facilities during the 1990-1995 period. Commercial enterprises included a wholesale and retail food distributor and one bus company.
Alofau
In 1995, ASG business license records indicate that there were about 20 commercial enterprises based in Alofau. No new building permits were issued for any new commercial facility during the 1990-1995 period. Commercial enterprises included five grocery stores, four general retail stores, four bus companies and one taxicab, a commercial fisherman, a stained glass sales representative, one gas station, an auto rental company.
Industrial No industrial operations were based in Auto, Amaua, Pagai or Fagaitua in 1995.

Fagaitua, Page 21-19
Public Facilities
Auto
The ASG Department of Education offers an early childhood education program in Auto. Elementary school-aged children attend either Alofau Elementary in Alofau or Masefau Elementary School in Masefau. High school students are bussed to Fagaitua High School in Fagaitua. Amaua
The ASG Department of Education does not offer an early childhood education program in Amaua. Elementary school-aged children attend either Alofau Elementary in Alofau or Masefau Elementary School in Masefau. High school students are bussed to Fagaitua High School in Fagaitua. Fagaitua
The ASG Department of Education offers an early childhood education program in Fagaitua. In September, 1994, this program was attended by 21 younger children. Elementary school-aged children attend either Alofau Elementary in Alofau or Masefau Elementary School in Masefau. High school students attend Fagaitua High School; this facility had a student enrollment of 512 students in September, 1994.
Pagai
The ASG Department of Education does not offer an early childhood education program in Pagai. Elementary school-aged children attend Alofau Elementary in Alofau. High school students are bussed to Fagaitua High School in Fagaitua. Alofau
The ASG Department of Education offers an early childhood education program in Alofau. In September, 1994, this program was attended by 24 younger children. Elementary school-aged children attend Alofau Elementary School, which had a student enrollment of 366 students in September, 1994. High school students are bussed to Fagaitua High School in Fagaitua.
Use of the Nearshore Waters Nearshore Fishing In Alofau, a local resident indicated in May, 1996 that an average of about three persons use the nearshore waters for fishing. During a watershed survey on May 4, 1996, Pedersen Planning Consultants observed about five persons that were fishing along the shoreline. Recreation in the nearshore waters that are adjacent to Fagaitua primarily occurs on Saturdays. About ten persons typically participate in fishing on a typical Saturday (Siliga, 1996). In May, 1996, one fisherman was observed using a throw net along the shoreline that adjoins the village of Utusia. Two young fisherman were fishing along the shoreline at Amaua in May, 1996. However, a local chief indicates that from two to 17 residents per day regularly use the nearshore waters for fishing (Tauai, 1996). An American Samoa Subsistence Fishing Survey was conducted by the University of Hawaii Sea Grant Program in the summer of 1992. This survey involved onsite interviews with shoreline users who were participating in fishing activities on selected days during that period. The results of the survey revealed, in part, that there is considerable use of the nearshore waters in the reefs off Fagaitua.

Fagaitua, Page 21-20
Some 17-30 persons were documented fishing on the reef seaward of Fagaitua Village. Fishing methods that were observed included the use of rod-and-reel, pole, gleaning, diving, as well as hand-and-line from a paopao. Swimming and General Recreation On May 4, 1996, ten people were observed to be swimming in the nearshore waters that front Alofau Village. About 20 people per day use the nearshore waters at Fagaitua Village for swimming and general water recreation (Siliga, 1996). At Amaua, it was reported by one resident that up to 60 persons may use the shoreline for swimming and general recreation (Tauai, 1996). Given the size of Amaua, this estimate suggests that the nearshore waters are also used by other residents in the Fagaitua watershed. RESOURCE MANAGEMENT ISSUES Future Land Uses to the Year 2015 Residential
Auto
Some residential expansion is expected to occur in Auto during the next 20 years. It is anticipated that future residential growth will be an average of about 3.3 percent per year. Such growth will be somewhat greater than the average annual residential growth that occurred between 1980 and 1990 (2.7 percent), but considerably less than the more recent seven percent annual growth from 1990 through 1994. Auto is a somewhat more affluent community that has become increasingly attractive to American Samoans returning to American Samoa. It is anticipated that developable lands will be depleted during the 20-year planning period for the construction of single family housing.
Future residential expansion is anticipated within the southwest and west portions of the Auto Village. About five potential home sites could be developed immediately north of Faasouga Point. The greater potential for residential expansion is along the Muliolevai Stream where approximately 25 additional homes could be developed. It is believed that all of these housesites will be developed during the next 20-year period.
During the next 20 years, Pedersen Planning Consultants believes that these potential development opportunities and constraints in Auto will generate the following sequence and volume of residential construction.
1996-2000 Eight new single family homes along Muliolevai Stream between the shoreline and the 50-foot elevation.
2001-2005 Eight new single family homes along Muliolevai Stream between the shoreline and the 50-foot elevation.
2006-2010 Three new single family homes north of Faasouga Point between the shoreline and the 25-foot elevation.
One new single family home along Muliolevai Stream between the shoreline and the 50-foot elevation.
2011-2015 Two new single family homes north of Faasouga Point between the shoreline and the 25-foot elevation.
Eight new single family homes along Muliolevai Stream between the shoreline and the 50-foot elevation.

Fagaitua, Page 21-21
The cumulative effect of this prospective residential growth is that the Amaua Village housing stock will increase to roughly 75 housing units in the year 2015. During the same period, it is believed that the average household size will have gradually decreased to approximately 6.61 persons per household. Consequently, the anticipated village population in the year 2015 is estimated to include about 496 persons. Amaua
Some residential expansion is expected to occur in Amaua during the next 20 years. It is anticipated that future residential growth will be limited to less than one percent per year. Such growth will be considerably less than the average annual residential growth that occurred from 1990 through 1994. The primary constraint to residential growth is the lack of developable land. Consequently, it is believed that vacant, developable lands will be depleted during the 20-year planning period for the construction of single family housing.
Future residential expansion in the upland portion of the existing residential area. About five potential home sites could be developed in this area. could be developed.
During the next 20 years, Pedersen Planning Consultants believes that these potential development opportunities and constraints will generate the following sequence and volume of residential construction.
1996-2000 Two new single family homes between the 25 and 50-foot elevation.
2001-2005 Two new single family homes between the 25 and the 50-foot elevation.
2006-2010 Only home extensions, additions, and replacements will be constructed during this period.
2011-2015 One new single family home between the 25 and 50-foot elevation.
The cumulative effect of this prospective residential growth is that the village housing stock in Amaua will increase to roughly 31 housing units in the year 2015. During the same period, it is believed that the average household size will have gradually decreased to approximately 5.59 persons per household. As a result of this expected development, the future village population is anticipated to be about 173 persons in the year 2015. Fagaitua
Some residential expansion is expected to occur in Fagaitua during the next 20 years. It is anticipated that future residential growth will be an average of about 1.7 percent per year. Such growth will be slightly greater than the average annual residential growth that occurred between 1980 and 1990 (less than one percent), but considerably less than the five percent annual growth from 1990 through 1994.
Future residential expansion is anticipated in three locations of the Fagaitua village Census area. In Utusia, ten potential housesites are available within an existing faatoaga area which will is expected to slowly convert to greater residential use. Between Palapala Ridge and the Fagaitua High School complex, there are 18 potential housesites within and upland of the existing residential area between 25 and 125 feet above mean sea level. Six additional housesites are located considerably upland of the two shoreline residential areas along the road to Masefau (400 to 525-foot elevation). It is believed that all developable lands in these areas will be developed during the next 20-year period.
During the next 20 years, Pedersen Planning Consultants believes that these potential development opportunities and constraints in Fagaitua will generate the following sequence and volume of residential construction.

Fagaitua, Page 21-22
1996-2000 Seven new single family homes between Fagaitua High School and Palapala Ridge between the 25 and 125-foot elevation.
Three new single family homes along road to Masefau between 400 to 525-foot elevation.
2001-2005 Seven new single family homes between Fagaitua High School and Palapala Ridge between the 25 and 125-foot elevation.
Three new single family homes along road to Masefau between 400 to 525-foot elevation.
2006-2010 Four new single family homes between Fagaitua High School and Palapala Ridge between the 25 and 125-foot elevation.
2011-2015 Ten new single family homes upland of existing residential area in Utusia up to 25-foot elevation.
The cumulative effect of this prospective residential growth is that the Fagaitua Village housing stock will increase to roughly 132 housing units in the year 2015. During the same period, it is believed that the average household size will have gradually decreased to approximately 5.31 persons per household. Consequently, the future village population is expected to be about 701 persons in the year 2015. Pagai
Limited residential expansion is expected to occur in Pagai during the next 20 years. It is anticipated that future residential growth will be an average of about 1.6 percent per year. This growth rate will be somewhat less than the 7.0 percent annual growth that occurred from 1990 through 1994. The primary constraint to future residential growth will be the lack of developable land.
Future residential expansion is anticipated primarily within the existing shoreline residential area where seven potential housesites are located. One additional housesite is feasible in the upland residential area between 25 and 50 feet above mean sea level. It is believed that all of these potential housesites will be developed during the next 20-year period.
During the next 20 years, Pedersen Planning Consultants believes that these potential development opportunities and constraints will generate the following sequence and volume of residential construction.
1996-2000 Three new single family homes in the shoreline residential area below the 25-foot elevation.
2001-2005 Four new single family homes in the shoreline residential area below the 25-foot elevation.
2006-2010 One new single family home in the upland residential area between the 25 and 50-foot elevation.
2011-2015 No new residential construction except for home replacements, additions, and extensions.
The cumulative effect of this prospective residential growth is that the village housing stock will increase to roughly 33 housing units in the year 2015. During the same period, it is believed that the average household size will have gradually decreased to approximately 4.92 persons per household. The future village population in the year 2015 is expected to include an estimated 163 persons.

Fagaitua, Page 21-23
Alofau
Limited residential expansion is expected to occur in Alofau during the next 20 years. It is anticipated that future residential growth will average less than one percent per year. Such growth will be considerably less than the average annual residential growth that occurred from 1990 through 1994 when the housing stock grew at a rate of five percent per year.
Future residential expansion is anticipated in the main village area of Alofau where there are 14 feasible housesites. These potential housesites are located between the shoreline and the 25-foot elevation.
During the next 20 years, Pedersen Planning Consultants believes that these potential development opportunities and constraints will generate the following sequence and volume of residential construction in Alofau.
1996-2000 Four new single family homes in the main village between the shoreline and the 25-foot elevation.
2001-2005 Four new single family homes in the main village between the shoreline and the 25-foot elevation.
2006-2010 Two new single family homes in the main village between the shoreline and the 25-foot elevation.
2011-2015 Four new single family homes in the main village between the shoreline and the 25-foot elevation.
The cumulative effect of this prospective residential growth is that the village housing stock will increase to roughly 103 housing units in the year 2015. During the same period, it is believed that the average household size will have gradually decreased to approximately 5.35 persons per household. On this basis, Pedersen Planning Consultants estimates that the future village population will include about 551 persons.
Commercial
Auto
Limited commercial facility expansion is anticipated in Auto due to the lack of developable land. However, the establishment of a laundromat is expected to be built between the year 1996 and 2000. Pedersen Planning Consultants believes that a second retail store will be constructed between 2001 and 2005. Amaua
Limited commercial facility expansion is anticipated due to the lack of developable land in Amaua. However, the establishment of a laundromat is expected to be built between the year 2001 and 2005. Local consumers will continue to shop at nearby villages, e.g., Auto, for convenience items. Grocery shopping and other household goods will likely be purchased in the Pago Pago Bay Area. Fagaitua
Limited commercial facility expansion is anticipated in Fagaitua due to the lack of developable land. However, the establishment of a laundromat with 10 washers is expected to be built between the year 1996 and 2000. Pedersen Planning Consultants also believes that a second retail store will be constructed between 2001 and 2005.

Fagaitua, Page 21-24
Pagai
No commercial facility expansion is anticipated due to the lack of developable land. However, two home-based occupations are expected to be established between 1996 and the year 2000. It is anticipated that two additional small businesses will be organized during the 2001-2005 period. Alofau
Limited commercial facility expansion is anticipated due to the lack of developable land in Alofau. However, the establishment of a laundromat is expected to be built between the year 1996 and 2000. Pedersen Planning Consultants also believes that a second retail store will be constructed between 2001 and 2005. During this period, it is expected that three home-based professional and technical services will also be established.
Industrial Despite modest increases in future resident population, no additional light industrial operations or facilities are anticipated during the next 20 years in the Fagaitua watershed area. The lack of developable land that would be suitable for industrial activities is the primary constraint to future industrial development in this community. Public Facilities Through the application of 1990 age characteristics to anticipated village populations in the year 2015, the general demand for future early childhood programs, elementary education, and high school education was quantified (Table 21-4). In some cases, these demands may generate the future development of expanded public school facilities within or outside the Fagaitua watershed. TABLE 21-4 POTENTIAL DEMAND FOR PUBLIC SCHOOL FACILITIES YEAR 2015 (NUMBER OF STUDENTS)
Village Early Childhood Elementary Secondary Auto 35 119 40 Amaua 5 38 24 Fagaitua 49 119 56 Pagai 10 34 13 Alofau 28 105 66
Source: Pedersen Planning Consultants, 1995 Impact of Future Population Growth Upon Water Consumption and Waste Generation Future population growth and changes in land use in the Fagaitua watershed will increase the volume of future wastewater and solid wastes that are generated by local residents. The consumption of potable water will also increase with a growing population (Tables 21-5 and 21-6).

Fagaitua, Page 21-25
TABLE 21-5 TABLE 21-6 ANTICIPATED AVERAGE DAY DEMAND ANTICIPATED AVERAGE DAILY DRINKING AND OTHER POTABLE WATER WASTEWATER GENERATION FAGAITUA WATERSHED AREA FAGAITUA WATERSHED AREA (IN GALLONS PER DAY) (IN GALLONS PER DAY)
Village 1995 2015 Village 1995 2015 Auto Amaua Fagaitua Pagai Alofau
23,356 11,250 50,864 9,557
44,803
41,138 14,837 82,316 13,080 55,145
Auto Amaua Fagaitua Pagai Alofau
16,349 7,875
35,605 6,690
31,362
28,797 10,386 57,621 9,156
38,602
Source: Pedersen Planning Consultants, 1995 Source: Pedersen Planning Consultants, 1995 Flood Potential A flood insurance study of American Samoa and related flood insurance rate maps were published by the U.S. Federal Emergency Management Agency (FEMA) in 1991. The study evaluated selected geographical locations throughout the Territory. Hydrologic and hydraulic analyses that were presented in the study were made by the U.S. Army Corps of Engineers, Pacific Ocean Division. A detailed study was made of five streams in the Fagaitua watershed. Inland Flood Potential The flood insurance rate map that encompasses the Fagaitua watershed area indicates that a potential 100-year flood would generate significant flood elevations with Fagaitua Village. Potential flood elevations are estimated by the U.S. Army Corps of Engineers to range between 11 and 20 feet above mean sea level. The higher flood elevations are expected in the northwest part of the inhabited village area. However, potential flood inundation levels would impact much of the inhabited village area, as well as the Fagaitua High School complex. The small wetland area near the mouth of the Punaomanuia Stream would also flood as a result of a potential 100-year storm. However, no potential flood elevations were estimated for this area. All other inland areas of the Fagaitua watershed have been designated by the Federal Emergency Management Agency (FEMA) as “zone x.” This designation indicates that the area is outside of the 100-year floodplain. In essence, FEMA is suggesting that the flood hazard potential is limited. Estimated 100-Year Peak Discharges Within the Fagaitua Village area, the U.S. Army Corps of Engineers estimated 100-year peak discharges at selected locations along four drainages. These estimates provide some insight concerning why Fagaitua Village has considerable flood potential. Potential 100-year flows along the Auvai Stream drainage were calculated for four locations.
1) Mouth of Auvai Stream: 900 cubic feet per second (cfs) 2) 250 feet upstream of the main stem of Auvai Stream confluence with its southern tributary:
820 cfs 3) 520 feet upstream of Auvai Stream’s confluence with its northern tributary: 710 cfs. 4) Unknown location above the Auvai Stream confluence with its northern tributary: 100 cfs
Along Siapapa Stream, 100-year peak flows were estimated for two locations.
1) Stream mouth: 260 cfs 2) 370 feet upstream of the Siapapa Stream confluence with a tributary on the east side of the
main stem of the Stream: 160 cfs.

Fagaitua, Page 21-26
Anticipated peak flows from a 100-year storm along Vaialufai Stream was estimated for three locations:
1) the stream mouth: 660 cfs 2) Vaialufai Stream confluence with Tialu Stream: 260 cfs 3) 390 feet upstream of the Vaialufai Stream confluence with an unnamed tributary on the east
side of Vaialufai Stream: 130 cfs. Peak flows from a 100-year storm were also estimated for Tialu Stream, upstream of its confluence with Vaialufai Stream near the shoreline. At this location, the potential 100-year storm discharge was calculated to be 370 cfs. Coastal Flood Hazards The flood insurance rate map for Fagaitua Bay indicates that there is a coastal flood hazard through much of the nearshore waters and adjoining shoreline. A potential 100-year flood is estimated to generate flood levels in these areas that would be four feet above mean sea level. The shoreline and nearshore waters are also designated as an area that may be subject to a coastal flooding via wave action. Potential 100-year tsunami elevations have also been estimated by the U.S. Army Corps of Engineers for the following shoreline locations:
• Shoreline at Afulei – 4.2 feet above mean sea level (MSL); • Shoreline at Asasama Point – 4.2 feet above MSL; • Shoreline at Uea Point – 3.9 feet above MSL; • Shoreline at Sinatau Point – 3.3 feet above MSL; The inhabited village areas in the Fagaitua watershed are generally set back at higher elevations from the shoreline. The preceding estimates of potential tsunami flood elevations suggest that all of the villages would sustain limited damage from a potential tsunami. Stormwater Runoff/Sedimentation and the Relationship to Surface Water Quality Storm runoff that is carried by streams that discharge into Fagaitua Bay generate some increased turbidity and sedimentation levels in the nearshore waters that adjoin the Fagaitua watershed. These conditions primarily occur during or following after heavier rainfall periods. It is believed that natural sedimentation from steeper upland slopes, which contain more erosive soils, e.g., Aua very stony silty clay loam and Fagasa family-LithicHapludolls-Rock outcrop association, represent the primary sources of downstream sedimentation in the watershed. Runoff from one or both of these soils is discharged into most streams in the watershed. The opportunities for the future detention of stormwater flows in the watershed are limited. At the northern end of the village of Alofau, a two-acre mangrove swamp that near the mouth of Fogalilimu Stream represents a continued opportunity for stormwater detention. In view of this opportunity, ASEPA should investigate the potential opportunity to detain a greater proportion of the stormwater in the Fogalilimu Stream drainage into the Alofau wetland. The capability of this area to accommodate additional runoff should be verified through the computer modeling of, at least, the Fogalilimu Stream drainage and the development of a design plan that would permit the potential detention of medium and higher stream flows. A similar investigation should be made of the 2.5-acre wetland area on the lower coastal plain of Pagai Village. While this wetland already detain low to medium flows, the potential opportunity of detaining stormwater flows within the wetland for a longer period should also be evaluated. If greater detention is feasible, the wetland may be capable of providing a greater deposition of sediments.
Fagaitua, Page 21-27
Nearshore Water Quality and the Marine Environment The nearshore waters that adjoin the watershed are impacted by natural sedimentation, urban runoff, inadequately treated wastewater from cesspools and septic tanks, a limited discharge of piggery wastes, as well as wave action and nearshore currents. It is believed that natural sedimentation from upland slopes represent the primary influences upon nearshore water quality in the Fagaitua watershed. Each of these influences is expected to continue. Periodic monitoring of suspended solids and nutrients in the nearshore waters that front the villages of Auto, Amaua, Fagaitua, Pagai, and Alofau is recommended to help identify any significant stresses to the marine environment. With this information, future management actions and related priorities can be made more effectively. Coral communities are significantly dependent upon the availability of light and related photosynthesis, and occasional periods of significant turbidity and sedimentation do not promote long-term coral nutrition, growth, reproduction, and depth distribution (Richmond, 1993). When corals fertilize, they are free-swimming. Consequently, they need a good location to settle and make a good attachment. With significant soil deposition, sediments can physically interfere with the recruitment of coral larvae (Richmond, 1993; Dashbach, 1996). Coral communities are an important component of the overall ecology of the nearshore waters that adjoin the Fagaitua watershed. They provide shelter to fish, invertebrates, and other marine organisms. Some of these resources represent a supplemental food source for residents of Auto, Amaua, Fagaitua, Pagai, and Alofau. Groundwater and Surface Water Supplies The extension of the ASPA water system to the Fagaitua watershed in 1996 will ensure that a higher level of water quality will be used for drinking, food preparation, and other potable uses. MANAGEMENT NEEDS AND RECOMMENDATIONS The primary focus of future resource management in the Fagaitua watershed will be to:
• Maintain the function of the existing wetlands in Alofau and Pagai which detain runoff and reduce the discharge of sediments into the adjoining nearshore waters. Investigate opportunities to increase the function of these wetlands to detain stormwater runoff and coordinate conservation efforts with local traditional leaders.
• Monitor nearshore waters of the Fagaitua watershed to determine contributions of sedimentation, nutrients, and bacteria and facilitate longer-term resource management.
Representatives of participating public agencies should make periodic visits to the watershed to 1) observe, document, and monitor selected resource conditions, 2) determine potential methods of correcting a potential hazard or undesirable conditions, 3) share potential solutions with a designated resident of Fagaitua, and 4) encourage the participation of traditional village leaders and residents in resource management solutions. The scope of issues that should be addressed by each agency in the field is summarized in Table 21-7. The general focus of recommended technical assistance is also identified. The experience and insights of agency representatives will determine the specific methodology to be used in the field.

Fagaitua, Page 21-28
TABLE 21-7 RECOMMENDED FOCUS OF FUTURE TECHNICAL ASSISTANCE FAGAITUA WATERSHED
Participating Public Agency
Resource Management Issue
Focus of Technical Assistance
ASEPA Facilitate a coordinated resource management effort within the watershed
1. Coordinate overall watershed management activities. 2. Hold periodic meetings with participating ASG and federal agencies to discuss, prioritize, and schedule resource management activities. 3. Coordinate program efforts with local traditional leaders and/or designated resident of the watershed. 4. Make annual assessment of resource management program.
ASEPA Increase understanding of the location and type of influences that impact the water quality of the streams in the watershed and the adjoining nearshore waters
1. Monitor water quality of Muliolevai Stream, unnamed stream upslope of Amaua, Auvai Stream, Siapapa Stream, Vaialufai Stream, Tialu Stream, Punaomanuia Stream, and Fogalilimu Stream 2. Monitor water quality of nearshore waters adjacent to Auto, Amaua, Fagaitua, Pagai, and Alofau. 3. Measure changes in and total/fecal bacteria, turbidity, total suspended solids, and nutrients on a quarterly basis.
ASEPA Monitor long-term water quality of ASPA groundwater supplies
Continue monitoring of total and fecal Coliform bacteria, turbidity, organic and inorganic chemicals, radioactivity, and chlorine.
ASDOC Monitor changes in population and land use
Annually map type and location of land uses in village and estimate resident population.
ASDOC, Coastal Management Program
Maintain the function of existing wetlands in Alofau and Pagai for stormwater detention and investigate potential opportunities for increased detention
1. Monitor land uses and other potential wetland changes that might impede wetland functions. 2. Encourage conservation of lands within and adjacent to existing wetlands at Pagai and Alofau. 3. Coordinate and required improvements with ASEPA and traditional Village leaders. 4. Carry out computer modeling of Fogalilimu Stream and Punaomanuia Stream drainages. 5. Evaluate and prepare plans for any feasible opportunities for increased stormwater detention.
ASCC Land Grant Program
Reduce sedimentation from agricultural activities
1. Determine locations where upslope agricultural activities may be generating some sedimentation. 2. Encourage soil conservation methods with resident growers of subsistence crops.
ASG Dept. of Marine and Wildlife Resources
Sustain health of marine communities in nearshore waters
1. Monitor changes in coral coverage, fish habitat, diversity and other characteristics (used by Green) in selected locations in Fagaitua Bay approximately once every three years. 2. Identify stresses upon coral communities and marine life.
Source: Pedersen Planning Consultants, 1998

Alega, Page 22-1
ALEGA Watershed 22 GEOGRAPHY The Alega watershed is located in the southeast part of the Island of Tutuila. The watershed comprises about 0.51 square miles of land area (Figure 22-1). The inland watershed is bounded by the mountain ridges along the west boundary of the watershed that are known as Tauga Ridge and Tiaseu Ridge. The east slopes of Sinapioa Mountain and the southeast slopes of Palapala Mountain form the north and east sides of the Alega watershed. Along the coast, the watershed lies between Siliataligalu Point and Faasouga Point. A small embayment is situated between Vaiola and Tifa Point. Alega Stream and four unnamed streams discharge into the nearshore waters. Alega Stream is the primary drainage system in the watershed. The watershed includes two inhabited areas. These areas include Avaio Village and Alega Village. RESOURCES OF THE WATERSHED Soils The U.S. Soil Conservation Service (National Resource Conservation Service) published a Soil Survey of American Samoa in 1984. Selected information derived from this survey provides some useful information for future watershed planning and management (Figure 22-2). Three different soil classifications were identified by the U.S. Soil Conservation Service for lands within the Alega watershed (Table 22-1). TABLE 22-1 SELECTED SOIL CHARACTERISTICS ALEGA WATERSHED
Soil Depth To: Land Use Suitability SCS Soil Unit
Name Typical Slope
(Percent)
Flood Runoff Erosion High Water (Feet)
Bed Rock
(Inches)
Soil Based WW
Treatment
Subsistence Ag
Potential
1 Aua very stony silty clay loam
15-30 None Med-ium
Mod-erate
>6 <60 Severe Slope Moderate
2 Aua very stony silty clay loam
30-60 None Rapid Severe <6 <60 Severe Slope Poor
4 Fagasa family-Lithic Hapludolls-Rock outcrop assoc
70-130 None Very Rapid
Very Severe
>6 20-40 Severe Slope Depth
Limited
Source: U.S. Soil Conservation Service, 1984 Aua Very Stony Silty Clay Loam (15 to 30 percent slopes) Aua very stony silty clay loam soils (SCS mapping unit 1) characterize most of inhabited Alega Village area and the lower Alega Stream drainage. These soils typically occur up to about 60 inches in depth. The permeability of these soils ranges between 2 and 6 inches per hour. The potential for runoff or erosion from the Aua soils is believed to be moderate (U.S. Soil Conservation Service, 1984).


Alega, Page 22-4
While moderately suited for agricultural production, the U.S. Soil Conservation Service estimates that this soil can annually sustain up to 5 tons per acre of erosion without impacting crop productivity (U.S. Soil Conservation Service, 1984). However, the U.S. Soil Conservation Service also advises that the stony and erosive characteristics of these soils may limit production. While the erosive characteristics of this soil generally may not significantly impact subsistence crop productivity, the erosive quality of the soil can be a significant contributor to sedimentation in downslope streams and the nearshore waters. The general characteristics of these Aua soils are also undesirable for individual wastewater disposal systems (U.S. Soil Conservation Service, 1984). These soils contain a significant amount of larger stones that typically hamper installation and provide inadequate soil treatment. Aua Very Stony Silty Clay Loam (30 to 60 percent slopes) Steeper slopes of that are situated upland of Alega Village contain Aua very stony silty clay loam soils (SCS mapping unit 2). The Aua soils range between seven to 60 inches in depth. The permeability of these soils (between 2 and 6 inches per hour) is moderately rapid. For watershed management purposes, it is important to note that these Aua soils have a high potential for runoff and erosion. This Aua soil is not recommended for agricultural production because of the stoniness of the soil, the high erosion potential, and hazards associated with subsistence crop cultivation on steeper slopes. However, when cultivation in these soils is necessary, the use of a mulch or ground cover is recommended to reduce soil erosion in cultivated areas. The U.S. Soil Conservation Service estimates that this soil can annually sustain up to 5 tons per acre of erosion without impacting crop productivity (U.S. Soil Conservation Service, 1984). While the erosive characteristics of this soil generally may not significantly impact subsistence crop productivity, the erosive quality of the soil can be a significant contributor to sedimentation in downslope streams and the nearshore waters. The general characteristics of these Aua soils are also undesirable for individual wastewater disposal systems (U.S. Soil Conservation Service, 1984). These soils contain a significant amount of larger stones that hamper installation and provide inadequate soil treatment. Fagasa Family-Lithic Hapludolls-Rock Outcrop Association Steeper upland land areas throughout the remaining watershed contain deep, well-drained soils on steep mountain ridges and slopes. The U.S. Soil Conservation Service identifies these soils as part of the Fagasa family-Lithic Hapludolls-Rock outcrop association (SCS mapping unit 4). Since this soil type is a combination of two general soil classifications, soil depths can vary between 20 and 60 inches. The soil represents a combination of silty clay and loam. Since the Fagasa Family-Lithic Hapludolls soil typically occurs on very steep slopes, the potential for surface runoff and erosion are high. The cultivation of subsistence crops on these soils is not considered desirable. However, when cultivation in these soils is necessary, care should be exercised to minimize the amount of exposed soil in cultivated areas. When heavier rainfall events occur, significant erosion of these soils can be expected from undeveloped upslope areas of the watershed. Natural runoff from steeper slopes in the watershed carries water, sediments, and organic debris to downslope drainage courses and streams. Such erosion can readily influence downstream water quality.

Alega, Page 22-5
Streams Stream Locations An unnamed stream (Stream 22A) begins upland of Avaio Village at about the 490-foot elevation. This stream passes through the heart of Avaio Village before its discharge into the nearshore waters. A second unnamed stream (Stream 22B) originates upland of Tifa Point at approximately 560 feet above mean sea level. The stream discharges into the nearshore waters roughly 250 feet northwest of Tifa Point. Alega Stream and its four tributaries represent the primary drainage in the watershed. The main stem of the stream begins at about the 880-foot contour. Following the contribution of runoff from its four tributaries, a single stem of the stream occurs at approximately 45 feet above the mean sea level. The stream passes through the west side of Alega Village before discharging into the nearshore waters. A third unnamed stream (Stream 22C) is situated west of the inhabited village area of Alega. This 600-foot stream occurs initially at about the 220-foot contour and ultimately drains at the shoreline, about 200 feet east of the Alega Beach Resort. Along the east side of Tauga Ridge, a fourth unnamed stream (Stream 22D) begins at approximately 375 feet above mean sea level. The stream discharge takes place between Vaiola Point and Siliataligalu Point. Stream Flows Within the Watershed Historical stream flow data is available from two locations along Alega Stream. A continuous-record stream gage (No. 16960000) was maintained approximately 0.3 mile upstream from the stream mouth between 1958 and 1976. The records derived from this stream gage enabled the U.S. Geological Survey to estimate a median flow of 0.78 cubic feet per second (cfs). Between 1976 and 1990, a second gage operated as a low-flow, partial record station (No. 16960500) on a left-bank tributary of Alega Stream. The gage, which was located roughly 300 feet upstream from the stream mouth, provided 19 measurements of stream flow that were used to calculate a median flow of 0.26 cfs (Wong, 1996). Aquatic Fishes and Invertebrates Field surveys of fishes and invertebrates were made by the U.S. Fish and Wildlife Service, Division of Ecological Services, in March-April, 1978 and the U.S. Army Corps of Engineers in August, 1980. Alega Stream was one of 37 streams in American Samoa that was inventoried by representatives of these federal agencies. Results from both field surveys were summarized in an American Samoa Stream Inventory that was published by the U.S. Army Corps of Engineers, Honolulu District, in July, 1981. Alega Stream was surveyed in two locations. Station 6a was located in a rocky riffle about 15 feet upstream from the shoreline. Station 6b was situated near the 50-foot elevation in a cobble and boulder riffle immediately below a small falls and plunge pool. Near the shoreline, one species of gobie fish and two species of mountain bass were observed. Three species of shrimp and one mollusk were also identified at station 6a. One goby fish and one eel were reported at upstream station 6b. Three species of shrimp were also present; one specie was abundant. Two species of mollusks were also recorded.

Alega, Page 22-6
Surface Water Quality Streams Two fresh-water samples were collected from Alega Stream in 1970 and 1971 (STORET, 1996). Laboratory results from these samples suggest that the water quality in Alega Stream appeared to be subject to excessive nutrient loading, i.e., nitrate+nitrite and total phosphorus, as well as elevated bacteria levels (Table 22-2).
TABLE 22-2 RANDOM WATER QUALITY SAMPLE RESULTS ALEGA STREAM SEPTEMBER, 1970 AND OCTOBER, 1971
Water Quality Parameter TN TKN NO3+NO2 TP Turbidity TSS pH Total Coliform (µg/l) (µg/l) (µg/l) (µg/l) (jtu)** (mg/l) (#/100 ml)
09/11/70 -- -- 400 -- 1.0 -- 6.70 14,000 10/12/71 -- -- nd* 220 1.0 -- 6.60 --
Notes: *nd means not detectable **Jackson units, or jtu, was used rather than ntu which is now more commonly used to measure turbidity.
Source: U. S. EPA (STORET), 1996 In May, 1996, local residents in both Avaio and Alega noted that turbid stream flows are regularly discharged from Alega Stream and the unnamed stream that flows through Avaio Village. These conditions are more prevalent during medium to higher stream flow conditions. Nearshore Waters There is no known water quality data for the nearshore waters that adjoin the Alega watershed. Wetlands There are no significant wetlands in the Alega watershed. Marine Resources Coral Communities The fringing reef in the nearshore waters extends between 250 and 1,300 feet from the shoreline. Selected areas of this fringing reef were surveyed by marine biologists in 1978 and 1979.
1978-1979
Seaward of Avaio Village, a few crown-of-thorns starfish were present on the upper reef front of Faalogologotala Rock in August and September 1979 at depths between 6 and 33 feet. Marine biologists observed that about 75 percent of the coral heads were alive.
On the forereef slopes seaward of Alega Village, one crown-of-thorns starfish was documented in early 1978. No starfish were evident in May, 1978 (Aecos and Aquatic Farms, 1980).
In August and September, 1979, only a sparse population of crown-of-thorns starfish was observed along the upper reef front seaward of Siliataligalu Point (Aecos and Aquatic Farms, 1980).

Alega, Page 22-7
Wildlife Resources Aecos and Aquatic Farms noted in its 1980 Coral Reef Inventory that Faalogologotala Rock may be a potential nesting area for the reef heron, a resident seabird uncommon in American Samoa. Shoreline Protection With the exception of the fringing reef, limited shoreline protection is present along the shoreline of the Alega watershed. About 180 feet of piled rock are present along the shoreline that fronts the center of Alega Village (Sea Engineering, Inc. and Belt Collins Hawaii, 1994). In March, 1994, Sea Engineering, Inc. and Belt Collins Hawaii published a shoreline inventory report that outlined, in part, ongoing shoreline erosion conditions and related shore protection needs. Sea Engineering, Inc. and Belt Collins Hawaii noted the following conditions in the Alega watershed that were determined to be “critical”, or “potentially critical” conditions: Between Faasouga Point and Fagailiili Point
• a 2-foot scarp along a 150-foot long pocket beach was within five feet of the primary shoreline roadway.
In the Vicinity of Two Dollar Beach and Faalogologotala Rock
• Along a 150-foot length of the beach, coconut trees were undermined and fallen; a scarp was within three feet of the primary shoreline roadway.
Groundwater and Surface Water Supplies Groundwater Supply and Quality All villages in the Alega watershed are served by ASPA’s primary water system. Consequently, residents of the watershed are dependent upon the groundwater supplies that are used to support the ASPA system. None of the groundwater wells used by ASPA are located in the Alega watershed. Surface Water Supply and Quality Since the ASPA water system was only recently extended to Alega and Avaio, some use of stream catchment systems may continue in the watershed. However, it is believed that the use of these surface supplies is primarily for non-potable purposes. A stream catchment is located upstream of Alega Village along Alega Stream at about the 40-foot elevation. A one-inch distribution line connects Avaio Village to a village water system in Auto Village (Kleman, 1996). Proposed Water System Improvements In its draft Utilities Master Plan, ASPA makes no recommendations concerning the development or improvement of any existing facilities in the Alega watershed area.

Alega, Page 22-8
USE OF THE WATERSHED Resident Population
Alega
Between 1980 and 1990, the resident population of Alega Village increased from 30 to 49 residents. Such growth represented an average annual growth rate of about 6.3 percent. Development activity between 1990 and 1995 further increased the resident population of Alega to about 77 persons.
Population trends reflected in the 1990 Census statistics suggest that significant in-migration has occurred in this community between 1980 and 1990 in Alega Village. The proportion of residents who were born outside of American Samoa during the 1980-1984 period was about seven percent. Between 1985 and 1990, the proportion increased to 66 percent. However, in 1990, the proportion dropped to about 59 percent. Avaio
Between 1980 and 1990, the resident population of Avaio Village declined from 55 to 50 residents. Such growth represented an average annual decline in population of about 0.9 percent. Development activity between 1990 and 1995 increased resident population to about 58 persons.
Population trends reflected in the 1990 Census statistics suggest that significant in-migration has occurred in Avaio between 1980 and 1990. The proportion of residents who were born outside of American Samoa during the 1980-1984 period was about 15 percent. Between 1985 and 1990, the proportion increased to 31 percent; in 1990, this proportion decreased slightly to 26 percent. The increased proportion of residents born outside of American Samoa between 1980 and 1990 may have represented the out-migration of two former Avaio residents since the village experienced a slight decline in overall village population during the same period.
Land Uses Residential The 1990 U.S. Census documented eight homes in Alega Village. Sixty-three percent of the homes were owner-occupied; the remaining three houses were rental units. ASG Building Division records indicate that five new residential building permits were issued from 1990 through 1994 for new construction in Alega. Consequently, the 1995 housing stock included approximately 13 houses. The 1990 U.S. Census documented ten homes in Avaio Village. All of the homes were owner-occupied; none of the houses were rental units. ASG Building Division records indicate that two new residential building permits were issued from 1990 through 1994 in Avaio. Consequently, the 1995 housing stock included approximately 12 houses. Agriculture A 12-year resident of Avaio reported that no piggeries were located in Avaio Village (Kleman, 1996). No piggeries were documented by Pedersen Planning Consultants during a survey of Alega Village in May, 1996.

Alega, Page 22-9
At least two faatoaga were documented during the May, 1996 survey of the watershed. These agricultural areas were observed upland of Avaio Village between the 75 and 150-foot contour. Commercial In 1995, ASG business license records indicate that there were two commercial enterprises based in Alega. Commercial enterprises included Tisa’s Barefoot Bar. This is a bar/restaurant operation is part of the Alega Beach Resort and can serve up to 25 persons. No new building permits were issued for any new commercial facilities during the 1990-1995 period. ASG business license records indicate that there were no commercial enterprises based in Avaio in 1995. However, building permits were issued for two new commercial facilities during the 1990-1995 period. No commercial facilities were observed during a during surveys of the Village by Pedersen Planning Consultants in November, 1994 and May, 1996.
Hotel and Visitor Accommodations
The Alega Beach Resort provides overnight accommodations. In 1996, this two-story building included a ground floor residence and one guestroom on the second floor that could accommodate up to four persons. The present owner indicated in May, 1996 that she does not expect to build any additional overnight accommodations in the future (Faamuli, 1996). However, it is believed that this facility will have four additional rooms developed between 2001 and 2005.
Industrial In 1995, no industrial operations were based in Alega or Avaio. Public Facilities The ASG Department of Education does not offer an early childhood education program in Alega or Avaio. Elementary school-aged children from both villages attend either Alofau Elementary or Laulii Elementary School. High school students are bussed to Fagaitua High School in Fagaitua. Use of the Nearshore Waters Fishing No shoreline fishing activity was observed during a May, 1996 survey of the watershed. However, a local resident of Avaio indicates that about five persons use the nearshore waters for fishing activities at night (Klemen, 1996). An American Samoa Subsistence Fishing Survey was conducted by the University of Hawaii Sea Grant Program in the summer of 1992. This survey involved onsite interviews with shoreline users who were participating in fishing activities on selected days during that period. The results of the survey revealed, in part, that there is some use of the nearshore waters in the reefs off Avaio. About 7-8 persons were documented fishing on the reef seaward of Avaio Village. Fishing methods that were observed included the use of rod-and-reel, pole, gill net, throw net, gleaning, and diving. Swimming and General Recreation Avaio Village is the home of the well-known “$2 Beach” which is used by both island residents and visitors. Approximately 40 persons use this beach on a typical weekend day (Klemen, 1996). In Alega, the coral sand beach and adjoining Alega Beach Resort also attract regular use of the nearshore waters by both residents and visitors. During May, 1996, one weekend day attracted about

Alega, Page 22-10
15 to 20 persons who used the nearshore waters for swimming, snorkeling, and general water recreation. RESOURCE MANAGEMENT ISSUES Future Land Uses to the Year 2015 Residential
Alega
Some residential expansion is expected to occur in Alega during the next 20 years. It is anticipated that future residential growth will average about three percent per year. This growth will be considerably less than the residential growth that has occurred from 1990 through 1994. The primary constraint that will limit future residential growth is the lack of developable land.
Future residential expansion is anticipated within the existing shoreline residential area where eight potential housesites are located. It is believed that all of these housesites will be developed during the next 20-year period.
During the next 20 years, ASPA believes that these potential development opportunities and constraints will generate the following sequence and volume of residential construction.
1996-2000 Three new single family homes between the shoreline and the 50-foot
elevation.
2001-2005 Three new single family homes between the shoreline and the 50-foot elevation.
2006-2010 No new residential construction except for home replacements, extensions and additions.
2011-2015 Two new single family homes between the shoreline and the 50-foot elevation.
The cumulative effect of this prospective residential growth is that the village housing stock will increase to roughly 21 housing units in the year 2015. During the same period, it is believed that the average household size will have gradually decreased to approximately 5.08 persons per household. Consequently, the future village population is expected to include about 107 persons in the year 2015. Some residential expansion is expected to occur in Avaio during the next 20 years. It is anticipated that future residential growth will be an average of about 2.5 percent per year. This growth will be somewhat less than the four percent annual growth that occurred from 1990 through 1994. The primary constraint to future residential growth is the lack of developable land. Future residential expansion is anticipated within the existing shoreline residential area where six potential housesites are located. It is believed that all of these housesites will be developed during the next 20-year period. Avaio During the next 20 years, ASPA believes that these potential development opportunities and constraints will generate the following sequence and volume of residential construction in Avaio.

Alega, Page 22-11
1996-2000 Two new single family homes between the shoreline and the 75-foot elevation.
2001-2005 Two new single family homes between the shoreline and the 75-foot elevation.
2006-2010 No new residential construction except for home replacements, extensions and additions.
2011-2015 Two new single family homes between the shoreline and the 75-foot elevation.
The cumulative effect of this prospective residential growth is that the village housing stock will increase to roughly 18 housing units in the year 2015. During the same period, it is believed that the average household size will have gradually decreased to approximately 4.15 persons per household. On this basis, it is believed that the future village population will include about 75 persons in the year 2015.
Commercial Limited commercial facility expansion is anticipated due to the lack of developable land in Alega. However, the establishment of a new laundromat is expected between the year 2001 and 2005. No commercial facility expansion is in Alega anticipated due to the lack of developable land. However, three home-based occupations are expected to be established between 1996 and the year 2000. Industrial Despite modest increases in future resident population, no additional light industrial operations or facilities are anticipated in either Avaio or Alega during the next 20 years. The lack of developable land that would be suitable for industrial activities is the primary constraint to future industrial development in these villages. Public Facilities Through the application of 1990 age characteristics to anticipated village populations in the year 2015, the general demand for future early childhood programs, elementary education, and high school education was quantified (Table 22-3). In some cases, these demands may generate the future development of expanded public school facilities within or outside the Alega watershed. TABLE 22-3 POTENTIAL DEMAND FOR PUBLIC SCHOOL FACILITIES ALEGA WATERSHED AREA YEAR 2015 (NUMBER OF STUDENTS)
Village Early Childhood Elementary Secondary Avaio 6 16 9 Alega 6 31 6
Source: Pedersen Planning Consultants, 1995

Alega, Page 22-12
Impact of Future Population Growth Upon Water Consumption and Waste Generation Future population growth and changes in land use in the Alega watershed will increase the volume of future wastewater and solid wastes that are generated by local residents. The consumption of potable water will also increase with a growing population (Tables 22-4 and 22-5). TABLE 22-4 ANTICIPATED AVERAGE DAY DEMAND DRINKING AND OTHER POTABLE WATER ALEGA WATERSHED AREA (IN GALLONS PER DAY)
Village 1995 2015 Avaio 3,845 6,029 Alega 5,260 9,715
Source: Pedersen Planning Consultants, 1995 TABLE 22-5 ANTICIPATED AVERAGE DAILY WASTEWATER GENERATION ALEGA WATERSHED AREA (IN GALLONS PER DAY)
Village 1995 2015 Avaio 2,692 4,220 Alega 3,862 6,801 Source: Pedersen Planning Consultants, 1995 Flood Potential A flood insurance study of American Samoa and related flood insurance rate maps were published by the U.S. Federal Emergency Management Agency (FEMA) in 1991. The study evaluated selected geographical locations throughout the Territory. Hydrologic and hydraulic analyses that were presented in the study were made by the U.S. Army Corps of Engineers, Pacific Ocean Division. No detailed study was made of the five streams in the Alega watershed. Inland Flood Potential The flood insurance rate map, which includes the Alega watershed, indicates that all inland areas of the Alega watershed have been designated by the Federal Emergency Management Agency (FEMA) as “zone x.”. This designation indicates that the area is outside of the 100-year floodplain. Consequently, there is limited potential that a 100-year flood would generate any flood elevations within the Alega watershed. Coastal Flood Hazards The flood insurance rate map that includes the Alega watershed indicates that there is a coastal flood hazard along the nearshore waters and adjoining shoreline. A potential 100-year flood is estimated to generate flood levels in these areas that would be four feet above mean sea level. Coastal flooding may also be generated from wave action. Potential 100-year tsunami elevations have also been estimated by the U.S. Army Corps of Engineers for the following shoreline locations:
• Shoreline at Siliataligalu Point: 3.6 feet above mean sea level (MSL) • Shoreline at Alega: 3.8 feet above MSL

Alega, Page 22-13
The inhabited village areas in the Alega watershed are generally set back at elevations that are, at least, 10 feet above mean sea level. One exception is the Alega Beach Resort, which is probably less than five feet above mean sea level. The preceding estimates of potential tsunami flood elevations suggest that both villages would probably sustain limited damage from a potential tsunami. Stormwater Runoff/Sedimentation and the Relationship to Surface Water Quality Storm runoff, which is carried by the five streams in the watershed, generates some increased turbidity and sedimentation levels in the adjoining nearshore waters. These conditions primarily occur during or following after heavier rainfall periods. It is believed that natural sedimentation from steeper upland slopes, which contain more erosive soils, e.g., Aua very stony silty clay loam and Fagasa family-LithicHapludolls-Rock outcrop association, represent the primary sources of downstream sedimentation in the watershed. Runoff from one or both of these more erosive soils is discharged into all streams in the watershed. Natural sedimentation from these more erosive soils is likely the primary source of sedimentation in the nearshore waters that adjoin the Alega watershed. However, during the May, 1996 survey, new residential construction on the east side of Tauga Ridge was generating significant erosion and downstream sedimentation into the nearshore waters. New residential construction was occurring on steeper slopes that contain Fagasa family-Lithic Hapludolls-Rock outcrop association soils. The unnamed stream (Stream 22D) on the east side of Tauga Ridge carried turbid runoff into the nearshore waters south of Vaiola Point. The downstream culvert below the primary shoreline roadway was blocked by silt and debris. In this context, it is recommended that traditional leaders of Alega and Avaio be encouraged to establish a restriction on upland residential construction on the steeper slopes of the Alega watershed. In terms of nearshore water quality, more favorable residential expansion would occur adjacent to existing villages on somewhat less, erosive soils. Nearshore Water Quality and the Marine Environment The nearshore waters that adjoin the watershed are impacted by natural sedimentation, urban runoff, new residential construction on steeper slopes, inadequately treated wastewater from cesspools and septic tanks, as well as wave action and nearshore currents. It is believed that natural sedimentation from upland slopes and residential construction on steeper slopes represent the primary influence upon nearshore water quality in the Alega watershed. Each of these influences is expected to continue. Increased erosion on steeper slopes of the watershed and related downstream sedimentation will likely represent a serious resource management concern unless future residential development is encouraged in other areas of the watershed. Periodic monitoring of suspended solids and nutrients in the nearshore waters that front Alega Village is recommended to help identify any significant stresses to the marine environment. With this information, future management actions and related priorities can be made more effectively by traditional leaders and ASG agencies. The concern for increased turbidity and sedimentation in the nearshore waters is important. Coral communities are significantly dependent upon the availability of light and related photosynthesis, and occasional periods of significant turbidity and sedimentation do not promote long-term coral nutrition, growth, reproduction, and depth distribution (Richmond, 1993). When corals fertilize, they are free-swimming. Consequently, they need a good location to settle and make a good attachment. With significant soil deposition, sediments can physically interfere with the recruitment of coral larvae (Richmond, 1993; Dashbach, 1996).
Alega, Page 22-14
Coral communities are an important component of the overall ecology of the nearshore waters that adjoin the Alega watershed. They provide shelter to fish, invertebrates, and other marine organisms. Some of these resources represent a supplemental food source for residents of Avaio and Alega. Groundwater and Surface Water Supplies The recent development of potential groundwater supplies will address both long-term water supply needs and ensure the availability of improved drinking water quality in the overall watershed. MANAGEMENT NEEDS AND RECOMMENDATIONS The primary focus of future resource management in the Alega watershed will be to:
• Encourage future residential expansion in the watershed in areas that contain limited slope and less erosive soils. Traditional leaders should be encouraged to restrict residential development on steeper slopes of the watershed.
• Monitor nearshore waters of the Alega watershed to determine contributions of sedimentation, nutrients, and bacteria and facilitate longer-term resource management.
• Provide periodic maintenance of culverts to reduce blockages that prevent shoreline discharges of stream flow.
Representatives of participating public agencies should make periodic visits to the watershed to 1) observe, document, and monitor selected resource conditions, 2) determine potential methods of correcting a potential hazard or undesirable conditions, 3) share potential solutions with a designated resident of Alega, and 4) encourage the participation of traditional village leaders and residents in resource management solutions. The scope of issues that should be addressed by each agency in the field is summarized in Table 22-6. The general focus of recommended technical assistance is also identified. The experience and insights of agency representatives will determine the specific methodology to be used in the field.

Alega, Page 22-15
TABLE 22-6 RECOMMENDED FOCUS OF FUTURE TECHNICAL ASSISTANCE ALEGA WATERSHED
Participating Public agency
Resource Management Issue
Focus of Technical Assistance
ASEPA Facilitate a coordinated resource management effort within the watershed
1. Coordinate overall watershed management activities. 2. Hold periodic meetings with participating ASG and federal agencies to discuss, prioritize, and schedule resource management activities. 3. Coordinate program efforts with local traditional leaders and/or designated resident of the watershed. 4. Make annual assessment of resource management program.
ASEPA Increase understanding of the location and type of influences that impact the water quality of the streams in the watershed and the adjoining nearshore waters
1. Monitor water quality of Alega Stream and Stream 22D in Alega. 2. Monitor water quality of nearshore waters in embayment that fronts Alega Village. 3. Measure changes in and total/fecal bacteria, turbidity, total suspended solids, and nutrients on a quarterly basis.
ASDOC Monitor changes in population and land use
Annually map type and location of land uses in village and estimate resident population.
ASDPW Maintain stormwater culverts at shoreline discharge points
1. Establish a periodic maintenance program. Consider use of village labor to supplement DPW heavy equipment. 2. Maintain all culverts along the primary shoreline roadway.
ASCC Land Grant Program
Reduce sedimentation from agricultural activities
1. Determine locations where upslope agricultural activities may be generating some sedimentation. 2. Encourage soil conservation methods with resident growers of subsistence crops.
ASDMWR Sustain health of marine communities in nearshore waters
1. Monitor changes in coral coverage, fish habitat, diversity and other characteristics (used by Green) along the reef front in the small embayment that fronts Alega Village approximately once every three years. 2. Correlate marine survey information with future water quality data from Alega Stream and Stream 22D.
Source: Pedersen Planning Consultants, 1997

Laulii-Aumi, Page 23-1
LAULII-AUMI Watershed 23 GEOGRAPHY
The Laulii-Aumi watershed is located on the Island of Tutuila on the east side of Pago Pago Bay. The watershed comprises almost 0.7 square mile of land area (Figure 23-1).
The upland boundary of the watershed is delineated by the peaks of South Pioa Mountain and Sinapioa Mountain. Papatele Ridge forms the west boundary of the watershed. Tiaseu Ridge and Tauga Ridge represent the east boundary of the watershed.
Within the external boundaries of the watershed, there are three additional mountain ridges. Tialiufau Ridge divides Lauliifou and Lauliituai villages. Maliefetaliai Ridge separates the villages of Lauliituai and Aumi villages. Laloulu Ridge, which is located on the east side of Aumi Village, establishes the west side of the Visa Stream drainage of the east side of the Laulii-Aumi watershed.
Along the coast, the Laulii-Aumi watershed lies between Siliataligalu Point and Breakers Point. Maoliuvaa Cove is situated on the southeast side of the watershed. Another small, unnamed cove fronts the Village of Lauliituai. There are three prominent, rocks in the nearshore waters that adjoin the watershed. These features include Fatutoaga Rock, Avagatatau Rock, and Tauga Rock.
Five streams are located within the Laulii-Aumi watershed. Each of these streams discharge into the nearshore waters.
There are three inhabited village areas in the watershed. These villages include Lauliifou (new Laulii), Lauliituai (old Laulii), and Aumi. RESOURCES OF THE WATERSHED Soils The U.S. Soil Conservation Service (National Resource Conservation Service) published a Soil Survey of American Samoa in 1984. Selected information derived from this survey provides some useful information for future watershed planning and management (Figure 23-2). Four different soil classifications were identified by the U.S. Soil Conservation Service for lands within the Laulii-Aumi watershed (Table 23-1).
TABLE 23-1 SELECTED SOIL CHARACTERISTICS LAULII-AUMI WATERSHED Soil Depth To: Land Use Suitability
SCS Soil Unit
Name Typical Slope
(Percent)
Flood Runoff Erosion High Water (Feet)
Bed Rock
(Inches)
Soil Based WW
Treatment
Subsistence Ag
Potential
2 Aua very stony silty clay loam
30-60 None Rapid Severe <6 <60 Severe Slope Poor
4 Fagasa family-Lithic Hapludolls-Rock outcrop assoc
70-130 None Very Rapid
Very Severe
>6 20-60 Severe Slope Depth
Limited
9 Leafu stony silty clay
0-3 Occ Slow Slight 3-5 >60 Severe Flood Wet
Moderate
34 Urban land-Aua-Leafu complex
0-30 A.None L. Occ
A. Slow to Med
A.Slightto Mod L.Slight
A.>6 L.3-5
>60 Severe A. Slope L. Flood Wet
Limited
Notes: A.= Aua- found on mountain foot slopes 6-30 percent L.= Leafu- found on coastal plains & valley floors 0-6 percent Source: U.S. Soil Conservation Service, 1984


Laulii-Aumi, Page 23-4
Urban Land-Aua-Leafu Complex (0 to 30 percent slopes) The soil known as Urban Land-Aua-Leafu complex (SCS mapping unit 34) occurs in the three inhabited areas of the watershed. All of the inhabited area of Lauliifou Village is characterized by this soil type. Within Lauliituai, this soil comprises the shoreline village area and extends up to about 1,050 feet inland from the primary shoreline roadway. The entire Aumi Village area also contains Urban Land-Aua-Leafu complex soils (Figure 23-2). This soil type represents a combination of Aua and Leafu soils. These soils typically are found at depths of 60 inches or more. The permeability of this soil is moderately rapid and ranges between 2 and six inches per hour. The soil has limited to moderate potential for runoff. The erosion potential is slight to moderate. This soil has limited potential for subsistence agriculture. The U.S. Soil Conservation Service estimates that this soil can annually sustain up to 5 tons per acre of erosion without impacting crop productivity (U.S. Soil Conservation Service, 1984). Consequently, the use of these lands for subsistence agriculture is not likely to generate significant downslope erosion. The use of these soils for septic tank systems and related soil-based wastewater treatment is not desirable. A higher composition of larger rock fragments, combined with moderately rapid permeability, do not promote effective wastewater treatment. Fagasa Family-Lithic Hapludolls-Rock Outcrop Association Steeper upland land areas throughout most of the watershed contain deep, well-drained soils on steep mountain ridges and slopes. The U.S. Soil Conservation Service identifies these soils as part of the Fagasa family-Lithic Hapludolls-Rock outcrop association (SCS mapping unit 4). Since this soil type is a combination of two general soil classifications, soil depths can vary between 20 and 60 inches. The soil represents a combination of silty clay and loam. Since the Fagasa Family-Lithic Hapludolls soil typically occurs on very steep slopes, the potential for surface runoff and erosion is high. The cultivation of subsistence crops on these soils is not considered desirable. However, when cultivation in these soils is necessary, care should be exercised to minimize the amount of exposed soil in cultivated areas. When heavier rainfall events occur, significant erosion of these soils can be expected from undeveloped upslope areas of the watershed. Natural runoff from steeper slopes in the watershed carries water, sediments, and organic debris to downslope drainage courses and streams. Such erosion can readily influence downstream water quality. Leafu Stony Silty Clay (0 to 3 percent slopes) Leafu stony silty clay soils (SCS mapping unit 9) are present on the north side of Lauliituai Village along the Vaitele Stream drainage. This soil is a deep soil that typically extends up to 60 inches in depth. Its permeability ranges between 2 and 6 inches per hour. Runoff from these soils is generally slow and the potential for soil erosion is limited. However, these soils are typically subject to brief periods of flooding after heavier rainfall periods. These soils are somewhat suitable for subsistence agriculture. However, this land use is constrained by occasional periods of flooding and general soil wetness. The U.S. Soil Conservation Service estimates that this soil can annually sustain up to 5 tons per acre of erosion without impacting crop productivity (U.S. Soil Conservation Service, 1984). Consequently, the use of these lands for subsistence agriculture is not likely to generate significant downslope erosion.

Laulii-Aumi, Page 23-5
The use of these Leafu soils for residential land uses is not recommended by the U.S. Soil Conservation Service because of the inherent flood potential associated with this soil. The same characteristics also hamper the use of these soils for septic tank systems and related soil-based treatment. Aua Very Stony Silty Clay Loam (30 to 60 percent slopes) Aua very stony silty clay loam soils (SCS mapping unit 2) are found on portions of the steeper slopes that are immediately adjacent to Vaitele Stream. These areas are situated upslope and inland of Laulii Elementary School. One area is located on the lower, but steeper slopes of Tialiufau Ridge. The second area is on the lower slopes of Maliefetaliai Ridge (Figure 23-2). The Aua soils range between seven to 60 inches in depth. The permeability of these soils (between 2 and 6 inches per hour) is moderately rapid. For watershed management purposes, it is important to note that these Aua soils have a high potential for runoff and erosion. This Aua soil is not recommended for agricultural production because of the stoniness of the soil, the high erosion potential, and hazards associated with subsistence crop cultivation on steeper slopes. However, when cultivation in these soils is necessary, the use of a mulch or ground cover is recommended to reduce soil erosion in cultivated areas. The U.S. Soil Conservation Service estimates that this soil can annually sustain up to 5 tons per acre of erosion without impacting crop productivity (U.S. Soil Conservation Service, 1984). While the erosive characteristics of this soil generally may not significantly impact subsistence crop productivity, the erosive quality of the soil can be a significant contributor to sedimentation in downslope streams and the nearshore waters. The general characteristics of these Aua soils are also undesirable for individual wastewater disposal systems (U.S. Soil Conservation Service, 1984). These soils contain a significant amount of larger stones that hamper installation and provide inadequate soil treatment. Streams Stream Locations There are six primary drainages in the watershed. Each discharge into the nearshore waters that adjoin the Laulii-Aumi watershed. Vaisina Stream, which flows through the Village of Lauliifou, is situated between Papatele Ridge and Tialiufau Ridge. The stream, which originates at about the 350-foot contour, extends about 0.4 mile before its discharge into the nearshore waters. The Vaitele Stream drainage contains approximately 10 tributaries that carry surface runoff from the west slopes of Tialiufau Ridge and the east slopes of Maliefetaliai Ridge. The main stem of Vaitele Stream extends approximately 2.8 miles before discharging into the nearshore waters that adjoin Lauliituai. In the Village of Aumi, two unnamed streams originates on the steeper slopes inland of the Village at about the 275 (Stream 23A) and 400-foot contour (Stream 23B). These streams receive surface runoff from the west side of Maliefetaliai Ridge and the east side of Laloulu Ridge. The Visa Stream drainage is located east of the main Village of Aumi. The main stem of the stream begins at about the 700-foot elevation. Three tributaries enter the main stem of the stream before the point of discharge along the shoreline. During the May, 1996 survey, a small fall was located north of the primary shoreline roadway just upstream of the shoreline discharge.

Laulii-Aumi, Page 23-6
Along the west side of Tauga Ridge, an unnamed stream (Steam 23C) carries surface runoff to the nearshore waters. A 4-inch pipe is located underneath the primary shoreline roadway. Stream Flows Within the Watershed Historical flow measurements made by the U.S. Geological Survey (USGS) have enabled them to estimate the rate of flow for seven streams in the Laulii-Aumi watershed.
Vaisina Stream
Between 1959 and 1974, a low-flow, partial record station (No. 16955500) was located about 0.1 mile north of Lauliifou and 600 feet upstream from the highway bridge. Twelve measurements of stream flow enabled USGS to estimate a median flow of approximately 0.06 cubic feet per second (cfs). However, no-flow conditions have been observed at this station (Wong, 1996).
Vaitele Stream
Two hundred feet upstream from an unnamed tributary, approximately 0.5 miles north of Lauliituai and 0.7 miles upstream from the mouth of Vaitele Stream, USGS operated a low-flow, partial record station (No. 16956000) between 1959 and 1977. Eighteen measurements of stream flow were used to derive an estimated median flow of about 0.65 cfs.
USGS records indicate that there is a stream diversion was established upstream of this station in 1964 for domestic use (Wong, 1996). Discussions with a local resident in the north part of Lauliituai confirmed that a stream catchment was located along a tributary on the east side of the main stem. The stream catchment is in the vicinity of the 100-foot elevation. Maga Stream
A total of 14 measurements were taken from a low-flow, partial record station (No. 16956500) between 1959 and 1963. This station was located about 0.1 mile upstream from the mouth of Maga Stream. USGS estimates that the median flow at this gage location is about 0.05 cfs (Wong, 1996).
Lesea Stream
Between 1959 and 1964, Lesea Stream provided a total of 17 measurements from a low-flow, partial record station (No. 16957000) that was located 0.1 mile upstream from the mouth. The estimated median flow at this location is about 0.32 cfs (Wong, 1996). Visa Stream
Visa Stream yielded a total of 18 measurements from a low-flow, partial record station (No. 16959000) that was located 100 feet upstream from the primary shoreline roadway between 1957 and 1976. The median flow is estimated to be 0.37 cfs at this gage location. USGS records note that a stream diversion for domestic use was located upstream of the record station site at about the 200-foot elevation beginning in 1974. The diversion was apparently relocated to the 50-foot contour sometime after 1976 (Wong, 1996). Visa Stream Tributary
A total of 21 measurements were derived from a low-flow, partial record station (No. 16958500) along a northeast tributary of Visa Stream. This station, located 200 feet upstream from the confluence of the tributary and the main step of Visa Stream, was operated intermittently between 1958 and 1976. USGS estimates that the median flow at this gage location is about 0.12 cfs (Wong, 1996).

Laulii-Aumi, Page 23-7
Aquatic Fishes and Invertebrates Field surveys of fishes and invertebrates were made by the U.S. Fish and Wildlife Service, Division of Ecological Services, in March-April, 1978 and the U.S. Army Corps of Engineers in August, 1980. Vaitele Stream was one of 37 streams in American Samoa that was inventoried by representatives of these federal agencies. Results from both field surveys were summarized in an American Samoa Stream Inventory that was published by the U.S. Army Corps of Engineers, Honolulu District, in July, 1981. Vaitele Stream was surveyed in two locations. Station 22a was located within Lauliituai Village at an elevation of about 20 feet above mean sea level. Station 22b was situated along Maga Stream just above its confluence with Vaitele Stream. Within Lauliituai Village, three species of gobie fish and two species of mountain bass were recorded (station 22a). One specie of eel was documented. Three species of shrimp were also identified. No mollusks were documented. Only one specie of goby fish and one eel specie were identified along Maga Stream (station 22b). Five species of shrimp were reported; one of the species was abundant. No mollusks were present. Surface Water Quality Streams One-time water quality samples were collected from Visa Stream and Vaitele in September, 1970 (STORET, 1996). Laboratory results indicate that both streams contained elevated total coliform bacteria levels on the sampling date (Table 23-2). TABLE 23-2 RANDOM WATER QUALITY SAMPLE RESULTS VISA AND VAITELE STREAMS SEPTEMBER, 1970
Water Quality Parameter
Stream TN TKN NO3+NO2 TP Turbidity TSS pH Total ColiformDate (µg/l) (µg/l) (µg/l) (µg/l) (jtu)** (mg/l) (#/100 ml)
Visa 09/11/70
-- -- nd* -- 1.0 -- 6.80 18,000
Vaitele 09/15/70 -- -- nd -- 3.0 -- 6.80 17,000 Notes: *nd = not detectable ** note use of jtu (Jackson units) rather than ntu now used to measure turbidity. Source: USEPA, STORET, 1996 Nearshore Waters ASEPA collected marine water samples from 17 embayments around the Island of Tutuila on July 25 and August 2, 1992 (Table 23-3). The samples were obtained from the outer portions of the embayments where more water exchange occurs at depths of three and 60 feet. Collected samples were subsequently analyzed for nutrients and chlorophyll a. Nutrient data gained from these samplings indicate that the outer waters seaward of Lauliituai met American Samoa water quality standards in late July and early August of 1992. Laboratory results also suggest that stormwater runoff from undeveloped lands upland of Lauliituai may not generate any significant discharge of nutrients.

Laulii-Aumi, Page 23-8
TABLE 23-3 SURFACE WATER QUALITY OUTER WATERS OF LAULIITUAI JULY-AUGUST, 1992
Sample Depth Nitrate/ Nitrite mg N/l
Total N
mg N/1
Kjeldahl N
mg N/l
Total P
mg P/l
CHL a
mg/m3
3 feet <0.0001 0.120 0.120 0.008 0.09 60 feet 0.005 0.102 0.097 0008 0.10
Source: ASEPA, 1992 Wetlands There are no significant wetlands in the Laulii-Aumi watershed. Marine Resources Coral Communities A fringing coral reef extends between Breakers Point and Siliataligalu Point. Various private consultants have completed field investigations of the fringing reef since the late 1970’s. In a cumulative sense, the available survey information provided suggests that:
• An estimated 70 to 90 percent of the corals on the reef flat between Breakers Point and Siliataligalu were destroyed by the crown-of-thorns starfish in December 1977.
• In 1978, coralline algae was present on the middle reef platform of the fringing reef flat seaward of Lauliifou Village The types of coral were diverse. The outer reef was characterized by wave resistant corals, and coralline algae.
• The crown-of-thorns starfish was sparse on the upper reef flat seaward of Lauliifou in August and September 1979. About 60 percent of the corals were alive at depths between 6 and 33 feet.
• Very little live coral was observed during a 1992 survey of the fringing reef seaward of Lauliituai.
1978-1979
In 1978, calcareous sand covered the inner reef platform off Lauliifou. Large amounts of reef rubble and boulders occur on the eastern portion of the reef flat. Patches of sand and coral rubble were interspersed with live coral that covered approximately 50 percent of the bottom (Aecos and Aquatic Farms, 1980).
The middle and outer reef flat, seaward of Lauliifou Beach, is a low relief platform of semi-consolidated to consolidated limestone. An ava (channel) through the reef provides boat access to the nearshore and offshore waters. However, the Lauliifou reef is exposed to severe wave and wind action and is known for the dangerous currents which flow through an ava (channel) which crosses the reef there (Aecos and Aquatic Farms, 1980).
The reef front seaward of Lauliifou slopes steeply. Seaward of the reef margin, depths reach about 165 feet within an equal distance of the reef margin. In August and September 1979, approximately 60 percent of the corals along the reef front were alive. The crown-of-thorns starfish was sparse on the upper reef front at depths between 6 and 33 feet (Aecos and Aquatic Farms, 1980).
The Lauliituai reef flat contained some juvenile crown-of-thorns starfish in August, 1977. By December of the same year, an estimated 70 to 90 percent of the coral on the reef flat between Breakers Point and Alega Village was destroyed by the starfish. A dense population of the starfish was observed on the reef flat in early 1978 (Aecos and Aquatic Farms, 1980).

Laulii-Aumi, Page 23-9
An ava crosses the outer reef seaward of Lauliituai. This channel affords boat access to the deeper nearshore and offshore waters.
A fringing reef flat continues seaward of Aumi Village. Between Lafiga Point and Avagatatau Rock, the inner reef flat is characterized primarily by sand that merges with a mid-reef platform of consolidated limestone. Exposed basaltic boulders are on the inner reef between Avagatatau Rock and Tauga Rock. North of Tauga Rock, a small sand flat with scattered coral wheels is present. The reef flat that surrounds Tauga Rock is a low platform of consolidated limestone that is broken by sand channels on the east (Aecos and Aquatic Farms, 1980).
1992
Field investigations were also made along the reef flat seaward of Lauliituai Village by Maragos, Hunter, and Meier in 1992. The shallow coral cover (6m) ranged between 10 and 15 percent. Coral coverage in deeper waters (18m) was about 5 percent.
Wildlife Resources The American Samoa Coral Reef Inventory notes that Fatutoaga Rock, Avagatatau Rock, and Tauga Rock are potential nesting areas for reef heron, a resident seabird uncommon in American Samoa (Aecos and Aquatic Farms, 1980). Shoreline Protection Limited shoreline protection is available between Breakers Point and Siliataligalu Point. Rock revetments are evident in selected shoreline areas that front the villages of Lauliifou, Lauliituai, and Aumi. Existing shoreline protection generally includes loose, basaltic rock revetments. During the May, 1996 survey, the shoreline protection that fronted Lauliituai Village appeared to have been significantly impacted by wave action. The shoreline that adjoins the watershed has also been impacted by significant shoreline erosion. Such erosion has cut vertical scarps into backshore areas and severely damaged portions of the shoreline roadway. The construction of larger boulder revetments are planned to protect existing retaining walls (Sea Engineering, Inc. and Belt Collins Hawaii, 1994). Groundwater and Surface Drinking Water Supplies Groundwater Supply and Quality All villages in the watershed are served by ASPA’s primary water system. Consequently, residents of the watershed are dependent upon the groundwater supplies that are used to support the ASPA system. None of the groundwater wells presently used by ASPA are located in the Laulii-Aumi watershed. Ground water samples were historically collected from Laulii well #96, located in a residential land-use area, on July 3, 1989 (USGS, 1994; STORET, 1996). The sample revealed contamination from fecal coliform bacteria. No evidence of contamination by major ions, metals, pesticides, or volatile organic compounds was noted. However, it is unclear whether or not this well was actually located in the Laulii-Aumi watershed. Surface Water Supply and Quality While Lauliifou, Lauliituai, and Aumi almost entirely upon groundwater supplies from the ASPA water system, some stream catchment systems remain in the watershed. It is believed that the use of these surface supplies is primarily for non-potable purposes.
Laulii-Aumi, Page 23-10
Two streams provide a surface supply to some residents. The only stream catchment that was observed in May, 1996 was found along Faga Stream, a tributary to Vaitele Stream in Lauliituai. In April 1986, M&E Pacific made a survey of existing village water systems on the Island of Tutuila. Two systems were identified in the Laulii-Aumi watershed. One catchment was located upslope of Lauliituai Village along Vaitele Stream. The stream catchment was located at about the 140-foot contour; a storage tank was situated at approximately 70 feet above mean sea level. This system served on the Lauliituai. A second village water system was situated along Visa Stream on the east side of Aumi. The stream catchment was located at about the 50-foot elevation. This system served only the Aumi Village area. Historical data suggests from the 1981-1986 period indicates that the Laulii water systems contained moderate coliform contamination. Laboratory results indicated a median of 48 coliforms per 100 milliliters for the Laulii system during the 1981-1986 period (M&E Pacific, 1987). It is uncertain whether this data refers to the Lauliituai catchment since this report also refers to another Laulii system that is located in Tafananai. No data was given for the water system in Aumi. Proposed Water System Improvements In its draft Utilities Master Plan, ASPA makes no recommendations concerning the development or improvement of any existing facilities in the Laulii-Aumi watershed. USE OF THE WATERSHED Resident Population
Aumi
Between 1980 and 1990, the resident population of Aumi Village increased from 155 to 228 residents. Such growth represented an average annual growth rate of about 4.71 percent. Between 1990 and 1995 the resident population decreased to about 221 persons.
Population trends reflected in the 1990 Census statistics suggest that significant in-migration has occurred in Aumi between 1980 and 1990. The proportion of residents who were born outside of American Samoa during the 1980-1984 period was about 18 percent. Between 1985 and 1990, the proportion increased to 27 percent. However, in 1990, the proportion increased to 37 percent, or double the number of residents born outside of the community in 1980. Consequently, more recent residential growth probably reflects in-migration rather than the formation of new satellite families from existing households. Laulii
Between 1980 and 1990, the resident population of Laulii Village increased from 600 to 814 residents. Such growth represented an average annual growth rate of about 3.57 percent. Development activity between 1990 and 1995 increased resident population to about 1,082 persons.
Population trends reflected in the 1990 Census statistics suggest that significant in-migration has occurred in Laulii between 1980 and 1990. The proportion of residents who were born outside of American Samoa during the 1980-1984 period was about 27 percent. Between 1985 and 1990, the proportion increased to 42 percent. However, in 1990, the proportion increased to 48 percent.

Laulii-Aumi, Page 23-11
Land Uses Residential The 1990 U.S. Census documented 29 homes in Aumi Village. All of the homes were owner-occupied; none were rental units. ASG Building Division records indicate that no new residential building permits were issued from 1990 through 1994. No new homes were observed during a brief onsite village survey in November, 1994. Consequently, the 1995 housing stock included 29 houses. The 1990 U.S. Census documented 118 homes in the Laulii village Census area. Eight-two percent of the homes were owner-occupied; 14 percent were rental units. The remaining four percent were vacant or used as vacation homes by absentee owners. The housing stock expanded considerably during the 1990-1995 period. ASG Building Division records indicate that 38 new residential building permits were issued during this period. Consequently, the 1995 housing stock in Laulii included 156 houses. Agriculture In April, 1996, High Talking Chief Maa Aulava reported that were are about three piggeries in Lauliituai that each contained three to four pigs. One piggery was also observed on the upland side of Aumi Village. Two faatoaga were located on the upland side Aumi Village in April 1996. One area is situated northeast of the village; the other is situated northwest of the village. Two plantations are situated northwest of Lauliifou. Steeper topography and limited land area constrains the development of local plantations in the watershed. Commercial In 1995, ASG business license records indicated that there were three commercial enterprises based in Aumi. No new building permits were issued for any new commercial facilities during the 1990-1995 period. Commercial enterprises included one village grocery store, the Tumua Palace Night Club, and a laundromat. In 1995, ASG business license records indicated that there were about 18 commercial enterprises based in Laulii. No new building permits were issued for any new commercial facilities during the 1990-1995 period. Commercial enterprises included three grocery stores, a laundromat, two commercial transportation companies, two import operations, a water laboratory support service, and various home-based technical and retail services. Industrial One marine repair operation was based in Aumi in 1995. Two sharkfin processing facilities and one upholstery manufacturer were based in Laulii. Public Facilities The ASG Department of Education does not offer an early childhood education program in Aumi. Elementary school-aged children from Aumi attend Masefau Elementary School in Masefau where 94 students were enrolled in September, 1994. High school students are bussed to Fagaitua High School in Fagaitua. The ASG Department of Education offers an early childhood education program in Lauliituai. This program provided educational opportunities for 28 younger children in September, 1994. Elementary school-aged children attend Laulii Elementary School in Lauliituai where 213 students were enrolled in September, 1994. High school students are bussed to Fagaitua High School in Fagaitua.

Laulii-Aumi, Page 23-12
Use of the Nearshore Waters Nearshore Fishing and Swimming A local resident of Lauliifou reported in April, 1996 that there are 10 to 15 people per day who use the nearshore waters on the reef for recreational and subsistence fishing. Most fishing activity occurs on Saturday. No fishing takes place on Sunday when use of the nearshore waters is prohibited by the village council (Lemapu, 1996). Ula Mariota, a lifetime resident of Aumi, reported in April, 1996 that about 7 to 10 fishermen per day use the nearshore waters adjacent to Aumi. The ASG Department of Marine and Wildlife Resources (ASDMWR) recorded between 3,400 and 5,300 hours per year of fishing activity in the Laulii area during the 1991-1993 period. Fishing methods typically included use of rod and reel, hand lines, bamboo poles, gleaning, spear diving, throw nets, and gill nets. ASDMWR creel survey data for the 1991-1993 period reveals that gleaning and spear diving are the two more popular methods of fishing in the nearshore waters. Swimming and General Water Recreation At Lauliituai, HTC Maa Aulaua says about 20 people per day fish in the nearshore waters. Most village residents make occasional use of the nearshore waters for swimming and general water recreation. Another ten residents per day typically use the nearshore waters in the vicinity of Aumi for swimming and general water recreation (Mariota, 1996). RESOURCE MANAGEMENT ISSUES Future Land Uses to the Year 2015 Residential
Aumi
Little residential expansion is expected to occur in Aumi during the next 20 years. It is anticipated that future residential growth will be an average of about 1.5 percent per year. This growth will actually be slightly greater than the residential growth that has occurred from 1990 through 1994. However, it is considerably less than the growth between 1980 and 1990 when residential growth averaged almost five percent per year. The driving force that will limit future residential growth is the lack of developable land.
Future residential expansion is anticipated within the existing shoreline residential area where eight new housesites and one former housesite could provide nine potential housesites.
During the next 20 years, ASPA believes that these potential development opportunities and constraints will generate the following sequence and volume of residential construction in Aumi.
1996-2000 Three new single family homes between the shoreline and the 50-foot elevation.
2001-2005 Three new single family homes between the shoreline and the 50-foot elevation.
2006-2010 No new residential construction except for home replacements, extensions and additions.
Laulii-Aumi, Page 23-13
2011-2015 Three new single family homes between the shoreline and the 50-foot elevation.
The cumulative effect of this prospective residential growth is that the Aumi Village housing stock will increase to roughly 38 housing units in the year 2015. During the same period, it is believed that the average household size will have gradually decreased to approximately 6.52 persons per household. Consequently, the future village population is expected to include about 248 persons in the year 2015. Lauliifou and Lauliituai
Little residential expansion is expected to occur in Laulii during the next 20 years. It is anticipated that future residential growth will not exceed an average of one percent per year. Future residential growth, which was slightly more than six percent between 1990 and 1995, is constrained by the lack of developable land.
Future residential expansion is anticipated only in Lauliituai where potential infilling could provide 14 potential housesites. There is no additional developable land in Tafananai. In Lauliifou, there is one vacant building foundation that could provide one additional home if it were reconstructed.
During the next 20 years, ASPA believes that these potential development opportunities and constraints will generate the following sequence and volume of residential construction.
1996-2000 Four new single family homes in Lauliituai between 25 and 50-foot elevation.
2001-2005 Four new single family homes in Lauliituai between 25 and 50-foot elevation.
2006-2010 Two new single family homes in Lauliituai between 25 and 50-foot elevation.
One new home will be constructed in Lauliifou between the shoreline and the 25-foot elevation.
2011-2015 Four new single family homes in Lauliituai between 25 and 50-foot elevation.
The cumulative effect of this prospective residential growth is that the village housing stock will increase to roughly 171 housing units in the year 2015. During the same period, it is believed that the average household size will have gradually decreased to approximately 5.92 persons per household. Consequently, the future village population will include about 1,012 persons in the year 2015.
Commercial No commercial facility expansion is anticipated in Aumi due to the lack of developable land, the proximity to commercial facilities and services in the Pago Pago Bay Area, and limited consumer demand within Laulii. Limited commercial facility expansion in Laulii is anticipated due to the lack of developable land, the proximity to commercial facilities and services in the Pago Pago Bay Area, and limited consumer demand within Laulii. Nevertheless, a somewhat increased resident population will prompt the establishment of a second laundromat between 2001 and 2005. It is anticipated that this facility will be built with Lauliituai where a few building sites may be available in the village interior. Industrial Despite modest increases in future resident population in Aumi, Lauliituai, and Lauliifou, no additional light industrial operations or facilities are anticipated during the next 20 years. The lack of developable land that would be suitable for industrial activities is the primary constraint to future industrial development in this community.

Laulii-Aumi, Page 23-14
Public Facilities Population characteristics for Aumi in 1990 suggest that approximately eight percent of the village population is three and four years of age. Elementary school-aged children (5 and 13 years old) include about 17 percent of the village population; high school students represented about eight percent of the population. The application of 1990 population characteristics to the anticipated 2015 village population suggest increased student enrollments in future early childhood, elementary education, and high school programs outside of Aumi. Anticipated student enrollments from the village population are expected to be as follows in the year 2015:
• early childhood education 20 students • elementary school 42 students • high school 20 students
Population characteristics for Lauliifou and Lauliituai in 1990 suggest that approximately seven percent of the combined village population is three and four years of age. Elementary school-aged children (5 and 13 years old) include about 21 percent of the village population; high school students represented about ten percent of the population. The application of 1990 population characteristics to the anticipated 2015 village population suggest increased student enrollments in future early childhood, elementary education, and high school programs within and outside of Lauliituai and Lauliifou. Anticipated student enrollments from the combined village population are expected to be as follows in the year 2015:
• early childhood education 71 students • elementary school 213 students • high school 101 students Impact of Future Population Growth Upon Water Consumption and Waste Generation Future population growth and changes in land use in the Laulii-Aumi watershed will increase the volume of future wastewater and solid wastes that are generated by local residents. Wastewater generation, for example, is expected to rise from about 10,947 gallons per day (gpd) in 1995 to 14,587 gpd in the year 2015 in Aumi Village. Wastewater generation is expected to rise in Laulii from about 26,906 gpd in 1995 to approximately 84,616 gpd (American Samoa Power Authority, 1996). The consumption of potable water will also increase with a growing population. The American Samoa Power Authority (ASPA) estimates that the average day demand for water in Aumi was about 15,638 gallons in 1995. By the year 2015, ASPA anticipates that the average demand in Aumi will increase to roughly 20,838 gpd. The average day demand for water in Laulii was about 38,437 gpd in 1995. By 2015 the average day demand is expected to increase to 120,880 gpd. Flood Potential A flood insurance study of American Samoa and related flood insurance rate maps were published by the U.S. Federal Emergency Management Agency (FEMA) in 1991. The study evaluated selected geographical locations throughout the Territory. Hydrologic and hydraulic analyses that were presented in the study were made by the U.S. Army Corps of Engineers, Pacific Ocean Division. A detailed study was made of Vaitele Stream and the coastal areas of the Laulii-Aumi watershed.
Laulii-Aumi, Page 23-15
Inland Flood Potential Vaitele Stream and the Lauliituai Village
Within the watershed, there is flood potential along the Vaitele Stream drainage in Lauliituai. The village area on the sami side of the Laulii Elementary School is expected by FEMA to flood up to the 10-foot elevation. Such conditions would impact a significant number of homes in this area.
Upland of the Elementary School, FEMA also anticipates that a 100-year flood inundation will occur immediately adjacent to Vaitele Stream between the 15 and 40-foot contour. Future residential growth is expected to occur on vacant lands within existing residential areas (between the 25 and 50 foot contour) unless some restrictions are established by traditional village leaders.
HTC Aulava reported that historically some flooding has occurred in the upper elevations in Lauliituai. He has never seen water levels rise above one foot above the banks of Vaitele Stream (Aulava, 1996).
Lauliifou and Aumi
The inhabited village areas of Lauliifou and Aumi apparently experience little to no flooding. Drainage courses in Lauliifou carry stormwater quickly out to the nearshore waters. However, this rapid discharge carries a considerable amount of sediment (Lemapu, 1996).
Similarly, limited ponding of stormwater occurs in the lower elevations of Aumi Village (Mariota, 1996). Fairly rapid infiltration apparently occurs in this area.
Lauliifou, Aumi, and undeveloped upland areas of the watershed have been designated by the Federal Emergency Management Agency (FEMA) as “zone x.” This designation indicates that the area is outside of the 100-year floodplain (Federal Emergency Management Agency, 1991). In essence, FEMA is suggesting that the flood hazard potential in these areas are limited.
Coastal Flood Hazards The flood insurance rate map for the Laulii-Aumi watershed indicates that there is a coastal flood hazard along the shoreline of the watershed. A 100-year flood is estimated to generate a potential shoreline flood elevation of approximately 4.0 feet above mean sea level. Potential tsunami elevations have also been estimated by the U.S. Army Corps of Engineers for the following shoreline locations:
• Shoreline between Pagaitua Point and Lafiga Point: 3.4 feet above mean sea level (MSL); • Shoreline at Siliataligalu Point: 3.6 feet above mean sea level. All inhabited areas of the Laulii-Aumi watershed are located, at least, 6 to 7 feet above mean sea level. Consequently, FEMA expects no significant damage from the estimated 100-year tsunami inundation levels. Stormwater Runoff/Sedimentation and the Relationship to Surface Water Quality Storm runoff that is carried by the five drainages in the watershed generate increased turbidity and sedimentation levels in the adjoining nearshore waters. These conditions primarily occur during or following after heavier rainfall periods. A resident of Lauliifou indicates that this is particularly true in the nearshore waters that are seaward of Lauliifou. Rapid discharges through existing drainage courses transport a significant amount of sediment to the nearshore waters (Lemapu, 1996).

Laulii-Aumi, Page 23-16
It is believed that natural sedimentation from steeper upland slopes, which contain more erosive soils, e.g., Aua very stony silty clay loam and Fagasa family-LithicHapludolls-Rock outcrop association, represent the primary sources of downstream sedimentation in the watershed. Runoff from one or both of these more erosive soils is discharged into all streams in the watershed. Onsite observations in April, 1996 suggest that considerably less sedimentation may be generated by the unnamed drainages (Streams 23A and Stream 23B) that flow through Aumi Village. Virtually no sedimentation was observed in the nearshore waters that adjoin Aumi. The ponding of some stormwater in coral fill must be providing an effective filter of turbid surface water. In addition, the higher elevation of the primary roadway also helps reduce the amount of sheet flow that enters the nearshore waters. Unfortunately, only a limited amount of vacant, undeveloped land area lies in the lower elevations of the watershed. Consequently, there appear to be no feasible opportunities to detain stormwater runoff before the discharge of stormwater into the nearshore waters. While the detention of stormwater runoff does not appear feasible, it is recommended that the traditional leaders of Lauliituai develop a conceptual land use plan for the village. Such a plan would, in part, encourage a setback of future residential uses from Vaitele Stream. In its preparation of the plan, it is recommended that technical assistance be provided to the village council by the American Samoa Coastal Zone Management Program. Nearshore Water Quality and the Marine Environment The concern for continued turbidity and sedimentation in the nearshore waters is important. Coral communities are significantly dependent upon the availability of light and related photosynthesis, and occasional periods of significant turbidity and sedimentation do not promote long-term coral nutrition, growth, reproduction, and depth distribution (Richmond, 1993). When corals fertilize, they are free-swimming. Consequently, they need a good location to settle and make a good attachment. With significant soil deposition, sediments can physically interfere with the recruitment of coral larvae (Richmond, 1993; Dashbach, 1996). Coral communities are an important component of the overall ecology of the nearshore waters that adjoin the Laulii-Aumi watershed. They provide shelter to fish, invertebrates, and other marine organisms. Some of these resources represent a supplemental food source for residents of Lauliifou, Lauliituai, and Aumi. The future monitoring of the nearshore waters is not believed to be necessary. Turbidity and sedimentation are the primary stresses to the coral communities in the nearshore waters. However, the ASG Department of Marine and Wildlife Resources should examine the coral communities at least once every three years to evaluate the potential impact of sedimentation and turbidity in the nearshore waters. Groundwater and Surface Water Supplies The villages of the Laulii-Aumi watershed have access to groundwater supplies via the ASPA system, as well as a supplementary village water supply. Since the groundwater supplies are not located in the watershed, there are no land uses or natural hazards that impact these supplies. Surface supplies are primarily used for non-potable purposes. Consequently, any likely bacterial contamination of these supplies does not represent a public health concern.

Laulii-Aumi, Page 23-17
MANAGEMENT NEEDS AND RECOMMENDATIONS The primary focus of future resource management in the Laulii-Aumi watershed will be to:
• Encourage future residential expansion in Lauliituai to be set back a reasonable distance from Vaitele Stream.
• Traditional leaders in Lauliituai should be encouraged to establish a community land use plan to help identify desirable housesites for future residential development.
Representatives of participating public agencies should make periodic visits to the watershed to observe, document, and monitor selected resource conditions, determine potential methods of correcting a potential hazard or undesirable conditions, share potential solutions with designated residents of Lauliifou, Lauliituai, and Aumi, as well as encourage the participation of traditional village leaders and residents in resource management solutions. The scope of issues that should be addressed by each agency in the field is summarized in Table 23-4. The general focus of recommended technical assistance is also identified. The experience and insights of agency representatives will determine the specific methodology to be used in the field. TABLE 23-4 RECOMMENDED FOCUS OF FUTURE TECHNICAL ASSISTANCE LAULII-AUMI WATERSHED Participating Public agency
Resource Management Issue
Focus of Technical Assistance
ASEPA Facilitate a coordinated resource management effort within the watershed.
1. Coordinate overall watershed management activities. 2. Hold periodic meetings with participating ASG and federal agencies to discuss, prioritize, and schedule resource management activities. 3. Coordinate program efforts with local traditional leaders and/or designated resident of the watershed. 4. Make annual assessment of resource management program.
ASDOC Monitor changes in population and land use
Annually map type and location of land uses in village and estimate resident population.
ASDOC Assist traditional leaders with the identification of desirable housesites and other land uses.
1. Prepare a community land use plan for Lauliituai in close cooperation with traditional leaders.
ASDPW
Maintain stormwater culverts at shoreline discharge points.
1. Establish a periodic maintenance program. Consider use of village labor to supplement DPW heavy equipment. 2. Maintain all culverts along the primary shoreline roadway.
ASDMWR Sustain health of marine communities in nearshore waters
1. Monitor changes in coral coverage, fish habitat, diversity and other characteristics (used by Green) in a selected location in the nearshore waters approximately every three years. 2. Identify stresses upon coral communities and marine life.
Source: Pedersen Planning Consultants, 1997


SAMOAN GLOSSARY
Samoan Word English Translation aiga family, extended family
aumaga young or untitled men of a Samoan village
ava channel, passage, gap
faaSamoa Samoan custom, Samoan way of life
faatoaga plantation, farm
faifeau minister, pastor
faisua mollusc, giant clam
fale house
Fono the Legislative branch of the American Samoa Government (ASG)
malae open space; village green, place used for social and traditional
gatherings, as well as for recreation
matai titled head of a Samoan extended family, high ranking title holder
palagi foreigner
puleaoga school principal
pulenuu village mayor representing ASG in villages of American Samoa
sami ocean
sao senior title-holder in Samoan village who, in part, makes decisions
concerning the use of communal lands
taufusi swamp, marshland
vaipuna spring
Source: Samoan Dictionary, G. B. Milner, 1978; Pedersen Planning Consultants, 1998