
American Red Cross: Fire Safety Poll€¦ · American Red Cross: Fire Safety Poll July 27-29, 2015...
33
American Red Cross: Fire Safety Poll July 27-29, 2015 ORC International CARAVAN® Omnibus Surveys Report Date: August 13, 2015
-
Upload
nguyenngoc -
Category
Documents
-
view
214 -
download
0
Transcript of American Red Cross: Fire Safety Poll€¦ · American Red Cross: Fire Safety Poll July 27-29, 2015...
American Red Cross: Fire Safety Poll
July 27-29, 2015
ORC International CARAVAN® Omnibus Surveys
Report Date: August 13, 2015

Methodology
2
Survey Type Omnibus Study. The online omnibus study is conducted twice a week
among a demographically representative U.S. sample of 1,000 adults 18
years of age and older.
Sample 1,120 adults comprising 557 men and 563 women 18 years of age and older.
This includes an oversample of participants with incomes less than $35,000.
Survey Date July 27-29, 2015
Statistical
Significance
Throughout the report, an asterisk (*) will indicate that the difference is
statistically significant at the 95% confidence level. Absence of any notation
indicates directional, but not statistically significant differences.

3
Key Findings (1 of 2) Smoke Alarm:
• 93% of homes have a smoke alarm and the number of homes with two or more fire alarms has increased 5%* in the
past year.
• Almost 70% of homes have had a smoke alarm installed within the past 10 years with those who experienced a serious
fire or know someone who died/was injured in a fire more likely* than other groups to have had an alarm installed.
• 82% of homes have tested at least one alarm within the past year.
• ‘Never made it a priority’ and ‘I rent and it’s the landlord’s responsibility’ were the most cited reasons over the past two
years for not having a smoke alarm.
• 68% of total respondents have replaced smoke alarm batteries within the past 12 months.
• Accidents while cooking are the primary reason for alarms sounding.
Home Fire:
• 35% of total respondents believe it takes 2-3 minutes before a home is fully engulfed in flames (38% in 2014).
• 65% of total respondents believe it will take at least five minutes (62% in 2014), with 21% of those stating it would take
10 minutes or more (18% in 2014). All comparisons are directional.
• 70% of total respondents feel confident they can escape their burning home in 2-3 minutes (only 56%* for homes with
people with disabilities).
• The majority of respondents would call 9-1-1 and/or evacuate their home in case of a fire.
• Most respondents have not had a serious fire. Homes with children reported a lower* incidence of serious fires than
other groups.
• Almost half of all respondents know someone who has lost a home or had significant damage in a home fire.
• 41% of total respondents have an upper floor in their residence or live on an upper floor.
• Jumping out of a window and calling 9-1-1 continue to be the most cited responses if trapped on an upper floor.
*Statistically significant at the 95% confidence level.

4
Key Findings (2 of 2)
Actions:
• 71% of households took at least one action, 7%* fewer than in 2014. Identifying multiple escape routes and
replacing smoke alarm batteries were the most frequently* cited actions. Practicing fire drills at home was cited least*.
• 80% of those who have practiced fire drills at home have done so within the past 12 months. More than half have
practiced within the past 6 months.
• 66% of households that have talked to children about what to do in case of a fire have done so within the past 12
months. Homes that have had a serious fire are more likely* than any other group to have talked to children in past 12
months.
• Most cited obstacles to preparedness include thinking “we’ll know what to do”, not knowing where to start, and
believing there will be plenty of time to evacuate.
• 56% of respondents have taken one or more action, with ‘using candles during a power outage’ being the most*
frequently cited among all groups. This year, fewer* people are leaving home/falling asleep with an electrical
appliance running, leaving matches in reach of a child, and deep frying turkeys close to dwelling.
• Parents state that young children are most capable* of recognizing the sound of a smoke alarm and getting to the
family meeting place after evacuating.
• Parents are less sure* that their youngest child over the age of 3 could identify an alternate exit or evacuate without
the help of an adult than they were last year.
*Statistically significant at the 95% confidence level.

F1. Do you have a smoke alarm in your home?
Base = Total respondents
5
Smoke Alarm: Presence of Alarm Ninety-three percent of homes have a smoke alarm.
Have smoke alarm in home.
94%
6%
0%
20%
40%
60%
80%
100%
Yes No
95% 95% 98% 94%
5% 5% 2% 6%
0%
20%
40%
60%
80%
100%
Homes with children Homes with people with disabilities
Have had serious fire Know someone who died/was injured in
fire
Yes No
Total=1,120
Children= 375
Disability=186
Fire=78
Death/Injury=172
2015 Base Size
93%
7%
0%
20%
40%
60%
80%
100%
Yes No
95% 92% 96% 92%
5% 8% 4%
8%
0%
20%
40%
60%
80%
100%
Homes with children Homes with people with disabilities
Have had serious fire Know someone who died/was injured in
fire
2015
2014
TOTAL

F2. How many smoke alarms do you have in your home?
Base = Have smoke alarm in home
*Statistically significant at the 95% confidence level.
6
Smoke Alarm: Number of Alarms The number of homes with two or more fire alarms has increased 5%* in the past year.
Number of smoke alarms in home.
20%
30%
20%
30%
0%
10%
20%
30%
40%
50%
One Two Three More than three
17%
22% 26%
19%
30% 29%
39% 36%
18% 20%
15% 16%
35%
30%
20%
29%
0%
10%
20%
30%
40%
50%
Homes with children Homes with people with disabilities
Have had serious fire Know someone who died/was injured in
fire
One Two Three More than three
2015
2014
15%
32%
21%
32%
0%
10%
20%
30%
40%
50%
One Two Three More than three
11% 14% 15%
12%
30% 29%
38%
28%
19% 23%
15%
26%
39%
33% 31%
33%
0%
10%
20%
30%
40%
50%
Homes with children Homes with people with disabilities
Have had serious fire Know someone who died/was injured in
fire
Total=1,042
Children=356
Disability=172
Fire=74
Death/Injury=157
2015 Base Size
TOTAL

F2A. To the best of your knowledge, was the smoke alarm(s) installed within the last 10 years?
Base = Have smoke alarm in home
*Statistically significant at the 95% confidence level.
7
Smoke Alarm: Installation Almost 70% of homes have had a smoke alarm installed within the past 10 years.
Those that have experienced a serious fire or know someone who died/was injured in
a fire are more likely* than other groups to have had an alarm installed within the past
10 years.
Smoke alarm installed within last 10 years
69%
18% 13%
0%
10%
20%
30%
40%
50%
60%
70%
80%
90%
100%
Yes No Don't Recall
74% 74%
81%
88%
14% 16%
9% 6%
12% 10% 10% 6%
0%
10%
20%
30%
40%
50%
60%
70%
80%
90%
100%
Homes with children
Homes with people with disabilities
Have had serious fire
Know someone who died/was injured in fire
Yes No Don't Recall
Total=1,042
Children= 356
Disability=172
Fire=74
Death/Injury=157
2015 Base Size
New Question 2015
TOTAL

F3. Which, if any, of the following statements have EVER applied to you?
Base = Total respondents
*Statistically significant at the 95% confidence level.
8
Smoke Alarm: Actions Taken Fifty-five percent of total respondents took at least one of the actions below, a decrease of
5%* from last year. Fewer* people are living in homes with no smoke alarm. There has
been a 12%* decrease in these behaviors in homes with people with disabilities.
40%
20%
8% 7% 10%
40%
34%
22%
15% 11% 11%
41%
51%
22% 20%
15% 12%
27%
55%
26% 29%
22%
10%
23%
48%
24% 22%
14% 12%
25%
0%
10%
20%
30%
40%
50%
60%
Lived in home with no smoke alarm
Disabled smoke alarm because of beeping or
flashing light
Removed batteries from smoke alarm for another
device
Ignored home smoke alarm when alarm
sounded
Disabled smoke alarm for some other reason
None of these
Total Homes w/children Homes w/people with disabilities Have had a serious fire Know someone who died/was injured in fire
35%
20%
6% 6% 10%
45%
30% 28%
8% 9% 8%
43% 38%
21%
10% 11% 12%
39%
50%
31%
15% 10% 11%
26%
43%
32%
11% 9% 13%
30%
0%
10%
20%
30%
40%
50%
60%
Lived in home with no smoke alarm
Disabled smoke alarm because of beeping or
flashing light
Removed batteries from smoke alarm for another
device
Ignored home smoke alarm when alarm
sounded
Disabled smoke alarm for some other reason
None of these
2015
2014
Total=1,120
Children= 375
Disability=186
Fire=78
Death/Injury=172
2015 Base Size
Have taken the following actions

F3A. When was the last time you tested at least one of your smoke alarms to be sure it was working?
Base = Have smoke alarm in home
*Statistically significant at the 95% confidence level.
9
Smoke Alarm: Testing Eighty-two percent of homes have tested at least one alarm within the past year. Fifteen
percent of homes that have experienced a serious fire have NOT tested their smoke
alarm, an increase of 10%* from last year.
25%
40%
14% 10% 11%
30%
42%
10% 8%
10%
29%
40%
18%
6% 8%
32%
42%
15%
6% 5%
31%
43%
12%
7% 6%
0%
10%
20%
30%
40%
50%
Within past month Within past 6 months Within past year More than a year ago Have not tested smoke alarm
Total Homes w/children Homes w/people with disabilities Have had a serious fire Know someone who died/was injured in fire
Last tested at least one smoke alarm.
2015 Base Size
29%
39%
15%
7% 11%
31%
37%
16%
6%
11%
36% 34%
17%
6% 7%
31% 32%
17%
4%
15%
32%
38%
15%
6% 8%
0%
10%
20%
30%
40%
50%
Within past month Within past 6 months Within past year More than a year ago Have not tested smoke alarm
Total=1,042
Children= 356
Disability=172
Fire=74
Death/Injury=157
2015
2014

F3B. When was the last time you replaced the batteries in your smoke alarm?
Base = Have smoke alarm in home
*Statistically significant at the 95% confidence level.
10
Smoke Alarm: Battery Replacement Sixty-eight percent of total respondents have replaced smoke alarm batteries within the past 12 months.
Those that have experienced a serious fire were less* likely than other groups to have replaced batteries
within the past 6 months.
49%
19%
10%
3%
6%
3%
10%
50%
18%
12%
4% 6%
2%
7%
51%
17%
13%
5% 3% 2%
9%
44%
24%
10%
6% 8%
2%
6%
50%
20%
12%
4% 4%
1%
9%
0%
10%
20%
30%
40%
50%
60%
Within last 6 months
7-12 months ago 1-2 years ago 2+ years ago Never Have next gen alarm (w/10 yr
battery)
Don't recall
Total Homes w/children Homes w/people with disabilities Have had a serious fire Know someone who died/was injured in fire
Last replaced batteries in smoke alarm 2015 Base Size
New Question 2015
Total=1,042
Children= 356
Disability=172
Fire=74
Death/Injury=157

F4. For which, if any, of the following reasons do you not have smoke alarms in your home?
Base = Do not have smoke alarm in home
11
Smoke Alarm: Excuses ‘Never made it a priority’ and ‘I rent and it’s the landlord’s responsibility’ were the most cited
reasons over the past two years for not having a smoke alarm.
0%
20%
40%
60%
80%
Never made it a priority
Rent and is landlord's
responsibility
Never felt need to install them
Didn't have one growing up
Can't afford smoke alarms
Don't see the need for one
Too hard to install
Too noisy Don't think they would be effective
Other
Total Homes w/children Homes w/people with disabilities Have had a serious fire Know someone who died/was injured in fire
Reason for not having smoke alarm in home 2015 Base Size
0%
20%
40%
60%
80%
Never made it a priority
Rent and is landlord's
responsibility
Can't afford smoke alarms
Too noisy Don't see the need for one
Didn't have one growing up
Never felt need to install them
Don't think they would be effective
Too hard to install
Other
Total =78
Children=19
Disability=15
Fire=3
Death/Injury=14
2015
2014
Caution small base size
F19. Do you know how to silence your smoke alarm without removing the batteries?
Base = Total respondents
*Statistically significant at the 95% confidence level.
12
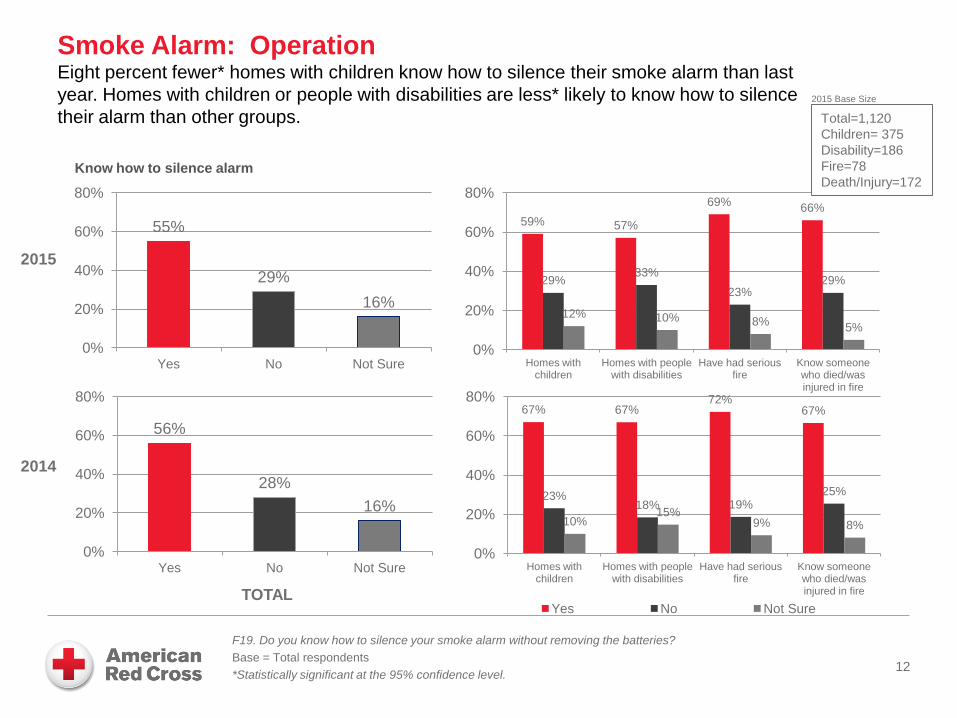
Smoke Alarm: Operation Eight percent fewer* homes with children know how to silence their smoke alarm than last
year. Homes with children or people with disabilities are less* likely to know how to silence
their alarm than other groups.
56%
28%
16%
0%
20%
40%
60%
80%
Yes No Not Sure
67% 67% 72%
67%
23% 18% 19%
25%
10% 15%
9% 8%
0%
20%
40%
60%
80%
Homes with children
Homes with people with disabilities
Have had serious fire
Know someone who died/was injured in fire
Yes No Not Sure
55%
29%
16%
0%
20%
40%
60%
80%
Yes No Not Sure
59% 57%
69% 66%
29% 33%
23% 29%
12% 10% 8% 5%
0%
20%
40%
60%
80%
Homes with children
Homes with people with disabilities
Have had serious fire
Know someone who died/was injured in fire
2015
2014
Total=1,120
Children= 375
Disability=186
Fire=78
Death/Injury=172
2015 Base Size
TOTAL
Know how to silence alarm

F17. Has your smoke alarm gone off within the past five years?
Base = Total respondents
13
Smoke Alarm: Alarm Activity Fewer homes report having smoke alarms go off than last year (directional).
Smoke alarm has gone off in past 5 years
47% 53%
0%
10%
20%
30%
40%
50%
60%
70%
Yes No
57% 64% 66% 64%
43% 36% 34% 36%
0%
10%
20%
30%
40%
50%
60%
70%
Homes with children Homes with people with disabilities
Have had serious fire Know someone who died/was injured in
fire Yes No
44%
56%
0%
10%
20%
30%
40%
50%
60%
70%
Yes No
52% 55% 58% 55% 48% 45% 42% 45%
0%
10%
20%
30%
40%
50%
60%
70%
Homes with children Homes with people with disabilities
Have had serious fire Know someone who died/was injured in
fire
2015
2014
Total=1,120
Children= 375
Disability=186
Fire=78
Death/Injury=172
2015 Base Size
TOTAL
F18. Why did your smoke alarm go off?
Base = Smoke alarm has gone off in past five years.
14
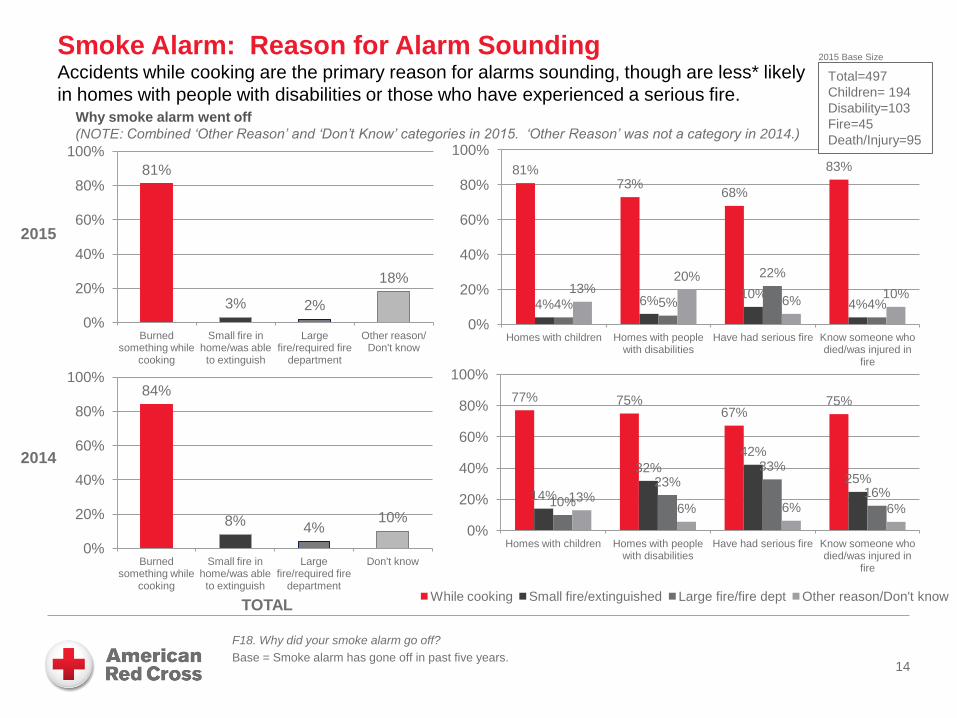
Smoke Alarm: Reason for Alarm Sounding Accidents while cooking are the primary reason for alarms sounding, though are less* likely
in homes with people with disabilities or those who have experienced a serious fire.
Why smoke alarm went off
(NOTE: Combined ‘Other Reason’ and ‘Don’t Know’ categories in 2015. ‘Other Reason’ was not a category in 2014.)
84%
8% 4% 10%
0%
20%
40%
60%
80%
100%
Burned something while
cooking
Small fire in home/was able to extinguish
Large fire/required fire
department
Don't know
77% 75% 67%
75%
14%
32%
42%
25%
10%
23%
33%
16% 13% 6% 6% 6%
0%
20%
40%
60%
80%
100%
Homes with children Homes with people with disabilities
Have had serious fire Know someone who died/was injured in
fire
While cooking Small fire/extinguished Large fire/fire dept Other reason/Don't know
81%
3% 2%
18%
0%
20%
40%
60%
80%
100%
Burned something while
cooking
Small fire in home/was able to extinguish
Large fire/required fire
department
Other reason/ Don't know
81% 73%
68%
83%
4% 6% 10%
4% 4% 5%
22%
4%
13% 20%
6% 10%
0%
20%
40%
60%
80%
100%
Homes with children Homes with people with disabilities
Have had serious fire Know someone who died/was injured in
fire
Total=497
Children= 194
Disability=103
Fire=45
Death/Injury=95
2015 Base Size
2015
2014
TOTAL

17% 18%
35%
9%*
13%
8%
19% 19%
37%
9% 10%
6%
20% 20%
32%
7%
14%
7%
20% 19%
33%
7%
14%
7%
19%
24%
33%
6%
15%
3%
0%
10%
20%
30%
40%
2 minutes 3 minutes 5 minutes 7 minutes 10 minutes Longer than 10 minutes
17%
21%
32%
12% 12%
6%
18%
23%
32%
10% 11%
6%
20% 23%
33%
9% 10%
6%
19%
26% 28%
15%
7% 5%
17%
23%
33%
12%
9% 6%
0%
10%
20%
30%
40%
2 minutes 3 minutes 5 minutes 7 minutes 10 minutes Longer than 10 minutes
Total Homes w/children Homes w/people with disabilities Have had a serious fire Know someone who died/was injured in fire
F5. How long do you think it takes before a home is fully engulfed in flames and becomes inescapable?
Base = Total respondents
*Statistically significant at the 95% confidence level.
15
Home Fire: Time to Engulf Home Thirty-five percent of total respondents believe it takes 2-3 minutes before a home is fully engulfed in
flames (38% in 2014).
Sixty-five percent believe it will take at least five minutes (62% in 2014), with 21% of those stating it would
take 10 minutes or more (18% in 2014). All comparisons are directional.
Time it takes to fully engulf home in flames
2015
2014
2015 Base Size
Total=1,120
Children= 375
Disability=186
Fire=78
Death/Injury=172
F6. How long do you think it would ACTUALLY take for everyone in your home to evacuate in the event of a fire?
Base = Total respondents
*Statistically significant at the 95% confidence level.
16
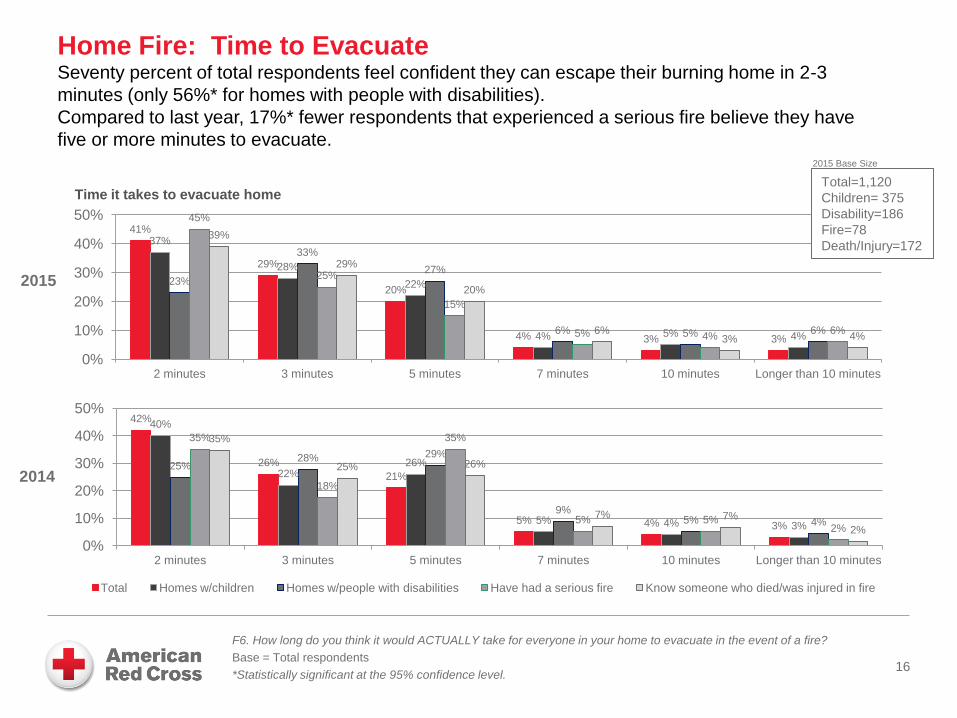
Home Fire: Time to Evacuate Seventy percent of total respondents feel confident they can escape their burning home in 2-3
minutes (only 56%* for homes with people with disabilities).
Compared to last year, 17%* fewer respondents that experienced a serious fire believe they have
five or more minutes to evacuate.
41%
29%
20%
4% 3% 3%
37%
28%
22%
4% 5% 4%
23%
33%
27%
6% 5% 6%
45%
25%
15%
5% 4% 6%
39%
29%
20%
6% 3% 4%
0%
10%
20%
30%
40%
50%
2 minutes 3 minutes 5 minutes 7 minutes 10 minutes Longer than 10 minutes
Time it takes to evacuate home
42%
26%
21%
5% 4% 3%
40%
22% 26%
5% 4% 3%
25% 28% 29%
9% 5% 4%
35%
18%
35%
5% 5% 2%
35%
25% 26%
7% 7%
2%
0%
10%
20%
30%
40%
50%
2 minutes 3 minutes 5 minutes 7 minutes 10 minutes Longer than 10 minutes
Total Homes w/children Homes w/people with disabilities Have had a serious fire Know someone who died/was injured in fire
2015
2014
2015 Base Size
Total=1,120
Children= 375
Disability=186
Fire=78
Death/Injury=172

F15. If there was a fire in your home, which, if any, of the following would you do?
Base = Total respondents
17
Home Fire: Actions Would Take The majority of respondents would call 9-1-1 and/or evacuate their home in case of a fire.
80% 76%
39% 39% 38%
2% 1%
84%
73%
38% 38%
82%
0% 1%
74% 68%
39% 34%
44%
2% 0%
69% 69%
34% 41% 41%
2% 0%
77% 74%
34% 37%
46%
2% 0%
0%
20%
40%
60%
80%
100%
Call 9-1-1 Evacuate the home Find my pets then evacuate
Try to extinguish the fire
Wake up my child then evacuate
Other Don't know/Not sure
Total Homes w/children Homes w/people with disabilities Have had a serious fire Know someone who died/was injured in fire
76% 72%
41% 40% 35%
1% 1%
74%
66%
39%
84%
31%
0% 1%
72% 66%
35% 40%
28%
1% 2%
65% 68%
36%
47%
37%
0% 0%
77%
67%
40% 45%
33%
0% 0%
0%
20%
40%
60%
80%
100%
Call 9-1-1 Evacuate the home Find my pets then evacuate
Wake up my child then evacuate
Try to extinguish the fire
Other Don't know/ Not sure
2015
2014
Total=1,120
Children= 375
Disability=186
Fire=78
Death/Injury=172
2015 Base Size
Would take the following actions in home fire
F20. Have you EVER experienced a fire in your home serious enough to cause you to evacuate your home?
Base = Total respondents
*Statistically significant at the 95% confidence level.
18
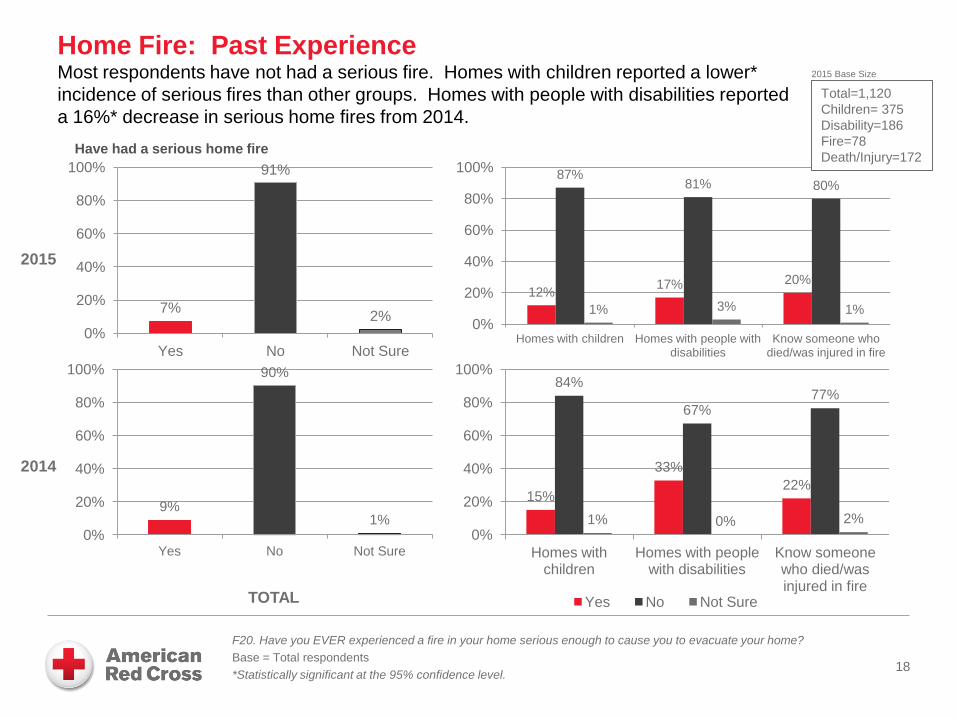
Home Fire: Past Experience Most respondents have not had a serious fire. Homes with children reported a lower*
incidence of serious fires than other groups. Homes with people with disabilities reported
a 16%* decrease in serious home fires from 2014.
Have had a serious home fire
9%
90%
1% 0%
20%
40%
60%
80%
100%
Yes No Not Sure
15%
33%
22%
84%
67% 77%
1% 0% 2%
0%
20%
40%
60%
80%
100%
Homes with children
Homes with people with disabilities
Know someone who died/was injured in fire
Yes No Not Sure
7%
91%
2%
0%
20%
40%
60%
80%
100%
Yes No Not Sure
12% 17% 20%
87% 81% 80%
1% 3% 1% 0%
20%
40%
60%
80%
100%
Homes with children Homes with people with disabilities
Know someone who died/was injured in fire
2015
2014
TOTAL
Total=1,120
Children= 375
Disability=186
Fire=78
Death/Injury=172
2015 Base Size

F21. Do you know anyone who has lost a home or had significant damage due to a home fire?
Base = Total respondents
*Statistically significant at the 95% confidence level.
19
Home Fire: Lost Home / Significant Damage Almost half of all respondents know someone who has lost a home or had significant
damage in a home fire. As would be expected, that proportion is much higher* for homes
that experienced a serious fire or know someone who died/was injured in fire.
44% 52%
3%
0%
20%
40%
60%
80%
100%
Yes No Not Sure
49% 56%
76% 82%
49% 44%
22% 16%
3% 0% 2% 2%
0%
20%
40%
60%
80%
100%
Homes with children Homes with people with disabilities
Have had serious fire
Know someone who died/was injured in
fire
Yes No Not Sure
46% 52%
2%
0%
20%
40%
60%
80%
100%
Yes No Not Sure
49% 53%
78% 79%
48% 44%
22% 21%
2% 3% 0% 0% 0%
20%
40%
60%
80%
100%
Homes with children Homes with people with disabilities
Have had serious fire
Know someone who died/was injured in
fire
2015
2014
TOTAL
Total=1,120
Children= 375
Disability=186
Fire=78
Death/Injury=172
2015 Base Size
Know someone who lost home or had significant damage in home fire

F22. Do you know anyone who has been killed or injured in a home fire?
Base = Total respondents
*Statistically significant at the 95% confidence level.
20
Home Fire: Someone Died or was Injured Sixteen percent of respondents report knowing someone who died or was injured in a fire,
compared to 18% last year. (directional). For homes with people with disabilities, this
number has decreased 11%* from last year.
10% 9%
80%
2% 0%
20%
40%
60%
80%
100%
Killed Injured No Not Sure
15%
27% 33%
58%
13% 20%
26%
52%
73%
56% 46%
0% 2% 4% 3% 0% 0%
20%
40%
60%
80%
100%
Homes with children
Homes with people with disabilities
Have had serious fire
Know someone who died/ was
injured
Killed Injured No Not Sure
9% 8%
82%
2%
0%
20%
40%
60%
80%
100%
Killed Injured No Not Sure
12% 17%
33%
61%
9% 16% 15%
50%
79% 69%
56%
0% 2% 2% 1% 0% 0%
20%
40%
60%
80%
100%
Homes with children
Homes with people with disabilities
Have had serious fire
Know someone who died/ was
injured
2015
2014
TOTAL
Total=1,120
Children= 375
Disability=186
Fire=78
Death/Injury=172
2015 Base Size
Know someone who has died or been injured in home fire

F7. What kind of dwelling do you live in?
Base = Total respondents
*Statistically significant at the 95% confidence level.
21
Home Fire: Type of Home Forty-one percent of total respondents have an upper floor in their residence or live on an
upper floor (this drops to 25%* for homes having experienced a serious fire). Compared to
last year, more homes with someone with a disability (+13%*) or who know someone who
died/was injured (+20%*) live in a single-story dwelling or on the first floor.
Dwelling type.
48%
9%
31%
12%
0%
10%
20%
30%
40%
50%
60%
Single-story home
Multi-unit bldg on ground
floor
Multi-story home
Multi-unit bldg on upper floor
45% 44% 49%
42%
8% 7% 6% 12%
34%
40% 35% 36%
12% 8% 10% 10%
0%
10%
20%
30%
40%
50%
60%
Homes with children Homes with people with disabilities
Have had serious fire Know someone who died/was injured in
fire
Single-story home Multi-unit bldg ground floor Multi-story home Multi-unit bldg upper floor
49%
10%
31%
10%
0%
10%
20%
30%
40%
50%
60%
Single-story home
Multi-unit bldg on ground
floor
Multi-story home
Multi-unit bldg on upper floor
52% 49%
54%
44%
9%
16% 21%
16%
33% 28%
19%
31%
7% 8% 6% 8%
0%
10%
20%
30%
40%
50%
60%
Homes with children Homes with people with disabilities
Have had serious fire
Know someone who died/was injured in
fire
2015
2014
TOTAL
Total=1,120
Children= 375
Disability=186
Fire=78
Death/Injury=172
2015 Base Size
F8. What would you do if your home was on fire, and you were trapped on an upper floor?
Base = Have upper floor
*Statistically significant at the 95% confidence level.
22
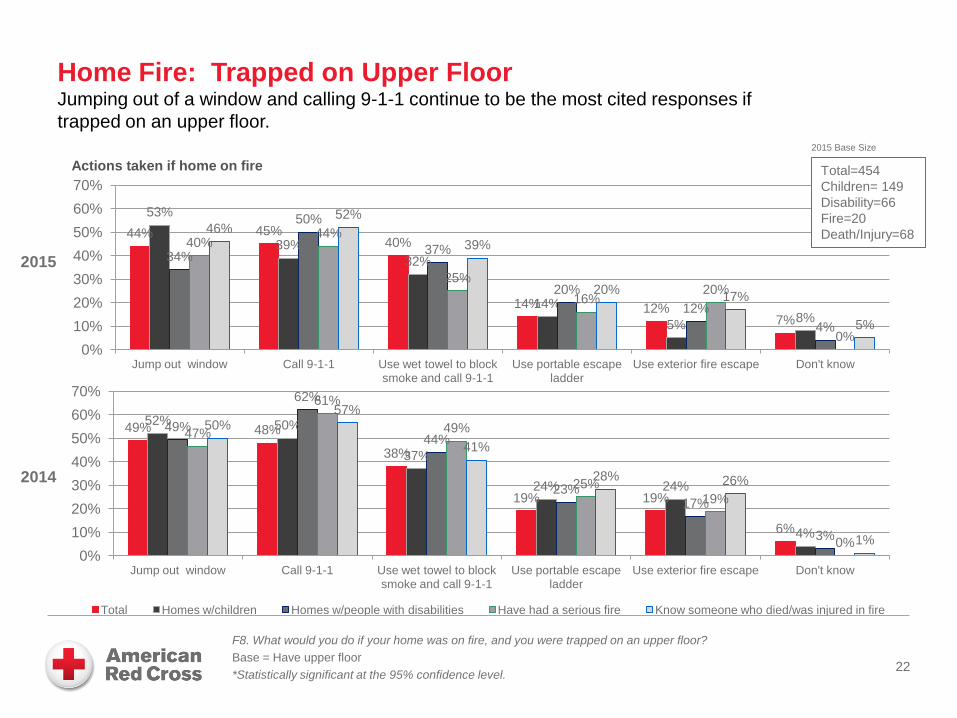
Home Fire: Trapped on Upper Floor Jumping out of a window and calling 9-1-1 continue to be the most cited responses if
trapped on an upper floor.
49% 48%
38%
19% 19%
6%
52% 50%
37%
24% 24%
4%
49%
62%
44%
23% 17%
3%
47%
61%
49%
25% 19%
0%
50% 57%
41%
28% 26%
1%
0%
10%
20%
30%
40%
50%
60%
70%
Jump out window Call 9-1-1 Use wet towel to block smoke and call 9-1-1
Use portable escape ladder
Use exterior fire escape Don't know
Total Homes w/children Homes w/people with disabilities Have had a serious fire Know someone who died/was injured in fire
2015 Base Size
44% 45% 40%
14% 12% 7%
53%
39%
32%
14%
5% 8%
34%
50%
37%
20%
12%
4%
40% 44%
25%
16% 20%
0%
46% 52%
39%
20% 17%
5%
0%
10%
20%
30%
40%
50%
60%
70%
Jump out window Call 9-1-1 Use wet towel to block smoke and call 9-1-1
Use portable escape ladder
Use exterior fire escape Don't know
2015
2014
Total=454
Children= 149
Disability=66
Fire=20
Death/Injury=68
Actions taken if home on fire

F9. Which, if any, of the following apply to you?
Base = Total respondents
*Statistically significant at the 95% confidence level.
23
Actions: Preparedness Efforts Seventy-one percent of households took at least one action, 7%* fewer than in 2014. Identifying
multiple escape routes and replacing smoke alarm batteries were the most frequently* cited
actions. Practicing fire drills at home was cited least*.
41%
33%
22% 18%
7%
29%
37% 33%
52%
24%
10%
21%
43% 40%
26% 26%
14% 17%
30% 28% 28%
17% 12%
24%
38% 38%
30% 26%
11%
19%
0%
10%
20%
30%
40%
50%
60%
Identified multiple escape routes
Replace smoke alarm batteries 2x year
Talked to children Identified family meeting place
Practice fire drills None of the above
Have taken the following actions
(NOTE: Test smoke alarms & installed next-gen/hard-wired smoke alarm omitted from QF9 on 2015 survey)
47%
40%
32%
19% 17% 16%
9%
22%
48%
40% 38%
45%
29%
21% 17%
13%
46% 41%
32%
21%
27% 28%
19%
10%
43%
49%
36%
27% 31%
26% 24%
6%
51% 51%
42%
28% 28% 27%
20%
8%
0%
10%
20%
30%
40%
50%
60%
Test smoke alarms
Identified multiple escape routes
Replace smoke alarm batteries 2x
year
Talked to children Identified family meeting place
Installed next-gen or hard-wired smoke alarm
Practice fire drills None of the above
Total Homes w/children Homes w/people with disabilities Have had a serious fire Know someone who died/was injured in fire
2015
2014
2015 Base Size
Total=1,120
Children= 375
Disability=186
Fire=78
Death/Injury=172

F9A: When was the last time you practiced a fire drill with members of your household?
Base = Have practiced fire drill
24
Actions: Preparedness Efforts 80% of those who have practiced fire drills at home have done so within the past 12 months. More than
half have practiced within the past 6 months.
51%
29%
9%
1% 0%
10%
47%
43%
2% 0% 0%
8%
50%
38%
7%
0% 0%
5%
59%
41%
0% 0% 0% 0%
39%
52%
5%
0% 0%
4%
0%
10%
20%
30%
40%
50%
60%
70%
Within past 6 months 7-12 months ago 1-2 years ago 2-5 years ago More than 5 years ago
Don't recall
Total Homes w/children Homes w/people with disabilities Have had a serious fire Know someone who died/was injured in fire
Total=78
Children=38
Disability=25
Fire=10
Death/Injury=18
2015 Base Size
New Question 2015
Caution small base size
Last time practiced fire drill

F9B: When was the last time you talked to your children about what to do in case of a fire?
Base = Have talked to children
*Statistically significant at the 95% confidence level. 25
Actions: Preparedness Efforts 66% of households that have talked to children about what to do in case of a fire have done so within the
past 12 months. Homes that have had a serious fire are more likely* than any other group to have talked
to children in past 12 months.
44%
22%
15%
9% 9%
49%
24%
16%
6% 5%
63%
11%
18%
4% 4%
62%
22%
16%
0% 0%
41%
20%
25%
11%
3%
0%
10%
20%
30%
40%
50%
60%
70%
Within past 6 months 7-12 months ago 1-2 years ago More than 5 years ago Don't recall
Total Homes w/children Homes w/people with disabilities Have had a serious fire Know someone who died/was injured in fire
Total=248
Children=193
Disability=48
Fire=21
Death/Injury=52
2015 Base Size
New Question 2015
Last time talked to children

F10. What is keeping you from being more prepared?
Base = None of the items apply to the respondent/not fully prepared
26
Actions: Obstacles to Preparedness Most cited obstacles include thinking “we’ll know what to do”, not knowing where to start,
and believing there will be plenty of time to evacuate.
30%
23% 19% 18%
8%
2% 2% 2% 2%
13%
37%
22% 18%
21%
4% 2% 0% 4% 3%
19% 23%
14% 14% 14%
7% 8% 7%
0% 0%
21% 17%
33%
0% 0% 0% 0% 0% 0%
17%
33%
27% 27%
7%
13%
7%
0% 0%
13% 13%
0%
10%
20%
30%
40%
50%
60%
We'll know what to do
Will have plenty of time to evacuate
Don't know where to start
Not at risk Not important Can't access smoke alarms
in home
Won't be able to save myself
Too time consuming
Will scare my children
Other
Total Homes w/children Homes w/people with disabilities Have had a serious fire Know someone who died/was injured in fire
Obstacles
(NOTE: ‘Other’ category was used in 2014. ‘None’ category was used in 2015.).
2015 Base Size
34%
18% 13% 13%
3% 2% 2% 1% 0%
36%
16%
31%
11%
17%
2% 2% 5% 3%
0%
40%
24% 22%
10% 7%
3% 0% 0% 0% 0%
44%
25%
16% 21%
8% 7% 4%
0% 0% 0%
46%
32%
11% 14% 15%
8% 4%
0% 0% 0%
32%
0%
10%
20%
30%
40%
50%
60%
We'll know what to do
Don't know where to start
Will have plenty of time to evacuate
Not at risk Not important Can't access smoke alarms
in home
Too time consuming
Will scare my children
Won't be able to save myself
None
2015
2014
Total =320
Children=79
Disability=31
Fire=19
Death/Injury=33
F16. Which, if any, of the following statements have applied to you within the last five years?
Base = Total respondents
*Statistically significant at the 95% confidence level (comparison of 2014 to 2015).
27
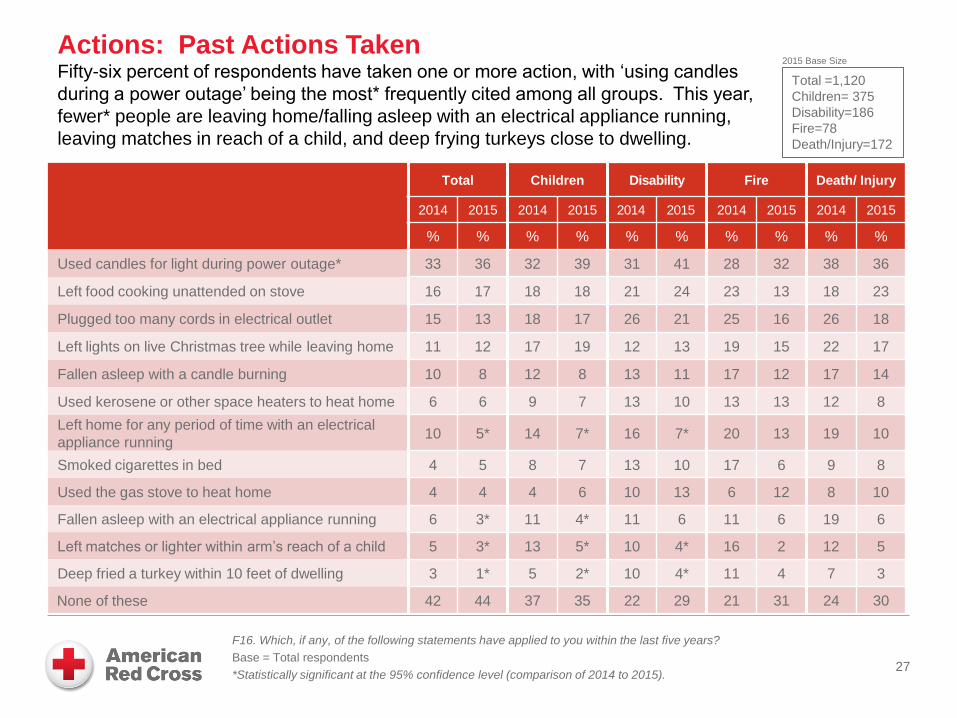
Actions: Past Actions Taken Fifty-six percent of respondents have taken one or more action, with ‘using candles
during a power outage’ being the most* frequently cited among all groups. This year,
fewer* people are leaving home/falling asleep with an electrical appliance running,
leaving matches in reach of a child, and deep frying turkeys close to dwelling.
Total Children Disability Fire Death/ Injury
2014 2015 2014 2015 2014 2015 2014 2015 2014 2015
% % % % % % % % % %
Used candles for light during power outage* 33 36 32 39 31 41 28 32 38 36
Left food cooking unattended on stove 16 17 18 18 21 24 23 13 18 23
Plugged too many cords in electrical outlet 15 13 18 17 26 21 25 16 26 18
Left lights on live Christmas tree while leaving home 11 12 17 19 12 13 19 15 22 17
Fallen asleep with a candle burning 10 8 12 8 13 11 17 12 17 14
Used kerosene or other space heaters to heat home 6 6 9 7 13 10 13 13 12 8
Left home for any period of time with an electrical
appliance running 10 5* 14 7* 16 7* 20 13 19 10
Smoked cigarettes in bed 4 5 8 7 13 10 17 6 9 8
Used the gas stove to heat home 4 4 4 6 10 13 6 12 8 10
Fallen asleep with an electrical appliance running 6 3* 11 4* 11 6 11 6 19 6
Left matches or lighter within arm’s reach of a child 5 3* 13 5* 10 4* 16 2 12 5
Deep fried a turkey within 10 feet of dwelling 3 1* 5 2* 10 4* 11 4 7 3
None of these 42 44 37 35 22 29 21 31 24 30
Total =1,120
Children= 375
Disability=186
Fire=78
Death/Injury=172
2015 Base Size

F12. For children between the ages of 3 and 17 who are living with you, in which of the following age groups is the
YOUNGEST child OVER THE AGE OF 3?
Base = Have children age 0-17 in household
28
Actions - Children: Age Groups In households with children under age 17, 49% have a child age 7 or younger.
Age of children.
38%
27% 26%
8%
0%
10%
20%
30%
40%
50%
60%
70%
Between ages 3-7
Between ages 8-12
Between ages 13-17
All under age 3
58% 63%
52%
29% 28% 29%
6% 10%
13% 7%
0%
7%
0%
10%
20%
30%
40%
50%
60%
70%
Homes with people with disabilities
Have had serious fire Know someone who died/was injured in fire
Between ages 3-7 Between ages 8-12 Betweeen ages 13-17 All under age 3
2015 Base Size
40%
27% 24%
9%
0%
20%
40%
60%
Between ages 3-7
Between ages 8-12
Between ages 13-17
All under age 3
37%
50% 43%
31% 30% 23% 23%
12% 17%
9% 9%
17%
0%
20%
40%
60%
Homes with people with disabilities
Have had serious fire Know someone who died/was injured in fire
2015
2014
TOTAL/HAVE CHILDREN
Total/Children=375
Disability=67
Fire=44
Death/Injury=71

F13. Think for a moment about the YOUNGEST child over the age of 3 who is living in your home. For each of the
following, please indicate if it is something your youngest child over the age of 3 can or cannot do or if you are not sure.
Base = Have children age 3-17 in household
*Statistically significant at the 95% confidence level.
29
Actions - Children: Ability to take Action (Can Do) Young children are most capable* of recognizing the sound of a smoke alarm and
getting to the family meeting place after evacuating. Fewer* children are able to
identify an alternate exit than last year.
Youngest child over age 3 CAN do this
Total/Children=340
Disability=61
Fire=40
Death/Injury=59
Can do this
Total /
Children Disability Fire Death/Injury
2014 2015 2014 2015 2014 2015 2014 2015
% % % % % % % %
Recognize the sound of our home smoke alarm 80 83* 71 76 67 68 65 77
Go to our family meeting place after evacuating 73 73* 67 66 55 65 63 67
Evacuate our home without the help of an adult 69 64 53 50 53 63 51 59
Wake up during the night and evacuate our home 67 64 54 66 55 69 51 61
Identify another way to leave a room if the doorway
is blocked 67 59* 50 53 53 61 59 59
2015 Base Size

F13. Think for a moment about the YOUNGEST child over the age of 3 who is living in your home. For each of the
following, please indicate if it is something your youngest child over the age of 3 can or cannot do or if you are not sure.
Base = Have children age 3-17 in household
*Statistically significant at the 95% confidence level.
30
Actions - Children: Ability to take Action (Cannot Do) More* young children can recognize the sound of a smoke alarm than last year. In
homes with someone with a disability, 19% more young children can identify an
alternate exit than reported in 2014.
Youngest child over age 3 CANNOT do this
Total/Children=340
Disability=61
Fire=40
Death/Injury=59
Cannot do this
Total /
Children Disability Fire Death/Injury
2014 2015 2014 2015 2014 2015 2014 2015
% % % % % % % %
Evacuate our home without the help of an adult 18 15 37 25 33 17 36 23
Wake up during the night and evacuate our home 17 15 24 24 28 16 28 25
Identify another way to leave a room if the doorway
is blocked 17 15 36 17* 33 11 27 14
Go to our family meeting place after evacuating 16 14 29 20 33 16 28 24
Recognize the sound of our home smoke alarm 14 9* 29 20 33 26 30 19
2015 Base Size

F13. Think for a moment about the YOUNGEST child over the age of 3 who is living in your home. For each of the
following, please indicate if it is something your youngest child over the age of 3 can or cannot do or if you are not sure.
Base = Have children age 3-17 in household
*Statistically significant at the 95% confidence level.
31
Actions - Children: Ability to take Action (Not Sure) Parents are less sure* that their youngest child over the age of 3 could identify an
alternate exit or evacuate without the help of an adult than they were last year.
NOT SURE if youngest child over age 3 can do this
Total/Children=340
Disability=61
Fire=40
Death/Injury=59
Not sure
Total /
Children Disability Fire Death/Injury
2014 2015 2014 2015 2014 2015 2014 2015
% % % % % % % %
Identify another way to leave a room if the doorway
is blocked 15 25* 14 30 14 28 15 26
Evacuate our home without the help of an adult 13 21* 10 25 14 20 14 18
Wake up during the night and evacuate our home 16 21 22 10 18 15 21 14
Go to our family meeting place after evacuating 11 14 4 14 12 19 10 10
Recognize the sound of our home smoke alarm 6 8 0 3 0 6 5 4
2015 Base Size

10% 10% 9%
0%
10%
20%
30%
40%
50%
60%
Disability Health Condition Elderly
F14. Does anyone living in your home have a disability, a health condition, or is elderly, impacting his or her ability to
evacuate in case of a fire?
Base = Total respondents
32
Actions - Disability In 2015, 17%* of homes have an individual with a disability, a health condition, or who is
elderly, impacting their ability to evacuate in case of a fire, compared to 12% in 2014.
Have a disability, a health condition, or is elderly
11%
57%
26%
22%
11%
60%
31%
23%
9%
55%
20% 18%
0%
10%
20%
30%
40%
50%
60%
Home with children
Homes with people with disabilities
Have had serious fire
Know someone who died/was injured in fire
Disability Health Condition Elderly
Total=1,120
Children=375
Fire=78
Death/Injury=172
2015 Base Size
Modified Question 2015
2014 Have a disability or health
condition.
12%
84%
4%
0%
10%
20%
30%
40%
50%
60%
70%
80%
90%
Yes No Not Sure
TOTAL

F14A. Do you have a specific plan to help the person with a disability or health condition to evacuate the home or get to
safety within 2 minutes?
Base = Anyone in home has a disability or health condition that would impact his or her ability to evacuate in case of a
fire
33
Actions - Disability: Specific Plan for Evacuation Sixty-five percent of homes with someone who has a disability, health condition, or the
elderly have a specific plan for evacuation, 6% less than last year (directional).
Have specific plan to help person with disability or health condition
71%
23%
6%
0%
20%
40%
60%
80%
100%
Yes No Not Sure
83% 82% 78%
13% 18% 18%
4% 0% 4%
0%
20%
40%
60%
80%
100%
Home with children Have had serious fire Know someone who died/was injured in fire
Yes No Not sure
2015 Base Size
65%
24%
11%
0%
20%
40%
60%
80%
100%
Yes No Not Sure
76% 72% 75%
21% 25% 16%
3% 3% 10%
0%
20%
40%
60%
80%
100%
Home with children Have had serious fire Know someone who died/was injured in fire
2015
2014
TOTAL
Total/Disability=186
Children=67
Fire=31
Death/Injury=54