AMERICAN INSTITUTES FOR RESEARCH -...
54
10720 COLUMBIA PIKE, SUITE 500SILVER SPRING, MD 20901-4400TEL 301 592 8600FAX 301 593 9433WEBSITE WWW.AIR.ORG AMERICAN INSTITUTES FOR RESEARCH ® DIETARY GUIDELINES FOR AMERICANS: FINAL REPORT ON FOCUS GROUPS DEPARTMENT OF HEALTH AND HUMAN SERVICES (HHS) OFFICE OF DISEASE PREVENTION AND PROMOTION (ODPHP) FINAL JUNE 18, 2010 Prepared for: Kathleen Loughrey Office of Disease Prevention and Promotion (ODPHP) Department of Health and Human Services (HHS) Prepared by: Graciela Castillo Tamika Owens Margarita Hurtado American Institutes for Research® (AIR®) “American Institutes for Research” is a registered trademark. All other brand, product, or company names are trademarks or registered trademarks of their respective owners.
Transcript of AMERICAN INSTITUTES FOR RESEARCH -...

10720 COLUMBIA PIKE, SUITE 500SILVER SPRING, MD 20901-4400TEL 301 592 8600FAX 301 593 9433WEBSITE WWW.AIR.ORG
AMERICAN INSTITUTES FOR RESEARCH® DIETARY GUIDELINES FOR AMERICANS:
FINAL REPORT ON FOCUS GROUPS
DEPARTMENT OF HEALTH AND HUMAN SERVICES (HHS)
OFFICE OF DISEASE PREVENTION AND PROMOTION (ODPHP)
FINAL
JUNE 18, 2010
Prepared for: Kathleen Loughrey
Office of Disease Prevention and Promotion (ODPHP) Department of Health and Human Services (HHS)
Prepared by: Graciela Castillo
Tamika Owens Margarita Hurtado
American Institutes for Research® (AIR®)
“American Institutes for Research” is a registered trademark. All other brand, product, or company names are trademarks or registered trademarks of their respective owners.

ODPHP Dietary Guidelines for Americans Final Report—June 18, 2010 1
Contents
Introduction ......................................................................................................................................2
Methods ............................................................................................................................................2 Considerations for the Focus Groups ........................................................................................................ 2 Focus Group Locations .............................................................................................................................. 3 Recruitment and Screening ....................................................................................................................... 4 Discussion Topics ...................................................................................................................................... 4 Procedures ................................................................................................................................................ 4 Analysis and Reporting .............................................................................................................................. 5
Characteristics of Focus Group Participants ........................................................................................5
Findings .............................................................................................................................................7 Making Food Decisions ............................................................................................................................. 7 Understanding Barriers, Motivators, and Behaviors ................................................................................ 8 Visualizing Food Portions ........................................................................................................................ 13
Reactions to Images ............................................................................................................................ 14 Reactions to Video .............................................................................................................................. 17 Recognition and Knowledge Regarding Nutrition Labels ................................................................... 18
Actionable Goals and Messages.............................................................................................................. 19
Recommendations ........................................................................................................................... 22 General Approach ................................................................................................................................... 22 Messages and Goals ................................................................................................................................ 22 Tools ........................................................................................................................................................ 23 Other Content ......................................................................................................................................... 23 Sources of Information ........................................................................................................................... 24 Products .................................................................................................................................................. 24
Appendixes ...................................................................................................................................... 25 Appendix A. Focus Group Participant Screener ...................................................................................... 26 Appendix B. Focus Group Participant Consent Form .............................................................................. 34 Appendix C. Focus Group Moderator Guide ........................................................................................... 37 Appendix D. Preferred Images of Focus Group Participants (by group and site) ................................... 46 Appendix E. Actionable Goals of Focus Group Participants (by group and site) .................................... 48
List of Tables Table 1. Focus group segmentation .............................................................................................................. 3 Table 2. Population meeting recommendations for fruit and vegetable consumption (population aged
2 years and older, ordered by tertiles) ..................................................................................................... 3 Table 3. Sociodemographic characteristics of focus group participants ...................................................... 6 Table 4. Race/ethnicity and gender characteristics of focus group participants ......................................... 6 Table 5. Preferred images to visualize food portions (all sites) .................................................................. 17 Table 6. Personal goals of focus group participants (all sites) .................................................................... 19

ODPHP Dietary Guidelines for Americans Final Report—June 18, 2010 2
Introduction Between March 29 and April 28, 2010, the American Institutes for Research® (AIR®) conducted six focus groups to conduct formative research regarding attitudes and behaviors related to food choices among adults with low health literacy. The focus groups were conducted in three locations: Baltimore, MD; Chicago, IL; and Little Rock, AR. This work is being conducted for the Office of Disease Prevention and Health Promotion (ODPHP) of the U.S. Department of Health and Human Services (HHS) as part of the audience research being used to develop and test consumer materials to communicate the revised Dietary Guidelines for Americans (DGA). The materials were tested with adult consumers in groups separated by their stage of behavior change (Contemplation Stage versus Preparation Stage) when the focus groups were conducted. The stages are defined by the transtheoretical model of behavior change.1
The main purpose of this research was to learn more about participants’ knowledge, attitudes, and behaviors related to their food planning and selection decisions, identify barriers and motivators to healthy eating, examine participants’ understanding of food groups and health-related food characteristics, examine participants’ reactions to various images that may be used to help identify effective methods to depict food portion sizes, and identify actionable goals and messages related to healthy eating. The target population for the research on the Dietary Guidelines for Americans (DGA) communication is the U.S. adult population with limited health literacy, mostly individuals with a high school education who are able to read simple text. (The assumption is that the resulting communication will also apply to a broader audience of U.S. adults.) This report describes the research conducted, the images tested, and the results of the focus groups as well as conclusions and recommendations.
Methods
Considerations for the Focus Groups Six focus groups were conducted for this study to examine factors that can influence knowledge, attitudes, and behaviors related to healthy eating and affect participants’ receptivity to messages about healthy eating. ODPHP wished to speak with adults with limited health literacy who had recently sought information about healthy eating. They also wanted to learn from respondents who were contemplating or preparing to make changes to eat healthier. Because no tool was identified to directly assess stage of interest in eating healthier that was validated for use in a screener rather than an interview or survey, ODPHP used an assessment of interest in increasing fruit and vegetable consumption among persons not eating recommended amounts. Instead, ODPHP used an assessment that has been validated and used in research settings but that could be easily adapted to a screener as subjects do not need to record or recall the number of fruits and vegetables they consumed during a particular period of time.2
As Table 1 shows, the level of interest in making a change was one of the characteristics used to divide or segment the focus groups. The second characteristic used to divide the focus groups was to divide them across three locations or states and thus have a variety of individuals in terms
1 Weinstein ND, Rothman AJ, Sutton S (1988). Stage theories of health behavior: conceptual and methodological issues. Health Psychol 17: 290–299. 2 Lechner L, Brug J, De Vries H, van Assema P, Mudde A (1998). Stages of change for fruit, vegetable and fat intake: Consequences of misconception. Health Education Research 13 (l): 1-11.

ODPHP Dietary Guidelines for Americans Final Report—June 18, 2010 3
of the availability and consumption of fruits and vegetables and a wide range of demographic characteristics including race and ethnicity.
Table 1. Focus group segmentation
LOCATION
STAGE OF CHANGE REGARDING FRUIT AND VEGETABLE CONSUMPTION
CONTEMPLATING EATING MORE FRUITS AND VEGETABLES
PREPARING TO EAT MORE FRUITS AND VEGETABLES TOTAL
Baltimore, MD 1 group 1 group 2
Chicago, IL 1 group 1 group 2
Little Rock, AR 1 group 1 group 2
Total 3 groups 3 groups 6 focus groups
Focus Group Locations Six focus groups were conducted in three locations: Baltimore, MD; Chicago, IL; and Little Rock, AR. These locations were selected to include large and small urban areas with different racial/ethnic representation, and to represent several geographic regions of the country. They also represent locations with different levels of consumption of fruits as well as vegetables as shown by the proportion of the population meeting the fruit consumption recommendation and the proportion of the population meeting the vegetable consumption recommendation (see Table 2).3
Table 2. Population meeting recommendations for fruit and vegetable consumption (population aged 2 years and older, ordered by tertiles
Arkansas is in the “low” group for both fruit and vegetable consumption, while Maryland is in the “middle” group for fruit and in the “low” group for vegetable consumption. Illinois is in the “high” group for consumption of fruits and the “middle” group for vegetable consumption. As a result, focus groups were conducted in three locations that represent different proportions of the population consuming the recommended amount of fruits and vegetables.
4
STATE
)
POPULATION MEETING THE FRUIT CONSUMPTION RECOMMENDATION
POPULATION MEETING THE VEGETABLE CONSUMPTION RECOMMENDATION
Arkansas 14.9% (low tertile) 12.6% (low tertile)
Illinois 26.5% (high tertile) 14.6% (middle tertile)
Maryland 19.1% (middle tertile) 12.9% (low tertile) Source: USDA. Agricultural Research Service Community Nutrition Mapping Project. Available at http://ars.usda.gov/Services/docs.htm?docid=15763&pf=1&cg_id=0; map last modified 7/31/2009. http://ars.usda.gov/Services/docs.htm?docid=15756&pf=1&cg_id=0; map last modified 7/31/2009. Retrieved May 20, 2010.
3 For the healthy eating patterns, food group data are derived from the ARS MyPyramid Equivalents Database for individuals aged 2 years and older. Information for individuals aged 25–64 years only was not available, so this was used as a measure of the consumption by the population overall. This mapping data is part of the USDA. Agricultural Research Service’s Community Nutrition Mapping Project. Available at http://ars.usda.gov/Services/docs.htm? docid=15656. Last Modified: 03/30/2010. Retrieved May 20, 2010. 4 Fruits: low tertile: <18.8 percent; middle tertile: 18.8 percent to <25.4 percent; high tertile: = or >25.4 percent Vegetables: low tertile: <13.5 percent; middle tertile: 13.5 percent to <15.7 percent; high tertile: = or >15.7 percent.
ODPHP Dietary Guidelines for Americans Final Report—June 18, 2010 4
Recruitment and Screening Participants were screened via telephone and recruited by professional recruiting services after being trained in the use of the screener by AIR (see Appendix A). Individuals were selected to participate in the focus groups if they were aged 25 to 64 years, if they had recently sought information about healthy eating, and if they were not meeting the dietary guidelines’ recommendations for fruit and vegetable consumption but were thinking about or planning to do so. Consumption of fruits and vegetables was used as a proxy for overall dietary patterns because many more studies have focused on consumption of fruits and vegetables rather than other foods. From a more practical standpoint, asking about all food groups in a brief screener, which can be done more easily in a survey, was impossible.
For the screener, we used validated measures to collect demographic information and one question to assess health literacy level as reported by the respondent.5
Between 11 and 12 participants were recruited for each group, and the actual focus group size ranged from 7 to 10 participants. Focus groups took place at professional focus group facilities. Moderators experienced in conducting groups with individuals with lower levels of literacy conducted the groups, and a note taker also was present. Discussions were videotaped in Chicago and Little Rock, and were audiotaped in Baltimore. AIR’s Institutional Review Board reviewed and approved all focus group procedures and materials; they also were approved by the Office of Management and Budget (OMB). Before beginning the focus group discussion, participants signed a consent form (see Appendix B).
The health literacy assessment item was not used to select participants but to characterize them. Instead, the level of education was the main exclusion criterion. Individuals with more than a high school diploma or GED were excluded. Individuals were also excluded from participation in the focus groups if they were following a restricted diet as needed for a health condition, had had bariatric surgery, or had a body mass index (BMI) was outside the range of 20–29 (that is, if they were underweight or obese).
Discussion Topics
The focus group guide includes questions on the following: • Making food decisions • Understanding barriers, motivators and behaviors • Understanding foods and how they relate to healthy eating • Visualizing food portions • Defining actionable goals for healthy eating and influential messages
Procedures Focus group moderators and note takers were trained in the focus group protocol (see Appendix C) before initiating the groups. During the groups and after confirming consent, participants were first asked questions about how they make food decisions and their sources of information and influencers, barriers and motivators to eating healthier, and understanding of the types of foods and 5 This item is a validated measure of health literacy from Morris NS, MacLean CD, Chew LD, & Littenberg B. 2006. “The Single Item Literacy Screener: Evaluation of a brief instrument to identify limited reading ability.” BMC Family Practice; 7(21).
ODPHP Dietary Guidelines for Americans Final Report—June 18, 2010 5
how they relate to healthy eating. Participants were then shown visual images, including photographs and a video, about the amounts of food to eat. After each image, participants were asked what the image meant and whether it helped them understand how much to eat. Participants were then asked to identify which image they thought was most helpful in visualizing food portion by writing their choice down; then they were asked to raise their hand for their choice when the image was mentioned by the moderator. The order of presentation was the same for each group. Some food portion images, however, were shown only in the first location (Baltimore) as they were found to be repetitive and did not provide additional information. Participants were also shown a nutrition label and asked questions regarding their understanding and use of the label. After the images and video were presented, participants were asked to write down three actionable goals they were planning to implement within the next month to eat healthier; discussion of the goals and healthy-eating messages followed. The focus groups concluded with final recommendations from the participants to the Government about how to best help people to eat healthier.
Analysis and Reporting The moderators and note takers reviewed all the notes and videotapes to identify common themes across focus groups as well as any similarities and differences in responses by stage of change (Contemplators versus Preparers) or by location. The definition of themes and interpretation of the findings was validated by each of two moderators. Note takers analyzed the data separately. An initial topline report was prepared, and this document represents the full report.
Characteristics of Focus Group Participants The six focus groups AIR staff conducted included a combined total of 53 participants across the three locations. Table 2 describes the main characteristics of focus group participants.
As Table 3 shows, approximately one third of participants (32%) were aged 45 to 54 years, and an additional third of participants (32%) were aged 55 and 64 years. About one fifth of participants (21%) were aged 35 to 44 years, and 15 percent of participants were aged 25 to 34 years. Non-Hispanic African Americans, Non-Hispanic Caucasians, and Latinos of any race were recruited because they are the largest representation in the country and have higher representation among those who do not meet the dietary guidelines. The two focus groups in Baltimore were almost evenly divided among African American and Caucasian participants. In Chicago, both focus groups had an equal or greater number of Latino participants than other ethnicities. Both focus groups in Little Rock had predominantly Caucasian participants. Across all focus groups, 53 percent of the focus group participants were Caucasian, 26 percent were African American, and 17 percent were Latino. Table 4 shows the number of focus group participants by race/ethnicity and gender.
Overall, 13 percent of the participants had some high school education, and 87 percent were high school graduates. The greatest proportion of participants (45%) reported “sometimes” needing someone to help them when they read instructions, pamphlets, or other written material from their doctor or pharmacy.
Three of the focus groups (n=28) consisted of participants who were in the Contemplation Stage of the transtheoretical model of behavior change, and three of the focus groups (n=25) consisted of participants in the Preparation Stage.

ODPHP Dietary Guidelines for Americans Final Report—June 18, 2010 6
Table 3. Sociodemographic characteristics of focus group participants BALTIMORE, MD CHICAGO, IL LITTLE ROCK, AR
TOTAL (n=53)
Group 1 (n=10)
Group 2 (n=10)
Group 1 (n=9)
Group 2 (n=8)
Group 1 (n=9)
Group 2 (n=7)
AGE 25–34 1 2 3 0 2 0 8 (15%) 35–44 2 1 2 3 1 2 11 (21%) 45–54 3 4 2 2 4 2 17(32%) 55–64 4 3 2 3 2 3 17 (32%) GENDER Male 3 4 3 2 4 3 19 (36%) Female 7 6 6 6 5 4 34 (64%) EDUCATION Some High School 3 3 1 0 0 0 7 (13%)
High School Graduate or GED 7 7 8 8 9 7 46 (87%)
RACE/ETHNICITY Non-Hispanic Caucasian 4 5 3 2 8 6 28 (53%) Non-Hispanic African American 5 4 2 2 1 0 14 (26%) Hispanic, any race 0 0 4 4 0 1 9 (17%) Mixed 1 1 0 0 0 0 2 (4%) SELF-REPORTED HEALTH LITERACY * Never 1 1 5 5 0 0 12 (23%) Rarely 0 1 2 2 5 6 16 (30%) Sometimes 9 8 1 1 4 1 24 (45%) Often 0 0 0 0 0 0 0 (0%) Always 0 0 1 0 0 0 1 (2%)** STAGE OF CHANGE Contemplation Stage 10 N/A 9 N/A 9 N/A 28 (53%) Preparation Change N/A 10 N/A 8 N/A 7 25 (47%)
* Single item used to gather information on this characteristic. N/A- not applicable as groups were segmented by this characteristic.
** Does not add up to 100% due to rounding.
Table 4. Race/ethnicity and gender characteristics of focus group participants
RACE/ETHNICTY AND GENDER BALTIMORE, MD CHICAGO, IL LITTLE ROCK, AR
TOTAL (n=53)
Group 1 (n=10)
Group 2 (n=10)
Group 1 (n=9)
Group 2 (n=8)
Group 1 (n=9)
Group 2 (n=7)
Non-Hispanic Caucasian Male 1 1 1 0 3 2 8 (15%)
Non-Hispanic Caucasian Female 3 4 2 2 5 4 20 (38%)
Non-Hispanic African American Male 2 2 0 1 1 0 6 (11%)
Non-Hispanic African American Female 3 2 2 1 0 0 8 (15%)
Hispanic, any race, Male 0 0 2 1 0 1 4 (8%)
Hispanic, any race, Female 0 0 2 3 0 0 5 (9%)
Non-Hispanic, Mixed race, Male 0 1 0 0 0 0 1 (2%)
Non-Hispanic, Mixed race, Female 1 0 0 0 0 0 1 (2%)

ODPHP Dietary Guidelines for Americans Final Report—June 18, 2010 7
Findings
Making Food Decisions Many participants did not plan their meals but rather decided on the spot or on a day-to-day basis what they were about to eat. Even participants who planned their grocery purchases to select particular ingredients for preparing meals still decided on a day-to-day basis which specific meals they prepared. Participants reported their food decisions were primarily influenced by taste, cravings, and convenience. These aspects played an important role in their decision not to plan their meals in advance. Several participants noted they made grocery lists for shopping but still tended to decide what their meals would be either the day before or on the same day.
I decide what I would like to eat but most of the time I go on what I’m craving rather than what I should be eating. It’s basically around what’s available, what’s cheap, doable, what the kids will eat, what everybody wants. Definitely decide day by day. (Chicago, IL)
I grocery shop two times a month. Sometimes, I’ll prepare. But sometimes the day may come up and my taste buds may change. So I go with the flow. (Baltimore, MD)
We kind of have favorites so I just get the basics. Hamburger meat and there’s a lot of different things you can cook with that. Chicken. I have the basic things that I buy but whatever hits my fancy is what I cook. I don’t really plan. (Little Rock, AR)
Most often, participants planned or prepared their meals if they or a close family member had health issues. Some participants did plan or prepare their meals ahead of time. These participants mentioned the main reasons for planning or preparing their meals ahead of time were health concerns: diabetes, high blood pressure, or obesity. These health concerns were mentioned at every focus group site. Several participants also mentioned they had changed their diet or were planning and preparing meals ahead of time as a way to control a health issue of a close relative (for example, spouse, parents, or children).
The different meal-planning methods participants mentioned include the following:
• Making lists for grocery shopping
• Making meals ahead of time and freezing them
• Using recipes
• Limiting certain food ingredients such as salt or fat
• Limiting types of foods in the house (for example, junk food)
Participants tended to plan more during weekends than during the week. Participants noted that it was typically more convenient for them to plan on the weekends. A few participants prepared all their meals for the following week during the weekend and froze them. This was most often the case for those who had little time or needed to spend time with their children during the week. Participants mentioned that lists for grocery shopping and recipes were the most popular ways for helping them plan. One participant also mentioned using a crock pot to help her plan and prepare her meals in advance.

ODPHP Dietary Guidelines for Americans Final Report—June 18, 2010 8
I use a mini crock pot. That helps. I love to use the crock pot ‘cause I can put it in there and go to sleep. And when I get up it’s done. (Baltimore, MD)
I’m a planner. I work Monday through Friday until 5pm and I enjoy cooking so on the weekends I like to plan what I’m going to make and what I need to make it.” (Chicago, IL)
You have more time on the weekend. During the week you rush it, you have more time on the weekend to plan meals. When I get home from work it just depends on what my husband wants that I fix. (Baltimore, MD)
Many of the participants had other people who influenced what they decided to cook and eat. Participants named parents, spouses, children, or grandchildren who lived with or visited them as primary influences of what they decided to cook and/or the way they decided to cook. They would incorporate others’ cravings, tastes, and health concerns into their decisions about what to prepare and how to prepare it.
My kids tell me what they want ahead of time. My husband tells me what he wants ahead of time. I know what I like and dislike. So we compromise on certain things. If they tell me certain things, I’ll say OK. (Baltimore, MD)
Most participants did not plan meals when eating out. Most participants did not eat out often due to the high cost of doing so. When they did go out to eat, they view it was as a special occasion and a time to treat themselves without considering whether it is healthy or not. When they did, they did not plan their meals. Their meal decisions when eating out were based on what they were craving at the moment, convenience, and whether the food was something they could make at home at lower cost. Several participants mentioned that it was cheaper to order the unhealthy foods than the healthy foods.
To get a salad at McDonald’s is $4.96–$5.96 but to get a cheeseburger it’s $2.20. There’s a money difference. I got a parfait, water and a grilled chicken and it was $7.95. I could have gotten a Big Mac, fries and a Coke for less than 5 bucks. (Little Rock, AR)
Participants did not differ by “stage of change” with respect to planning meals or food decisions. Focus groups were divided equally between Contemplators and Preparers. Although we had hypothesized that this aspect might influence several of the topics addressed such as planning meals, in general, we did not find any clear-cut differences across the groups by stage of change. Rather, the variation in responses among Preparers and the variation among contemplators were very large, so the differences found were actually within groups of Preparers or contemplators rather than across them. In general, this was true for all of the focus group topics, unless noted otherwise.
Understanding Barriers, Motivators, and Behaviors Most focus group participants understood the meaning of “healthy eating.” Participants were asked to share what they thought of when they heard the phrase “healthy eating” or to share what it meant to them. The common phrases used to describe healthy eating across the groups included eating foods low in fat, eating foods low in salt/sodium, eating fruits

ODPHP Dietary Guidelines for Americans Final Report—June 18, 2010 9
and vegetables, eating a balanced diet/everything in moderation, eating smaller portions, and weight control.
I have high blood pressure so I don’t eat certain things like pork or lots of cholesterol. I don’t use salt at all because of my high blood pressure. (Baltimore, MD)
We’re eating more fruits and vegetables, but still well rounded. I couldn’t do that, I need a decent ground beef, fish, crab cake. (Baltimore, MD)
In addition to the common positive terms participants used to describe healthy eating, there were also a few negative terms in reference to healthy eating. These included higher cost and that healthy eating consisted of tasteless food.
It’s about cost for me. I’m tight and the things that are best for you are the most expensive. My guilty pleasure is a big bowl of fruit but it’s not because it’s bad for you but that it costs $4. Real fish looks delicious but I won’t pay for it. (Little Rock, AR)
One participant stated that healthy eating is about eating to lose weight since most media messages mention healthy eating in relation to being a healthy weight. The participants from Little Rock seemed particularly knowledgeable about healthy eating.
Health and “healthy eating” were factors for some of the participants’ decisions about what to eat. Participants who reported making at least a few healthy eating choices most often referred to the following reasons:
• To maintain current good health
• To decrease their risk of disease such as diabetes, high blood pressure, high cholesterol, heart attacks
• To manage diseases such as diabetes, high blood pressure, high cholesterol, and heart attacks
Several participants were also influenced in their food decisions by the health concerns of others for whom they made food decisions (for example, parents, spouse). Some participants also mentioned aging and its relation to declining health as a motivator to eat healthier.
Sugar. Diabetes runs big in my family so I’ve changed my eating habits with that, high cholesterol and heart disease run in my family, too. (Chicago, IL)
I made a decision 5 or 6 years ago about just getting healthy. I was quite a bit overweight. But I set a goal and I’ve lost 70 pounds and I kept it off. The main reason behind that is I had a birthday last week, I turned 51 and I lived longer than my father did. Heart problems, high cholesterol, and high blood pressure, all that runs in my family. So I made a decision a few years back that if I was going to see 51, I was going to have to change some things. And I did. I feel better for it. Like I said, it’s a conscious decision you got to make as you get older. Because when I was younger, I could care less. I didn’t care if it was a light beer. But now, if I’m gonna have a beer I’m gonna have a light beer. Like I said, it’s age. You just start thinking, ‘do I want to see my kids
ODPHP Dietary Guidelines for Americans Final Report—June 18, 2010 10
married? Do I want to see grandkids or do I want to just act like there’s no tomorrow and throw caution to the wind?’ As far as I know, my doctor says I’m healthy as a horse. (Little Rock, AR)
Losing weight or maintaining weight was also a factor for some of the participants’ decisions about what to eat. Some of the focus group participants reported weight loss or maintenance played a role in the choices they made about what to eat. Several participants mentioned losing weight as a motivator for eating healthier. When asked to elaborate how or what choices they made based on weight loss/maintenance, participants often referred to eating salads; limiting their fat intake; limiting their calories; baking, grilling or broiling food instead of frying it; and replacing unhealthy foods with healthy alternatives. Also mentioned were using smaller plates, eating food slowly and chewing thoroughly, and eating only until they were no longer hungry.
I’m trying to lose weight now. I’ve gained a lot of weight in the past eight months. I’ve been 132 pounds forever and now I weigh 164 pounds. I try to eat healthy but then I get hungry and I eat more stuff. I’ve tried to get stuff like little packs of applesauce and yogurt that I eat instead of eating potato chips or something. (Baltimore, MD)
“The more calories you eat the more weight you gain. If you lose weight you’ll be healthier. Your blood pressure will go down, cholesterol, all of that. (Chicago, IL)
A few participants had lost large amounts of weight (30 lbs or more) by changing their food choices and almost all had kept the weight off.
My thing is, what works for me? Like I said, I can remember when I was 350 pounds. I just lessened everything that I eat. I have learned that it’s good to have a vegetable with your meals. This is what’s taught. A full course has your vegetable, a starch, a meat. (Baltimore, MD)
[My wife and I] limited ourselves to 30 grams of fat per day and I dropped 35 pounds over a 12 week period. I did it because of high blood pressure. I was packing the pounds on. (Little Rock, AR)
I have lost a lot of weight. I lost like 40 pounds and I’ve almost gained all of that back already. So it’s just for me to eat healthy and to be healthy, so that I won’t have any diabetes, high blood pressure, or stuff like that. Right now, my health is pretty good. I have a good healthy system, so that’s important to me, but then right now to eat healthy is a way for me to lose weight. (Chicago, IL)
The primary barriers mentioned by participants to choosing healthier foods were high cost, lack of convenience in preparing or accessing healthier food, and lack of time. The most commonly mentioned barriers to choosing healthier foods were the high cost of food and not having enough time to prepare a healthy meal. Other barriers included the lack of taste of some healthier foods, seasonal availability (for fruits and vegetables), and the negative opinions regarding healthy foods of other household members, such as children, spouses, or parents.

ODPHP Dietary Guidelines for Americans Final Report—June 18, 2010 11
Time. It takes longer. We’re in a society that both men and women are working and even though men are helping more in the household than they used to, it takes more time and it’s more expensive. (Little Rock, AR)
Cost. It appears to me that food that is good for you is expensive. And the crap is cheap. One thing, for instance, like virgin olive oil, they say that’s good for you but that’s expensive. You can get a lot of stuff cheap. (Baltimore, MD)
Choosing healthier foods is made easier by planning ahead, having to lose weight, and making healthy food taste good. When asked what would make it easier for them to choose healthier foods, several participants mentioned planning their meals ahead of time. Most often they referred to both lunch (taking lunch to work) and dinner. A few participants also noted that having to lose weight made them choose healthier foods. Several other participants also said it was easier to eat healthier foods if they tasted good and had some flavor. One way they often added flavor to healthy foods was by using spices. A few participants mentioned that they simply did not buy junk food (for example, cookies, ice cream, or chips), and that made it easier to avoid eating it once they were home. One participant noted that she was also influenced by her husband, who had lost 65 pounds and was also diabetic. Because she prepared most of the food, she limited fat and sugar intake for both of them.
Planning ahead. For lunch, if I’m smart I get a Lean Cuisine. I like those. If not, I go to McDonald’s and get a cheeseburger, salad, and a parfait with water. But if I would take the time to plan ahead I would be better off for it. (Little Rock, AR)
I don’t buy sweets; I don’t even go down the aisles. No cookies, no chips. I had said I liked sandwiches. I always try to keep fish in the freezer; I always get fresh bananas, vegetables, fruits. I try hard. But it’s only me and I don’t feel like cooking all the time. So I keep it simple. (Baltimore, MD)
Most participants turned to family members for support in eating healthier foods. Spouses were the primary source of support for participants to eat healthier. Several participants also mentioned doctors or dietitians as sources of support. A few participants mentioned other family members, such as a sibling, mother, or their children.
My wife. She’s the one that encourages me. She’s a healthy eater anyway and she cooks, so that’s what influences me. (Little Rock, AR)
If I asked anybody it would probably be my doctor. (Baltimore, MD)
My brother helps me to eat healthy because this is what he eats, and he encourages me to eat like that. (Baltimore, MD)
Most participants identified a link between the items on the “Food List” and items on the “Things About Food List.” Participants across all focus groups were able to give examples of each of the different items on the Food List, which were the food groups (fruits, milk group, vegetables, whole grains, and lean meats group). They saw the Food List as healthy, although there was some confusion as to whether alcoholic beverages (specifically beer, brandy, and wine) were healthy.

ODPHP Dietary Guidelines for Americans Final Report—June 18, 2010 12
When asked for examples for each of the food groups, the most common answers included the following:
• Fruits: strawberries, apples, bananas, cherries, raspberries, blueberries, oranges, peaches, and grapes
• Milk group: cheese, milk, ice cream, yogurt, cottage cheese, and sour cream
• Vegetables: cabbage, green beans, broccoli, beets, spinach, avocado, corn, squash, peas, string beans, Brussels sprouts, and asparagus
• Whole grains: oats, granola, rye bread, whole wheat bread, Cheerios with whole grains, Wheaties, and pasta
• Alcoholic beverages: beer, red wine, and brandy
• Lean meats group (meats, poultry, fish, beans, eggs, and nuts): chicken, lean ground beef, ground turkey, pot roast with the fat cut off, pork, fish, eggs, egg whites, egg beaters, seafood, tuna fish packed in water, nuts (almonds, walnuts), and beans
Some participants noted the items in the second list, Things about Food, were found in the first list (for example, calcium was found in the milk group; protein in the lean meats group). Generally, most participants had a high level of knowledge on topics pertaining to both lists. Participants also mentioned that the items in the Things about Food list should be limited except for calcium-rich foods and fiber. Participants mentioned that they were aware calcium was added to a wide variety of foods, including orange juice; however, in one group there was clear confusion about the role of calcium in the diet and in the food supply. Some participants also pointed out that they did not understand why the lean meat group also included nuts.
Many participants were confused about “good” and “bad” fats. Some participants recognized the terms saturated, unsaturated, and trans fats but did not know what types of food contained each type of fat. When they were asked to explain the different types of fat or to give examples of what foods contained each of these fats, participants were not able to do so. One participant thought saturated fat meant that the food itself was saturated with fat.
It has a lot of fat, meaning it’s saturated. Meaning excessive amounts of fat. They go out of their way to saturate said product in fat. (Chicago, IL)
They have two different names; some fats are bad for you. The saturated I think is the bad and the unsaturated is the good [fat]. (Chicago, IL)
However, across all the focus groups, at least some of the participants mentioned olive oil and nuts as examples of sources of a “good” fat. They also were able to say that trans fat was a “bad” fat.
Several participants stated they were thinking about or were currently making changes about items on the lists. The most common changes mentioned by participants were reducing sodium, eating more fruits and vegetables, reducing sugar, reducing fat, and eating more fiber. A few participants mentioned limiting alcohol to reduce calories, especially if they were concerned about weight.

ODPHP Dietary Guidelines for Americans Final Report—June 18, 2010 13
More fiber. Fiber fills you up more so you won’t eat as much. (Little Rock, AR)
When I’m trying to lose weight, so I lay off the alcohol yes that is something I think about. Because I like to have it but I’m trying to lose weight and it’s not really a good idea, there’s so much calories and sugar. (Baltimore, MD)
Some participants wanted more information about items on the “Things about Food List.” Fats, fiber, and calcium were the most common items participants said they would like more information about. When referring to fiber and calcium, participants wanted to know about the types of food that contain fiber and calcium. Concerning fats, they wanted to know the difference between the different types of fat and the types of food that contain each type of fat.
For me, I want to know more about fats and sugars. Sometimes I’ll look for fat-free products and someone recently told me that fat-free isn’t always good because they have to substitute it with something and most of the time it’s sugar. So I really would like to know more about fats and sugars. (Baltimore, MD)
I would like to know more about calcium. You said it is in broccoli. I didn’t know that, I just thought it was in milk. (Chicago, IL)
Visualizing Food Portions Focus group participants were asked to react to several images, including a video clip selected by AIR and ODPHP. They were asked whether the images were clear, understandable, actionable, and useful to them as they made healthy food choices. Specifically, participants were asked what the image meant to them, whether it helped them understand how much of the food depicted in the image they should eat, and whether they found it confusing.
Participants were shown the following images:
1. Carrots 2. Bowl of green beans, 3. Measuring cups of berries/ teaspoon of olive oil 4. Plate with fish dinner 5. Poster of food/object comparisons or two food/object comparisons (from poster) 6. Video on food portions
Based on participants’ reactions to the images, three images were not tested with the second focus group in Baltimore: the small carrots, teaspoon of olive oil, and the poster, How Much Do You Eat? (in which portions are compared with household items). As a result of participants’ reactions in the second focus group in Baltimore, Maryland, the rest of the groups were presented with the bowl of green beans, the cups of berries, and the plate with the fish dinner, but instead of the poster, an image of an apple and a baseball coupled with an image of a deck of cards and a piece of chicken were added. These last sets of coupled images were taken from the poster of food/object comparisons presented in the first group in Baltimore.

ODPHP Dietary Guidelines for Americans Final Report—June 18, 2010 14
Reactions to Images This image was tested only with the first focus group. That this was an image of carrots was unclear to a few participants when they first saw it. Some spontaneously commented that it looked like cheese, and one participant said it “looks like cheese puffs.”
When asked if the image helped them to know how much to eat of this item, one participant mentioned “you can count the carrots.” Most other participants did not find the image useful and instead mentioned their own frames of reference, such as using the palm of their hand or their fist.
It was clear to focus group participants that this was an image of green beans. Interestingly, the initial reaction varied and several participants questioned whether it was a picture of a portion size or a serving size. Some participants spontaneously commented that it “looks like the right amount,” and “it looks like an average serving” while others noted “that would be a ‘child serving’ to me,” and “that doesn’t look like a serving to me.”
When asked if the image helped them know how much of the green beans to eat, most participants did not find this image useful.
They noted it was not easy to tell the size of the bowl. Others thought knowing the exact measurement by volume, as in cup or half cup, or by weight, for example, in ounces would be more useful.
If it was to tell you measurements like a cup, half a cup. But to tell you how big the bowl is doesn’t tell me how many green beans are in there. (Baltimore, MD)
One participant also mentioned counting the green beans, “you’re saying 6 inches is about 20 little green beans, is that what you’re trying to say?” Some participants thought that because green beans are a vegetable and healthy, the amount one can eat should not be limited, and one more serving should be fine.
From these images, it was clear to participants that the items in the picture were either blackberries and blueberries or olive oil. Most participants selected either one of these images (the teaspoon of olive oil was shown only in the first of six focus groups) as the one image that helped them the most in determining how much of the berries or olive oil to eat.
Carrots
Bowl of green beans
Cup of berries Teaspoon of olive oil

ODPHP Dietary Guidelines for Americans Final Report—June 18, 2010 15
Participants often referred to the labeled measurement on the cups and teaspoon, “it gives you the exact measurement [of the berries].” Of interest is that a few participants commented that the cups were “overflowing” and that when measuring, the cups should be level.
The teaspoon of olive oil was not tested beyond the first focus group because of time constraints and because the cup of berries image used a measuring cup; thus a similar concept was still tested.
It was clear to participants that this image included a variety of foods. Most participants did not think the image helped them know how much to eat of the foods shown. These participants often said the image was not helpful because they did not know the size of the plate. Some participants, however, said the image helped them know how much to eat of the food. A few of these participants who found it helpful said that they could tell the size of the plate by either the fork or the green beans: “The fork’s bigger than the plate.”
Overall, participants noted the plate was not “overfull,” nor was the food “piled up.” Other spontaneous comments were positive about the types of foods portrayed and referred to the image as “dinner,” “a proper meal,” and “that’s a well-balanced meal.” Some participants also mentioned the plate included a protein or a lean meat and vegetables.
This image was tested only with the first focus group. A few participants understood the poster demonstrated portion sizes with a reference to everyday items. However, most participants did not find it useful, and a few participants actually found it confusing. For example, it was unclear to a couple of participants whether the image of the deck of cards and the 10 French fries meant one could eat 52 fries because there are 52 cards in a deck. Another participant thought it was not useful to her because she was used to thinking of food measurement in tablespoons, cups, etc., and not by its size relative to everyday items.
I’m just saying food versus things; why not just eat the thing? You got mousse, cards, against food. I don’t get the cards, it doesn’t equal food to me. (Baltimore, MD)
Participants seemed confused because they did not see how a lot of the reference items in the poster related to food, for example, the computer mouse or a CD. Of the images in the poster, a participant mentioned she understood two images the most: the apple and the baseball and the deck of cards and the piece of chicken.
Plate with fish and other food
Poster: How Much Do You Eat?

ODPHP Dietary Guidelines for Americans Final Report—June 18, 2010 16
Instead of using the whole poster, only these two images were tested in Chicago and Little Rock. Both images were presented together. Participants generally responded positively to the images and considered them useful in helping them know how much to eat of the food in the image.
That’s more my style because it’s giving me visual images that I can compare to. (Little Rock, AR)
A few participants noted that they had learned to use their fist or the size of their palm as a reference point for a serving, and some noted that they would use that reference instead of the deck of cards or baseball. Again, a few participants said they wouldn’t limit themselves to eating a small apple since it was healthy.
Well an apple no matter what size is good for you. But the fish, meat, and poultry one, that’s really helpful. Everybody knows or has a deck of cards. (Little Rock, AR)
Several participants also had questions as to whether the images showed a portion size or a serving size. A couple of participants said the deck of cards and chicken image were not useful because the servings were too small and they typically ate more than that.
I would not use this as a rule of thumb because it is too small. It’s not enough chicken. (Chicago, IL)
Participants differed by location in their preferences of tools or images to visualize portions, but the measuring cups with berries were the most popular. Once all images (except the video and the nutrition label) were presented, participants were asked to select one image that they thought made it easiest to understand how much of a certain food they should eat. Across all groups, the photograph of the measuring cups with berries was selected most often (by half of participants (see Table 5)). The plate of fish with other food was selected by one fourth of participants. The preferred choice was quite different by location. The cup of berries image was the one preferred in Baltimore and Chicago. The photographs of the plate with fish and other foods and the chicken with the deck of cards were preferred in Little Rock. Appendix D provides more detailed information.
Apple and baseball from the poster
How Much Do You Eat?)
Deck of cards and a piece of chicken (from the poster How Much Do You Eat?)

ODPHP Dietary Guidelines for Americans Final Report—June 18, 2010 17
Table 5. Preferred images to visualize food portions (all sites)
IMAGE CONTEMPLATION
(n=27) PREPARATION
(n=22)
ALL (n=49)*
Measuring Cups of Berries/Teaspoon Olive Oil 14 11 25 Plate with Fish and Other Food 6 6 12 Two Food/Object comparisons*** 5 1 6 Poster of Food/Object comparisons ** 0 0 0 Video 0 1 1 Carrots** 0 0 0 Bowl of Green Beans 0 0 0 More Than One Image Selected 2 2 4 Would Not Use Any of the Images 0 1 1 * Total is less than 53 because 4 participants did not provide information or information was filled out incorrectly. **Shown only during focus groups in Baltimore, MD (Teaspoon olive oil, carrots, poster of food/object
comparisons). *** Not shown during focus groups in Baltimore, MD (two food/object comparisons).
Reactions to Video Focus group participants were shown a video clip6
The food portion video was well received by participants but was not considered effective in retaining the information provided. Participants generally liked the way the information was presented in the video, but many stated that they would not be able to remember all the objects used as references.
lasting approximately 25 seconds. The video showed a registered dietitian demonstrating the portion sizes of various foods using everyday items as reference. After the video clip was presented, participants were asked to share their opinion of the video and whether it helped them better understand how much they should eat of a certain food compared with the print images presented earlier.
If I could [get] a little pocket guide to take with me to restaurants, then that’s more understandable than pulling the video every five seconds to go ‘how much was that again?’ (Little Rock, AR)
Some participants asked whether they were supposed to carry around the reference items (deck of cards, dice, etc.,) in order to determine portion sizes, since they thought it would be difficult to remember all the examples provided. They also found it difficult to remember the size of all the items presented.
6 Registered dietitian Alyse Levine shows portion sizes using everyday items as references in a Discovery Health video titled National Body Challenge: Portion Control on the Discovery Health. Used with permission. Available at http://health.discovery.com/videos/national-body-challenge-2008-portion-control.html
Video

ODPHP Dietary Guidelines for Americans Final Report—June 18, 2010 18
Can I ask you how many people are going to go around with some dice or a deck of cards or a tennis ball in their pockets just to measure? (Chicago, IL)
Other participants also questioned the video’s use of the fist or thumb to estimate a portion size because the size of a fist or thumb varies from person to person.
Participants in Little Rock were asked whether they preferred to hear from health professionals like doctors or dietitians, from people like them, or from others such as chefs or famous personalities. Generally, participants preferred hearing from other people like them and from doctors as long as they did not get too “clinical.” This question was asked only in the last two focus groups in Little Rock as it was a revision made after the other four focus groups were conducted.
Recognition and Knowledge Regarding Nutrition Labels
Participants were presented with a nutrition label of an unspecified food. They were then asked whether they had seen a label similar to that before along with specific questions to see whether they were able to read it correctly, such as the serving size and the amount of servings per container. Participants were also asked whether and how they used the label to make decisions about food.
Nutrition Label
Many participants recognized the nutrition label image, but not all used it to make food decisions. Those who did report using the label varied on the items they considered the most important. Many participants had seen a nutrition label before, and several could identify the serving size and the number of servings on the label. Overall, several participants reported sometimes using the label when they made food choices, and a few said they never used it.
Well, I’m diabetic, so I look at it for health things before I purchase something. (Chicago, IL)
I probably look at the calories, sodium, and protein, but to be honest with you that’s not what I look at when I go shopping. I look at what I like within reason. If I want more protein intake, then I’ll look for that sort of thing. But other than that I don’t really understand it that well to base it on what I eat or buy. For example, the saturated fat, total fat, and dietary fiber make it harder to know. (Chicago, IL)
Some of the most common items participants mentioned looking at on a nutrition label were calories, sodium, sugars, fats, and serving size. In reference to the label presented, one participant commented:
Whatever it is, it’s got way too much fat. 12 grams, that’s a lot. That’s the first thing I would look at. (Little Rock, AR)

ODPHP Dietary Guidelines for Americans Final Report—June 18, 2010 19
Actionable Goals and Messages Preparers and Contemplators differed in the type of actionable goals they provided. Participants were asked to list three things they would like to do in the next month to eat healthier. Participant responses were then categorized by function based on an analysis of the responses.7
• Food selection—choosing or buying certain types of food (for example, eating more fruits).
The main functions regarding healthy eating that were derived from the goals were related to:
• Nutritional content—selecting foods that had more or less amounts of certain nutrients and ingredients based on their prior knowledge or by looking at the nutrition label (for example, foods with less sodium).
• Portion size—limiting the portion size, although this did not necessarily mean measuring a specific portion. For example, it could be using tools such as smaller plates or just reducing their consumption of a certain food or beverage (for example, drinking fewer sodas).
• Food preparation—modifying, for the most part, their cooking methods or substituting meals prepared at home for fast food (for example, substituting frying by another method, preparing a salad and taking it to work rather than buying something on the spot).
• Planning meals—using several methods to plan meals (for example, grocery lists) and much less frequently, recording.
• Scheduling—defining specific times for eating or not eating (for example, not snacking after a certain time in the evening).
As seen in Table 6, goals related to food selection and nutritional content were the most prevalent (73%) in both the Contemplation and Preparation groups. Clear distinctions are seen between the groups in the goals related to cooking/preparation methods, planning or recording, and nutritional content.
Table 6. Personal goals of focus group participants (all sites)
CATEGORY CONTEMPLATION
(n=28) PREPARATION
(n=25) NUMBER OF RESPONSES
Food Selection 30 31 61 Nutritional Content 27 13 40 Portion Size/Amount 8 6 14 Cooking/Preparation Methods 9 3 12 Planning or Recording 0 6 6 Scheduling 3 2 5 Other 1 0 1
7 Although some of the functions overlap, responses were classified into the one that appeared to be the most influential. For example, frying foods could be classified into food preparation or food selection (consuming less fat), but the first one is the more dominant function.

ODPHP Dietary Guidelines for Americans Final Report—June 18, 2010 20
While the reasoning for these differences is unclear from the focus group discussions, it is interesting to note the following:
• Participants in the Contemplation group had three times the number of responses relating to cooking/preparation methods as those in the Preparation group.
• Participants in the Contemplation group stated goals relating to nutritional content twice as often as participants in the Preparation group.
• All of the responses relating to planning or recording were mentioned by participants in the Preparation group.
Several themes were identified regarding goals. Grouping the participant goals into distinct categories, we found three common themes across participants’ goals:
• Eating more healthy foods or foods with certain nutrients
• Avoiding unhealthy foods or foods with certain ingredients
• Making other behavioral changes
• Participants who mentioned eating more healthy foods/nutrients specifically noted eating more fruits and/or vegetables as a goal most often.
• Participants who mentioned avoiding unhealthy foods/ingredients specifically noted eating less fat as a goal most often.
• Participants who mentioned other behavioral changes specifically noted eating smaller portions as a goal most often.
Most participants said these were actionable goals they could implement because they had tried them before or others they knew had implemented these changes successfully. Participants also mentioned ways in which to accomplish these goals, such as making juices from fruits and vegetables to increase fruit and vegetable intake; buying fresh or frozen vegetables rather than canned ones to reduce sodium intake; drinking water before a meal to help feeling full and lose weight; and bringing lunch to work to eat healthier, save money, and control portions. Appendix E provides more detailed information on the goals stated by participants in each focus group.
Print materials and Web sites as a source of information. There were equal preferences for print materials and Web sites as a way to get information on healthy eating among participants in Chicago and Little Rock. Participants from Baltimore were not asked this question due to time constraints.
Participants who preferred print materials (for example, brochures or pamphlets) suggested placing them in restaurants, grocery stores, and doctors’ offices. Many participants indicated that they would go to the Internet for information, and the most popular site mentioned was Google. Participants mentioned that information online could be easily printed for reference and that the information should be in multiple formats. Cookbooks about healthy eating or special diets and cooking shows were also mentioned as information sources. Other suggested formats for

ODPHP Dietary Guidelines for Americans Final Report—June 18, 2010 21
information included a pocket guide, email, recipes, television advertisements, billboards, and nutritional classes.
I think people learn by different ways, so you need to show it in different forms. The picture is a visual form for me, or the doctor telling me. (Little Rock, AR)
Messages of interest to participants. When asked about the kinds of messages that would most attract their attention, several participants mentioned the scare tactic as the best way to present the information. One participant in Little Rock mentioned that people tend not to want to change until a doctor finds something medically wrong, and then it becomes a subject that they are willing to seriously consider. Another participant in Little Rock also suggested advertising information about cholesterol and high fat foods similar to the HIV/AIDS scare in the 1980s. Another suggestion was to show the effects of not eating healthy in a manner similar to the popular “This is your brain. This is your brain on drugs.” campaign to make people more conscious of healthy choices.
Maybe they should show more stuff about what the consequences are if you don’t [eat] healthy. Maybe some people out there have a weight problem. Show videos of how people live and how they suffer and I’m sure there’s a lot of people in a lot of pain from not eating healthy. Maybe show more stuff like that so people are afraid of becoming that person. They will watch more what they eat. (Little Rock, AR)
A few participants mentioned that the topic of healthy eating seems to be focused more on losing weight and dieting than being healthy.
I feel like today’s discussion was more based on dieting and not healthy eating. We’re not talking calories, we’re talking health. How is eating green beans better than eating corn? It’s more about losing weight/diet because that’s what everyone is talking about. (Chicago, IL)
There should be more focus on what vitamins are in what foods. A lot of things you see on TV or in magazines are about losing weight than telling you about the vitamins. (Chicago, IL)
Participants made several suggestions for healthy eating messages. One participant mentioned that he wanted to be given the information directly. In his own words:
We live in a generation where we want our information as fast and as quickly as possible and we want it right. Make it simple, make it right, and make it quick [emphasis added]. (Little Rock, AR)
Other recommendations include giving visuals of portion sizes, giving examples of how to incorporate healthier food into someone’s diet, putting warnings on the nutrition labels for unhealthy foods, advertising on children’s channels about how to eat healthy, and having stories that relate to everyday people.
Influencers or preferred messengers. When asked about from whom they would prefer to receive messages about healthy eating, participants had mixed responses, preferring either a
ODPHP Dietary Guidelines for Americans Final Report—June 18, 2010 22
doctor/dietitian or someone similar to themselves. Most participants from Chicago preferred a doctor or dietitian, while most participants from Little Rock preferred someone similar to themselves. (This question was not asked in Baltimore due to time constraints.) Participants who preferred the doctor/dietitian as a messenger liked hearing the facts from someone they deemed to be a reliable source.
I’d much rather have a doctor because even though he might have the scare tactics at least it’s honest and honesty from someone that’s licensed. This guy knows what he’s talking about. (Little Rock, AR)
Participants who preferred receiving the message from someone similar to themselves liked that such a person is not so clinical.
I like everyday people, a real homemaker. Doctors get too clinical sometimes. They take it too far with the scare tactics sometimes. Let’s just keep it simple. We’re not doctors. (Little Rock, AR)
Recommendations
Based on the findings from the focus groups, it appears that the preferred strategy would be to develop a set of materials that provides information about the Dietary Guidelines coupled with images to visualize portion sizes and concrete examples as well as actionable messages that suggest what people can do to meet the guidelines and overcome barriers, and that explain potential benefits from new behaviors. Below are some recommendations on the ideas and types of information that may need to be considered in the development of the consumer materials (whether print, video, Web-based, or in some other format) based on the categories of general approach, messages and goals, tools, other content, sources of information, and products.
General Approach Provide information and tools enabling people to make “healthy eating” choices in everyday situations. Participants mentioned many situations where they are faced with making decisions about food. Facilitating understanding and helping people use the information provides them with tips and tools that take them through the day from one setting to another: from the home where they may be preparing a meal, to the grocery store where they are deciding what foods to purchase, to the workplace where they may be eating “on the run,” to eating out when they want to have something special.
Consider using images or information about the health conditions and risk factors of not eating healthy. This can include consequences such as obesity, diabetes, high blood pressure, heart attack, stroke, high cholesterol, and atherosclerosis.
Messages and Goals Refer to the actionable goals most often mentioned by focus group participants. The most common goals stated by participants centered on the themes of selecting healthy foods, increasing knowledge of nutritional content of foods, and eating smaller portions. The most common goals specifically mentioned by participants—when examining the goals by changes in

ODPHP Dietary Guidelines for Americans Final Report—June 18, 2010 23
terms of eating more healthy foods or eating less unhealthy foods—were eating more fruits and vegetables and fewer fats.
Consider using specific messages suggested by participants. Participants mentioned several messages to include in the materials: using smaller plates, eating food slowly and chewing thoroughly, eating only until no longer hungry (that is, not until “full”), and including information on the effects of not eating healthy.
Tools Use measuring instruments (for example, cups) as tools for visualizing portion size. Participants most liked measuring instruments as a way to visualize portion size. Some participants stated that they preferred these images because they were familiar with them, but most often because the portion size was clearly stated in the measurement instrument (for example, 1 cup). It will also be important to examine what to recommend for estimating portion size when eating out, where using another method probably would be more convenient.
Be careful about using reference objects as a way to determine portion size. Participants disagreed about the usefulness of reference objects to estimate portion size, particularly because they were not likely to remember the reference object corresponding to each type of food and portion size. If these are used, it will also be important to explain that the objects are for reference and not necessarily meant to be carried around all the time or to have some particular relation to the food portrayed, as both of these aspects came out in the discussion. For example, the material developed may say, to get an idea of what a serving of an apple is, hold a baseball or tennis ball in your hand and notice how it fits in your hand.
Include low-cost, easy-to-prepare, healthy eating options so people can more easily adopt the dietary guidelines. This is important to address the major barriers identified in the focus groups: cost, convenience, and lack of time. For example, ODPHP may provide recipes for healthy meals and recommend lower cost lean meats (for example, chicken and tuna); sources of protein besides meat (for example, beans, lentils, eggs); cooking tools to make cooking healthier easier (for example, crock pot/slow cooker, slow roaster, grill); and various cooking methods to reduce fat or maintain nutritional value such as baking, broiling, boiling, steaming, or grilling.
Other Content Provide information on calcium, fiber, and fats, in particular. These items were most often mentioned by participants when they were asked what they wanted to know more about regarding nutritional content. For fats, it will be necessary to provide information on distinguishing good from bad fats (that is, unsaturated versus saturated, and trans fats).
Explain why persons should be aware of portion sizes of healthy foods that they should eat more of as well as foods that they should eat in limited amounts. Some participants did not understand why it is necessary to know and limit portion sizes of healthy foods such as vegetables.
Include text to explain the purpose of the images when used in print materials. This can be either text within the image or a thorough caption underneath the image. A few participants made this suggestion spontaneously as they shared their opinions of the images presented to them.

ODPHP Dietary Guidelines for Americans Final Report—June 18, 2010 24
Sources of Information Consider using “real-people” and doctors or dietitians as information sources. Doctors and dietitians could provide information on how to adopt the dietary guidelines, and “real people” may share their personal experiences in adopting the dietary guidelines or engaging in healthier eating.
Products A variety of formats will be needed. Participants were asked specifically about print and Web sites (this could be Web-based electronic materials or Web pages). Participants generally preferred one or both of these formats, but consensus was not reached. Although they were not asked specifically about video formats, they were presented with one after the print images. They reacted positively to the way the information was presented in the video (found it generally easy to understand), but several commented that it was too much information to absorb and retain. So, a video or series of videos could perhaps focus on specific messages backed with more detailed information in print form and/or on a Web site.
ODPHP Dietary Guidelines for Americans Final Report—June 18, 2010 25
Appendixes

ODPHP Dietary Guidelines for Americans Final Report—June 18, 2010 26
Appendix A. Focus Group Participant Screener

ODPHP Dietary Guidelines for Americans Final Report—June 18, 2010 27
Form Approved OMB No. 0990-0281
Exp. Date XX/XX/XX12
Participant Screener for Focus Groups on Dietary Guidelines for Americans Under OMB No. [NUMBER], [NAME OF OVERALL RESEARCH]
ODPHP Concept Testing Focus Groups on Dietary Guidelines
Summary of Focus Groups by Type and Location All participants will be between 25 and 64 years old. There will be a mix of participants with respect to age, gender and race/ethnicity within and across groups. Baltimore, Maryland Group 1 _____ [Contemplation Stage] Group 2 _____ [Preparation Stage] Chicago, Illinois Group 3 _____ [Contemplation Stage] Group 4 _____ [Preparation Stage] Little Rock, Oklahoma Group 5 ____ [Contemplation Stage] Group 6 ____ [Preparation Stage]
OMB BURDEN STATEMENT: According to the Paperwork Reduction Act of 1995, no persons are required to respond to a collection of information unless it displays a valid OMB control number. The valid OMB control number for this information collection is 0990-0281. The time required to complete this information collection is estimated to average 10 minutes per response, including the time to review instructions, search existing data resources, and gather the data needed, and complete and review the information collection. If you have comments concerning the accuracy of the time estimate(s) or suggestions for improving this form, please write to: U.S. Department of Health and Human Services, OS/OCIO/PRA, 200 Independence Ave., S.W., Suite 537-H, Washington D.C. 20201, Attention: PRA Reports Clearance Officer
ODPHP Dietary Guidelines for Americans Final Report—June 18, 2010 28
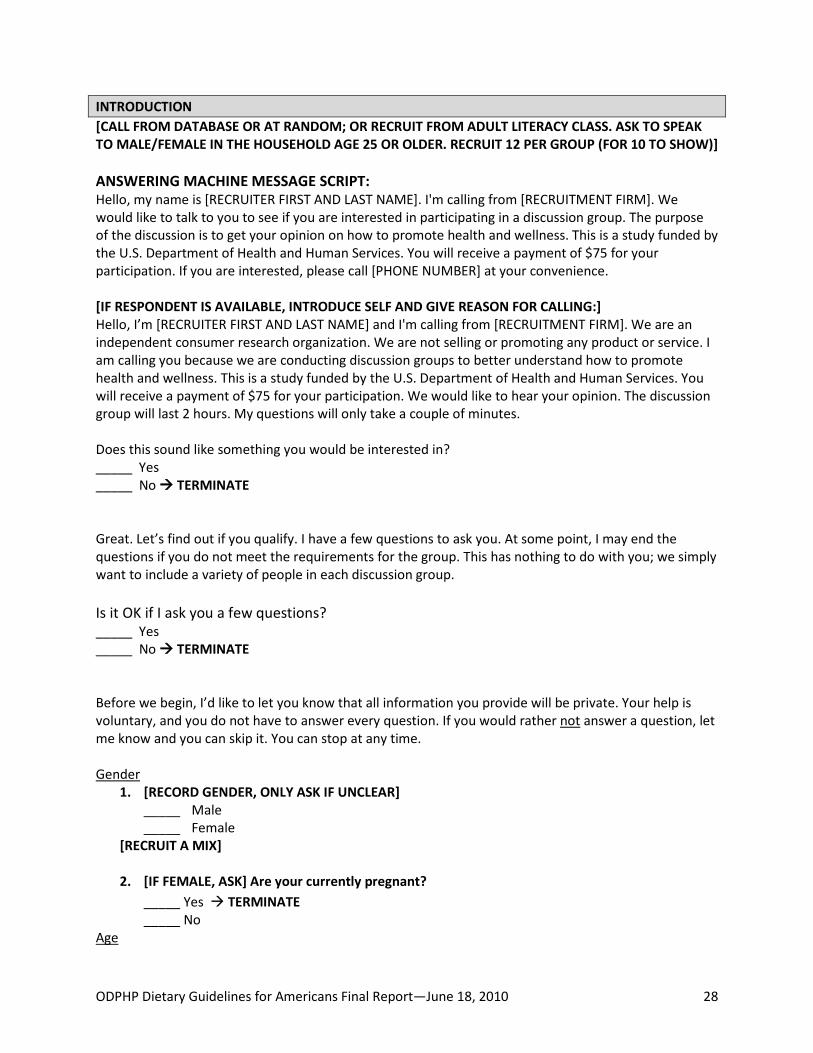
INTRODUCTION [CALL FROM DATABASE OR AT RANDOM; OR RECRUIT FROM ADULT LITERACY CLASS. ASK TO SPEAK TO MALE/FEMALE IN THE HOUSEHOLD AGE 25 OR OLDER. RECRUIT 12 PER GROUP (FOR 10 TO SHOW)] ANSWERING MACHINE MESSAGE SCRIPT: Hello, my name is [RECRUITER FIRST AND LAST NAME]. I'm calling from [RECRUITMENT FIRM]. We would like to talk to you to see if you are interested in participating in a discussion group. The purpose of the discussion is to get your opinion on how to promote health and wellness. This is a study funded by the U.S. Department of Health and Human Services. You will receive a payment of $75 for your participation. If you are interested, please call [PHONE NUMBER] at your convenience. [IF RESPONDENT IS AVAILABLE, INTRODUCE SELF AND GIVE REASON FOR CALLING:] Hello, I’m [RECRUITER FIRST AND LAST NAME] and I'm calling from [RECRUITMENT FIRM]. We are an independent consumer research organization. We are not selling or promoting any product or service. I am calling you because we are conducting discussion groups to better understand how to promote health and wellness. This is a study funded by the U.S. Department of Health and Human Services. You will receive a payment of $75 for your participation. We would like to hear your opinion. The discussion group will last 2 hours. My questions will only take a couple of minutes. Does this sound like something you would be interested in? _____ Yes _____ No TERMINATE Great. Let’s find out if you qualify. I have a few questions to ask you. At some point, I may end the questions if you do not meet the requirements for the group. This has nothing to do with you; we simply want to include a variety of people in each discussion group. Is it OK if I ask you a few questions? _____ Yes _____ No TERMINATE Before we begin, I’d like to let you know that all information you provide will be private. Your help is voluntary, and you do not have to answer every question. If you would rather not answer a question, let me know and you can skip it. You can stop at any time. Gender
1. [RECORD GENDER, ONLY ASK IF UNCLEAR] _____ Male _____ Female
[RECRUIT A MIX]
2. [IF FEMALE, ASK] Are your currently pregnant? _____ Yes TERMINATE _____ No
Age
ODPHP Dietary Guidelines for Americans Final Report—June 18, 2010 29
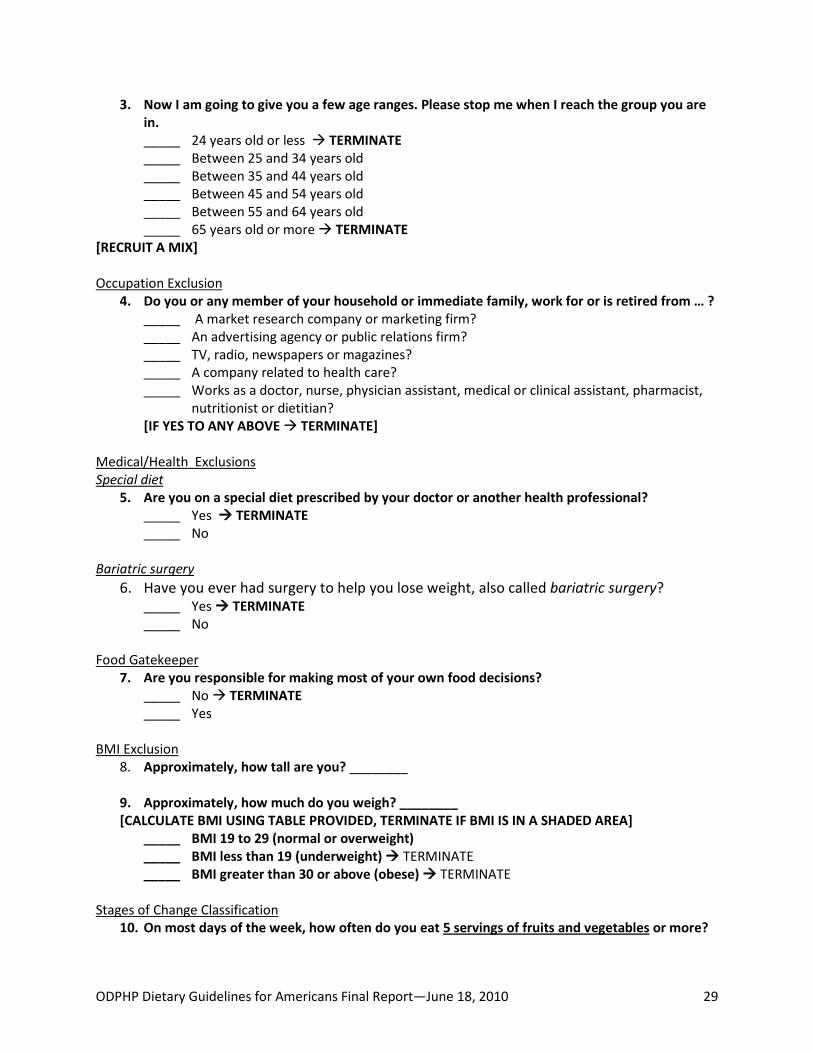
3. Now I am going to give you a few age ranges. Please stop me when I reach the group you are in. _____ 24 years old or less TERMINATE _____ Between 25 and 34 years old _____ Between 35 and 44 years old _____ Between 45 and 54 years old _____ Between 55 and 64 years old _____ 65 years old or more TERMINATE
[RECRUIT A MIX] Occupation Exclusion
4. Do you or any member of your household or immediate family, work for or is retired from … ? _____ A market research company or marketing firm? _____ An advertising agency or public relations firm? _____ TV, radio, newspapers or magazines? _____ A company related to health care? _____ Works as a doctor, nurse, physician assistant, medical or clinical assistant, pharmacist,
nutritionist or dietitian? [IF YES TO ANY ABOVE TERMINATE]
Medical/Health Exclusions Special diet
5. Are you on a special diet prescribed by your doctor or another health professional? _____ Yes TERMINATE _____ No
Bariatric surgery
6. Have you ever had surgery to help you lose weight, also called bariatric surgery? _____ Yes TERMINATE _____ No
Food Gatekeeper
7. Are you responsible for making most of your own food decisions? _____ No TERMINATE _____ Yes
BMI Exclusion
8. Approximately, how tall are you? ________
9. Approximately, how much do you weigh? ________ [CALCULATE BMI USING TABLE PROVIDED, TERMINATE IF BMI IS IN A SHADED AREA]
_____ BMI 19 to 29 (normal or overweight) _____ BMI less than 19 (underweight) TERMINATE _____ BMI greater than 30 or above (obese) TERMINATE
Stages of Change Classification 10. On most days of the week, how often do you eat 5 servings of fruits and vegetables or more?

ODPHP Dietary Guidelines for Americans Final Report—June 18, 2010 30
For example, on most days you might have 3 servings of vegetables and 2 servings of fruit, for a total of 5. OR, another example, on most days you have 2 servings of fruit and no servings of vegetables, for a total of 2. [ONLY IF PARTICIPANT ASKS WHAT A SERVING IS: For example, one serving of fruit could be a medium apple, or, half a banana. For example, one serving of vegetables could be a half cup of green beans, or, 1 cup of spinach.] _____ Never TERMINATE _____ Rarely _____ Sometimes _____ Often _____ Almost always _____ Always TERMINATE ACTION/MAINTENANCE STAGES
11. We understand some people may intend to eat more fruits and vegetables in the near future.
For some people, that may be next week or next month. Other people may need more time and they may plan to do so in the next 6 months, for example.
Do you plan to eat more fruits and vegetables within the next month? _____ Yes GO TO Q13 PREPARATION STAGE _____ No
12. Do you plan to eat more fruits and vegetables within the next 6 months?
_____ Yes CONTEMPLATION STAGE _____ No TERMINATE PRECONTEMPLATION STAGE
Nutrition expertise, information seeking, and interest Expertise
13. Generally speaking, do you consider yourself an expert in nutrition? _____ Yes TERMINATE _____ No _____ Don’t know/Refused TERMINATE
Information seeking
14. In the last three months, how many times did you seek information about healthy eating? _____ Never TERMINATE _____ Once _____ Two times or more

ODPHP Dietary Guidelines for Americans Final Report—June 18, 2010 31
Health literacy screener 15. How often do you need to have someone help you when you read instructions, pamphlets, or
other written material from your doctor or pharmacy? (SILS)8
_____ Never
_____ Rarely _____ Sometimes _____ Often _____ Always
Educational level
16. What is the highest level of education you have completed? _____ Did not attend school _____ Some years of school, but did not go to high school (1 to 8 years of school) _____ Some high school, but did not finish (= 9 to 12 years) _____ High school diploma or GED _____ Some college TERMINATE _____ College graduate or more TERMINATE _____ [NO ANSWER] TERMINATE
Race/Ethnicity
17. Are you of Hispanic or Latino origin? ____ Yes ____ No
18. So that we can be sure that all backgrounds are represented, how would you describe your
race? Are you…? [READ AND CHECK ALL THAT APPLY] _____ White
_____ Black or African-American
_____ American Indian or Alaskan Native
_____ Asian or Pacific Islander
_____ Another race or multiracial (write in) ____________________ [RECRUIT A RACIAL/ETHNIC MIX]
TERMINATION SCRIPT Thank you for answering all of my questions. We are recruiting people from different backgrounds and unfortunately, we have already recruited several individuals with similar characteristics as yours. Again, thank you for the time.
8 This item is a validated measure of health literacy from: Morris NS, MacLean CD, Chew LD, & Littenberg B. 2006. “The Single Item Literacy Screener: Evaluation of a brief instrument to identify limited reading ability.” BMC Family Practice; 7(21).

ODPHP Dietary Guidelines for Americans Final Report—June 18, 2010 32
INVITATION SCRIPT (USE IF INDIVIDUAL MEETS RECRUITING CRITERIA)
Thank you for answering all of my questions so far. 1. The group discussions will take place on [INSERT SCHEDULE]. Are you able to attend on one of these
days and times? Which ones? ____ Yes ____ No TERMINATE
2. During the group, you will be asked to read several materials and share your opinion. Would you
feel comfortable reading the materials and discussing them with others? ____ Yes ____ No TERMINATE
3. How would you rate your ability to read? Excellent Very good Good Okay Poor
Great. As I said, the group discussion will take about 2 hours of your time. The group will be both fun and informative. No one will try to sell you anything. No one will call on you as a result of your participation. You will receive a payment of $75 for your participation. This is an important project and your opinions will help the U.S. Department of Health and Human Services develop materials to promote healthy lifestyles. We hope you will be part of it. 4. Do you agree to participate in one of the discussion groups?
____ Yes ____ No TERMINATE. Thank you for speaking with me.
CONTINUATION SCRIPT (USE FOR INDIVIDUALS WHO QUALIFY AND AGREE TO PARTICIPATE)
Let me just mention a couple of more things:
1) If you use glasses for reading or watching TV, please be sure to bring them with you, since you will be asked to read several things.
2) We cannot provide babysitting services, so it will not be possible for you to bring any children with you.
3) If someone comes with you to the discussion group, they will not be able to join in the group. They will need to wait for you outside the room .
4) Only one person from the same family will be able to participate in the discussion groups. We can only invite a limited number of people to be in the groups. May we schedule you for one of the groups?

ODPHP Dietary Guidelines for Americans Final Report—June 18, 2010 33
We will call you a few days before the group to remind you of the date and time. If you will not be able to participate, please call [NAME AND NUMBER] to let us know as soon as possible, so we can ask someone else. We need to have a certain number of people for each group. NAME: _________________________________________________ ADDRESS: _________________________________________________ CITY: _________________________________________________ ZIP CODE: _________________________________________________ PHONE: (DAY) _____________________________________ (EVE) _____________________________________ (FAX) _____________________________________ (EMAIL) _____________________________________ SCHEDULED FOR: _________________________________________________ Recruiter: ____________________________________ Date: _______________

ODPHP Dietary Guidelines for Americans Final Report—June 18, 2010 34
Appendix B. Focus Group Participant Consent Form

ODPHP Dietary Guidelines for Americans Final Report—June 18, 2010 35
Dietary Guidelines Focus Group Consent Form Under OMB No. [NUMBER], [TITLE OF OVERALL RESEARCH]
[NOTE TO FOCUS GROUP FACILITY STAFF: Please read aloud to participants the “About This Project” and “Participant Consent” statements below. Then ask each participant to sign, print their name, and write today’s date on the form.]
Your Permission for the Discussion Group About This Project We have asked you to join a group of 10 people to talk about a few topics. The talk will last about 2 hours. A trained person will lead it. You will help the government develop some ideas into health promotion materials to help people make better choices about the food they eat. A few people will watch the group from behind a one-way mirror. We will also video-record and audio-record this discussion. Observers will write down what is said and view and listen to the recordings. We do this to help us write a report. We will not let anyone outside this project read, view or listen to anything that was recorded or written down. All that you say will be kept private. We will not put your name in the report or on the recordings. The recordings will be kept in a password-protected computer file. The recordings will be deleted by October 31, 2011. There will be no risk to you. You do not have to answer any question you don’t want to answer. You may stop participating in the discussion at any time. This project is sponsored by the US Department of Health and Human Services. The American Institutes for Research is helping with these discussion groups and the project. If you have any questions about this project, please call Margarita Hurtado at (301) 592-2215. If you have questions or concerns about your rights as a participant or think you have been harmed, please contact the Chair of AIR’s Institutional Review Board (which is responsible for the protection of study participants) by email at [email protected], by phone toll-free at 1-800-634-0797, or by mail at: AIR, 1000 Thomas Jefferson Street, NW, Washington, DC 20007. I can write down both of these phone numbers for you so you can call if you have any questions. Thank you for your time. Participant Consent By signing below I show that I heard the About this Project statement and know my rights as a participant. I agree to join today’s group. I know that in the group we will talk about some ideas about how to make healthy choices about food. I agree to be video-taped, audio-taped and observed. I know that only the people working on this project will be able to view or listen to the

ODPHP Dietary Guidelines for Americans Final Report—June 18, 2010 36
tapes. I understand that neither my name nor identity will be used in any report or other products that may come out of this project. If you decide to sign this form, it means that you agree to be part of the study and to participate in this discussion group. If you do not understand any part of what I have said, be sure to ask me. Do not sign until you have answers to your questions. If you choose to take part in this study, please sign, print your name, and write today’s date below: Sign Here: ____________________________________________ Print Name:___________________________________________ Today’s Date: _______________

ODPHP Dietary Guidelines for Americans Final Report—June 18, 2010 37
Appendix C. Focus Group Moderator Guide

ODPHP Dietary Guidelines for Americans Final Report—June 18, 2010 38
Form Approved OMB No. 0990-0281
Exp. Date XX/XX/XX12
ODPHP/AIR Focus Groups on Dietary Guidelines for Americans
Moderator’s Guide
INSTRUCTIONS TO MODERATOR MODERATOR: This is a GUIDE only. It is not a script from which you will read questions verbatim. You should adapt the order of the questions to best suit the dynamics of the group and comments from participants.
Objectives: To explore beliefs, attitudes and behaviors related to healthy eating among adults with low health literacy and assess ways to better communicate healthy eating guidelines to this audience.
Materials: 2 Flipcharts, markers in several colors, small clock, 2 laptops with Internet connection, projector, screen, test messages, visuals related to food portions; name tents; handouts; consent forms and receipt forms. The facility may have some of these, check ahead of time. Organization:
I. Introduction and Ice-Breaker 15 minutes II. Making Food Decisions 20 minutes III. Understanding Barriers, Motivators and Behaviors 25 minutes IV. Understanding and Use of Foods 15 minutes V. Visualizing Food Portions 20 minutes VI. Actionable Goals and Messages 20 minutes VII. Closing 5 minutes
Total time: 120 minutes
OMB BURDEN STATEMENT: According to the Paperwork Reduction Act of 1995, no persons are required to respond to a collection of information unless it displays a valid OMB control number. The valid OMB control number for this information collection is 0990-0281. The time required to complete this information collection is estimated to average 120 minutes per response, including the time to review instructions, search existing data resources, gather the data needed, and complete and review the information collection. If you have comments concerning the accuracy of the time estimate(s) or suggestions for improving this form, please write to: U.S. Department of Health and Human Services, OS/OCIO/PRA, 200 Independence Ave., S.W., Suite 537-H, Washington D.C. 20201, Attention: PRA Reports Clearance Officer

ODPHP Dietary Guidelines for Americans Final Report—June 18, 2010 39
FOCUS GROUP GUIDE
I. INTRODUCTION AND ICE-BREAKER (15 MIN.)
Hi, my name is _______ and I work for the American Institutes for Research (AIR). Thanks for coming. AIR is helping the United States Department of Health and Human Services to hold these discussions here and in other cities. They want to learn about your thoughts and experiences related to eating for better health. The Department of Health and Human Services is developing some materials to let Americans know about new recommendations for healthy eating that will be announced later in the year. What they decide to do will be partly based on these discussions, so your contributions are VERY IMPORTANT. Before we begin, I’d like to explain a few things about how the discussion group will work. [LOGISTICS] • Restrooms • Refreshments • Turn off cell phones & pagers [PROCEDURES] First, I am going to ask you several questions about different topics on which I will ask you to share your thoughts and experiences. We will also share with you several pictures or diagrams related to healthy eating and ask you about them. Finally, we will review several ways to tell people about the guidelines and ask for your opinion. Before we finish the group, I will ask you to fill out a short form with some questions. You may have noticed that there is a microphone and a video camera. We will be recording the discussion group. Behind me is a one-way mirror. Some of the people working on this project are in the next room. This allows them to hear your opinions directly from you. Some of them may be taking notes. I will use the notes and the recordings to help me with a report that I have to write about these discussions. However, we will not include your name, address or phone numbers in any of the notes or the report. Also, we will not give this information to anyone. Everything that you say here will be kept private. So, feel free to say what you really think and feel. Please speak one at a time so that we can all hear each other clearly. Speak at least as loudly as I am speaking now so the recording comes out clear. The recording is only for the use of the people working on this study. We will destroy all the notes and recordings by October 2011. I am not an employee of the Department of Health and Human Services. So, I am not going to feel bad if you tell me that you do not like something. There is nothing you can say that will offend me. It helps me to do a good job if you tell me what you honestly think, so I know what kind of information is most useful and what ideas work or don’t work. You do not have to answer every question I ask. But, I would like to hear from everyone at different points in the discussion. There are not right or wrong answers. All of your comments—whether positive

ODPHP Dietary Guidelines for Americans Final Report—June 18, 2010 40
or negative—are welcome. Negative comments or those that tell us about what is missing or what is wrong are sometimes more useful than positive comments. The discussion group will last about two hours. Sometimes, I will let the group know that we need to move on to another topic. There are a lot of things I need to get your input on and I want to make sure that there is enough time to discuss them all. Do you have any questions? [ICE-BREAKER] Let’s start by introducing ourselves. Here we will use only first names. So, let’s go around the table. Tell us:
• Your first name • What is your favorite food?
II. Making Food Decisions (20 min.) Let’s get started and talk about how we make decisions about food. 1) How do you decide what to eat and what not to eat? What makes you eat one thing and not
another? (It might help you to think about how you decided what to eat this week or yesterday or at breakfast, lunch, or dinner)
a. Do you usually decide what to eat ahead of time or do you pretty much decide on the spot?
b. Do you sometimes plan your meals and other times decide bite by bite? Why do you think that is? What are some of the things that sometimes allow you to plan and others not?
c. Are there other people who influence what you plan to eat or what you decide to eat at a certain time?
d. Do you decide what to eat based mostly on your own needs, or, are there other people that you also need to think about? Who?
2) If or when you plan out your meals ahead of time, how do you actually go about it? What do you do
to plan them? [Do you usually plan what you are going to eat for a whole week, for the next day, or from meal to meal?]
ODPHP Dietary Guidelines for Americans Final Report—June 18, 2010 41
III. Understanding Barriers, Motivators and Behaviors (25min.) OK, let’s talk more about food and some of the other reasons why you choose certain foods and not others. NOTE: Do not spend too much time on “understanding,” spend more on “strategies.” Spend more time on Q5, Q6 (especially for those in the preparation stage). Spend more time on Q7 and Q8 (especially for those in the contemplation stage).
3) What do you think of when I say “healthy eating”? What does “healthy eating” or “eating healthy” mean to you?
4) When did you first hear about “healthy eating”? How did you hear about it?
5) How does “healthy eating” or thinking about health affect what you, personally, decide to eat?
6) What kind of things are you doing now to help you eat healthier and make better food choices? [PROBE FOR SPECIFIC ACTIONS RELATED TO:]
a. Shopping for food b. Preparing foods c. Eating out
7) What gets in the way when you try to choose healthier foods?
8) What makes it easier for you to choose healthier foods?
9) Who can you turn to for support to help you eat healthier foods?
a. Who would you trust to help you with this (among the persons you know)? b. Who would not be helpful or would discourage you from eating healthy? c. Where else would you turn for information?
i. PROBE: Any websites? Which ones? ii. Social media?
10) How does wanting to stay at the same weight or lose weight affect what you decide to eat?
a. What are some of the ways you know if a food is more “fattening” than another? Do you think about calories? [Carbohydrates? fat? fiber?]

ODPHP Dietary Guidelines for Americans Final Report—June 18, 2010 42
IV. Understanding and Use of Foods (15 min.) Let’s move now to talk about types of foods. [HAVE LIST(S) ON FLIPCHART- SIDE by SIDE- AND READ ALOUD] FOODS:
• Fruits • Vegetables • Milk Group • Whole grains • Alcoholic beverages • Lean meats group (meats, poultry, fish, beans, eggs, and nuts)
THINGS ABOUT FOODS:
• Calcium-rich foods • Protein • Fats • Salt • Sugars • Fiber
11) Let’s look at the first list of foods. What does each of these [fruits, vegetables, milk group, whole
grains, alcoholic beverages] mean to you? NOTE: Don’t spend too much time on this question.
a. Can you give me some examples of each one [fruits, vegetables, milk groups, whole grains, alcoholic beverages]?
b. For which ones are you not sure what it means? [Probe for “Whole Grains”, “Lean Meats”]
12) Let’s look at the second list of things about foods. What does each of these [calcium-rich foods, protein, fats, salt, sugars] mean to you?
a. Can you give me some examples of foods high in [mention items on the list]?
13) In terms of fat, what do “good fats” mean to you? What about “bad fats”? a. How about non-fat foods? Examples? b. What about low-fat foods? Examples?
14) Now look at both lists. How do the things listed here relate to healthy eating or choosing healthy
foods? a. How do you put this all together? How does this fit into your meals, the way you eat?
15) Are you making changes [OR planning to make changes- CHOOSE DEPENDING ON GROUP
SEGMENT] about anything that is on the list? a. For example, are you trying to eat [planning to eat] more of some of these or eat less of
some of these? [ONLY IF NEEDED: For example, eating more fruits, reducing foods high in fat]
b. Are there any other changes you are making or [planning to make] with respect to the food you eat?

ODPHP Dietary Guidelines for Americans Final Report—June 18, 2010 43
16) Which foods or aspects about food on these 2 lists do you want to get more information about? [GO THROUGH EACH LIST SEPARATELY]
a. How would you go about finding out more information about each of these? b. How would you like to get this information to help you eat healthy? (Probe if needed:
Website, booklet, radio, TV, etc.)
V. Visualizing Amounts of Foods to Eat (20 min.)
Thanks, your comments and ideas are very helpful. One of the ways we can make healthier choices is by eating the right amount of each food. However, we can’t always measure exactly how much we served ourselves They say that a picture can be worth 1,000 words. I am going to share with you several drawings or pictures. They are supposed to help people choose the right amounts of food they should eat. We have heard that these pictures don’t always work. I would like to know whether these work for you or not. IMAGES:
1. Green beans 2. Cups of berries 3. Plate with fish
[SHOW 4 & 5 TOGETHER]
4. Image of apple and baseball (from Poster: How Much do You Eat?) 5. Image of deck of cards and chicken (from Poster: How Much do You Eat?)
[SHOW EACH VISUAL SEPARATELY ON FLIPCHART OR SCREEN, HAND OUT COPIES, AND ASK THE FOLLOWING QUESTIONS.] 17) In your own words, what does the picture mean?
18) Does the picture help you understand better how much you should eat of a certain food? How does
it do that? a. Is any part of this picture confusing?
[MOVE TO NEXT IMAGE AND FOLLOW THE SAME PROCEDURES. REMIND PARTICIPANTS TO THINK OF EACH IMAGE SEPARATELY.] [PRESENT ALL VISUALS TOGETHER AND HANDOUT PAGE WITH ALL OF THEM]

ODPHP Dietary Guidelines for Americans Final Report—June 18, 2010 44
Comparison of Visuals OK, I just handed out a piece of paper with small versions of each of the drawings we just discussed. Take a few minutes to yourself, look these over and draw a circle around the picture that is the easiest for you to understand. 19) OK, so which of these pictures helps you understand better how much food there is? That is, how
much should you eat? Why? What makes it easier to understand this? SHOW VIDEO Questions for Video 20) What do you think of the video?
21) Does it you understand better how much you should eat of a certain food? How does it do that? SHOW Poster: Nutrition Label Questions for Nutrition Label 22) How many have seen this type of label before? Where? 23) How do you use the label to make decisions about food? How do you use it? 24) Does the label tell you how much to eat? 25) How many servings there are in the container?
VI. Actionable Goals and Messages (20 min.) Thanks, your comments and ideas are very helpful. We have talked about a lot of things today- about things that make it easier for you to eat healthy and others that make it harder, about specific foods, about who are the people that you go to for support. Let’s talk more now about some ways that you, personally, can make healthier choices about the food you eat. Take a few minutes now and think about the question I am going to ask you now. After you do, go ahead and write down your answer and we will talk about these as a group.
26) Given everything that we’ve talked about today [tonight], what 3 things would you like try to do in the next month to eat healthier? In other words, what would be your 3 goals to help you eat healthier? [MODERATOR: WRITE MAIN ANSWERS DOWN ON A FLIPCHART AS PARTICIPANTS MENTION THEM IN TURN]
27) Why did you list these 3 goals and not others?

ODPHP Dietary Guidelines for Americans Final Report—June 18, 2010 45
28) How have these ways of eating healthier worked for you before or helped others you know? Are there other goals listed here that would definitely be helpful to you and you feel that you could do? [PROMPT PARTICIPANTS WITH EXAMPLES BELOW ONLY IF THEY LOOK LIKE THEY DON’T KNOW WHAT IS BEING ASKED OF THEM]
o [How about what to do when you eat out?] o [How do you cut back on salt in your diet?] o [How to eat a variety of foods and not just one type?] o [How to eat more healthy fats and avoid the less healthy fats?] o [So, how do you eat more healthy carbohydrates like whole grains?]
[NOTE: BEFORE ENDING, CHECK WITH ODPHP TO SEE IF THEY HAVE OTHER QUESTIONS!!]
VII. CLOSING (5 min.)
29) Is there anything else the people from the Department of Health and Human Services who are working on the recommendations for healthy eating should know? Any words of wisdom you want to give them?
30) What would you like to tell the government about how to help people like you eat healthier? Thank you so much for participating in this discussion and sharing your ideas. All your comments and opinions will be very helpful in designing the materials about dietary guidelines.

ODPHP Dietary Guidelines for Americans Final Report—June 18, 2010 46
Appendix D. Preferred Images of Focus Group Participants (by group and site)
Table D-1. Preferred images from participants in Baltimore, MD CONTEMPLATION GROUP (n=9)* PREPARATION GROUP (n=8) *
Image # of Responses Image # of Responses Carrots*** 0 Carrots*** 0 Bowl of Green Beans 0 Bowl of Green Beans 0 Measuring Cups of Berries/Teaspoon Olive Oil
8 Measuring Cups of Berries/Teaspoon Olive Oil
6
Plate with Fish 1 Plate with Fish 1 Poster (‘How Much do You Eat?’)***
0 Poster (‘How Much do You Eat?’)***
0
Poster Food/Object comparisons** 0 Poster Food/Object comparisons** 0 Video 0 Video 1
* Participant(s) incorrectly filled out preference sheet or did not submit preference. ** Not shown during focus groups in Baltimore, MD. *** Not shown during focus groups in Chicago, IL or Little Rock, AR.
Table D-2. Preferred images from participants in Chicago, IL CONTEMPLATION GROUP (n=9) PREPARATION GROUP (n=8)*
Image # of Responses Image # of Responses Carrots*** 0 Carrots*** 0 Bowl of Green Beans 0 Bowl of Green Beans 0 Measuring Cups of Berries/Teaspoon Olive Oil
5 Measuring Cups of Berries/Teaspoon Olive Oil
4
Plate with Fish 1 Plate with Fish 0 Poster (‘How Much do You Eat?’)***
0 Poster (‘How Much do You Eat?’)***
Poster Food/Object comparisons** 1 Poster Food/Object comparisons** 0 Video 0 Video 0 Several choices 2 Several choices 2 Would not use any Would not use any 1
* Participant(s) incorrectly filled out preference sheet or did not submit preference. ** Not shown during focus groups in Baltimore, MD. *** Not shown during focus groups in Chicago, IL or Little Rock, AR.

ODPHP Dietary Guidelines for Americans Final Report—June 18, 2010 47
Table D-3 Preferred images from participants in Little Rock, AR Contemplation Group (n=9) Preparation Group (n=7)
Image # of Responses Image # of Responses Carrots*** 0 Carrots*** 0 Bowl of Green Beans 0 Bowl of Green Beans 0 Measuring Cups of Berries/Teaspoon Olive Oil
1 Measuring Cups of Berries/Teaspoon Olive Oil
1
Plate with Fish 4 Plate with Fish 5 Poster (‘How Much do You Eat?’)*** 0 Poster (‘How Much do You
Eat?’)*** 0
Poster Food/Object comparisons** 4 Poster Food/Object comparisons** 1 Video 0 Video 0
** Not shown during focus groups in Baltimore, MD. *** Not shown during focus groups in Chicago, IL or Little Rock, AR.

ODPHP Dietary Guidelines for Americans Final Report—June 18, 2010 48
Appendix E. Actionable Goals of Focus Group Participants (by group and site)
Table E-1. Goals from participants in Baltimore, MD—Contemplation Group (n=10) GOAL # OF RESPONSES Decrease unhealthy foods/ingredients Less fats 2 Less salt 2 No fried foods 1 Increase healthy foods/nutrients Drink more water 1 More calcium 1 More fruits 2 More fruits & vegetables 2 More fiber 1 More vegetables 4 More nutritional foods 1 Behavioral changes Time to eat 1 Smaller portions 3 Learn more about proper daily intake 1 Watch calorie intake 1 Cut back 1 Read nutrition label 1
Table E-2. Goals from participants in Baltimore, MD—Preparation Group (n=10) GOAL # OF RESPONSES Decrease unhealthy foods/ingredients Less fried foods 1 Stop drinking coffee 1 Increase healthy foods/nutrients Drink more water 2 More calcium 1 More fruits 2 More liver 1 More protein 1 More salads & vegetables 1 More seafood 3 Behavioral changes Eat 3 balanced meals per day 1 No unhealthy snacks/ eat healthy snacks 1

ODPHP Dietary Guidelines for Americans Final Report—June 18, 2010 49
Table E-3. Goals from participants in Chicago—Contemplation Group (n=9) GOAL # OF RESPONSES Decrease unhealthy foods/ingredients Less beer 1 Less butter 1 Less caffeine 1 Less fats 1 Less fried foods 1 Less salt 1 No soda 2 Increase healthy foods/nutrients Drink more water 1 More fruits 2 More fruits & vegetables 1 More lean meats 1 More salads/vegetables/frozen vegetables/vegetable juice 4 Behavioral changes Learn about fats (good vs. bad) 1 Less take out foods 1 Make lunch for work 1 More home prepared foods 1 Pick healthier foods 1 Read nutrition label 1 Smaller portions 1 Steam vegetables 1 Stop eating late 1 Watch calorie intake 1

ODPHP Dietary Guidelines for Americans Final Report—June 18, 2010 50
Table E-4. Goals from participants in Chicago—Preparation Group (n=8) GOAL # OF RESPONSES Decrease unhealthy foods/ingredients Less artificial sugars & preservatives 1 Less fried foods 1 Less pasta 1 Less red meats 1 Less salt 1 Less soda 2 Less sweets 2 Increase healthy foods/nutrients Drink more green tea 1 Eat wheat bread 1 More fiber 2 More fruits 2 More fruits & vegetables 2 More salads/vegetables/greens 1 Behavioral changes Measure food & snacks 2 Read nutrition label 2 Smaller portions 2
Table E-5. Goals from participants in Little Rock—Contemplation Group (n=9) GOAL # OF RESPONSES Decrease unhealthy foods/ingredients Less fats 4 Less fried foods 2 Less salt 1 Less soda 1 Less sweets/sugar 3 Low cholesterol 1 Increase healthy foods/nutrients More chicken 1 More fiber 1 More fruits 2 More fruits & vegetables 2 More salads/vegetables 2 Behavioral changes Look at calories and fat grams 1 More home prepared foods 1 Smaller portions 3 Stop eating late 1 Substitute fruits for desserts 1
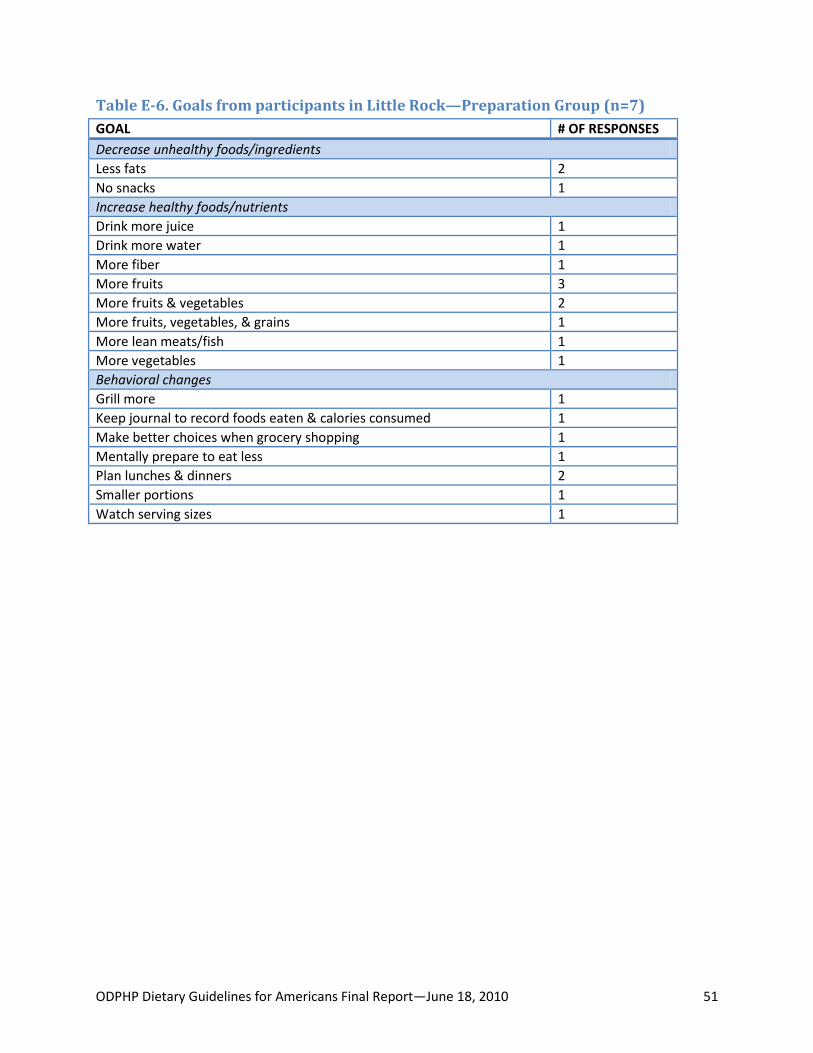
ODPHP Dietary Guidelines for Americans Final Report—June 18, 2010 51
Table E-6. Goals from participants in Little Rock—Preparation Group (n=7) GOAL # OF RESPONSES Decrease unhealthy foods/ingredients Less fats 2 No snacks 1 Increase healthy foods/nutrients Drink more juice 1 Drink more water 1 More fiber 1 More fruits 3 More fruits & vegetables 2 More fruits, vegetables, & grains 1 More lean meats/fish 1 More vegetables 1 Behavioral changes Grill more 1 Keep journal to record foods eaten & calories consumed 1 Make better choices when grocery shopping 1 Mentally prepare to eat less 1 Plan lunches & dinners 2 Smaller portions 1 Watch serving sizes 1

ODPHP Dietary Guidelines for Americans Final Report—June 18, 2010 52
Table E-7. Goals from participants in all sites (n=53) GOAL CONTEMPLATION PREPARATION TOTAL Decrease unhealthy foods/ingredients Less fats 7 2 9 No fried foods 1 0 1 Less fried foods 3 2 5 Low cholesterol 1 0 1 Less butter 1 0 1 No unhealthy snacks 0 1 1 No snacks 0 1 1 Stop drinking coffee 0 1 1 Less caffeine 1 0 1 Less salt 4 1 5 Less beer 1 0 1 No soda 2 0 2 Less soda 1 2 3 Less pasta 0 1 1 Less sweets/sugar 3 2 5 Less artificial sugars & preservatives 0 1 1 Less red meats 0 1 1 Increase healthy foods/nutrients Drink more juice 0 1 1 Drink more water 2 3 5 More fiber 2 3 5 More fruits 6 7 13 More fruits & vegetables 5 4 9 More fruits, vegetables, & grains 0 1 1 More lean meats/fish 1 1 2 More salads/vegetables/frozen vegetables/ vegetable juice 10 3 13 More seafood 0 3 3 More liver 0 1 1 More calcium 0 1 1 More protein 0 1 1 Eat wheat bread 0 1 1 Drink more green tea 0 1 1 More chicken 1 0 0 Behavioral changes Grill more 0 1 1 Keep journal to record foods eaten & calories consumed 0 1 1 Make better choices when grocery shopping 0 1 1 Mentally prepare to eat less 0 1 1 Plan lunches & dinners 0 2 2 Smaller portions/measure foods & snacks/watch serving sizes
7 6 10

ODPHP Dietary Guidelines for Americans Final Report—June 18, 2010 53
GOAL CONTEMPLATION PREPARATION TOTAL Eat 3 balanced meals per day 0 1 1 Stop eating late/time to eat 3 0 3 Pick healthier foods/more nutritional foods 2 0 2 Read nutrition label 2 2 4 Learn about fats (good fats) 1 0 1 Learn more about proper daily intake 1 0 1 Steam vegetables 1 0 1 Make lunch for work 1 0 1 Watch calorie intake 2 0 2 Less take out foods 1 0 1 Cut back 1 0 1 More home prepared foods 2 0 2 Substitute fruits for desserts 1 0 1 Look for calories and fat grams 1 0 1