American Dental Education Association DAT Count, 2000-2007 Source: American Dental Education...
13
American Dental Education Association DAT Count, 2000-2007 2000 2001 2002 2003 2004 2005 2006 2007 0 2000 4000 6000 8000 10000 12000 14000 16000 Year DAT Count Source: American Dental Education Association, U.S. Dental School Applicants and Enrollees, 2006 and 2007 Entering Classes
-
Upload
annis-muriel-willis -
Category
Documents
-
view
223 -
download
0
Transcript of American Dental Education Association DAT Count, 2000-2007 Source: American Dental Education...

American Dental Education Association
DAT Count, 2000-2007
2000 2001 2002 2003 2004 2005 2006 20070
2000
4000
6000
8000
10000
12000
14000
16000
Year
DA
T C
ou
nt
Source: American Dental Education Association, U.S. Dental School Applicants and Enrollees, 2006 and 2007 Entering Classes
American Dental Education Association
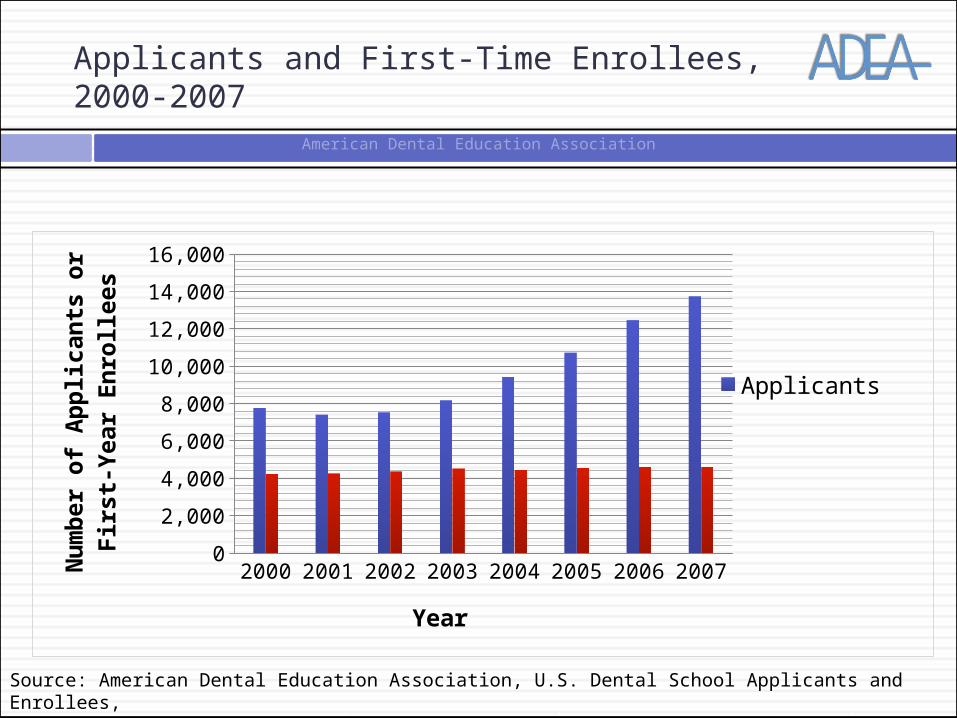
Applicants and First-Time Enrollees, 2000-2007
Source: American Dental Education Association, U.S. Dental School Applicants and Enrollees, 2006 and 2007 Entering Classes
2000 2001 2002 2003 2004 2005 2006 20070
2,000
4,000
6,000
8,000
10,000
12,000
14,000
16,000
ApplicantsFirst-Time Enrollees
Year
Nu
mb
er o
f A
pp
lica
nts
or
Fir
st-Y
ear
En
roll
ees

American Dental Education Association
Applicant/First-Year Enrollee Ratio, 2000-2007
2000 2001 2002 2003 2004 2005 2006 20070
0.5
1
1.5
2
2.5
3
3.5
Year
Rat
io
Source: American Dental Education Association, U.S. Dental School Applicants and Enrollees, 2006 and 2007 Entering Classes

American Dental Education Association
Grade Point Averages of Dental School Applicants, 2000-2007
2000 2001 2002 2003 2004 2005 2006 20072.95
3.00
3.05
3.10
3.15
3.20
3.25
3.30
3.35
3.23.18 3.19 3.2
3.25 3.24
3.283.3
3.08 3.07 3.07 3.07
3.13 3.12
3.16
3.2
GPA Total GPA Science
Year
GP
A S
co
re (
Me
an
)
Source: American Dental Education Association, U.S. Dental School Applicants and Enrollees, 2006 and 2007 Entering Classes and historic

American Dental Education Association
U.S. Dental School Applicants and First-Year Enrollment Trends 1955 - 2007
19
55
19
57
19
59
19
61
19
63
19
65
19
67
19
69
19
71
19
73
19
75
19
77
19
79
19
81
19
83
19
85
19
87
19
89
19
91
19
93
19
95
19
97
19
99
20
01
20
03
20
05
20
07
0
3,000
6,000
9,000
12,000
15,000
18,000
Applicants First-Time Enrollees
Year
Nu
mb
er
Source: American Dental Education Association, U.S. Dental School Applicants and Enrollees, 2006 and 2007 Entering Classes and historic

American Dental Education Association
Geographic Distribution of Applicants and Enrollees, 2007
New England Mid-Atlantic Southeast Midwest Southwest Northwest Pacfic West0
500
1000
1500
2000
2500
3000
3500
338
1756
3270
2359
1814
1029
2343
166
689
993846
417 397
880
Applicants Enrollees
Geographical Area
Nu
mb
er
Source: American Dental Education Association, U.S. Dental School Applicants and Enrollees, 2006 and 2007 Entering Classes

American Dental Education Association
Predental Majors of Applicants and Enrollees, 2007
Predental Major % of Applicants
% of Enrollees
Enrollment Rate
Biological/Life Science 56.4% 56.8% 35.3%
Business/Management 3.4% 3.4% 35.7%
Computer/Information Technology 0.7% 0.6% 31.6%
Education 0.4% 0.2% 20%
Engineering 1.6% 2.1% 44.4%
Health 12% 10.3% 30%
Humanities 3.4% 3.5% 36%
Mathematics 0.5% 0.6% 39.3%
Physical Sciences 10.1% 10% 34.9%
Social/Behavioral Sciences 7.8% 8.4% 37.7%
Other Technical/Professional 3.7% 4.0% 37.2%
Source: American Dental Education Association, Applicant Analysis Survey, Using NCES BPS major field coding system

American Dental Education Association
Age Distribution of Dental School Applicants and Enrollees, 2007
Less than 20
21 22 23 24 25 26 27 28 29 30 More than 30
0
4
8
12
16
20
24
2007 Applicants 2007 Enrollees
Age
Pe
rce
nt
Source: American Dental Education Association, Applicant Analysis Survey

American Dental Education Association
Age Distribution of Dental School Applicants and Enrollees, 2006
Less than 20
21 22 23 24 25 26 27 28 29 30 More than 30
0
4
8
12
16
20
24
2006 Applicants 2006 Enrollees
Age
Pe
rce
nt
Source: American Dental Education Association, Applicant Analysis Survey

American Dental Education Association
Minority Applicants to U.S. Dental Schools,1990 - 2007
Source: American Dental Education Association, U.S. Dental School Applicants and Enrollees, 2006 and 2007 Entering class.

American Dental Education Association
Percent of Applicants and Enrollees by Range of Grade Point Averages, 2007
Source: American Dental Education Association, U.S. Dental School Applicants and Enrollees, 2006 and 2007 Entering Classes
GPA Scores
< 2.50 2.50 – 2.74 2.75 – 2.99 3.0 – 3.24 3.25 – 3.49 3.5 – 3.74 3.75+
Applicants
Science GPA 7.9% 8.3% 14.7% 20.6% 19.3% 16.2% 12.9%
Total GPA 3.2% 5.5% 10.8% 22.2% 23.9% 19.9% 14.7%
Enrollees
Science GPA 1.0% 2.6% 6.6% 16.5% 23.4% 25.9% 24.0%
Total GPA 0.3% 1.2% 4.0% 13.0% 23.9% 30.1% 27.5%

American Dental Education Association
Percent of Applicants and Enrollees by Range of DAT Scores, 2007
Source: American Dental Education Association, U.S. Dental School Applicants and Enrollees, 2006 and 2007 Entering Classes
DAT Scores
< 14 14 - 16 17 - 18 19 - 20 21+
Applicants
Academic Average 2.5% 23.0% 35.5% 27.5% 15.9%
Perceptual Ability 5.6% 27.5% 31.6% 27.4% 16.4%
Total Science 4.1% 24.8% 32.7 26.7% 14.6%
Enrollees
Academic Average 0.1% 6.1% 26.4% 38.3% 29.1%
Perceptual Ability 0.3% 7.6% 25.4% 37.2% 29.6%
Total Science 1.5% 15.3% 29.7% 33.0% 20.6%

American Dental Education Association
2007 AADSAS Applicants by Gender
Source: American Dental Education Association; U.S. Dental School Applicants and Enrollees, 2006 and 2007 Entering Classes
• 13,742 AADSAS applicants
• 53% of 2007 AADSAS applicants are male; 47% are female