Reaching Out to Congregations and Faith Communities Part IV Looking Ahead and Following Up.


American Congregations
2000 – 2010
David A. Roozen
Congregations were also asked, in 2010, about
One purpose of the FACT survey series is to monitor the vital signs and health of American congregations. As is
evident in the above outline of this report, several vital signs have improved over the decade, others remained
critical, and still others worsened. The overall prognosis: American congregations enter the second decade a
bit less healthy than they were at the turn of the century.
The FACT survey series totals responses from 28,789 randomly sampled congregations. The decadal
FACT2000 and FACT2010 surveys each include over 10,000 congregations, the mid-decade FACT2005 and FACT2008
tracking surveys are more in the 1,000 range. A description of the FACT surveys and the Faith Communities
Today project is provided on the back page, with additional details at www.FaithCommunitiesToday.org.
Statistics reported for a single year are from the 2010 survey.
A Decade of Change in American Congregations
2000 – 2010 David A. Roozen
Despite bursts of innovation and pockets of vitality, the first decade of the
twenty-first century witnessed a slow, overall erosion of the strength of
America’s congregations, according to the Faith Community Today series of
national surveys of American congregations.
Conducted in 2000, 2005, 2008 and 2010, the FACT series shows that the
decade brought:
A continued increase in innovative, adaptive worship
A surprisingly rapid adoption of electronic technologies
A dramatic increase in racial/ethnic congregations, many for
immigrant groups
A general increase in the breadth of both member-oriented and
mission-oriented programs
It also gave witness to:
An increase in connection across faith traditions
A twist in the historical pattern of religious involvement in support of
the electoral process
But the decade also saw:
A steep drop in financial health
Continuing high levels of conflict
Aging memberships
The net, overall result:
Fewer persons in the pews
Decreasing spiritual vitality
-----------------------------------------------

Findings for individual denominations and faith groups for several key items are contained in the appendix.
In the body of text we only report total national findings and, where relevant, findings for Oldline Protestant
and Evangelical Protestant congregations as groups (see the appendix for the definition of these groups).
Innovative Worship
The edges and images of congregational vitality continually shifted over the last half of the twentieth
century. In the post-war 40s and 50s one thinks of the incredible burst of new church development following
Americans to the suburbs. In the mid-60s one pictures Oldline (then, Mainline) Protestant’s solidary in the
streets with the civil rights movement. In the 70s one sees Pentecostalism’s move into the middle class. In
the 80s, the rise of the “religious right.” And in the 90s, new styles of worship. On the one hand, and most
visibly, we were introduced to the jam-packed arena sized sanctuary of the seeker-friendly mega-church,
complete with concert quality music and large screen
video. On the other hand, and more numerically
dominant because of its accessibly to typical
congregations, the contemporary worship movement
swept from its West Coast origins north and east, along
with its less formal style and California praise music
backed by electric guitars and rock-style drums –
decidedly more Pentecostal than Presbyterian.
As seen in Figure 1, the surge in contemporary
worship continued in the first decade of the new
century. Indeed, the increase is dramatic, especially
for those who carry lingering memories of the church
as the “Rock of Ages.” Using our measure of “often or
always using electric guitars or drums in worship” the
Figure shows a 50% increase across the decade to the
point where over four in 10 congregations often or
always use electric guitars or drums in worship.
The figure also shows that while Evangelical
Protestant congregations were the early adaptors of
contemporary worship, it has gained a strong foothold
in Oldline Protestantism, even as the
Oldline/Evangelical worship gap widens. The FACT
surveys also show that Northeastern congregations
have been least receptive to contemporary worship,
although even in the Northeast around a third of
congregations in FACT2010 said they often or
frequently use electric guitars or drums in worship.
The West and South lead the way, with the South
edging past the West over the decade in percentage of
congregations using contemporary forms of worship.
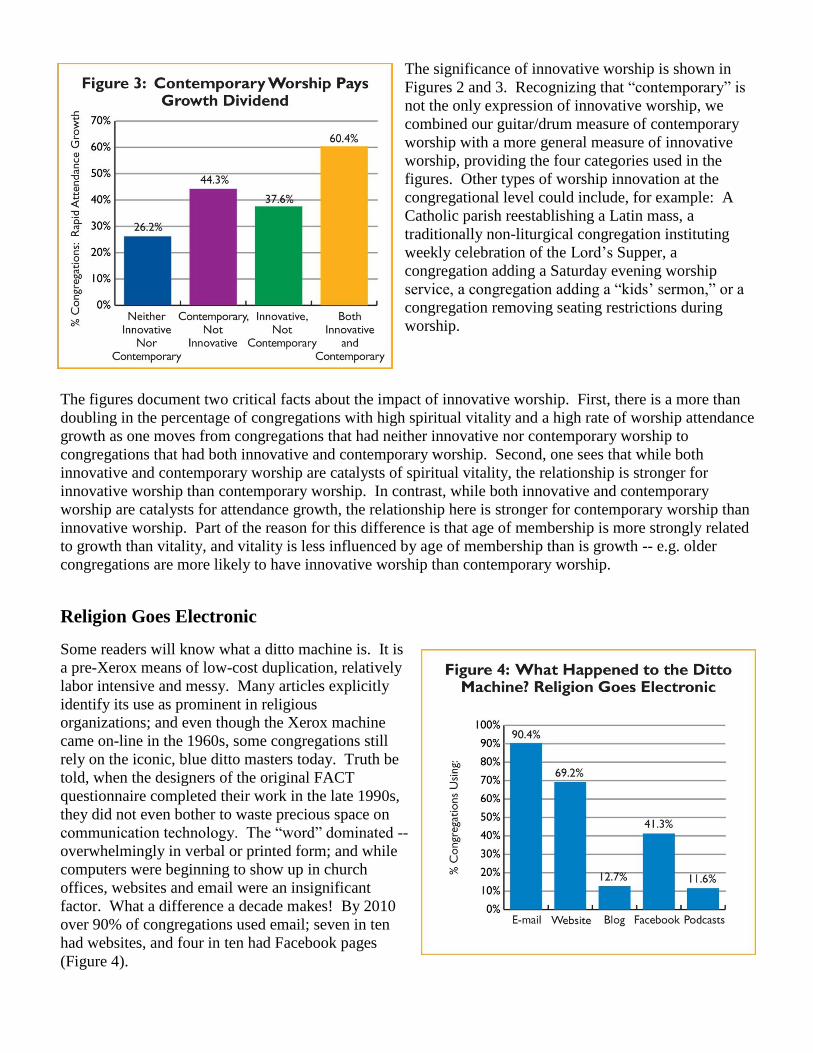
The significance of innovative worship is shown in
Figures 2 and 3. Recognizing that “contemporary” is
not the only expression of innovative worship, we
combined our guitar/drum measure of contemporary
worship with a more general measure of innovative
worship, providing the four categories used in the
figures. Other types of worship innovation at the
congregational level could include, for example: A
Catholic parish reestablishing a Latin mass, a
traditionally non-liturgical congregation instituting
weekly celebration of the Lord’s Supper, a
congregation adding a Saturday evening worship
service, a congregation adding a “kids’ sermon,” or a
congregation removing seating restrictions during
worship.
The figures document two critical facts about the impact of innovative worship. First, there is a more than
doubling in the percentage of congregations with high spiritual vitality and a high rate of worship attendance
growth as one moves from congregations that had neither innovative nor contemporary worship to
congregations that had both innovative and contemporary worship. Second, one sees that while both
innovative and contemporary worship are catalysts of spiritual vitality, the relationship is stronger for
innovative worship than contemporary worship. In contrast, while both innovative and contemporary
worship are catalysts for attendance growth, the relationship here is stronger for contemporary worship than
innovative worship. Part of the reason for this difference is that age of membership is more strongly related
to growth than vitality, and vitality is less influenced by age of membership than is growth -- e.g. older
congregations are more likely to have innovative worship than contemporary worship.
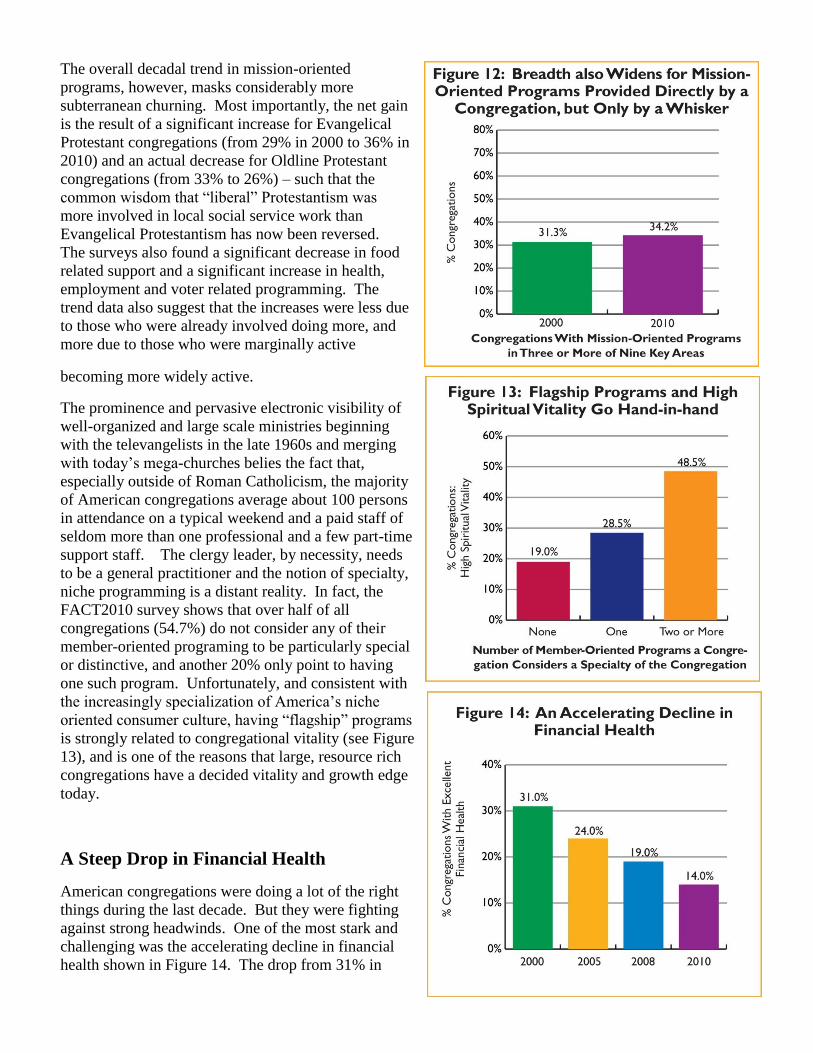
Religion Goes Electronic
Some readers will know what a ditto machine is. It is
a pre-Xerox means of low-cost duplication, relatively
labor intensive and messy. Many articles explicitly
identify its use as prominent in religious
organizations; and even though the Xerox machine
came on-line in the 1960s, some congregations still
rely on the iconic, blue ditto masters today. Truth be
told, when the designers of the original FACT
questionnaire completed their work in the late 1990s,
they did not even bother to waste precious space on
communication technology. The “word” dominated --
overwhelmingly in verbal or printed form; and while
computers were beginning to show up in church
offices, websites and email were an insignificant
factor. What a difference a decade makes! By 2010
over 90% of congregations used email; seven in ten
had websites, and four in ten had Facebook pages
(Figure 4).

Indeed, the adoption of electronic communication
technology has been so rapid and pervasive within
religious organizations that a separate FACT2010 report
on the subject is forthcoming in November, 2011.
Suffice it to note just a few basic facts here. As one
might expect, the extent of a congregation’s use of
technology is strongly related to its openness to change
and the age profile of its members. Congregations with
significant numbers of young adults are roughly twice
as likely as older congregations to be heavy users of
electronic technology. Evangelical congregations are
more likely to be heavy users of technology, even when
age of members is controlled.
Congregations that are marginal technology users also
have marginal spiritual vitality, but there is relatively
little difference in vitality between modest and heavy
technology users. The pattern for worship attendance
growth has somewhat of the same dynamic. As shown
in Figure 5, spikes in technology use are found at both
the growing and declining extreme. It appears that
heavy users effectively use the new technology for
marketing purposes, and that congregations struggling
with growth the most are turning to technology with the
same hope.
The use of visual projection screens brings electronic
technology to worship and Figure 6 shows the
relationship between the two. Most dramatically, the
use of visual projection equipment has become almost a
hallmark of contemporary oriented worship with six in
ten congregations who identity their worship as
contemporary also indicating regular use of projection
equipment. This is three times the usage found for
congregations whose worship is neither innovative nor
contemporary or congregations whose worship is
innovative but not contemporary. Equally noteworthy,
there is no difference in usage between the latter.
Majority of Minorities
We’re not there as a nation yet, but most of us are well
aware of the reality – specifically, according to census
bureau projections by 2050 minorities will be a majority
of Americans. Perhaps more startling, because it is only
a bit more than a decade away, is the related projection
that by 2023 more than half of all children in the United
States will be minorities. What drives the trend: high
minority birth rates, new waves of immigration and the

rapid aging of the white, non-Hispanic population. The
implications: just about everyone agrees they will be
profound, although the scenarios vary dramatically from
the fulfilling of the American dream to the muddying of
the melting pot. One ironic fact: a society that honors
its immigrant roots faces complex and deeply ingrained
ethnic and racial divisions today. From 2000 to 2010
census data tells us that the white, non-Hispanic
population of the Unites States declined from 69% to
64% overall, from 61% to 56% for children. Against
this larger background the increase in racial/ethnic
congregations shown in Figure 7 for the same period –
from 23% to 30% -- should come as no surprise. If
there is a disappointment for some religious leaders in
these figures it may be that it appears that the nation’s
new minority population is, by and large, creating its
own congregations rather than participating in
historically white congregations. Then again, to the
extent it is true that the American congregational form
originally emerged as a melding of European parish and
ethnic center, this should hardly be surprising.
One clear implication of the increase in racial/ethnic
minority congregations is that they inject a strong dose
of growth and vitality into America’s religious life (see
Figure 8). Their participants are also considerably
younger, as seen in Figure 9 such that just like the
American population overall, their numbers are sure to
increase faster than for majority white congregations,
even if immigration were to slow. One significant area
in which they lag, however, is financial health (see
Figure 10). [Note: “None” in Figures 8-10 refers to
congregations that have no majority racial/ethnic
group.]
Racial/ethnic congregations are also disproportionately
Evangelical Protestant or Non-Christian. They are also
disproportionately urban and Southern if you include
the historically black denominations, Western for other
racial/ethnic groups. Their worship is more likely
contemporary and innovative in comparison to white
congregations; their theology more moderate to liberal;
but their technology usage is more modest to marginal
and they have, on average, fewer college graduates
among their participants. There is no significant
difference in size of congregation.

A Congregation is more than Worship
The American congregation’s historical melding of house of worship and ethnic society, beginning in the
colonial period, resulted in a variety and level of fellowship, support and educational programs that is
distinctly American. The gradual but steady shift in congregational self-understanding from supporting
mission to doing mission in one’s local community, which became dominant in the 1960s, added a second
layer to the complexity of American congregations’ program structure. Besides the normative expectations
for strong member-oriented and strong mission-oriented programing ingrained in American congregational
life, many practitioners argue that such programming is also especially adaptive to vitality and growth in our
emergent, post-modern world. Broad and dynamic member-oriented programing, so the argument goes,
provides multiple and diverse points of entry and attachment for “consumers” accustomed to following their
highly individualized preferences in a niche-oriented marketplace. Broad and dynamic, local oriented
mission programming provides both name recognition in the community and feedback loops about the needs
and interests of potential recruits.
The FACT2010
survey provides empirical support for this wisdom. It finds that breadth of member-oriented
and breadth of mission-oriented programming is related to spiritual vitality and worship attendance growth --
vitality a bit more strongly than growth. The survey also supports the common (and common-sense) wisdom
that larger congregations naturally have more resources – human, organizational and financial -- for offering
a more extensive range of programs. But most importantly for present purposes the survey shows that the
programmatic connection to vitality and growth holds at all size points – the more program the more vitality
and growth regardless of size; and this is true not only overall, but also within Oldline and Evangelical
Protestantism.
Having said this, and given the overall erosion in congregational vitality and size over the decade that we
document in the concluding section, one might expect a decline in congregational programming. The slight
growth in programming over the decade shown in Figures 11 and 12, therefore, comes as a surprise. The
2000 and 2010 FACT surveys each contained questions about seven, member-oriented programs such as
prayer groups, scripture and theology study, parenting and marriage enrichment classes, choirs and music
programs, youth and young adult activities. Minimally, the surveys were able to ascertain whether or not a
congregation offered anything in each program area. Combining these answers creates a scale that measures
the “breadth” of a congregation’s member-oriented
programming. The surveys also contained common
questions about nine local mission-oriented
programs such as soup kitchens, day care programs,
employment counseling, health clinics and voter
education which were used to create a similar scale
for breadth of mission-oriented programming.
The decadal trend in the individual member-oriented
program items aggregated in the scale pretty much
follows the overall scale trend – flat to slightly
increasing. The major exception was a significant
increase in the percentage of congregations offering
special programs for young adults. The slight
decadal increase in the overall scale also held across
denominational families.
The overall decadal trend in mission-oriented
programs, however, masks considerably more
subterranean churning. Most importantly, the net gain
is the result of a significant increase for Evangelical
Protestant congregations (from 29% in 2000 to 36% in
2010) and an actual decrease for Oldline Protestant
congregations (from 33% to 26%) – such that the
common wisdom that “liberal” Protestantism was
more involved in local social service work than
Evangelical Protestantism has now been reversed.
The surveys also found a significant decrease in food
related support and a significant increase in health,
employment and voter related programming. The
trend data also suggest that the increases were less due
to those who were already involved doing more, and
more due to those who were marginally active
becoming more widely active.
The prominence and pervasive electronic visibility of
well-organized and large scale ministries beginning
with the televangelists in the late 1960s and merging
with today’s mega-churches belies the fact that,
especially outside of Roman Catholicism, the majority
of American congregations average about 100 persons
in attendance on a typical weekend and a paid staff of
seldom more than one professional and a few part-time
support staff. The clergy leader, by necessity, needs
to be a general practitioner and the notion of specialty,
niche programming is a distant reality. In fact, the
FACT2010 survey shows that over half of all
congregations (54.7%) do not consider any of their
member-oriented programing to be particularly special
or distinctive, and another 20% only point to having
one such program. Unfortunately, and consistent with
the increasingly specialization of America’s niche
oriented consumer culture, having “flagship” programs
is strongly related to congregational vitality (see Figure
13), and is one of the reasons that large, resource rich
congregations have a decided vitality and growth edge
today.
A Steep Drop in Financial Health
American congregations were doing a lot of the right
things during the last decade. But they were fighting
against strong headwinds. One of the most stark and
challenging was the accelerating decline in financial
health shown in Figure 14. The drop from 31% in

2000 to 24% in 2005 is a decline of almost 25% or 4% per year.
The drop from 19% in 2008 to 14% in 2010 is a decline of 26% or
nearly 9% a year, twice the rate of decline as found between 2000
and 2005. Certainly a significant part of the reason for the
accelerated rate of decline late in the decade was the recession of
2008 and 2009. A full 80% of American congregations reported in
the FACT 2010
survey that their finances had been negatively
impacted by the recession. It affected nearly every kind of
congregation equally – large and small; north, south, east and west;
financially healthy or struggling before the recession. One bit of
good news was that one in ten congregations reported that by the
time of the survey they had already begun to recover. Our special
report on the impact of the recession on American congregations
expands upon these findings and we refer the reader to it. It is
available online at www.FaithCommunitiesToday.org.
Continuing High Levels of Conflict
One of the disturbing surprises in the FACT2000
survey
was the dramatically high level of conflict found in
American congregations. As shown in Figure 15, it
continues. Almost two of every three congregations in
2010 had experienced conflict in at least one of four key
areas in the past five years. In a third of the
congregations the conflict was serious enough that
members left or withheld contributions, or a leader left.
Financial stress is a major cause of conflict (although
far from the only one), and the negative impact of the
recession late in the decade certainly contributed to the
continuing high incidence of conflict.
But the incidence of conflict is only one part of the
story. More important is the corrosive effect of conflict
on the overall vitality of congregational life as seen in
Figure 16 -- a doubling of the percent of congregations

with low spiritual vitality as one moves from no conflict to serious conflict; and more than a doubling of
the percent of congregations experiencing rapid worship attendance decline and financial stress.
Aging Memberships and other Demographic Details
You hate to do it. But sometimes, as a researcher, you just have to revise a question in a projected series of
surveys, even if it disrupts the trend. Such was the case for the FACT series with regard to the age profile of
a congregation’s participants So we can’t say with as much certainty as we would like that the average age
of a person in the pew increased over the last decade. But we can say that from 2000 to 2005 the average
percentage of participants over 60 years old increased and that over the same time period the average
percentage of participants 18 -34 decreased. We can also say that from 2008 to 2010 the average percentage
of participants over 65 increased slightly, and the average percentage of 18-34 year olds continued to decline.
And given that the U.S. census shows that the median age of the American population increased from 35.3 in
2000 to 37.2 in 2010, and that the proportion of older Americans increased because of the aging of the baby
boom, it feels relatively safe to say that the age of a typical congregation’s memberships similarly aged.
But a few more grey hairs is not the major point about the changing age profile of American congregations.
Four related points are much more significant. One was already noted in the prior discussion of the
increasing proportion of racial/ethnic congregations. Specifically, Figure 9 showed that racial/ethnic
congregations have significantly higher proportions of young adults among their participants than do white
congregations. This, coupled with the likely continued surge in immigration, assures they will become an
ever increasing piece of the American congregational story throughout the foreseeable future.
A second critical point is that among historically white denominations the membership of the typical Oldline
Protestant congregation is much, much older than that of white, Evangelical Protestant congregations.
Indeed, a third or more of the membership in over half (52.7%) of Oldline Protestant congregations consists
of seniors (65 years old or older). Less than a quarter (22.9%) of white, Evangelical congregations have such
a senior skew to their membership profile.
The figures for the flip side of the age spectrum are even more stark. Seventy-five percent of Oldline
Protestant congregations said that less than 10% of their regular participants were young adults (18-34 years
old). The figure drops to 45% for white, Evangelical congregations, which is nearly identical for
racial/ethnic congregations. Public opinion polls tell
us that young adult involvement in just about any
type of organized religion has trended downward
over the past decade or so. The situation appears to
have reached critical dimensions for Oldline
Protestantism. Even in the new suburbs more than
60% of Oldline Protestant congregations report
having fewer than 10% young adults among their
regular participants (see Figure 17).
The fourth significant point related to the senior-
skewed age profile of American congregations is that
aging congregations lose some of their capacity for
change. A not so implicit theme in the preceding
sections of this report is that congregational vitality is
closely connected with innovation and change –
which makes sense in a world changing as rapidly as

ours. As one might expect, openness to change is
closely tied to being adaptively innovative.
Unfortunately, as shown in Figure 18, congregations
with older memberships significantly lag younger
congregations in their openness to change. And,
indeed, the FACT2010 survey shows that
congregations with older memberships lag younger
congregations in spiritual vitality, growth in worship
attendance, financial health, ability to find volunteers
and breadth of programming – to name just a few.
The gap is especially great for growth. Less than a
quarter of congregations reporting that a third or more
of their members are seniors report rapid attendance
growth. That percentage jumps to nearly 50% for
congregations without such a senior skew.
Figures 19 and 20 serve as reminders of two other
demographic – in this case, locational – realities of
American congregational life as we move deeper into
the new century. Each region has a slightly different
denominational flavor. The Northeast is
disproportionately Oldline Protestant, Roman
Catholic and non-Christian, with a slightly above
average skew of Black and other racial/ethnic and
new immigrant groups. The South is predominantly
Black Protestant and White Evangelical. The West
skews Evangelical Protestant and non-Black
racial/ethnic and new immigrant. The North Central
skews white Protestant, although its major urban areas
are richly diverse.
Figure 20 charts out the location of congregations
started in the last decade. To connect to the above
regional discussion it should be noted that the new
suburbs are disproportionately in the South and West.
Also by way of background and to give specificity to
what most readers are aware it should be noted that
the decadal population growth in the new suburbs was
more than twice that of big cities and older suburbs,
and more than four times that of our small city, town
and country locations. They are also
disproportionately white. It is not surprising, then,
that the new suburbs were the location of choice for
the bulk of congregations started in the last decade;
that the vast majority of such congregations were
White Evangelical; and that the bulk of the
congregations started in big cities and older suburbs
were racial ethnic.

Connecting Across Faith Traditions
One legacy of the infamous attacks of September 11, 2001
was a hopeful leap in American congregations’ interfaith
involvement. From 2000 to 2010 their participation in
interfaith worship doubled and involvement in interfaith
community service efforts nearly tripled (Figure 21).
Worship across faith traditions, nevertheless, remains low.
A little more than one in ten (13.9%) congregations
surveyed in 2010 indicated they had shared worship across
faith traditions in the past year, up from a near negligible
6.8% in 2000. Participation in interfaith community
service efforts rose to a more noticeable 20.4% of
congregations in 2010. But this still represents less than a
third of congregations cooperatively engaged in
community service.
Denominational family is important to a congregation’s
inclination toward interfaith involvement. But as shown in
Figure 22, theology is more important. The most liberal
congregations of any family are the most engaged, the
most conservative congregations the least engaged, and the
biggest jump is found between “somewhat“ and “very”
liberal. Congregations with a strong predisposition toward
civic participation also were especially likely to connect
across faith traditions.
A special report on congregations’ reach across faith
traditions, released in commemoration of Sept 11, expands
upon these findings. It is available online at
www.FaithCommunitiesToday.org.

Supporting the Electoral Process
September 11 is not the only seismic social and cultural
event in the post-World War Two era whose continued
reverberations are evident in the trends provided by the
FACT surveys. One also sees a clear legacy of the
civil rights movement of the 1950s and 60s. Most
people’s remembrance of this period in American
history vacillates between iconic memories of non-
violent protest and flashes of civil unrest, and the
longing to overcome and prophetic leading of a new
dream. Considerably less visible was the Black
Church’s strong turn to the use of the electoral process
through voter education and registration efforts. It is a
hallmark of the Black Church that clearly lives on
today as can be seen in Figure 23.
Those with a religious sensitivity that either lived
through or have studied the movement also know that
then “Mainline,” now Oldline, Protestantism provided
a strong and visible base of support for the movement,
and the idea of “social action” quickly became a
dominant thread in Oldline Protestantism’s theological
understanding of mission.
There is irony in American history! With the Moral
Majority’s founding in the late 1970s, it was America’s
“religious right” that became identified with political
action and indeed it did seem to have an extraordinary
ability to turn out the vote. Figure 24 shows that even
by 2000, non-black Evangelical Protestant
congregations were more likely to be involved with
voter education or registration programs than were
Oldline Protestant congregations. Just as importantly,
the figure shows that while such use of the political
process declined over the decade in Oldline Protestant
congregations (to just over one in ten in 2010), it
surged among non-black Evangelical Protestant
congregations to 25% in 2010, more than twice that of
Oldline Protestant congregations. Black church rates
remained relatively unchanged for the decade.
Among larger non-black, Evangelical Protestant
congregations’ involvement with voter education or
registration programs jumps to half (Figure 25). It is
the rule rather than the exception for larger
congregations to have more extensive programs than
smaller congregations, so in many respects the upward
movement by size in Figure 25 is not surprising. One
finds the same general progression for Oldline

Protestantism, except such use of the political process
only reaches 19% for its 450 + size congregations,
compared to the 49% for Evangelical congregations.
For large Black churches the comparable number is
67%.
Fewer Persons in the Pews
The times, they are a changing! When I grew up
“nuns” were women religious. In today’s headline
news about religion the “nones” are those without any
religious preference. Why the shift in popular
connotation? Because the nones are the fastest
growing religious segment of the American population
and number more than any American denomination
except Roman Catholic. It is also increasingly the
case that scholarly analyses of recent trends in
individual religiosity in the United States are
concluding that traditional forms of religious belief
and practice (including worship attendance) are
beginning to erode across the board.
It is not surprising, then, to see in Figure 26 that the
average weekend worship attendance of your typical
congregation decreased from 2000 to 2010. Indeed,
the prominence of mega-church images
notwithstanding, more than 1 in 4 American
congregations had fewer than 50 in worship in 2010,
and just under half had fewer than 100. Overall,
median weekend worship attendance of your typical
congregation dropped from 130 to 108 during the
decade according to the FACT surveys. While it is
true that the number of mega-churchs roughly doubled
during the decade, they still only constitute about a
half of one percent of all congregations in the U.S. And while it appears to be true they are attracting an ever
bigger slice of the religious attender pie, it is a bigger slice of a shrinking pie.
What is surprising in the FACT data is that the vanishing presence in the pews is not only true of Oldline
Protestant congregations whose numerical decline has been documented for the last fifty years. It is also true
for your typical White Evangelical congregation and your typical racial/ethnic congregation (Figure 27) –
although one can find hints of impending decline within Evangelicalism in the mid-to-late 1990s, especially
related to the retention of young adults. The downward blip for racial/ethnic congregations may be the most
surprising of all, especially given the youth, vitality and growth such congregations add to the American
religious diversity as previously noted.
The apparent pervasiveness of the observant contraction led us to look at all the typically studied drivers of
“church” growth available in the FACT survey series to see if we could find a general kind of category of
congregation that was not affected – things like high spiritual vitality, purposefulness, new suburban
location, and strongly held beliefs. They all continue to be positively related to growth in 2010, which will
be the subject of a forthcoming special report in the FACT survey series. However, we found no single

category or kind of congregation that was exempt
from the decadal downsizing of worship attendance.
The closest we found were congregations strongly
involved in mission-oriented programs, this type of
congregation typically being larger in addition to
having a stronger inclination toward outreach. But as
seen in Figure 28, even the typical congregation of
this type had slightly fewer in worship in 2010 than it
did in 2000.
Decreasing Spiritual Vitality
To the extent it has been true of every generation of
young adults in America since the baby boomers that
they tend to gravitate to the spiritual more than the
religious, then the sharp downtrend in the self-
assessed spiritual vitality of American congregations
evident in Figure 29 must be particularly concerning.
Equally notable and although the extent of the decline
varies somewhat, the downtrend is generally true
across the board -- across denominational family, race
and ethnic, region, and size differences to mention
just a few.
We have noted aspects of congregational life that
heighten vitality, several of which have increased
over the decade. Their potency continues in 2010.
To take just one dramatic example: if one contrasts
white conflicted congregations that have traditional
forms of worship and no more than one specialty
program on the one hand, with non-conflicted
racial/ethnic congregations that have innovative,
contemporary worship and 2 or more specialty
programs on the other hand, the latter is nearly five
times as likely to have high levels of spiritual vitality
than the former (62% vs 13%).
But we have also noted several trends that are
corrosive to vitality -- e.g., decreasing financial
health, shrinking worship attendance, aging
memberships and continued high levels of conflict.
And they appear to have been the dominant, overall
influence during the decade.
The FACT survey measure of spiritual vitality is, like
the widely known, regularly used and influential
consumer confidence index, a subjective evaluation
and typically subject to more exaggerated fluctuations
than more concrete measures. Fortunately, we also

have a more concrete measure that is relatively
strongly correlated with it. It is the extent to which a
congregation emphasizes personal spiritual practices
like prayer and scripture reading. Overall, the
percentage of congregations that said they give it
“quite or a great deal” of emphasis dropped slightly
over the decade from 85% to 82%. Figure 30 shows
the trend for White Oldline, White Evangelical and
Racial/ethnic congregations. The most notable
feature of the figure is the sizable drop for White
Oldline congregations. One also notices that White
Evangelical congregations bucked the downtrend,
with, if anything, a very slight increase. This is
clearly the exception rather than the rule, and in fact
as we scoured across a wide range of types and
categories of congregations the only other exception
we found was for extremely large congregations –
those with a 1,000 attenders or more. It appears that
for the most part, congregations kept trying to do the right things across the decade (like we saw for
increased breadth of member-oriented and mission-oriented programming), but they were fighting an uphill
battle.
One final note about spiritual vitality, in part because it tends to be counter-intuitive. As one might expect,
vitality goes up at both extremes of the liberal – conservative theological continuum as seen in Figure 31.
What may be surprising is that it rises considerably higher at the very liberal extreme than it does at the very
conservative extreme; and we have found a similar pattern in the two other surveys in which we included a
comparable theological question – 2005 and 2008. Most of our other measures of vitality also peak at the
theological extremes, but in most of these instances the jumps are not as great and whether the edge goes to
the very conservative (e.g., attendance growth, financial health) or to the very liberal (e.g., clarity of vision
and securing volunteer leaders) varies.
And so our report comes full circle:
Despite bursts of innovation, pockets of vitality, and interesting
forays into greater civic participation, American congregations
enter the second decade of the twenty-first century a bit less
healthy than at the turn of the century.

A See discussion related to Figure 29. B See discussion related to Figure 2. C See discussion related to Figure 23. D See discussion related to Figure 13. E See discussion related to Figure 17.
Protestant Families: E Evangelical; O Oldline 1 Response rate warrants caution. 2 Conducted by Synagogue 3000. Includes the Conservative and Reform Traditions 3 Conducted by the Interdenominational Theological Center. Response rate warrants caution. 4 Conducted by the Islamic Society of America. 5 Conducted by the Hartford Institute for Religion Research. Response rate warrants caution. 6 Conducted by the Standing Conference of Canonical Orthodox Bishops in America. Includes the Antiochian Orthodox
Christian Archdiocese of North America, Greek Orthodox Archdiocese of America and the Orthodox Church in America. 7 Conducted by the Center for Applied Research in the Apostolate (CARA). 8 Conducted by a sub-contractor of the Cooperative Congregational partnership. Response rate warrants caution.
Innovative &
Contemporary
Worship B
17%
51
0
17
25
0
22
0
1
5
11
46
9
20
NA
34
0
9
22
6
9
8
23
3
8
14
30
33% or More of
Members 65+
Years Old E
51%
13
18
53
18
4
23
29
37
42
43
29
40
21
NA
13
28
62
27
22
34
28
28
32
55
50
25
Consider 2+
Programs
Specialties of
Congregation D
15%
26
6
27
20
18
12
19
9
28
22
46
19
16
3
26
16
20
29
18
21
17
17
19
20
20
29
Voter Education
Or Registration
Programs C
18%
27
3
14
17
8
17
9
8
10
9
67
12
7
48
33
9
8
15
17
27
11
21
28
14
13
33
Appendix
FACT2010 Denomination and Faith Group Partner Surveys Named partner conducted or contracted for survey. For partner contact information and links to
partner reports on their respective surveys see: http//faithcommunitiestoday.org/
American Baptist Churches USA O,1
Assemblies of God E
Baha’is of the United States
Christian Church (Disciples of Christ) O
Christian Reformed Church E
Church of Jesus Christ of Latter-day Saints E
Church of the Nazarene E
Churches of Christ E
Conservative Judaism 2
Episcopal Church O
Evangelical Lutheran Church in America O
Historically Black Denominations E, 3
Lutheran Church -- Missouri Synod E
Mennonite Church USA O
Muslim 4
Nondenominational E, 5
Orthodox Christian 6
Presbyterian Church (U.S.A.) O
Reformed Church in America O
Reform Judaism 2
Roman Catholic Church 7
Seventh-day Adventist Church E
Southern Baptist Convention E
Unitarian Universalist Association O
United Church of Christ O
United Methodist Church O
Non-Partner Denominations/Traditions E, 8
High
Spiritual
Vitality A
21%
35
15
24
16
34
19
25
15
28
15
35
17
16
39
45
28
26
22
19
21
16
24
15
17
20
31

The Faith Communities Today Surveys. The FACT2010 national data set brings together the 26
individual surveys of congregations listed on the previous page. Twenty-four were conducted by or for denominations and
faith groups in the Cooperative Congregational Studies Partnership (CCSP), representing 32 of the county’s largest
denominations and traditions. Partners developed a common core questionnaire of just over 150 questions consisting of
items from the FACT2000 , FACT2005 and FACT2008 surveys. Copies of all FACT questionnaires are available at:
http://faithcommunitiestoday.org/ They should be referred to for the exact wording of items used in this report.
Using the common questionnaire, CCSP partner groups conducted their own, typically mail and online survey of a
representative, random national sample of their own congregations. Usually a congregation’s leader completed the
questionnaire. CCSP also conducted a national survey of nondenominational congregations based on a random sample
drawn from several mailing and marketing lists purchased from national vendors. Finally, CCSP contracted with a
denominational agency to survey a sample of non-partner denomination congregations, also based on a random sample
drawn from several mailing and marketing lists.
For purposes of the overall national analysis, the 26 FACT2010 sub-surveys were combined in such a way that, through the
use of statistical weights, each partner denomination and faith group, and each non-partner cluster of congregations are
represented in the national FACT2010 data proportionate to their representation in the total population of congregations in
the United States. This aggregated dataset includes responses from 11,077 congregations, and over 120 denominations.
Return rates were typically good for surveys of this type -- in 40% range. Sub-surveys with lower return rates are noted in the
appendix. Sampling error for a survey such as FACT2010 can only be roughly estimated. We believe a conservative estimate
is +/- 4% at the 95% confidence level.
In a few instances a partner faith group had to make the difficult choice to omit a set of questions in order to maximize
return rate. This was a major challenge, for example, for the pioneering FACT2000 survey of congregations in the Historically
Black denominations. Accordingly, in order to make appropriate comparisons between the FACT2000 and FACT2010 national
samples in this report the responses of congregations from denominations and faith groups missing data in FACT2000 are
also omitted from the FACT2010 figures.
The ground breaking FACT2000 survey used the same methodology as FACT2010. With responses from 14,301 congregations
it remains the largest national survey of congregations ever conducted in the U.S. CCSP intends to conduct coalition based,
mega-surveys such as FACT2000 and FACT2010 at the turn of each decade. Additionally, just as the U.S. Census Bureau
conducts regular national surveys between its large-scale decadal enumerations, CCSP is committed to conducting more
normally sized national surveys of congregations between decades. FACT2005 was the first of these; FACT2008 the second. The
purpose of these interim surveys is to track short-term changes in a limited number of key areas of congregational life and
structure, and to plumb the dynamics of selected congregational practices and challenges. Both interim survey samples
began with national samples drawn from mailing and marketing lists. The samples’ list of CCSP coalition denominations and
faith groups was cleaned and supplemented by CCSP partners. Finally, to enhance national representativeness, responses
were weighted to population parameters for faith family, region, size of congregation and rural/city/suburban location.
FACT2005 had responses from 884 congregations; FACT2008 from 2,527 congregations.
The Faith Communities Today Project. The FACT series of national surveys of American
Congregations is a project of the Cooperative Congregational Studies Partnership. CCSP is a multi-faith coalition of
denominations and religious groups hosted by Hartford Seminary’s Hartford Institute for Religion Research. CCSP
denominations and religious groups participating in FACT2010 are listed on the previous page. The primary purposes of CCSP
are developing research-based resources for congregational development and advancing the public understanding of the
most numerous voluntary organization in the U.S. – our religious congregations. More information about CCSP, its partners,
its publications, the FACT surveys and how to subscribe to its monthly newsletter is available at:
http://faithcommunitiestoday.org/
The Decade of Change report was written by David A. Roozen, Director, The Hartford Institute for Religion Research,
Professor of Religion & Society, Hartford Seminary, and Director, CCSP. For a list of publications and contact information
visit his web site at: HartfordInstitute.org/about/roozen.htm
Copyright © 2011 Hartford Institute for Religion Research
Hartford Seminary
77 Sherman Street
Hartford, CT 06105
(860) 509-9543
http://hirr.hartsem.edu/
Graphic Design by Richard Housel