
American Airlines Group Inc. September 28, 2017 Exhibit 99
87
Transcript of American Airlines Group Inc. September 28, 2017 Exhibit 99
American Airlines Group Inc. September 28, 2017 Exhibit 99.1

Safe Harbor This document includes forward-looking statements within the meaning of the Private Securities Litigation Reform Act of 1995. These forward-looking statements may be identified by words such as “may,” “will,” “expect,” “intend,” “anticipate,” “believe,” “estimate,” “plan,” “project,” “could,” “should,” “would,” “continue,” “seek,” “target,” “guidance,” “outlook,” “if current trends continue,” “optimistic,” “forecast” and other similar words. Such statements include, but are not limited to, statements about future financial and operating results, the Company’s plans, objectives, estimates, expectations and intentions, and other statements that are not historical facts. These forward-looking statements are based on the Company’s current objectives, beliefs and expectations, and they are subject to significant risks and uncertainties that may cause actual results and financial position and timing of certain events to differ materially from the information in the forward-looking statements. These risks and uncertainties include, but are not limited to, those set forth in the Company’s Quarterly Report on Form 10-Q for the quarter ended June 30, 2017 (especially in Part I, Item 2. Management’s Discussion and Analysis of Financial Condition and Results of Operations, and Part II, Item 1A. Risk Factors) and in the Company’s other filings with the Securities and Exchange Commission (“SEC”), and other risks and uncertainties listed from time to time in the Company’s other filings with the SEC. There may be other factors of which the Company is not currently aware that may affect matters discussed in the forward-looking statements and may also cause actual results to differ materially from those discussed. The Company does not assume any obligation to publicly update or supplement any forward-looking statement to reflect actual results, changes in assumptions or changes in other factors affecting these forward-looking statements other than as required by law. Any forward-looking statements speak only as of the date hereof or as of the dates indicated in the statements.

American Airlines: Playing The Long Game Doug Parker – Chairman and Chief Executive Officer

Setting Context – 35,000-Foot View We are a U.S.-based, global hub-and-spoke airline with a set of privileged assets Our history has created a need to: Invest in the airline Transform our culture Focus on our customer experience Executing on our strategy will deliver significant shareholder value

The Leap of Faith Revisited

The Leap: The Leap of Faith Revisited Believe/Understand that our industry and our airline have been materially and permanently transformed Leadership must adapt to the new world The Implication:

Data presented is pretax income excluding net special items for AMR and US Airways combined for 1978 – 2012 and pretax income excluding net special items for American Airlines Group Inc. for 2013 – 2016. Please refer to the Company’s GAAP to Non-GAAP reconciliation in the appendix for these years. 1978 – 2013 $1.0B 2014 – 2017 $19.8B American Post-Merger Earnings

Data presented is pretax income excluding net special items for AMR and US Airways combined for 1978 – 2012 and pretax income excluding net special items for American Airlines Group Inc. for 2013 – 2016. Please refer to the Company’s GAAP to Non-GAAP reconciliation in the appendix for these years. The estimated 2017 data is based on consensus data as of 9/26/2017 and is not a company forecast. 1978 – 2013 $1.0B 2014 – 2017 $19.8B American Post-Merger Earnings

Data presented is pretax income excluding net special items for AMR and US Airways combined for 1978 – 2012 and pretax income excluding net special items for American Airlines Group Inc. for 2013 – 2016. Please refer to the Company’s GAAP to Non-GAAP reconciliation in the appendix for these years. The estimated 2017 data is based on consensus data as of 9/26/2017 and is not a company forecast. American Post-Merger Earnings $3 billion $5 billion $7 billion 1978 – 2013 $1.0B

Playing the Long Game Build a World Class Product Strengthen our network: grow where we have competitive advantage Deliver value to all customer segments, with focus on the premium traveler Achieve operational excellence Leverage technology for customer ease of use Make Culture a Competitive Advantage Create an environment that cares for our frontline team members Invest in our team: provide the tools, training and facilities they require Develop innovative and inspiring leaders Think Forward, Lead Forward Become nimble: get value to market quickly Instill a leadership mindset focused on the future Drive Efficiencies Capture post-integration efficiencies Leverage technology to improve productivity Our Strategy
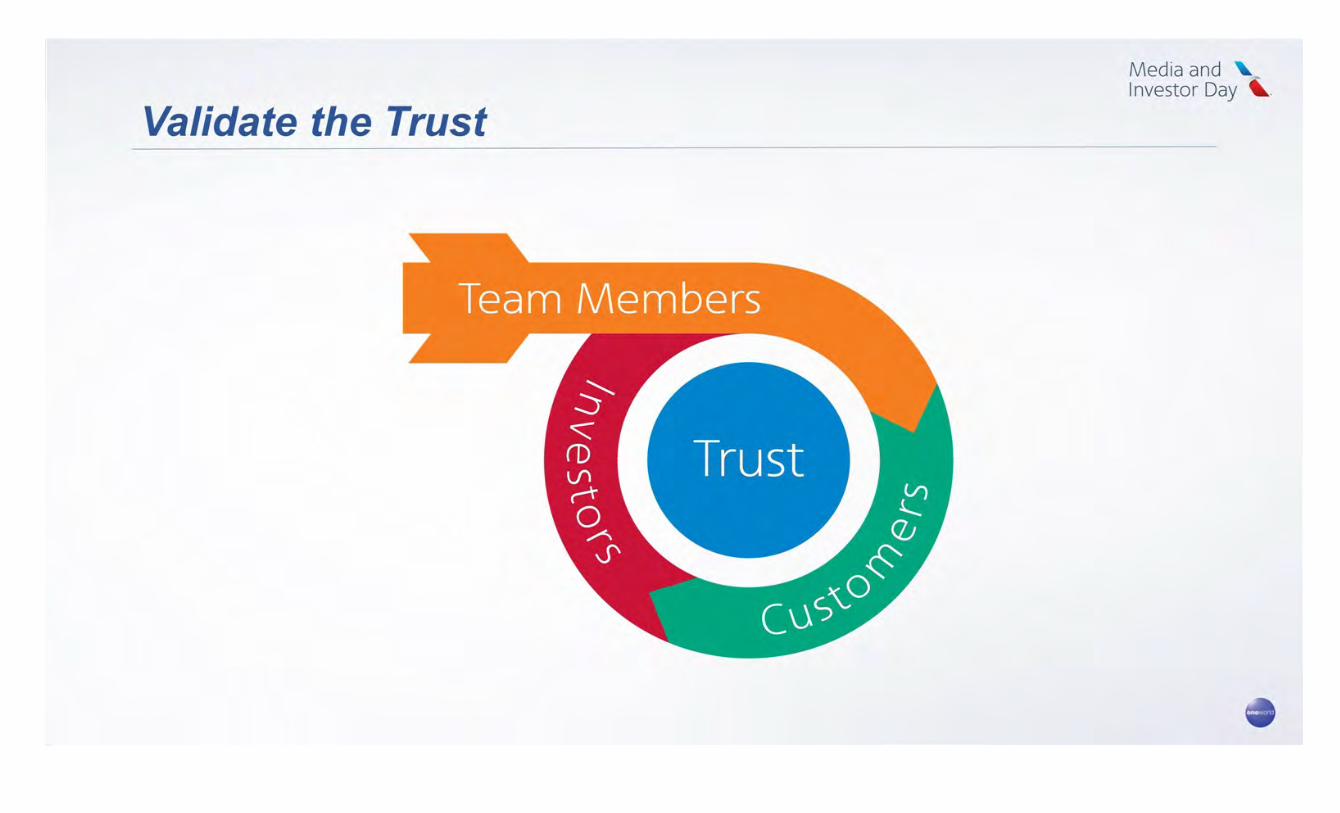
Validate the Trust
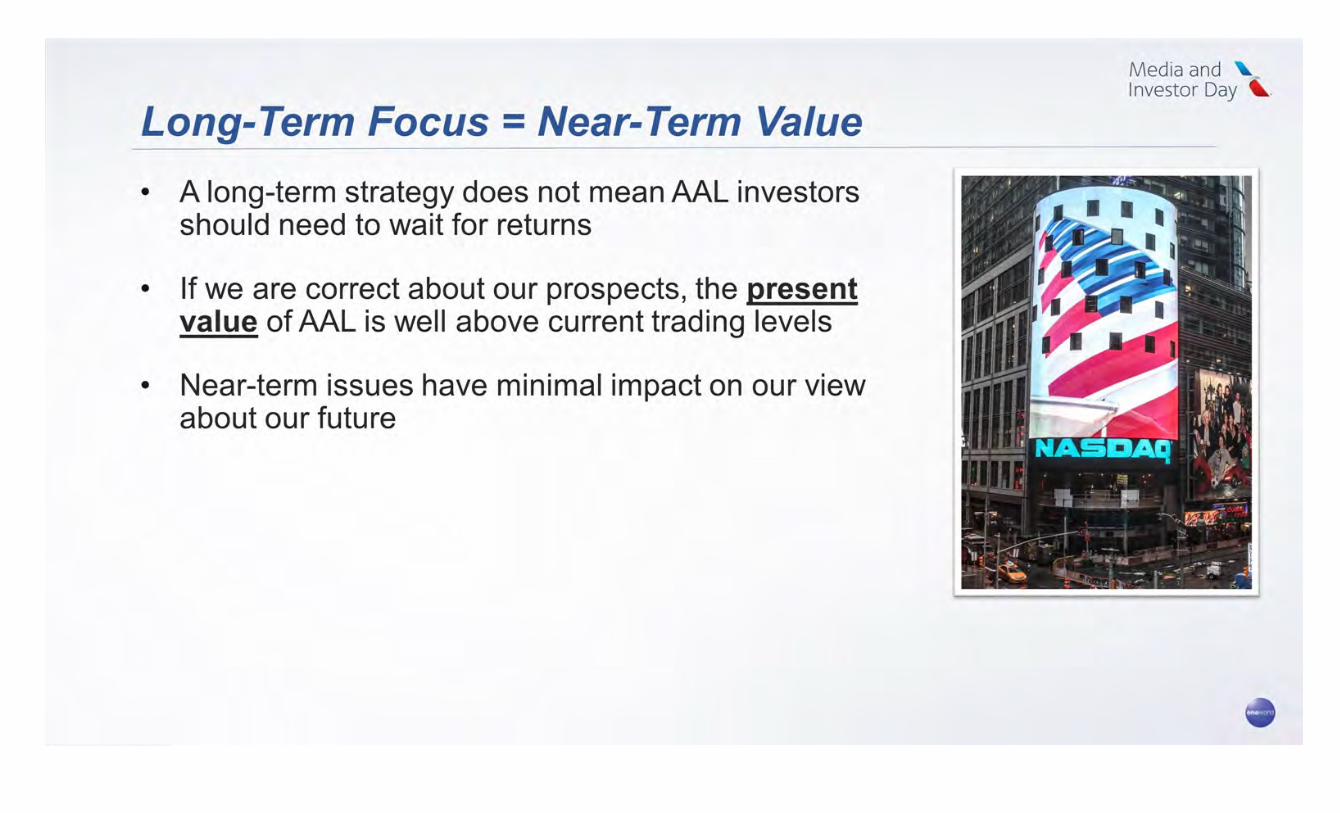
Long-Term Focus = Near-Term Value A long-term strategy does not mean AAL investors should need to wait for returns If we are correct about our prospects, the present value of AAL is well above current trading levels Near-term issues have minimal impact on our view about our future
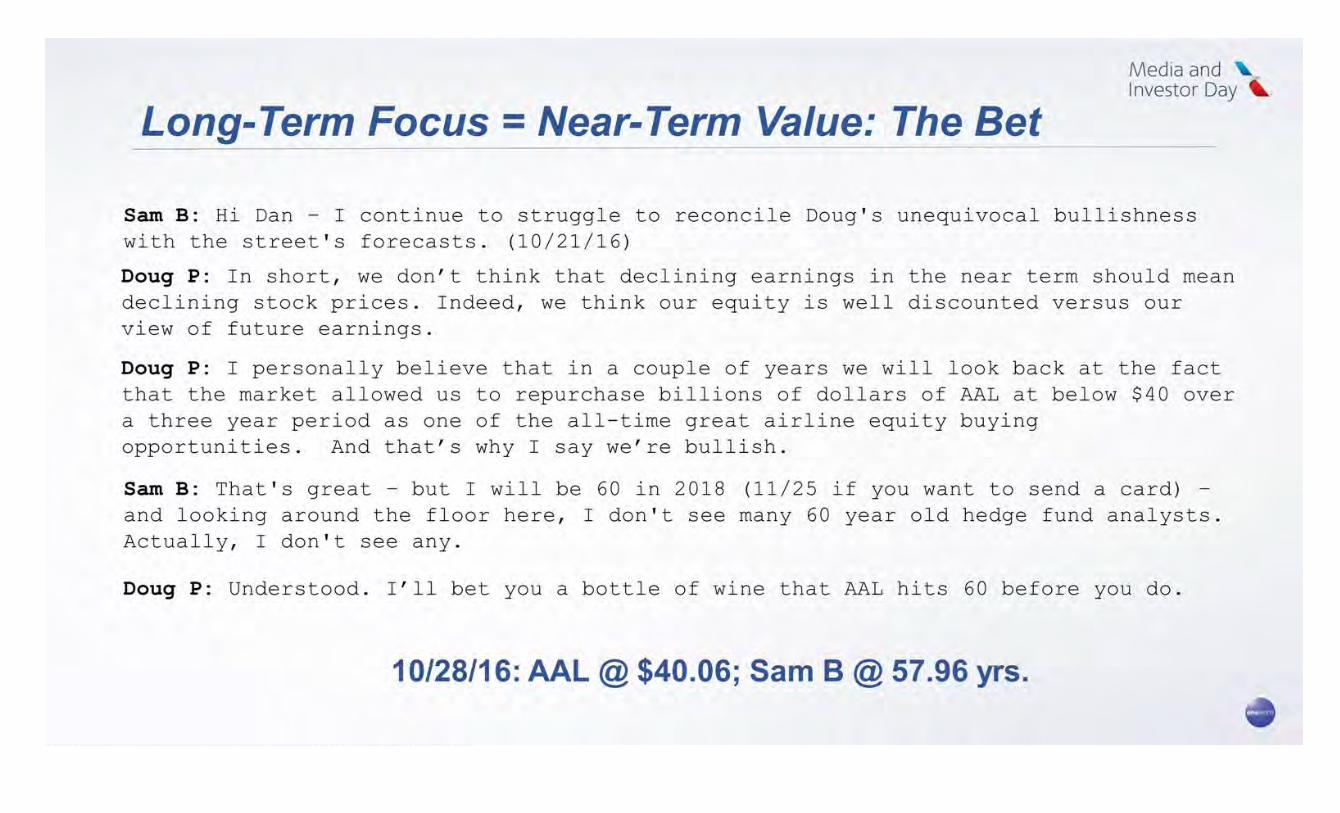
Long-Term Focus = Near-Term Value: The Bet Sam B: Hi Dan – I continue to struggle to reconcile Doug's unequivocal bullishness with the street's forecasts. (10/21/16) Doug P: In short, we don’t think that declining earnings in the near term should mean declining stock prices. Indeed, we think our equity is well discounted versus our view of future earnings. Doug P: I personally believe that in a couple of years we will look back at the fact that the market allowed us to repurchase billions of dollars of AAL at below $40 over a three year period as one of the all-time great airline equity buying opportunities. And that’s why I say we’re bullish. Sam B: That's great – but I will be 60 in 2018 (11/25 if you want to send a card) – and looking around the floor here, I don't see many 60 year old hedge fund analysts. Actually, I don't see any. Doug P: Understood. I’ll bet you a bottle of wine that AAL hits 60 before you do. 10/28/16: AAL @ $40.06; Sam B @ 57.96 yrs.

Long Term Focus = Near Term Value: The Bet The Bet = AAL will be $60/share before Sam B. turns 60 years old on 11/25/2018

Summary Incredibly excited and bullish about our future Know who we are: have a plan to create substantial value for our shareholders Focused on the long game and running our own race Encourage you to hold our feet to the fire against these plans

Building a World Class Product Robert Isom – President

Building a World Class Product Our Privileged Assets There’s More to Come Our Strategy Is Working Who We Serve Bet on American Our Privileged Assets There’s More to Come Our Strategy Is Working Who We Serve Bet on American

The World’s Largest Network … 350 Destinations 1,050 Nonstops 35,000 Markets

With Strong Partners in Europe …

Latin America and the Caribbean …

and the Pacific …

Provides Easy Access to the World 990 Destinations 2,800 Nonstops 50,000 Markets

American’s Network Structured to Serve Demand 1/ American Airlines Flown O&D passengers per day each way August 2017 Market % of Daily Passengers1 DFW-LAX 49% LIT-LAX 3% TUL-LAX 2% JAN-LAX 1% BNA-LAX 1% EWR-LAX 1% DAY-LAX 1% SDF-LAX 1% MSY-LAX 1% SGF-LAX 1% XNA-LAX 1% SHV-LAX 1% GUA-LAX 1% LFT-LAX 1% AEX-LAX 1% LGA-LAX 1% ICT-LAX 1% VPS-LAX 1% STL-LAX 1% PNS-LAX 1% DCA-LAX 1% FLL-LAX 1% BTR-LAX 1% IND-LAX 1% 300+ <1% A321 Dallas/Fort Worth to Los Angeles

Providing Access to Markets Worldwide ULCC 825 ULCC 5,200 LCC 50,000 Markets Hub-and-Spoke 8x 48x Source: Db1B and OAG data

Building a World Class Product Our Privileged Assets There’s More to Come Our Strategy Is Working Who We Serve Bet on American

Customer Segmentation 76% 24% 13% Fly more than once a year2 87% Fly once a year or less 1/ Unique O&D passengers on 11/27/16 2/ Unique flown passengers 3/ O&D destination region with at least one flown leg operated by American Airlines 500,000 daily passengers1 3

Product Segmentation Appeals to Broad Customer Base Price Quantity First Business Premium Economy Basic Economy Main Cabin Extra Flagship First Flagship Business Main Cabin

Basic Economy: Retain Core Aspects of Main Cabin … Carry-on Bags Seat Assignment Upgrades Snacks & Drinks American Main Cabin Wi-Fi & Entertainment American Basic Economy Service Recovery ULCC Economy Price = = +

With the Ability to Choose Desired Benefits Basic Economy Main Cabin Customers American Lowest price Bundled product with all the benefits Marketplace competitive More ancillary revenue 50% upsell rate to better product

Main Cabin Extra: Additional Comfort and Convenience Additional benefits coming soon

3Q 2017 4Q 2017 1Q 2018 2Q 2018 3Q 2018 4Q 2018 26% 76% 88% 88% 88% 100% Premium Economy: Coming to a Widebody Near You Premium Economy Rollout Schedule – Retrofit Completion Rate by Quarter

Flagship Business: Lie-flat Seats with Flagship Lounge Access

Flagship First: A Premium Experience on the Ground and in the Air Airport Flagship Lounge JFK Open ORD Open MIA 4Q 2017 LAX 4Q 2017 DFW 4Q 2018 PHL TBA LHR TBA

A Successful Model for Industry Competition Network Product Schedule Service Rewards Segmentation

Building a World Class Product Our Privileged Assets There’s More to Come Our Strategy Is Working Who We Serve Bet on American

Customer Satisfaction is Improving

Continued Growth in High Value Channels Added 13,000 new small and medium business accounts YTD 2017 1/ Data includes Business agencies and Travel Management Company (TMC) channel performance

Strong Premium Cabin Revenue Performance

Revenue Performance Outpacing the Industry

Building a World Class Product

Reliability through Improved Operational Performance Flight attendant integration Maintenance systems alignment Fleet alignment

Major Milestones = Delivering More Value Integration Milestone Impact to Network Improved Aircraft Utilization Crew & Aircraft Scheduling Efficiencies Better Match Supply to Demand

Enhancing Revenue Management Tools and Processes

Ancillary Revenue Performance Continues to Improve

A Younger, More Modern Fleet More 2-class Regional Aircraft2

Updating Aircraft to Align Fleet Types and Improve the Customer Experience

Major Fleet Harmonization and Optimization Update In 4Q 2017, the first of more than 550 narrowbody aircraft will begin the largest fleet modernization project in aviation history New seats Satellite Wi-Fi In-seat power Larger overhead bins B737-800 172 B737 MAX 160 172 B737-800 & MAX 181 LAA A321 190 A321 187 LUS A321

Strengthening Relationships with Global Partners Atlantic Joint Business Latin Joint Business Qantas Joint Business China Southern

Revitalized Sales Efforts to Extend Global Reach
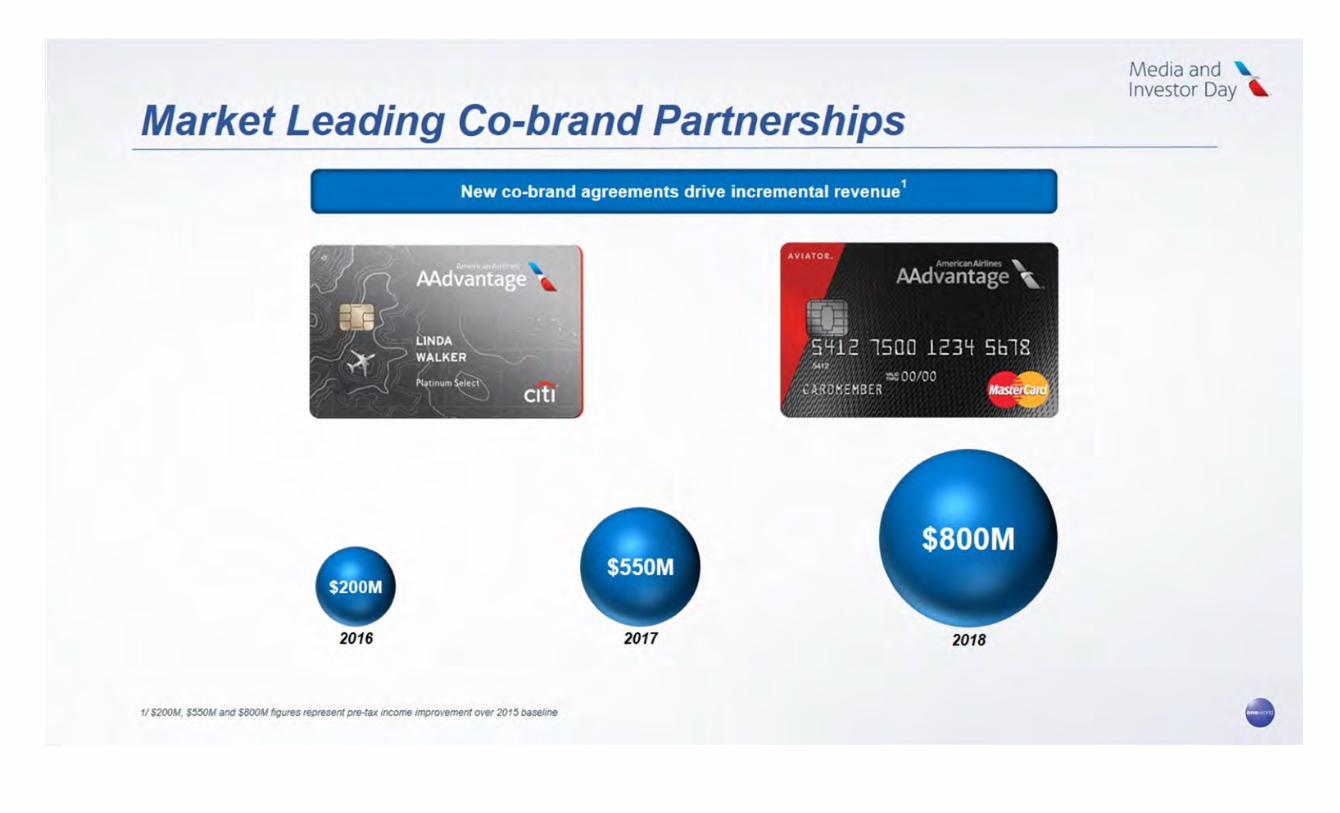
Market Leading Co-brand Partnerships

Building a World Class Product That Delivers Value 500 Seat Harmonization 550 Co-Branded Partnerships 175 Sales Initiatives 325 Commercial Initiatives 350 Revenue Management Initiatives 1,000 Basic and Premium Economy Total Estimated Program/Project Value ($ Millions) 2,900 Total Opportunity from Commercial Projects

Building a World Class Product Our Privileged Assets There’s More to Come Our Strategy Is Working Who We Serve Bet on American

A Winning Combination You Can Bet On
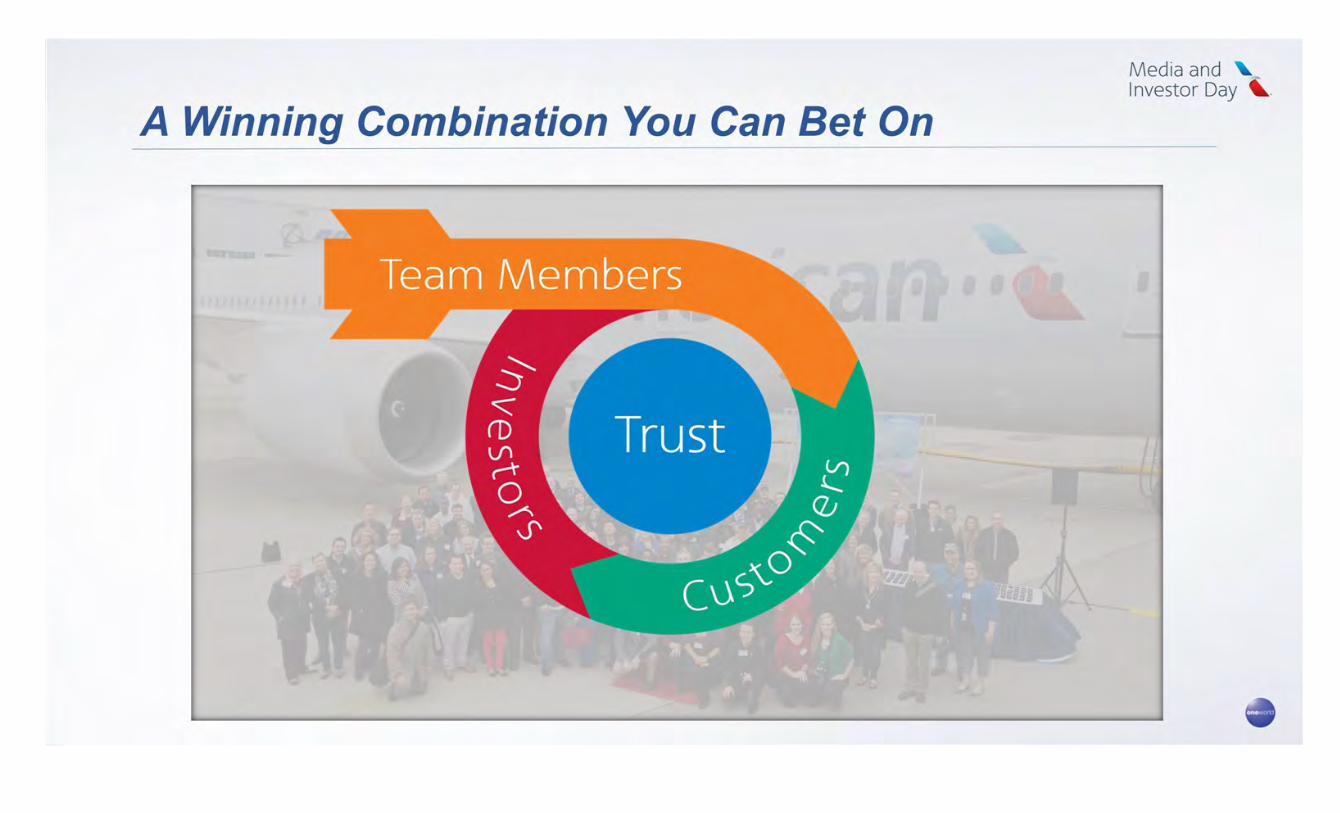
A Winning Combination You Can Bet On

Trust in Action

Drive Efficiencies Derek Kerr – Chief Financial Officer
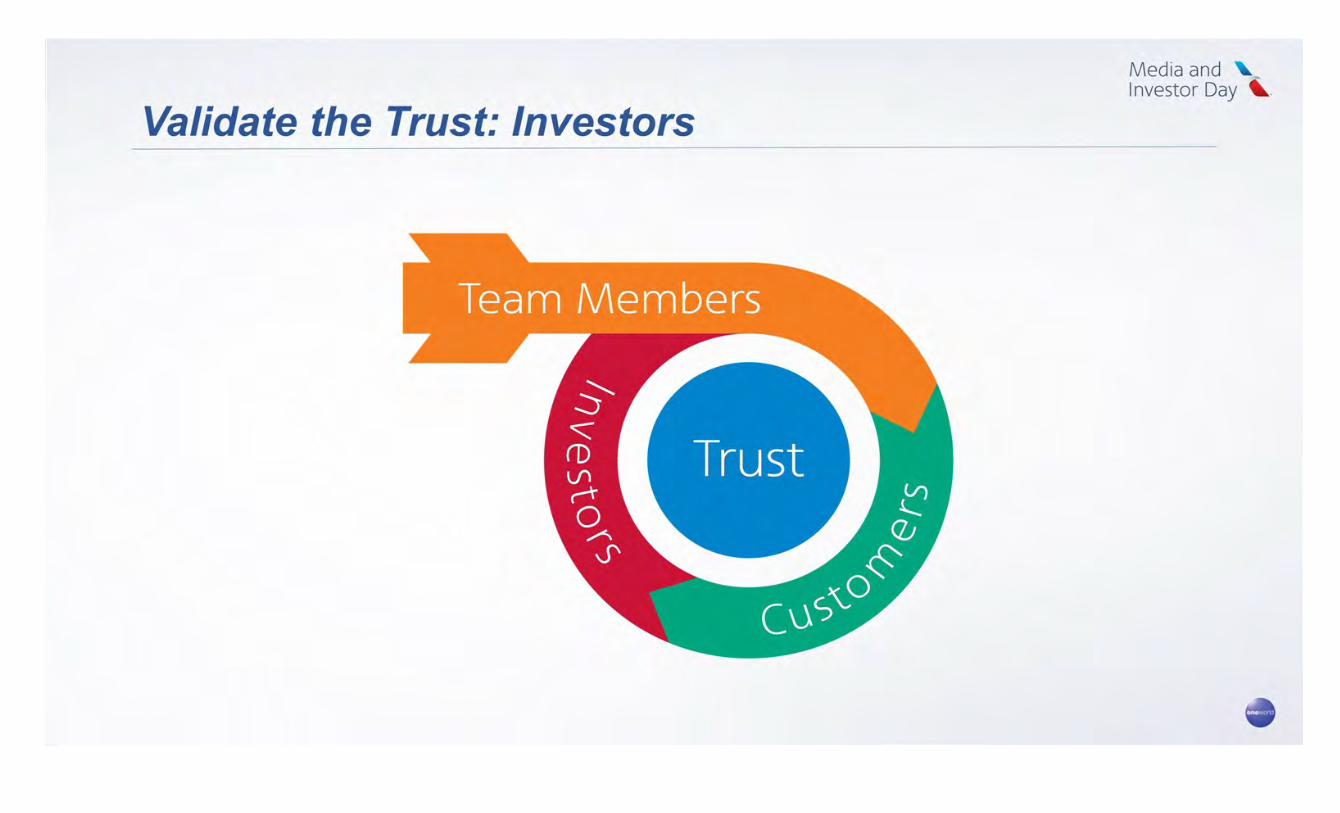
Validate the Trust: Investors

Data presented is pretax income excluding net special items for AMR and US Airways combined for 1978 – 2012 and pretax income excluding net special items for American Airlines Group Inc. for 2013 – 2016. Please refer to the Company’s GAAP to Non-GAAP reconciliation in the appendix for these years. The estimated 2017 data is based on consensus data as of 9/26/2017 and is not a company forecast. 1978 – 2013 $1.0B Current Status: Pretax Earnings $3 billion $5 billion $7 billion

Despite significant investment in the airline, American remains comfortably above its target liquidity of $7.0 billion Target Liquidity $7.0B 1/ Total liquidity consists of unrestricted cash and short term investments, plus available undrawn revolving credit facilities Current Status: Liquidity

Long-Term Value Creation Validating the Trust: Investors Investment in the Business Commercial Initiatives Capital Allocation Project One Airline

Investment in the Business

Capital Investments Elevated capex driven by fleet renewal program Fewer aircraft deliveries in future years reduces cash outflows and increases financial flexibility
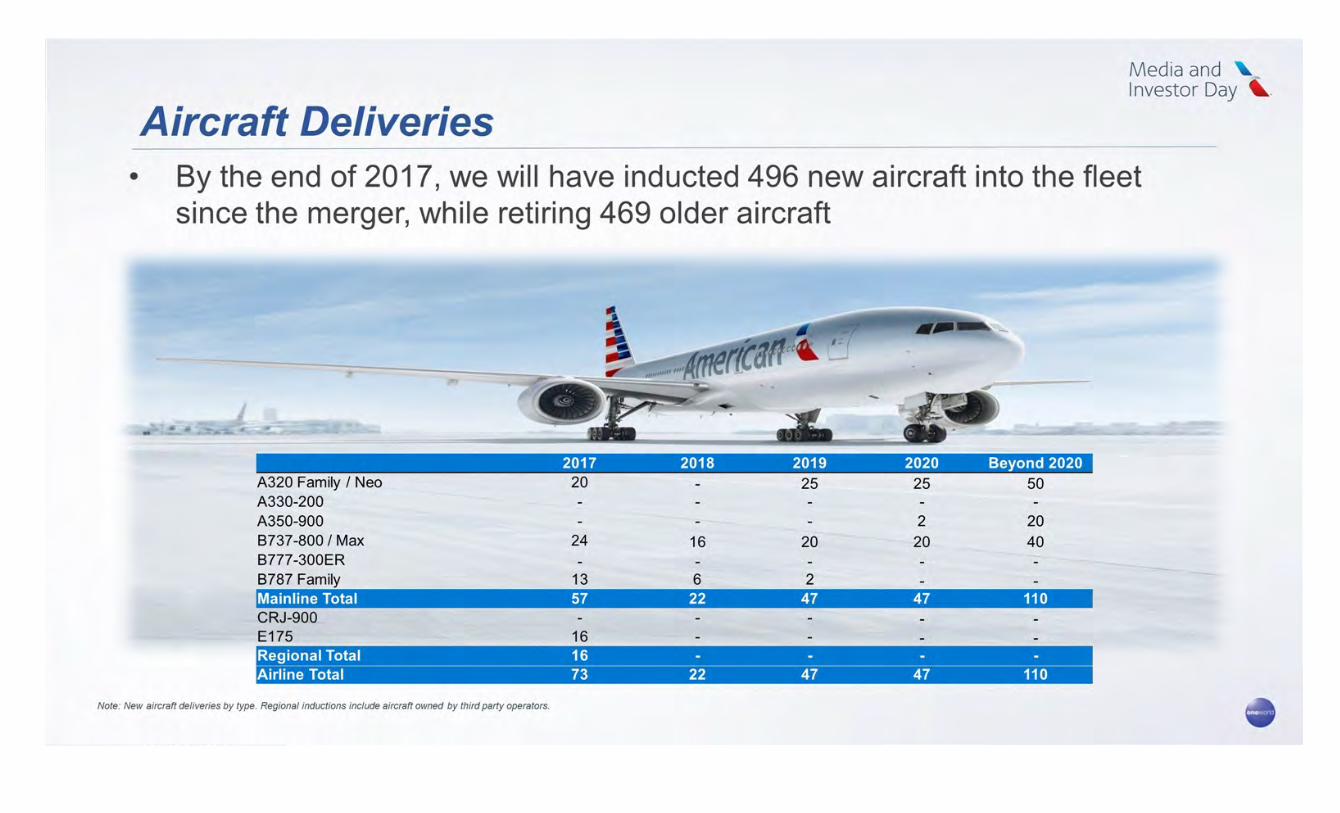
Aircraft Deliveries By the end of 2017, we will have inducted 496 new aircraft into the fleet since the merger, while retiring 469 older aircraft 2017 2018 2019 2020 Beyond 2020 A320 Family / Neo 20 - 25 25 50 A330-200 - - - - - A350-900 - - - 2 20 B737-800 / Max 24 16 20 20 40 B777-300ER - - - - - B787 Family 13 6 2 - - Mainline Total 57 22 47 47 110 CRJ-900 - - - - - E175 16 - - - - Regional Total 16 - - - - Airline Total 73 22 47 47 110 Note: New aircraft deliveries by type. Regional inductions include aircraft owned by third party operators.

5 -Year Fleet Plan Future deliveries will continue to be accompanied by retirements, keeping the number of aircraft relatively flat Total Aircraft

Efficient capacity growth driven by larger replacement aircraft, upgauging existing aircraft and longer stage length flying 10% more fuel efficient1 1/ Measured in gallons per 10,000 ASMs Fleet Transformation

Significant Capital Projects 2021 Flight attendant operational integration Tech Ops integration HR and Payroll integration Initial rollout of Basic Economy Self re-accommodation tools New pricing and yield management system One Campus, One Team Harmonize seat layouts: B737/737 Max Harmonize seat layouts: A321 classics 2017 2018 2019 2020 Remaining integration items Note: Estimated completion dates subject to revision Installation of Premium Economy Installation of lie-flat seats on B757s Satellite wifi installation on narrowbody fleet

Project One Airline

High-value initiatives in customer experience, ops, sales and marketing 32 Technology driven or enabled initiatives 72 Smaller process improvement initiatives 253 Remaining redundancies on FTEs, systems and other initiatives 60 A total of 417 efficiency projects have been identified Drive Efficiencies: Project One Airline Note: All efficiencies assume employee impacts are paced by attrition

Drive Efficiencies: Project One Airline Examples of efficiency projects include: $250 million $350 million $175 million $225 million Estimated Opportunity of $1.0 billion Integrated Ops Aircraft taxi management technologies Optimize aircraft warranty recoveries Customer Experience New airport ramp technologies Implement new cargo operating system Strategic Planning Improved asset/gate utilization at hub airports Concentrate widebody hub deployment Other Fuel initiatives – RAF, APU, single engine taxi and other Hotel booking management Implement new airport overtime assignment system Implement new IROPS voucher system Further shift to dual-class regional jets, primarily at wholly owned carriers Redesign schedule seasonality Reduce airport footprint following integration Improve workers’ compensation case management Fleet simplification Pharmaceutical expense audit Complete Flight Attendant integration Expand direct connect technology Flight, route and re-routing planning systems

Long Term CASM Growth Targets 1% - 2% Long-term CASM Growth Goal As the efficiency program takes hold and the integration nears completion, sustainable low CASM growth is anticipated

Commercial Initiatives

50 100 50 250 50 Integrated Operations 20 105 50 225 50 Other 10 125 - 175 40 Strategic Planning 120 120 50 350 60 Customer Experience 200 125 175 500 - Seat Harmonization 200 100 - 550 250 Co-branded Partnerships 25 50 50 175 50 Sales Initiatives 25 150 - 325 150 Commercial Initiatives - 100 - 350 250 Revenue Management Initiatives 50 250 50 1,000 650 Basic and Premium Economy Driving Efficiencies: Commercial Initiatives 20/19 19/18 21/20 Total 18/17 Estimated Program/Project Value ($ Millions) 500 775 275 2,900 1,350 Total Revenue Opportunity from Commercial Projects 700 1,225 425 3,900 1,550 Total Opportunity from All Initiatives 200 450 150 1,000 200 Total Cost Opportunity from One Airline Initiatives

Capital Allocation

Higher debt levels supported by higher asset values Driving Efficiencies: Allocating Capital 1/ Data estimated from Diio and MBA Redbook values

American is comfortably above its target liquidity level of $7.0 billion, and has higher liquidity than both the other network airlines 1/ Total liquidity consists of unrestricted cash and short term investments, plus available undrawn revolving credit facilities 2/ Net of an assumed 1% increase in earnings on $6.9 billion of current cash balances Driving Efficiencies: Liquidity Impact of 100 bps increase in interest rates is ~$30M / year in net interest expense2 Target Liquidity $7.0B

Driving Efficiencies: Capital Allocation Strategy Anticipated Uses of Cash Investors Return excess above $7.0 billion to shareholders Debt Prepay high cost debt Investments Invest in our people, product and operations, while taking advantage of attractive financing options Operational cashflow Complete merger integration items, operate the airline, pay pension and debt obligations

Summary American remains committed to long-term value creation American has identified $3.9 billion of revenue and cost opportunities Fleet transformation Commercial initiatives Project One Airline Capital allocation plan: We expect to de-lever over time as our capex program decreases We will maintain a minimum target liquidity of $7.0 billion as we complete the integration With these initiatives, along with our strong financial position, American expects its pretax earnings excluding special items to average $5.0 billion annually

Long-term Guidance

Focus on the Long-Term – Changes to Guidance American will lay out long-term, clear financial objectives Going forward: Will provide TRASM guidance on a quarterly basis Will stop reporting monthly traffic Starting in 2018: Guidance will be on consolidated basis Will provide three years of fleet guidance Will provide three years of CASM guidance
Change to Revenue Recognition Standard
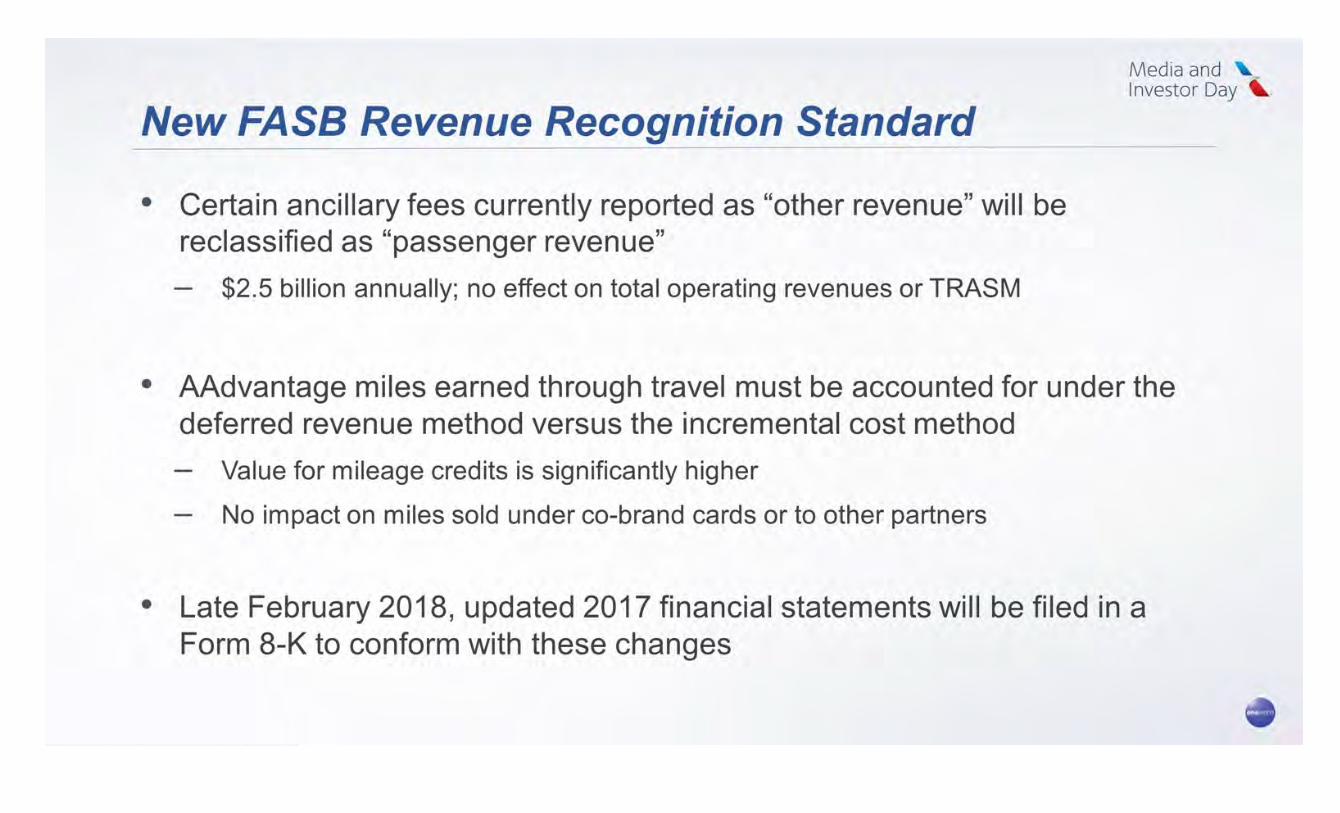
New FASB Revenue Recognition Standard Certain ancillary fees currently reported as “other revenue” will be reclassified as “passenger revenue” $2.5 billion annually; no effect on total operating revenues or TRASM AAdvantage miles earned through travel must be accounted for under the deferred revenue method versus the incremental cost method Value for mileage credits is significantly higher No impact on miles sold under co-brand cards or to other partners Late February 2018, updated 2017 financial statements will be filed in a Form 8-K to conform with these changes

New FASB Revenue Recognition Standard Estimated impact upon adoption on January 1, 2018: Balance Sheet: $5.5 billion increase to liability for outstanding mileage credits Corresponding $2.0 billion increase in deferred tax asset Net $3.5 billion charge recorded to retained earnings Income Statement: In accordance with GAAP, the prior year will be adjusted for comparison purposes to reflect an approximate $300 million increase in passenger revenue and pretax income For modeling purposes, this adjusted passenger revenue and pretax income will become the new 2017 base

Closing Remarks

Playing the Long Game Build a World Class Product Strengthen our network: grow where we have competitive advantage Deliver value to all customer segments, with focus on the premium traveler Achieve operational excellence Leverage technology for customer ease of use Make Culture a Competitive Advantage Create an environment that cares for our frontline team members Invest in our team: provide the tools, training and facilities they require Develop innovative and inspiring leaders Think Forward, Lead Forward Become nimble: get value to market quickly Instill a leadership mindset focused on the future Drive Efficiencies Capture post-integration efficiencies Leverage technology to improve productivity Our Strategy

Summary Incredibly excited and bullish about our future Know who we are: have a plan to create substantial value for our shareholders Focused on the long game and running our own race Encourage you to hold our feet to the fire against these plans

Appendix

GAAP/Non-GAAP Reconciliation For additional detail regarding net special items and the methodology used to produce combined historical results for 2013, see the Company’s earnings press releases filed on SEC Form 8-K issued January 27th, 2017, January 29th, 2016, January 27th, 2015 and January 28th, 2014, which can be found at www.aa.com/investorrelations


