ameren lehman_sept_2008
28
investing for our future. 1 Lehman Brothers CEO Energy/ Power Conference September 4, 2008
-
Upload
finance30 -
Category
Economy & Finance
-
view
220 -
download
0
Transcript of ameren lehman_sept_2008

investing for our future.1
Lehman Brothers CEO Energy/Power Conference
September 4, 2008

investing for our future.2
Regulation G StatementAmeren has presented certain information in this presentation on a diluted cents per share basis. These diluted per share amounts reflect certain factors that directly impact Ameren’s total earnings per share. The core (non-GAAP) earnings per share and core (non-GAAP) earnings per share guidance exclude one or more of the following: costs related to severe January 2007 storms, the earnings impact of the settlement agreement among parties in Illinois for comprehensive electric rate relief and customer assistance, the reversal of accruals made in 2006 for low-income energy assistance and energy efficiency program funding commitments in Illinois, a March 2007 FERC order, which retroactively adjusted prior years’ regional transmission organization costs, net mark-to-market gains or losses from nonqualifying hedges, the estimated minimum benefit of an accounting order from the Missouri Public Service Commission associated with 2007 storm costs and the 2008 lump-sum payment from a coal supplier for expected higher fuel costs in 2009 as a result of the premature closure of a mine and termination of a contract. Ameren uses core (non-GAAP) earnings internally for financial planning and for analysis of performance. Ameren also uses core (non-GAAP) earnings as primary performance measurements when communicating with analysts and investors regarding our earnings results and outlook, as the company believes it allows it to more accurately compare the company’s ongoing performance across periods.In providing consolidated and segment core (non-GAAP) earnings guidance, there could be differences between core(non-GAAP) earnings and earnings prepared in accordance with GAAP for certain items, such as those listed above. Ameren is unable to estimate the impact, if any, on future GAAP earnings of certain items, such as the ultimate earnings impact of the Missouri Public Service Commission storm cost-related order, or net mark-to-market gains or losses from nonqualifying hedges Forward-looking StatementsAmeren’s earnings guidance assumes normal weather and is subject to, among other things, regulatory decisions and legislative actions, plant operations, energy market and economic conditions, severe storms, unusual or otherwise unexpected gains or losses and other risks and uncertainties outlined in Ameren’s Forward-looking Statements in its news releases and in the Forward-looking and Risk Factors sections in its periodic filings with the Securities and Exchange Commission.
Cautionary Statements

investing for our future.3
UEIP
CIPS
CILCO
Ameren Introduction● Regional electric and gas utility
• Missouri regulated generation, transmission and delivery business
• Illinois regulated transmission and delivery businesses
• Non-rate-regulated generation business
● NYSE-listed under AEE
• Market cap. ~$9 billion
• Component of the S&P 500
investing for our future.4
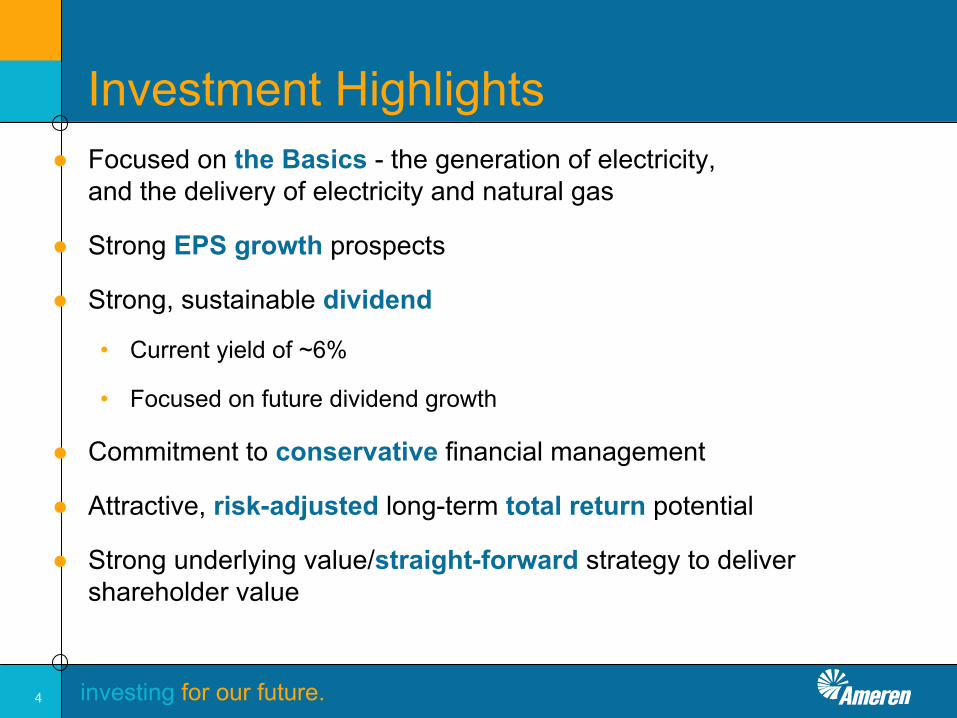
Investment Highlights● Focused on the Basics - the generation of electricity,
and the delivery of electricity and natural gas
● Strong EPS growth prospects
● Strong, sustainable dividend
• Current yield of ~6%
• Focused on future dividend growth
● Commitment to conservative financial management
● Attractive, risk-adjusted long-term total return potential
● Strong underlying value/straight-forward strategy to deliver shareholder value

investing for our future.5
Ameren’s Business Plan● Achieve operational excellence in
all aspects of our business
● Improve our customer service, satisfaction and image
● Demonstrate environmentalleadership
● Improve regulatory frameworks and returns
● Optimize non-rate-regulated generation business
● Maximize the value of our shareholders’ investment
Highcustomer
satisfaction
Meaningfulinvestmentin servingcustomers
Fairreturn
on investment
High qualityservice

investing for our future.6
Financial Outlook OpportunitiesRegulated Businesses
● Earning fair returns in regulated operations
• Illinois Regulated Operations
Estimated 2008 Core (non-GAAP) ROE < 4%
• Missouri Regulated Operations
Estimated 2008 Core (non-GAAP) ROE ~ 7%
• Allowed return in last rate cases was ~10%. Every 1% equals approximately $50 million of revenues in Missouri and $25 million in Illinois
• Rate cases pending in Illinois and Missouri
● Increasing rate base investment
investing for our future.7
$0
$1,000
$2,000
$3,000
$4,000
$5,000
$6,000
$7,000
$8,000
$9,000
2006 2007 2008 2009 2010 2011 2012
$0
$500
$1,000
$1,500
$2,000
$2,500
$3,000
$3,500
$4,000
$4,500
2006 2007 2008 2009 2010 2011 2012
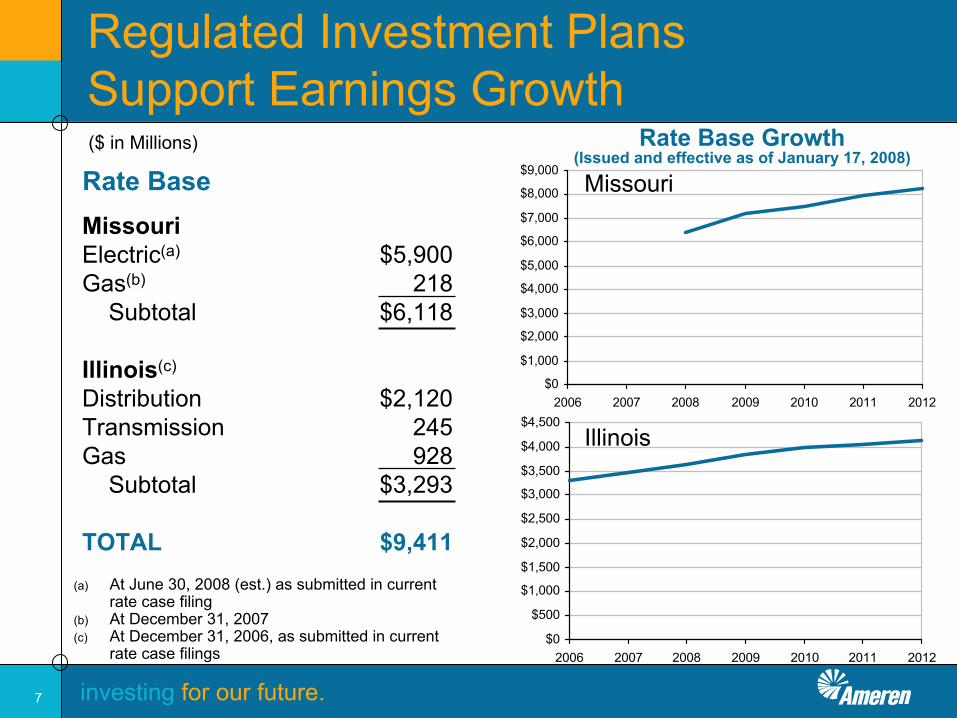
Regulated Investment Plans Support Earnings Growth
Rate Base
Illinois
Missouri
MissouriElectric(a) $5,900Gas(b) 218
Subtotal $6,118
Illinois(c)
Distribution $2,120Transmission 245Gas 928
Subtotal $3,293
TOTAL $9,411(a) At June 30, 2008 (est.) as submitted in current
rate case filing(b) At December 31, 2007(c) At December 31, 2006, as submitted in current
rate case filings
Rate Base Growth(Issued and effective as of January 17, 2008)
($ in Millions)

investing for our future.8
Illinois Rate Cases● Illinois electric and gas delivery service rate case decisions by end of
September 2008
● Current request is $207 million revenue increase, includes rider mechanisms • 10.7% ROE; 50% to 53% equity
● ICC staff revenue increase recommendation is $87 million
● ALJ’s revenue increase recommendation is $163.5 million• Voluntary electric rate cap reduces $163.5 million recommendation by
~$10 million in year 1 only• 10.65% electric, 10.68% gas ROEs; 50% to 53% equity
• Key recommended disallowances include post-test year reliability expenditures and certain financing costs
• Recommends increasing fixed monthly gas charge to 80%vs. prior ~57% to address decoupling

investing for our future.9
Missouri Rate Case● Electric rate case decision by February 2009
● Request is $251 million revenue increase
• 10.9% ROE; 51% equity
● Requesting fuel and purchased power cost recovery mechanism
● MoPSC staff recently recommended $51 million revenue increase
• 9.5% ROE; 51% equity
● Key issues:
• Return on equity
• Fuel and purchased power cost recovery mechanism
• Operating cost and rate base adjustments

investing for our future.10
Financial Outlook OpportunitiesNon-rate-regulated Generation
● Position non-rate-regulated business for earnings growth
• Improving plant performance
• Effective marketing, trading and hedging
• Environmental compliance
● Areas significantly impacting future earnings results include future power, capacity and fuel prices
investing for our future.11
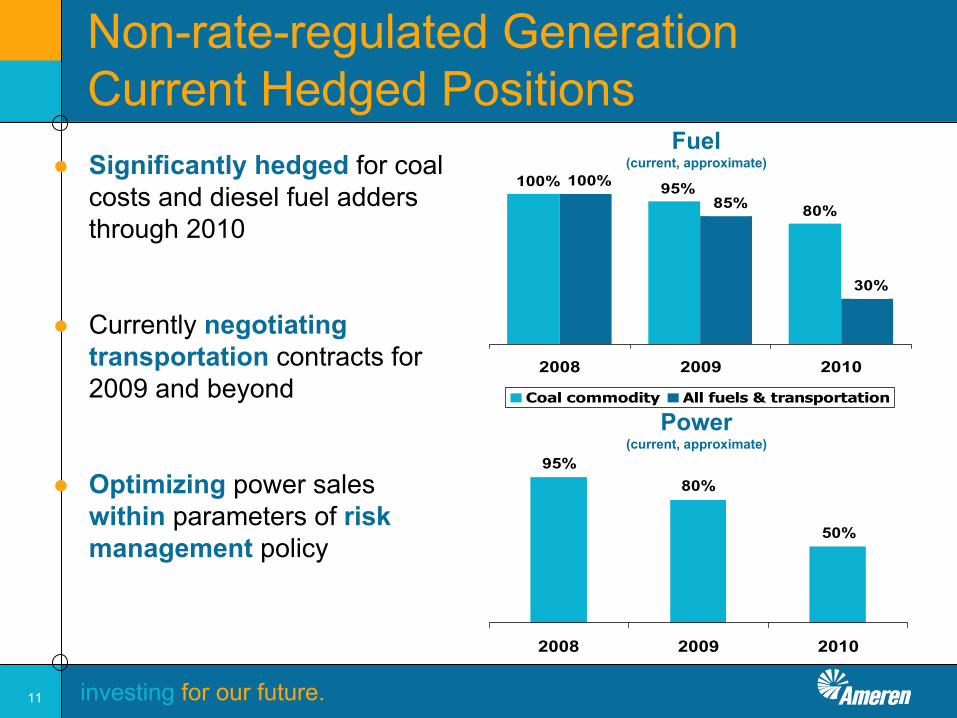
● Significantly hedged for coal costs and diesel fuel adders through 2010
● Currently negotiating transportation contracts for 2009 and beyond
● Optimizing power sales within parameters of risk management policy
Fuel(current, approximate)
Power(current, approximate)
Non-rate-regulated GenerationCurrent Hedged Positions
95%
50%
80%
2008 2009 2010
100% 95%80%
30%
85%100%
2008 2009 2010
Coal commodity All fuels & transportation

investing for our future.12
Key Considerations for 2nd Half 2008● Regulatory matters
• Illinois delivery rate orders
• Illinois rate redesign
• Missouri rate case hearings
● Operations
• Callaway scheduled refueling & maintenance outage
• Weather
• Power prices
● Financings
investing for our future.13
Q & A

investing for our future.14
Appendix

investing for our future.15
Ameren Segments
investing for our future.16
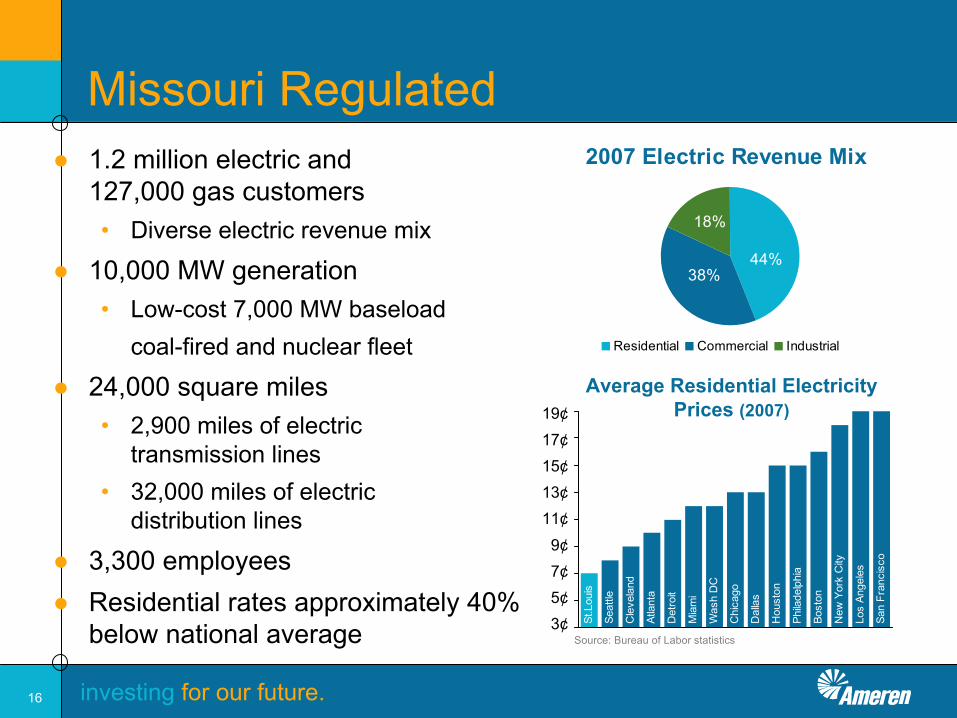
● 1.2 million electric and 127,000 gas customers • Diverse electric revenue mix
● 10,000 MW generation• Low-cost 7,000 MW baseload
coal-fired and nuclear fleet
● 24,000 square miles• 2,900 miles of electric
transmission lines• 32,000 miles of electric
distribution lines
● 3,300 employees● Residential rates approximately 40%
below national averageC
leve
land
Atla
nta
Det
roit
Mia
mi
Was
h D
C
Chi
cago
Dal
las
Hou
ston
Phila
delp
hia
Bost
on
New
Yor
k C
ity
Los
Ange
les
San
Fran
cisc
o
Seat
tle
St.L
ouis
0.03
0.05
0.07
0.09
0.11
0.13
0.15
0.17
0.19
2007 Electric Revenue Mix
44%38%
18%
Residential Commercial Industrial
Average Residential Electricity Prices (2007)
Source: Bureau of Labor statistics
Missouri Regulated
19¢17¢15¢13¢11¢9¢7¢5¢3¢

investing for our future.17
2007 Margin Mix
71%
29%Electric
Gas
Ameren Illinois Utilities● Regulated transmission and
distribution company• Owns no generation
● 1.2 million electric and 830,000 gas customers
● 44,000 square miles• 4,490 miles of electric transmission lines
• 45,000 miles of electric distribution lines
• 17,900 miles of natural gas mains
● 2,300 employees
● Current bundled electric rates approximate national average
CILCO
CIPSIP

investing for our future.18
Non-Rate-Regulated Generation● Operate power plants
• Three legal entities
● Market power and related products
● 6,300 MW generation
• Low-cost 4,500 MW baseload coal-fired fleet
● 1,100 employees
Duck Creek330 MW
Coal – 1976
Edwards745 MW
Coal – 1960CTGs
1,140 MWGas – 2000-01
Hutsonville150 MW
Coal – 1953
Coffeen900 MW
Coal – 1965
Newton1,210 MW
Coal – 1977
Joppa – 80%1,000 MW
Coal – 1953
Grand Tower CTG510 MW
Gas – 2001
Meredosia445 MW
Coal/Oil – 1948

investing for our future.19
Financial

investing for our future.20
Q2 2008 Earnings Reconciliation2007 GAAP Earnings per Share
2007 severe storm-related costsFERC order – MISO chargesIllinois contribution plan terminationNet mark-to-market gains
2007 Core Earnings per Share (Non-GAAP)Missouri rate cases (margin and expense)Illinois rate redesignOther electric and gas marginsWeather (estimate)Fuel prices Coal contract settlement – 2008 impactCallaway refueling and maintenance outagePlant operations and maintenanceDistribution system reliability Other labor and employee benefitsBad debt expensesDepreciation and amortizationDilution and financingOther, net
2008 Core Earnings per Share (Non-GAAP)Illinois electric rate relief settlementNet mark-to-market gainsCoal contract settlement – 2009 impactMO storm accounting order
2008 GAAP Earnings per Share
$ 0.69 $ 1.29– 0.09– 0.05– (0.05)
(0.02) –$ 0.67 $ 1.38
0.02 0.08(0.01) (0.06)0.18 0.34
(0.03) –(0.08) (0.17)0.10 0.100.16 0.16
(0.06) (0.08)(0.08) (0.14)(0.05) (0.06)(0.02) (0.03)(0.02) (0.03)(0.03) (0.03)(0.08) (0.15)
$ 0.67 $ 1.31(0.04) (0.07)0.23 0.280.08 0.080.04 0.04
$ 0.98 $ 1.64
Q2 YTD

investing for our future.21
2007 GAAP Earnings per Share 2007 severe storm-related costsIllinois electric rate relief settlement, netFERC order – MISO charges2007 Core Earnings per Share (non-GAAP)Missouri 2007 rate cases (margin and expense)Other electric and gas marginsWeather (estimate)Fuel pricesCallaway refueling and maintenance outagePlant operations and maintenanceDistribution system reliabilityOther labor and employee benefitsBad debt expensesDepreciation and amortizationDilution and financing, netOther taxesOther, net2008 Core EPS Guidance Range (non-GAAP)Illinois electric rate relief settlementCoal contract settlement – 2009 impactMO storm accounting order2008 GAAP EPS Guidance Range
2008 Earnings Guidance(Issued and effective as of August 1, 2008)
$2.980.090.210.06
$3.340.090.83
(0.06) (0.40)0.06
(0.17)(0.25)(0.04)(0.05)(0.06)(0.12)(0.04)(0.13)
$2.80 – $3.20(0.12)0.080.04
$2.80 – $3.20

investing for our future.22
(a) Excluded from 2008 core (non-GAAP) earnings guidance is an estimated 12 cents per share negative impact of the Illinois comprehensive electric rate relief and customer assistance settlement agreement, an 8 cents per share benefit from the coal contract settlement related to expected 2009 costs, a 4 cents per share positive impact of a Missouri Public Service Commission accounting order associated with 2007 storm costs and net mark-to market gains or losses from nonqualifying hedges.
2008 Core EPS Segment Guidance(Issued and effective as of August 1, 2008)
Expected Segment Contribution to Earnings per ShareMissouri Regulated $1.20 – $1.30Illinois Regulated 0.30 – 0.40Non-Rate-Regulated Generation 1.30 – 1.502008 Core EPS Guidance Range (Non-GAAP)(a) $2.80 – $3.20

investing for our future.23
Q1 Q2 Q3 Q4
2008 Illinois Electric Rate Redesign
● Illinois electric rate redesign will result in quarterly changes in earnings per share, but no annual change
5¢
10¢
5¢

investing for our future.24
Financial Objectives(Issued and effective as of January 17, 2008)
● Targeting 4% to 6% average non-GAAP EPS growth from normalized 2007 base to 2010• Driven primarily by regulated business growth• Goal of ~$4 per share by 2011 and higher in 2012
● Overall percentage of earnings contribution by regulated businesssegments forecasted to increase and approximate current annual dividend by the end of 2010
● Focused on providing a strong, sustainable dividend• Current yield of ~6%• Cash flows do not support near-term change• Focus on future dividend growth
● Targeting long-term total annual shareholder return of ~10%
Bottom line: strong underlying valueStraight-forward strategy to deliver value

investing for our future.25
Reference

investing for our future.26
Ameren Calendar
IllinoisFinal delivery service order issued September 2008
Missouri Rebuttal testimony filed by all parties October 14, 2008Surrebuttal testimony filed by all parties November 5, 2008 Hearings November 17-25 &
December 1-5, 2008Briefs January 8, 2009Rate order issued February 2009New rates effective March 2009
Investor RelationsMerrill Lynch Conference September 24, 2008Q3 2008 quiet period Begins October 7, 2008Q3 2008 earnings release and call October 31, 2008 (tentative)EEI Financial Conference November 9-11, 2008Analyst Day December 2008 or January 2009

investing for our future.27
Major Regulatory Proceedings
IllinoisWeb site www.icc.illinois.gov/e-docketCase # 07-0527
– Interim procurement planCase # 07-0585, 07-0586, 07-0587
– Electric delivery services rate casesCase # 07-0588, 07-0589, 07-0590
– Gas delivery services rate casesMissouriWeb site www.efis.psc.mo.gov/mpsc/DocketSheet.htmlCase # ER-2008-0318
– Electric rate case

investing for our future.28
Investor Relations Contacts● Bruce Steinke 314-554-2574
• Vice President & Controller [email protected]
● Doug Fischer 314-554-4859• Director, Investor Relations [email protected]