
Ameren Illinois Energy Efficiency Market Potential Assessment · 2020-03-05 · Ameren Illinois...
276
Ameren Illinois Energy Efficiency Market Potential Assessment Report Number 1404 Volume 2: Market Research EnerNOC Utility Solutions Consulting 500 Ygnacio Valley Road Suite 450 Walnut Creek, CA 94596 925.482.2000 www.enernoc.com Prepared for: Ameren Illinois June 10, 2013
Transcript of Ameren Illinois Energy Efficiency Market Potential Assessment · 2020-03-05 · Ameren Illinois...
Ameren Illinois Energy Efficiency Market Potential Assessment Report Number 1404
Volume 2: Market Research
EnerNOC Utility Solutions Consulting
500 Ygnacio Valley Road Suite 450
Walnut Creek, CA 94596 925.482.2000
www.enernoc.com
Prepared for: Ameren Illinois
June 10, 2013

EnerNOC Utility Solutions Consulting iii
This report was prepared by
EnerNOC Utility Solutions Consulting 500 Ygnacio Valley Blvd., Suite 450
Walnut Creek, CA 94596
I. Rohmund, Project Director B. Kester, Project Manager
Subcontractor YouGov|Definitive Insights
Washington University in St. Louis
In cooperation with Applied Energy Group


EnerNOC Utility Solutions Consulting v
CONTENTS
CONTENTS
1 INTRODUCTION .................................................................................................... 1-1
Background ................................................................................................................... 1-1
Objectives ..................................................................................................................... 1-1
Report Organization ....................................................................................................... 1-2
2 RESIDENTIAL METHODOLOGY ............................................................................. 2-1
Sample Design ............................................................................................................... 2-1
Questionnaires ............................................................................................................... 2-2
Data Analysis ................................................................................................................. 2-2
Estimating Take Rates ........................................................................................ 2-2 Testing Programs at Different Payback Levels ...................................................... 2-4 Weighting 2-4 Psychographic Segmentation Analysis ................................................................. 2-4
3 RESIDENTIAL PROGRAM INTEREST SURVEY RESULTS ....................................... 3-1
Summary: Overall Response to EE Programs by Ameren Illinois Customers ....................... 3-7
4 UNDERSTANDING RESIDENTIAL CUSTOMER PERSPECTIVES ON ENERGY ISSUES4-1
Understanding Overall Customer Opinions of Ameren Illinois ............................................ 4-1
Understanding Customer Perspectives on Energy Issues ................................................... 4-3
Exploring Customer Segments ........................................................................................ 4-4
Base Segment Descriptions ............................................................................................. 4-5
Practical Idealists (30%)..................................................................................... 4-5 Cost-Focused Conservers (15%) ......................................................................... 4-5 Willing, But Uninformed (15%) ........................................................................... 4-5 Willing, But Challenged (15%) ............................................................................ 4-6 Comfort Focused (10%) ..................................................................................... 4-6 Low Interest, Little Action (16%) ........................................................................ 4-6
Segment Marketing ........................................................................................................ 4-7
Residential Segments – At a Glance .............................................................................. 4-10
5 RESIDENTIAL SATURATION SURVEY RESULTS .................................................... 5-1
Household Demographics ............................................................................................... 5-1
Age and Size of Home ........................................................................................ 5-1 Individuals Home During the Weekday ................................................................ 5-2
Household Equipment and Appliances ............................................................................. 5-3
Heating, Cooling and Water Heating .................................................................... 5-3 Appliances ......................................................................................................... 5-5 Lighting 5-6 Electronics ......................................................................................................... 5-6
vi www.enernoc.com
Energy Actions ............................................................................................................... 5-7
Home Improvements.......................................................................................... 5-7 Program Awareness and Participation .................................................................. 5-8
6 C&I METHODOLOGY ............................................................................................. 6-1
Sample Design ............................................................................................................... 6-1
Questionnaires ............................................................................................................... 6-1
Data Analysis ................................................................................................................. 6-2
Estimating Take Rates ........................................................................................ 6-2 Testing Programs at Different Payback Levels ...................................................... 6-3 Weighting 6-4 Psychographic Segmentation Analysis ................................................................. 6-4
7 C&I PROGRAM INTEREST SURVEY RESULTS ....................................................... 7-1
Summary: Overall Response to EE Programs by Ameren Illinois Customers ....................... 7-7
8 UNDERSTANDING BUSINESS CUSTOMER PERSPECTIVES ON ENERGY ISSUES .. 8-1
Understanding Overall Customer Opinions of Ameren Illinois ............................................ 8-1
Exploring Customer Segments ........................................................................................ 8-2
Base Segment Descriptions ............................................................................................. 8-3
Practical Idealists (21%)..................................................................................... 8-3 Cost-Focused Conservers (6%) ........................................................................... 8-3 Willing, But Unmotivated (21%) .......................................................................... 8-4 Cost-Focused Skeptics (15%) ............................................................................. 8-4 Willing, But Uninformed (14%) ........................................................................... 8-4 Low Interest, Little Action (23%) ........................................................................ 8-4
Segment Marketing ........................................................................................................ 8-5
Business Segments – At a Glance .................................................................................... 8-8
9 C&I SATURATION SURVEY RESULTS .................................................................... 9-1
Building Characteristics................................................................................................... 9-1
Size and Age of Segment Floor Space ................................................................. 9-1
Building Equipment ........................................................................................................ 9-2
Heating and Cooling ........................................................................................... 9-2 Water Heating ................................................................................................... 9-4 Lighting 9-6 Energy Efficiency Measures................................................................................. 9-7
10 COMPARISON TO 2009 STUDY ........................................................................... 10-1
Residential Sector ........................................................................................................ 10-1
Commercial Sector ....................................................................................................... 10-5
Industrial Sector .......................................................................................................... 10-8
A RESIDENTIAL SAMPLE DESIGN ............................................................................ A-1
B BUSINESS SAMPLE DESIGN.................................................................................. B-4
C RESIDENTIAL PROGRAM INTEREST SURVEY QUESTIONNAIRE .......................... C-1
D RESIDENTIAL SATURATION SURVEY QUESTIONNAIRE ...................................... D-1

EnerNOC Utility Solutions Consulting vii
E BUSINESS PROGRAM INTEREST SURVEY QUESTIONNAIRE ................................ E-1
F BUSINESS SATURATION SURVEY QUESTIONNAIRE ............................................. F-1

Copyright © 2013 EnerNOC, Inc. ix
CONTENTS
LIST OF FIGURES
Figure 3-1 Maximum and Minimum Take Rates for Residential Customers ................................ 3-1
Figure 3-2 Measures for Purchasing / Installing Energy Efficient Equipment* ............................ 3-2
Figure 3-3 Measures for Improving Energy Efficiency of Existing Systems ................................. 3-2
Figure 3-4 Measures Not Requiring an Investment by the Customer (and not involving a payback
period) ................................................................................................................. 3-3
Figure 3-5 Likely Takers by Demographic Differences .............................................................. 3-5
Figure 3-6 Likely Takers by General Attitudinal Differences (% Top Box, 8-10) ......................... 3-6
Figure 3-7 Likely Takers by Attitudinal Differences about Ameren Illinois .................................. 3-7
Figure 4-1 Overall Ratings of Ameren Illinois (ratings of 8-10 on 10 pt. scale) .......................... 4-1
Figure 4-2 Ratings of Ameren Illinois on EE-Specific Issues (ratings of 8-10 on 10 pt. scale) ..... 4-2
Figure 4-3 Responses to forced choice question on EE / Green vs. Cost Options ....................... 4-2
Figure 4-4 Average importance / agreement for top items in each attitude bundle .................... 4-4
Figure 4-5 Residential Segment Distribution ........................................................................... 4-5
Figure 5-1 Year Home was Built ............................................................................................. 5-1
Figure 5-2 Square Footage of Home ....................................................................................... 5-2
Figure 5-3 Customers with Someone Home All or Most Weekdays ............................................ 5-2
Figure 5-4 Number of Weekdays Spent Working at Home ....................................................... 5-3
Figure 5-5 Type of Primary Cooling by Segment ..................................................................... 5-4
Figure 5-6 Type of Space Heating .......................................................................................... 5-4
Figure 5-7 Water Heating Fuel ............................................................................................... 5-5
Figure 5-8 Appliance Saturation – Single-Family Segment ........................................................ 5-5
Figure 5-9 Type of TV by Segment ......................................................................................... 5-6
Figure 5-10 Home Improvements ............................................................................................ 5-7
Figure 5-11 Awareness of Ameren Illinois Programs .................................................................. 5-8
Figure 5-12 Participation in Ameren Illinois Programs ................................................................ 5-8
Figure 7-1 Maximum and Minimum Take Rates for Business Customers ................................... 7-1
Figure 7-2 Measures for Purchasing / Installing Energy Efficient Equipment* ............................ 7-2
Figure 7-3 Measures for Improving Energy Efficiency of Existing Systems ................................. 7-3
Figure 7-4 Likely Takers by Demographics .............................................................................. 7-5
Figure 7-5 Likely Takers by General Attitudinal Differences (% Top Box, 8-10) ......................... 7-6
Figure 7-6 Likely Takers by Attitudinal Differences about Ameren Illinois .................................. 7-7
Figure 8-1 Overall Ratings of Ameren Illinois (ratings of 8-10 on 10 pt. scale) .......................... 8-1
Figure 8-2 Ratings of Ameren Illinois on EE-Specific Issues (ratings of 8-10 on 10 pt. scale) ..... 8-2
Figure 8-3 Responses to forced choice question on EE / Green vs. Cost Options ....................... 8-2
Figure 8-4 Business Segment Distribution ............................................................................... 8-3
Figure 9-1 Total Square Footage by Segment ......................................................................... 9-1
Figure 9-2 Age of Floorspace by Segment .............................................................................. 9-2
Figure 9-3 Percent of Floor Space Heated and Cooled by Segment ........................................... 9-2
Figure 9-4 Type of Primary Cooling Equipment by Segment ..................................................... 9-3
x www.enernoc.com
Figure 9-5 Type of Primary Space Heating Equipment and Fuel ............................................... 9-4
Figure 9-6 Type of Water Heating .......................................................................................... 9-5
Figure 10-1 Electric Residential Market Segmentation by Housing Type – % of Energy Use ....... 10-1
Figure 10-2 Natural Gas Residential Market Segmentation by Housing Type – % of Energy Use 10-1
Figure 10-3 Residential Electricity Use by End Use (2011), All Homes ....................................... 10-2
Figure 10-4 Residential Natural Gas Use by End Use (2011), All Homes ................................... 10-2
Figure 10-5 Age of the home ................................................................................................. 10-3
Figure 10-6 Distribution of Cooling Technologies .................................................................... 10-3
Figure 10-7 Distribution of Heating Technologies .................................................................... 10-4
Figure 10-8 Distribution of Water Heating Fuel ....................................................................... 10-4
Figure 10-9 Saturation of Appliances and Miscellaneous .......................................................... 10-5
Figure 10-10 Saturation of Electronics ...................................................................................... 10-5
Figure 10-11 Commercial Market Segmentation by Building Type – Percent of Electricity Use ...... 10-6
Figure 10-12 Commercial Market Segmentation by Building Type – Percent of Natural Gas Use ... 10-6
Figure 10-13 Commercial Electricity Use by End Use (2011), All Buildings .................................. 10-6
Figure 10-14 Commercial Natural Gas Use by End Use (2011), All Buildings ............................... 10-7
Figure 10-15 Types of Commercial Heating Equipment ............................................................. 10-7
Figure 10-16 Types of Commercial Cooling Equipment .............................................................. 10-8
Figure 10-17 Industrial Market Segmentation – Percentage of Electricity Use ............................. 10-8
Figure 10-18 Industrial Market Segmentation – Percentage of Natural Gas Use .......................... 10-9
Figure 10-19 Industrial Electricity Use by End Use (2009, 2011), All Industries ........................... 10-9
Figure 10-20 Industrial Natural Gas Use by End Use (2009, 2011), All Industries ........................ 10-9
Copyright © 2013 EnerNOC, Inc. xi
LIST OF TABLES
Table 2-1 Translating Stated Intent into Take Rates for Irregular Purchases ............................ 2-3
Table 2-2 Translating Stated Intent into Take Rates for REGULAR Purchases .......................... 2-4
Table 3-1 Opportunities for Measures, High to Low ................................................................ 3-4
Table 4-1 Segment Marketing ............................................................................................... 4-7
Table 4-2 Segment Prioritization ......................................................................................... 4-10
Table 4-3 Likely Takers given a 3 year payback period ......................................................... 4-11
Table 5-1 Average Number of Light Bulbs by Segment and Type ............................................ 5-6
Table 6-1 Translating Stated Intent into Take Rates for Irregular Purchases ............................ 6-3
Table 7-1 Opportunities for Measures, High to Low ................................................................ 7-4
Table 8-1 Segment Marketing ............................................................................................... 8-5
Table 8-2 Segment Prioritization ........................................................................................... 8-8
Table 8-3 Likely Takers given a 3 year payback period ........................................................... 8-9
Table 9-1 Primary Cooling Equipment by Segment ................................................................. 9-3
Table 9-2 Primary Space Heating Equipment by Segment ....................................................... 9-4
Table 9-3 Water Heating by Segment.................................................................................... 9-5
Table 9-4 Average Number of Lamps by Type– All Indoor ...................................................... 9-6
Table 9-5 Indoor Fluorescent Tubes by Type ......................................................................... 9-6
Table 9-6 Average Percent of Hours Lamps are On– All Indoor ............................................... 9-7
Table 9-7 HVAC Measures Implemented in Last 3 years ......................................................... 9-7
Table 9-8 Water Heating Measures Implemented in Last 3 years ............................................ 9-8
Table 9-9 Lighting Measures Implemented in Last 3 years ...................................................... 9-8
Table 9-10 Building Structure Measures Implemented in Last 3 years ....................................... 9-9
Table 9-11 Equipment Upgrades Implemented in Last 3 years .................................................. 9-9

Copyright © 2013 EnerNOC, Inc. 1-1
CHAPTER 1
INTRODUCTION
Background Ameren Illinois contracted with EnerNOC to conduct an electricity and natural gas Energy Efficiency (EE) Market Potential study covering the period of performance from June 1, 2014 through May 31,
2017 to aid the development of a three-year plan for programs implemented by Ameren Illinois in
Cycle 3. In addition, the analysis also included the period of performance from June 1, 2017 through May 31, 2024 to aid in benchmarking and other tasks related to future analyses. This study identifies
the potential to achieve the kWh and therm annual load reduction targets within the rated caps identified in Sections 8-103 and 8-104 of the Illinois Public Utilities Act. In addition, the electric
component of the study identifies the potential to achieve additional kWh savings per Section 5/16 -
111.5Bnew of the Act absent rate cap limitations. This comprehensive study includes primary market research, a full demand side management (DSM) potential analysis for electricity and natural gas,
energy efficiency program design, supply curve development, and analysis of wasted energy.
EnerNOC teamed with YouGov|Definitive Insights and Washington University in St. Louis to perform
saturation surveys and program-interest research with Ameren Illinois customers. The EnerNOC team worked in collaboration with Applied Energy Group who, under separate contract with Ameren
Illinois, performed the program analysis. This report represents the combined effort of these four
organizations. This volume focuses on the results of the primary market research conducted with
YouGov|Definitive Insights.
Objectives Ameren Illinois is investigating the market potential for a wide variety of Demand Side Management (DSM) options by completing a comprehensive DSM Study which consists of three primary
components: market research, a full DSM potential analysis, and quantification of wasted
energy due to customer behavior. The market research component has collected electricity and
natural gas end-use data, end-use saturation data, customer demographics and psychographic
information that will provide insight on how Ameren Illinois customers make decisions related to
electric and natural gas usage and energy efficiency investment decisions. This report describes the
outcomes of that market research effort.
Broad questions embedded in this phase of this research that will help Ameren Illinois better
understand energy-efficiency potential include:
• How likely are customers to participate in various electric- or natural gas-related energy
efficiency programs Ameren Illinois is considering offering?
• Which of these energy efficiency measures offer the highest likely participation rates?
• How does likelihood to participate differ by payback period for customers?
• What overall demographic/firmographic and psychographic characteristics correspond to a higher
likelihood to participate in energy efficiency programs?
• What segments can be derived within each sector, and how do these segments differ in terms of their impact on the likelihood to participate, as well as on customer demographic/firmographic
and psychographic characteristics?
• Which of these segments represent the best opportunities for Ameren Illinois to focus their
marketing on?
• What messaging strategies would likely be useful to help foster participation among these high
opportunity segments?
Introduction
1-2 www.enernoc.com
Report Organization This report is presented in 6 volumes as outlined below. This document is Volume 2: Market
Research Report.
• Volume 1, Executive Summary
• Volume 2, Market Research Report
• Volume 3, Energy Efficiency Potential Analysis
• Volume 4, Program Analysis
• Volume 5, Supply Curves
• Volume 6, EE Potential Analysis Appendices
Copyright © 2013 EnerNOC, Inc. 2-1
CHAPTER 2
RESIDENTIAL METHODOLOGY
This section covers sample design, questionnaire development and data analysis for the residential
sector.
Sample Design Ameren Illinois provided the EnerNOC team with billing data for all residential and business
customers. This customer data included a variety of information for each customer, including name, address, annual kWh usage, annual therm usage, division, account number, etc. The EnerNOC team
created a sample design with 48 separate sample cells – against which survey responses were targeted and monitored, and which took into account gas usage, electric usage and region / climate
zone – which was implemented separately and independently for each of the two surveys (the
Program Interest survey and the Saturation survey).
The EnerNOC team generated a total of approximately 42,000 randomly selected households
distributed across six separate and independent sample tranches (three per survey) . In total, postcard invitations were mailed to the households included in sample tranches one and two for the
Program Interest survey and tranches one and two for the Saturation survey (with approximately 13,000 postcards mailed for each of the two surveys). Postcards invited respondents to go online
and complete the survey. Customers were offered a $10 check for completing the survey. Although
the team prepared for three tranches, the sample targets were hit with tranche 2 respondents.
In order to qualify to complete the survey, respondents had to meet the following criteria:
• Must have primary or shared responsibility for making energy-related decisions
• Must be at least 18 years old
• Must not work for a gas or electric utility company and must not have a household member that
works for a gas or electric utility company
• Must be billed for electricity or natural gas directly by Ameren Illinois
A total of 749 Ameren Illinois Residential customers completed the Program Interest survey, while
726 completed the Saturation survey.
• Approximately 88% of those who attempted to complete the survey qualified based on applying
the criteria above.
• The overall net response rate was approximately 8%
• Approximately 14% of those who started the surveys abandoned them before completing the
survey.
• Average online survey length was about 25-30 minutes depending on the survey
Residential Methodology
2-2 www.enernoc.com
Questionnaires The Program Interest questionnaire was designed to cover multiple content areas, including:
1. Screening questions
2. Description of major end uses in the household
3. Attitudes toward Ameren Illinois
4. Attitudes toward using energy
5. Energy efficiency measures implemented to-date (with a focus on lighting)
6. Attitudes toward appliance purchasing
7. Interest in potential EE programs that could be offered by Ameren Illinois
8. Attitudes toward shopping
9. Demographics
The Saturation questionnaire was designed to cover multiple content areas, including:
1. Screening questions
2. Description of household structure (including windows)
3. Description of heating and cooling equipment
4. Description of lighting (bulbs and fixtures / interior and exterior)
5. Description of major appliances
6. Description of energy related actions
7. Awareness of EE-related energy programs
8. Demographics
Data Analysis
Estimating Take Rates
Market researchers have long recognized that customers tend to over-estimate their likelihood to
participate in new programs and services within the context of a market research study:
• This means that it has been long recognized that some customers who say that they would be
“certain” to participate in a given program in a survey would, in reality, not participate
• This is often referred to as the “say-do” problem; the problem that survey respondents are
typically more likely to say they would do something than actually end up doing it
• The analytic challenge, as a result, is to appropriately adjust stated likelihood-to-participate
ratings into more realistic estimates of likely customer response
• Different options are available for making these adjustments, and the best option depends in
part on the nature of the product, service, or program being evaluated. For example, reactions to
socially desirable (including “green”) options need to be adjusted down more aggressively, while
those for certain new technologies need to be adjusted less.
• The method used by the YGDI / EnerNOC team is based on proprietary research conducted by
YGDI during 2010. This research captured stated likelihood to adopt / purchase a variety of new products / services, at one point in time, and then tracked actual product / service adoption /
Residential Methodology
EnerNOC Utility Solutions Consulting 2-3
purchase over 6 -12 months. As we expected, people were less likely to actually purchase
products / services than they estimated they would at an earlier point in time1.
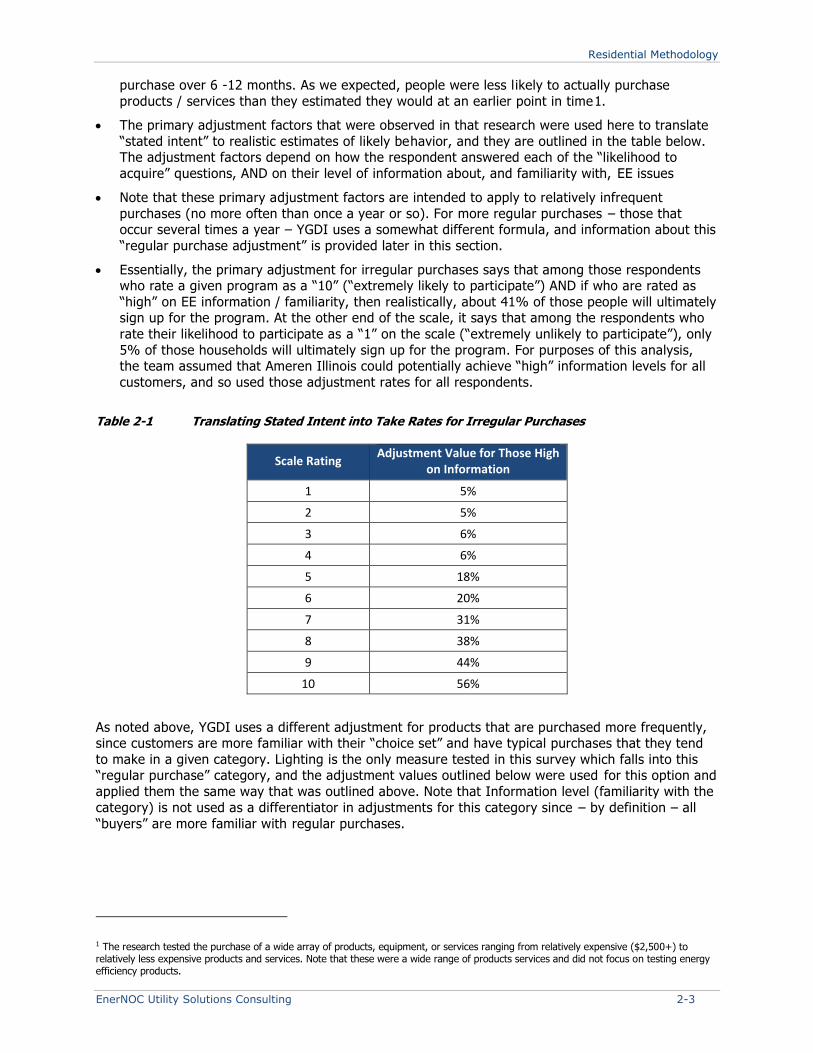
• The primary adjustment factors that were observed in that research were used here to translate
“stated intent” to realistic estimates of likely behavior, and they are outlined in the table below. The adjustment factors depend on how the respondent answered each of the “likelihood to
acquire” questions, AND on their level of information about, and familiarity with, EE issues
• Note that these primary adjustment factors are intended to apply to relatively infrequent
purchases (no more often than once a year or so). For more regular purchases – those that occur several times a year – YGDI uses a somewhat different formula, and information about this
“regular purchase adjustment” is provided later in this section.
• Essentially, the primary adjustment for irregular purchases says that among those respondents who rate a given program as a “10” (“extremely likely to participate”) AND if who are rated as
“high” on EE information / familiarity, then realistically, about 41% of those people will ultimately sign up for the program. At the other end of the scale, it says that among the respondents who
rate their likelihood to participate as a “1” on the scale (“extremely unlikely to participate”), only
5% of those households will ultimately sign up for the program. For purposes of this analysis, the team assumed that Ameren Illinois could potentially achieve “high” information levels for all
customers, and so used those adjustment rates for all respondents.
Table 2-1 Translating Stated Intent into Take Rates for Irregular Purchases
Scale Rating Adjustment Value for Those High
on Information
1 5%
2 5%
3 6%
4 6%
5 18%
6 20%
7 31%
8 38%
9 44%
10 56%
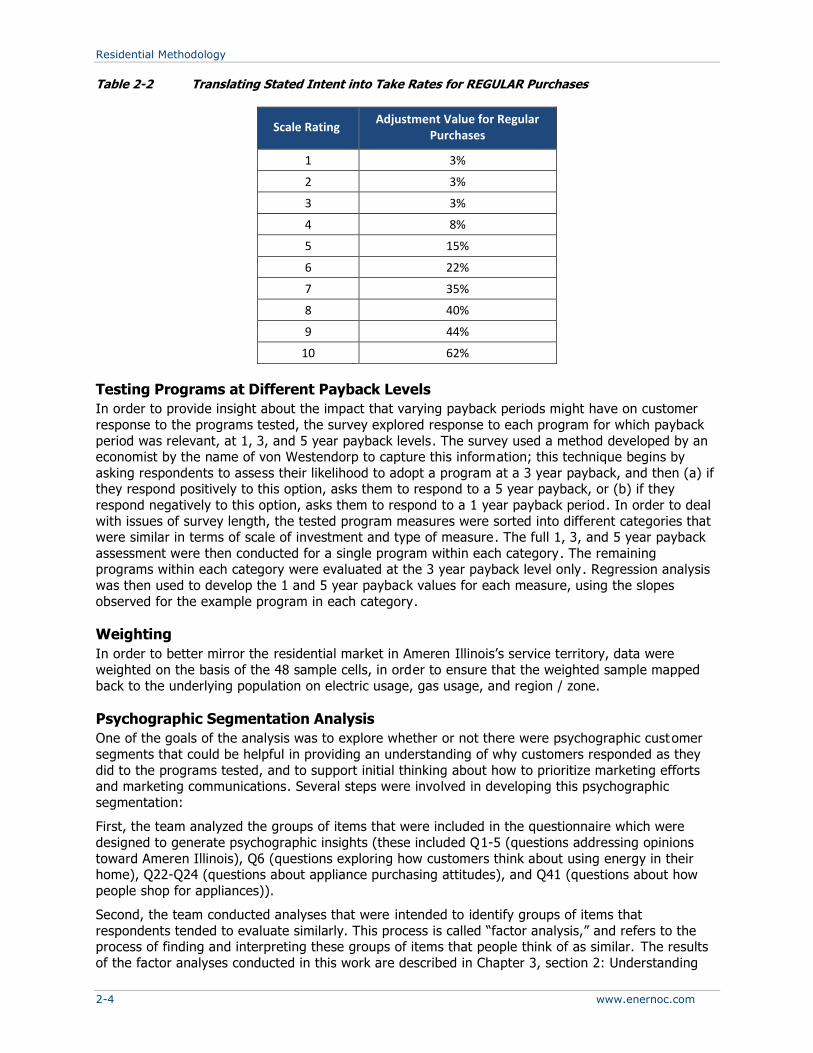
As noted above, YGDI uses a different adjustment for products that are purchased more frequently, since customers are more familiar with their “choice set” and have typical purchases that they tend
to make in a given category. Lighting is the only measure tested in this survey which falls into this “regular purchase” category, and the adjustment values outlined below were used for this option and
applied them the same way that was outlined above. Note that Information level (familiarity with the
category) is not used as a differentiator in adjustments for this category since – by definition – all
“buyers” are more familiar with regular purchases.
1 The research tested the purchase of a wide array of products, equipment, or services ranging from relatively expensive ($2,500+) to relatively less expensive products and services. Note that these were a wide range of products services and did not focus on testing energy efficiency products.
Residential Methodology
2-4 www.enernoc.com
Table 2-2 Translating Stated Intent into Take Rates for REGULAR Purchases
Scale Rating Adjustment Value for Regular
Purchases
1 3%
2 3%
3 3%
4 8%
5 15%
6 22%
7 35%
8 40%
9 44%
10 62%
Testing Programs at Different Payback Levels
In order to provide insight about the impact that varying payback periods might have on customer
response to the programs tested, the survey explored response to each program for which payback
period was relevant, at 1, 3, and 5 year payback levels. The survey used a method developed by an economist by the name of von Westendorp to capture this information; this technique begins by
asking respondents to assess their likelihood to adopt a program at a 3 year payback, and then (a) if they respond positively to this option, asks them to respond to a 5 year payback, or (b) if they
respond negatively to this option, asks them to respond to a 1 year payback period. In order to deal
with issues of survey length, the tested program measures were sorted into different categories that were similar in terms of scale of investment and type of measure. The full 1, 3, and 5 year payback
assessment were then conducted for a single program within each category. The remaining programs within each category were evaluated at the 3 year payback level only . Regression analysis
was then used to develop the 1 and 5 year payback values for each measure, using the slopes
observed for the example program in each category.
Weighting
In order to better mirror the residential market in Ameren Illinois’s service territory, data were
weighted on the basis of the 48 sample cells, in order to ensure that the weighted sample mapped
back to the underlying population on electric usage, gas usage, and region / zone.
Psychographic Segmentation Analysis
One of the goals of the analysis was to explore whether or not there were psychographic cust omer
segments that could be helpful in providing an understanding of why customers responded as they
did to the programs tested, and to support initial thinking about how to prioritize marketing efforts and marketing communications. Several steps were involved in developing this psychographic
segmentation:
First, the team analyzed the groups of items that were included in the questionnaire which were
designed to generate psychographic insights (these included Q1-5 (questions addressing opinions
toward Ameren Illinois), Q6 (questions exploring how customers think about using energy in their home), Q22-Q24 (questions about appliance purchasing attitudes), and Q41 (questions about how
people shop for appliances)).
Second, the team conducted analyses that were intended to identify groups of items that
respondents tended to evaluate similarly. This process is called “factor analysis,” and refers to the process of finding and interpreting these groups of items that people think of as similar. The results
of the factor analyses conducted in this work are described in Chapter 3, section 2: Understanding

Residential Methodology
EnerNOC Utility Solutions Consulting 2-5
Customer Perspectives on Energy Issues in which we outline the six separate attitude bundles that
appeared to best describe the way that residential customers think about energy issues.
Third, the team considered all of the attitudinal factors that were identified in step two, along with a variety of other variables to find the ones that generated the most useful segmentation model. This
was partly a trial and error process, but ultimately, the variables selected to be included in the
segmentation model included:
• Overall satisfaction with Ameren Illinois (Q3)
• Overall importance rating given to the question of how important they believe it is for Ameren Illinois to actively encourage its customers to participate in energy saving, and cost saving
programs (Q4-1)
• Agreement / disagreement with the item “You are very concerned about the environmental effect
of electric power plants” (Q6-5)
• Agreement / disagreement with the item “Conserving energy at your home will make no
difference to the quality of the environment overall” (Q6-6)
• Agreement / disagreement with the item “You would do more to make your home more energy
efficient, but you don’t know where to start” (Q6-7)
• Agreement / disagreement with the item “It’s worth spending more money to get the highest
quality product available” (Q24-6)
• A calculated variable that was called “EE Informed Level” and was based on indicators of
experience with / awareness of EE end use options to-date, and awareness and use of existing
Ameren EE programs
• A calculated variable that was called “Likely Taker Level” and was based on a count of the
frequency that a given respondent rated themselves as “8” or higher on the “1” to “10” likelihood
to participate scale for each of the 25 EE programs tested
Once these inputs were identified, the team tested a wide variety of segmentation solutions, ultimately selecting a solution that optimized relative segment size, absolute segment sample size,
and overall meaningfulness of segment profiles. The solution selected as most appropriate was a
solution containing 6 segments with different response patterns to the final set of selected
segmentation inputs.


Copyright © 2013 EnerNOC, Inc. 3-1
CHAPTER 3
RESIDENTIAL PROGRAM INTEREST SURVEY RESULTS
Note that the “take rates” that are reported in this chapter have been adjusted using the say / do
adjustment model referenced in Chapter 2. As such, they represent the team’s best estimate of the
most likely proportion of customers who would actively sign up for each program, given that they
were eligible to do so, and were fully aware of the program and its potential benefits for them.
The range of take rates across the full range of programs / measures tested spans from a low of around one-fifth of all eligible customers to a high of just under one-half of all eligible customers
(Figure 3-1).
Figure 3-1 Maximum and Minimum Take Rates for Residential Customers
The first full category of EE measures that were explored considered the idea of purchasing higher
than standard efficiency appliances within the context of a normal replacement cycle. As shown in Figure 3-2, within the ten appliances or end uses considered, refrigerators and light bulbs were the
technologies that residential customers are estimated to be the most likely to upgrade to an EE
option at each payback period level (for light bulbs, this is largely due to the use of the “regular purchase” adjustment for this product category). Across the other technologies, the take rates don’t
differ greatly (ranging from a high of 41% to a low of 32% at a one year payback level). As
expected, take rates are higher for lower payback periods.
Residential Program Interest Survey Results
3-2 www.enernoc.com
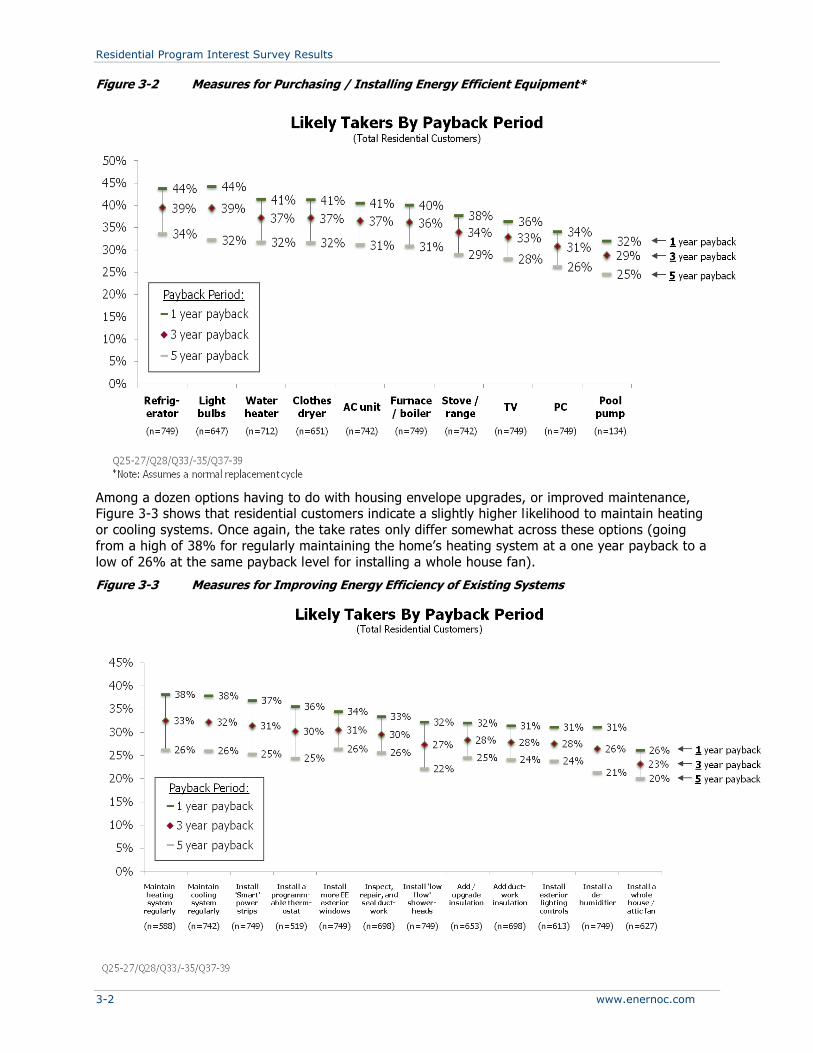
Figure 3-2 Measures for Purchasing / Installing Energy Efficient Equipment*
Among a dozen options having to do with housing envelope upgrades, or improved maintenance, Figure 3-3 shows that residential customers indicate a slightly higher l ikelihood to maintain heating
or cooling systems. Once again, the take rates only differ somewhat across these options (going
from a high of 38% for regularly maintaining the home’s heating system at a one year payback to a
low of 26% at the same payback level for installing a whole house fan).
Figure 3-3 Measures for Improving Energy Efficiency of Existing Systems
Residential Program Interest Survey Results
EnerNOC Utility Solutions Consulting 3-3
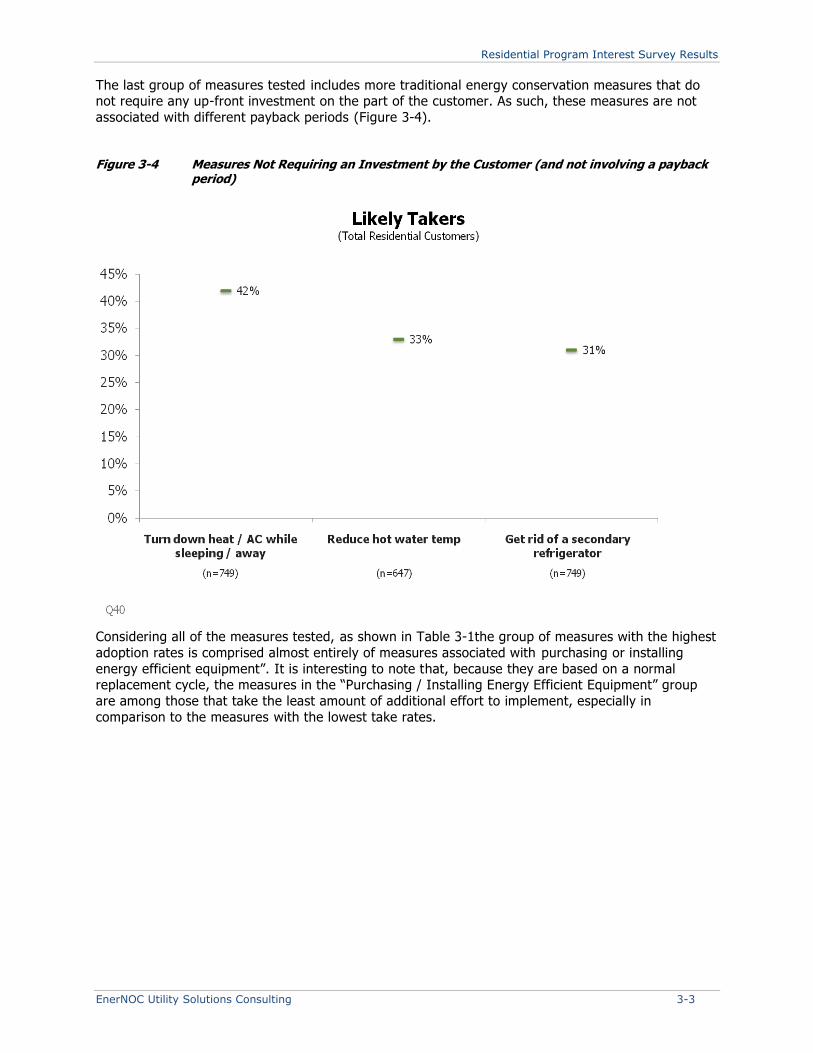
The last group of measures tested includes more traditional energy conservation measures that do not require any up-front investment on the part of the customer. As such, these measures are not
associated with different payback periods (Figure 3-4).
Figure 3-4 Measures Not Requiring an Investment by the Customer (and not involving a payback period)
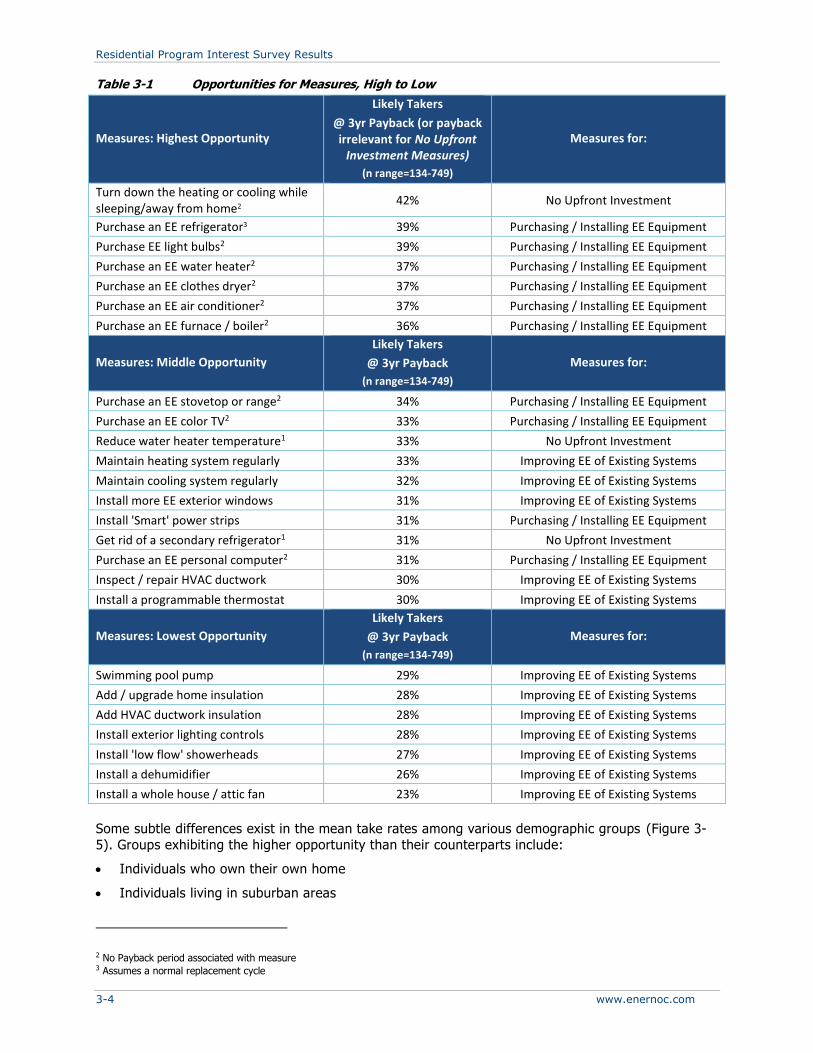
Considering all of the measures tested, as shown in Table 3-1the group of measures with the highest
adoption rates is comprised almost entirely of measures associated with purchasing or installing
energy efficient equipment”. It is interesting to note that, because they are based on a normal replacement cycle, the measures in the “Purchasing / Installing Energy Efficient Equipment” group
are among those that take the least amount of additional effort to implement, especially in
comparison to the measures with the lowest take rates.
Residential Program Interest Survey Results
3-4 www.enernoc.com
Table 3-1 Opportunities for Measures, High to Low
Measures: Highest Opportunity
Likely Takers
@ 3yr Payback (or payback irrelevant for No Upfront
Investment Measures)
(n range=134-749)
Measures for:
Turn down the heating or cooling while sleeping/away from home2
42% No Upfront Investment
Purchase an EE refrigerator3 39% Purchasing / Installing EE Equipment
Purchase EE light bulbs2 39% Purchasing / Installing EE Equipment
Purchase an EE water heater2 37% Purchasing / Installing EE Equipment
Purchase an EE clothes dryer2 37% Purchasing / Installing EE Equipment
Purchase an EE air conditioner2 37% Purchasing / Installing EE Equipment
Purchase an EE furnace / boiler2 36% Purchasing / Installing EE Equipment
Measures: Middle Opportunity
Likely Takers
@ 3yr Payback
(n range=134-749)
Measures for:
Purchase an EE stovetop or range2 34% Purchasing / Installing EE Equipment
Purchase an EE color TV2 33% Purchasing / Installing EE Equipment
Reduce water heater temperature1 33% No Upfront Investment
Maintain heating system regularly 33% Improving EE of Existing Systems
Maintain cooling system regularly 32% Improving EE of Existing Systems
Install more EE exterior windows 31% Improving EE of Existing Systems
Install 'Smart' power strips 31% Purchasing / Installing EE Equipment
Get rid of a secondary refrigerator1 31% No Upfront Investment
Purchase an EE personal computer2 31% Purchasing / Installing EE Equipment
Inspect / repair HVAC ductwork 30% Improving EE of Existing Systems
Install a programmable thermostat 30% Improving EE of Existing Systems
Measures: Lowest Opportunity
Likely Takers
@ 3yr Payback
(n range=134-749)
Measures for:
Swimming pool pump 29% Improving EE of Existing Systems
Add / upgrade home insulation 28% Improving EE of Existing Systems
Add HVAC ductwork insulation 28% Improving EE of Existing Systems
Install exterior lighting controls 28% Improving EE of Existing Systems
Install 'low flow' showerheads 27% Improving EE of Existing Systems
Install a dehumidifier 26% Improving EE of Existing Systems
Install a whole house / attic fan 23% Improving EE of Existing Systems
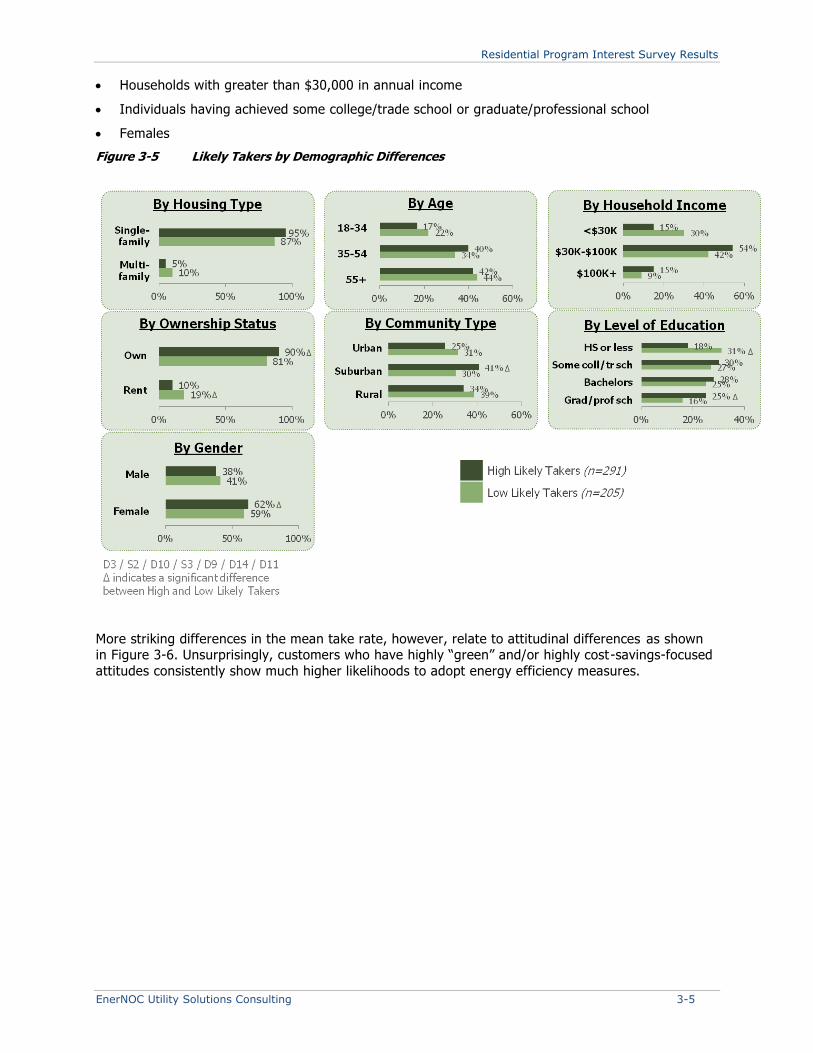
Some subtle differences exist in the mean take rates among various demographic groups (Figure 3-
5). Groups exhibiting the higher opportunity than their counterparts include:
• Individuals who own their own home
• Individuals living in suburban areas
2 No Payback period associated with measure 3 Assumes a normal replacement cycle
Residential Program Interest Survey Results
EnerNOC Utility Solutions Consulting 3-5
• Households with greater than $30,000 in annual income
• Individuals having achieved some college/trade school or graduate/professional school
• Females
Figure 3-5 Likely Takers by Demographic Differences
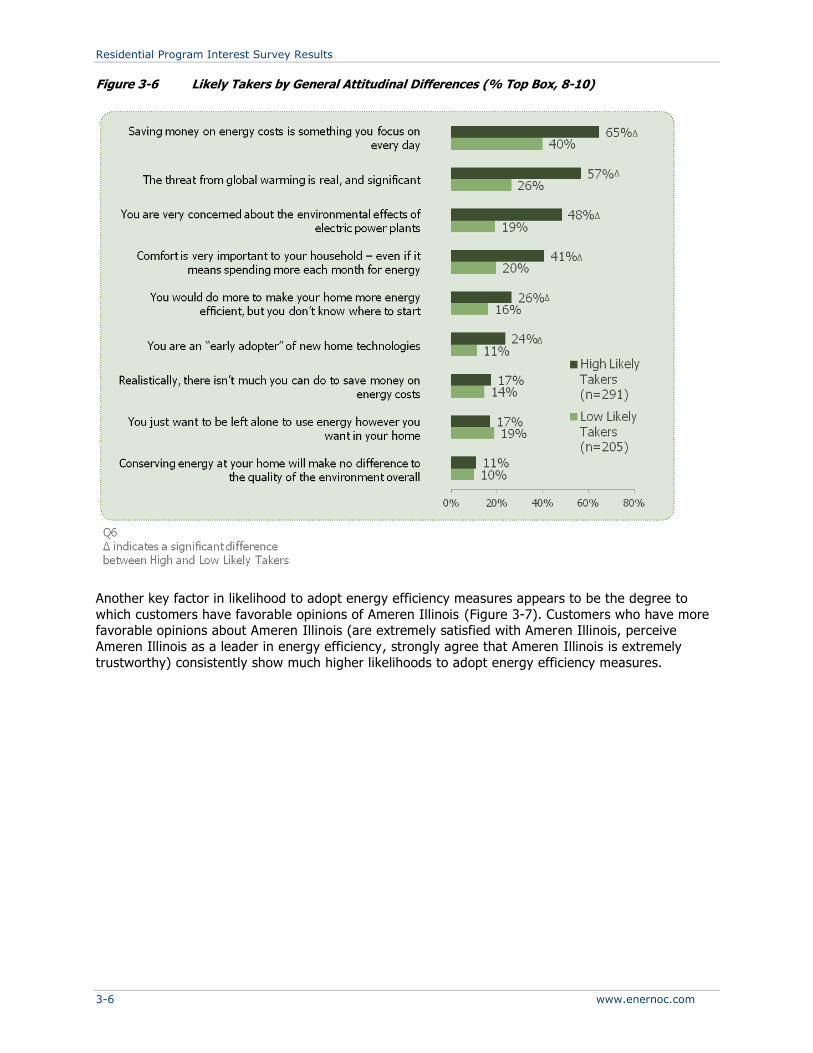
More striking differences in the mean take rate, however, relate to attitudinal differences as shown in Figure 3-6. Unsurprisingly, customers who have highly “green” and/or highly cost -savings-focused
attitudes consistently show much higher likelihoods to adopt energy efficiency measures.
Residential Program Interest Survey Results
3-6 www.enernoc.com
Figure 3-6 Likely Takers by General Attitudinal Differences (% Top Box, 8-10)
Another key factor in likelihood to adopt energy efficiency measures appears to be the degree to
which customers have favorable opinions of Ameren Illinois (Figure 3-7). Customers who have more favorable opinions about Ameren Illinois (are extremely satisfied with Ameren Illinois, perceive
Ameren Illinois as a leader in energy efficiency, strongly agree that Ameren Illinois is extremely
trustworthy) consistently show much higher likelihoods to adopt energy efficiency measures.

Residential Program Interest Survey Results
EnerNOC Utility Solutions Consulting 3-7
Figure 3-7 Likely Takers by Attitudinal Differences about Ameren Illinois
Summary: Overall Response to EE Programs by Ameren Illinois Customers As the preceding pages have suggested, it appears that psychographic factors (attitudes) have a
larger impact on customer response to tested EE programs than do demographic differences. This means that how customers think about Ameren Illinois is likely to be much more important in
predicting how they will respond to new EE programs offered by the company, than will differences
in how they are situated (where they live or how large is their income).
This is important for two reasons:
• It may explain why the overall take rates for Ameren Illinois’s programs are lower than they are
for those observed at many other US utilities.
• It is even more important to understand the impact of customer attitudes by understanding
psychographic segments.
o These segments may identify the confluence of attitudes and concerns that map to
differences in overall reaction to potential Ameren Illinois EE programs.
o In fact, the segmentation analysis reported in the following section focuses on just these
issues, focusing in particular, on the role of customer attitudes and perceptions in
contributing to likely response to EE programs.

Copyright © 2013 EnerNOC, Inc. 4-1
SECTION 4
UNDERSTANDING RESIDENTIAL CUSTOMER PERSPECTIVES ON ENERGY ISSUES
Understanding Overall Customer Opinions of Ameren Illinois In order to understand what lies beneath customer reaction to new EE options that might be offered by Ameren Illinois, it is worth exploring overall customer perspectives, both toward the company,
and toward energy issues as a whole.
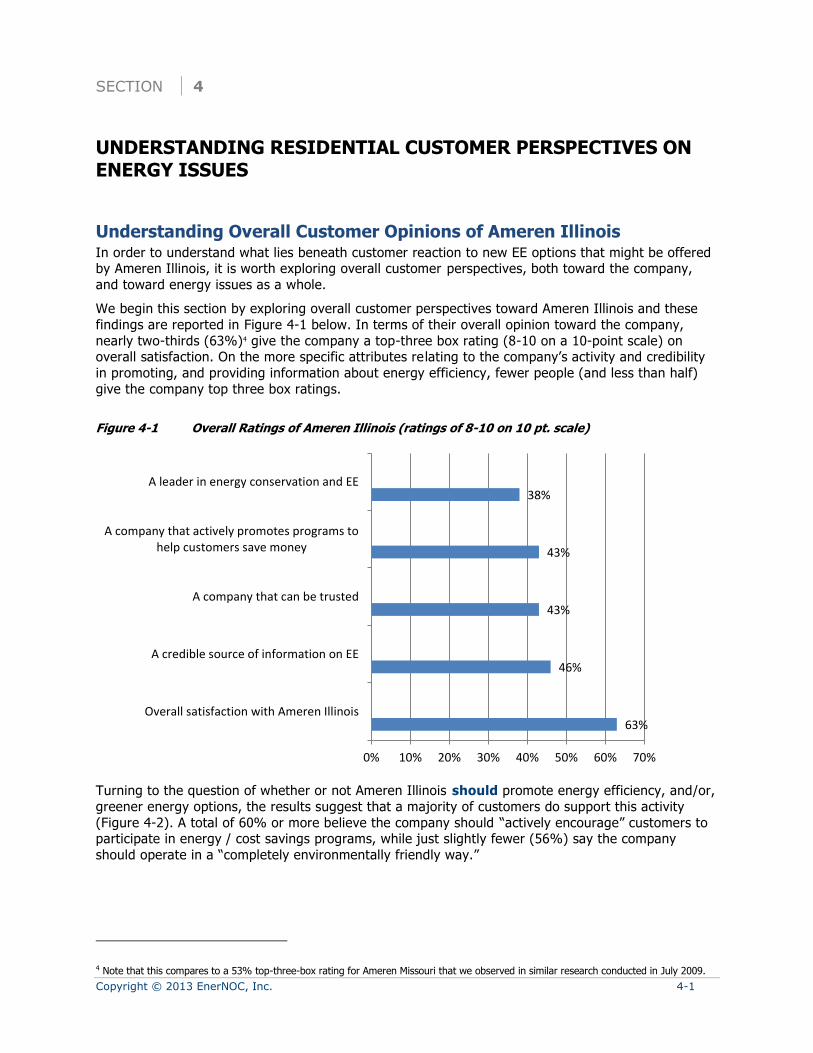
We begin this section by exploring overall customer perspectives toward Ameren Illinois and these
findings are reported in Figure 4-1 below. In terms of their overall opinion toward the company,
nearly two-thirds (63%)4 give the company a top-three box rating (8-10 on a 10-point scale) on overall satisfaction. On the more specific attributes re lating to the company’s activity and credibility
in promoting, and providing information about energy efficiency, fewer people (and less than half)
give the company top three box ratings.
Figure 4-1 Overall Ratings of Ameren Illinois (ratings of 8-10 on 10 pt. scale)
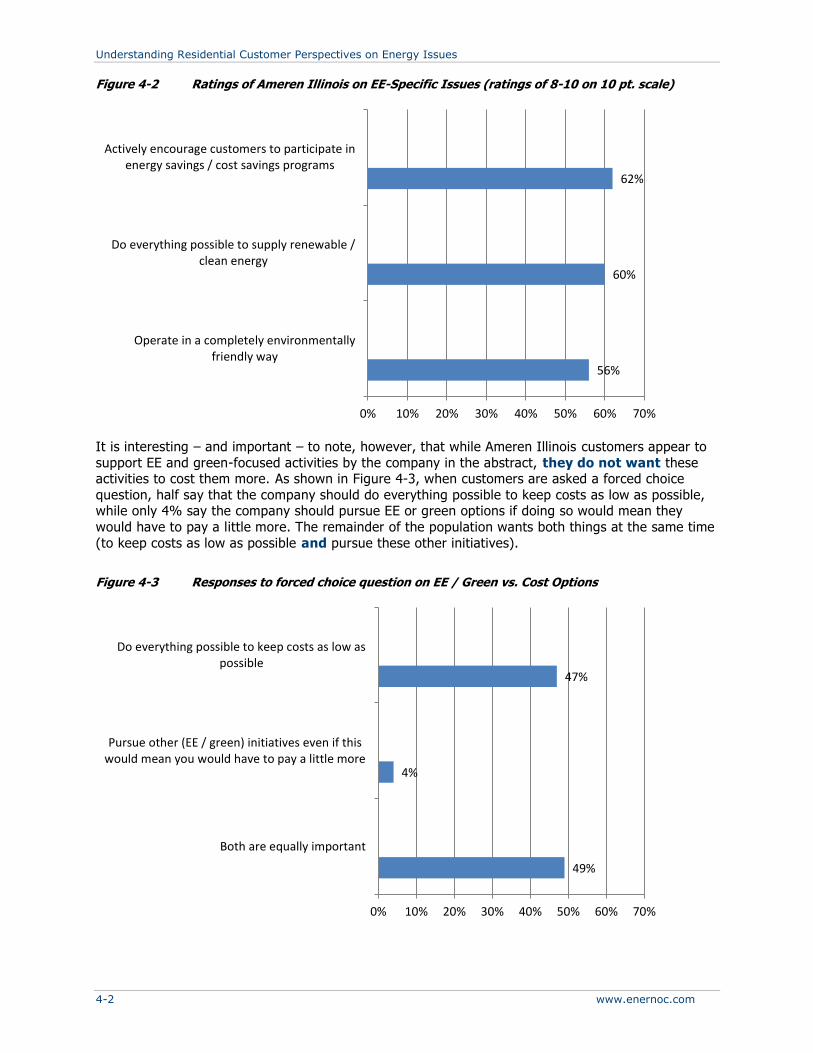
Turning to the question of whether or not Ameren Illinois should promote energy efficiency, and/or,
greener energy options, the results suggest that a majority of customers do support this activity
(Figure 4-2). A total of 60% or more believe the company should “actively encourage” customers to participate in energy / cost savings programs, while just slightly fewer (56%) say the company
should operate in a “completely environmentally friendly way.”
4 Note that this compares to a 53% top-three-box rating for Ameren Missouri that we observed in similar research conducted in July 2009.
63%
46%
43%
43%
38%
0% 10% 20% 30% 40% 50% 60% 70%
Overall satisfaction with Ameren Illinois
A credible source of information on EE
A company that can be trusted
A company that actively promotes programs tohelp customers save money
A leader in energy conservation and EE
Understanding Residential Customer Perspectives on Energy Issues
4-2 www.enernoc.com
Figure 4-2 Ratings of Ameren Illinois on EE-Specific Issues (ratings of 8-10 on 10 pt. scale)
It is interesting – and important – to note, however, that while Ameren Illinois customers appear to
support EE and green-focused activities by the company in the abstract, they do not want these activities to cost them more. As shown in Figure 4-3, when customers are asked a forced choice
question, half say that the company should do everything possible to keep costs as low as possible, while only 4% say the company should pursue EE or green options if doing so would mean they
would have to pay a little more. The remainder of the population wants both things at the same time
(to keep costs as low as possible and pursue these other initiatives).
Figure 4-3 Responses to forced choice question on EE / Green vs. Cost Options
56%
60%
62%
0% 10% 20% 30% 40% 50% 60% 70%
Operate in a completely environmentallyfriendly way
Do everything possible to supply renewable /clean energy
Actively encourage customers to participate inenergy savings / cost savings programs
49%
4%
47%
0% 10% 20% 30% 40% 50% 60% 70%
Both are equally important
Pursue other (EE / green) initiatives even if thiswould mean you would have to pay a little more
Do everything possible to keep costs as low aspossible
Understanding Residential Customer Perspectives on Energy Issues
EnerNOC Utility Solutions Consulting 4-3
Understanding Customer Perspectives on Energy Issues In order to provide additional context and understanding concerning why customers, are – or are not
– interested in implementing a variety of EE measures, the research team explored customer thinking across a variety of background energy issues. These specific questions covered the following
issues:
• How customers think about using energy in their homes (how much they think about energy
costs, for example, or the relative importance of comfort vs. cost)
• What is important to them as they evaluate new appliances (initial cost vs. operating cost
savings, for example)
• How they shop for new appliances
In order to understand how customers think about these issues, we conducted what is called a factor analysis of all of the attitudinal items included in these different sections of the questionnaire. What
factor analysis allows us to do is to understand how customers organize their thinking about energy
issues by grouping together the questionnaire items that customers evaluate similarly.
The first block of items that customers tend to rate similarly – suggesting that they see these items as addressing the same – or at least very similar issues – are questions that asked them to rate the
importance of:
• The total amount of money that a product or service would cost
• Any cost savings you might see from using the product
• Any rebates or purchase discounts that might be offered
• The features and functions included with the product
This finding suggests that customers tend to aggregate together all of the cost related issues as
similarly important, and further, they tend to link in feature functionality as tied to cost.
Besides this first bundle of customer perspectives on energy issues – which we might label as “cost focus,” the findings suggest that there are there are five other factors – or bundles – of customer
opinions on these issues. These include:
• High quality / tech products. The items aggregated here include expressed preferences for
high quality and innovative products that help customers to save time and money. What is perhaps most interesting here is having a product labeled as EE or ENERGY STAR is viewed as
fitting in with this bundle of attributes.
• Environmental focus. The questionnaire items that were aggregated together in this bundle of opinions included those that had to do with being concerned about the environmental effects of
electric power plants; the effects of global warming, and any environmental effects from using products. Also interesting here was that being an “early adopter” of new products was connected
with these “green” attitudes.
• Product researching. Customers also reacted similarly to items that had to do with
descriptions of themselves as taking the time to research and shop carefully for products. Also included in this grouping were items that described the respondent as living in a do -it-yourself
sort of household, and in a household that tended to only buy things when they were on sale.
• Conservation doesn’t matter. Respondents did also rate similarly the questionnaire items that indicated a lack of confidence in the impact of energy efficiency / conservation: that conserving
energy will make no difference to the economy, that there isn’t much they can do to save money
on energy costs, and that they just want to be left alone to use energy however they want in
their homes.
• Simple appliances. Customers also rated similarly statements that focused on using appliances
that are simple and functional, but also included in this grouping, the desire to purchase
products in a physical store, rather than on the internet.
Understanding Residential Customer Perspectives on Energy Issues
4-4 www.enernoc.com
• Lack of knowledge. Finally, customers rated a questionnaire item that described the
respondent as willing to do more to make their home more efficient, but not knowing where to
start, by itself – not grouping it together with other items.
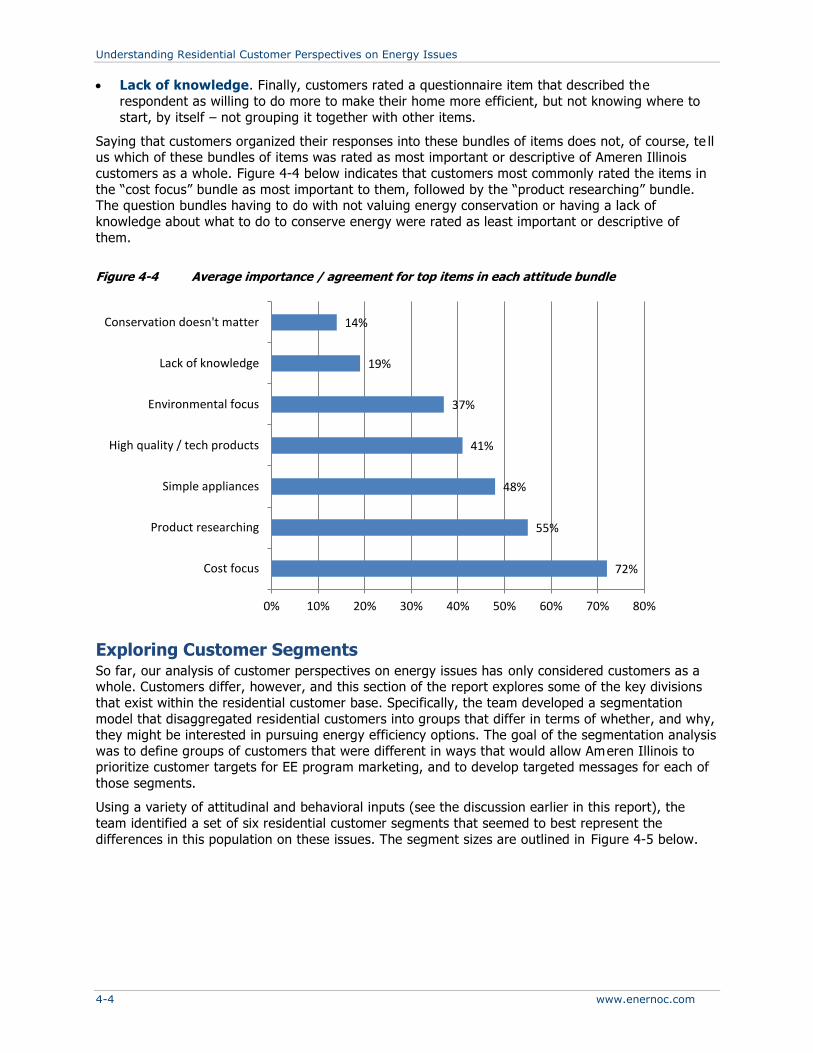
Saying that customers organized their responses into these bundles of items does not, of course, te ll us which of these bundles of items was rated as most important or descriptive of Ameren Illinois
customers as a whole. Figure 4-4 below indicates that customers most commonly rated the items in
the “cost focus” bundle as most important to them, followed by the “product researching” bundle. The question bundles having to do with not valuing energy conservation or having a lack of
knowledge about what to do to conserve energy were rated as least important or descriptive of
them.
Figure 4-4 Average importance / agreement for top items in each attitude bundle
Exploring Customer Segments So far, our analysis of customer perspectives on energy issues has only considered customers as a whole. Customers differ, however, and this section of the report explores some of the key divisions
that exist within the residential customer base. Specifically, the team developed a segmentation
model that disaggregated residential customers into groups that differ in terms of whether, and why, they might be interested in pursuing energy efficiency options. The goal of the segmentation analysis
was to define groups of customers that were different in ways that would allow Ameren Illinois to prioritize customer targets for EE program marketing, and to develop targeted messages for each of
those segments.
Using a variety of attitudinal and behavioral inputs (see the discussion earlier in this report), the
team identified a set of six residential customer segments that seemed to best represent the
differences in this population on these issues. The segment sizes are outlined in Figure 4-5 below.
72%
55%
48%
41%
37%
19%
14%
0% 10% 20% 30% 40% 50% 60% 70% 80%
Cost focus
Product researching
Simple appliances
High quality / tech products
Environmental focus
Lack of knowledge
Conservation doesn't matter

Understanding Residential Customer Perspectives on Energy Issues
EnerNOC Utility Solutions Consulting 4-5
Figure 4-5 Residential Segment Distribution
Base Segment Descriptions Summary descriptions for each of the segments follow:
Practical Idealists (30%)
Concerned with conserving energy, both from a cost-focus and an environmental perspective (they
are the “greenest” segment). They are tech and feature oriented when considering appliances, but they also say they research options and compare prices. Higher education and income, and with the
largest homes (though with only average total annual kWh usage), but tend to say their economic situation is worse than it was a year ago. Tend to be high on familiarity, and experience, with EE /
conservation measures to date, and are very likely to say that they would adopt new EE /
conservation measures.
Cost-Focused Conservers (15%)
Informed about, and interested in, conservation / EE measures, but for cost reasons rather than
environmental reasons. This group believes in the value of EE as a way to save money, and has
taken many prior EE actions. They do not trust Ameren Illinois very highly, however, and do not see it as the job of the company to encourage customers to save energy or money. They would prefer
the company reduce rates than spend money on EE or green options. They have higher than average education and income levels, and the second largest homes on average, and the second highest
average kWh. They have the second highest program take rate.
Willing, But Uninformed (15%)
This group is positive in its assessment of Ameren Illinois, and green in their environmental perspectives (though this is not a daily, top-of-mind issue). They are relatively less experienced with
EE / conservation measures to-date, however, and unsure of what they could be doing in this area,
or if any of their actions would actually lead them to save money. They prefer simple, functional

Understanding Residential Customer Perspectives on Energy Issues
4-6 www.enernoc.com
appliances that are on sale, and which they can purchase locally, rather than online. They have average sized homes and average annual kWh usage, as well as have lower than average income
and education levels. They are moderate on take rates across programs, but are the lowest on
familiarity / experience with EE conservation measures currently.
Willing, But Challenged (15%)
This group has relatively high opinions of Ameren Illinois and believes that the company should be
pursuing EE options for its customers, while also supporting green initiatives. They are relatively low on EE / conservation information currently, however, and have implemented fewer such measures
than others to-date. Appliance cost is critical to them and it appears that they do not think that they
can afford to purchase higher quality / higher EE appliances. They live in the smallest homes, and have lower than average income and education levels, as well as the lowest annual kWh usage. They
are moderate to low in their interest in participating in new EE / conservation options.
Comfort Focused (10%)
This group is quite positive in its overall assessment of Ameren Illinois, but does not see the company as a leader in energy efficiency, nor do they think the company should be a leader in this
area (i.e., in encouraging customers to be more efficient), or in green energy. Rather, the company should just focus on keeping costs low. Comfort is important to them, and they just want to be left
alone to use energy as they please. They are concerned about appliance cost, but worry more about
functionality (particularly as this relates to comfort) than about environmental / energy saving considerations. They tend to live in average sized homes, but have the highest annual kWh levels,
along with higher than average incomes and educations. They are moderate on both familiarity with
EE programs / options to-date, and their likelihood to participate in new programs.
Low Interest, Little Action (16%)
This group has very little interest in conservation or EE. This group actively dislikes Ameren Illinois,
particularly on the dimensions of trust and being a leader in EE. They do not want the company to encourage customers to save energy, nor do they want it to pursue green options. They do want the
company to keep costs low as its sole focus. They have smaller than average homes, but average
kWh levels, and are more likely to live in multi-family structures and to have somewhat lower levels of education and income. They are the lowest on likelihood to adopt new EE programs and one of
the lowest on existing familiarity / experience with EE / conservation options.
Understanding Residential Customer Perspectives on Energy Issues
Copyright © 2013 EnerNOC, Inc. 4-7
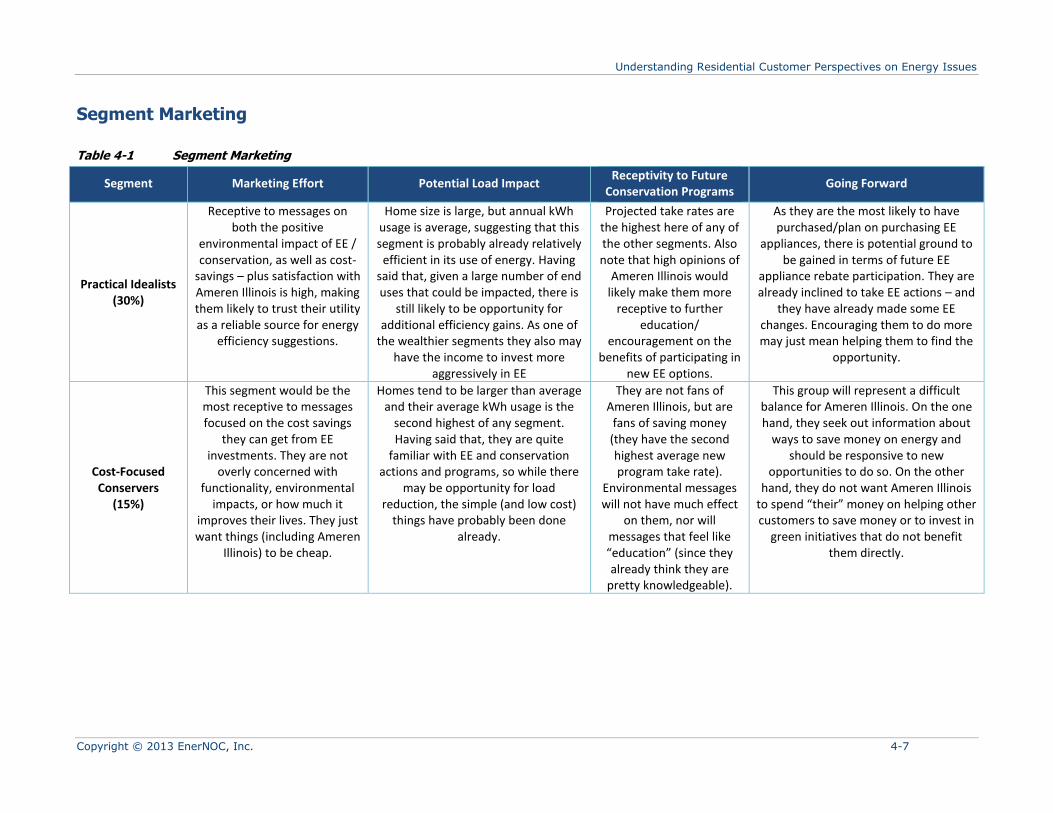
Segment Marketing
Table 4-1 Segment Marketing
Segment Marketing Effort Potential Load Impact Receptivity to Future
Conservation Programs Going Forward
Practical Idealists (30%)
Receptive to messages on both the positive
environmental impact of EE / conservation, as well as cost-
savings – plus satisfaction with Ameren Illinois is high, making them likely to trust their utility as a reliable source for energy
efficiency suggestions.
Home size is large, but annual kWh usage is average, suggesting that this segment is probably already relatively
efficient in its use of energy. Having said that, given a large number of end uses that could be impacted, there is
still likely to be opportunity for additional efficiency gains. As one of
the wealthier segments they also may have the income to invest more
aggressively in EE
Projected take rates are the highest here of any of the other segments. Also note that high opinions of
Ameren Illinois would likely make them more
receptive to further education/
encouragement on the benefits of participating in
new EE options.
As they are the most likely to have purchased/plan on purchasing EE
appliances, there is potential ground to be gained in terms of future EE
appliance rebate participation. They are already inclined to take EE actions – and
they have already made some EE changes. Encouraging them to do more may just mean helping them to find the
opportunity.
Cost-Focused Conservers
(15%)
This segment would be the most receptive to messages focused on the cost savings
they can get from EE investments. They are not
overly concerned with functionality, environmental
impacts, or how much it improves their lives. They just want things (including Ameren
Illinois) to be cheap.
Homes tend to be larger than average and their average kWh usage is the
second highest of any segment. Having said that, they are quite
familiar with EE and conservation actions and programs, so while there
may be opportunity for load reduction, the simple (and low cost)
things have probably been done already.
They are not fans of Ameren Illinois, but are
fans of saving money (they have the second highest average new program take rate).
Environmental messages will not have much effect
on them, nor will messages that feel like “education” (since they already think they are
pretty knowledgeable).
This group will represent a difficult balance for Ameren Illinois. On the one hand, they seek out information about
ways to save money on energy and should be responsive to new
opportunities to do so. On the other hand, they do not want Ameren Illinois
to spend “their” money on helping other customers to save money or to invest in
green initiatives that do not benefit them directly.
Understanding Residential Customer Perspectives on Energy Issues
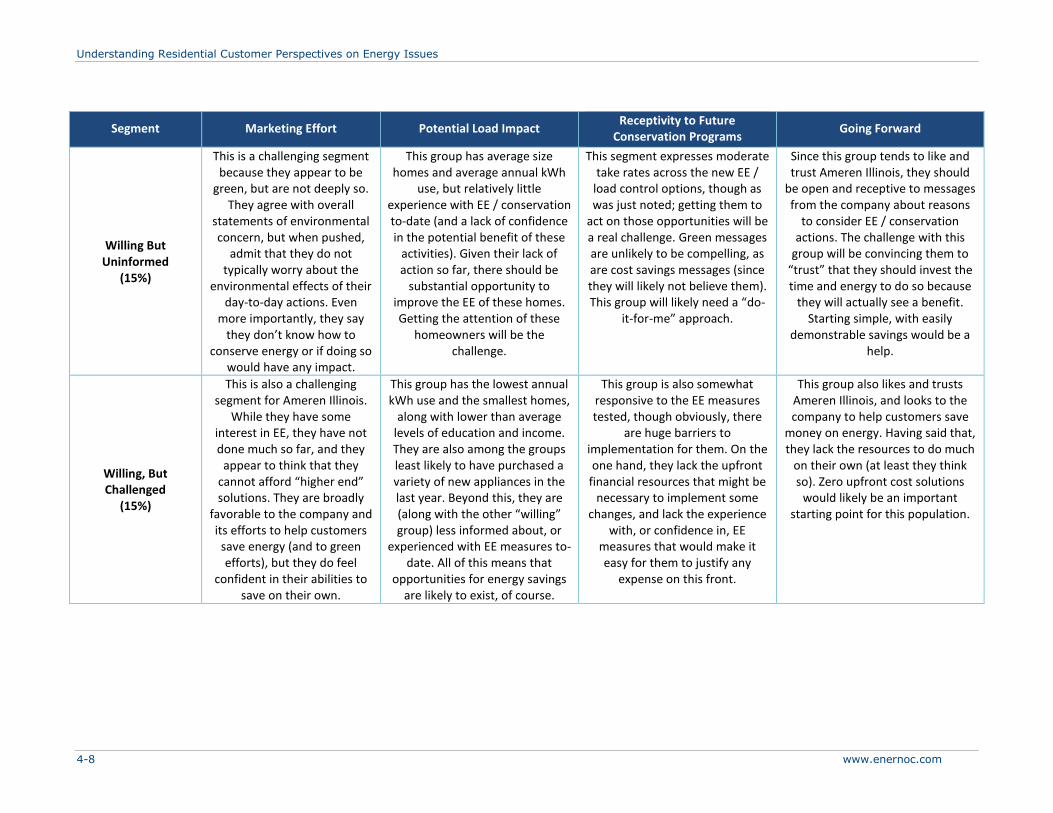
4-8 www.enernoc.com
Segment Marketing Effort Potential Load Impact Receptivity to Future
Conservation Programs Going Forward
Willing But Uninformed
(15%)
This is a challenging segment because they appear to be
green, but are not deeply so. They agree with overall
statements of environmental concern, but when pushed,
admit that they do not typically worry about the
environmental effects of their day-to-day actions. Even
more importantly, they say they don’t know how to
conserve energy or if doing so would have any impact.
This group has average size homes and average annual kWh
use, but relatively little experience with EE / conservation to-date (and a lack of confidence in the potential benefit of these
activities). Given their lack of action so far, there should be
substantial opportunity to improve the EE of these homes. Getting the attention of these
homeowners will be the challenge.
This segment expresses moderate take rates across the new EE /
load control options, though as was just noted; getting them to
act on those opportunities will be a real challenge. Green messages are unlikely to be compelling, as are cost savings messages (since they will likely not believe them). This group will likely need a “do-
it-for-me” approach.
Since this group tends to like and trust Ameren Illinois, they should
be open and receptive to messages from the company about reasons
to consider EE / conservation actions. The challenge with this
group will be convincing them to “trust” that they should invest the time and energy to do so because
they will actually see a benefit. Starting simple, with easily
demonstrable savings would be a help.
Willing, But Challenged
(15%)
This is also a challenging segment for Ameren Illinois.
While they have some interest in EE, they have not done much so far, and they
appear to think that they cannot afford “higher end” solutions. They are broadly
favorable to the company and its efforts to help customers
save energy (and to green efforts), but they do feel
confident in their abilities to save on their own.
This group has the lowest annual kWh use and the smallest homes,
along with lower than average levels of education and income. They are also among the groups least likely to have purchased a variety of new appliances in the last year. Beyond this, they are (along with the other “willing” group) less informed about, or
experienced with EE measures to-date. All of this means that
opportunities for energy savings are likely to exist, of course.
This group is also somewhat responsive to the EE measures tested, though obviously, there
are huge barriers to implementation for them. On the one hand, they lack the upfront
financial resources that might be necessary to implement some
changes, and lack the experience with, or confidence in, EE
measures that would make it easy for them to justify any
expense on this front.
This group also likes and trusts Ameren Illinois, and looks to the company to help customers save
money on energy. Having said that, they lack the resources to do much
on their own (at least they think so). Zero upfront cost solutions
would likely be an important starting point for this population.
Understanding Residential Customer Perspectives on Energy Issues
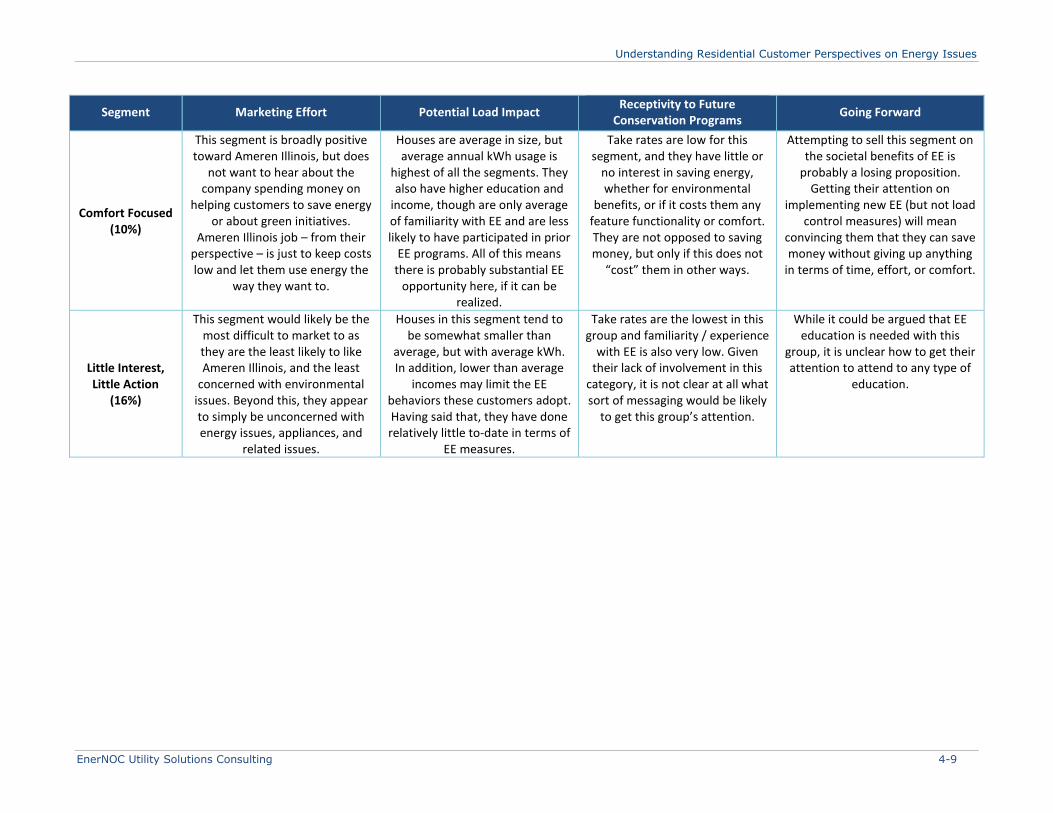
EnerNOC Utility Solutions Consulting 4-9
Segment Marketing Effort Potential Load Impact Receptivity to Future
Conservation Programs Going Forward
Comfort Focused (10%)
This segment is broadly positive toward Ameren Illinois, but does
not want to hear about the company spending money on
helping customers to save energy or about green initiatives.
Ameren Illinois job – from their perspective – is just to keep costs low and let them use energy the
way they want to.
Houses are average in size, but average annual kWh usage is
highest of all the segments. They also have higher education and
income, though are only average of familiarity with EE and are less likely to have participated in prior
EE programs. All of this means there is probably substantial EE
opportunity here, if it can be realized.
Take rates are low for this segment, and they have little or
no interest in saving energy, whether for environmental
benefits, or if it costs them any feature functionality or comfort. They are not opposed to saving money, but only if this does not
“cost” them in other ways.
Attempting to sell this segment on the societal benefits of EE is
probably a losing proposition. Getting their attention on
implementing new EE (but not load control measures) will mean
convincing them that they can save money without giving up anything
in terms of time, effort, or comfort.
Little Interest, Little Action
(16%)
This segment would likely be the most difficult to market to as they are the least likely to like Ameren Illinois, and the least
concerned with environmental issues. Beyond this, they appear to simply be unconcerned with energy issues, appliances, and
related issues.
Houses in this segment tend to be somewhat smaller than
average, but with average kWh. In addition, lower than average
incomes may limit the EE behaviors these customers adopt. Having said that, they have done relatively little to-date in terms of
EE measures.
Take rates are the lowest in this group and familiarity / experience
with EE is also very low. Given their lack of involvement in this
category, it is not clear at all what sort of messaging would be likely
to get this group’s attention.
While it could be argued that EE education is needed with this
group, it is unclear how to get their attention to attend to any type of
education.

Understanding Residential Customer Perspectives on Energy Issues
4-10 www.enernoc.com
Residential Segments – At a Glance
Table 4-2 Segment Prioritization
Practical Idealists
Cost-Focused Conservers
Willing, But Uninformed
Willing, But Challenged Comfort Focused
Little Interest, Little Action
Size
30% 15% 15% 15% 10% 16%
Opportunity
High They have done a lot already, but are open to – and able to – do
more
Medium-High Experienced in EE and willing to do
more; if the money is right
Medium-Low Willing to be
convinced of the advisability of EE actions, but not
convinced to date
Medium-Low Open to the possibility of
EE actions, but see themselves as very limited
in their opportunity to take advantage and have
not done so yet
Low No interest in
the EE category; “leave me
alone”
Very Low Totally uninvolved
with the energy category and no
interest in becoming so
Role for Ameren Illinois
Trusted Green Partner:
They like the company and see Ameren Illinois as
having an important role in both EE and promoting green
initiatives
Save Us Money: Broadly negative
toward the company; just want Ameren Illinois to focus on lowering costs (for
me)
Help Me: They like the
company and want it to help them become more energy efficient (though they are not
certain this is possible).
Help Me: They like the company but
do not think that EE is something that is relevant for them, or is something that they can afford, or figure out how to make
work for them
Leave Me Alone: Don’t like the
company, don’t trust it, and just
want to b left alone
Don’t Bother Me: Like the company,
but not interested in energy issues
generally, and see little likely value in
EE actions

Understanding Residential Customer Perspectives on Energy Issues
EnerNOC Utility Solutions Consulting 4-11
Table 4-3 Likely Takers given a 3 year payback period
Practical Idealists
Cost-Focused Conservers
Willing, But Uninformed
Willing, But Challenged
Comfort Focused Low Interest, Little
Action
Size 30% 15% 15% 15% 10% 16%
Measures for purchasing/installing energy efficient equipment ( Assumes a normal replacement cycle)
Light bulb 52% 41% 38% 38% 31% 22%
Refrigerator 49% 40% 40% 35% 36% 27%
Water heater 48% 38% 37% 31% 33% 21%
Air conditioner 47% 40% 36% 32% 33% 20%
Clothes dryer 47% 39% 38% 32% 32% 21%
Furnace or boiler 46% 39% 37% 30% 32% 20%
Color TV 43% 33% 35% 27% 28% 20%
PC 41% 33% 30% 27% 23% 18%
Stovetop or range 46% 35% 33% 30% 30% 18%
Swimming pool pump 32% 28% 36% 25% 29% 15%
Measures for improving energy efficiency of existing systems
Maintain heating system regularly 45% 37% 29% 26% 31% 18%
Maintain cooling system regularly 43% 35% 29% 26% 30% 19%
Install Smart power strips 41% 35% 33% 27% 22% 18%
Install a programmable thermostat 39% 30% 30% 33% 23% 16%
Inspect, repair, and seal HVAC ductwork VAC ductwork
40% 31% 28% 26% 23% 16%
Install exterior lighting controls 34% 31% 28% 24% 20% 19%
Install more EE exterior windows 37% 36% 31% 27% 23% 19%
Install improved home insulation 36% 33% 30% 23% 20% 17%
Install “low flow” showerheads 38% 29% 28% 23% 19% 15%
Add insulation to HVAC ductwork 37% 32% 27% 25% 22% 15%
Install a dehumidifier 34% 31% 27% 22% 21% 15%
Install a whole house/attic fan 30% 27% 24% 20% 17% 13%
Measures not requiring an investment by the customer
Turning down the heating/cooling systems while sleeping/away
33% 29% 21% 23% 22% 16%
Reduce water heater temperature 33% 22% 17% 18% 17% 13%
Get rid of secondary refrigerator 25% 22% 16% 18% 14% 13%

Copyright © 2013 EnerNOC, Inc. 5-1
SECTION 5
RESIDENTIAL SATURATION SURVEY RESULTS
Household Demographics The sample was split by housing type into two segments for analysis: single -family detached homes and multi-family homes. Single-family detached homes include single-family homes and mobile or
manufactured homes. The multi-family home segment includes single-family homes that are attached
to one or more other homes, multi-family homes in a building with 2-4 units, and multi-family homes in a building with 5 or more units. Seventy-nine percent of respondents live in a single-family home
while 21% live in a multi-family home. The average number of individuals living in a single-family
home is 2.6 and the average number of individuals living in a multi-family home is 2.0.
Several household demographic questions were asked that are important to a household’s energy
use. Key demographics include the age of home, the size of the home, and the number of individuals
who work from home or are home during the weekday.
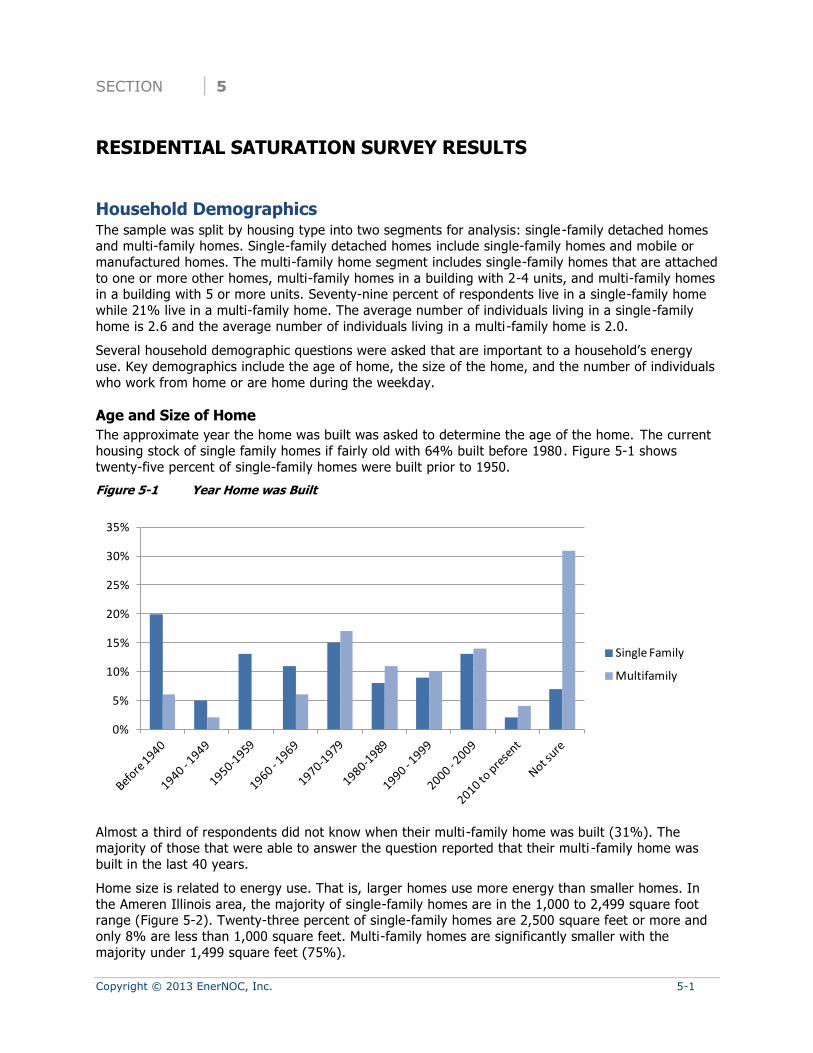
Age and Size of Home
The approximate year the home was built was asked to determine the age of the home. The current
housing stock of single family homes if fairly old with 64% built before 1980. Figure 5-1 shows
twenty-five percent of single-family homes were built prior to 1950.
Figure 5-1 Year Home was Built
Almost a third of respondents did not know when their multi-family home was built (31%). The majority of those that were able to answer the question reported that their multi -family home was
built in the last 40 years.
Home size is related to energy use. That is, larger homes use more energy than smaller homes. In
the Ameren Illinois area, the majority of single-family homes are in the 1,000 to 2,499 square foot range (Figure 5-2). Twenty-three percent of single-family homes are 2,500 square feet or more and
only 8% are less than 1,000 square feet. Multi-family homes are significantly smaller with the
majority under 1,499 square feet (75%).
0%
5%
10%
15%
20%
25%
30%
35%
Single Family
Multifamily

Residential Saturation Survey Results
5-2 www.enernoc.com
Figure 5-2 Square Footage of Home
Individuals Home During the Weekday
Energy use tends to be higher in homes where one or more household members are home during
the day. Similarly, in the summer, peak demand tends to be higher.
Most homes in the Ameren Illinois service territory have a member who is regularly home during the day on weekdays (Figure 5-3). Fifty-nine percent of single-family and 52% of multi-family customers
say someone is home during the weekday, either because they work at home or regularly stay at
home all or most weekdays (four days or more).
Figure 5-3 Customers with Someone Home All or Most Weekdays
Within the group presented in Figure 5-3 is a subset of respondents that are working at home.
Sixteen percent of respondents in the single-family segment have a member who telecommutes or
%
5%
10%
15%
20%
25%
30%
35%
1,000 -1,499 sq.ft.
1,500 -1,999 sq.ft.
2,000 -2,499 sq.ft.
2,500 -2,999 sq.ft.
3,000 -3,499 sq. ft.
3,500 -3,999 sq.ft.
4,000 sq.ft. or more
Single Family
Multifamily
48%
50%
52%
54%
56%
58%
60%
Single Family Multifamily
Residential Saturation Survey Results
EnerNOC Utility Solutions Consulting 5-3
works from home at least one day during the day on weekdays. A slightly smaller percentage (13%)
of those living in multi-family homes telecommutes or works from home.
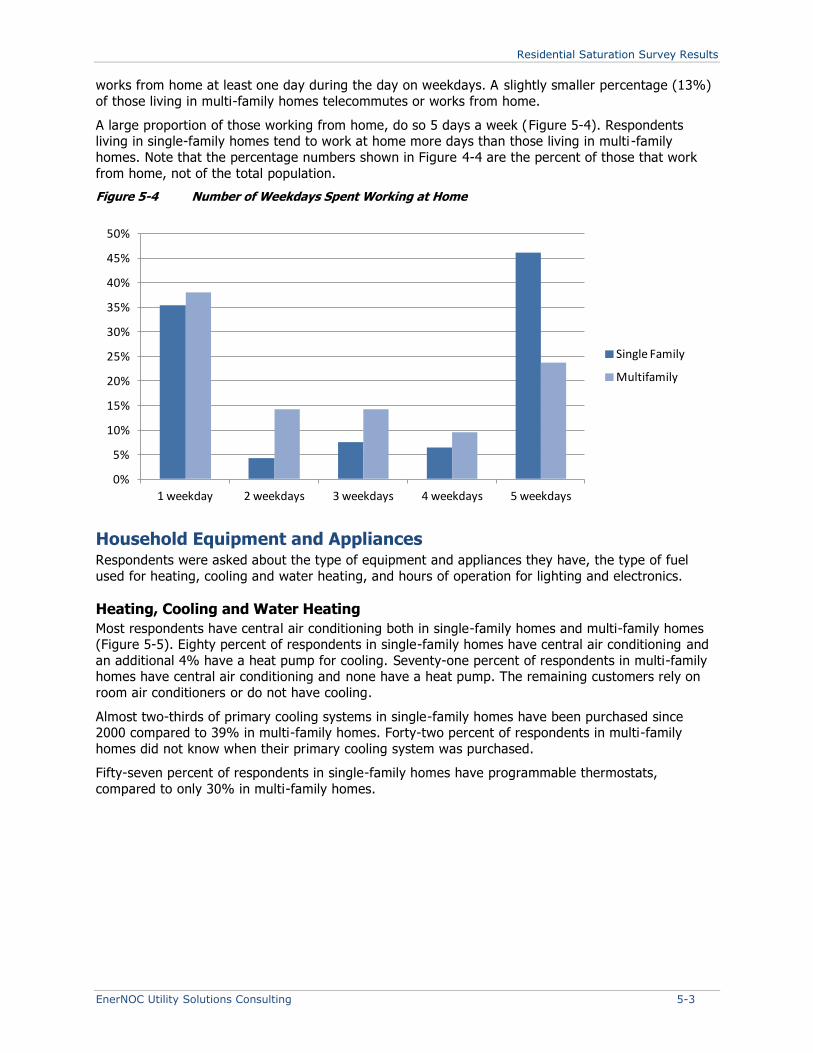
A large proportion of those working from home, do so 5 days a week (Figure 5-4). Respondents living in single-family homes tend to work at home more days than those living in multi -family
homes. Note that the percentage numbers shown in Figure 4-4 are the percent of those that work
from home, not of the total population.
Figure 5-4 Number of Weekdays Spent Working at Home
Household Equipment and Appliances Respondents were asked about the type of equipment and appliances they have, the type of fuel
used for heating, cooling and water heating, and hours of operation for lighting and electronics.
Heating, Cooling and Water Heating
Most respondents have central air conditioning both in single-family homes and multi-family homes (Figure 5-5). Eighty percent of respondents in single-family homes have central air conditioning and
an additional 4% have a heat pump for cooling. Seventy-one percent of respondents in multi-family homes have central air conditioning and none have a heat pump. The remaining customers rely on
room air conditioners or do not have cooling.
Almost two-thirds of primary cooling systems in single-family homes have been purchased since 2000 compared to 39% in multi-family homes. Forty-two percent of respondents in multi-family
homes did not know when their primary cooling system was purchased.
Fifty-seven percent of respondents in single-family homes have programmable thermostats,
compared to only 30% in multi-family homes.
0%
5%
10%
15%
20%
25%
30%
35%
40%
45%
50%
1 weekday 2 weekdays 3 weekdays 4 weekdays 5 weekdays
Single Family
Multifamily
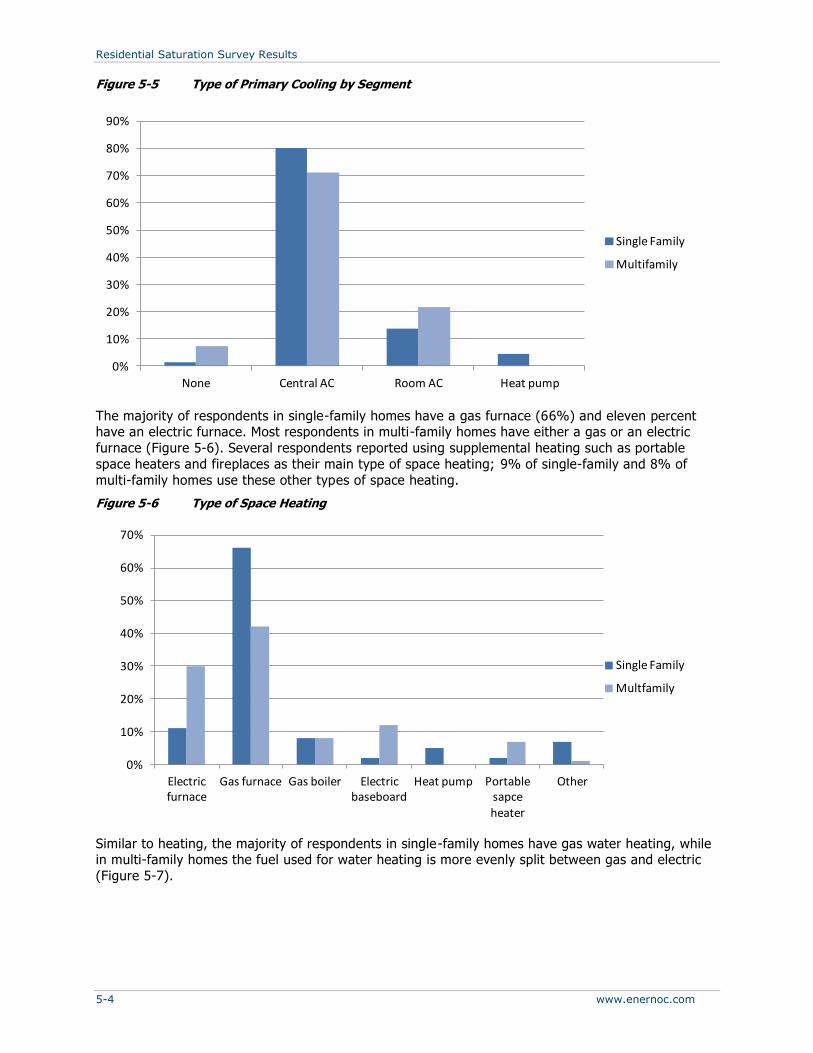
Residential Saturation Survey Results
5-4 www.enernoc.com
Figure 5-5 Type of Primary Cooling by Segment
The majority of respondents in single-family homes have a gas furnace (66%) and eleven percent have an electric furnace. Most respondents in multi-family homes have either a gas or an electric
furnace (Figure 5-6). Several respondents reported using supplemental heating such as portable
space heaters and fireplaces as their main type of space heating; 9% of single-family and 8% of
multi-family homes use these other types of space heating.
Figure 5-6 Type of Space Heating
Similar to heating, the majority of respondents in single-family homes have gas water heating, while in multi-family homes the fuel used for water heating is more evenly split between gas and electric
(Figure 5-7).
0%
10%
20%
30%
40%
50%
60%
70%
80%
90%
None Central AC Room AC Heat pump
Single Family
Multifamily
0%
10%
20%
30%
40%
50%
60%
70%
Electric furnace
Gas furnace Gas boiler Electric baseboard
Heat pump Portable sapce heater
Other
Single Family
Multfamily
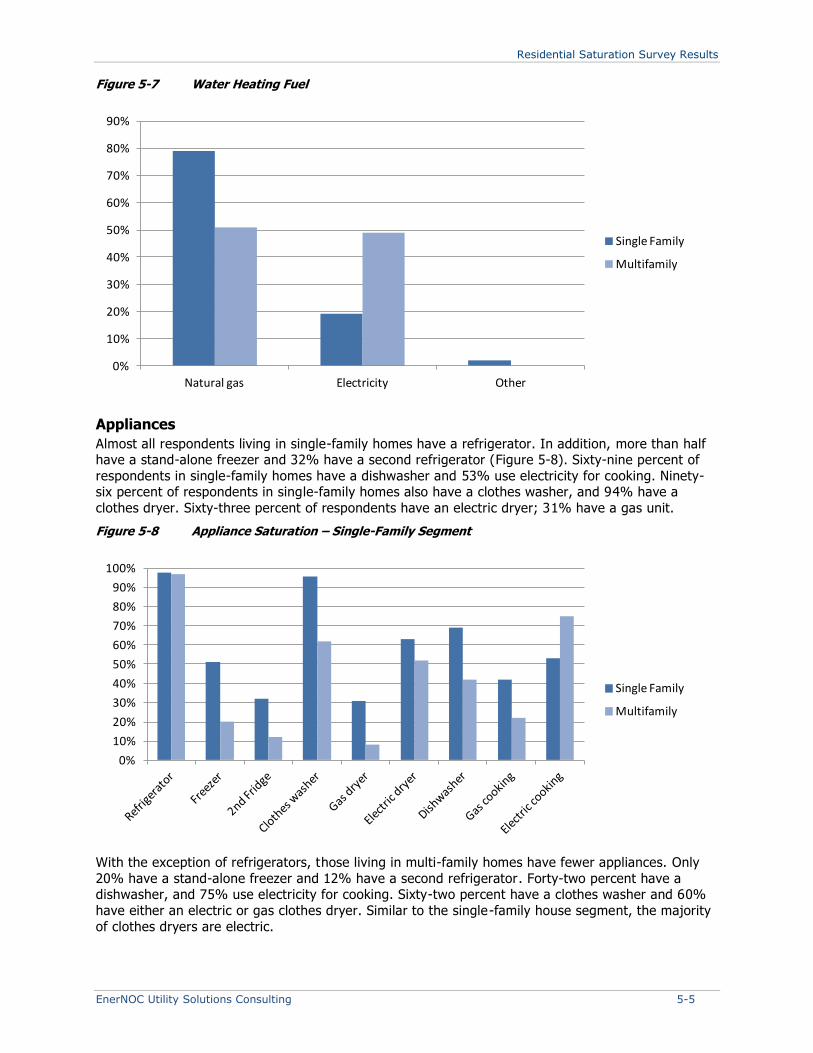
Residential Saturation Survey Results
EnerNOC Utility Solutions Consulting 5-5
Figure 5-7 Water Heating Fuel
Appliances
Almost all respondents living in single-family homes have a refrigerator. In addition, more than half have a stand-alone freezer and 32% have a second refrigerator (Figure 5-8). Sixty-nine percent of
respondents in single-family homes have a dishwasher and 53% use electricity for cooking. Ninety-six percent of respondents in single-family homes also have a clothes washer, and 94% have a
clothes dryer. Sixty-three percent of respondents have an electric dryer; 31% have a gas unit.
Figure 5-8 Appliance Saturation – Single-Family Segment
With the exception of refrigerators, those living in multi-family homes have fewer appliances. Only
20% have a stand-alone freezer and 12% have a second refrigerator. Forty-two percent have a dishwasher, and 75% use electricity for cooking. Sixty-two percent have a clothes washer and 60%
have either an electric or gas clothes dryer. Similar to the single-family house segment, the majority
of clothes dryers are electric.
0%
10%
20%
30%
40%
50%
60%
70%
80%
90%
Natural gas Electricity Other
Single Family
Multifamily
0%
10%
20%
30%
40%
50%
60%
70%
80%
90%
100%
Single Family
Multifamily

Residential Saturation Survey Results
5-6 www.enernoc.com
Lighting
The average number of light bulbs in a single-family home is 46, while a multi-family home has an average of 38 total light bulbs (Table 5-1). Almost half (48%) of the light bulbs in both segments are
conventional incandescent bulbs. CFLs represent about one-third of the light bulbs.
Table 5-1 Average Number of Light Bulbs by Segment and Type
Segment Incande-
scent CFL LED
Tubular Fluore-scent
Halogen Low
Voltage Other
Single Family 47% 32% 1% 10% 4% 4% 2%
Multi-family 50% 31% 1% 9% 3% 4% 2%
Total 48% 31% 1% 10% 3% 4% 2%
Few respondents in single-family homes use some sort of lighting controls on their interior lighting.
Sixteen percent in single-family homes use lighting timers compared to 14% of those in multi-family homes. Fourteen percent in single-family homes use motion detectors compared to 4% of those in
multi-family homes.
Several respondents use lighting controls for the exterior lighting in their homes . Twenty-one percent
of those in single-family homes use motion detectors, compared to 9% in multi-family homes; 26% in single-family homes use dusk-to-dawn lights compared to 13% in multi-family homes; and 7% in
single family homes and 3% in multifamily homes use timers.
Electronics
Respondents in single-family homes have an average of 2.9 TVs per household, while those in multi-
family homes have an average of 2.1 TVs. The majority of respondents have at least one standard TV, and 59% of those in single-family homes and 46% of those in multi-family homes have at least
one LCD TV (Figure 5-9). Smaller percentages have one or more LED, plasma or rear projection TV.
Figure 5-9 Type of TV by Segment
Respondents in single-family homes report that their household watches TV on average a total of
10.34 hours per day on all their TVs combined, while those in apartments watch TV 8.6 hours per
0%
10%
20%
30%
40%
50%
60%
70%
Standard LCD LED Plasma Rear Projection
Single Family
Multifamily
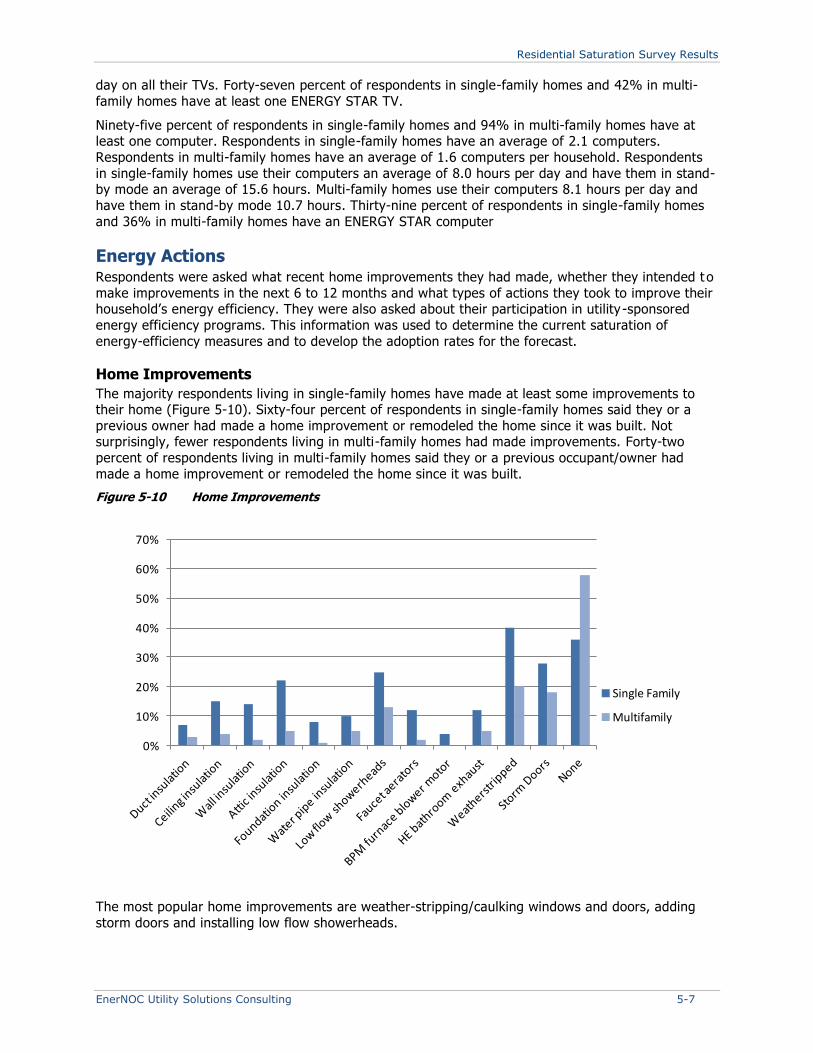
Residential Saturation Survey Results
EnerNOC Utility Solutions Consulting 5-7
day on all their TVs. Forty-seven percent of respondents in single-family homes and 42% in multi-
family homes have at least one ENERGY STAR TV.
Ninety-five percent of respondents in single-family homes and 94% in multi-family homes have at least one computer. Respondents in single-family homes have an average of 2.1 computers.
Respondents in multi-family homes have an average of 1.6 computers per household. Respondents
in single-family homes use their computers an average of 8.0 hours per day and have them in stand-by mode an average of 15.6 hours. Multi-family homes use their computers 8.1 hours per day and
have them in stand-by mode 10.7 hours. Thirty-nine percent of respondents in single-family homes
and 36% in multi-family homes have an ENERGY STAR computer
Energy Actions Respondents were asked what recent home improvements they had made, whether they intended t o
make improvements in the next 6 to 12 months and what types of actions they took to improve their household’s energy efficiency. They were also asked about their participation in utility -sponsored
energy efficiency programs. This information was used to determine the current saturation of
energy-efficiency measures and to develop the adoption rates for the forecast.
Home Improvements
The majority respondents living in single-family homes have made at least some improvements to their home (Figure 5-10). Sixty-four percent of respondents in single-family homes said they or a
previous owner had made a home improvement or remodeled the home since it was built. Not surprisingly, fewer respondents living in multi-family homes had made improvements. Forty-two
percent of respondents living in multi-family homes said they or a previous occupant/owner had
made a home improvement or remodeled the home since it was built.
Figure 5-10 Home Improvements
The most popular home improvements are weather-stripping/caulking windows and doors, adding
storm doors and installing low flow showerheads.
0%
10%
20%
30%
40%
50%
60%
70%
Single Family
Multifamily

Residential Saturation Survey Results
5-8 www.enernoc.com
Program Awareness and Participation
About a quarter of respondents in both segments stated they were aware of programs that offer conservation rebates, loans or price discount programs. Similar percentages have participated in at
least one program in the last 3 years.
When asked specifically about Ameren Illinois programs, the refrigerator recycling programs was the program the majority of respondents were aware of in both segments (Figure 5-11). Half of
multifamily respondents are also aware of the Home Energy Performance program.
Figure 5-11 Awareness of Ameren Illinois Programs
Rebate programs have the lowest levels of awareness. Overall multifamily respondents are more
aware of the programs available than are single family respondents.
Figure 5-12 Participation in Ameren Illinois Programs
Few respondents have participated in Ameren Illinois’ programs in the last 3 years (Figure 5-12).
Twelve percent of single family respondents have participated in the refrigerator recycling program,
and 13% of multifamily customers have participated in the lighting discounts program.
0%
10%
20%
30%
40%
50%
60%
Single Family
Multifamily
0%
10%
20%
30%
40%
50%
60%
Single Family
Multifamily
Copyright © 2013 EnerNOC, Inc. 6-1
SECTION 6
C&I METHODOLOGY
This section covers sample design, questionnaire development and data analysis for the commercial
and industrial market research.
Sample Design As mentioned above, Ameren Illinois provided the EnerNOC team with billing data for residential and
business accounts that included a variety of information for each commercial customer, including company name, address, annual kWh usage, annual therm usage, division, account number, etc.
Contact names of individuals were not provided in the list. The EnerNOC team created a sample design with 124 separate sample cells – against which survey responses were targeted and
monitored, and which took into account industry, gas usage and electric usage. This grid was
implemented separately and independently for each of the two surveys (the Program Interest survey and the Saturation survey). Appendix A provides additional information about the business sample
design.
The EnerNOC team generated a total of 19,074 randomly selected company locations. In total,
postcard invitations were mailed to all of the locations included in the list, with 9 ,529 cards sent for Program Interest and 9,545 sent for the Saturation survey. These postcards were allocated across
the desired quota cells and invited respondents to go online and complete a survey.
• Customers were originally offered a $25 check for completing the survey, but that amount was
increased to $50 approximately halfway through fielding to increase response to the survey site
• Due to the somewhat limited nature of the list, cards were mailed to all respondents at one time,
and the mailing was followed by several rounds of reminder emails and phone calls
In order to qualify to complete the survey, respondents/companies had to meet the following criteria:
• The site must be a business, or a residence used for a home-operated business
• The respondent must be knowledgeable about decision-making for energy issues for the business
at the specified location
• The company must be responsible for the cost of their electricity or natural gas, and Ameren
must be a provider of either electricity and/or natural gas
• The location must not ONLY be an outdoor structure or facility
A total of 622 Ameren Illinois Business customers completed the Program Interest survey.
• Approximately 72% of those who attempted to complete the survey qualified based on applying
the criteria above.
• The overall net response rate was approximately 10%
• Approximately 21% of those who started the surveys abandoned them before completing it
• Average online survey length was about 26 minutes
Questionnaires The Program Interest questionnaire was designed to cover multiple content areas, including:
1. Screening questions
2. Customer energy needs
C&I Methodology
6-2 www.enernoc.com
3. Basic energy usage
4. Attitudes toward energy usage
5. Energy efficiency measures already taken
6. Purchasing attitudes / behavior & environmental attitudes
7. Interest in potential energy efficiency measures offered by Ameren Illinois
The Saturation questionnaire was designed to cover multiple content areas, including:
1. Screening questions
2. Description of building type: business-use area
3. Description of building type: entire building area
4. Heating and cooling
5. Lighting
6. Office and other equipment
7. Manufacturing / processing operations
8. Energy efficiency measures
Data Analysis
Estimating Take Rates
Market researchers have long recognized that customers tend to over-estimate their likelihood to
participate in new programs and services within the context of a market research study. This means that it has been long recognized that some customers who say that they would be “certain” to
participate in a given program in a survey would, in reality, not participate . This is often referred to as the “say-do” problem; the problem that survey respondents are typically more likely to say they
would do something than actually end up doing it. The analytic challenge, as a result, is to
appropriately adjust stated likelihood-to-participate ratings into more realistic estimates of likely
customer response.
Different options are available for making these adjustments, and the best option depends in part on the nature of the product, service, or program being evaluated. For example, reactions to socially
desirable (including “green”) options need to be adjusted down more aggressively, while those for
certain new technologies need to be adjusted less. The method used by the YGDI / EnerNOC team is based on proprietary research conducted by YGDI during 2010. This research captured stated
likelihood to adopt / purchase a variety of new products / services, at one point in time, and then tracked the actual product / service adoption / purchase over 6 -12 months. As we expected, people
were less likely to actually purchase the specific products / services that they estimated they would
at an earlier point in time.
The primary adjustment factors that were observed in that research were used here to translate
“stated intent” to realistic estimates of likely behavior, and they are outlined in the table below. The adjustment factors depend on how the respondent answered each of the “likelihood to acquire”
questions. Note that these primary adjustment factors are intended to apply to relatively infrequent purchases (no more often than once a year or so). For more regular purchases – those that occur
several times a year – YGDI uses a somewhat different formula, and information about this “regular
purchase adjustment” is provided later in this section.
Essentially, the primary adjustment for irregular purchases says that among those respondents who
rate a given program as a “10” (“extremely likely to participate”) AND if who are rated as “high” on EE information / familiarity, then realistically, about 41% of those people will ultimately sign up for
the program. At the other end of the scale, it says that among the respondents who rate their
likelihood to participate as a “1” on the scale (“extremely unlikely to participate”), only 5% of those

C&I Methodology
EnerNOC Utility Solutions Consulting 6-3
businesses will ultimately sign up for the program. For purposes of this analysis, we assumed that Ameren Illinois would be able to move all businesses to a “high” level of information / familiarity with
the relevant EE options.
Table 6-1 Translating Stated Intent into Take Rates for Irregular Purchases
Scale Rating Adjustment for Those High on
Information
1 3%
2 3%
3 4%
4 8%
5 30%
6 38%
7 48%
8 58%
9 61%
10 72%
As noted above, YGDI uses a different adjustment for products that are purchased more frequently, since customers are more familiar with their “choice set” and have typical purchases that they tend
to make in a given category. Lighting is the only measure tested in this survey which falls into this “regular purchase” category, and the adjustment values outlined below were used for this option and
applied them the same way that was outlined above. Note that Information level (familiarity with the
category) is not used as a differentiator in adjustments for this category since – by definition – all
“buyers” are more familiar with regular purchases.
Table 2-2 Translating Stated Intent into Take Rates for REGULAR Purchases
Scale Rating Adjustment For Those Making Regular
Purchases
1 0%
2 0%
3 0%
4 5%
5 12%
6 26%
7 44%
8 58%
9 67%
10 83%
Testing Programs at Different Payback Levels
In order to provide insight about the impact that varying payback periods might have on customer response to the programs tested, the survey explored response to each program for which payback
period was relevant, at 1, 3, and 5 year payback levels. The survey used a method developed by an

C&I Methodology
6-4 www.enernoc.com
economist by the name of von Westendorp to capture this information; this technique begins by asking respondents to assess their likelihood to adopt a program at a 3 year payback, and then (a) if
they respond positively to this option, asks them to respond to a 5 year payback, or (b) if they respond negatively to this option, asks them to respond to a 1 year payback period. In order to deal
with issues of survey length, the tested program measures were sorted into different categories that
were similar in terms of scale of investment and type of measure. The full 1, 3, and 5 year payback assessment were then conducted for a single program within each category. The remaining
programs within each category were evaluated at the 3 year payback level only . Regression analysis was then used to develop the 1 and 5 year payback values for each measure, using the slopes
observed for the example program in each category.
Weighting
In order to better mirror the business market in Ameren Illinois’s service territory, data were weighted on the basis of the 124 sample cells, in order to ensure that the weighted sample mapped
back to the underlying population on electric usage, gas usage, and region / zone.
Psychographic Segmentation Analysis
One of the goals of the analysis was to explore whether or not there were psychographic customer segments that could be helpful in providing an understanding of why customers responded as they
did to the programs tested, and to support initial thinking about how to prioritize marketing efforts
and marketing communications. Several steps were involved in developing this psychographic
segmentation:
• First, the team analyzed the groups of items that were included in the questionnaire which were
designed to generate psychographic insights (these included Q2 and Q4 (questions addressing opinions toward Ameren Illinois), Q14 (questions exploring how customers think about using
energy in their facility), Q23 and Q25 (questions about priorities when evaluating energy -related
products and services for their facility)).
• Second, the team conducted analyses that were intended to identify groups of items that
respondents tended to evaluate similarly. This process is called “factor analysis,” and refers to
the process of finding and interpreting these groups of items that people think of as similar.
• Third, the team considered all of the attitudinal factors that were identified in step two, along with a variety of other variables to find the ones that generated the most useful segmentation
model. This was partly a trial and error process, but ultimately, the variables selected to be
included in the segmentation model included:
o Whether the business owns or leases their facility (QS5)
o Overall satisfaction with Ameren Illinois (Q3)
o Preference for whether Ameren Illinois should focus on pursuing EE and conservation
initiative, or on keeping costs low for their customers(Q5)
o Kilowatt hours (from sample)
o Agreement / disagreement with the item “Our organization believes that the long -term threat
from global warming and climate change is real, and potentially devastating” (Q14_7)
o Importance of the item “Features and functions included with the product / service” when
selecting which pieces of equipment, electronic devices, or other energy-related products or
services to purchase for their facility (Q23_6)
o Agreement / disagreement with the item “The reality is that the most ene rgy-efficient
equipment is also almost always the best equipment on the market” (Q25_6)
o Agreement / disagreement with the item “Since energy costs make up such a small portion of
our total operating costs, energy issues just don’t get a lot of attention” (Q25_11)
C&I Methodology
EnerNOC Utility Solutions Consulting 6-5
o A calculated variable that was called “EE Informed Level” and was based on indicators of experience with / awareness of EE end use options to-date, and awareness and use of
existing Ameren EE programs
o A calculated variable that was called “Likely Taker Level” and was based on a count of the
frequency that a given respondent rated themselves as “8” or higher on the “1” to “10”
likelihood to participate scale for each of the 34 EE programs tested
Once these inputs were identified, the team tested a wide variety of segmentation solutions,
ultimately selecting a solution that optimized relative segment size, absolute segment sample size, and overall meaningfulness of segment profiles. The solution selected as most appropriate was a
solution containing 6 segments with different response patterns to the final set of selected
segmentation inputs.


Copyright © 2013 EnerNOC, Inc. 7-1
CHAPTER 7
C&I PROGRAM INTEREST SURVEY RESULTS
Note that the “take rates” that are reported in this chapter have been adjusted using the say / do
adjustment model referenced in the Methodology section earlier in this report. As such, they
represent the team’s best estimate of the most likely proportion of customers who wou ld actively sign up for each program, given that they were eligible to do so, and were fully aware of the
program and its potential benefits for them.
As shown in Figure 7-1, the range of take rates across the full range of programs / measures tested
spans from a low of around one-tenth of all eligible customers to a high of just under 50% of all
eligible customers.
Figure 7-1 Maximum and Minimum Take Rates for Business Customers
The first full category of EE measures that were explored considered the idea of purchasing higher than standard efficiency appliances within the context of a normal replacement cycle. Within the nine
appliances or end uses considered, light bulbs were the technology that business customers are estimated to be the most likely to upgrade to an EE option at each payback period level (and this is
largely due to the use of the “regular purchase” adjustment for this product category). Across the
other technologies, the take rates are highest at each payback period level for the least expensive equipment purchases: PCs and light bulbs. While – as expected – take rates are higher for lower
payback periods, these ranges are smallest for basic office equipment such as printer and servers
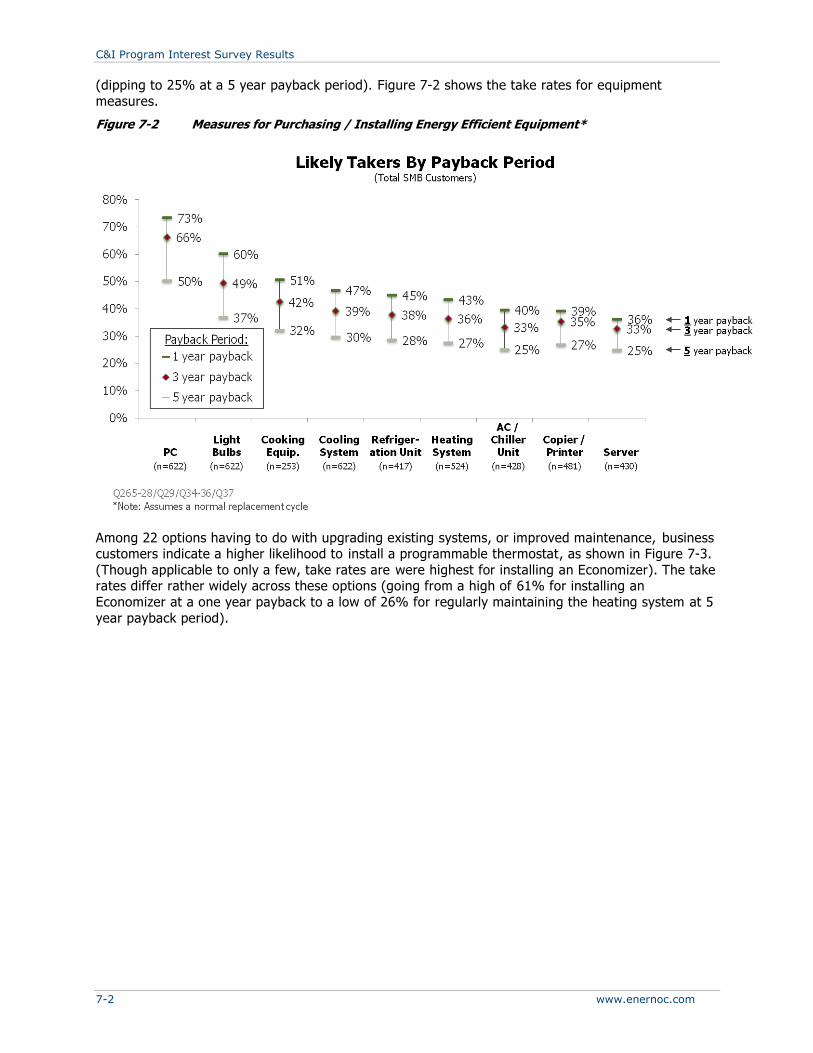
C&I Program Interest Survey Results
7-2 www.enernoc.com
(dipping to 25% at a 5 year payback period). Figure 7-2 shows the take rates for equipment
measures.
Figure 7-2 Measures for Purchasing / Installing Energy Efficient Equipment*
Among 22 options having to do with upgrading existing systems, or improved maintenance, business customers indicate a higher likelihood to install a programmable thermostat, as shown in Figure 7-3.
(Though applicable to only a few, take rates are were highest for installing an Economizer). The take rates differ rather widely across these options (going from a high of 61% for installing an
Economizer at a one year payback to a low of 26% for regularly maintaining the heating system at 5
year payback period).
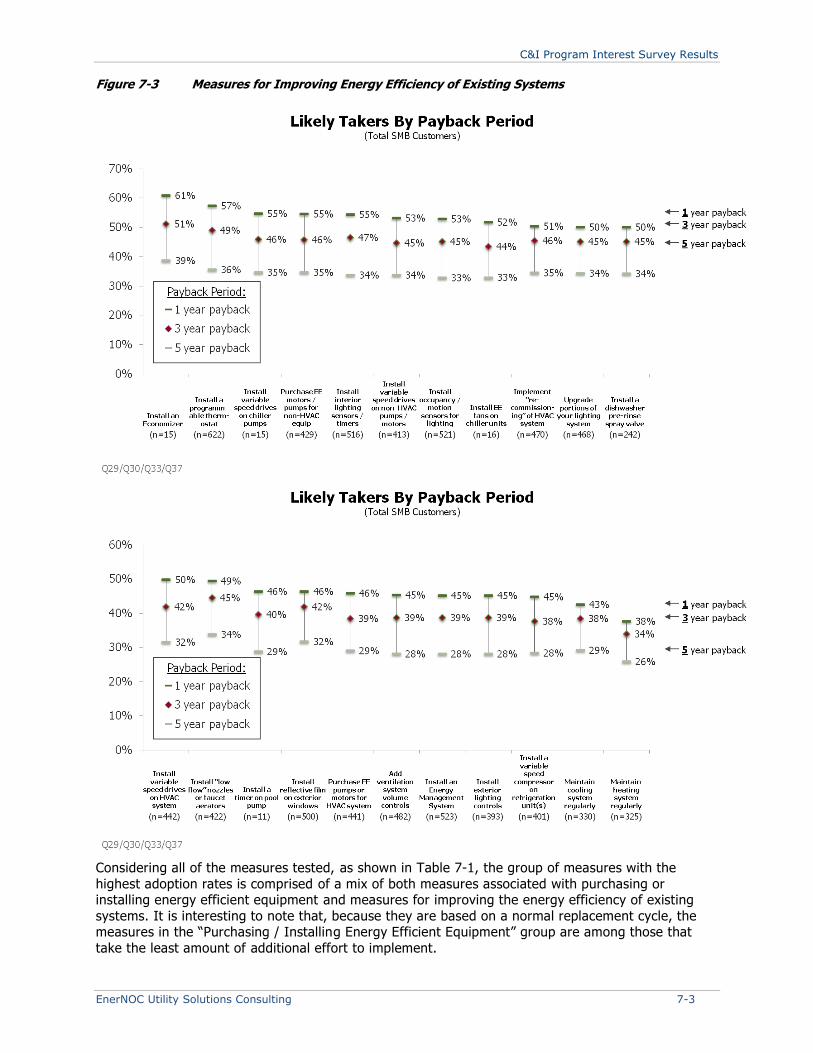
C&I Program Interest Survey Results
EnerNOC Utility Solutions Consulting 7-3
Figure 7-3 Measures for Improving Energy Efficiency of Existing Systems
Considering all of the measures tested, as shown in Table 7-1, the group of measures with the
highest adoption rates is comprised of a mix of both measures associated with purchasing or installing energy efficient equipment and measures for improving the energy efficiency of existing
systems. It is interesting to note that, because they are based on a normal replacement cycle, the measures in the “Purchasing / Installing Energy Efficient Equipment” group are among those that
take the least amount of additional effort to implement.
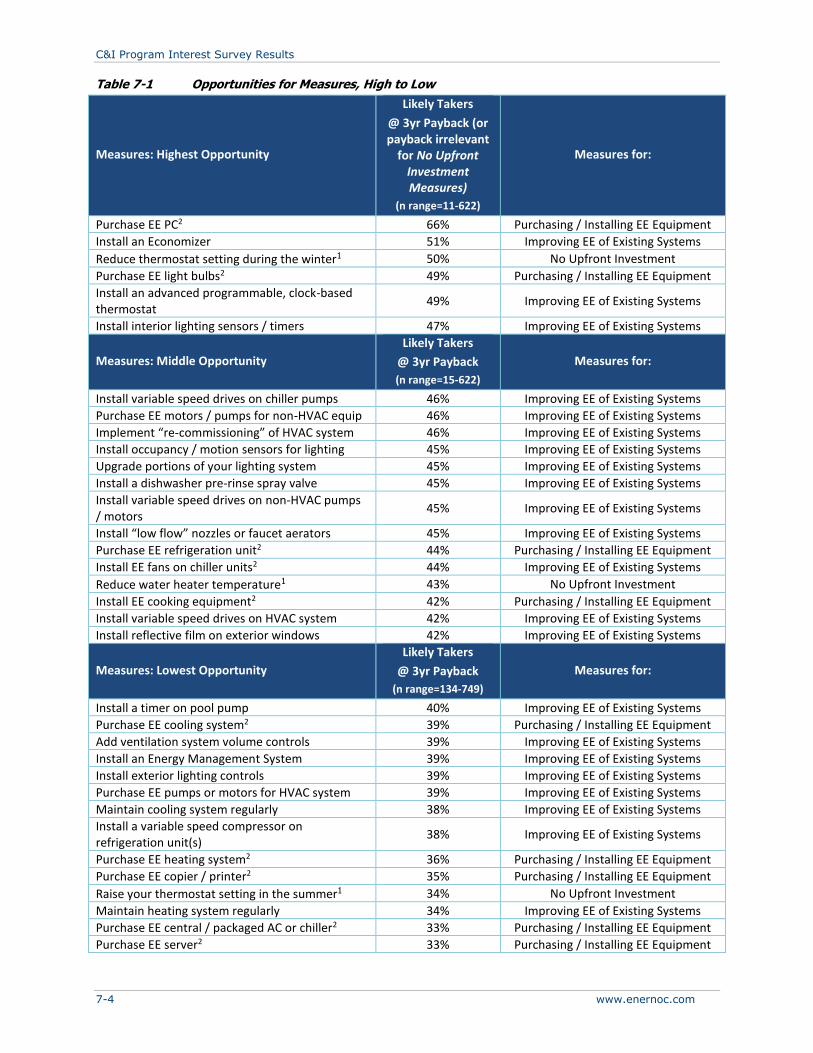
C&I Program Interest Survey Results
7-4 www.enernoc.com
Table 7-1 Opportunities for Measures, High to Low
Measures: Highest Opportunity
Likely Takers
@ 3yr Payback (or payback irrelevant
for No Upfront Investment Measures)
(n range=11-622)
Measures for:
Purchase EE PC2 66% Purchasing / Installing EE Equipment
Install an Economizer 51% Improving EE of Existing Systems
Reduce thermostat setting during the winter1 50% No Upfront Investment
Purchase EE light bulbs2 49% Purchasing / Installing EE Equipment
Install an advanced programmable, clock-based thermostat
49% Improving EE of Existing Systems
Install interior lighting sensors / timers 47% Improving EE of Existing Systems
Measures: Middle Opportunity
Likely Takers
@ 3yr Payback
(n range=15-622)
Measures for:
Install variable speed drives on chiller pumps 46% Improving EE of Existing Systems
Purchase EE motors / pumps for non-HVAC equip 46% Improving EE of Existing Systems
Implement “re-commissioning” of HVAC system 46% Improving EE of Existing Systems
Install occupancy / motion sensors for lighting 45% Improving EE of Existing Systems
Upgrade portions of your lighting system 45% Improving EE of Existing Systems
Install a dishwasher pre-rinse spray valve 45% Improving EE of Existing Systems
Install variable speed drives on non-HVAC pumps / motors
45% Improving EE of Existing Systems
Install “low flow” nozzles or faucet aerators 45% Improving EE of Existing Systems
Purchase EE refrigeration unit2 44% Purchasing / Installing EE Equipment
Install EE fans on chiller units2 44% Improving EE of Existing Systems
Reduce water heater temperature1 43% No Upfront Investment
Install EE cooking equipment2 42% Purchasing / Installing EE Equipment
Install variable speed drives on HVAC system 42% Improving EE of Existing Systems
Install reflective film on exterior windows 42% Improving EE of Existing Systems
Measures: Lowest Opportunity
Likely Takers
@ 3yr Payback
(n range=134-749)
Measures for:
Install a timer on pool pump 40% Improving EE of Existing Systems
Purchase EE cooling system2 39% Purchasing / Installing EE Equipment
Add ventilation system volume controls 39% Improving EE of Existing Systems
Install an Energy Management System 39% Improving EE of Existing Systems
Install exterior lighting controls 39% Improving EE of Existing Systems
Purchase EE pumps or motors for HVAC system 39% Improving EE of Existing Systems
Maintain cooling system regularly 38% Improving EE of Existing Systems
Install a variable speed compressor on refrigeration unit(s)
38% Improving EE of Existing Systems
Purchase EE heating system2 36% Purchasing / Installing EE Equipment
Purchase EE copier / printer2 35% Purchasing / Installing EE Equipment
Raise your thermostat setting in the summer1 34% No Upfront Investment
Maintain heating system regularly 34% Improving EE of Existing Systems
Purchase EE central / packaged AC or chiller2 33% Purchasing / Installing EE Equipment
Purchase EE server2 33% Purchasing / Installing EE Equipment

C&I Program Interest Survey Results
EnerNOC Utility Solutions Consulting 7-5
Some subtle differences exist in the mean take rates among various demographic groups , as shown
in Figure 7-4. Groups exhibiting the higher opportunity than their counterparts include:
• Organizations with 20 or more employees
• Organizations with either small facilities (less than 5,000 sq. ft.) or very large facilities (greater
than 15,000 sq. ft.)
• Organizations operating as/in a school or college
Figure 7-4 Likely Takers by Demographics
More striking differences in the mean take rate, however, relate to attitudinal differences as shown
in Figure 7-5. Unsurprisingly, customers who have highly “green” and/or highly cost-savings-focused
attitudes consistently show much higher likelihoods to adopt energy efficiency measures.
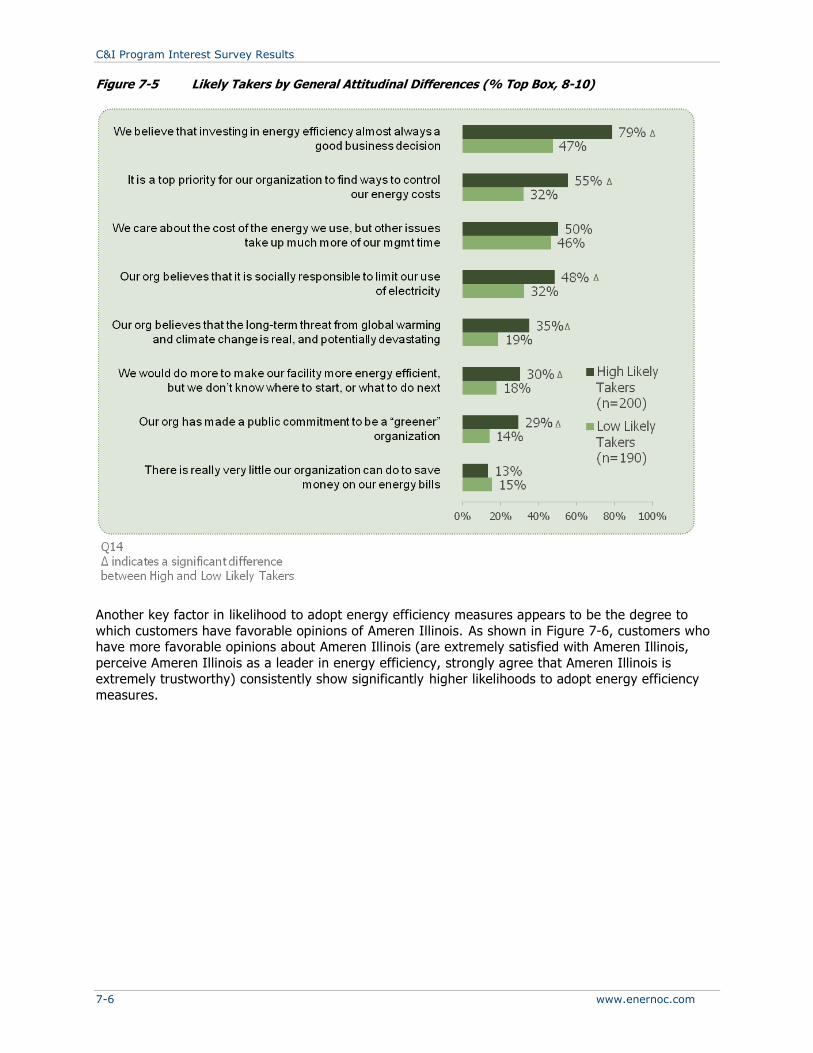
C&I Program Interest Survey Results
7-6 www.enernoc.com
Figure 7-5 Likely Takers by General Attitudinal Differences (% Top Box, 8-10)
Another key factor in likelihood to adopt energy efficiency measures appears to be the degree to
which customers have favorable opinions of Ameren Illinois. As shown in Figure 7-6, customers who have more favorable opinions about Ameren Illinois (are extremely satisfied with Ameren Illinois,
perceive Ameren Illinois as a leader in energy efficiency, strongly agree that Ameren Illinois is extremely trustworthy) consistently show significantly higher likelihoods to adopt energy efficiency
measures.
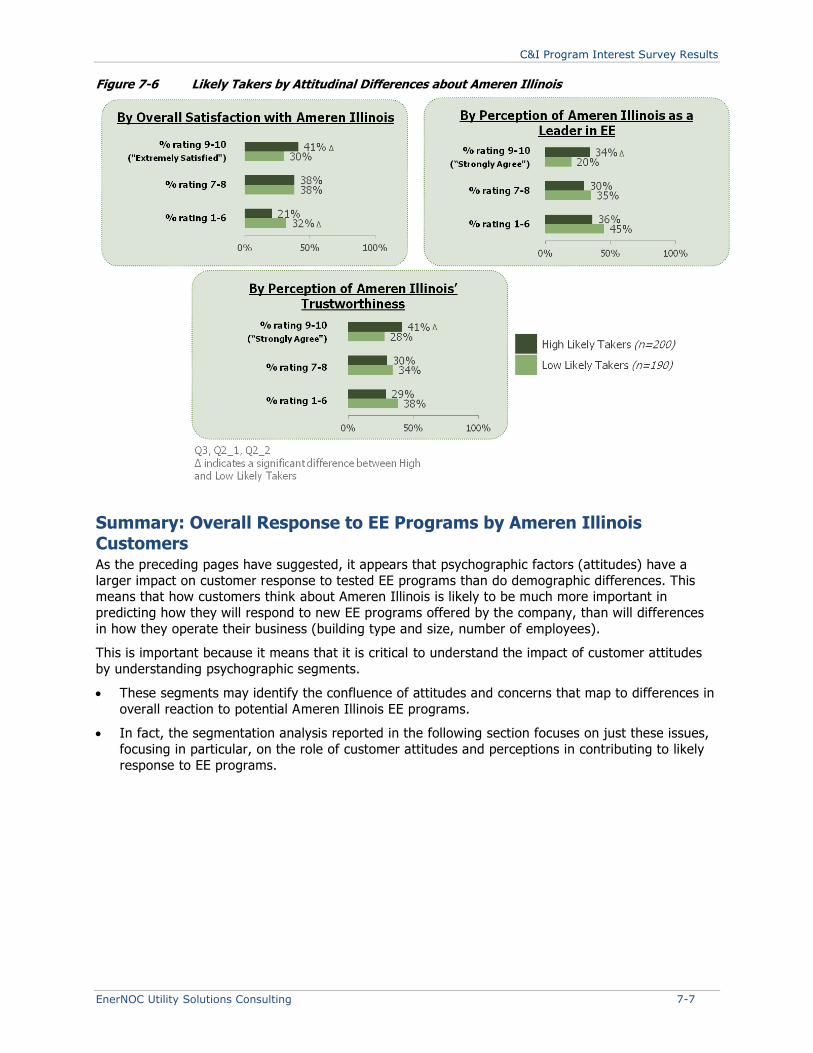
C&I Program Interest Survey Results
EnerNOC Utility Solutions Consulting 7-7
Figure 7-6 Likely Takers by Attitudinal Differences about Ameren Illinois
Summary: Overall Response to EE Programs by Ameren Illinois Customers As the preceding pages have suggested, it appears that psychographic factors (attitudes) have a
larger impact on customer response to tested EE programs than do demographic differences. This means that how customers think about Ameren Illinois is likely to be much more important in
predicting how they will respond to new EE programs offered by the company, than will differences
in how they operate their business (building type and size, number of employees).
This is important because it means that it is critical to understand the impact of customer attitudes
by understanding psychographic segments.
• These segments may identify the confluence of attitudes and concerns that map to differences in
overall reaction to potential Ameren Illinois EE programs.
• In fact, the segmentation analysis reported in the following section focuses on just these issues,
focusing in particular, on the role of customer attitudes and perceptions in contributing to likely
response to EE programs.

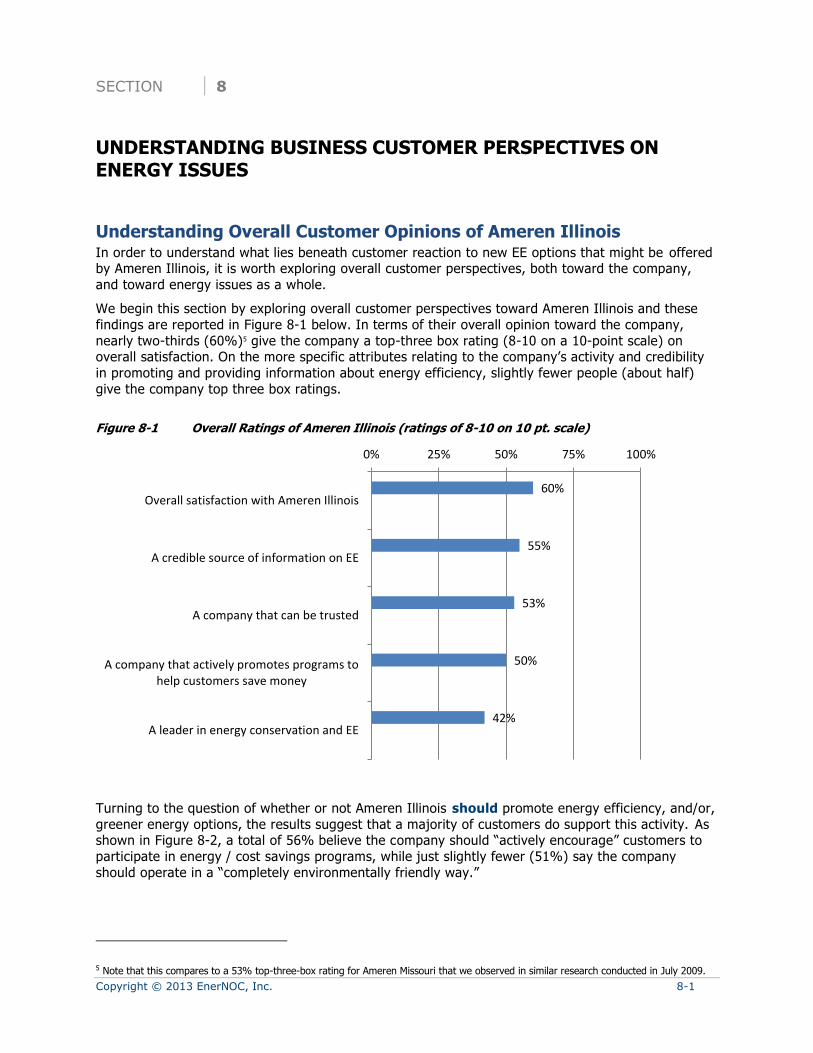
Copyright © 2013 EnerNOC, Inc. 8-1
SECTION 8
UNDERSTANDING BUSINESS CUSTOMER PERSPECTIVES ON ENERGY ISSUES
Understanding Overall Customer Opinions of Ameren Illinois In order to understand what lies beneath customer reaction to new EE options that might be offered by Ameren Illinois, it is worth exploring overall customer perspectives, both toward the company,
and toward energy issues as a whole.
We begin this section by exploring overall customer perspectives toward Ameren Illinois and these
findings are reported in Figure 8-1 below. In terms of their overall opinion toward the company,
nearly two-thirds (60%)5 give the company a top-three box rating (8-10 on a 10-point scale) on overall satisfaction. On the more specific attributes relating to the company’s activity and credibility
in promoting and providing information about energy efficiency, slightly fewer people (about half)
give the company top three box ratings.
Figure 8-1 Overall Ratings of Ameren Illinois (ratings of 8-10 on 10 pt. scale)
Turning to the question of whether or not Ameren Illinois should promote energy efficiency, and/or,
greener energy options, the results suggest that a majority of customers do support this activity. As shown in Figure 8-2, a total of 56% believe the company should “actively encourage” customers to
participate in energy / cost savings programs, while just slightly fewer (51%) say the company
should operate in a “completely environmentally friendly way.”
5 Note that this compares to a 53% top-three-box rating for Ameren Missouri that we observed in similar research conducted in July 2009.
60%
55%
53%
50%
42%
0% 25% 50% 75% 100%
Overall satisfaction with Ameren Illinois
A credible source of information on EE
A company that can be trusted
A company that actively promotes programs tohelp customers save money
A leader in energy conservation and EE

Understanding Business Customer Perspectives on Energy Issues
8-2 www.enernoc.com
Figure 8-2 Ratings of Ameren Illinois on EE-Specific Issues (ratings of 8-10 on 10 pt. scale)
It is interesting – and important – to note, however, that while Ameren Illinois customers appear to support EE, and green-focused activities by the company in the abstract, they do not want these
activities to cost them more. When customers are asked a forced choice question, just under half say that the company should do everything possible to keep costs as low as possible, while only 3% say
the company should pursue EE or green options if doing so would mean they would have to pay a
little more (Figure 8-3). The remainder of the population wants both things at the same time (to
keep costs as low as possible and pursue these other initiatives).
Figure 8-3 Responses to forced choice question on EE / Green vs. Cost Options
Exploring Customer Segments So far, our analysis of customer perspectives on energy issues has only considered customers as a
whole. Customers differ, however, and this section of the report explores some of the key divisions that exist within the non-residential customer base. Specifically, the team developed a segmentation
model that disaggregated business customers into groups that differ in terms of whether, and why,
51%
52%
56%
0% 25% 50% 75% 100%
Operate in a completely environmentallyfriendly way
Do everything possible to supply renewable /clean energy
Actively encourage customers to participatein energy savings / cost savings programs
49%
3%
48%
0% 25% 50% 75% 100%
Both are equally important
Pursue other (EE / green) initiatives even ifthis would mean you would have to pay a little
more
Do everything possible to keep costs as low aspossible
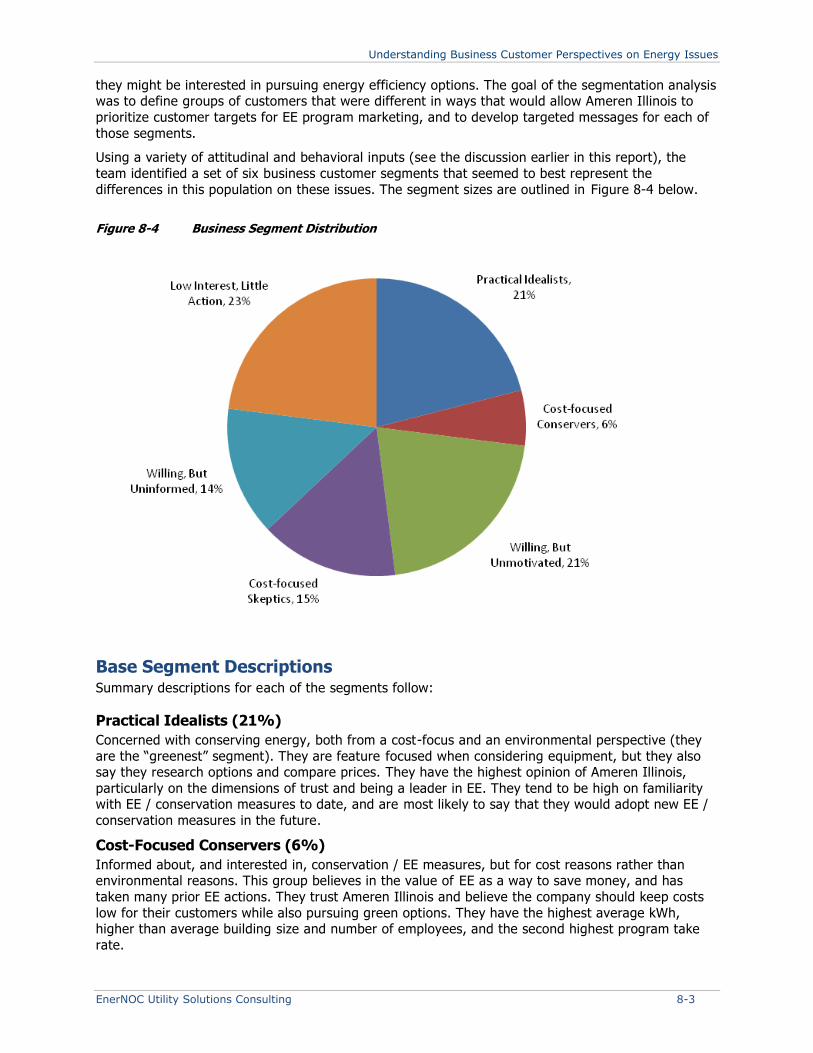
Understanding Business Customer Perspectives on Energy Issues
EnerNOC Utility Solutions Consulting 8-3
they might be interested in pursuing energy efficiency options. The goal of the segmentation analysis was to define groups of customers that were different in ways that would allow Ameren Illinois to
prioritize customer targets for EE program marketing, and to develop targeted messages for each of
those segments.
Using a variety of attitudinal and behavioral inputs (see the discussion earlier in this report), the
team identified a set of six business customer segments that seemed to best represent the
differences in this population on these issues. The segment sizes are outlined in Figure 8-4 below.
Figure 8-4 Business Segment Distribution
Base Segment Descriptions Summary descriptions for each of the segments follow:
Practical Idealists (21%)
Concerned with conserving energy, both from a cost-focus and an environmental perspective (they
are the “greenest” segment). They are feature focused when considering equipment, but they also say they research options and compare prices. They have the highest opinion of Ameren Illinois,
particularly on the dimensions of trust and being a leader in EE. They tend to be high on familiarity with EE / conservation measures to date, and are most likely to say that they would adopt new EE /
conservation measures in the future.
Cost-Focused Conservers (6%)
Informed about, and interested in, conservation / EE measures, but for cost reasons rather than environmental reasons. This group believes in the value of EE as a way to save money, and has
taken many prior EE actions. They trust Ameren Illinois and believe the company should keep costs
low for their customers while also pursuing green options. They have the highest average kWh, higher than average building size and number of employees, and the second highest program take
rate.
Understanding Business Customer Perspectives on Energy Issues
8-4 www.enernoc.com
Willing, But Unmotivated (21%)
This group believes in conserving energy, for both environmental and cost reasons, and has the highest familiarity with EE / conservation measures. Despite this, they aren’t as active as you might
expect in conserving energy, which could be due to the fact that they already have lower than
average kWh. They are, however, likely to say they would adopt new EE programs in the future.
Cost-Focused Skeptics (15%)
Skeptical about global warming and the need for EE, this group is only focused on saving energy if it will in turn save them money. They have a positive opinion of Ameren Illinois, but believe their
priority should be keeping costs low for their customers rather than focusing on conservation. While unfamiliar with EE measures, they have higher than average kWh and would be somewhat likely to
adopt new EE / conservation measures in the future if they thought it would save them money.
Willing, But Uninformed (14%)
This group is relatively less experienced with EE / conservation measures to-date, and unsure of what they could be doing in this area, but they believe that conservation is important and that
Ameren Illinois should be focused on pursuing green options in addition to keeping energy costs low.
They have an average building size and number of employees, as well as have lower than average kWh. They are low on take rates across programs, and are the lowest on familiarity / experience
with EE conservation measures currently.
Low Interest, Little Action (23%)
This group has very little interest in conservation or EE. This group actively dislikes Ameren Illinois, particularly on the dimensions of trust and being a leader in EE. They do not want the company to
encourage customers to save energy, nor do they want it to pursue green options. They do want the company to keep costs low as its sole focus. They operate in smaller than average size buildings,
and have smaller than average company size (more than half have less than 10 employees). They
are the lowest on likelihood to adopt new EE programs and second lowest on existing familiarity.
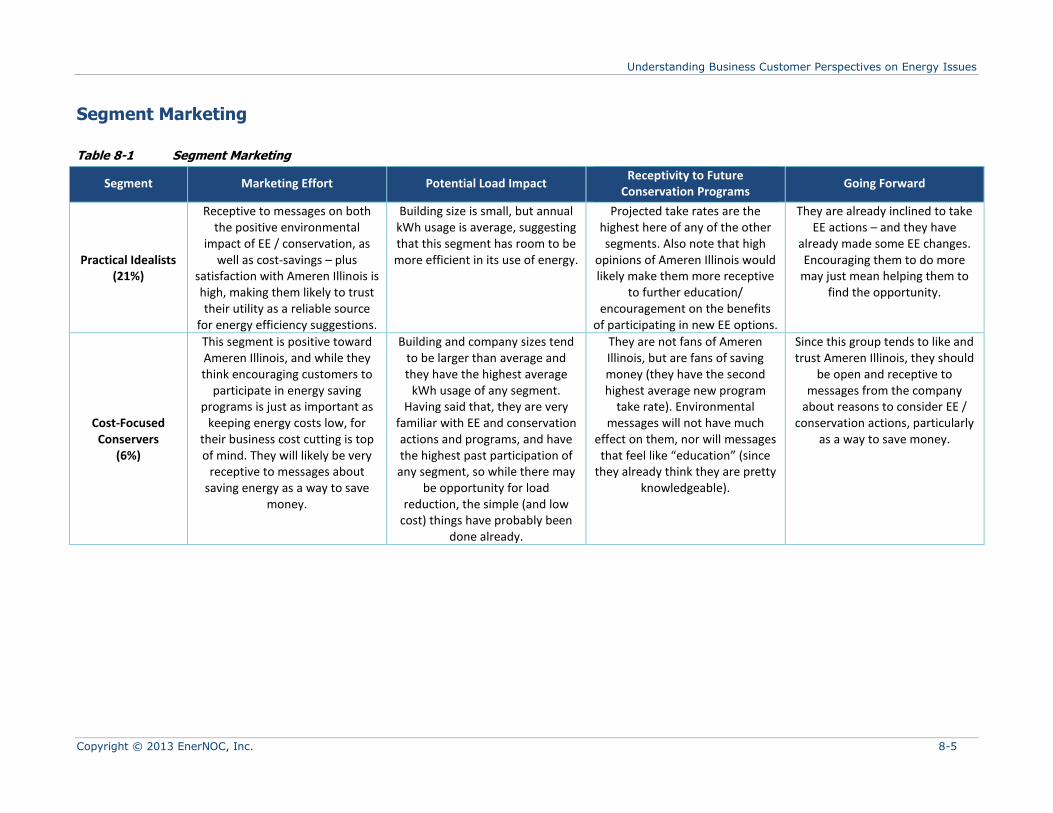
Understanding Business Customer Perspectives on Energy Issues
Copyright © 2013 EnerNOC, Inc. 8-5
Segment Marketing
Table 8-1 Segment Marketing
Segment Marketing Effort Potential Load Impact Receptivity to Future
Conservation Programs Going Forward
Practical Idealists (21%)
Receptive to messages on both the positive environmental
impact of EE / conservation, as well as cost-savings – plus
satisfaction with Ameren Illinois is high, making them likely to trust their utility as a reliable source
for energy efficiency suggestions.
Building size is small, but annual kWh usage is average, suggesting that this segment has room to be more efficient in its use of energy.
Projected take rates are the highest here of any of the other segments. Also note that high
opinions of Ameren Illinois would likely make them more receptive
to further education/ encouragement on the benefits
of participating in new EE options.
They are already inclined to take EE actions – and they have
already made some EE changes. Encouraging them to do more
may just mean helping them to find the opportunity.
Cost-Focused Conservers
(6%)
This segment is positive toward Ameren Illinois, and while they think encouraging customers to
participate in energy saving programs is just as important as
keeping energy costs low, for their business cost cutting is top of mind. They will likely be very
receptive to messages about saving energy as a way to save
money.
Building and company sizes tend to be larger than average and they have the highest average
kWh usage of any segment. Having said that, they are very
familiar with EE and conservation actions and programs, and have the highest past participation of any segment, so while there may
be opportunity for load reduction, the simple (and low
cost) things have probably been done already.
They are not fans of Ameren Illinois, but are fans of saving money (they have the second highest average new program
take rate). Environmental messages will not have much
effect on them, nor will messages that feel like “education” (since
they already think they are pretty knowledgeable).
Since this group tends to like and trust Ameren Illinois, they should
be open and receptive to messages from the company
about reasons to consider EE / conservation actions, particularly
as a way to save money.
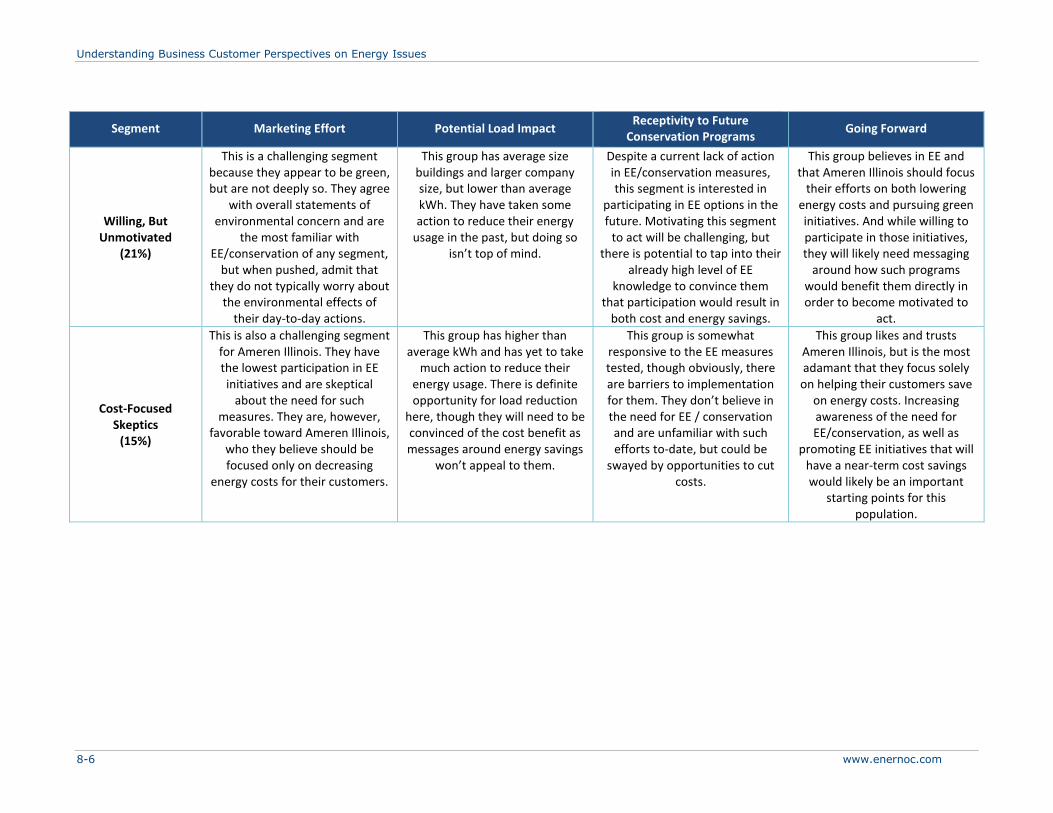
Understanding Business Customer Perspectives on Energy Issues
8-6 www.enernoc.com
Segment Marketing Effort Potential Load Impact Receptivity to Future
Conservation Programs Going Forward
Willing, But Unmotivated
(21%)
This is a challenging segment because they appear to be green, but are not deeply so. They agree
with overall statements of environmental concern and are
the most familiar with EE/conservation of any segment,
but when pushed, admit that they do not typically worry about
the environmental effects of their day-to-day actions.
This group has average size buildings and larger company size, but lower than average kWh. They have taken some action to reduce their energy
usage in the past, but doing so isn’t top of mind.
Despite a current lack of action in EE/conservation measures, this segment is interested in
participating in EE options in the future. Motivating this segment
to act will be challenging, but there is potential to tap into their
already high level of EE knowledge to convince them
that participation would result in both cost and energy savings.
This group believes in EE and that Ameren Illinois should focus
their efforts on both lowering energy costs and pursuing green initiatives. And while willing to participate in those initiatives, they will likely need messaging
around how such programs would benefit them directly in order to become motivated to
act.
Cost-Focused Skeptics
(15%)
This is also a challenging segment for Ameren Illinois. They have the lowest participation in EE initiatives and are skeptical
about the need for such measures. They are, however,
favorable toward Ameren Illinois, who they believe should be focused only on decreasing
energy costs for their customers.
This group has higher than average kWh and has yet to take
much action to reduce their energy usage. There is definite opportunity for load reduction
here, though they will need to be convinced of the cost benefit as messages around energy savings
won’t appeal to them.
This group is somewhat responsive to the EE measures tested, though obviously, there are barriers to implementation for them. They don’t believe in the need for EE / conservation and are unfamiliar with such efforts to-date, but could be
swayed by opportunities to cut costs.
This group likes and trusts Ameren Illinois, but is the most adamant that they focus solely on helping their customers save
on energy costs. Increasing awareness of the need for EE/conservation, as well as
promoting EE initiatives that will have a near-term cost savings would likely be an important
starting points for this population.
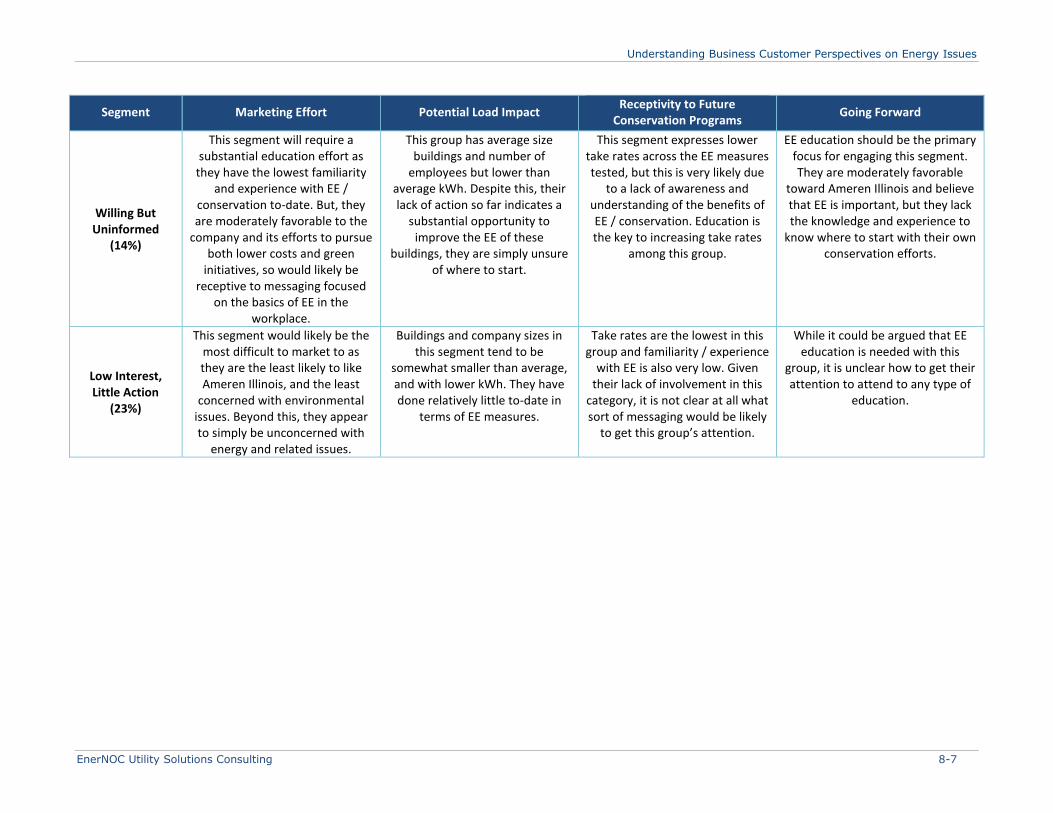
Understanding Business Customer Perspectives on Energy Issues
EnerNOC Utility Solutions Consulting 8-7
Segment Marketing Effort Potential Load Impact Receptivity to Future
Conservation Programs Going Forward
Willing But Uninformed
(14%)
This segment will require a substantial education effort as
they have the lowest familiarity and experience with EE /
conservation to-date. But, they are moderately favorable to the
company and its efforts to pursue both lower costs and green
initiatives, so would likely be receptive to messaging focused
on the basics of EE in the workplace.
This group has average size buildings and number of
employees but lower than average kWh. Despite this, their lack of action so far indicates a
substantial opportunity to improve the EE of these
buildings, they are simply unsure of where to start.
This segment expresses lower take rates across the EE measures tested, but this is very likely due
to a lack of awareness and understanding of the benefits of EE / conservation. Education is the key to increasing take rates
among this group.
EE education should be the primary focus for engaging this segment. They are moderately favorable
toward Ameren Illinois and believe that EE is important, but they lack the knowledge and experience to
know where to start with their own conservation efforts.
Low Interest, Little Action
(23%)
This segment would likely be the most difficult to market to as they are the least likely to like Ameren Illinois, and the least
concerned with environmental issues. Beyond this, they appear to simply be unconcerned with
energy and related issues.
Buildings and company sizes in this segment tend to be
somewhat smaller than average, and with lower kWh. They have done relatively little to-date in
terms of EE measures.
Take rates are the lowest in this group and familiarity / experience
with EE is also very low. Given their lack of involvement in this
category, it is not clear at all what sort of messaging would be likely
to get this group’s attention.
While it could be argued that EE education is needed with this
group, it is unclear how to get their attention to attend to any type of
education.
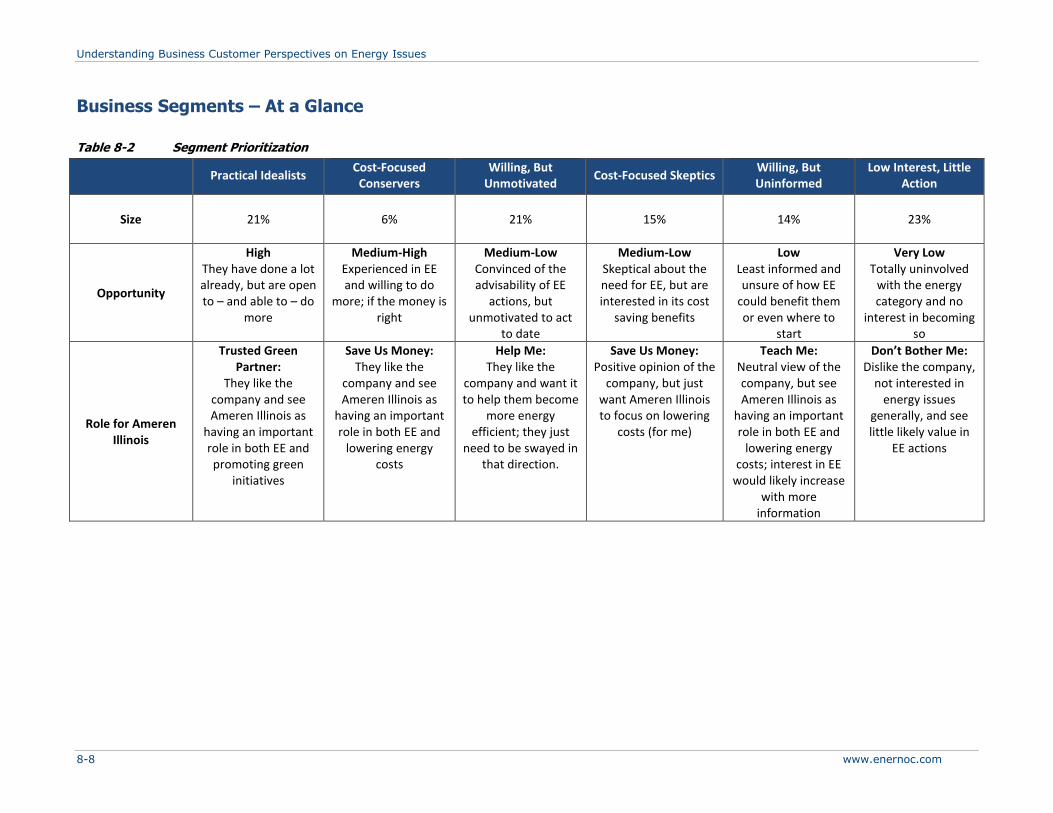
Understanding Business Customer Perspectives on Energy Issues
8-8 www.enernoc.com
Business Segments – At a Glance
Table 8-2 Segment Prioritization
Practical Idealists
Cost-Focused Conservers
Willing, But Unmotivated
Cost-Focused Skeptics Willing, But Uninformed
Low Interest, Little Action
Size
21% 6% 21% 15% 14% 23%
Opportunity
High They have done a lot already, but are open to – and able to – do
more
Medium-High Experienced in EE and willing to do
more; if the money is right
Medium-Low Convinced of the advisability of EE
actions, but unmotivated to act
to date
Medium-Low Skeptical about the need for EE, but are interested in its cost
saving benefits
Low Least informed and unsure of how EE
could benefit them or even where to
start
Very Low Totally uninvolved
with the energy category and no
interest in becoming so
Role for Ameren Illinois
Trusted Green Partner:
They like the company and see Ameren Illinois as
having an important role in both EE and promoting green
initiatives
Save Us Money: They like the
company and see Ameren Illinois as
having an important role in both EE and
lowering energy costs
Help Me: They like the
company and want it to help them become
more energy efficient; they just
need to be swayed in that direction.
Save Us Money: Positive opinion of the
company, but just want Ameren Illinois to focus on lowering
costs (for me)
Teach Me: Neutral view of the company, but see Ameren Illinois as
having an important role in both EE and
lowering energy costs; interest in EE
would likely increase with more
information
Don’t Bother Me: Dislike the company,
not interested in energy issues
generally, and see little likely value in
EE actions
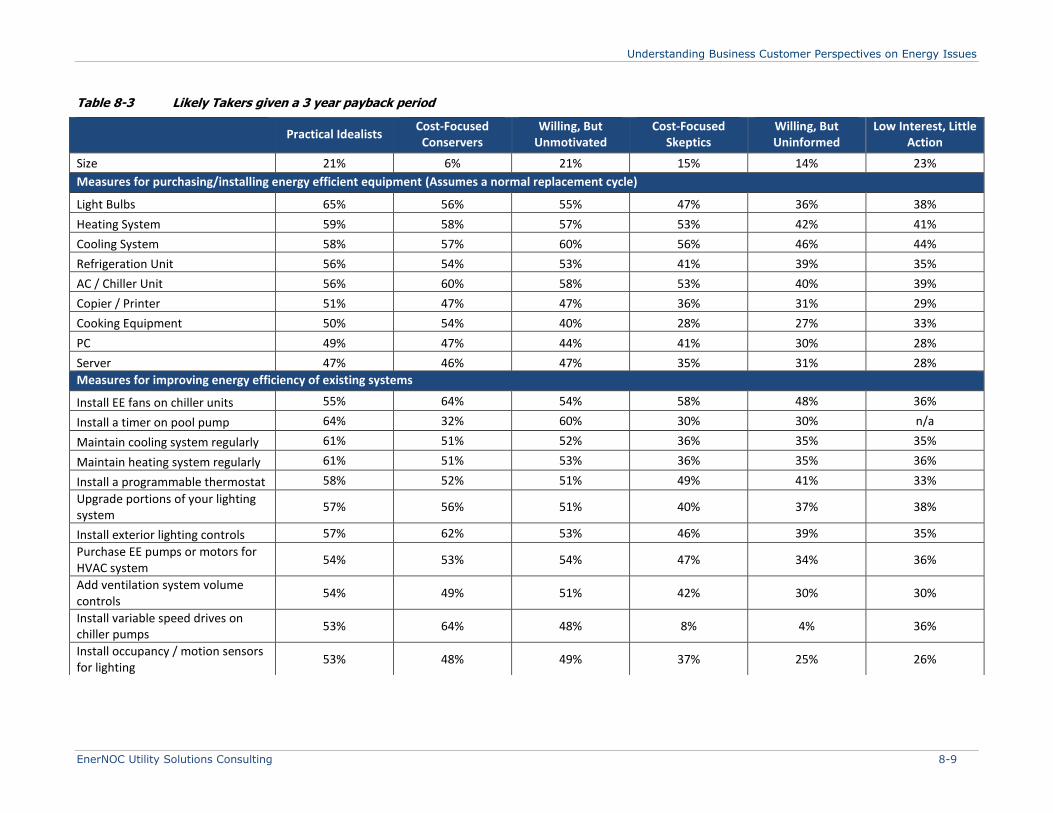
Understanding Business Customer Perspectives on Energy Issues
EnerNOC Utility Solutions Consulting 8-9
Table 8-3 Likely Takers given a 3 year payback period
Practical Idealists
Cost-Focused Conservers
Willing, But Unmotivated
Cost-Focused Skeptics
Willing, But Uninformed
Low Interest, Little Action
Size 21% 6% 21% 15% 14% 23%
Measures for purchasing/installing energy efficient equipment (Assumes a normal replacement cycle)
Light Bulbs 65% 56% 55% 47% 36% 38%
Heating System 59% 58% 57% 53% 42% 41%
Cooling System 58% 57% 60% 56% 46% 44%
Refrigeration Unit 56% 54% 53% 41% 39% 35%
AC / Chiller Unit 56% 60% 58% 53% 40% 39%
Copier / Printer 51% 47% 47% 36% 31% 29%
Cooking Equipment 50% 54% 40% 28% 27% 33%
PC 49% 47% 44% 41% 30% 28%
Server 47% 46% 47% 35% 31% 28%
Measures for improving energy efficiency of existing systems
Install EE fans on chiller units 55% 64% 54% 58% 48% 36%
Install a timer on pool pump 64% 32% 60% 30% 30% n/a
Maintain cooling system regularly 61% 51% 52% 36% 35% 35%
Maintain heating system regularly 61% 51% 53% 36% 35% 36%
Install a programmable thermostat 58% 52% 51% 49% 41% 33%
Upgrade portions of your lighting system
57% 56% 51% 40% 37% 38%
Install exterior lighting controls 57% 62% 53% 46% 39% 35%
Purchase EE pumps or motors for HVAC system
54% 53% 54% 47% 34% 36%
Add ventilation system volume controls
54% 49% 51% 42% 30% 30%
Install variable speed drives on chiller pumps
53% 64% 48% 8% 4% 36%
Install occupancy / motion sensors for lighting
53% 48% 49% 37% 25% 26%
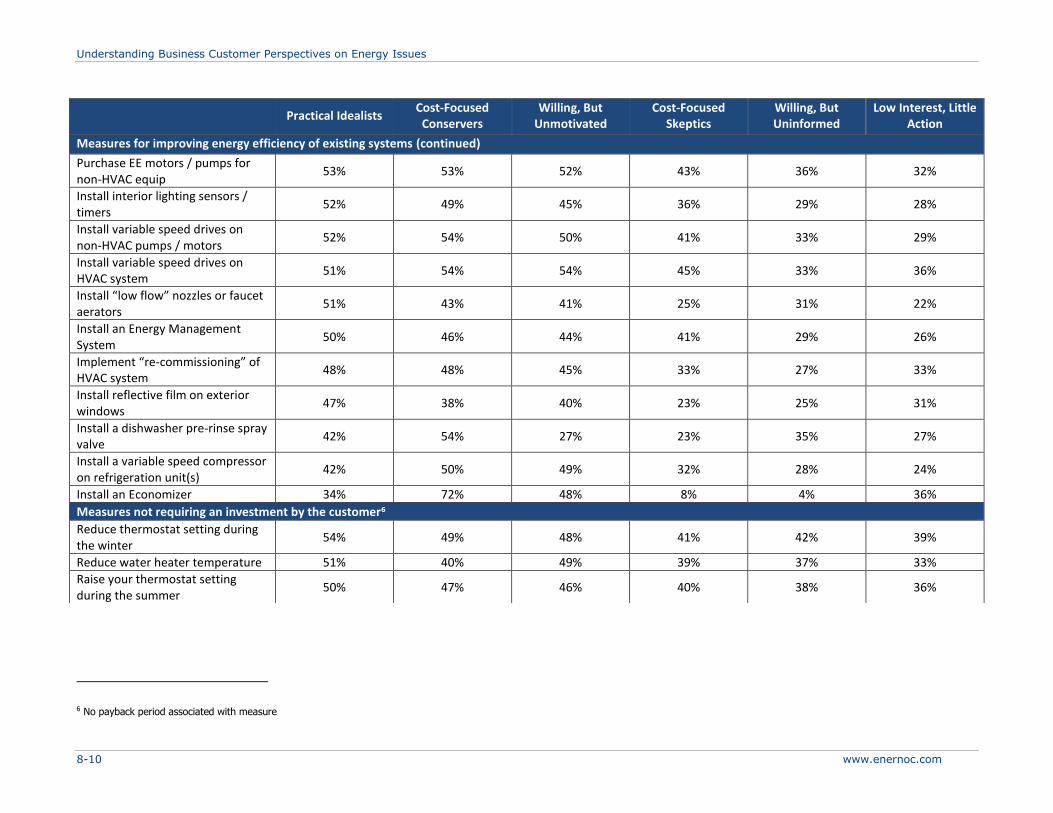
Understanding Business Customer Perspectives on Energy Issues
8-10 www.enernoc.com
6 No payback period associated with measure
Practical Idealists
Cost-Focused Conservers
Willing, But Unmotivated
Cost-Focused Skeptics
Willing, But Uninformed
Low Interest, Little Action
Measures for improving energy efficiency of existing systems (continued)
Purchase EE motors / pumps for non-HVAC equip
53% 53% 52% 43% 36% 32%
Install interior lighting sensors / timers
52% 49% 45% 36% 29% 28%
Install variable speed drives on non-HVAC pumps / motors
52% 54% 50% 41% 33% 29%
Install variable speed drives on HVAC system
51% 54% 54% 45% 33% 36%
Install “low flow” nozzles or faucet aerators
51% 43% 41% 25% 31% 22%
Install an Energy Management System
50% 46% 44% 41% 29% 26%
Implement “re-commissioning” of HVAC system
48% 48% 45% 33% 27% 33%
Install reflective film on exterior windows
47% 38% 40% 23% 25% 31%
Install a dishwasher pre-rinse spray valve
42% 54% 27% 23% 35% 27%
Install a variable speed compressor on refrigeration unit(s)
42% 50% 49% 32% 28% 24%
Install an Economizer 34% 72% 48% 8% 4% 36%
Measures not requiring an investment by the customer6
Reduce thermostat setting during the winter
54% 49% 48% 41% 42% 39%
Reduce water heater temperature 51% 40% 49% 39% 37% 33%
Raise your thermostat setting during the summer
50% 47% 46% 40% 38% 36%
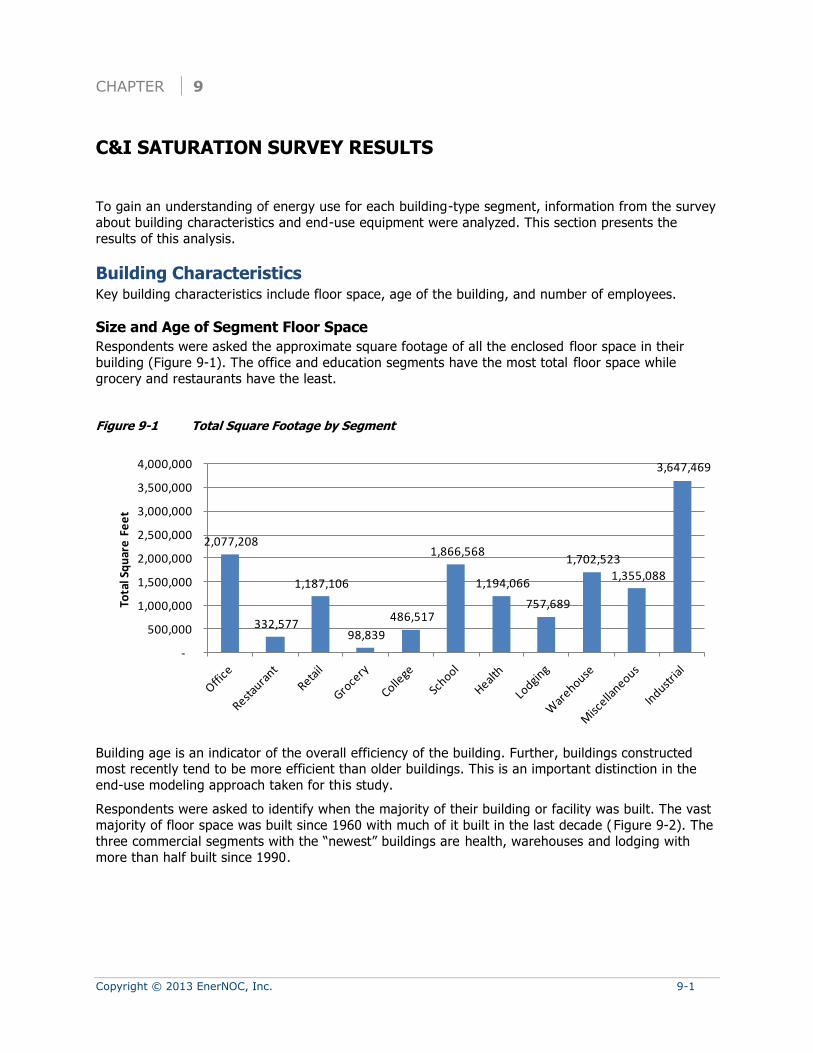
Copyright © 2013 EnerNOC, Inc. 9-1
CHAPTER 9
C&I SATURATION SURVEY RESULTS
To gain an understanding of energy use for each building-type segment, information from the survey
about building characteristics and end-use equipment were analyzed. This section presents the
results of this analysis.
Building Characteristics Key building characteristics include floor space, age of the building, and number of employees.
Size and Age of Segment Floor Space
Respondents were asked the approximate square footage of all the enclosed floor space in their
building (Figure 9-1). The office and education segments have the most total floor space while
grocery and restaurants have the least.
Figure 9-1 Total Square Footage by Segment
Building age is an indicator of the overall efficiency of the building. Further, buildings constructed most recently tend to be more efficient than older buildings. This is an important distinction in the
end-use modeling approach taken for this study.
Respondents were asked to identify when the majority of their building or facility was built. The vast
majority of floor space was built since 1960 with much of it built in the last decade (Figure 9-2). The
three commercial segments with the “newest” buildings are health, warehouses and lodging with
more than half built since 1990.
2,077,208
332,577
1,187,106
98,839
486,517
1,866,568
1,194,066
757,689
1,702,523
1,355,088
3,647,469
-
500,000
1,000,000
1,500,000
2,000,000
2,500,000
3,000,000
3,500,000
4,000,000
Tota
l Sq
uar
e F
ee
t
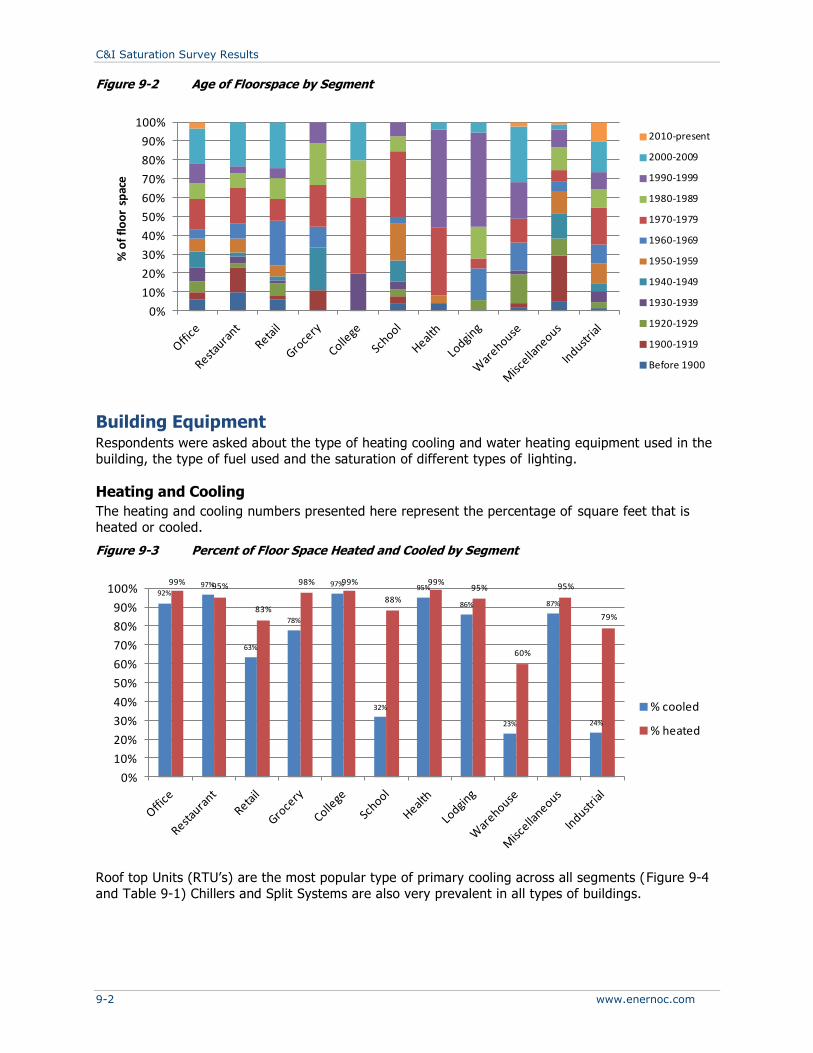
C&I Saturation Survey Results
9-2 www.enernoc.com
Figure 9-2 Age of Floorspace by Segment
Building Equipment Respondents were asked about the type of heating cooling and water heating equipment used in the
building, the type of fuel used and the saturation of different types of lighting.
Heating and Cooling
The heating and cooling numbers presented here represent the percentage of square feet that is
heated or cooled.
Figure 9-3 Percent of Floor Space Heated and Cooled by Segment
Roof top Units (RTU’s) are the most popular type of primary cooling across all segments (Figure 9-4
and Table 9-1) Chillers and Split Systems are also very prevalent in all types of buildings.
0%
10%
20%
30%
40%
50%
60%
70%
80%
90%
100%%
of
flo
or
spac
e2010-present
2000-2009
1990-1999
1980-1989
1970-1979
1960-1969
1950-1959
1940-1949
1930-1939
1920-1929
1900-1919
Before 1900
92%97%
63%
78%
97%
32%
95%
86%
23%
87%
24%
99% 95%
83%
98% 99%
88%
99%95%
60%
95%
79%
0%
10%
20%
30%
40%
50%
60%
70%
80%
90%
100%
% cooled
% heated
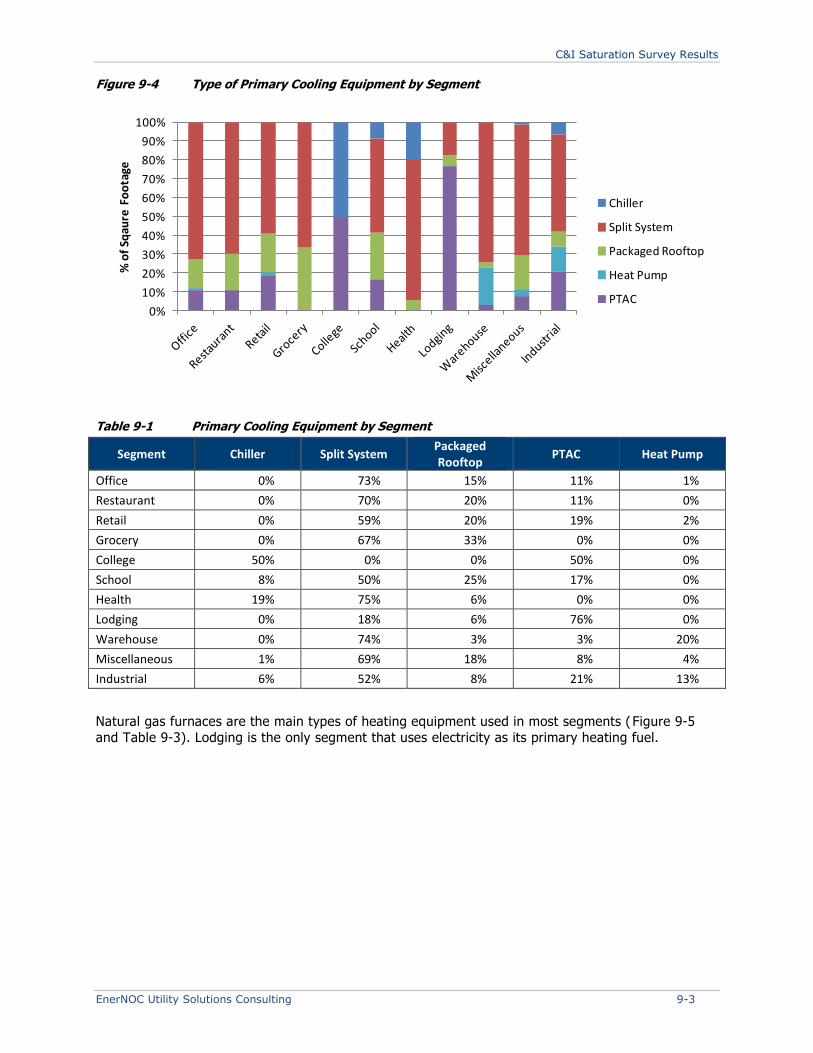
C&I Saturation Survey Results
EnerNOC Utility Solutions Consulting 9-3
Figure 9-4 Type of Primary Cooling Equipment by Segment
Table 9-1 Primary Cooling Equipment by Segment
Segment Chiller Split System Packaged Rooftop
PTAC Heat Pump
Office 0% 73% 15% 11% 1%
Restaurant 0% 70% 20% 11% 0%
Retail 0% 59% 20% 19% 2%
Grocery 0% 67% 33% 0% 0%
College 50% 0% 0% 50% 0%
School 8% 50% 25% 17% 0%
Health 19% 75% 6% 0% 0%
Lodging 0% 18% 6% 76% 0%
Warehouse 0% 74% 3% 3% 20%
Miscellaneous 1% 69% 18% 8% 4%
Industrial 6% 52% 8% 21% 13%
Natural gas furnaces are the main types of heating equipment used in most segments ( Figure 9-5
and Table 9-3). Lodging is the only segment that uses electricity as its primary heating fuel.
0%
10%
20%
30%
40%
50%
60%
70%
80%
90%
100%%
of
Sqau
re F
oo
tage
Chiller
Split System
Packaged Rooftop
Heat Pump
PTAC

C&I Saturation Survey Results
9-4 www.enernoc.com
Figure 9-5 Type of Primary Space Heating Equipment and Fuel
Table 9-2 Primary Space Heating Equipment by Segment
Segment Heat
Pump
Electric Room Heat
Electric Furnace
PTHP Electric Boiler
Gas Furnace
Gas Boiler
Gas Unit Heater
Office 1% 1% 21% 3% 4% 58% 4% 8%
Restaurant 4% 0% 26% 4% 0% 64% 0% 2%
Retail 2% 5% 14% 2% 0% 57% 8% 13%
Grocery 0% 0% 38% 0% 0% 50% 0% 13%
College 0% 0% 0% 0% 0% 83% 17% 0%
School 8% 0% 4% 0% 4% 50% 29% 4%
Health 6% 0% 13% 0% 0% 74% 6% 0%
Lodging 0% 6% 28% 56% 0% 6% 6% 0%
Warehouse 15% 0% 13% 0% 0% 57% 0% 15%
Miscellaneous 4% 4% 2% 7% 0% 73% 11% 0%
Industrial 13% 2% 11% 3% 0% 44% 5% 21%
Water Heating
Natural gas is the fuel used most often to heat water in the majority of segments (Figure 9-6 and Table 9-3). But both the office segment and the lodging segment are more likely to have an electric
water heater.
0%
10%
20%
30%
40%
50%
60%
70%
80%
90%
100%
Heat Pump
Electric Room Heat
Electric Furnace
PTHP
Electric Boiler
Gas Furnace
Gas Boiler
Gas Unit Heater

C&I Saturation Survey Results
EnerNOC Utility Solutions Consulting 9-5
Figure 9-6 Type of Water Heating
Table 9-3 Water Heating by Segment
Segment
Natural Gas Self
Contained Storage
WH
Natural Gas
Central Boiler
Natural Gas
Tankless
Natural Gas Heat
Pump
Natural Gas
Domestic
Electric Self
Contained Storage
WH
Electric Tankless
Electric Domestic
Office 3% 0% 2% 5% 33% 24% 0% 32%
Restaurant 17% 0% 13% 0% 24% 35% 0% 11%
Retail 16% 0% 1% 0% 23% 31% 6% 23%
Grocery 33% 0% 11% 0% 22% 11% 0% 22%
College 0% 0% 0% 0% 67% 0% 0% 33%
School 80% 10% 0% 0% 10% 0% 0% 0%
Health 77% 0% 0% 0% 3% 17% 0% 3%
Lodging 23% 8% 0% 0% 8% 54% 0% 8%
Warehouse 50% 0% 0% 0% 22% 22% 0% 6%
Miscellaneous 22% 1% 0% 0% 39% 14% 0% 23%
Industrial 13% 0% 0% 0% 35% 17% 2% 33%
0%
10%
20%
30%
40%
50%
60%
70%
80%
90%
100%Electric Domestic
Electric Tankless
Electric Self Contained Storage WHNatural Gas Domestic
Natural Gas Heat Pump
Natural Gas Tankless
Natural Gas Central Boiler
Natural Gas Self Contained Storage WH
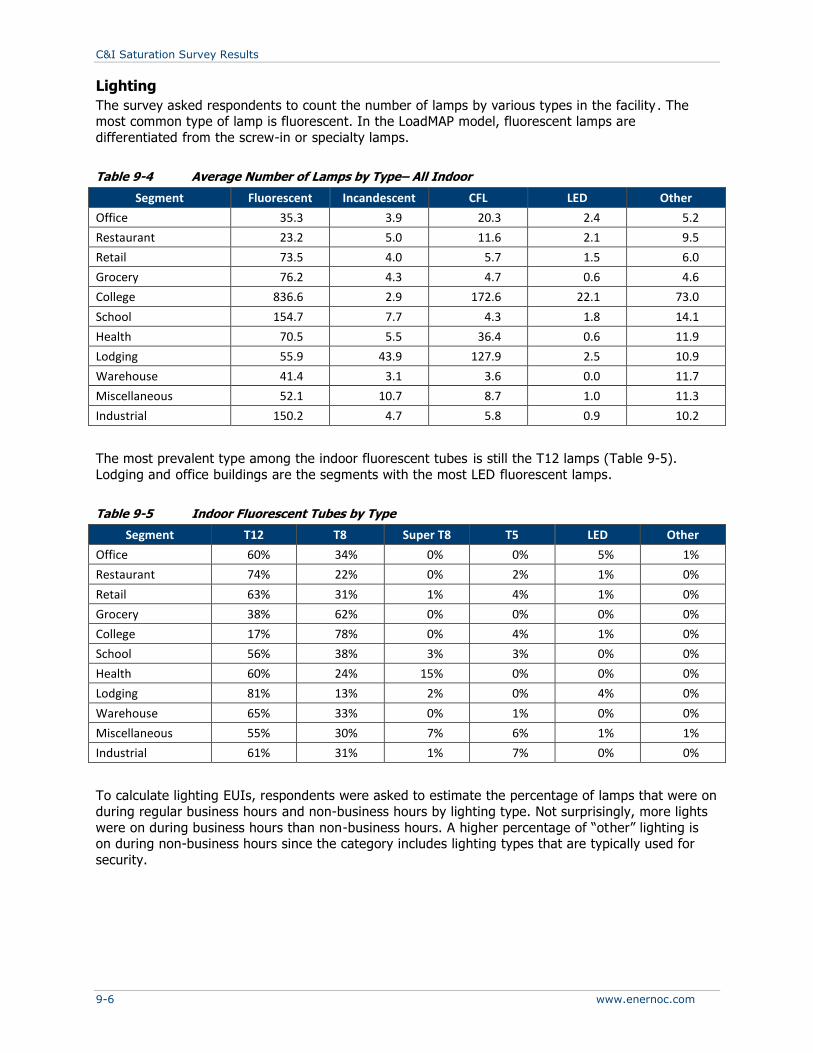
C&I Saturation Survey Results
9-6 www.enernoc.com
Lighting
The survey asked respondents to count the number of lamps by various types in the facility . The most common type of lamp is fluorescent. In the LoadMAP model, fluorescent lamps are
differentiated from the screw-in or specialty lamps.
Table 9-4 Average Number of Lamps by Type– All Indoor
Segment Fluorescent Incandescent CFL LED Other
Office 35.3 3.9 20.3 2.4 5.2
Restaurant 23.2 5.0 11.6 2.1 9.5
Retail 73.5 4.0 5.7 1.5 6.0
Grocery 76.2 4.3 4.7 0.6 4.6
College 836.6 2.9 172.6 22.1 73.0
School 154.7 7.7 4.3 1.8 14.1
Health 70.5 5.5 36.4 0.6 11.9
Lodging 55.9 43.9 127.9 2.5 10.9
Warehouse 41.4 3.1 3.6 0.0 11.7
Miscellaneous 52.1 10.7 8.7 1.0 11.3
Industrial 150.2 4.7 5.8 0.9 10.2
The most prevalent type among the indoor fluorescent tubes is still the T12 lamps (Table 9-5).
Lodging and office buildings are the segments with the most LED fluorescent lamps.
Table 9-5 Indoor Fluorescent Tubes by Type
Segment T12 T8 Super T8 T5 LED Other
Office 60% 34% 0% 0% 5% 1%
Restaurant 74% 22% 0% 2% 1% 0%
Retail 63% 31% 1% 4% 1% 0%
Grocery 38% 62% 0% 0% 0% 0%
College 17% 78% 0% 4% 1% 0%
School 56% 38% 3% 3% 0% 0%
Health 60% 24% 15% 0% 0% 0%
Lodging 81% 13% 2% 0% 4% 0%
Warehouse 65% 33% 0% 1% 0% 0%
Miscellaneous 55% 30% 7% 6% 1% 1%
Industrial 61% 31% 1% 7% 0% 0%
To calculate lighting EUIs, respondents were asked to estimate the percentage of lamps that were on
during regular business hours and non-business hours by lighting type. Not surprisingly, more lights
were on during business hours than non-business hours. A higher percentage of “other” lighting is on during non-business hours since the category includes lighting types that are typically used for
security.
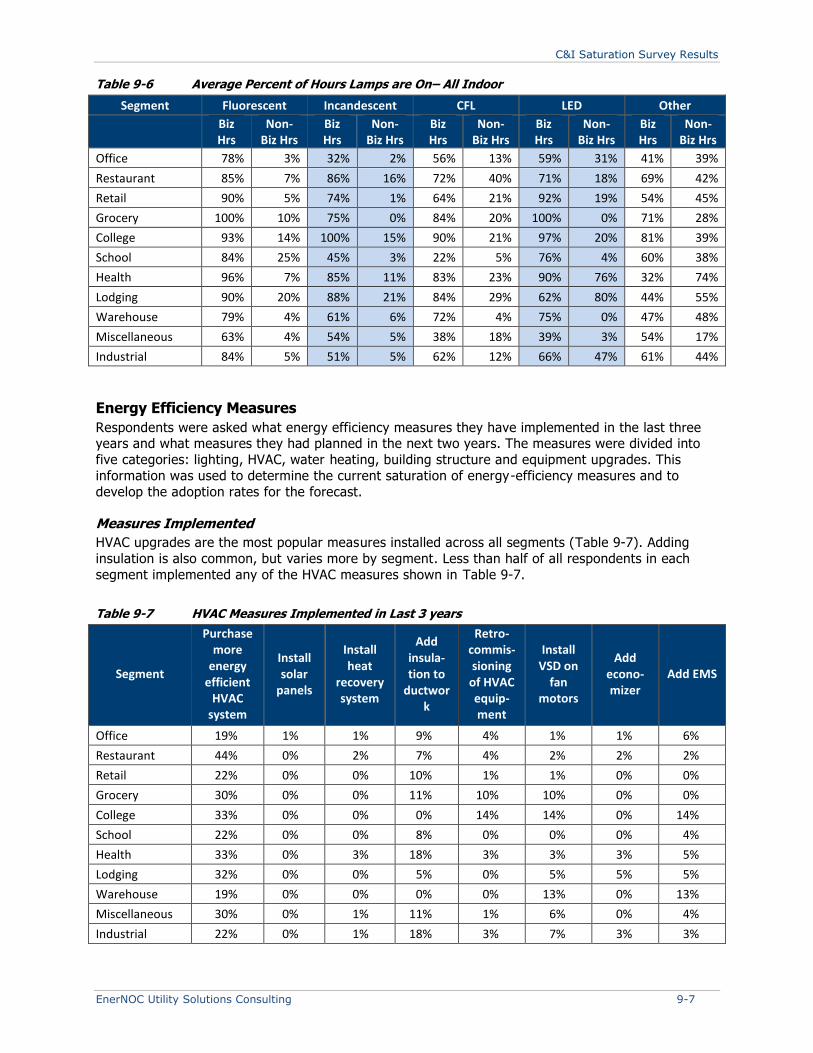
C&I Saturation Survey Results
EnerNOC Utility Solutions Consulting 9-7
Table 9-6 Average Percent of Hours Lamps are On– All Indoor
Segment Fluorescent Incandescent CFL LED Other
Biz Hrs
Non-Biz Hrs
Biz Hrs
Non-Biz Hrs
Biz Hrs
Non-Biz Hrs
Biz Hrs
Non-Biz Hrs
Biz Hrs
Non-Biz Hrs
Office 78% 3% 32% 2% 56% 13% 59% 31% 41% 39%
Restaurant 85% 7% 86% 16% 72% 40% 71% 18% 69% 42%
Retail 90% 5% 74% 1% 64% 21% 92% 19% 54% 45%
Grocery 100% 10% 75% 0% 84% 20% 100% 0% 71% 28%
College 93% 14% 100% 15% 90% 21% 97% 20% 81% 39%
School 84% 25% 45% 3% 22% 5% 76% 4% 60% 38%
Health 96% 7% 85% 11% 83% 23% 90% 76% 32% 74%
Lodging 90% 20% 88% 21% 84% 29% 62% 80% 44% 55%
Warehouse 79% 4% 61% 6% 72% 4% 75% 0% 47% 48%
Miscellaneous 63% 4% 54% 5% 38% 18% 39% 3% 54% 17%
Industrial 84% 5% 51% 5% 62% 12% 66% 47% 61% 44%
Energy Efficiency Measures
Respondents were asked what energy efficiency measures they have implemented in the last three years and what measures they had planned in the next two years. The measures were divided into
five categories: lighting, HVAC, water heating, building structure and equipment upgrades. This
information was used to determine the current saturation of energy-efficiency measures and to
develop the adoption rates for the forecast.
Measures Implemented
HVAC upgrades are the most popular measures installed across all segments (Table 9-7). Adding
insulation is also common, but varies more by segment. Less than half of all respondents in each
segment implemented any of the HVAC measures shown in Table 9-7.
Table 9-7 HVAC Measures Implemented in Last 3 years
Segment
Purchase more
energy efficient
HVAC system
Install solar
panels
Install heat
recovery system
Add insula-tion to
ductwork
Retro-commis-sioning
of HVAC equip-ment
Install VSD on
fan motors
Add econo-mizer
Add EMS
Office 19% 1% 1% 9% 4% 1% 1% 6%
Restaurant 44% 0% 2% 7% 4% 2% 2% 2%
Retail 22% 0% 0% 10% 1% 1% 0% 0%
Grocery 30% 0% 0% 11% 10% 10% 0% 0%
College 33% 0% 0% 0% 14% 14% 0% 14%
School 22% 0% 0% 8% 0% 0% 0% 4%
Health 33% 0% 3% 18% 3% 3% 3% 5%
Lodging 32% 0% 0% 5% 0% 5% 5% 5%
Warehouse 19% 0% 0% 0% 0% 13% 0% 13%
Miscellaneous 30% 0% 1% 11% 1% 6% 0% 4%
Industrial 22% 0% 1% 18% 3% 7% 3% 3%

C&I Saturation Survey Results
9-8 www.enernoc.com
Purchasing a more energy efficient water heating system is the most popular water heating measure, followed by reducing the water heater temperature. The grocery and lodging segments are the most
likely to have implemented a water heating measure in the last 3 years, with over two-thirds
implementing at least one measure.
Table 9-8 Water Heating Measures Implemented in Last 3 years
Segment
Purchase more
energy efficient WH
system
Insulate pipes
Reduce water temperature
Install low flow nozzles
Install faucet
aerators
Other water heating
measure
Office 9% 2% 6% 1% 2% 0%
Restaurant 42% 7% 25% 9% 9% 0%
Retail 15% 7% 13% 4% 7% 1%
Grocery 50% 11% 40% 0% 10% 0%
College 14% 14% 29% 14% 14% 0%
School 19% 4% 15% 4% 4% 0%
Health 32% 3% 18% 8% 8% 0%
Lodging 21% 5% 10% 42% 40% 5%
Warehouse 17% 19% 25% 0% 25% 0%
Miscellaneous 23% 9% 22% 2% 9% 6%
Industrial 16% 10% 12% 4% 3% 0%
Lighting upgrades have been implemented in 12% or more of the floor space in all the segments.
Upgrading a fluorescent lighting system and switching to CFLs have been popular measures that
were implemented, likely due to the awareness around the change in the lighting standard (Table 9-
9). Installing occupancy or daylighting sensors is less prevalent.
Table 9-9 Lighting Measures Implemented in Last 3 years
Segment
Upgrade fluorescent
lighting system
Reduce number of fluorescent
fixtures
Replace with CFLs or
LEDs
Replace with task lighting
Install occupancy
sensors
Install daylighting
sensors
Office 39% 13% 53% 1% 6% 6%
Restaurant 40% 14% 40% 21% 4% 5%
Retail 31% 11% 32% 14% 5% 1%
Grocery 60% 20% 50% 0% 0% 0%
College 43% 14% 43% 14% 14% 14%
School 33% 4% 12% 4% 11% 4%
Health 37% 34% 42% 3% 3% 3%
Lodging 63% 47% 47% 5% 11% 10%
Warehouse 27% 2% 21% 2% 29% 0%
Miscellaneous 57% 10% 44% 6% 8% 21%
Industrial 44% 12% 33% 10% 12% 10%
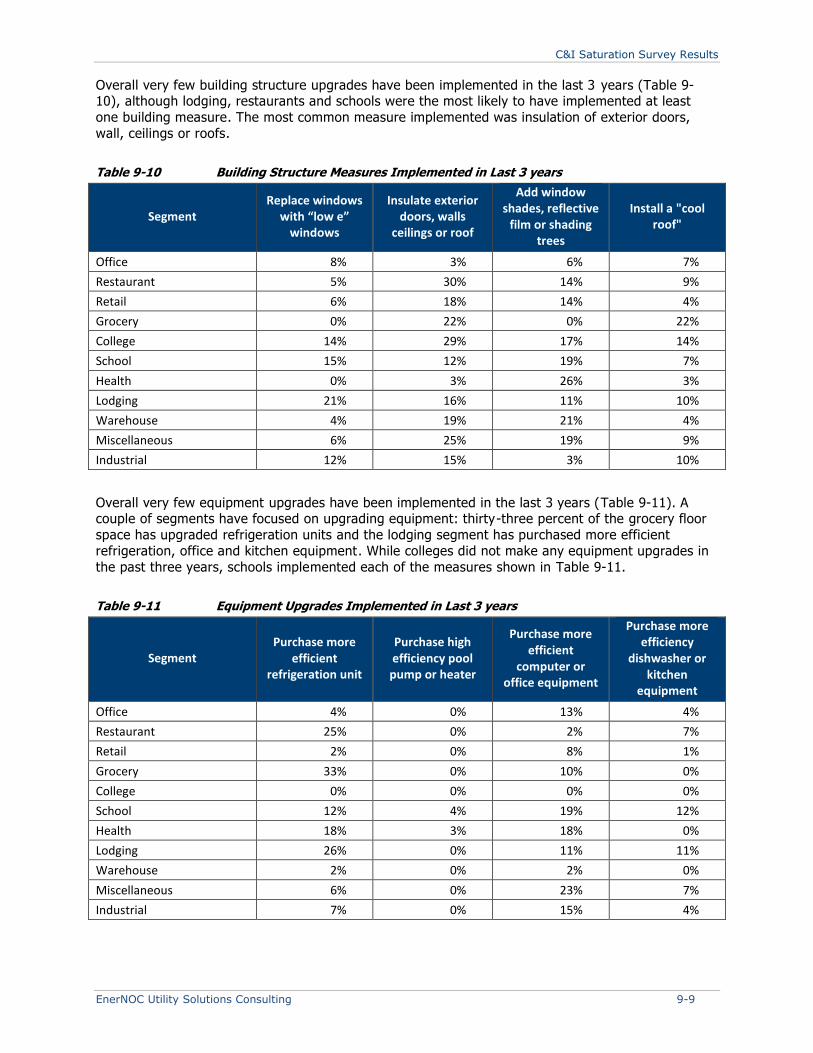
C&I Saturation Survey Results
EnerNOC Utility Solutions Consulting 9-9
Overall very few building structure upgrades have been implemented in the last 3 years (Table 9-10), although lodging, restaurants and schools were the most likely to have implemented at least
one building measure. The most common measure implemented was insulation of exterior doors,
wall, ceilings or roofs.
Table 9-10 Building Structure Measures Implemented in Last 3 years
Segment Replace windows
with “low e” windows
Insulate exterior doors, walls
ceilings or roof
Add window shades, reflective
film or shading trees
Install a "cool roof"
Office 8% 3% 6% 7%
Restaurant 5% 30% 14% 9%
Retail 6% 18% 14% 4%
Grocery 0% 22% 0% 22%
College 14% 29% 17% 14%
School 15% 12% 19% 7%
Health 0% 3% 26% 3%
Lodging 21% 16% 11% 10%
Warehouse 4% 19% 21% 4%
Miscellaneous 6% 25% 19% 9%
Industrial 12% 15% 3% 10%
Overall very few equipment upgrades have been implemented in the last 3 years (Table 9-11). A couple of segments have focused on upgrading equipment: thirty-three percent of the grocery floor
space has upgraded refrigeration units and the lodging segment has purchased more efficient
refrigeration, office and kitchen equipment. While colleges did not make any equipment upgrades in
the past three years, schools implemented each of the measures shown in Table 9-11.
Table 9-11 Equipment Upgrades Implemented in Last 3 years
Segment Purchase more
efficient refrigeration unit
Purchase high efficiency pool pump or heater
Purchase more efficient
computer or office equipment
Purchase more efficiency
dishwasher or kitchen
equipment
Office 4% 0% 13% 4%
Restaurant 25% 0% 2% 7%
Retail 2% 0% 8% 1%
Grocery 33% 0% 10% 0%
College 0% 0% 0% 0%
School 12% 4% 19% 12%
Health 18% 3% 18% 0%
Lodging 26% 0% 11% 11%
Warehouse 2% 0% 2% 0%
Miscellaneous 6% 0% 23% 7%
Industrial 7% 0% 15% 4%

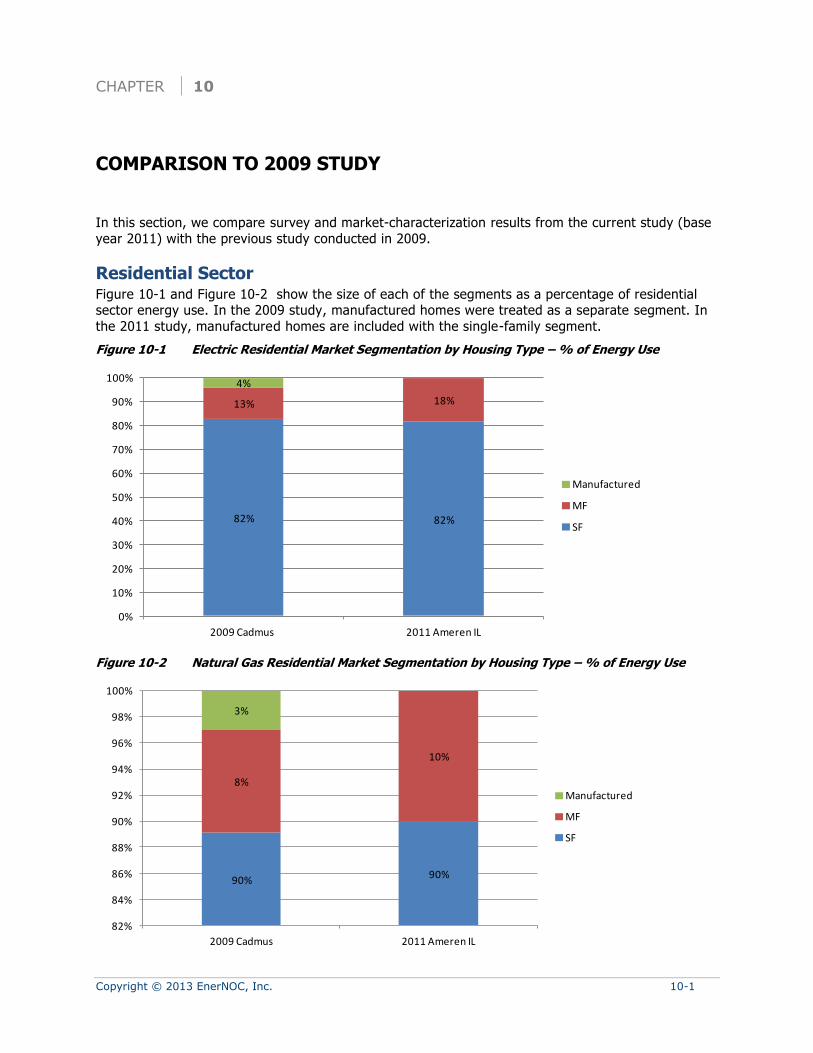
Copyright © 2013 EnerNOC, Inc. 10-1
CHAPTER 10
COMPARISON TO 2009 STUDY
In this section, we compare survey and market-characterization results from the current study (base
year 2011) with the previous study conducted in 2009.
Residential Sector Figure 10-1 and Figure 10-2 show the size of each of the segments as a percentage of residential sector energy use. In the 2009 study, manufactured homes were treated as a separate segment. In
the 2011 study, manufactured homes are included with the single-family segment.
Figure 10-1 Electric Residential Market Segmentation by Housing Type – % of Energy Use
Figure 10-2 Natural Gas Residential Market Segmentation by Housing Type – % of Energy Use
82% 82%
13% 18%
4%
0%
10%
20%
30%
40%
50%
60%
70%
80%
90%
100%
2009 Cadmus 2011 Ameren IL
Manufactured
MF
SF
90%90%
8%
10%
3%
82%
84%
86%
88%
90%
92%
94%
96%
98%
100%
2009 Cadmus 2011 Ameren IL
Manufactured
MF
SF
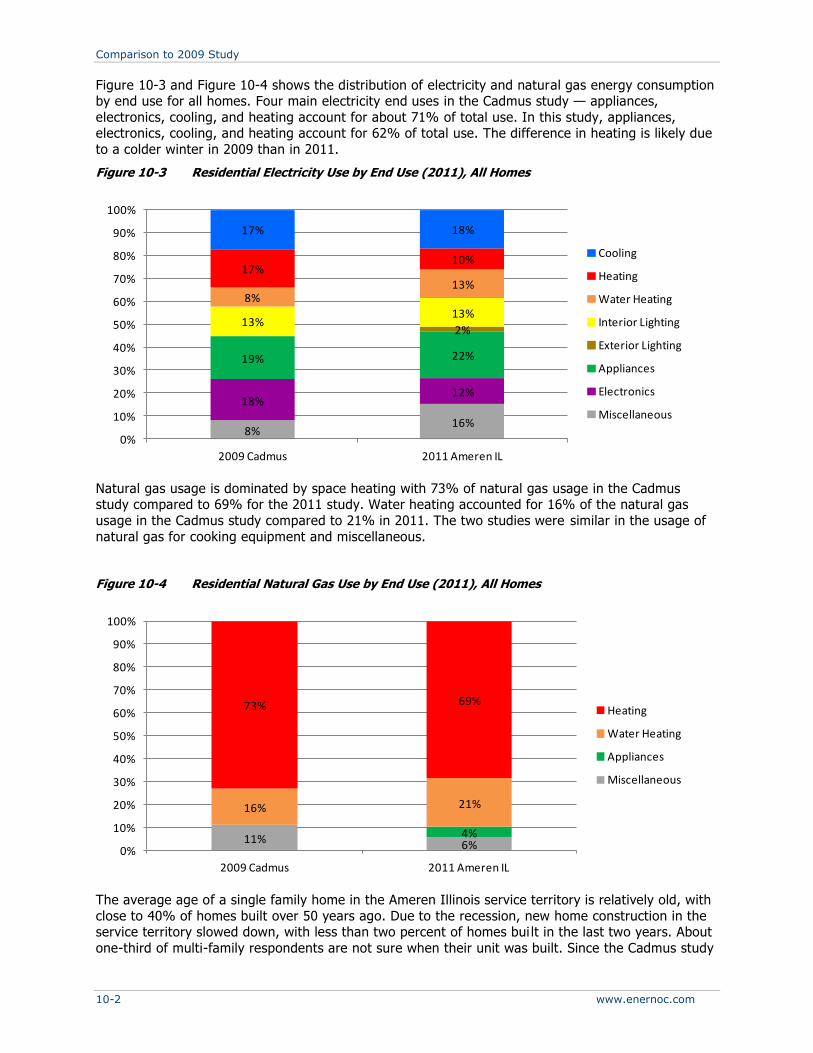
Comparison to 2009 Study
10-2 www.enernoc.com
Figure 10-3 and Figure 10-4 shows the distribution of electricity and natural gas energy consumption by end use for all homes. Four main electricity end uses in the Cadmus study — appliances,
electronics, cooling, and heating account for about 71% of total use. In this study, appliances, electronics, cooling, and heating account for 62% of total use. The difference in heating is likely due
to a colder winter in 2009 than in 2011.
Figure 10-3 Residential Electricity Use by End Use (2011), All Homes
Natural gas usage is dominated by space heating with 73% of natural gas usage in the Cadmus study compared to 69% for the 2011 study. Water heating accounted for 16% of the natural gas
usage in the Cadmus study compared to 21% in 2011. The two studies were similar in the usage of
natural gas for cooking equipment and miscellaneous.
Figure 10-4 Residential Natural Gas Use by End Use (2011), All Homes
The average age of a single family home in the Ameren Illinois service territory is relatively old, with
close to 40% of homes built over 50 years ago. Due to the recession, new home construction in the service territory slowed down, with less than two percent of homes bui lt in the last two years. About
one-third of multi-family respondents are not sure when their unit was built. Since the Cadmus study
8%16%
18%12%
19% 22%
2%13%
13%
8%13%
17%10%
17% 18%
0%
10%
20%
30%
40%
50%
60%
70%
80%
90%
100%
2009 Cadmus 2011 Ameren IL
Cooling
Heating
Water Heating
Interior Lighting
Exterior Lighting
Appliances
Electronics
Miscellaneous
11% 6%4%
16% 21%
73% 69%
0%
10%
20%
30%
40%
50%
60%
70%
80%
90%
100%
2009 Cadmus 2011 Ameren IL
Heating
Water Heating
Appliances
Miscellaneous
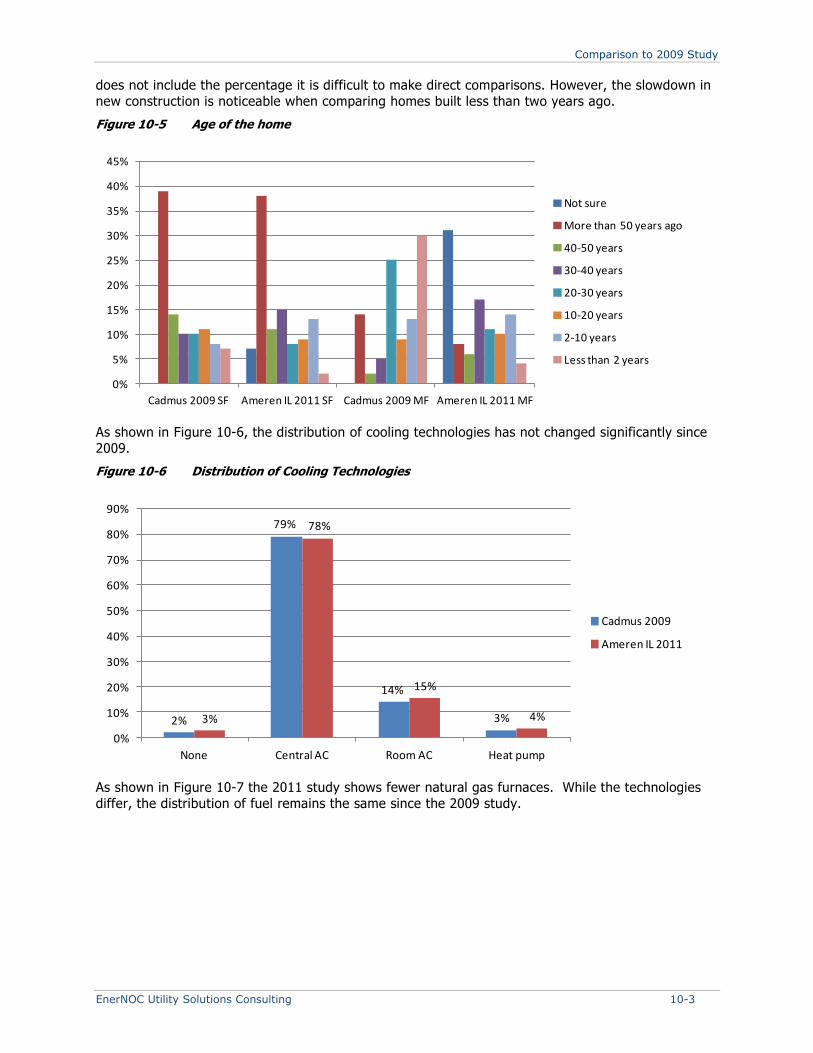
Comparison to 2009 Study
EnerNOC Utility Solutions Consulting 10-3
does not include the percentage it is difficult to make direct comparisons. However, the slowdown in
new construction is noticeable when comparing homes built less than two years ago.
Figure 10-5 Age of the home
As shown in Figure 10-6, the distribution of cooling technologies has not changed significantly since
2009.
Figure 10-6 Distribution of Cooling Technologies
As shown in Figure 10-7 the 2011 study shows fewer natural gas furnaces. While the technologies
differ, the distribution of fuel remains the same since the 2009 study.
0%
5%
10%
15%
20%
25%
30%
35%
40%
45%
Cadmus 2009 SF Ameren IL 2011 SF Cadmus 2009 MF Ameren IL 2011 MF
Not sure
More than 50 years ago
40-50 years
30-40 years
20-30 years
10-20 years
2-10 years
Less than 2 years
2%
79%
14%
3%3%
78%
15%
4%
0%
10%
20%
30%
40%
50%
60%
70%
80%
90%
None Central AC Room AC Heat pump
Cadmus 2009
Ameren IL 2011
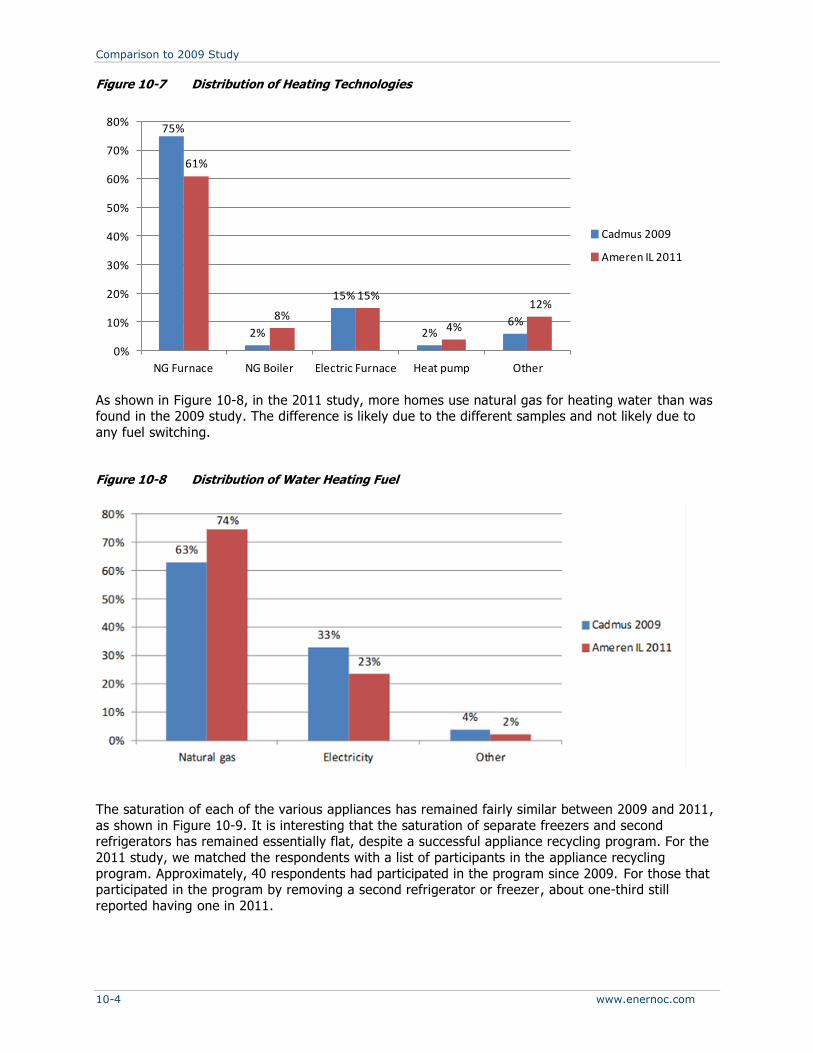
Comparison to 2009 Study
10-4 www.enernoc.com
Figure 10-7 Distribution of Heating Technologies
As shown in Figure 10-8, in the 2011 study, more homes use natural gas for heating water than was found in the 2009 study. The difference is likely due to the different samples and not likely due to
any fuel switching.
Figure 10-8 Distribution of Water Heating Fuel
The saturation of each of the various appliances has remained fairly similar between 2009 and 2011,
as shown in Figure 10-9. It is interesting that the saturation of separate freezers and second refrigerators has remained essentially flat, despite a successful appliance recycling program. For the
2011 study, we matched the respondents with a list of participants in the appliance recycling
program. Approximately, 40 respondents had participated in the program since 2009. For those that participated in the program by removing a second refrigerator or freezer, about one-third still
reported having one in 2011.
75%
2%
15%
2%6%
61%
8%
15%
4%
12%
0%
10%
20%
30%
40%
50%
60%
70%
80%
NG Furnace NG Boiler Electric Furnace Heat pump Other
Cadmus 2009
Ameren IL 2011
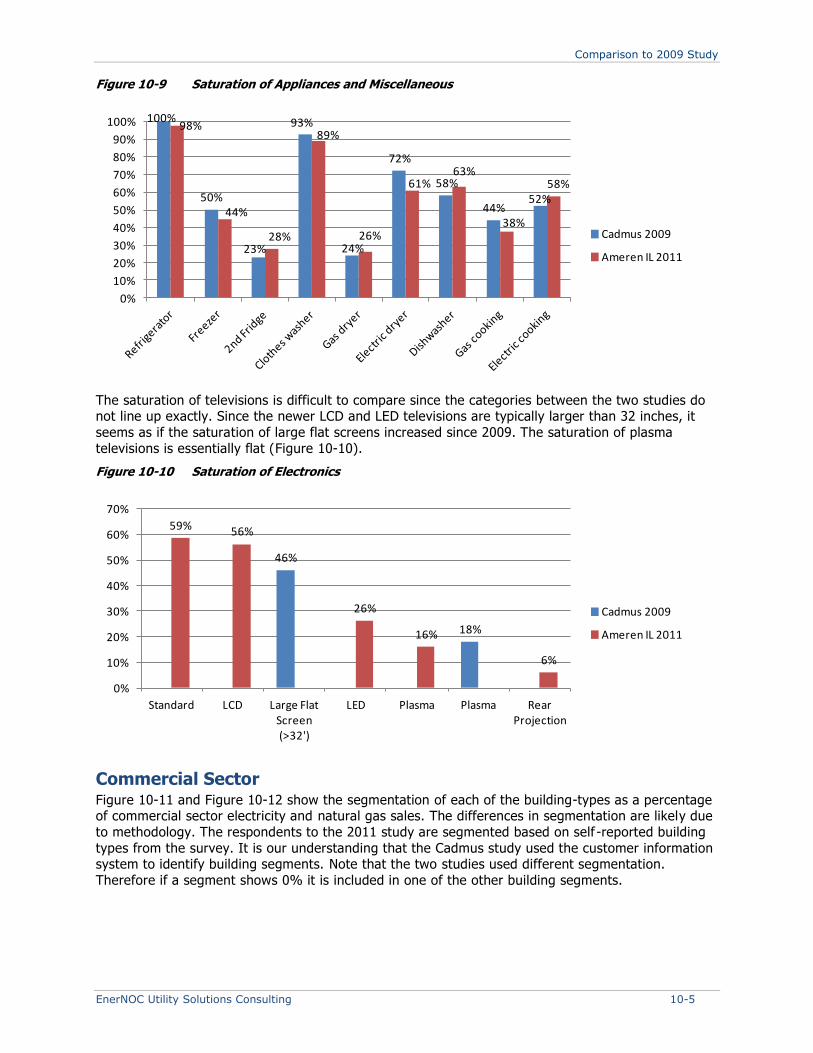
Comparison to 2009 Study
EnerNOC Utility Solutions Consulting 10-5
Figure 10-9 Saturation of Appliances and Miscellaneous
The saturation of televisions is difficult to compare since the categories between the two studies do not line up exactly. Since the newer LCD and LED televisions are typically larger than 32 inches, it
seems as if the saturation of large flat screens increased since 2009. The saturation of plasma
televisions is essentially flat (Figure 10-10).
Figure 10-10 Saturation of Electronics
Commercial Sector Figure 10-11 and Figure 10-12 show the segmentation of each of the building-types as a percentage of commercial sector electricity and natural gas sales. The differences in segmentation are likely due
to methodology. The respondents to the 2011 study are segmented based on self -reported building
types from the survey. It is our understanding that the Cadmus study used the customer information system to identify building segments. Note that the two studies used different segmentation.
Therefore if a segment shows 0% it is included in one of the other building segments.
100%
50%
23%
93%
24%
72%
58%
44%52%
98%
44%
28%
89%
26%
61%63%
38%
58%
0%
10%
20%
30%
40%
50%
60%
70%
80%
90%
100%
Cadmus 2009
Ameren IL 2011
46%
18%
59% 56%
26%
16%
6%
0%
10%
20%
30%
40%
50%
60%
70%
Standard LCD Large Flat Screen (>32')
LED Plasma Plasma Rear Projection
Cadmus 2009
Ameren IL 2011
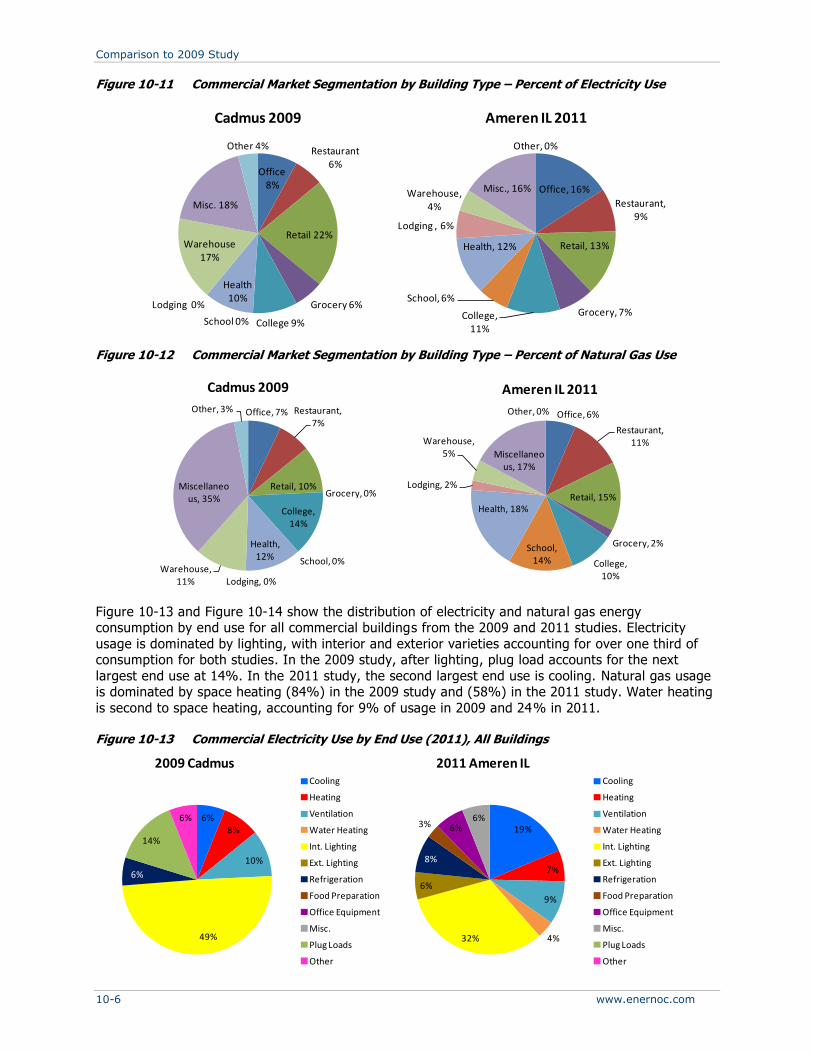
Comparison to 2009 Study
10-6 www.enernoc.com
Figure 10-11 Commercial Market Segmentation by Building Type – Percent of Electricity Use
Figure 10-12 Commercial Market Segmentation by Building Type – Percent of Natural Gas Use
Figure 10-13 and Figure 10-14 show the distribution of electricity and natural gas energy consumption by end use for all commercial buildings from the 2009 and 2011 studies. Electricity
usage is dominated by lighting, with interior and exterior varieties accounting for over one third of consumption for both studies. In the 2009 study, after lighting, plug load accounts for the next
largest end use at 14%. In the 2011 study, the second largest end use is cooling. Natural gas usage is dominated by space heating (84%) in the 2009 study and (58%) in the 2011 study. Water heating
is second to space heating, accounting for 9% of usage in 2009 and 24% in 2011.
Figure 10-13 Commercial Electricity Use by End Use (2011), All Buildings
Office 8%
Restaurant 6%
Retail 22%
Grocery 6%
College 9%School 0%
Health 10%
Lodging 0%
Warehouse 17%
Misc. 18%
Other 4%
Cadmus 2009
Office, 16%
Restaurant, 9%
Retail, 13%
Grocery, 7%College, 11%
School, 6%
Health, 12%
Lodging , 6%
Warehouse, 4%
Misc., 16%
Other, 0%
Ameren IL 2011
Office, 7% Restaurant, 7%
Retail, 10%Grocery, 0%
College, 14%
School, 0%
Health, 12%
Lodging, 0%Warehouse,
11%
Miscellaneous, 35%
Other, 3%
Cadmus 2009
Office, 6%
Restaurant, 11%
Retail, 15%
Grocery, 2%
College, 10%
School, 14%
Health, 18%
Lodging, 2%
Warehouse, 5% Miscellaneo
us, 17%
Other, 0%
Ameren IL 2011
6%8%
10%
49%
6%
14%
6%
2009 Cadmus Cooling
Heating
Ventilation
Water Heating
Int. Lighting
Ext. Lighting
Refrigeration
Food Preparation
Office Equipment
Misc.
Plug Loads
Other
19%
7%
9%
4%32%
6%
8%
3% 6%6%
2011 Ameren IL Cooling
Heating
Ventilation
Water Heating
Int. Lighting
Ext. Lighting
Refrigeration
Food Preparation
Office Equipment
Misc.
Plug Loads
Other
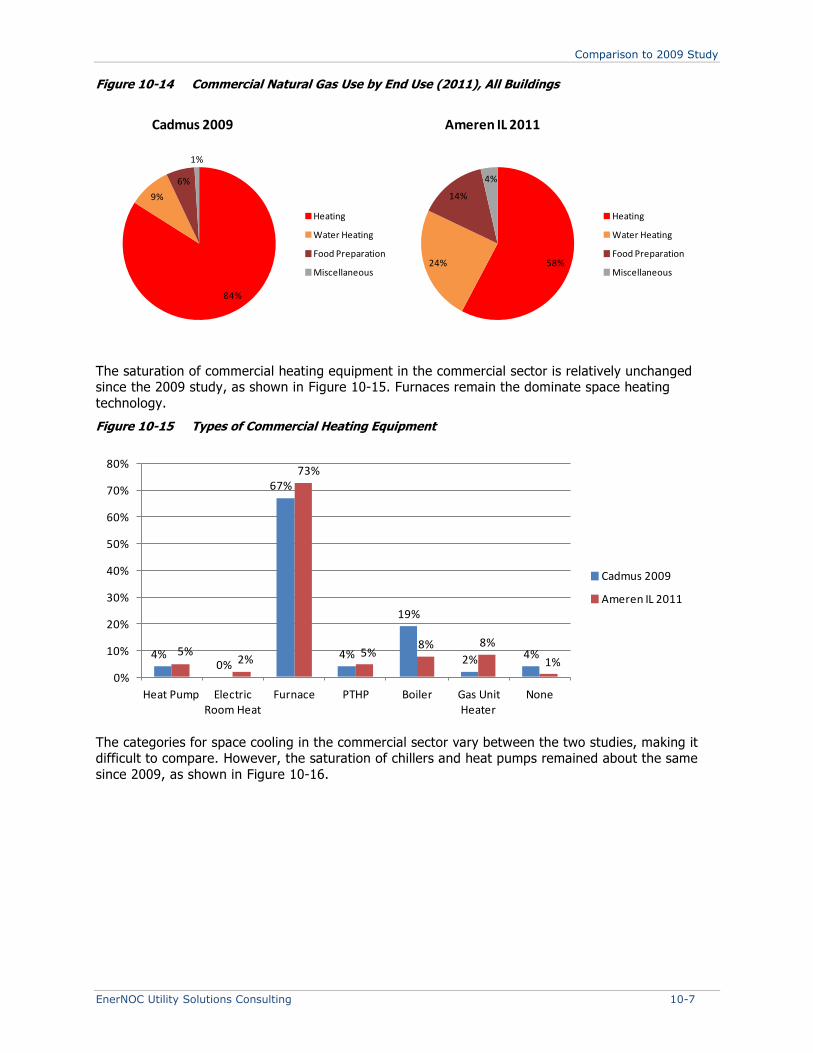
Comparison to 2009 Study
EnerNOC Utility Solutions Consulting 10-7
Figure 10-14 Commercial Natural Gas Use by End Use (2011), All Buildings
The saturation of commercial heating equipment in the commercial sector is relatively unchanged since the 2009 study, as shown in Figure 10-15. Furnaces remain the dominate space heating
technology.
Figure 10-15 Types of Commercial Heating Equipment
The categories for space cooling in the commercial sector vary between the two studies, making it difficult to compare. However, the saturation of chillers and heat pumps remained about the same
since 2009, as shown in Figure 10-16.
84%
9%
6%
1%
Cadmus 2009
Heating
Water Heating
Food Preparation
Miscellaneous58%24%
14%
4%
Ameren IL 2011
Heating
Water Heating
Food Preparation
Miscellaneous
4%0%
67%
4%
19%
2% 4%5%2%
73%
5%8% 8%
1%
0%
10%
20%
30%
40%
50%
60%
70%
80%
Heat Pump Electric Room Heat
Furnace PTHP Boiler Gas Unit Heater
None
Cadmus 2009
Ameren IL 2011
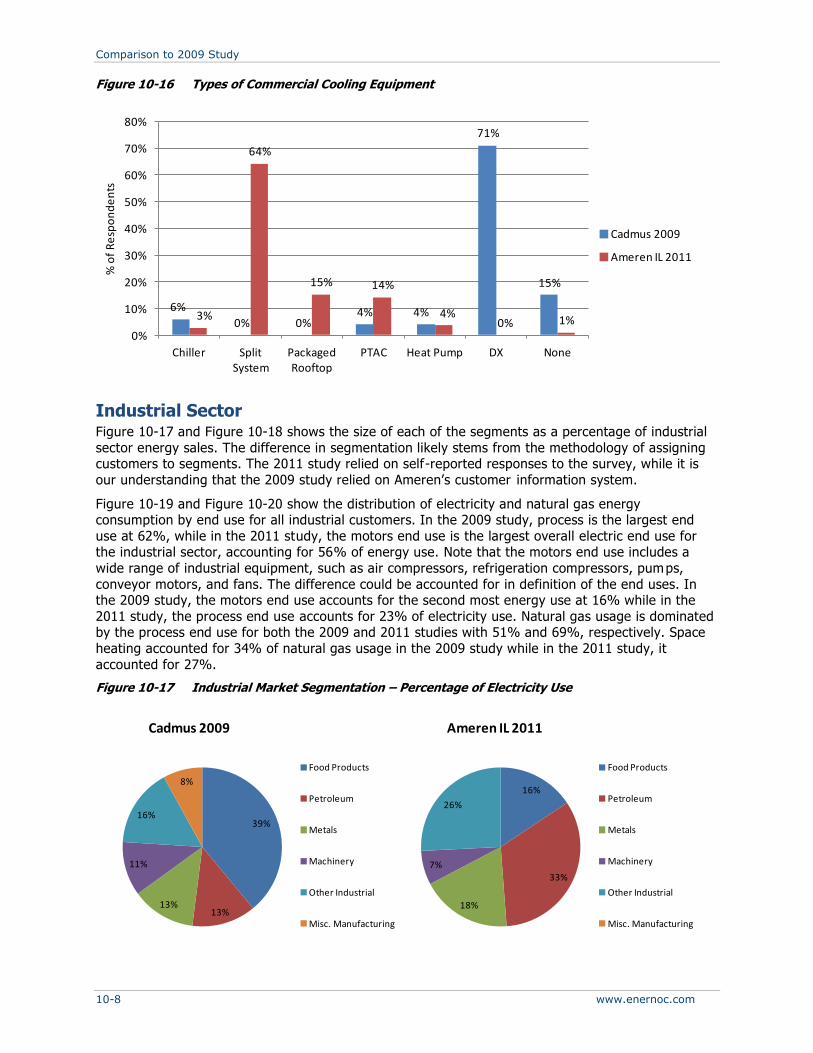
Comparison to 2009 Study
10-8 www.enernoc.com
Figure 10-16 Types of Commercial Cooling Equipment
Industrial Sector Figure 10-17 and Figure 10-18 shows the size of each of the segments as a percentage of industrial
sector energy sales. The difference in segmentation likely stems from the methodology of assigning customers to segments. The 2011 study relied on self-reported responses to the survey, while it is
our understanding that the 2009 study relied on Ameren’s customer information system.
Figure 10-19 and Figure 10-20 show the distribution of electricity and natural gas energy consumption by end use for all industrial customers. In the 2009 study, process is the largest end
use at 62%, while in the 2011 study, the motors end use is the largest overall electric end use for the industrial sector, accounting for 56% of energy use. Note that the motors end use includes a
wide range of industrial equipment, such as air compressors, refrigeration compressors, pumps,
conveyor motors, and fans. The difference could be accounted for in definition of the end uses. In the 2009 study, the motors end use accounts for the second most energy use at 16% while in the
2011 study, the process end use accounts for 23% of electricity use. Natural gas usage is dominated by the process end use for both the 2009 and 2011 studies with 51% and 69%, respectively. Space
heating accounted for 34% of natural gas usage in the 2009 study while in the 2011 study, it
accounted for 27%.
Figure 10-17 Industrial Market Segmentation – Percentage of Electricity Use
6%
0% 0%4% 4%
71%
15%
3%
64%
15% 14%
4%0% 1%
0%
10%
20%
30%
40%
50%
60%
70%
80%
Chiller Split System
Packaged Rooftop
PTAC Heat Pump DX None
% o
f R
esp
on
de
nts
Cadmus 2009
Ameren IL 2011
16%
33%
18%
7%
26%
Ameren IL 2011
Food Products
Petroleum
Metals
Machinery
Other Industrial
Misc. Manufacturing
39%
13%13%
11%
16%
8%
Cadmus 2009
Food Products
Petroleum
Metals
Machinery
Other Industrial
Misc. Manufacturing
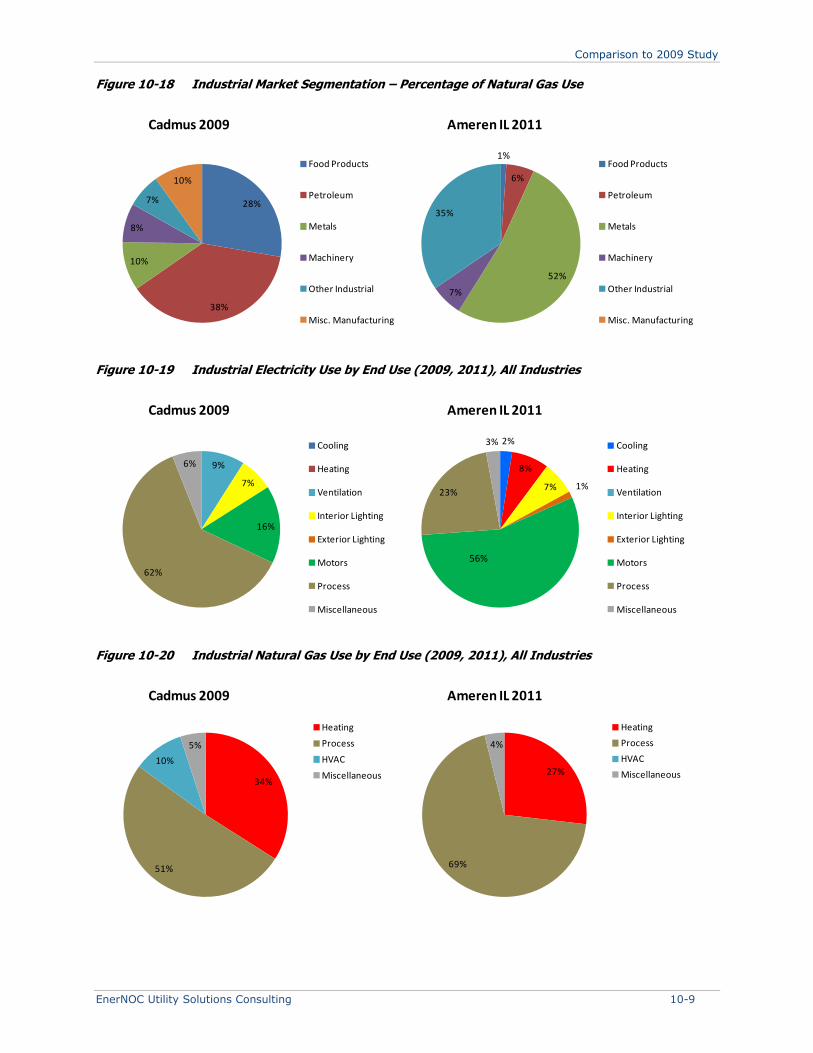
Comparison to 2009 Study
EnerNOC Utility Solutions Consulting 10-9
Figure 10-18 Industrial Market Segmentation – Percentage of Natural Gas Use
Figure 10-19 Industrial Electricity Use by End Use (2009, 2011), All Industries
Figure 10-20 Industrial Natural Gas Use by End Use (2009, 2011), All Industries
1%
6%
52%
7%
35%
Ameren IL 2011
Food Products
Petroleum
Metals
Machinery
Other Industrial
Misc. Manufacturing
28%
38%
10%
8%
7%
10%
Cadmus 2009
Food Products
Petroleum
Metals
Machinery
Other Industrial
Misc. Manufacturing
2%
8%
7% 1%23%
3%
Ameren IL 2011
Cooling
Heating
Ventilation
Interior Lighting
Exterior Lighting
Motors
Process
Miscellaneous
9%
7%
16%
62%
6%
Cadmus 2009
Cooling
Heating
Ventilation
Interior Lighting
Exterior Lighting
Motors
Process
Miscellaneous
27%
69%
4%
Ameren IL 2011
Heating
Process
HVAC
Miscellaneous34%
51%
10%
5%
Cadmus 2009
Heating
Process
HVAC
Miscellaneous
56%

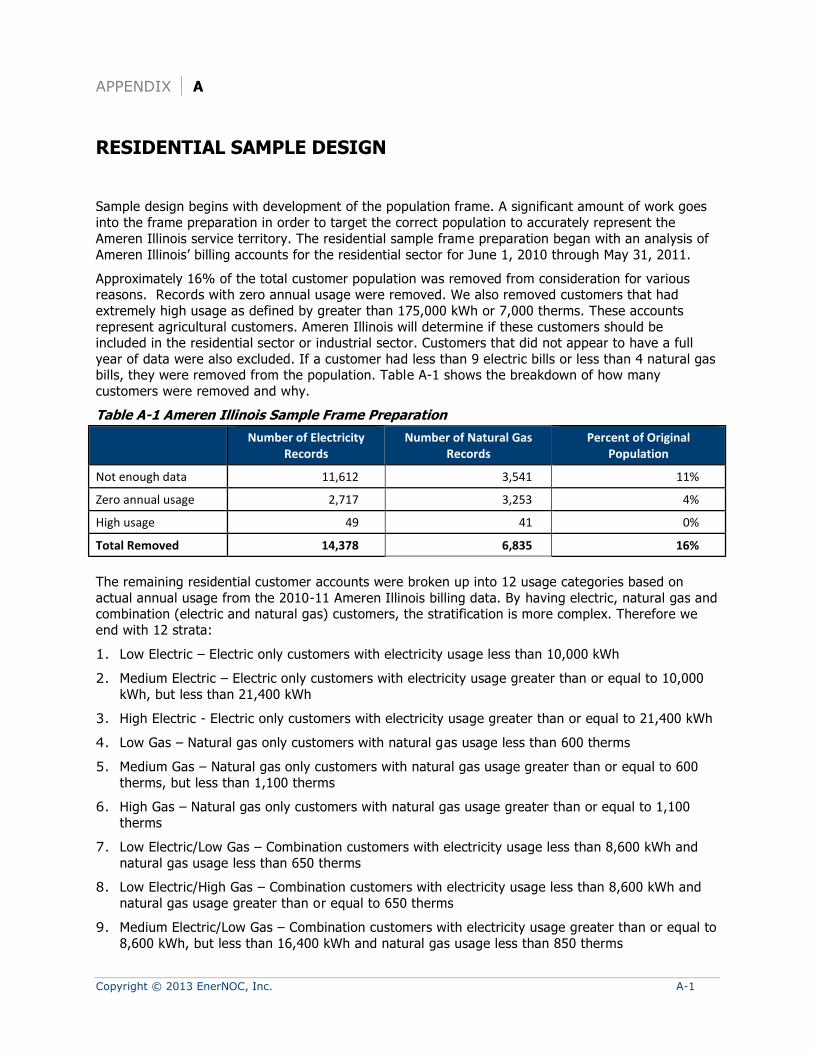
Copyright © 2013 EnerNOC, Inc. A-1
APPENDIX A
RESIDENTIAL SAMPLE DESIGN
Sample design begins with development of the population frame. A significant amount of work goes
into the frame preparation in order to target the correct population to accurately represent the
Ameren Illinois service territory. The residential sample frame preparation began with an analysis of
Ameren Illinois’ billing accounts for the residential sector for June 1, 2010 through May 31, 2011.
Approximately 16% of the total customer population was removed from consideration for various reasons. Records with zero annual usage were removed. We also removed customers that had
extremely high usage as defined by greater than 175,000 kWh or 7,000 therms. These accounts
represent agricultural customers. Ameren Illinois will determine if these customers should be included in the residential sector or industrial sector. Customers that did not appear to have a full
year of data were also excluded. If a customer had less than 9 electric bills or less than 4 natural gas bills, they were removed from the population. Table A-1 shows the breakdown of how many
customers were removed and why.
Table A-1 Ameren Illinois Sample Frame Preparation
Number of Electricity Records
Number of Natural Gas Records
Percent of Original Population
Not enough data 11,612 3,541 11%
Zero annual usage 2,717 3,253 4%
High usage 49 41 0%
Total Removed 14,378 6,835 16%
The remaining residential customer accounts were broken up into 12 usage categories based on
actual annual usage from the 2010-11 Ameren Illinois billing data. By having electric, natural gas and combination (electric and natural gas) customers, the stratification is more complex. Therefore we
end with 12 strata:
1. Low Electric – Electric only customers with electricity usage less than 10,000 kWh
2. Medium Electric – Electric only customers with electricity usage greater than or equal to 10,000
kWh, but less than 21,400 kWh
3. High Electric - Electric only customers with electricity usage greater than or equal to 21,400 kWh
4. Low Gas – Natural gas only customers with natural gas usage less than 600 therms
5. Medium Gas – Natural gas only customers with natural gas usage greater than or equal to 600
therms, but less than 1,100 therms
6. High Gas – Natural gas only customers with natural gas usage greater than or equal to 1,100
therms
7. Low Electric/Low Gas – Combination customers with electricity usage less than 8,600 kWh and
natural gas usage less than 650 therms
8. Low Electric/High Gas – Combination customers with electricity usage less than 8,600 kWh and
natural gas usage greater than or equal to 650 therms
9. Medium Electric/Low Gas – Combination customers with electricity usage greater than or equal to
8,600 kWh, but less than 16,400 kWh and natural gas usage less than 850 therms
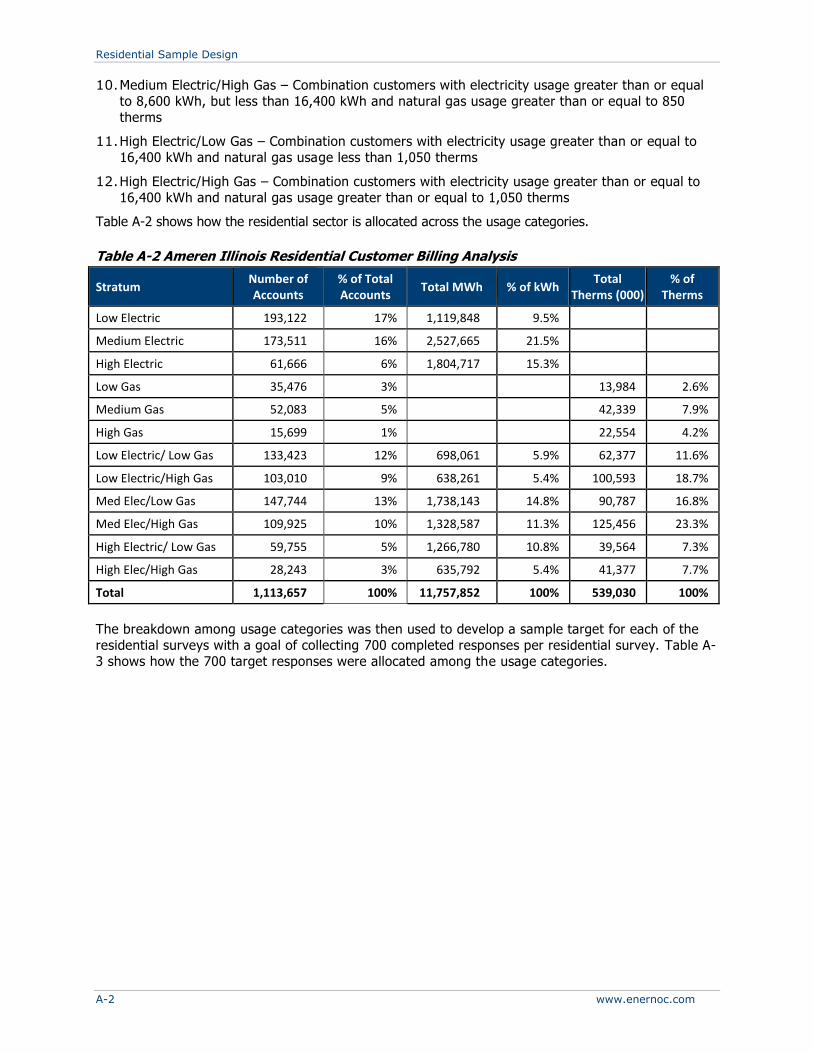
Residential Sample Design
A-2 www.enernoc.com
10. Medium Electric/High Gas – Combination customers with electricity usage greater than or equal
to 8,600 kWh, but less than 16,400 kWh and natural gas usage greater than or equal to 850
therms
11. High Electric/Low Gas – Combination customers with electricity usage greater than or equal to
16,400 kWh and natural gas usage less than 1,050 therms
12. High Electric/High Gas – Combination customers with electricity usage greater than or equal to
16,400 kWh and natural gas usage greater than or equal to 1,050 therms
Table A-2 shows how the residential sector is allocated across the usage categories.
Table A-2 Ameren Illinois Residential Customer Billing Analysis
Stratum Number of Accounts
% of Total Accounts
Total MWh % of kWh Total
Therms (000) % of
Therms
Low Electric 193,122 17% 1,119,848 9.5%
Medium Electric 173,511 16% 2,527,665 21.5%
High Electric 61,666 6% 1,804,717 15.3%
Low Gas 35,476 3% 13,984 2.6%
Medium Gas 52,083 5% 42,339 7.9%
High Gas 15,699 1% 22,554 4.2%
Low Electric/ Low Gas 133,423 12% 698,061 5.9% 62,377 11.6%
Low Electric/High Gas 103,010 9% 638,261 5.4% 100,593 18.7%
Med Elec/Low Gas 147,744 13% 1,738,143 14.8% 90,787 16.8%
Med Elec/High Gas 109,925 10% 1,328,587 11.3% 125,456 23.3%
High Electric/ Low Gas 59,755 5% 1,266,780 10.8% 39,564 7.3%
High Elec/High Gas 28,243 3% 635,792 5.4% 41,377 7.7%
Total 1,113,657 100% 11,757,852 100% 539,030 100%
The breakdown among usage categories was then used to develop a sample target for each of the
residential surveys with a goal of collecting 700 completed responses per residential survey. Table A-
3 shows how the 700 target responses were allocated among the usage categories.

Residential Sample Design
EnerNOC Utility Solutions Consulting A-3
Table A-3 Ameren Illinois Residential Sample Target
Stratum Number of Accounts
% of Total Accounts
Proposed Sample
% of Sample
Low Electric 193,122 17% 66 9%
Medium Electric 173,511 16% 69 10%
High Electric 61,666 6% 73 10%
Low Gas 35,476 3% 30 4%
Medium Gas 52,083 5% 30 4%
High Gas 15,699 1% 30 4%
Low Electric/ Low Gas 133,423 12% 66 9%
Low Electric/High Gas 103,010 9% 84 12%
Medium Electric/ Low Gas 147,744 13% 73 10%
Medium Electric/ High Gas 109,925 10% 94 13%
High Electric/ Low Gas 59,755 5% 44 6%
High Electric/ High Gas 28,243 3% 41 6%
Total 1,113,657 100% 700 100%
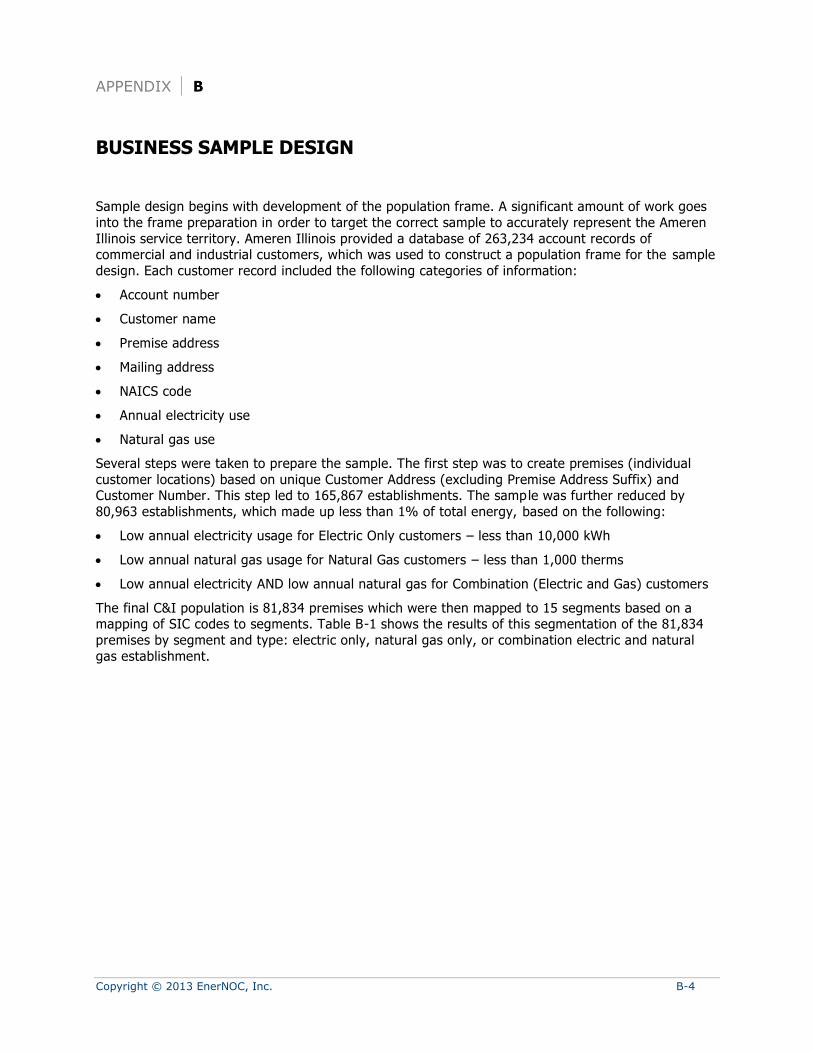
Copyright © 2013 EnerNOC, Inc. B-4
APPENDIX B
BUSINESS SAMPLE DESIGN
Sample design begins with development of the population frame. A significant amount of work goes
into the frame preparation in order to target the correct sample to accurately represent the Ameren
Illinois service territory. Ameren Illinois provided a database of 263,234 account records of commercial and industrial customers, which was used to construct a population frame for the sample
design. Each customer record included the following categories of information:
• Account number
• Customer name
• Premise address
• Mailing address
• NAICS code
• Annual electricity use
• Natural gas use
Several steps were taken to prepare the sample. The first step was to create premises (individual
customer locations) based on unique Customer Address (excluding Premise Address Suffix) and Customer Number. This step led to 165,867 establishments. The sample was further reduced by
80,963 establishments, which made up less than 1% of total energy, based on the following:
• Low annual electricity usage for Electric Only customers – less than 10,000 kWh
• Low annual natural gas usage for Natural Gas customers – less than 1,000 therms
• Low annual electricity AND low annual natural gas for Combination (Electric and Gas) customers
The final C&I population is 81,834 premises which were then mapped to 15 segments based on a mapping of SIC codes to segments. Table B-1 shows the results of this segmentation of the 81,834
premises by segment and type: electric only, natural gas only, or combination electric and natural
gas establishment.
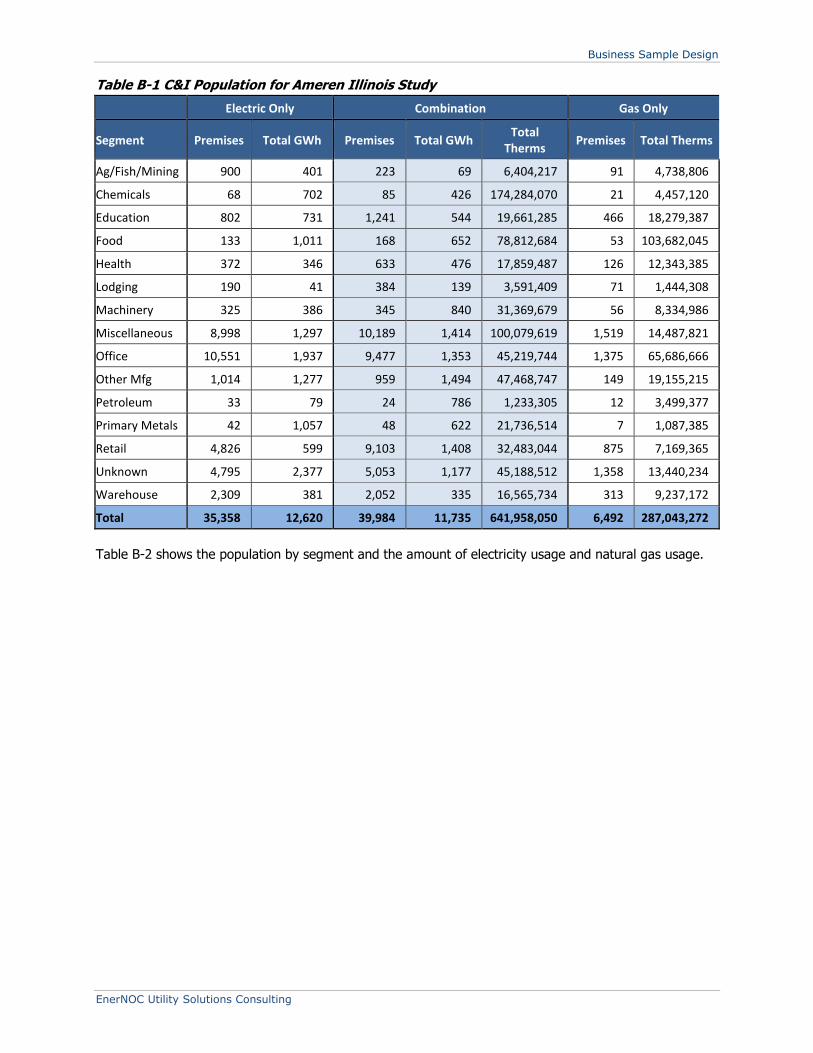
Business Sample Design
EnerNOC Utility Solutions Consulting B-5
Table B-1 C&I Population for Ameren Illinois Study
Electric Only Combination Gas Only
Segment Premises Total GWh Premises Total GWh Total
Therms Premises Total Therms
Ag/Fish/Mining 900 401 223 69 6,404,217 91 4,738,806
Chemicals 68 702 85 426 174,284,070 21 4,457,120
Education 802 731 1,241 544 19,661,285 466 18,279,387
Food 133 1,011 168 652 78,812,684 53 103,682,045
Health 372 346 633 476 17,859,487 126 12,343,385
Lodging 190 41 384 139 3,591,409 71 1,444,308
Machinery 325 386 345 840 31,369,679 56 8,334,986
Miscellaneous 8,998 1,297 10,189 1,414 100,079,619 1,519 14,487,821
Office 10,551 1,937 9,477 1,353 45,219,744 1,375 65,686,666
Other Mfg 1,014 1,277 959 1,494 47,468,747 149 19,155,215
Petroleum 33 79 24 786 1,233,305 12 3,499,377
Primary Metals 42 1,057 48 622 21,736,514 7 1,087,385
Retail 4,826 599 9,103 1,408 32,483,044 875 7,169,365
Unknown 4,795 2,377 5,053 1,177 45,188,512 1,358 13,440,234
Warehouse 2,309 381 2,052 335 16,565,734 313 9,237,172
Total 35,358 12,620 39,984 11,735 641,958,050 6,492 287,043,272
Table B-2 shows the population by segment and the amount of electricity usage and natural gas usage.

Business Sample Design
B-6 www.enernoc.com
Table B-2 Ameren Illinois C&I Establishments and Usage by Segment
Electric Population Electricity Usage Gas Population Gas Usage
Stratum Name Total
Premises % of
Premises Total kWh
% of kWh
Premises % of
Premises Total
Therms % of
Therms
Ag/Fish/Mining 1,123 1% 469 2% 314 1% 11,143,023 1%
Chemicals 153 0% 1,128 5% 106 0% 178,741,190 19%
Education 2,043 3% 1,275 5% 1,707 4% 37,940,672 4%
Food 301 0% 1,663 7% 221 0% 182,494,729 20%
Health 1,005 1% 822 3% 759 2% 30,202,872 3%
Lodging 574 1% 179 1% 455 1% 5,035,717 1%
Machinery 670 1% 1,226 5% 401 1% 39,704,665 4%
Miscellaneous 19,187 25% 2,711 11% 11,708 25% 114,567,440 12%
Office 20,028 27% 3,290 14% 10,852 23% 110,906,410 12%
Other Mfg 1,973 3% 2,771 11% 1,108 2% 66,623,962 7%
Petroleum 57 0% 865 4% 36 0% 4,732,682 1%
Primary Metals 90 0% 1,679 7% 55 0% 22,823,899 2%
Retail 13,929 18% 2,007 8% 9,978 21% 39,652,409 4%
Unknown 9,848 13% 3,554 15% 6,411 14% 58,628,746 6%
Warehouse 4,361 6% 716 3% 2,365 5% 25,802,906 3%
Total 75,342 100% 24,355 100% 46,476 100% 929,001,322 100%
*Note that the electric population plus the natural gas population exceeds the total establishment count of 81,834 because of the overlap caused by combination customers.
The sample design step approached the C&I customer population as follows:
• The largest customers/premises were identified for individual treatment. Most of these customers
will receive an onsite survey.
• The remaining small and medium C&I customers will be contacted via direct mail for the online
survey.
Based on the electricity and natural gas usage within each segment, a sample target for each of the C&I surveys was developed with a goal of optimizing the precision targets. Table B-3 shows the
allocation by segment.
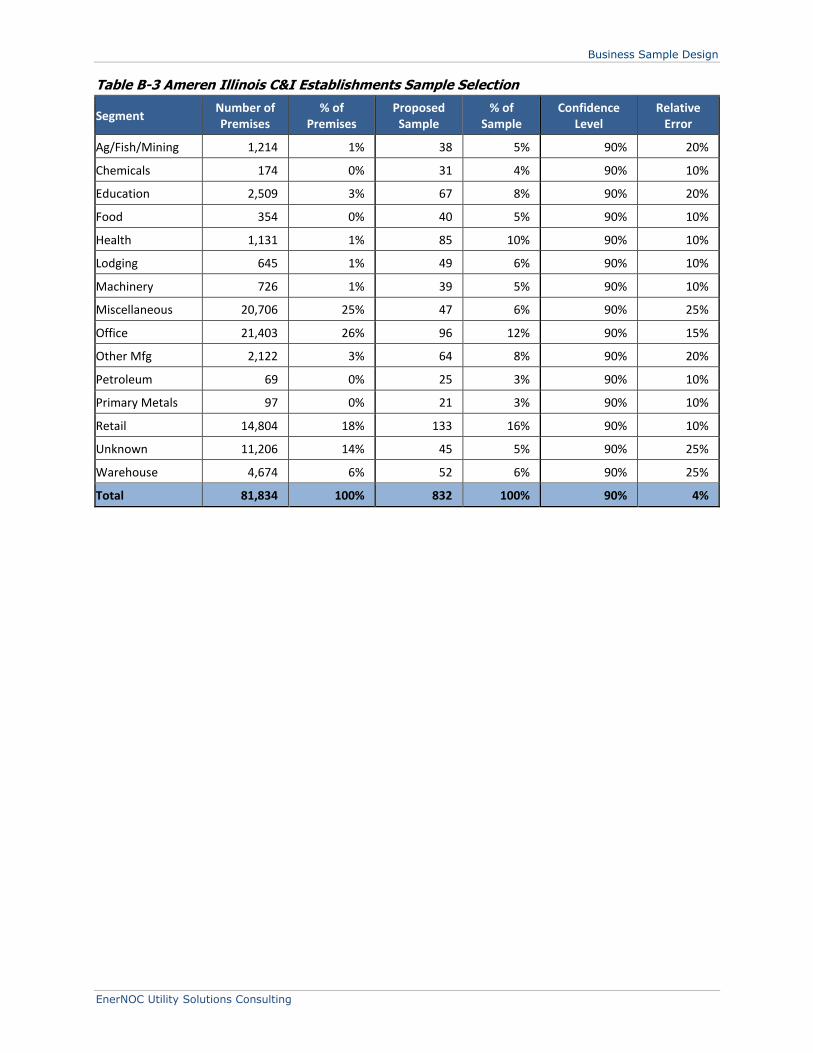
Business Sample Design
EnerNOC Utility Solutions Consulting B-7
Table B-3 Ameren Illinois C&I Establishments Sample Selection
Segment Number of Premises
% of Premises
Proposed Sample
% of Sample
Confidence Level
Relative Error
Ag/Fish/Mining 1,214 1% 38 5% 90% 20%
Chemicals 174 0% 31 4% 90% 10%
Education 2,509 3% 67 8% 90% 20%
Food 354 0% 40 5% 90% 10%
Health 1,131 1% 85 10% 90% 10%
Lodging 645 1% 49 6% 90% 10%
Machinery 726 1% 39 5% 90% 10%
Miscellaneous 20,706 25% 47 6% 90% 25%
Office 21,403 26% 96 12% 90% 15%
Other Mfg 2,122 3% 64 8% 90% 20%
Petroleum 69 0% 25 3% 90% 10%
Primary Metals 97 0% 21 3% 90% 10%
Retail 14,804 18% 133 16% 90% 10%
Unknown 11,206 14% 45 5% 90% 25%
Warehouse 4,674 6% 52 6% 90% 25%
Total 81,834 100% 832 100% 90% 4%


EnerNOC Utility Solutions Consulting C-1
APPENDIX C
RESIDENTIAL PROGRAM INTEREST SURVEY QUESTIONNAIRE
Ameren Illinois DSM Market Potential – Program Interest Questionnaire RESIDENTIAL
REVISED FINAL 7/11/2012
QUALIFYING CRITERIA AND QUOTAS
Qualifying Criteria
• The respondent must have primary or shared responsibility for making energy-related decisions
• The respondent must be at least 18 years old
• No one in the respondent’s household may work for a gas or electric utility company
• The respondent household must be billed for electricity directly by Ameren Illinois
PRELOAD ALL SAMPLE FIELDS.
Hard Quotas Total: n=700
Soft Quotas THE MAIN QUOTA VARIABLE IS STRATUM_ID / ALL OTHER QUOTAS ARE DRIVEN BY THAT ONE. USAGE STRATUM
N=SEE QUOTA GRID
Age (S3) N=AS FALLS BUT WE WANT TO TRACK
Geography – READ IN FROM SAMPLE: [REGION] N=SEE QUOTA GRID
FOR ENTIRE SURVEY, [ADDRESS]=THE FOLLOWING SAMPLE FIELDS:
ADDR# ADDRDIR ADDRSTR ADDRSUF ADDRSTRUC ADDRCITY ADDRSTATE ADDRZIP
Residential Program Interest Survey Questionnaire
C-2 www.enernoc.com
RESPONDENT IDENTIFICATION / VERIFICATION
Welcome. This survey is sponsored by Ameren Illinois.
[PROGRAMMER: INCLUDE AMEREN ILLINOIS LOGO]
Survey results will be collected and summarized by Definitive Insights, a market research company.
Please enter the 5-digit “Survey ID#” that appears on the survey invitation postcard you received. It should be located just above the mailing address on the front side of the postcard.
Survey ID# : ________________
[PROGRAMMER: VERIFY VALID CODE AND READ IN ALL VARIABLES FROM SAMPLE FILE]
We at Ameren Illinois and Definitive Insights value your privacy. We will use the information you provide for research purposes only and will NOT share it with third parties for marketing purposes. Information you provide will be stored in a secure database. If you have questions about our privacy practices or would like to get any other information about this study, please contact us via one of the following methods:
e-mail: [email protected]
phone: 1-888-742-4511
postal mail: Definitive Insights ATTN: Ameren Illinois Project Director 601 SW Oak Street Portland, Oregon 97205

Residential Program Interest Survey Questionnaire
EnerNOC Utility Solutions Consulting C-3
INTRODUCTION
Thank you for taking the time to see if you and your household qualify to participate in a new research study about energy. The study is sponsored by Ameren Illinois, and it has a very important purpose. Ameren Illinois is delivering programs to help its customers use energy more efficiently. Your answers to this survey will help the company to improve these programs so that they work best for everyone. Your household is one of a small number being asked to respond to the survey. To show our appreciation for your time and effort in completing the survey, you will have the option of choosing a $10 Amazon Electronic Gift Card or a $10 check at the end of the survey if you complete all of the questions. (You may decline to receive payment if desired.) You will first be asked a few questions to make sure your household qualifies for participation. If you do qualify, you will then be invited to complete the full survey.
Note: If you need to pause the survey at any time, you can come back later and begin again where you left off. Simply save the URL and the Survey ID# from your survey invitation to access your survey again. The survey will automatically take you to the point where you left off.
Please note: any word or phrase that appears in blue, underlined font will have a hyperlinked definition that pops-up in a separate browser window when you click on that word or phrase. Clicking on any of these hyperlinks will NOT make you navigate away from the survey site. Please click “Continue” to begin.
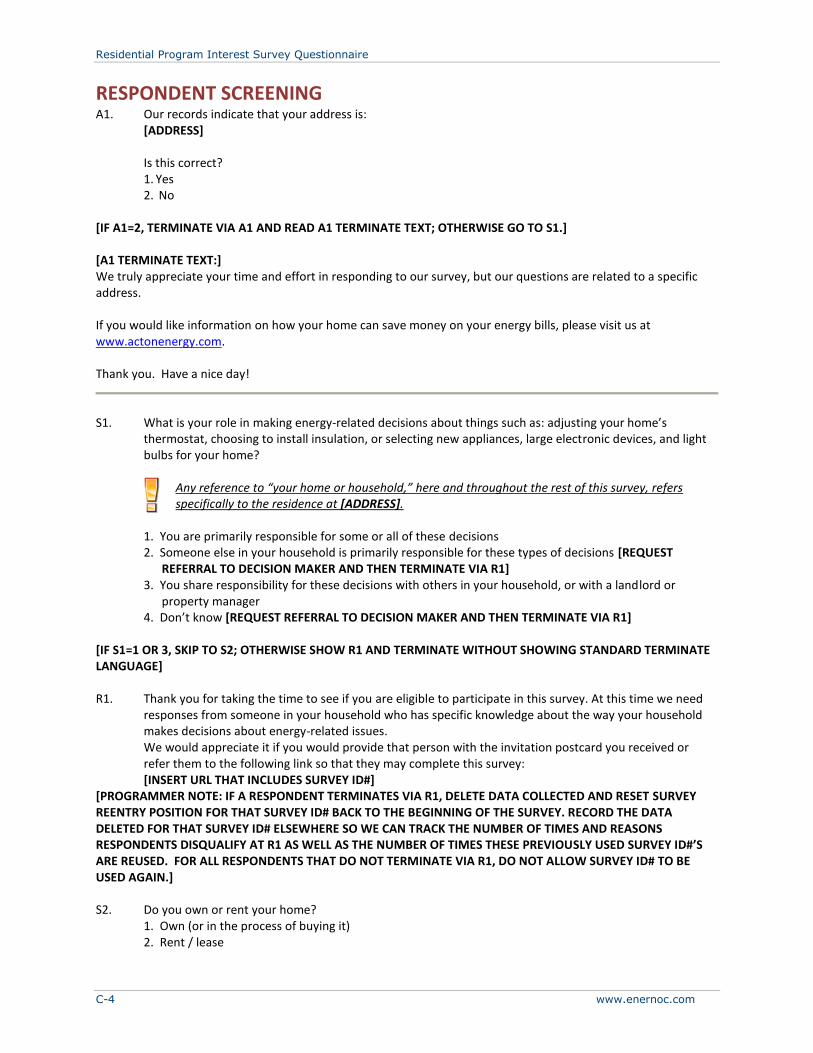
Residential Program Interest Survey Questionnaire
C-4 www.enernoc.com
RESPONDENT SCREENING
A1. Our records indicate that your address is: [ADDRESS] Is this correct?
1. Yes 2. No
[IF A1=2, TERMINATE VIA A1 AND READ A1 TERMINATE TEXT; OTHERWISE GO TO S1.] [A1 TERMINATE TEXT:] We truly appreciate your time and effort in responding to our survey, but our questions are related to a specific address. If you would like information on how your home can save money on your energy bills, please visit us at www.actonenergy.com. Thank you. Have a nice day!
S1. What is your role in making energy-related decisions about things such as: adjusting your home’s
thermostat, choosing to install insulation, or selecting new appliances, large electronic devices, and light bulbs for your home?
Any reference to “your home or household,” here and throughout the rest of this survey, refers specifically to the residence at [ADDRESS].
1. You are primarily responsible for some or all of these decisions 2. Someone else in your household is primarily responsible for these types of decisions [REQUEST
REFERRAL TO DECISION MAKER AND THEN TERMINATE VIA R1] 3. You share responsibility for these decisions with others in your household, or with a landlord or
property manager 4. Don’t know [REQUEST REFERRAL TO DECISION MAKER AND THEN TERMINATE VIA R1]
[IF S1=1 OR 3, SKIP TO S2; OTHERWISE SHOW R1 AND TERMINATE WITHOUT SHOWING STANDARD TERMINATE LANGUAGE] R1. Thank you for taking the time to see if you are eligible to participate in this survey. At this time we need
responses from someone in your household who has specific knowledge about the way your household makes decisions about energy-related issues. We would appreciate it if you would provide that person with the invitation postcard you received or refer them to the following link so that they may complete this survey: [INSERT URL THAT INCLUDES SURVEY ID#]
[PROGRAMMER NOTE: IF A RESPONDENT TERMINATES VIA R1, DELETE DATA COLLECTED AND RESET SURVEY REENTRY POSITION FOR THAT SURVEY ID# BACK TO THE BEGINNING OF THE SURVEY. RECORD THE DATA DELETED FOR THAT SURVEY ID# ELSEWHERE SO WE CAN TRACK THE NUMBER OF TIMES AND REASONS RESPONDENTS DISQUALIFY AT R1 AS WELL AS THE NUMBER OF TIMES THESE PREVIOUSLY USED SURVEY ID#’S ARE REUSED. FOR ALL RESPONDENTS THAT DO NOT TERMINATE VIA R1, DO NOT ALLOW SURVEY ID# TO BE USED AGAIN.] S2. Do you own or rent your home?
1. Own (or in the process of buying it) 2. Rent / lease
Residential Program Interest Survey Questionnaire
EnerNOC Utility Solutions Consulting C-5
S3. Which of the following categories represents your current age? 1. Less than 18 years old [TERMINATE AFTER S7]
2. 18-24
3. 25-34
4. 35-44
5. 45-54
6. 55-64
7. 65 or more years old
[IF S3=2-7, ASK S4; OTHERWISE ASK S4 AND TERMINATE AFTER S7] S4. Do you, or does anyone else in your household work for a gas or electric utility company?
1. Yes [TERMINATE AFTER S7] 2. No
[IF S4=2, CONTINUE; OTHERWISE, TERMINATE AFTER S7 OR S9 – DEPENDING ON S6 RESPONSE] S5. How is your household billed for the electricity you use?
1. My household is billed directly by Ameren Illinois [CONTINUE TO S6, BUT DO NOT TERMINATE, REGARDLESS OF S6 RESPONSE]
2. My household is NOT billed directly by Ameren Illinois; the cost for our electricity is included in our rent, or is paid by someone else [ASK S6 – IF S6 NOT=1, ASK S7-S9 AND TERMINATE]
3. My household’s electricity is provided by another utility; not Ameren Illinois [ASK S6 – IF S6 NOT=1, TERMINATE AFTER S7]
4. Don’t know [ASK S6, BUT TERMINATE AFTER S7, REGARDLESS OF S6 RESPONSE]
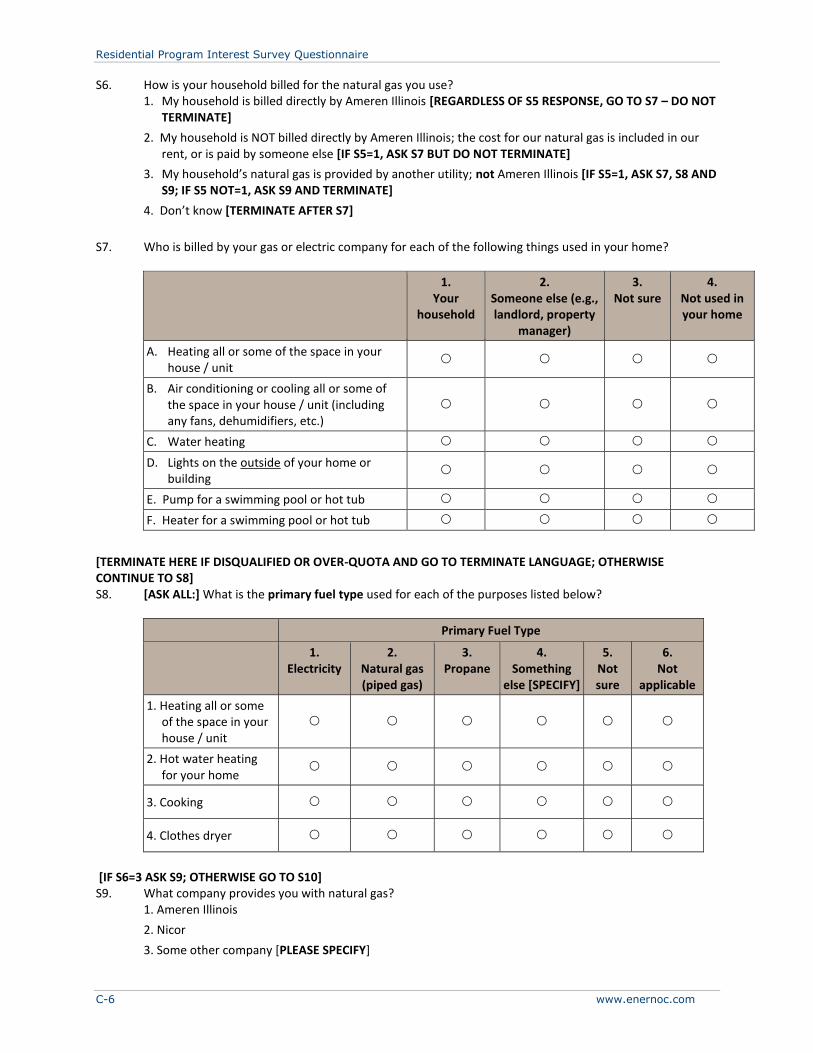
Residential Program Interest Survey Questionnaire
C-6 www.enernoc.com
S6. How is your household billed for the natural gas you use? 1. My household is billed directly by Ameren Illinois [REGARDLESS OF S5 RESPONSE, GO TO S7 – DO NOT
TERMINATE]
2. My household is NOT billed directly by Ameren Illinois; the cost for our natural gas is included in our rent, or is paid by someone else [IF S5=1, ASK S7 BUT DO NOT TERMINATE]
3. My household’s natural gas is provided by another utility; not Ameren Illinois [IF S5=1, ASK S7, S8 AND S9; IF S5 NOT=1, ASK S9 AND TERMINATE]
4. Don’t know [TERMINATE AFTER S7]
S7. Who is billed by your gas or electric company for each of the following things used in your home?
1. Your
household
2. Someone else (e.g., landlord, property
manager)
3. Not sure
4. Not used in your home
A. Heating all or some of the space in your house / unit
B. Air conditioning or cooling all or some of the space in your house / unit (including any fans, dehumidifiers, etc.)
C. Water heating
D. Lights on the outside of your home or building
E. Pump for a swimming pool or hot tub
F. Heater for a swimming pool or hot tub
[TERMINATE HERE IF DISQUALIFIED OR OVER-QUOTA AND GO TO TERMINATE LANGUAGE; OTHERWISE CONTINUE TO S8] S8. [ASK ALL:] What is the primary fuel type used for each of the purposes listed below?
Primary Fuel Type
1.
Electricity 2.
Natural gas (piped gas)
3. Propane
4. Something
else [SPECIFY]
5. Not sure
6. Not
applicable
1. Heating all or some of the space in your house / unit
2. Hot water heating for your home
3. Cooking
4. Clothes dryer
[IF S6=3 ASK S9; OTHERWISE GO TO S10] S9. What company provides you with natural gas?
1. Ameren Illinois
2. Nicor
3. Some other company [PLEASE SPECIFY]
Residential Program Interest Survey Questionnaire
EnerNOC Utility Solutions Consulting C-7
[IF S5 NOT=1 AND S9 NOT=1, TERMINATE; OTHERWISE CONTINUE]
S10. Which of the following systems/equipment do you use to cool your home, even if only once in a while,
and / or for part of your home? Select all that apply. 1. Central air conditioner
2. One or more room air conditioners mounted in or near a window or on a wall
3. Air-source heat pump
4. Geothermal heat pump
5. Whole-house fan
6. Attic fan
7. One or more portable room air conditioners
8. One or more portable dehumidifiers
9. One or more ceiling fans
10. One or more window or room fans
990. Other [SPECIFY]
996. Not sure [EXCLUSIVE]
998. My home has no cooling systems/equipment [EXCLUSIVE]
[IF >1 ITEM SELECTED IN S10, DISLAY S11; OTHERWISE AUTOCODE S11=S10 AND SKIP TO S12] S11. Which one of these cooling systems/equipment do you use to cool all or most of your home? [ONLY DISPLAY ITEMS SELECTED IN S10]
1. Central air conditioner
2. One or more room air conditioners mounted in or near a window or on a wall
3. Air-source heat pump
4. Geothermal heat pump
5. Whole-house fan
6. Attic fan
7. One or more portable room air conditioners
8. One or more portable dehumidifiers
9. One or more ceiling fans
10. One or more window or room fans
990. [INSERT S10_990 RESPONSE]
996. Not sure [EXCLUSIVE]
998. home has no cooling systems/equipment that cool all or most of my home [EXCLUSIVE]
S12. Which of the following systems/equipment do you use to heat your home, even if only once in a while, and / or for part of your home? Select all that apply. 1. Central warm air furnace with ducts/vents to individual rooms
2. Central boiler with hot water/steam radiators or baseboards in individual rooms
3. Electric baseboard or electric coils radiant heating
4. An air-source heat pump
5. A geothermal heat pump
6. One or more wall furnaces
7. One or more fireplaces
8. One or more wood burning stoves
9. One or more wall-mounted space heaters
Residential Program Interest Survey Questionnaire
C-8 www.enernoc.com
10. One or more portable space heaters
990. Other [SPECIFY]
996. Not sure [EXCLUSIVE]
998. My home has no heating systems/equipment [EXCLUSIVE]
[IF >1 ITEM SELECTED IN S12, DISLAY S13; OTHERWISE AUTOCODE S13=S12 AND SKIP TO END OF SCREENER]
S13. Which one of these heating systems/equipment do you use to heat all or most of your home? [ONLY DISPLAY ITEMS SELECTED IN S12]
1. Central warm air furnace with ducts/vents to individual rooms
2. Central boiler with hot water/steam radiators or baseboards in individual rooms
3. Electric baseboard or electric coils radiant heating
4. An air-source heat pump
5. A geothermal heat pump
6. One or more wall furnaces
7. One or more fireplaces
8. One or more wood burning stoves
9. One or more wall-mounted space heaters
10. One or more portable space heaters
990. [INSERT S12_990 RESPONSE]
996. Not sure [EXCLUSIVE]
998. My home has no heating system/equipment that heat all of most of my home [EXCLUSIVE]
[TERMINATE IF DISQUALIFIED; OR OVER-QUOTA AND GO TO TERMINATE LANGUAGE; OTHERWISE GO TO INVITATION LANGUAGE]
Residential Program Interest Survey Questionnaire
EnerNOC Utility Solutions Consulting C-9
TERMINATE LANGUAGE FOR NON-QUALIFYING AFTER QS1.0 OR OVER-QUOTA RESPONDENTS
We truly appreciate your time and effort in responding to our survey invitation and answering these initial questions, which were designed to see if you are eligible to participate. In order to achieve a representative sample, quotas with specific criteria have been designated. At this point, we have reached the number of respondents we can accept from individuals with your type of experience or background. Again, we would like to thank you for your time and effort.
If you would like information on how your home can save money on your energy bills, please visit us at www.actonenergy.com
Thank you. Have a nice day!
INVITATION LANGUAGE FOR QUALIFYING RESPONDENTS
Thank you for your responses so far! You qualify for the survey. As we indicated earlier, only a limited number of individuals have been invited to participate in this survey, so we appreciate your time in filling out the survey as completely as possible. The survey should take about 20 - 25 minutes to complete. Once you complete the survey you will be eligible to receive our $10 thank you payment. Information about how to receive this payment will be provided at the end of the survey. Your responses are important to us, so please press “Continue” to begin answering the survey questions. All information provided in this survey will be kept strictly confidential, and at no time will you be asked to purchase anything If you need to pause the survey at any time, you can come back later and begin again where you left off. Simply save the personalized URL to access your survey again. The survey will automatically take you to the point where you left off. As you complete the survey, you will not be able to use your browser’s “back” button. If you mistakenly press your browser’s “back” button, you will need to press the “refresh” button to continue the survey.
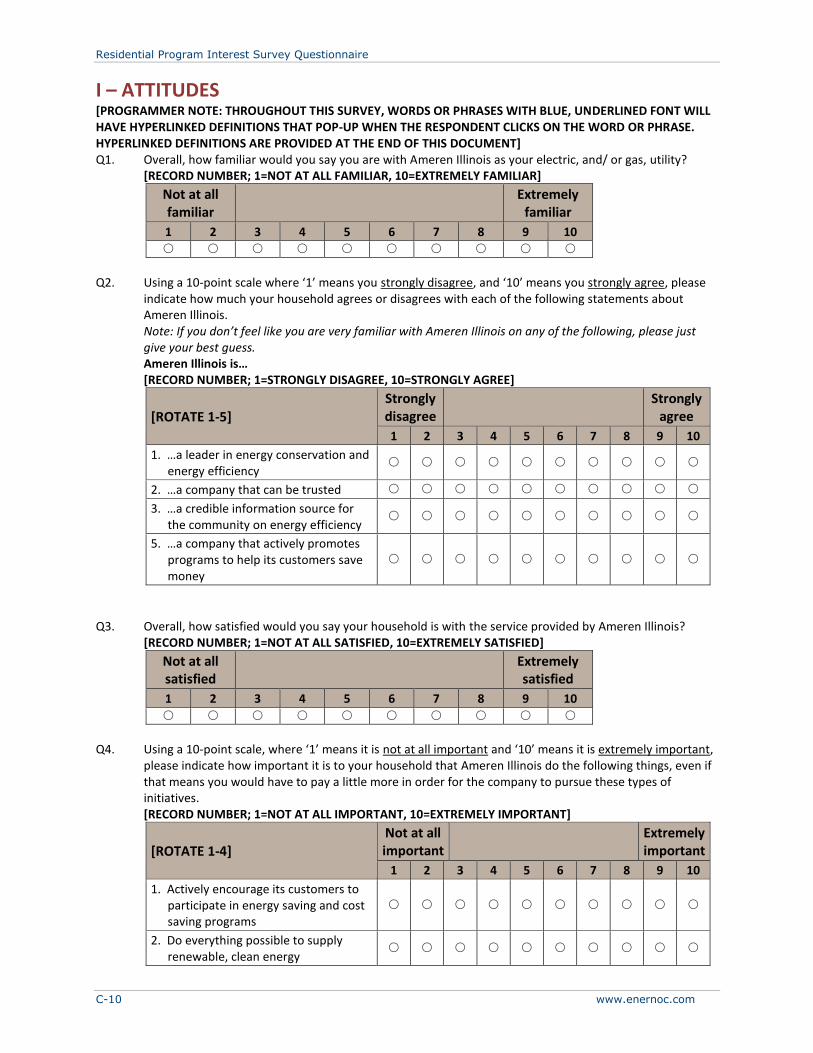
Residential Program Interest Survey Questionnaire
C-10 www.enernoc.com
I – ATTITUDES
[PROGRAMMER NOTE: THROUGHOUT THIS SURVEY, WORDS OR PHRASES WITH BLUE, UNDERLINED FONT WILL HAVE HYPERLINKED DEFINITIONS THAT POP-UP WHEN THE RESPONDENT CLICKS ON THE WORD OR PHRASE. HYPERLINKED DEFINITIONS ARE PROVIDED AT THE END OF THIS DOCUMENT] Q1. Overall, how familiar would you say you are with Ameren Illinois as your electric, and/ or gas, utility? [RECORD NUMBER; 1=NOT AT ALL FAMILIAR, 10=EXTREMELY FAMILIAR]
Not at all familiar
Extremely familiar
1 2 3 4 5 6 7 8 9 10
Q2. Using a 10-point scale where ‘1’ means you strongly disagree, and ‘10’ means you strongly agree, please
indicate how much your household agrees or disagrees with each of the following statements about Ameren Illinois.
Note: If you don’t feel like you are very familiar with Ameren Illinois on any of the following, please just give your best guess.
Ameren Illinois is… [RECORD NUMBER; 1=STRONGLY DISAGREE, 10=STRONGLY AGREE]
[ROTATE 1-5] Strongly disagree
Strongly agree
1 2 3 4 5 6 7 8 9 10
1. …a leader in energy conservation and energy efficiency
2. …a company that can be trusted
3. …a credible information source for the community on energy efficiency
5. …a company that actively promotes programs to help its customers save money
Q3. Overall, how satisfied would you say your household is with the service provided by Ameren Illinois? [RECORD NUMBER; 1=NOT AT ALL SATISFIED, 10=EXTREMELY SATISFIED]
Not at all satisfied
Extremely satisfied
1 2 3 4 5 6 7 8 9 10
Q4. Using a 10-point scale, where ‘1’ means it is not at all important and ‘10’ means it is extremely important,
please indicate how important it is to your household that Ameren Illinois do the following things, even if that means you would have to pay a little more in order for the company to pursue these types of initiatives.
[RECORD NUMBER; 1=NOT AT ALL IMPORTANT, 10=EXTREMELY IMPORTANT]
[ROTATE 1-4]
Not at all important
Extremely important
1 2 3 4 5 6 7 8 9 10
1. Actively encourage its customers to participate in energy saving and cost saving programs
2. Do everything possible to supply renewable, clean energy
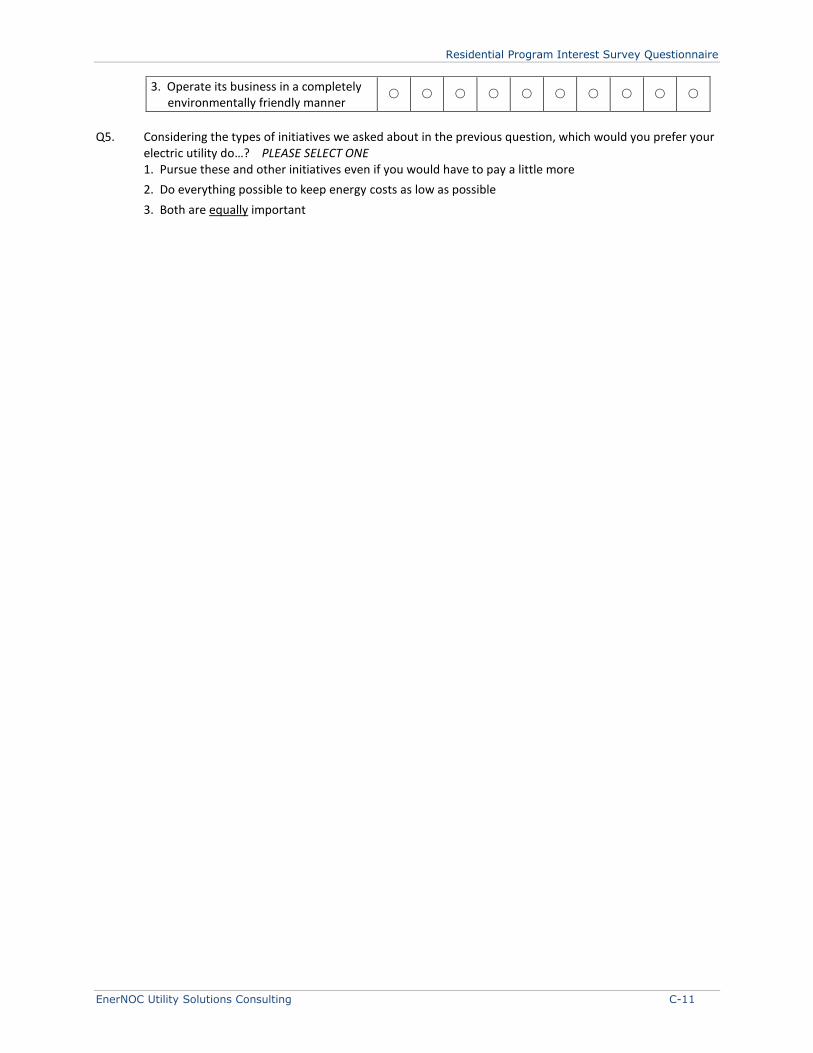
Residential Program Interest Survey Questionnaire
EnerNOC Utility Solutions Consulting C-11
3. Operate its business in a completely environmentally friendly manner
Q5. Considering the types of initiatives we asked about in the previous question, which would you prefer your
electric utility do…? PLEASE SELECT ONE 1. Pursue these and other initiatives even if you would have to pay a little more
2. Do everything possible to keep energy costs as low as possible
3. Both are equally important
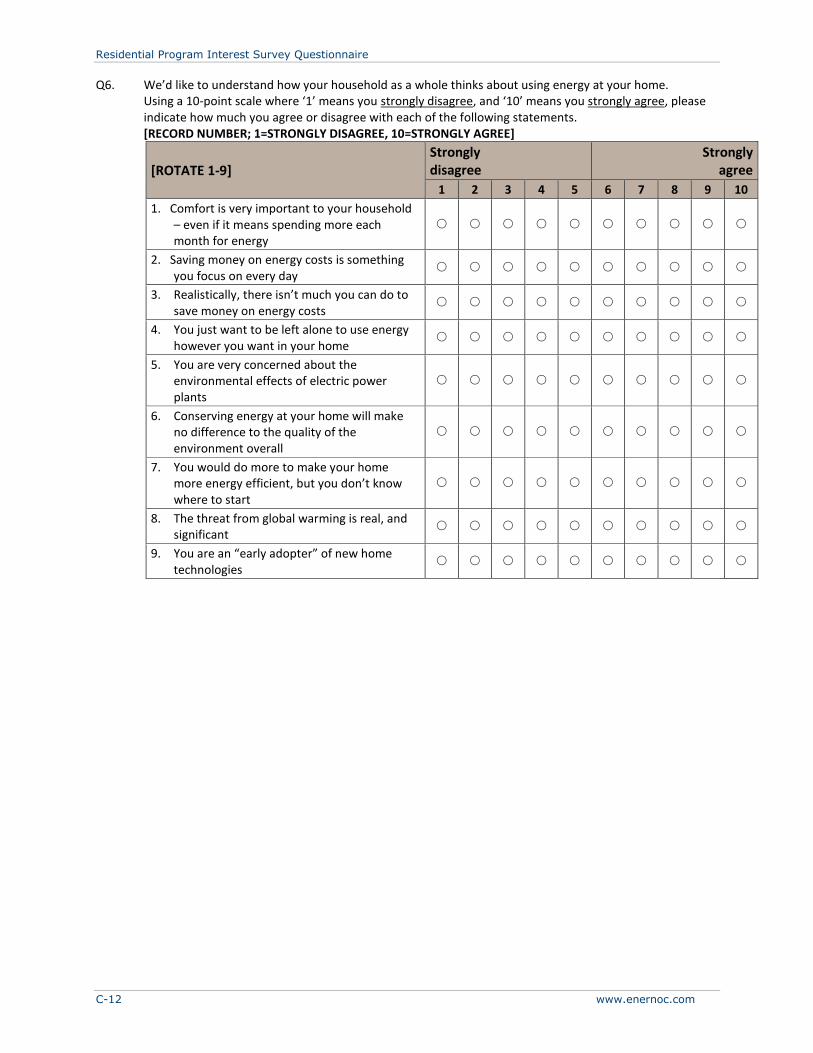
Residential Program Interest Survey Questionnaire
C-12 www.enernoc.com
Q6. We’d like to understand how your household as a whole thinks about using energy at your home. Using a 10-point scale where ‘1’ means you strongly disagree, and ‘10’ means you strongly agree, please indicate how much you agree or disagree with each of the following statements.
[RECORD NUMBER; 1=STRONGLY DISAGREE, 10=STRONGLY AGREE]
[ROTATE 1-9]
Strongly disagree
Strongly agree
1 2 3 4 5 6 7 8 9 10
1. Comfort is very important to your household – even if it means spending more each month for energy
2. Saving money on energy costs is something you focus on every day
3. Realistically, there isn’t much you can do to save money on energy costs
4. You just want to be left alone to use energy however you want in your home
5. You are very concerned about the environmental effects of electric power plants
6. Conserving energy at your home will make no difference to the quality of the environment overall
7. You would do more to make your home more energy efficient, but you don’t know where to start
8. The threat from global warming is real, and significant
9. You are an “early adopter” of new home technologies
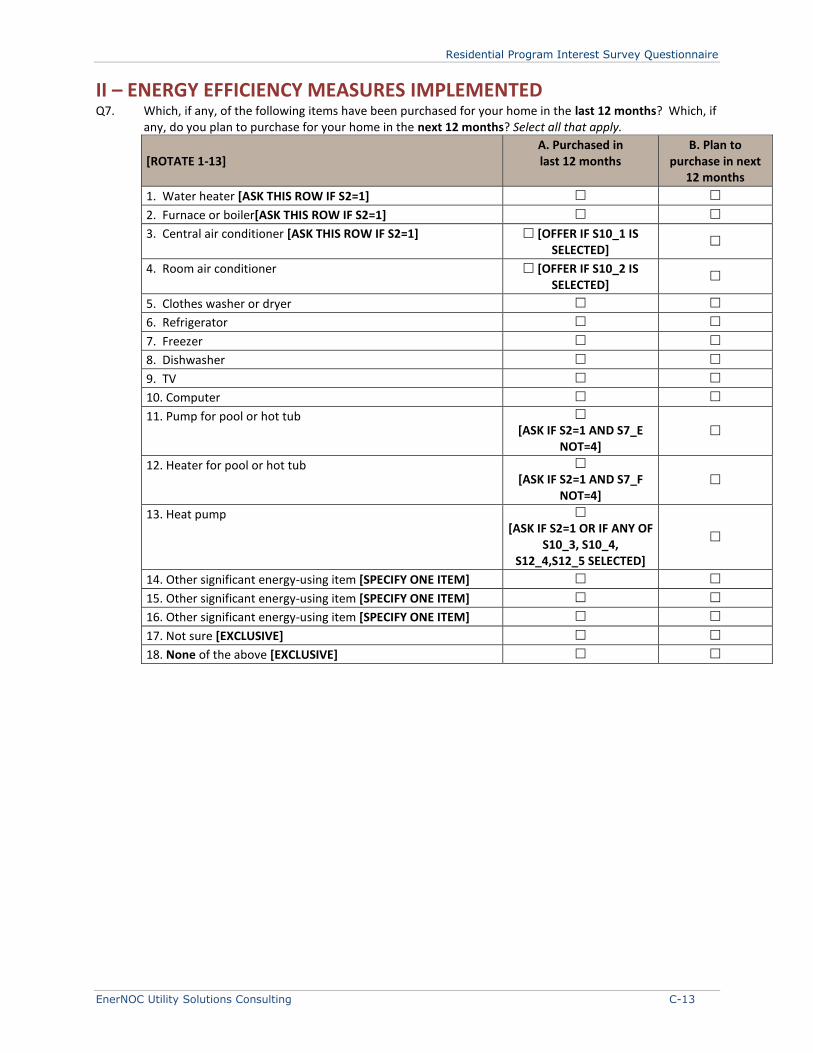
Residential Program Interest Survey Questionnaire
EnerNOC Utility Solutions Consulting C-13
II – ENERGY EFFICIENCY MEASURES IMPLEMENTED
Q7. Which, if any, of the following items have been purchased for your home in the last 12 months? Which, if any, do you plan to purchase for your home in the next 12 months? Select all that apply.
[ROTATE 1-13] A. Purchased in last 12 months
B. Plan to purchase in next
12 months
1. Water heater [ASK THIS ROW IF S2=1]
2. Furnace or boiler[ASK THIS ROW IF S2=1]
3. Central air conditioner [ASK THIS ROW IF S2=1] [OFFER IF S10_1 IS SELECTED]
4. Room air conditioner [OFFER IF S10_2 IS SELECTED]
5. Clothes washer or dryer
6. Refrigerator
7. Freezer
8. Dishwasher
9. TV
10. Computer
11. Pump for pool or hot tub [ASK IF S2=1 AND S7_E
NOT=4]
12. Heater for pool or hot tub [ASK IF S2=1 AND S7_F
NOT=4]
13. Heat pump [ASK IF S2=1 OR IF ANY OF
S10_3, S10_4, S12_4,S12_5 SELECTED]
14. Other significant energy-using item [SPECIFY ONE ITEM]
15. Other significant energy-using item [SPECIFY ONE ITEM]
16. Other significant energy-using item [SPECIFY ONE ITEM]
17. Not sure [EXCLUSIVE]
18. None of the above [EXCLUSIVE]
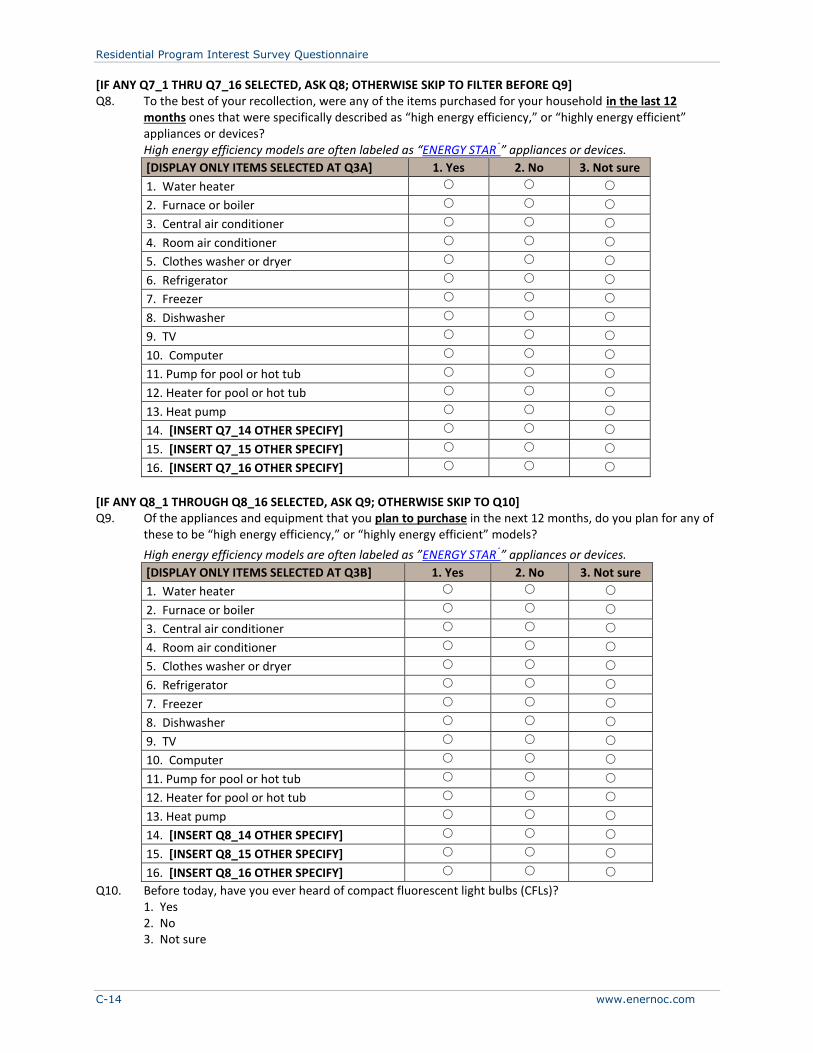
Residential Program Interest Survey Questionnaire
C-14 www.enernoc.com
[IF ANY Q7_1 THRU Q7_16 SELECTED, ASK Q8; OTHERWISE SKIP TO FILTER BEFORE Q9] Q8. To the best of your recollection, were any of the items purchased for your household in the last 12
months ones that were specifically described as “high energy efficiency,” or “highly energy efficient” appliances or devices?
High energy efficiency models are often labeled as “ENERGY STAR®” appliances or devices.
[DISPLAY ONLY ITEMS SELECTED AT Q3A] 1. Yes 2. No 3. Not sure
1. Water heater
2. Furnace or boiler
3. Central air conditioner
4. Room air conditioner
5. Clothes washer or dryer
6. Refrigerator
7. Freezer
8. Dishwasher
9. TV
10. Computer
11. Pump for pool or hot tub
12. Heater for pool or hot tub
13. Heat pump
14. [INSERT Q7_14 OTHER SPECIFY]
15. [INSERT Q7_15 OTHER SPECIFY]
16. [INSERT Q7_16 OTHER SPECIFY]
[IF ANY Q8_1 THROUGH Q8_16 SELECTED, ASK Q9; OTHERWISE SKIP TO Q10] Q9. Of the appliances and equipment that you plan to purchase in the next 12 months, do you plan for any of
these to be “high energy efficiency,” or “highly energy efficient” models?
High energy efficiency models are often labeled as ”ENERGY STAR®” appliances or devices.
[DISPLAY ONLY ITEMS SELECTED AT Q3B] 1. Yes 2. No 3. Not sure
1. Water heater
2. Furnace or boiler
3. Central air conditioner
4. Room air conditioner
5. Clothes washer or dryer
6. Refrigerator
7. Freezer
8. Dishwasher
9. TV
10. Computer
11. Pump for pool or hot tub
12. Heater for pool or hot tub
13. Heat pump
14. [INSERT Q8_14 OTHER SPECIFY]
15. [INSERT Q8_15 OTHER SPECIFY]
16. [INSERT Q8_16 OTHER SPECIFY]
Q10. Before today, have you ever heard of compact fluorescent light bulbs (CFLs)? 1. Yes 2. No 3. Not sure
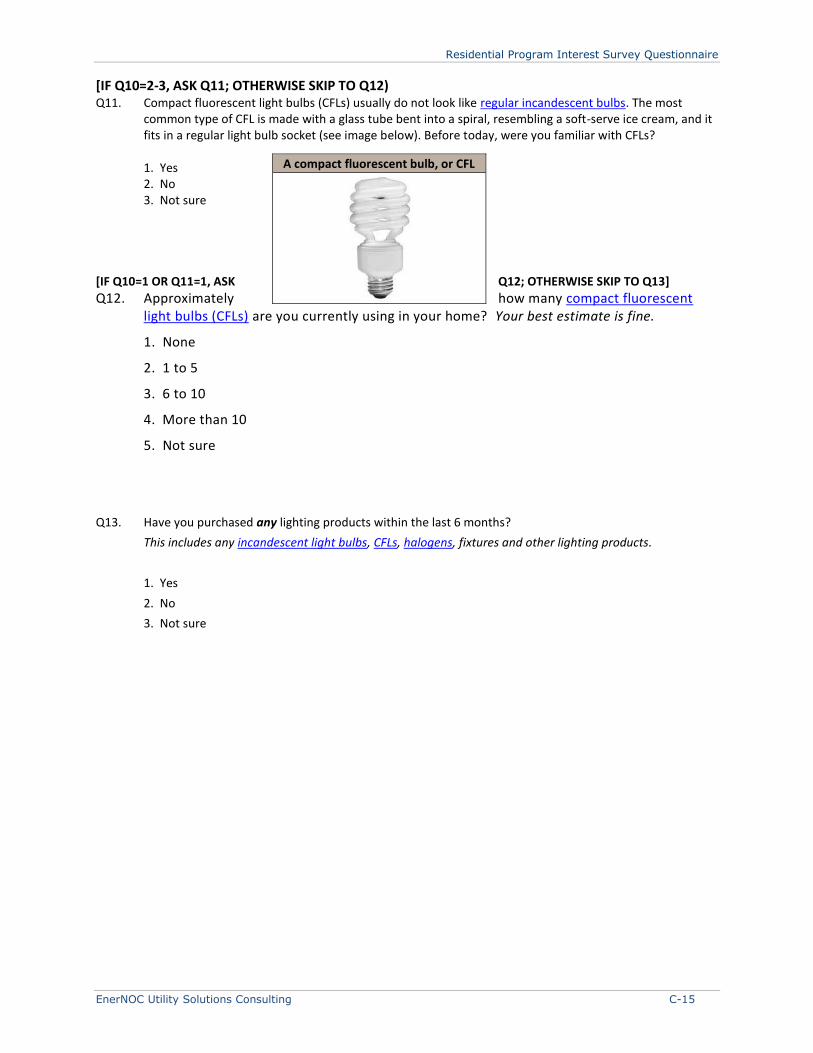
Residential Program Interest Survey Questionnaire
EnerNOC Utility Solutions Consulting C-15
[IF Q10=2-3, ASK Q11; OTHERWISE SKIP TO Q12) Q11. Compact fluorescent light bulbs (CFLs) usually do not look like regular incandescent bulbs. The most
common type of CFL is made with a glass tube bent into a spiral, resembling a soft-serve ice cream, and it fits in a regular light bulb socket (see image below). Before today, were you familiar with CFLs?
1. Yes 2. No 3. Not sure
[IF Q10=1 OR Q11=1, ASK Q12; OTHERWISE SKIP TO Q13]
Q12. Approximately how many compact fluorescent light bulbs (CFLs) are you currently using in your home? Your best estimate is fine.
1. None
2. 1 to 5
3. 6 to 10
4. More than 10
5. Not sure
Q13. Have you purchased any lighting products within the last 6 months?
This includes any incandescent light bulbs, CFLs, halogens, fixtures and other lighting products.
1. Yes
2. No
3. Not sure
A compact fluorescent bulb, or CFL
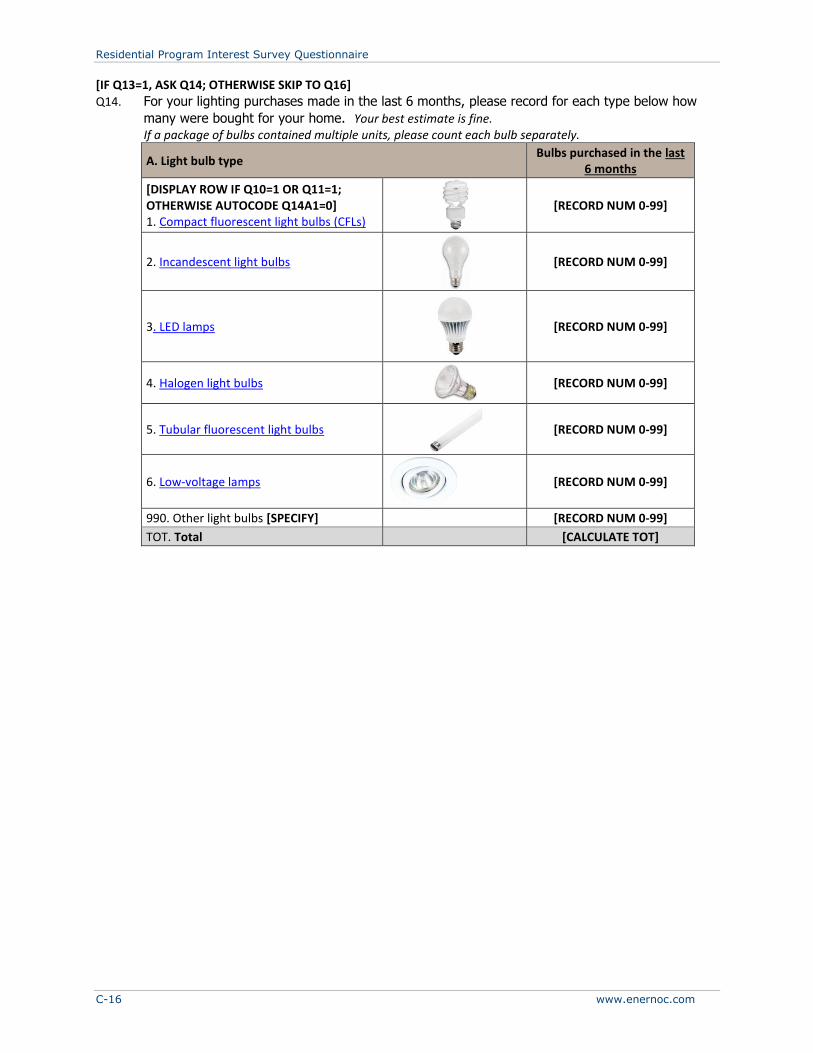
Residential Program Interest Survey Questionnaire
C-16 www.enernoc.com
[IF Q13=1, ASK Q14; OTHERWISE SKIP TO Q16]
Q14. For your lighting purchases made in the last 6 months, please record for each type below how
many were bought for your home. Your best estimate is fine. If a package of bulbs contained multiple units, please count each bulb separately.
A. Light bulb type Bulbs purchased in the last
6 months
[DISPLAY ROW IF Q10=1 OR Q11=1; OTHERWISE AUTOCODE Q14A1=0] 1. Compact fluorescent light bulbs (CFLs)
[RECORD NUM 0-99]
2. Incandescent light bulbs
[RECORD NUM 0-99]
3. LED lamps
[RECORD NUM 0-99]
4. Halogen light bulbs
[RECORD NUM 0-99]
5. Tubular fluorescent light bulbs
[RECORD NUM 0-99]
6. Low-voltage lamps
[RECORD NUM 0-99]
990. Other light bulbs [SPECIFY] [RECORD NUM 0-99]
TOT. Total [CALCULATE TOT]
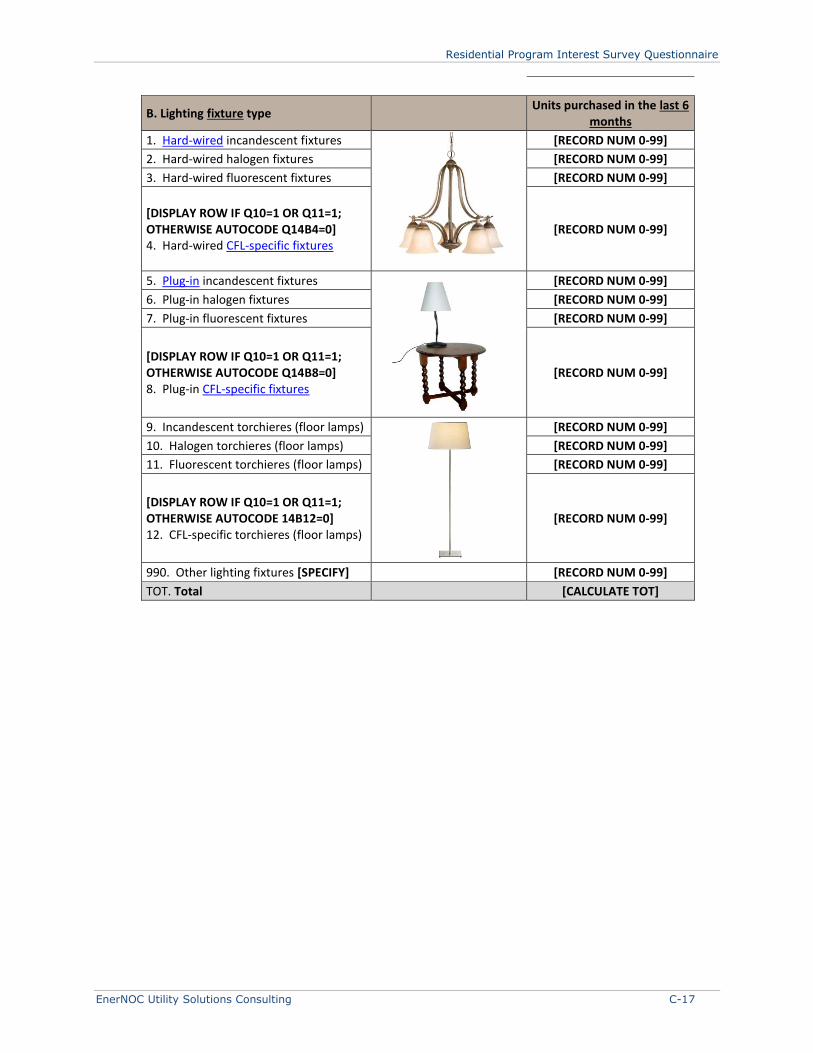
Residential Program Interest Survey Questionnaire
EnerNOC Utility Solutions Consulting C-17
B. Lighting fixture type Units purchased in the last 6
months
1. Hard-wired incandescent fixtures
[RECORD NUM 0-99]
2. Hard-wired halogen fixtures [RECORD NUM 0-99]
3. Hard-wired fluorescent fixtures [RECORD NUM 0-99]
[DISPLAY ROW IF Q10=1 OR Q11=1; OTHERWISE AUTOCODE Q14B4=0] 4. Hard-wired CFL-specific fixtures
[RECORD NUM 0-99]
5. Plug-in incandescent fixtures
[RECORD NUM 0-99]
6. Plug-in halogen fixtures [RECORD NUM 0-99]
7. Plug-in fluorescent fixtures [RECORD NUM 0-99]
[DISPLAY ROW IF Q10=1 OR Q11=1; OTHERWISE AUTOCODE Q14B8=0] 8. Plug-in CFL-specific fixtures
[RECORD NUM 0-99]
9. Incandescent torchieres (floor lamps)
[RECORD NUM 0-99]
10. Halogen torchieres (floor lamps) [RECORD NUM 0-99]
11. Fluorescent torchieres (floor lamps) [RECORD NUM 0-99]
[DISPLAY ROW IF Q10=1 OR Q11=1; OTHERWISE AUTOCODE 14B12=0] 12. CFL-specific torchieres (floor lamps)
[RECORD NUM 0-99]
990. Other lighting fixtures [SPECIFY] [RECORD NUM 0-99]
TOT. Total [CALCULATE TOT]
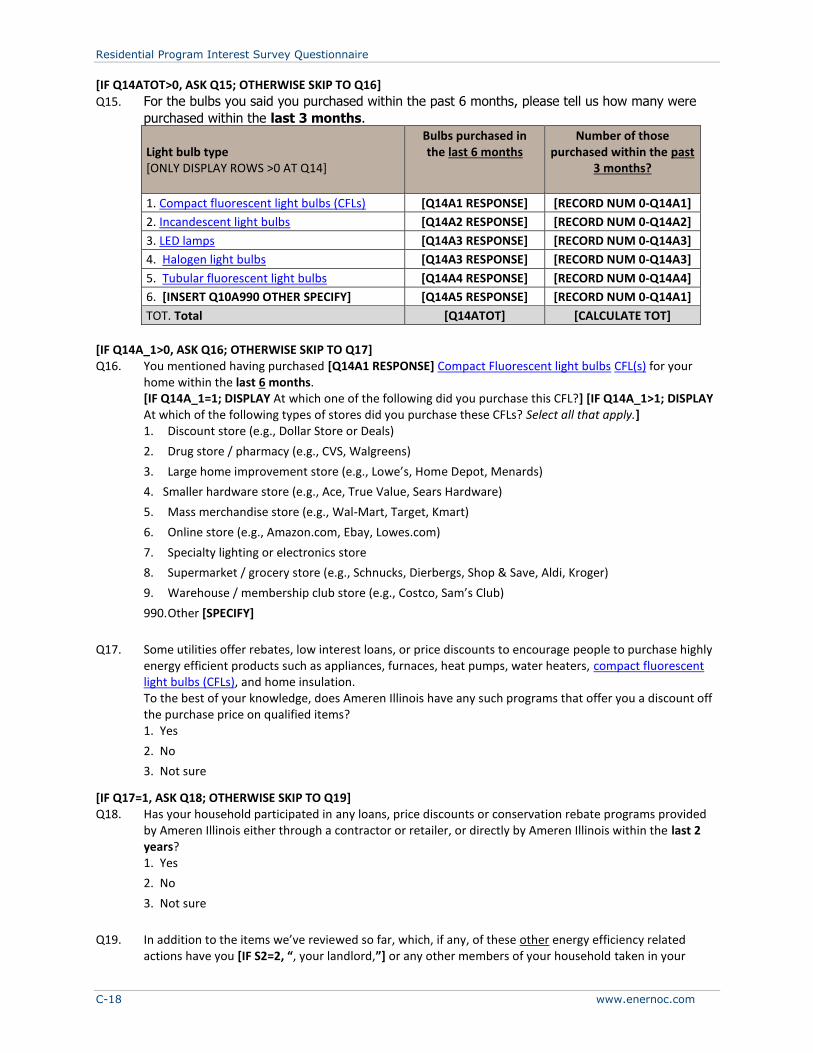
Residential Program Interest Survey Questionnaire
C-18 www.enernoc.com
[IF Q14ATOT>0, ASK Q15; OTHERWISE SKIP TO Q16]
Q15. For the bulbs you said you purchased within the past 6 months, please tell us how many were
purchased within the last 3 months.
Light bulb type [ONLY DISPLAY ROWS >0 AT Q14]
Bulbs purchased in the last 6 months
Number of those purchased within the past
3 months?
1. Compact fluorescent light bulbs (CFLs) [Q14A1 RESPONSE] [RECORD NUM 0-Q14A1]
2. Incandescent light bulbs [Q14A2 RESPONSE] [RECORD NUM 0-Q14A2]
3. LED lamps [Q14A3 RESPONSE] [RECORD NUM 0-Q14A3]
4. Halogen light bulbs [Q14A3 RESPONSE] [RECORD NUM 0-Q14A3]
5. Tubular fluorescent light bulbs [Q14A4 RESPONSE] [RECORD NUM 0-Q14A4]
6. [INSERT Q10A990 OTHER SPECIFY] [Q14A5 RESPONSE] [RECORD NUM 0-Q14A1]
TOT. Total [Q14ATOT] [CALCULATE TOT]
[IF Q14A_1>0, ASK Q16; OTHERWISE SKIP TO Q17] Q16. You mentioned having purchased [Q14A1 RESPONSE] Compact Fluorescent light bulbs CFL(s) for your
home within the last 6 months. [IF Q14A_1=1; DISPLAY At which one of the following did you purchase this CFL?] [IF Q14A_1>1; DISPLAY At which of the following types of stores did you purchase these CFLs? Select all that apply.] 1. Discount store (e.g., Dollar Store or Deals)
2. Drug store / pharmacy (e.g., CVS, Walgreens)
3. Large home improvement store (e.g., Lowe’s, Home Depot, Menards)
4. Smaller hardware store (e.g., Ace, True Value, Sears Hardware)
5. Mass merchandise store (e.g., Wal-Mart, Target, Kmart)
6. Online store (e.g., Amazon.com, Ebay, Lowes.com)
7. Specialty lighting or electronics store
8. Supermarket / grocery store (e.g., Schnucks, Dierbergs, Shop & Save, Aldi, Kroger)
9. Warehouse / membership club store (e.g., Costco, Sam’s Club)
990. Other [SPECIFY]
Q17. Some utilities offer rebates, low interest loans, or price discounts to encourage people to purchase highly
energy efficient products such as appliances, furnaces, heat pumps, water heaters, compact fluorescent light bulbs (CFLs), and home insulation. To the best of your knowledge, does Ameren Illinois have any such programs that offer you a discount off the purchase price on qualified items? 1. Yes
2. No
3. Not sure
[IF Q17=1, ASK Q18; OTHERWISE SKIP TO Q19] Q18. Has your household participated in any loans, price discounts or conservation rebate programs provided
by Ameren Illinois either through a contractor or retailer, or directly by Ameren Illinois within the last 2 years? 1. Yes
2. No
3. Not sure
Q19. In addition to the items we’ve reviewed so far, which, if any, of these other energy efficiency related
actions have you [IF S2=2, “, your landlord,”] or any other members of your household taken in your
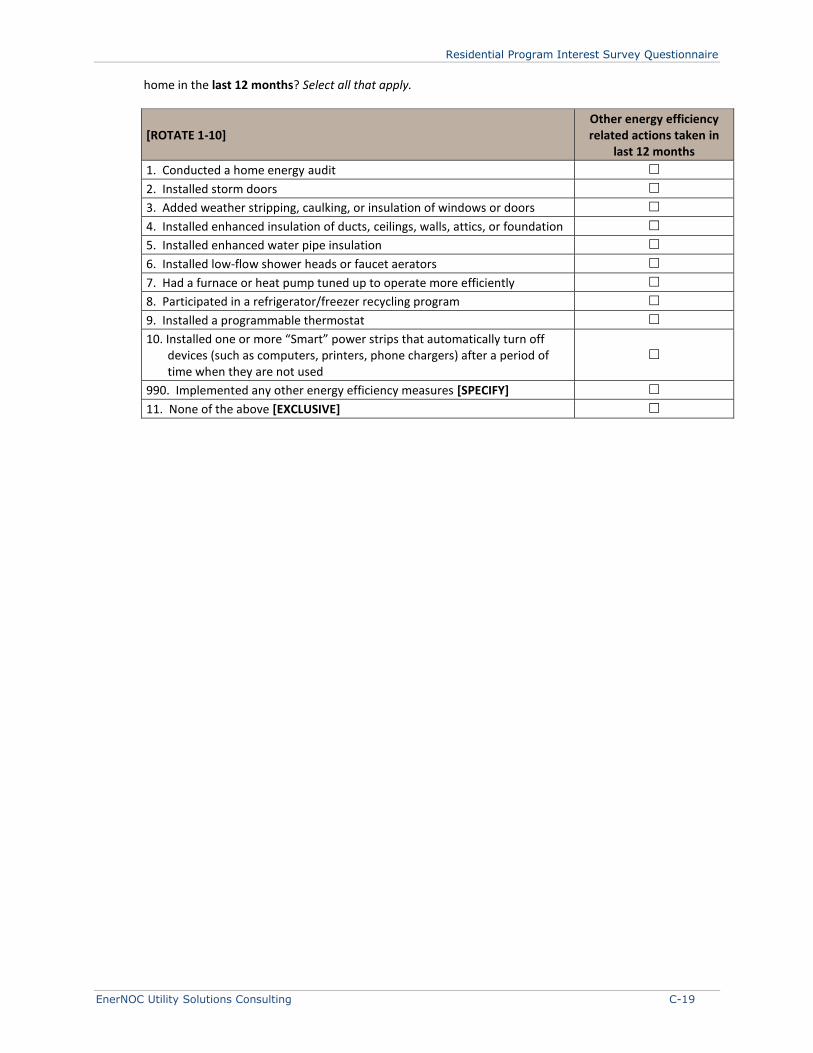
Residential Program Interest Survey Questionnaire
EnerNOC Utility Solutions Consulting C-19
home in the last 12 months? Select all that apply.
[ROTATE 1-10] Other energy efficiency related actions taken in
last 12 months
1. Conducted a home energy audit
2. Installed storm doors
3. Added weather stripping, caulking, or insulation of windows or doors
4. Installed enhanced insulation of ducts, ceilings, walls, attics, or foundation
5. Installed enhanced water pipe insulation
6. Installed low-flow shower heads or faucet aerators
7. Had a furnace or heat pump tuned up to operate more efficiently
8. Participated in a refrigerator/freezer recycling program
9. Installed a programmable thermostat
10. Installed one or more “Smart” power strips that automatically turn off devices (such as computers, printers, phone chargers) after a period of time when they are not used
990. Implemented any other energy efficiency measures [SPECIFY]
11. None of the above [EXCLUSIVE]
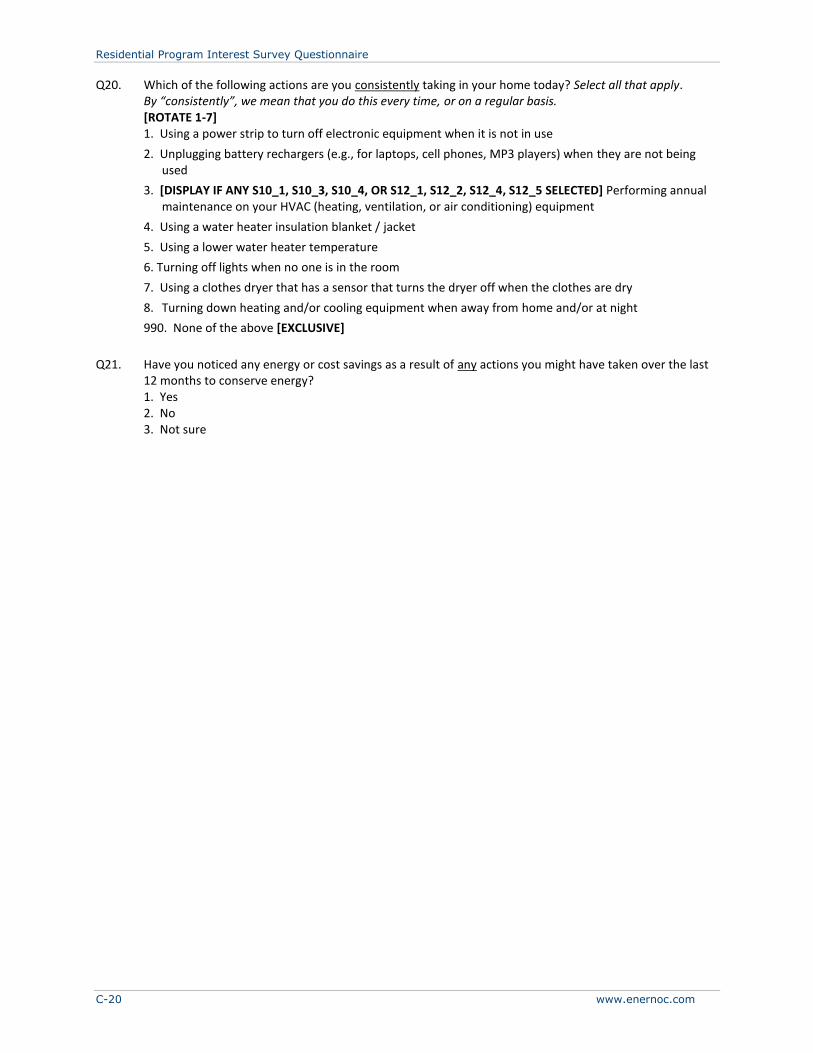
Residential Program Interest Survey Questionnaire
C-20 www.enernoc.com
Q20. Which of the following actions are you consistently taking in your home today? Select all that apply. By “consistently”, we mean that you do this every time, or on a regular basis. [ROTATE 1-7] 1. Using a power strip to turn off electronic equipment when it is not in use
2. Unplugging battery rechargers (e.g., for laptops, cell phones, MP3 players) when they are not being used
3. [DISPLAY IF ANY S10_1, S10_3, S10_4, OR S12_1, S12_2, S12_4, S12_5 SELECTED] Performing annual maintenance on your HVAC (heating, ventilation, or air conditioning) equipment
4. Using a water heater insulation blanket / jacket
5. Using a lower water heater temperature
6. Turning off lights when no one is in the room
7. Using a clothes dryer that has a sensor that turns the dryer off when the clothes are dry
8. Turning down heating and/or cooling equipment when away from home and/or at night
990. None of the above [EXCLUSIVE]
Q21. Have you noticed any energy or cost savings as a result of any actions you might have taken over the last
12 months to conserve energy? 1. Yes 2. No 3. Not sure
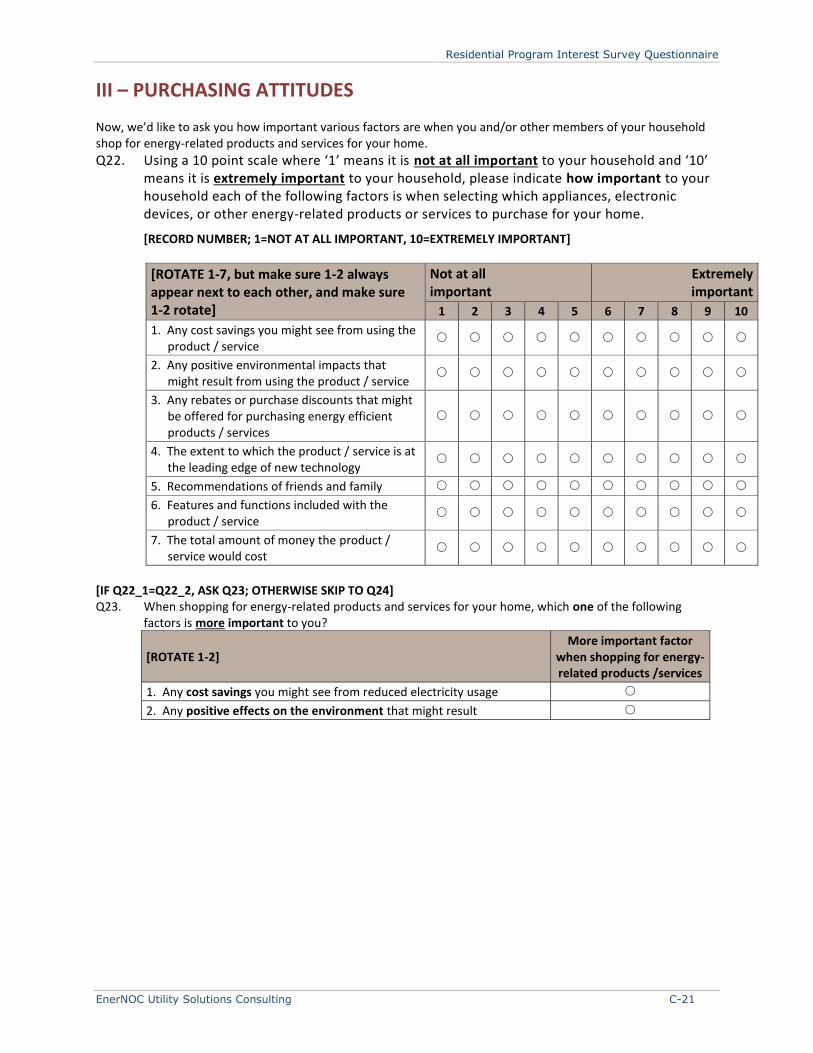
Residential Program Interest Survey Questionnaire
EnerNOC Utility Solutions Consulting C-21
III – PURCHASING ATTITUDES
Now, we’d like to ask you how important various factors are when you and/or other members of your household shop for energy-related products and services for your home.
Q22. Using a 10 point scale where ‘1’ means it is not at all important to your household and ‘10’ means it is extremely important to your household, please indicate how important to your household each of the following factors is when selecting which appliances, electronic devices, or other energy-related products or services to purchase for your home.
[RECORD NUMBER; 1=NOT AT ALL IMPORTANT, 10=EXTREMELY IMPORTANT]
[ROTATE 1-7, but make sure 1-2 always appear next to each other, and make sure 1-2 rotate]
Not at all important
Extremely important
1 2 3 4 5 6 7 8 9 10
1. Any cost savings you might see from using the product / service
2. Any positive environmental impacts that might result from using the product / service
3. Any rebates or purchase discounts that might be offered for purchasing energy efficient products / services
4. The extent to which the product / service is at the leading edge of new technology
5. Recommendations of friends and family
6. Features and functions included with the product / service
7. The total amount of money the product / service would cost
[IF Q22_1=Q22_2, ASK Q23; OTHERWISE SKIP TO Q24] Q23. When shopping for energy-related products and services for your home, which one of the following
factors is more important to you?
[ROTATE 1-2] More important factor
when shopping for energy-related products /services
1. Any cost savings you might see from reduced electricity usage
2. Any positive effects on the environment that might result
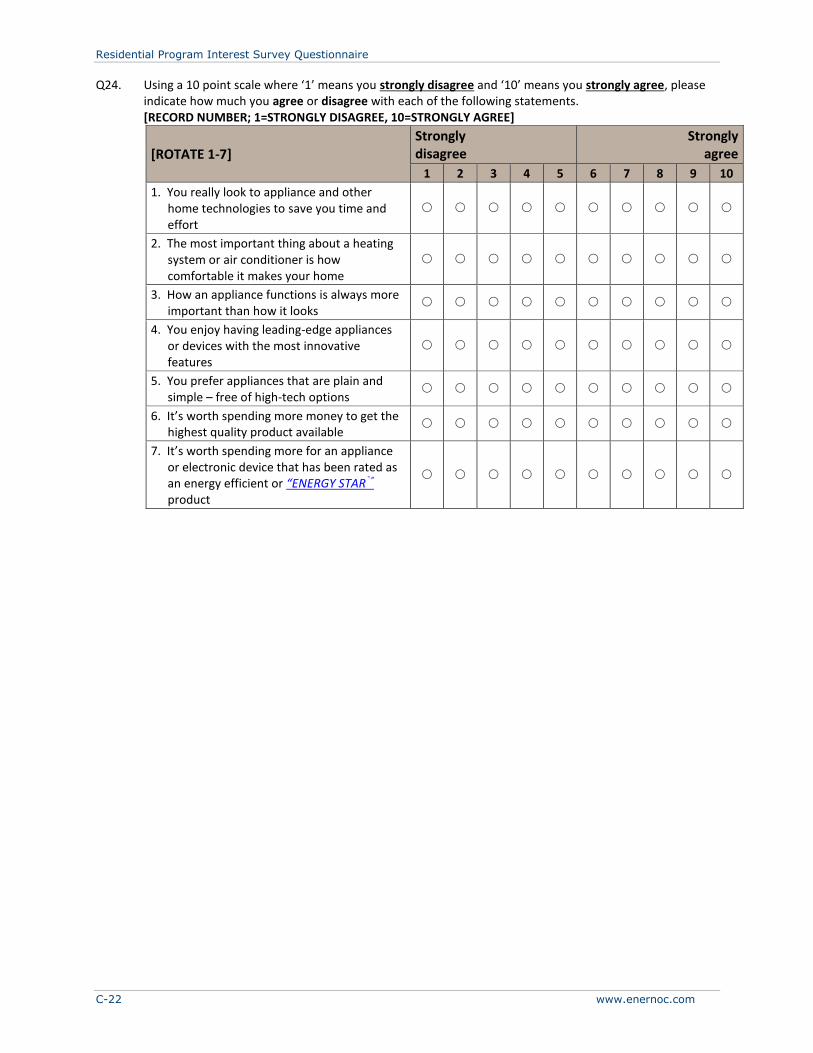
Residential Program Interest Survey Questionnaire
C-22 www.enernoc.com
Q24. Using a 10 point scale where ‘1’ means you strongly disagree and ‘10’ means you strongly agree, please indicate how much you agree or disagree with each of the following statements.
[RECORD NUMBER; 1=STRONGLY DISAGREE, 10=STRONGLY AGREE]
[ROTATE 1-7] Strongly disagree
Strongly agree
1 2 3 4 5 6 7 8 9 10
1. You really look to appliance and other home technologies to save you time and effort
2. The most important thing about a heating system or air conditioner is how comfortable it makes your home
3. How an appliance functions is always more important than how it looks
4. You enjoy having leading-edge appliances or devices with the most innovative features
5. You prefer appliances that are plain and simple – free of high-tech options
6. It’s worth spending more money to get the highest quality product available
7. It’s worth spending more for an appliance or electronic device that has been rated as an energy efficient or “ENERGY STAR®” product
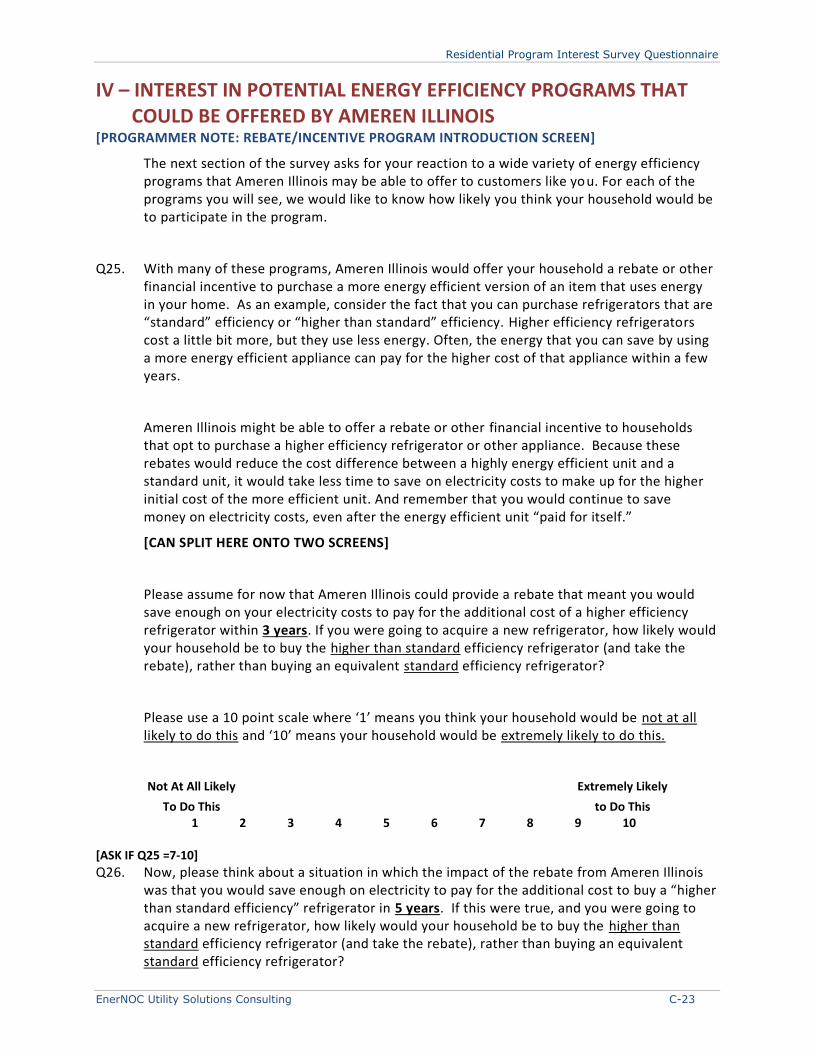
Residential Program Interest Survey Questionnaire
EnerNOC Utility Solutions Consulting C-23
IV – INTEREST IN POTENTIAL ENERGY EFFICIENCY PROGRAMS THAT COULD BE OFFERED BY AMEREN ILLINOIS
[PROGRAMMER NOTE: REBATE/INCENTIVE PROGRAM INTRODUCTION SCREEN]
The next section of the survey asks for your reaction to a wide variety of energy efficiency programs that Ameren Illinois may be able to offer to customers like you. For each of the programs you will see, we would like to know how likely you think your household would be to participate in the program.
Q25. With many of these programs, Ameren Illinois would offer your household a rebate or other financial incentive to purchase a more energy efficient version of an item that uses energy in your home. As an example, consider the fact that you can purchase refrigerators that are “standard” efficiency or “higher than standard” efficiency. Higher efficiency refrigerators cost a little bit more, but they use less energy. Often, the energy that you can save by using a more energy efficient appliance can pay for the higher cost of that appliance within a few years.
Ameren Illinois might be able to offer a rebate or other financial incentive to households that opt to purchase a higher efficiency refrigerator or other appliance. Because these rebates would reduce the cost difference between a highly energy efficient unit and a standard unit, it would take less time to save on electricity costs to make up for the higher initial cost of the more efficient unit. And remember that you would continue to save money on electricity costs, even after the energy efficient unit “paid for itself.”
[CAN SPLIT HERE ONTO TWO SCREENS]
Please assume for now that Ameren Illinois could provide a rebate that meant you would save enough on your electricity costs to pay for the additional cost of a higher efficiency refrigerator within 3 years. If you were going to acquire a new refrigerator, how likely would your household be to buy the higher than standard efficiency refrigerator (and take the rebate), rather than buying an equivalent standard efficiency refrigerator?
Please use a 10 point scale where ‘1’ means you think your household would be not at all likely to do this and ‘10’ means your household would be extremely likely to do this.
Not At All Likely Extremely Likely
To Do This to Do This 1 2 3 4 5 6 7 8 9 10
[ASK IF Q25 =7-10]
Q26. Now, please think about a situation in which the impact of the rebate from Ameren Illinois was that you would save enough on electricity to pay for the additional cost to buy a “higher than standard efficiency” refrigerator in 5 years. If this were true, and you were going to acquire a new refrigerator, how likely would your household be to buy the higher than standard efficiency refrigerator (and take the rebate), rather than buying an equivalent standard efficiency refrigerator?

Residential Program Interest Survey Questionnaire
C-24 www.enernoc.com
Not At All Likely Extremely Likely To Do This to Do This 1 2 3 4 5 6 7 8 9 10
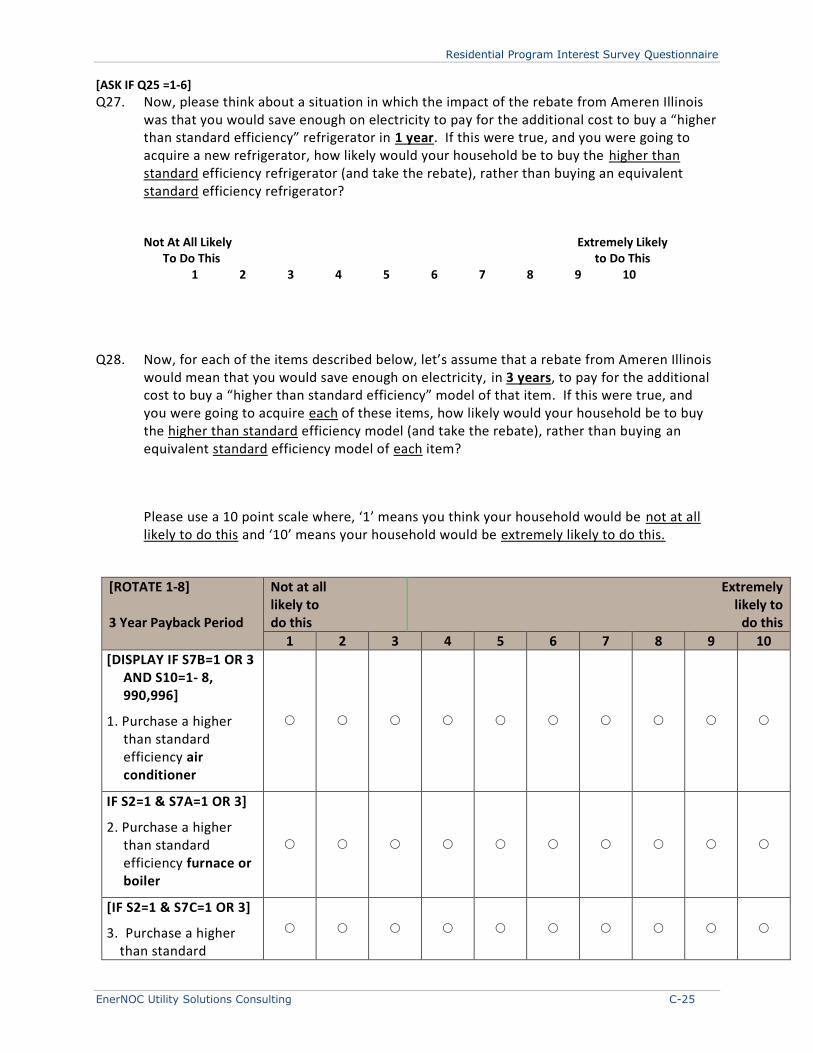
Residential Program Interest Survey Questionnaire
EnerNOC Utility Solutions Consulting C-25
[ASK IF Q25 =1-6]
Q27. Now, please think about a situation in which the impact of the rebate from Ameren Illinois was that you would save enough on electricity to pay for the additional cost to buy a “higher than standard efficiency” refrigerator in 1 year. If this were true, and you were going to acquire a new refrigerator, how likely would your household be to buy the higher than standard efficiency refrigerator (and take the rebate), rather than buying an equivalent standard efficiency refrigerator?
Not At All Likely Extremely Likely To Do This to Do This 1 2 3 4 5 6 7 8 9 10
Q28. Now, for each of the items described below, let’s assume that a rebate from Ameren Illinois would mean that you would save enough on electricity, in 3 years, to pay for the additional cost to buy a “higher than standard efficiency” model of that item. If this were true, and you were going to acquire each of these items, how likely would your household be to buy the higher than standard efficiency model (and take the rebate), rather than buying an equivalent standard efficiency model of each item?
Please use a 10 point scale where, ‘1’ means you think your household would be not at all likely to do this and ‘10’ means your household would be extremely likely to do this.
[ROTATE 1-8] 3 Year Payback Period
Not at all likely to do this
Extremely likely to
do this
1 2 3 4 5 6 7 8 9 10
[DISPLAY IF S7B=1 OR 3 AND S10=1- 8, 990,996]
1. Purchase a higher than standard efficiency air conditioner
IF S2=1 & S7A=1 OR 3]
2. Purchase a higher than standard efficiency furnace or boiler
[IF S2=1 & S7C=1 OR 3]
3. Purchase a higher than standard
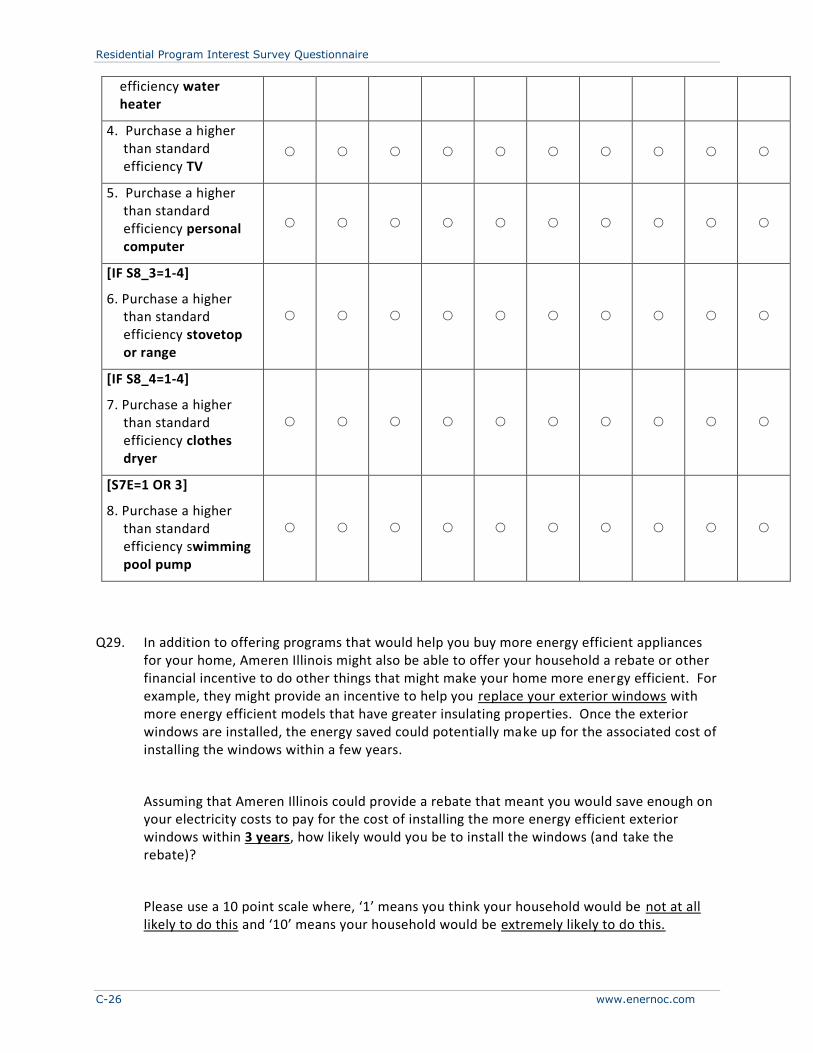
Residential Program Interest Survey Questionnaire
C-26 www.enernoc.com
efficiency water heater
4. Purchase a higher than standard efficiency TV
5. Purchase a higher than standard efficiency personal computer
[IF S8_3=1-4]
6. Purchase a higher than standard efficiency stovetop or range
[IF S8_4=1-4]
7. Purchase a higher than standard efficiency clothes dryer
[S7E=1 OR 3]
8. Purchase a higher than standard efficiency swimming pool pump
Q29. In addition to offering programs that would help you buy more energy efficient appliances for your home, Ameren Illinois might also be able to offer your household a rebate or other financial incentive to do other things that might make your home more energy efficient. For example, they might provide an incentive to help you replace your exterior windows with more energy efficient models that have greater insulating properties. Once the exterior windows are installed, the energy saved could potentially make up for the associated cost of installing the windows within a few years.
Assuming that Ameren Illinois could provide a rebate that meant you would save enough on your electricity costs to pay for the cost of installing the more energy efficient exterior windows within 3 years, how likely would you be to install the windows (and take the rebate)?
Please use a 10 point scale where, ‘1’ means you think your household would be not at all likely to do this and ‘10’ means your household would be extremely likely to do this.
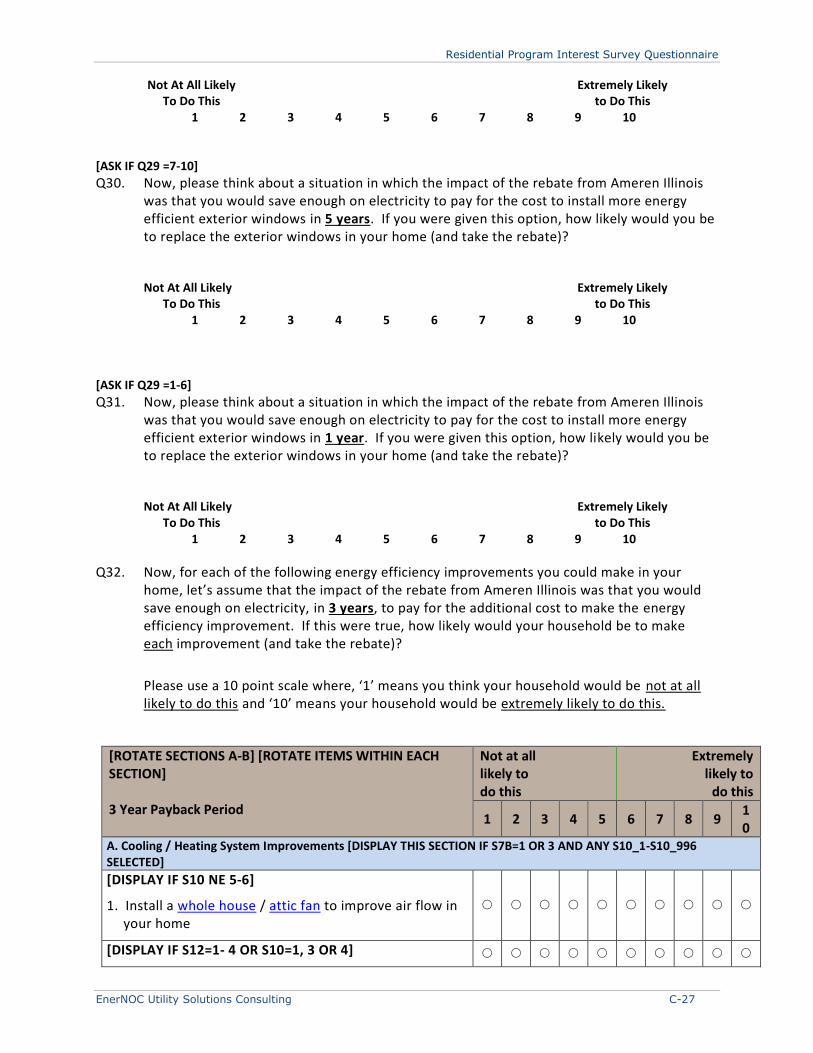
Residential Program Interest Survey Questionnaire
EnerNOC Utility Solutions Consulting C-27
Not At All Likely Extremely Likely To Do This to Do This 1 2 3 4 5 6 7 8 9 10
[ASK IF Q29 =7-10]
Q30. Now, please think about a situation in which the impact of the rebate from Ameren Illinois was that you would save enough on electricity to pay for the cost to install more energy efficient exterior windows in 5 years. If you were given this option, how likely would you be to replace the exterior windows in your home (and take the rebate)?
Not At All Likely Extremely Likely To Do This to Do This 1 2 3 4 5 6 7 8 9 10
[ASK IF Q29 =1-6]
Q31. Now, please think about a situation in which the impact of the rebate from Ameren Illinois was that you would save enough on electricity to pay for the cost to install more energy efficient exterior windows in 1 year. If you were given this option, how likely would you be to replace the exterior windows in your home (and take the rebate)?
Not At All Likely Extremely Likely To Do This to Do This 1 2 3 4 5 6 7 8 9 10
Q32. Now, for each of the following energy efficiency improvements you could make in your home, let’s assume that the impact of the rebate from Ameren Illinois was that you would save enough on electricity, in 3 years, to pay for the additional cost to make the energy efficiency improvement. If this were true, how likely would your household be to make each improvement (and take the rebate)?
Please use a 10 point scale where, ‘1’ means you think your household would be not at all likely to do this and ‘10’ means your household would be extremely likely to do this.
[ROTATE SECTIONS A-B] [ROTATE ITEMS WITHIN EACH SECTION] 3 Year Payback Period
Not at all likely to do this
Extremely likely to
do this
1 2 3 4 5 6 7 8 9 10
A. Cooling / Heating System Improvements [DISPLAY THIS SECTION IF S7B=1 OR 3 AND ANY S10_1-S10_996 SELECTED]
[DISPLAY IF S10 NE 5-6]
1. Install a whole house / attic fan to improve air flow in your home
[DISPLAY IF S12=1- 4 OR S10=1, 3 OR 4]
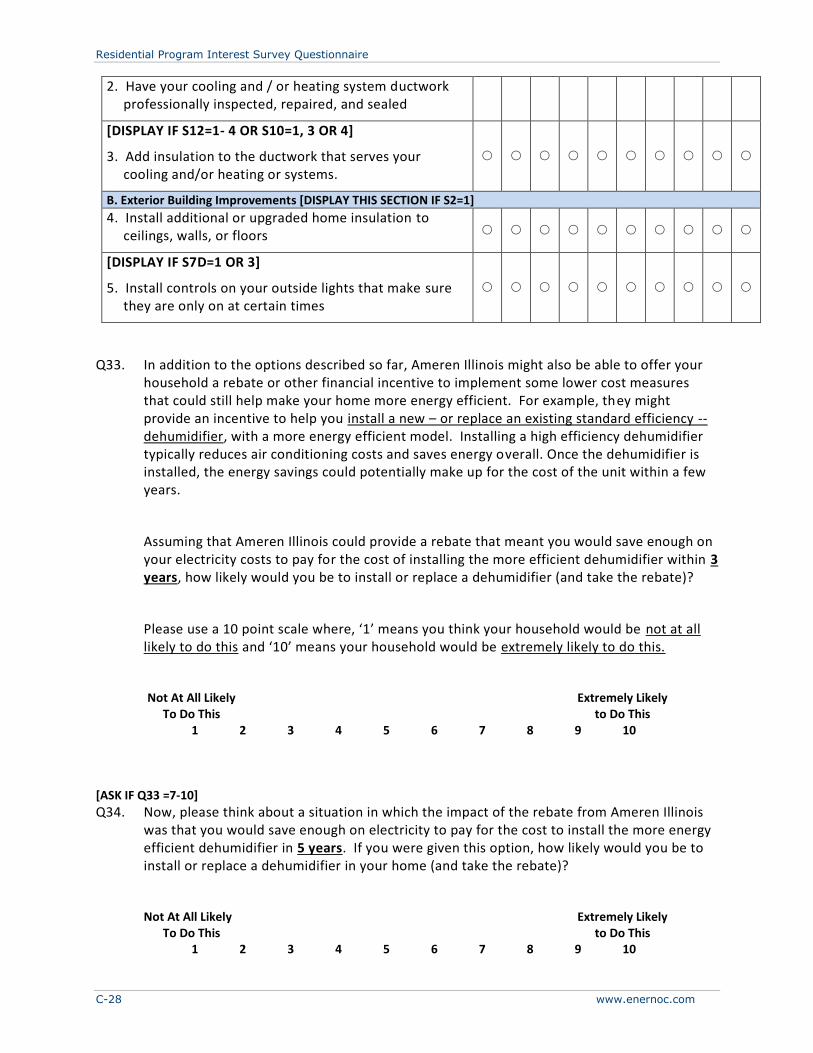
Residential Program Interest Survey Questionnaire
C-28 www.enernoc.com
2. Have your cooling and / or heating system ductwork professionally inspected, repaired, and sealed
[DISPLAY IF S12=1- 4 OR S10=1, 3 OR 4]
3. Add insulation to the ductwork that serves your cooling and/or heating or systems.
B. Exterior Building Improvements [DISPLAY THIS SECTION IF S2=1]
4. Install additional or upgraded home insulation to ceilings, walls, or floors
[DISPLAY IF S7D=1 OR 3]
5. Install controls on your outside lights that make sure they are only on at certain times
Q33. In addition to the options described so far, Ameren Illinois might also be able to offer your household a rebate or other financial incentive to implement some lower cost measures that could still help make your home more energy efficient. For example, they might provide an incentive to help you install a new – or replace an existing standard efficiency -- dehumidifier, with a more energy efficient model. Installing a high efficiency dehumidifier typically reduces air conditioning costs and saves energy overall. Once the dehumidifier is installed, the energy savings could potentially make up for the cost of the unit within a few years.
Assuming that Ameren Illinois could provide a rebate that meant you would save enough on your electricity costs to pay for the cost of installing the more efficient dehumidifier within 3 years, how likely would you be to install or replace a dehumidifier (and take the rebate)?
Please use a 10 point scale where, ‘1’ means you think your household would be not at all likely to do this and ‘10’ means your household would be extremely likely to do this.
Not At All Likely Extremely Likely To Do This to Do This 1 2 3 4 5 6 7 8 9 10
[ASK IF Q33 =7-10]
Q34. Now, please think about a situation in which the impact of the rebate from Ameren Illinois was that you would save enough on electricity to pay for the cost to install the more energy efficient dehumidifier in 5 years. If you were given this option, how likely would you be to install or replace a dehumidifier in your home (and take the rebate)?
Not At All Likely Extremely Likely To Do This to Do This 1 2 3 4 5 6 7 8 9 10
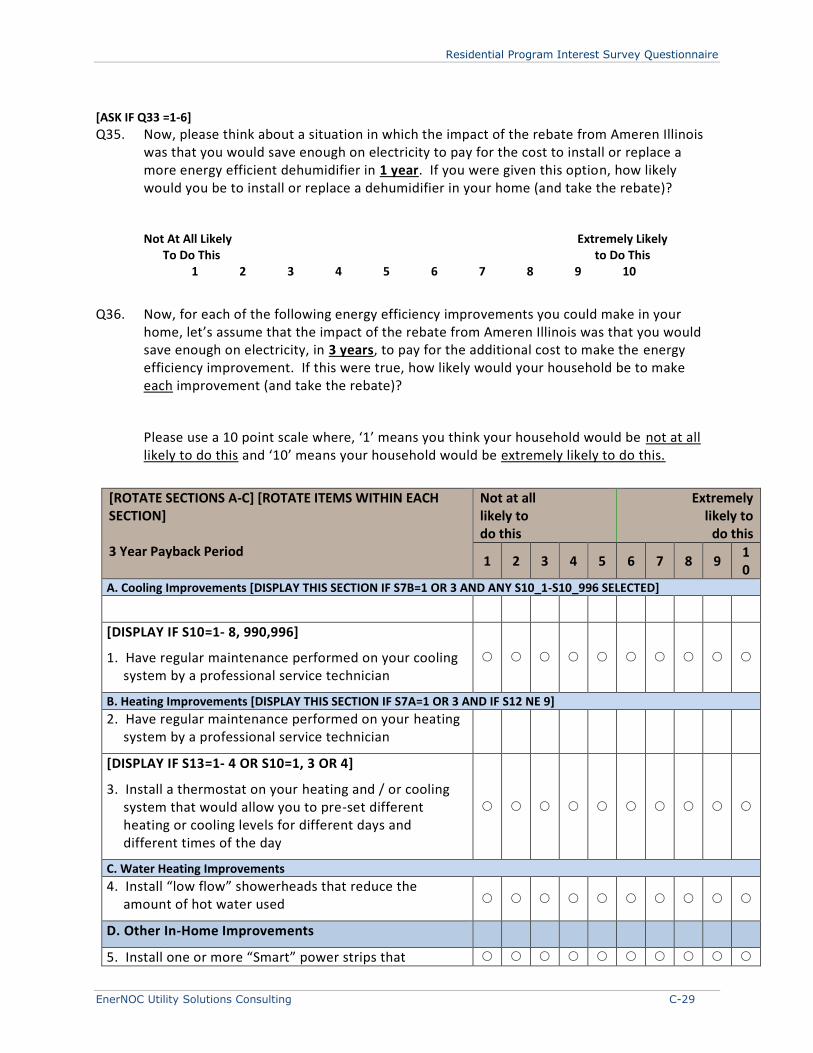
Residential Program Interest Survey Questionnaire
EnerNOC Utility Solutions Consulting C-29
[ASK IF Q33 =1-6]
Q35. Now, please think about a situation in which the impact of the rebate from Ameren Illinois was that you would save enough on electricity to pay for the cost to install or replace a more energy efficient dehumidifier in 1 year. If you were given this option, how likely would you be to install or replace a dehumidifier in your home (and take the rebate)?
Not At All Likely Extremely Likely To Do This to Do This 1 2 3 4 5 6 7 8 9 10
Q36. Now, for each of the following energy efficiency improvements you could make in your home, let’s assume that the impact of the rebate from Ameren Illinois was that you would save enough on electricity, in 3 years, to pay for the additional cost to make the energy efficiency improvement. If this were true, how likely would your household be to make each improvement (and take the rebate)?
Please use a 10 point scale where, ‘1’ means you think your household would be not at all likely to do this and ‘10’ means your household would be extremely likely to do this.
[ROTATE SECTIONS A-C] [ROTATE ITEMS WITHIN EACH SECTION] 3 Year Payback Period
Not at all likely to do this
Extremely likely to
do this
1 2 3 4 5 6 7 8 9 10
A. Cooling Improvements [DISPLAY THIS SECTION IF S7B=1 OR 3 AND ANY S10_1-S10_996 SELECTED]
[DISPLAY IF S10=1- 8, 990,996]
1. Have regular maintenance performed on your cooling system by a professional service technician
B. Heating Improvements [DISPLAY THIS SECTION IF S7A=1 OR 3 AND IF S12 NE 9]
2. Have regular maintenance performed on your heating system by a professional service technician
[DISPLAY IF S13=1- 4 OR S10=1, 3 OR 4]
3. Install a thermostat on your heating and / or cooling system that would allow you to pre-set different heating or cooling levels for different days and different times of the day
C. Water Heating Improvements
4. Install “low flow” showerheads that reduce the amount of hot water used
D. Other In-Home Improvements
5. Install one or more “Smart” power strips that
Residential Program Interest Survey Questionnaire
C-30 www.enernoc.com
automatically turn off devices (such as computers, printers, or phone chargers) after a period of time when they are not used
Residential Program Interest Survey Questionnaire
EnerNOC Utility Solutions Consulting C-31
Q37. So, finally in terms of new energy efficiency options that Ameren Illinois might also be able to offer your household is a rebate to install new light bulbs that are more energy efficient than traditional incandescent bulbs. Light bulbs such as compact fluorescent light bulbs (CFLs) or LED (light emitting diode) bulbs fit into this category. Installing these higher efficiency bulbs saves energy, and could potentially make up for the higher cost of the bulb within a few years.
Assuming that Ameren Illinois could provide a rebate that meant you would save enough on your electricity costs to pay for the cost of installing the more efficient bulbs within 3 years, how likely would you be to install one or more of the bulbs (and take the rebate)?
Please use a 10 point scale where, ‘1’ means you think your household would be not at all likely to do this and ‘10’ means your household would be extremely likely to do this.
Not At All Likely Extremely Likely To Do This to Do This 1 2 3 4 5 6 7 8 9 10
[ASK IF Q37 =7-10]
Q38. Now, please think about a situation in which the impact of the rebate from Ameren Illinois was that you would save enough on electricity to pay for the cost to install the more energy efficient light bulbs in 5 years. If you were given this option, how likely would you be to install one or more of these bulbs in your home (and take the rebate)?
Not At All Likely Extremely Likely To Do This to Do This 1 2 3 4 5 6 7 8 9 10
[ASK IF Q37 =1-6]
Q39. Now, please think about a situation in which the impact of the rebate from Ameren Illinois was that you would save enough on electricity to pay for the cost to install the more energy efficient light bulbs in 1 year. If you were given this option, how likely would you be to install one or more of these bulbs in your home (and take the rebate)?
Not At All Likely Extremely Likely To Do This to Do This 1 2 3 4 5 6 7 8 9 10
Residential Program Interest Survey Questionnaire
C-32 www.enernoc.com
Q40. Now, please consider the following list of actions you can take to make your home more energy efficient, which don’t have any up-front costs, but may require some tradeoffs in terms of a small amount of comfort or convenience.
Using a 10 point scale where, ‘1’ means you think your household would be not at all likely to do this and ‘10’ means your household would be extremely likely to do this, please indicate how likely you would be to take any of these energy saving actions.
[ROTATE 1-2]
Not at all likely to do this
Extremely likely to
do this
1 2 3 4 5 6 7 8 9 10
1. Reduce the temperature of the hot water that your water heater delivers
2. Turn down the heating or cooling while sleeping or away from home
3. Get rid of a secondary refrigerator that you may only use sometimes and might be in a garage or basement
Residential Program Interest Survey Questionnaire
EnerNOC Utility Solutions Consulting C-33
V – PURCHASING ATTITUDES / BEHAVIOR & ENVIRONMENTAL ATTITUDES
Q41. Now we’d like to understand how your household shops for products and services for your home. Using a 10-point scale where ‘1’ means you strongly disagree, and ‘10’ means you strongly agree, please indicate how much you agree or disagree with each of the following statements.
[RECORD NUMBER; 1=STRONGLY DISAGREE, 10=STRONGLY AGREE]
[ROTATE 1-6]
Strongly disagree
Strongly agree
1 2 3 4 5 6 7 8 9 10
1. You carefully research product features and reviews to select the best product
2. You usually don’t buy things unless they’re on sale, or you have a coupon or discount
3. Someone in your household does a lot of do-it-yourself / home-improvement projects
4. You usually take the time to shop and explore all of your options before you make a final purchase decisions
5. You prefer to shop and make purchases in a store, rather than on the Internet
6. To be honest, the environmental impact of your day-to-day purchases is not something you spend a lot of time worrying about

Residential Program Interest Survey Questionnaire
C-34 www.enernoc.com
VII – ADDITIONAL HOUSEHOLD CHARACTERISTICS / DEMOGRAPHICS
In order to help us classify your responses, the last few questions are on your household’s characteristics. D1. Including yourself, how many individuals normally live in your home?
Please do not include anyone who is just visiting, or not currently living with you due to their enrollment in college and/or military service."
[RECORD NUMBER 1-20] individuals D2. Are there any individuals in your home that regularly stay at home all or most weekdays?
1. Yes 0. No
D3. Which of the following best describes your home?
1. Single-family house detached from any other houses
2. Single-family house attached to one or more houses
3. Multi-family house or building with 2-4 apartments/units
4. Multi-family house or building with 5 or more apartments/units
5. Mobile/manufactured home
990. Other [SPECIFY]
D4. For about how many years have you lived in your present home?
Your best estimate is fine, but please enter a whole number rather than a range of numbers. 1. Less than 1 year 2. [RECORD NUMBER 1-100] years D5. Is this home your primary place of residence or is it a seasonal/vacation home that is only occupied for
part of the year? 1. Primary residence
2. Seasonal / vacation home
990. Other [SPECIFY]
[ASK IF D5=2] D6. How many months out of the year do you or any other members of your household typically occupy this
home? Your best estimate is fine, but please enter a whole number rather than a range of numbers.
[RECORD NUMBER 0-12] months D7. What is the approximate square footage of your home? Please include only heated living space in your
response. If you are not certain, please give your best estimate. 1. Less than 500 sq. ft.
2. 500 – 999
3. 1,000 – 1,499
4. 1,500 – 1,999
5. 2,000 – 2,499
6. 2,500 – 2,999
7. 3,000 – 3,499
8. 3,500 – 3,999
9. 4,000 sq. ft. or more
D8. How many bedrooms are in your home?
Residential Program Interest Survey Questionnaire
EnerNOC Utility Solutions Consulting C-35
0. 0 / Studio/Efficiency apartment / SRO
1. 1
2. 2
3. 3
4. 4
5. 5
6. 6 or more
D9. Which of the following best characterizes the city / town / community in which you live?
1. Urban
2. Suburban
3. Rural
D10. What is your gender? 1. Male 2. Female
Residential Program Interest Survey Questionnaire
C-36 www.enernoc.com
D11. What is the highest level of education you have completed?
1. Less than a high school degree
2. High school degree
3. Technical/trade school program
4. Associates degree or some college
5. Bachelors degree
6. Graduate / professional degree, e.g., J.D., MBA, MD, etc.
7. Professional certification, e.g., CPA, CNP, etc.
D12. What is your current employment status?
1. Employed full-time
2. Employed part-time
3. Not currently employed
4. Retired
990. Other [SPECIFY]
D13. Which of the following categories includes your household’s total annual income before taxes in 2008? Please include the income of all people living in your home in this figure.
1. Less than $60,000
2. $60,000 or more
D14. Which of the following categories includes your household’s total annual income before taxes in 2008? Please include the income of all people living in your home in this figure.
[IF D13=1, DISPLAY OPTIONS 1-7 AND 13; IF D13=2, DISPLAY OPTIONS 8-13]
1. Less than $10,000
2. $10,000 – $14,999
3. $15,000 – $19,999
4. $20,000 – $29,999
5. $30,000 – $39,999
6. $40,000 –$49,999
7. $50,000 – $59,999
8. $60,000 – $74,999
9. $75,000 – $99,999
10. $100,000 – $124,999
11. $125,000 – $149,999
12. $150,000 or more
13. Prefer not to say

Residential Program Interest Survey Questionnaire
EnerNOC Utility Solutions Consulting C-37
D15. When thinking about your household’s current financial situation compared to what it was a year ago, would you say that overall your current financial situation is…?
1. Better than it was a year ago
2. The same as it was a year ago
3. Worse than it was a year ago
4. Prefer not to say
D16. When thinking about your household’s current financial situation compared to what you anticipate it will be in a year from now, would you say that overall your anticipated financial situation in a year from now will be…?
1. Better than your current financial situation
2. The same as your current financial situation
3. Worse than your current financial situation
4. Prefer not to say
D17. Which of the following best describes your race or ethnic background?
1. White, Caucasian
2. Black, African American, Caribbean American
3. American Indian (Native American), Alaska Native
4. Asian
6. Hispanic, Latino
5. Native Hawaiian, Pacific Islander
990. Other [SPECIFY]
7. Prefer not to say
Residential Program Interest Survey Questionnaire
C-38 www.enernoc.com
VIII - CONCLUSION
[INCENTIVE NAME/ADDRESS COLLECTION SCREEN] Those are all the questions we have for you today. Thanks for your participation!
Please click ‘Continue’ to proceed to the payment screen.
C0. Please indicate which of the following you would prefer: 1. Please email me a $10 Amazon Gift Card 2. I would prefer to have a $10 check mailed to me 3. I would like to decline and not receive an incentive [IF C0=1, ASK C1; IF C0=2, ASK C2; IF C0=3, ASK C0A]
COA. You have indicated that you do NOT want to receive your $10 payment. Is that correct?
1. Yes 2. No
[IF YES, GO TO THANK YOU SCREEN; IF NO, RE-ASK C0] C1. So that we may mail your incentive to you, please provide your name and address below.
A. Full name
C. Mailing Address Line #1
D. Mailing Address Line #2 (optional)
E. City
F. State
G. ZIP Code
C1. So that we may email your incentive to you, please provide your email address below.
[RECORD EMAIL ADDRESS –VALIDATE FOR FORMAT] [INCENTIVE NAME/ADDRESS VERIFICATION SCREEN] Please review the information you provided and verify that it is complete and correct:
[DISPLAY ALL NAME AND ADDRESS OR EMAIL INFORMATION COLLECTED] If you would like to edit any of this information, please click the “Back” button to go to the previous screen, where you can make any needed changes. Otherwise, please click “Continue” to submit your information. [PROGRAMMER: INCLUDE BACK BUTTON FOR THIS SCREEN DURING LIVE VERSION]
Residential Program Interest Survey Questionnaire
EnerNOC Utility Solutions Consulting C-39
[IF CHOOSE TO RECEIVE AN INCENTIVE, DISPLAY:] You have successfully submitted the information we need so we can send you your $10 thank you gift. Your check or gift card will be issued within 4-6 weeks to the address or email address you provided. Thank you and have a nice day! If you would like information on how your household can save money on energy bills, please visit Ameren Illinois at
www.actonenergy.com
[IF CHOOSE NOT TO RECEIVE AN INCENTIVE, DISPLAY:] Thank you for taking the time to answer our survey questions. Have a nice day! If you would like information on how your household can save money on energy bills, please visit Ameren Illinois at
www.actonenergy.com
SURVEY CLOSED MESSAGE – only display for terms or survey closed…do NOT display if respondent finishes survey.
We truly appreciate your time and effort in responding to the survey invitation you received, but the survey sponsored by Ameren Illinois is now closed. In order to achieve a representative sample for this survey, quotas with specific criteria needed to be designated. Because these quotas have now been filled, we are not accepting any more responses. If you would like information on how your home can save money on your energy bills, please visit Ameren Illinois at
www.actonenergy.com
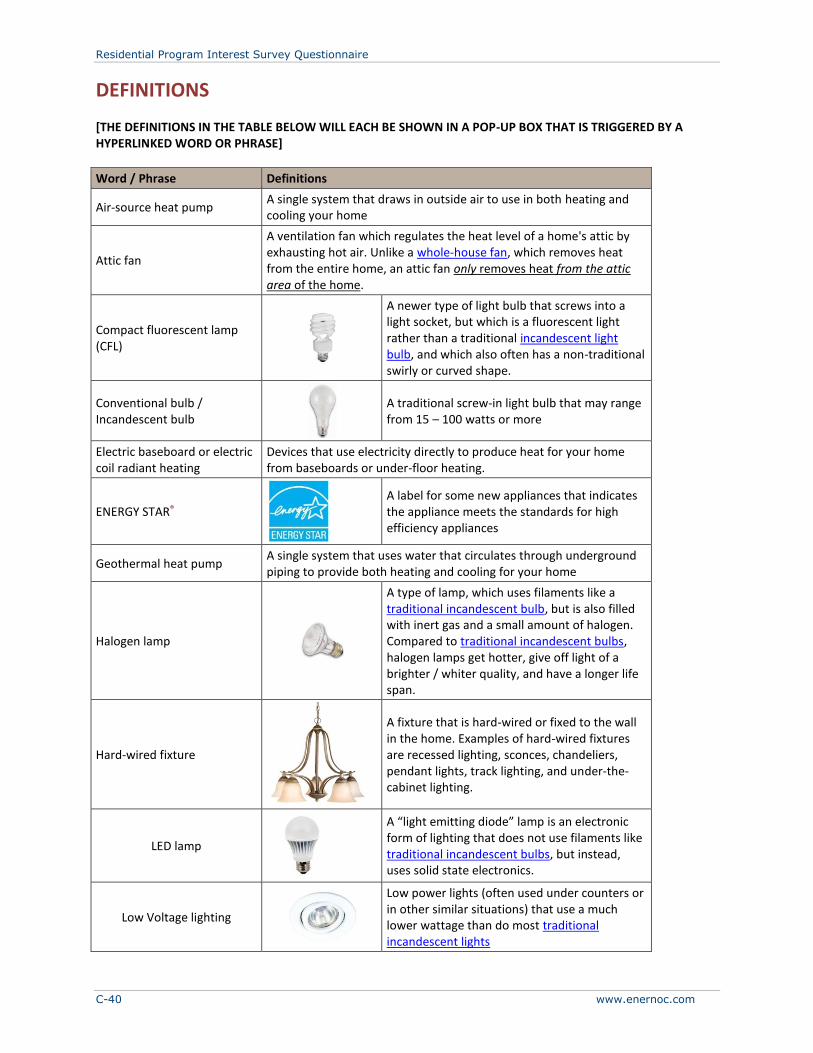
Residential Program Interest Survey Questionnaire
C-40 www.enernoc.com
DEFINITIONS
[THE DEFINITIONS IN THE TABLE BELOW WILL EACH BE SHOWN IN A POP-UP BOX THAT IS TRIGGERED BY A HYPERLINKED WORD OR PHRASE]
Word / Phrase Definitions
Air-source heat pump A single system that draws in outside air to use in both heating and cooling your home
Attic fan
A ventilation fan which regulates the heat level of a home's attic by exhausting hot air. Unlike a whole-house fan, which removes heat from the entire home, an attic fan only removes heat from the attic area of the home.
Compact fluorescent lamp (CFL)
A newer type of light bulb that screws into a light socket, but which is a fluorescent light rather than a traditional incandescent light bulb, and which also often has a non-traditional swirly or curved shape.
Conventional bulb / Incandescent bulb
A traditional screw-in light bulb that may range from 15 – 100 watts or more
Electric baseboard or electric coil radiant heating
Devices that use electricity directly to produce heat for your home from baseboards or under-floor heating.
ENERGY STAR®
A label for some new appliances that indicates the appliance meets the standards for high efficiency appliances
Geothermal heat pump A single system that uses water that circulates through underground piping to provide both heating and cooling for your home
Halogen lamp
A type of lamp, which uses filaments like a traditional incandescent bulb, but is also filled with inert gas and a small amount of halogen. Compared to traditional incandescent bulbs, halogen lamps get hotter, give off light of a brighter / whiter quality, and have a longer life span.
Hard-wired fixture
A fixture that is hard-wired or fixed to the wall in the home. Examples of hard-wired fixtures are recessed lighting, sconces, chandeliers, pendant lights, track lighting, and under-the-cabinet lighting.
LED lamp
A “light emitting diode” lamp is an electronic form of lighting that does not use filaments like traditional incandescent bulbs, but instead, uses solid state electronics.
Low Voltage lighting
Low power lights (often used under counters or in other similar situations) that use a much lower wattage than do most traditional incandescent lights
Residential Program Interest Survey Questionnaire
EnerNOC Utility Solutions Consulting C-41
Plug-in fixture
A fixture that is portable or free-standing with a cord that plugs into an outlet. Examples of plug-in fixtures are table lamps, or task lighting.
CFL-specific fixture
A fixture that has a CFL-ballast located inside, which is larger and lasts longer than integrated CFLs (CFLs with a screw-in mechanism so that they can replace incandescent bulbs). CFL-specific fixtures use replaceable bulbs that have a starter in the base of the bulb.
Tubular fluorescent lamp
Traditional fluorescent lights are generally tubes of 3 or more feet in length and are installed in special fixtures made specifically for these tubes
Wall furnace A furnace that works “through the wall,” meaning that it is a box that draws air directly from the outside and then warms it before sending the resulting warm air into a room.
Whole-house fan
A ventilation fan mounted in the ceiling of a central part of a home that removes heat from the entire home. It does this by first drawing that heat from the living areas of the home into the home’s attic, and then pushing the heat trapped in the attic to the outside through vents. Unlike an attic fan, which only removes heat from a home’s attic, a whole-house fan removes heat from the entire home.

EnerNOC Utility Solutions Consulting D-1
APPENDIX D
RESIDENTIAL SATURATION SURVEY QUESTIONNAIRE
Ameren Illinois DSM Market Potential – Saturation Questionnaire RESIDENTIAL
QUALIFYING CRITERIA AND QUOTAS
Qualifying Criteria
• The respondent must have primary or shared responsibility for making energy-related decisions
• The respondent must be at least 18 years old
• The respondent must be billed for electricity or natural gas directly by Ameren Illinois
PRELOAD ALL SAMPLE FIELDS. Hard Quotas Total: n=700 Soft Quotas SEE QUOTA GRID: STRATUM_ID – we will track and enforce only if we need to Age (S2) FOR ENTIRE SURVEY, [ADDRESS]=THE FOLLOWING SAMPLE FIELDS:
CLEAN_ADDRESS1
CLEAN_ADDRESS2
Residential Saturation Survey Questionnaire
D-2 www.enernoc.com
RESPONDENT IDENTIFICATION / VERIFICATION
Welcome. This survey is sponsored by Ameren Illinois.
[PROGRAMMER: INCLUDE AMEREN ILLINOIS LOGO]
Survey results will be collected and summarized by Definitive Insights, a market research company.
Please enter the 5-digit “Survey ID#” that appears on the survey invitation postcard you received. This ID# should be located just above the mailing address on the front side of your postcard.
Survey ID# : ________________
[PROGRAMMER: VERIFY VALID CODE AND READ IN ALL VARIABLES FROM SAMPLE FILE] We at Ameren Illinois and Definitive Insights value your privacy. We will use the information you provide for research purposes only and will NOT share it with third parties for marketing purposes. Information you provide will be stored in a secure database. If you have questions about our privacy practices or would like to get any other information about this study, please contact us via one of the following methods:
e-mail: [email protected]
phone: 1- 855-888-9270
postal mail: Definitive Insights ATTN: Ameren Illinois Project Director 601 SW Oak Street Portland, Oregon 97205

Residential Saturation Survey Questionnaire
EnerNOC Utility Solutions Consulting D-3
INTRODUCTION
Thank you for taking the time to see if you and your household qualify to participate in a new research study about energy. The study is sponsored by Ameren Illinois, and it has a very important purpose. Ameren Illinois is delivering programs to help its customers use energy more efficiently. Your answers to this survey will help the company to improve these programs so that they work best for everyone.
Your household is one of a small number being asked to respond to the survey. To show our appreciation for your time and effort in completing the survey, you will have the option of choosing a $10 Amazon Electronic Gift Card or a $10 check at the end of the survey if you complete all of the questions. (You may decline to receive payment if desired.) If you need to pause the survey at any time, you can come back later and begin again where you left off. Simply save the URL and the Survey ID# from your survey invitation to access your survey again. The survey will automatically take you to the point where you left off. Please note: any word or phrase that appears in blue, underlined font will have a hyperlinked definition that pops-up in a separate browser window when you click on that word or phrase. Clicking on any of these hyperlinks will NOT make you navigate away from the survey site. Please click “CONTINUE” to begin.
Residential Saturation Survey Questionnaire
D-4 www.enernoc.com
RESPONDENT SCREENING A1. Our records indicate that your address is: [ADDRESS] Is this correct?
3. Yes 4. No
[IF A1=2, TERMINATE AND READ A1 TERMINATE TEXT; OTHERWISE, GO TO S1.]
[A1 TERMINATE TEXT:] We truly appreciate your time and effort in responding to our survey, but our questions are related to a specific address. If you would like information on how your home can save money on your energy bills, please visit us at www.actonenergy.com.
Thank you. Have a nice day! [DO NOT SHOW STANDARD THANK YOU SCREEN.]
S1. What is your role in making energy-related decisions about things such as: adjusting your home’s thermostat, choosing to install insulation, selecting new appliances, large electronic devices, and light bulbs that are used in your home?
Any reference to “your home,” here and throughout the rest of this survey, refers specifically to the residence at [ADDRESS].
1. You are primarily responsible for some or all of these decisions 2. Someone else in your household is primarily responsible for these types of decisions [REQUEST
REFERRAL TO DECISION MAKER AND THEN TERMINATE VIA R1] 3. You share responsibility for these decisions with others in your household, or with a landlord or
property manager 4. Don’t know [REQUEST REFERRAL TO DECISION MAKER AND THEN TERMINATE VIA R1]
[IF S1=1 OR 3, ASK S2; OTHERWISE SHOW R1 AND TERMINATE WITHOUT SHOWING STANDARD TERMINATE
LANGUAGE] [R1 TERMINATE TEXT – NOT A DECISION MAKER] R1. Thank you for taking the time to see if you are eligible to participate in this survey. At this time we need
responses from someone in your household who has specific knowledge about the way your household makes decisions about energy-related issues. We would appreciate it if you would provide that person with the invitation postcard you received or refer them to the following link so that they may complete this survey with the following ID:
Link: [URL] http://tiny.cc./ameren2
Residential Saturation Survey Questionnaire
EnerNOC Utility Solutions Consulting D-5
[PROGRAMMER NOTE: IF A RESPONDENT TERMINATES VIA S2, DELETE DATA COLLECTED AND RESET SURVEY REENTRY POSITION FOR THAT SURVEY ID# BACK TO THE BEGINNING OF THE SURVEY. RECORD THE DATA DELETED FOR THAT SURVEY ID# ELSEWHERE SO WE CAN TRACK THE NUMBER OF TIMES AND REASONS RESPONDENTS DISQUALIFY AT S2 AS WELL AS THE NUMBER OF TIMES THESE PREVIOUSLY USED SURVEY ID#’S ARE REUSED. FOR ALL RESPONDENTS THAT DO NOT TERMINATE VIA S5R, DO NOT ALLOW SURVEY ID# TO BE USED AGAIN.] {NOTE: THIS WILL ALLOW A RESPONDENT WHO DOES NOT PERSONALLY QUALIFY TO FORWARD THEIR SURVEY ID# TO A CO-WORKER WHO MAY BE BETTER QUALIFIED TO ANSWER THE SURVEY.}
[NEW PROGRAMMER NOTE 7/16 –FOR ALL TERMINATES BEYOND THIS POINT, USE THE GENERAL TERMINATE TEXT ON PG 6]
S2. Which of the following categories represents your current age?
1. Less than 18 years old [TERMINATE AFTER S7] 2. 18-24 3. 25-34 4. 35-44 5. 45-54 6. 55-64 7. 65 or more years old
[IF S2=2-7, ASK S3; OTHERWISE ASK S3 BUT FLAG AS TERMINATE AND END SCREENER AFTER S7] S3. Do you, or does anyone else in your household work for a gas or electric utility company?
1. Yes [TERMINATE AFTER S7] 2. No
[ASK ALL] S4. Do you own or rent your home? 1. Own (or in the process of buying it) 2. Rent / lease [PROGRAMMER NOTE: QS5 AND QS6 SHOULD BE PROGRAMMED EXACTLY LIKE S5 & S6 IN THE RES PROG
INTEREST SURVEY] S5. How is your household billed for the electricity you use?
1. My household is billed directly by Ameren Illinois [CONTINUE TO S6]
2. My household is NOT billed directly by Ameren Illinois; the cost for our electricity is included in our rent, or is paid by someone else [ASK S6 – IF S6 NOT=1, ASK S7 AND TERMINATE]
3. My household’s electricity is provided by another utility; not Ameren Illinois [ASK S6 – IF S6 NOT=1, TERMINATE AFTER S7]
4. Don’t know [ASK S6, BUT TERMINATE AFTER S7, REGARDLESS OF S6 RESPONSE]
Residential Saturation Survey Questionnaire
D-6 www.enernoc.com
S6. How is your household billed for the natural gas you use? 1. My household is billed directly by Ameren Illinois [IF S5 NOT=4, CONTINUE]
2. My household is NOT billed directly by Ameren Illinois; the cost for our natural gas is included in our rent, or is paid by someone else [IF S5=1, ASK S7 & DO NOT TERMINATE; OTHERWISE, ASK S7 AND TERMINATE]
3. My household’s natural gas is provided by another utility; not Ameren Illinois [IF S5=1, ASK S7, S8 AND S9; IF S5 NOT=1, ASK S9 AND TERMINATE]
4. Don’t know [TERMINATE AFTER S7]
S7. Which of the following things are included in a gas or electric bill that you pay directly, as opposed to
things that might be paid for by a landlord, a property management company, or someone else? Please select all that apply.
Things for which you pay directly
1. Heating all or some of the space in your house / unit 2. Air conditioning 3. Water heating 4. Lights on the outside of your home or building 5. None of the above – I am not billed directly for any of these things in my gas or electric bill
[EXCLUSIVE]
[IF S2=1 OR S3=2, TERMINATE HERE, BUT TERM LABEL SHOULD BE FOR THE ACTUAL TERMINATION REASON…NOT THE LAST QUESTION VIEWED)
[QUOTA CHECK – IF OVER-QUOTA, TERMINATE AND SHOW TERMINATE LANGUAGE BELOW; OTHERWISE GO TO INVITATION LANGUAGE]
GENERAL TERMINATE LANGUAGE ONLY FOR NON-QUALIFYING AFTER QS1.0 OR OVER-QUOTA RESPONDENTS
We truly appreciate your time and effort in responding to our survey invitation and answering these initial questions, which were designed to see if you are eligible to participate. In order to achieve a representative sample, quotas with specific criteria have been designated. At this point, we have reached the number of respondents we can accept from individuals with your type of experience or background. Again, we would like to thank you for your time and effort.
If you would like information on how your home can save money on your energy bills, please visit us at www.actonenergy.com.
Thank you. Have a nice day!

Residential Saturation Survey Questionnaire
EnerNOC Utility Solutions Consulting D-7
INVITATION LANGUAGE FOR QUALIFYING RESPONDENTS
Thank you for your responses so far! You qualify for the survey. As we indicated earlier, only a limited number of individuals will be able to complete this survey, so we appreciate your time in filling out the survey as completely as possible. The survey should take about 20 minutes to complete. Once you complete the survey you will be eligible to receive our $10 Visa card thank you payment. Information about how to receive this payment will be provided at the end of the survey. Your responses are important to us, so please press “CONTINUE” to begin answering the survey questions. All information provided in this survey will be kept strictly confidential, and at no time will you be asked to purchase anything. If you need to pause the survey at any time, you can come back later and begin again where you left off. Simply save the personalized URL to access your survey again. The survey will automatically take you to the point where you left off. As you complete the survey, you will not be able to use your browser’s “back” button. If you mistakenly press your browser’s “back” button, you will need to press the “refresh” button to continue the survey.
Residential Saturation Survey Questionnaire
D-8 www.enernoc.com
I – HOUSEHOLD INFORMATION
[PROGRAMMER NOTE: THROUGHOUT THIS SURVEY, WORDS OR PHRASES WITH BLUE, UNDERLINED FONT WILL HAVE HYPERLINKED DEFINITIONS THAT POP-UP WHEN THE RESPONDENT CLICKS ON THE WORD OR PHRASE. HYPERLINKED DEFINITIONS ARE PROVIDED AT THE END OF THIS DOCUMENT] 7/25 PROGRAMMER NOTES: PLEASE USE SAME PROCESS THAT WE USED IN RES PROG INT TO PREVENT A CLICKED HYPERLINK FROM SELECTING THAT RESPONSE IF THE WORD IS A QUESTION RESPONSE OPTION; REQUIRE WHOLE NUMBERS ONLY – NO DECIMALS]] Q1. Including yourself, how many individuals normally live in your home?
Do not include anyone who is just visiting, those away in the military, or children who are away at college.
[RECORD NUMBER 1-20] individuals Q2. Which of the following best describes your home at [ADDRESS]? 1. Single-family house detached from any other houses 2. Single-family house attached to one or more houses 3. Multi-family house or building with 2-4 apartments/units 4. Multi-family house or building with 5 or more apartments/units 5. Mobile/manufactured home 990. Other [SPECIFY] [PROGRAMMER: DISPLAY DIRECTLY BELOW Q2 ON SCREEN: Note is displayed above Q3 “PLEASE NOTE THAT ALL OF OUR REMAINING QUESTIONS REFER SPECIFICALLY TO THE RESIDENCE AT THE LOCATION CITED ABOVE.”] [IF Q2=990, ASK Q3 ; OTHERWISE SKIP TO Q4] Q3. Rather than using one of the residence type descriptions we offered in the last question, you described
your home as: “[INSERT Q2=990 RESPONSE].” Which of the following would you say best describes this dwelling?
Note: The term “single-family” does not necessarily mean that the individuals living in the house/building/structure must be family members. Rather, this term indicates individuals voluntarily living together in a single dwelling who share common areas and do not consider each other neighbors or tenants.
1. A single-family fully detached house/building/structure – a house/building/structure that is fully
separated from any other house/building/structure (i.e., it has open space on all four sides of its ground-to-roof outer walls)
2. Either…
• a single-family semi-detached house/building/structure – a house/building/structure that is not fully separated from all other houses/buildings/structures (i.e., it shares a wall with at least one other house/building/structure) and is occupied by a single party of individuals
or…
• a multi-family house/building/structure– a single house/building/structure that incorporates several relatively self-contained housing units, each of which are occupied by separate parties of individuals

Residential Saturation Survey Questionnaire
EnerNOC Utility Solutions Consulting D-9
(This option includes any condominiums, town houses, row houses, duplexes, triplexes, apartment buildings, etc.)
Q4. About when was your home built?
1. Before 1940 2. 1940-1949 3. 1950-1959 4. 1960-1969 5. 1970-1979 6. 1980-1989 7. 1990-1999 8. 2000-2009 9. 2010-present 10. Not sure
Q5. For about how many years have you lived in your present home?
Your best estimate is fine, but please enter a whole number rather than a range of numbers.
1. Less than 1 year 2. [RECORD NUMBER 1-100] years Q6. Is this home your primary place of residence or is it a seasonal/vacation home that is only occupied for
part of the year?
1. Primary residence 2. Seasonal / vacation home 990. Other [SPECIFY]
[IF Q6=2, ASK Q7; OTHERWISE SKIP TO Q8] Q7. How many months out of the year do you or any other members of your household typically occupy this
home? Your best estimate is fine, but please enter a whole number rather than a range of numbers.
[RECORD NUMBER 0-12] Q8. What is the approximate square footage of your home? Please include only heated living space in your
response.
If you are not certain, please give your best estimate.
1. Less than 500 sq. ft. 2. 500 – 999 3. 1,000 – 1,499 4. 1,500 – 1,999 5. 2,000 – 2,499 6. 2,500 – 2,999 7. 3,000 – 3,499
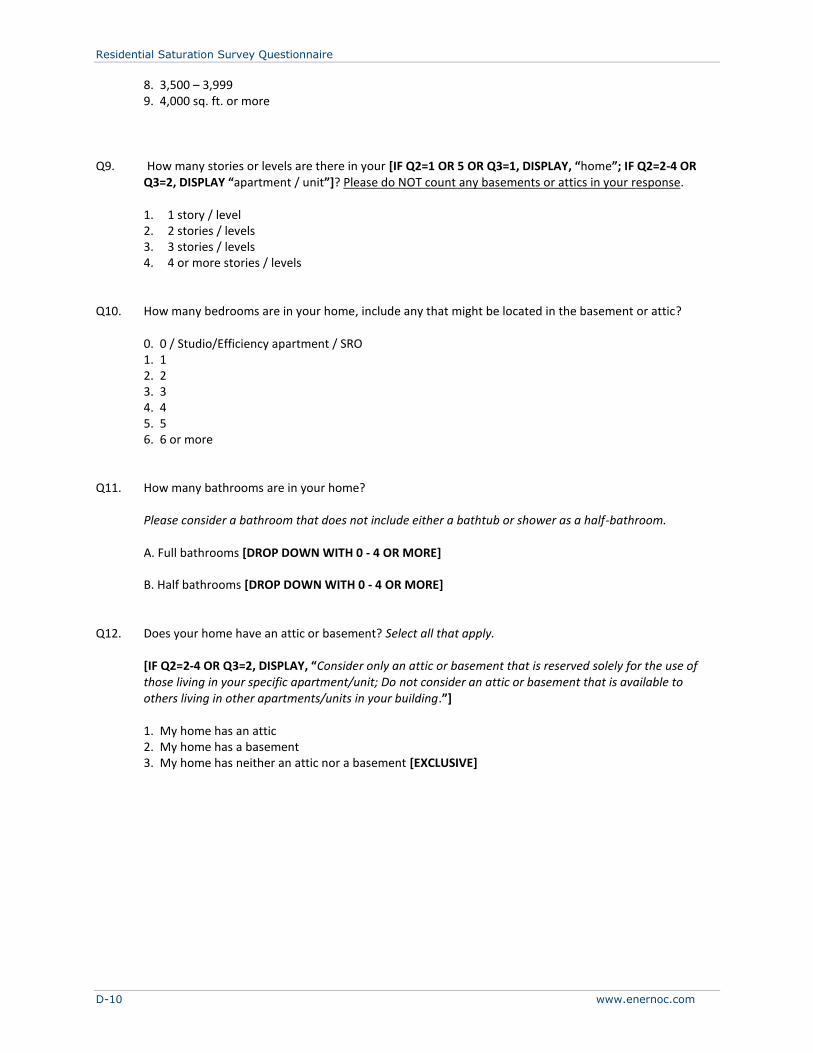
Residential Saturation Survey Questionnaire
D-10 www.enernoc.com
8. 3,500 – 3,999 9. 4,000 sq. ft. or more
Q9. How many stories or levels are there in your [IF Q2=1 OR 5 OR Q3=1, DISPLAY, “home”; IF Q2=2-4 OR
Q3=2, DISPLAY “apartment / unit”]? Please do NOT count any basements or attics in your response. 1. 1 story / level 2. 2 stories / levels 3. 3 stories / levels 4. 4 or more stories / levels Q10. How many bedrooms are in your home, include any that might be located in the basement or attic?
0. 0 / Studio/Efficiency apartment / SRO 1. 1 2. 2 3. 3 4. 4 5. 5 6. 6 or more
Q11. How many bathrooms are in your home?
Please consider a bathroom that does not include either a bathtub or shower as a half-bathroom.
A. Full bathrooms [DROP DOWN WITH 0 - 4 OR MORE] B. Half bathrooms [DROP DOWN WITH 0 - 4 OR MORE]
Q12. Does your home have an attic or basement? Select all that apply.
[IF Q2=2-4 OR Q3=2, DISPLAY, “Consider only an attic or basement that is reserved solely for the use of those living in your specific apartment/unit; Do not consider an attic or basement that is available to others living in other apartments/units in your building.”]
1. My home has an attic 2. My home has a basement 3. My home has neither an attic nor a basement [EXCLUSIVE]
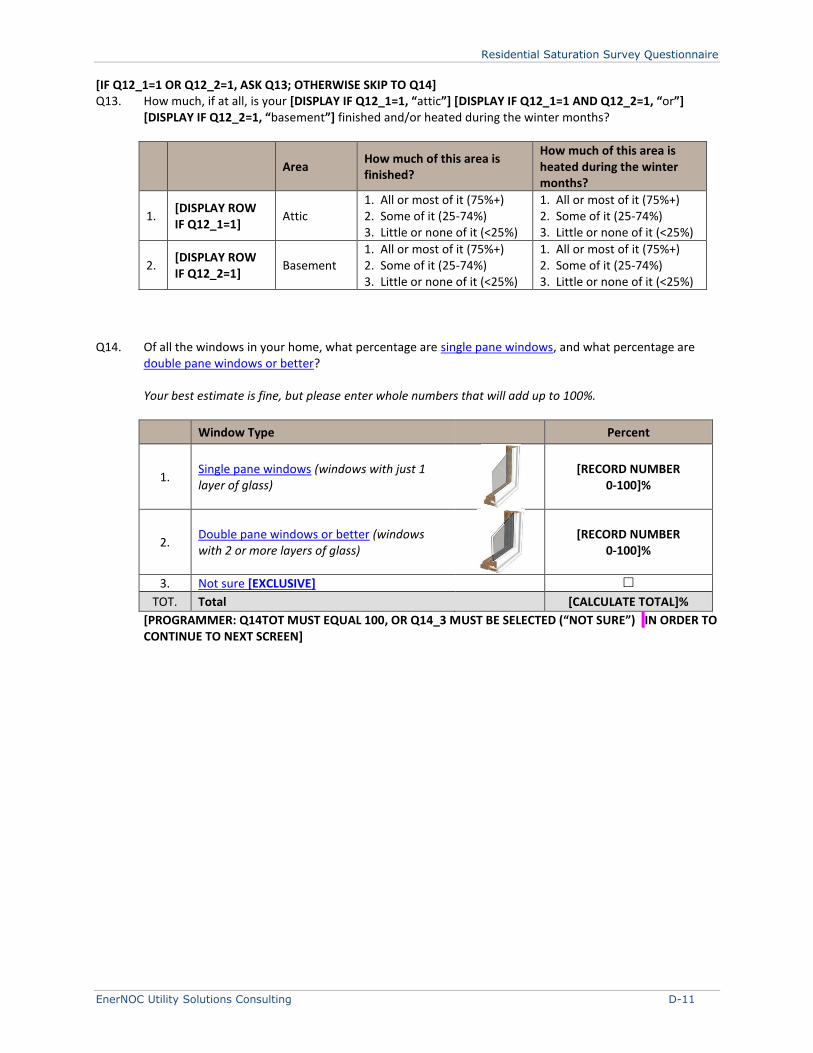
Residential Saturation Survey Questionnaire
EnerNOC Utility Solutions Consulting D-11
[IF Q12_1=1 OR Q12_2=1, ASK Q13; OTHERWISE SKIP TO Q14] Q13. How much, if at all, is your [DISPLAY IF Q12_1=1, “attic”] [DISPLAY IF Q12_1=1 AND Q12_2=1, “or”]
[DISPLAY IF Q12_2=1, “basement”] finished and/or heated during the winter months?
Area How much of this area is finished?
How much of this area is heated during the winter months?
1. [DISPLAY ROW IF Q12_1=1]
Attic 1. All or most of it (75%+) 2. Some of it (25-74%) 3. Little or none of it (<25%)
1. All or most of it (75%+) 2. Some of it (25-74%) 3. Little or none of it (<25%)
2. [DISPLAY ROW IF Q12_2=1]
Basement 1. All or most of it (75%+) 2. Some of it (25-74%) 3. Little or none of it (<25%)
1. All or most of it (75%+) 2. Some of it (25-74%) 3. Little or none of it (<25%)
Q14. Of all the windows in your home, what percentage are single pane windows, and what percentage are
double pane windows or better?
Your best estimate is fine, but please enter whole numbers that will add up to 100%.
Window Type Percent
1. Single pane windows (windows with just 1 layer of glass)
[RECORD NUMBER 0-100]%
2. Double pane windows or better (windows with 2 or more layers of glass)
[RECORD NUMBER 0-100]%
3. Not sure [EXCLUSIVE]
TOT. Total [CALCULATE TOTAL]%
[PROGRAMMER: Q14TOT MUST EQUAL 100, OR Q14_3 MUST BE SELECTED (“NOT SURE”) IN ORDER TO CONTINUE TO NEXT SCREEN]
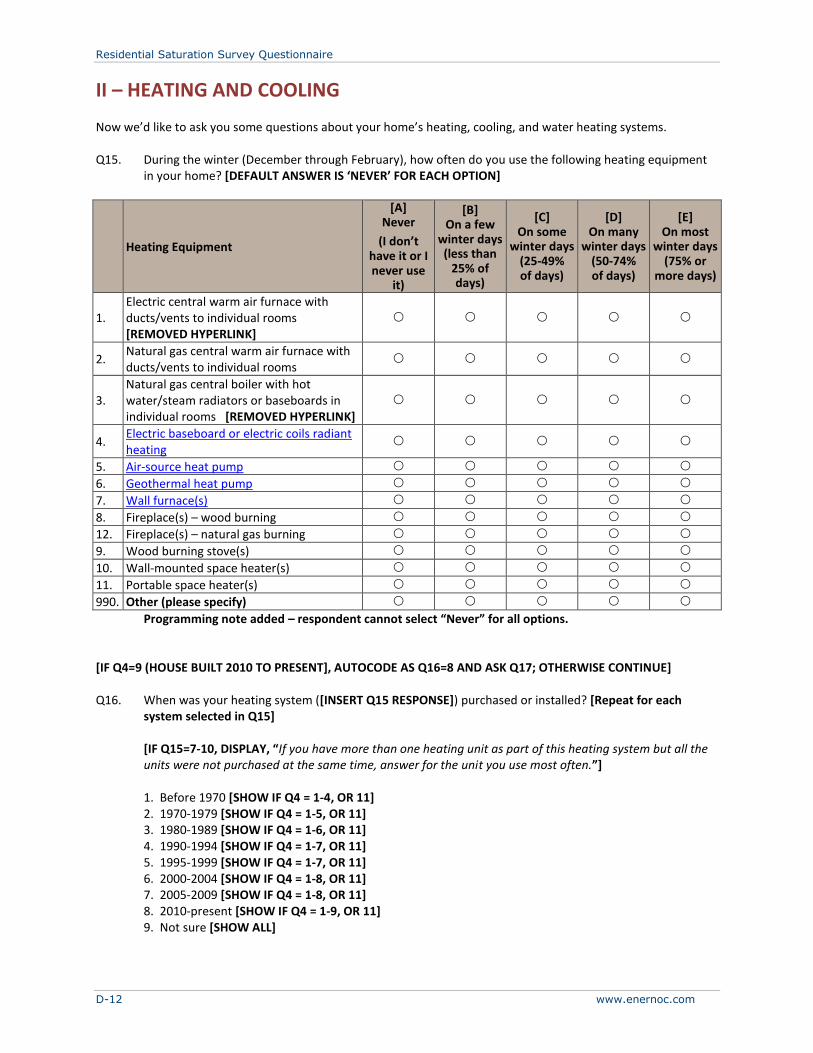
Residential Saturation Survey Questionnaire
D-12 www.enernoc.com
II – HEATING AND COOLING
Now we’d like to ask you some questions about your home’s heating, cooling, and water heating systems. Q15. During the winter (December through February), how often do you use the following heating equipment
in your home? [DEFAULT ANSWER IS ‘NEVER’ FOR EACH OPTION]
Heating Equipment
[A] Never
(I don’t have it or I never use
it)
[B] On a few
winter days (less than
25% of days)
[C] On some
winter days (25-49% of days)
[D] On many
winter days (50-74% of days)
[E] On most
winter days (75% or
more days)
1. Electric central warm air furnace with ducts/vents to individual rooms [REMOVED HYPERLINK]
2. Natural gas central warm air furnace with ducts/vents to individual rooms
3. Natural gas central boiler with hot water/steam radiators or baseboards in individual rooms [REMOVED HYPERLINK]
4. Electric baseboard or electric coils radiant heating
5. Air-source heat pump
6. Geothermal heat pump
7. Wall furnace(s)
8. Fireplace(s) – wood burning
12. Fireplace(s) – natural gas burning
9. Wood burning stove(s)
10. Wall-mounted space heater(s)
11. Portable space heater(s)
990. Other (please specify)
Programming note added – respondent cannot select “Never” for all options. [IF Q4=9 (HOUSE BUILT 2010 TO PRESENT], AUTOCODE AS Q16=8 AND ASK Q17; OTHERWISE CONTINUE] Q16. When was your heating system ([INSERT Q15 RESPONSE]) purchased or installed? [Repeat for each
system selected in Q15]
[IF Q15=7-10, DISPLAY, “If you have more than one heating unit as part of this heating system but all the units were not purchased at the same time, answer for the unit you use most often.”] 1. Before 1970 [SHOW IF Q4 = 1-4, OR 11] 2. 1970-1979 [SHOW IF Q4 = 1-5, OR 11] 3. 1980-1989 [SHOW IF Q4 = 1-6, OR 11] 4. 1990-1994 [SHOW IF Q4 = 1-7, OR 11] 5. 1995-1999 [SHOW IF Q4 = 1-7, OR 11] 6. 2000-2004 [SHOW IF Q4 = 1-8, OR 11] 7. 2005-2009 [SHOW IF Q4 = 1-8, OR 11] 8. 2010-present [SHOW IF Q4 = 1-9, OR 11] 9. Not sure [SHOW ALL]
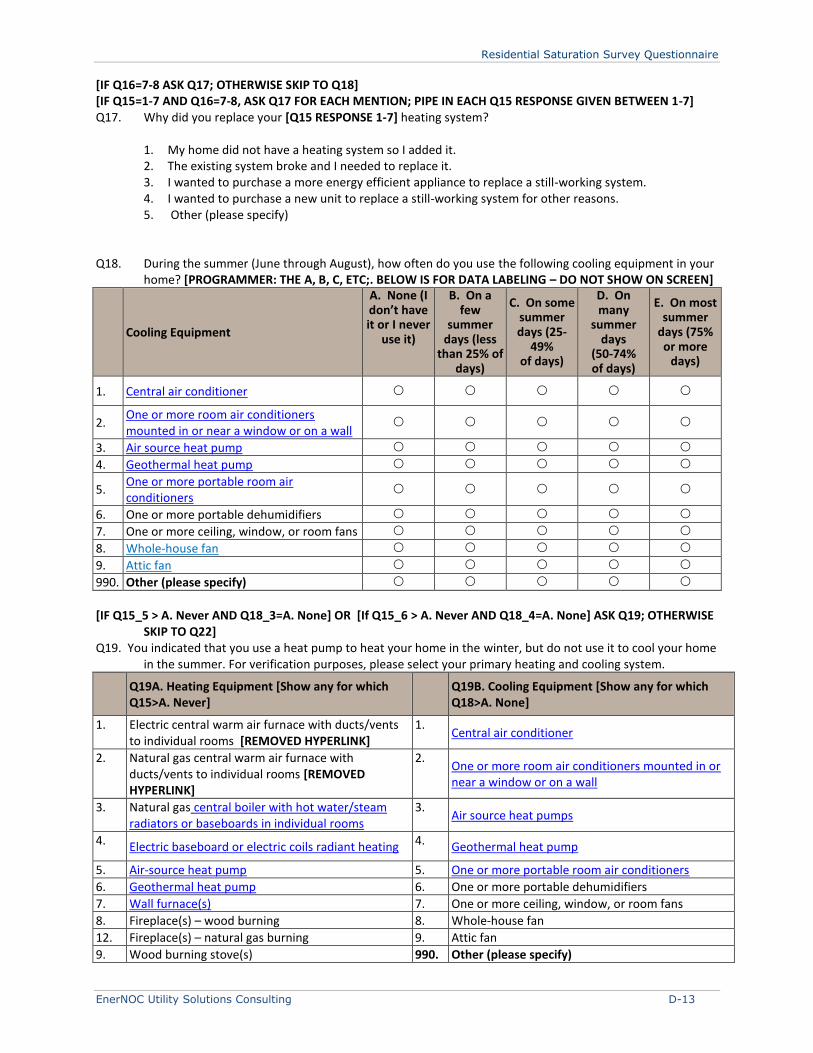
Residential Saturation Survey Questionnaire
EnerNOC Utility Solutions Consulting D-13
[IF Q16=7-8 ASK Q17; OTHERWISE SKIP TO Q18] [IF Q15=1-7 AND Q16=7-8, ASK Q17 FOR EACH MENTION; PIPE IN EACH Q15 RESPONSE GIVEN BETWEEN 1-7] Q17. Why did you replace your [Q15 RESPONSE 1-7] heating system?
1. My home did not have a heating system so I added it. 2. The existing system broke and I needed to replace it. 3. I wanted to purchase a more energy efficient appliance to replace a still-working system. 4. I wanted to purchase a new unit to replace a still-working system for other reasons. 5. Other (please specify)
Q18. During the summer (June through August), how often do you use the following cooling equipment in your
home? [PROGRAMMER: THE A, B, C, ETC;. BELOW IS FOR DATA LABELING – DO NOT SHOW ON SCREEN]
Cooling Equipment
A. None (I don’t have it or I never
use it)
B. On a few
summer days (less
than 25% of days)
C. On some summer days (25-
49% of days)
D. On many
summer days
(50-74% of days)
E. On most summer
days (75% or more
days)
1. Central air conditioner
2. One or more room air conditioners mounted in or near a window or on a wall
3. Air source heat pump
4. Geothermal heat pump
5. One or more portable room air conditioners
6. One or more portable dehumidifiers
7. One or more ceiling, window, or room fans
8. Whole-house fan
9. Attic fan
990. Other (please specify)
[IF Q15_5 > A. Never AND Q18_3=A. None] OR [If Q15_6 > A. Never AND Q18_4=A. None] ASK Q19; OTHERWISE
SKIP TO Q22] Q19. You indicated that you use a heat pump to heat your home in the winter, but do not use it to cool your home
in the summer. For verification purposes, please select your primary heating and cooling system.
Q19A. Heating Equipment [Show any for which Q15>A. Never]
Q19B. Cooling Equipment [Show any for which Q18>A. None]
1. Electric central warm air furnace with ducts/vents to individual rooms [REMOVED HYPERLINK]
1. Central air conditioner
2. Natural gas central warm air furnace with ducts/vents to individual rooms [REMOVED HYPERLINK]
2. One or more room air conditioners mounted in or near a window or on a wall
3. Natural gas central boiler with hot water/steam radiators or baseboards in individual rooms
3. Air source heat pumps
4. Electric baseboard or electric coils radiant heating 4. Geothermal heat pump
5. Air-source heat pump 5. One or more portable room air conditioners
6. Geothermal heat pump 6. One or more portable dehumidifiers
7. Wall furnace(s) 7. One or more ceiling, window, or room fans
8. Fireplace(s) – wood burning 8. Whole-house fan
12. Fireplace(s) – natural gas burning 9. Attic fan
9. Wood burning stove(s) 990. Other (please specify)
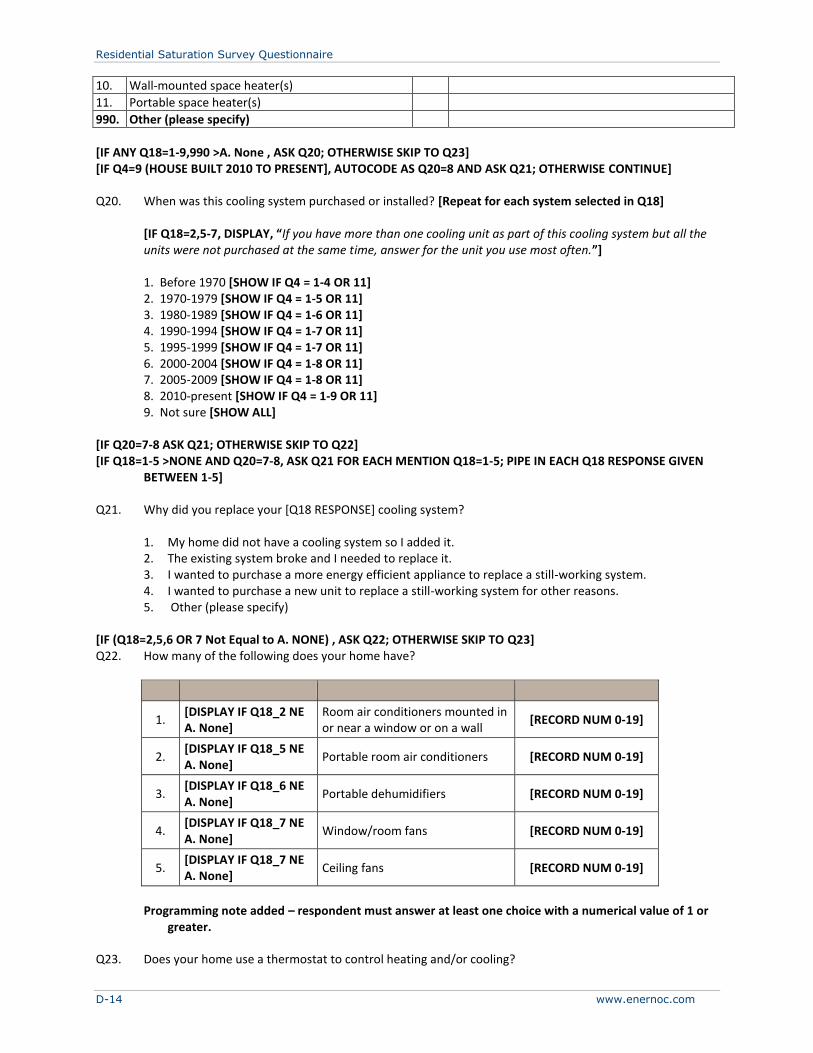
Residential Saturation Survey Questionnaire
D-14 www.enernoc.com
10. Wall-mounted space heater(s)
11. Portable space heater(s)
990. Other (please specify)
[IF ANY Q18=1-9,990 >A. None , ASK Q20; OTHERWISE SKIP TO Q23] [IF Q4=9 (HOUSE BUILT 2010 TO PRESENT], AUTOCODE AS Q20=8 AND ASK Q21; OTHERWISE CONTINUE] Q20. When was this cooling system purchased or installed? [Repeat for each system selected in Q18]
[IF Q18=2,5-7, DISPLAY, “If you have more than one cooling unit as part of this cooling system but all the units were not purchased at the same time, answer for the unit you use most often.”]
1. Before 1970 [SHOW IF Q4 = 1-4 OR 11] 2. 1970-1979 [SHOW IF Q4 = 1-5 OR 11] 3. 1980-1989 [SHOW IF Q4 = 1-6 OR 11] 4. 1990-1994 [SHOW IF Q4 = 1-7 OR 11] 5. 1995-1999 [SHOW IF Q4 = 1-7 OR 11] 6. 2000-2004 [SHOW IF Q4 = 1-8 OR 11] 7. 2005-2009 [SHOW IF Q4 = 1-8 OR 11] 8. 2010-present [SHOW IF Q4 = 1-9 OR 11] 9. Not sure [SHOW ALL]
[IF Q20=7-8 ASK Q21; OTHERWISE SKIP TO Q22] [IF Q18=1-5 >NONE AND Q20=7-8, ASK Q21 FOR EACH MENTION Q18=1-5; PIPE IN EACH Q18 RESPONSE GIVEN
BETWEEN 1-5] Q21. Why did you replace your [Q18 RESPONSE] cooling system?
1. My home did not have a cooling system so I added it. 2. The existing system broke and I needed to replace it. 3. I wanted to purchase a more energy efficient appliance to replace a still-working system. 4. I wanted to purchase a new unit to replace a still-working system for other reasons. 5. Other (please specify)
[IF (Q18=2,5,6 OR 7 Not Equal to A. NONE) , ASK Q22; OTHERWISE SKIP TO Q23] Q22. How many of the following does your home have?
1. [DISPLAY IF Q18_2 NE A. None]
Room air conditioners mounted in or near a window or on a wall
[RECORD NUM 0-19]
2. [DISPLAY IF Q18_5 NE A. None]
Portable room air conditioners [RECORD NUM 0-19]
3. [DISPLAY IF Q18_6 NE A. None]
Portable dehumidifiers [RECORD NUM 0-19]
4. [DISPLAY IF Q18_7 NE A. None]
Window/room fans [RECORD NUM 0-19]
5. [DISPLAY IF Q18_7 NE A. None]
Ceiling fans [RECORD NUM 0-19]
Programming note added – respondent must answer at least one choice with a numerical value of 1 or
greater. Q23. Does your home use a thermostat to control heating and/or cooling?
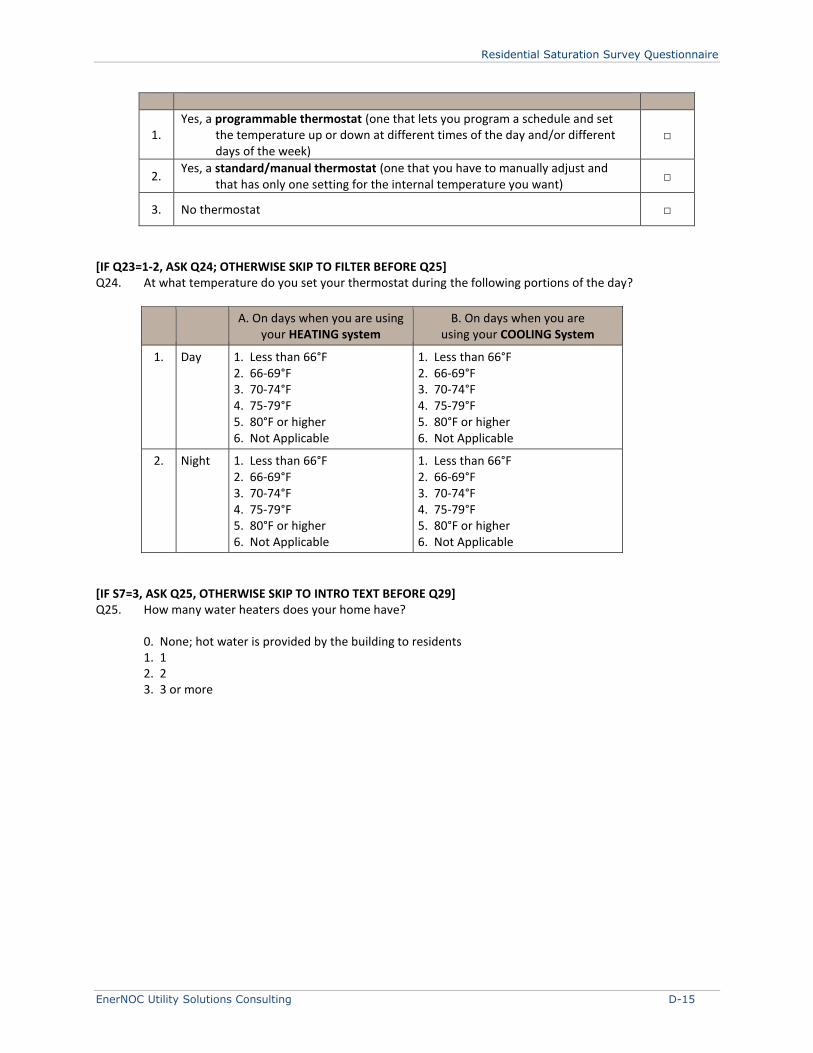
Residential Saturation Survey Questionnaire
EnerNOC Utility Solutions Consulting D-15
1. Yes, a programmable thermostat (one that lets you program a schedule and set
the temperature up or down at different times of the day and/or different days of the week)
□
2. Yes, a standard/manual thermostat (one that you have to manually adjust and
that has only one setting for the internal temperature you want) □
3. No thermostat □
[IF Q23=1-2, ASK Q24; OTHERWISE SKIP TO FILTER BEFORE Q25] Q24. At what temperature do you set your thermostat during the following portions of the day?
A. On days when you are using
your HEATING system B. On days when you are
using your COOLING System
1. Day 1. Less than 66°F 2. 66-69°F 3. 70-74°F 4. 75-79°F 5. 80°F or higher 6. Not Applicable
1. Less than 66°F 2. 66-69°F 3. 70-74°F 4. 75-79°F 5. 80°F or higher 6. Not Applicable
2. Night 1. Less than 66°F 2. 66-69°F 3. 70-74°F 4. 75-79°F 5. 80°F or higher 6. Not Applicable
1. Less than 66°F 2. 66-69°F 3. 70-74°F 4. 75-79°F 5. 80°F or higher 6. Not Applicable
[IF S7=3, ASK Q25, OTHERWISE SKIP TO INTRO TEXT BEFORE Q29] Q25. How many water heaters does your home have?
0. None; hot water is provided by the building to residents 1. 1 2. 2 3. 3 or more
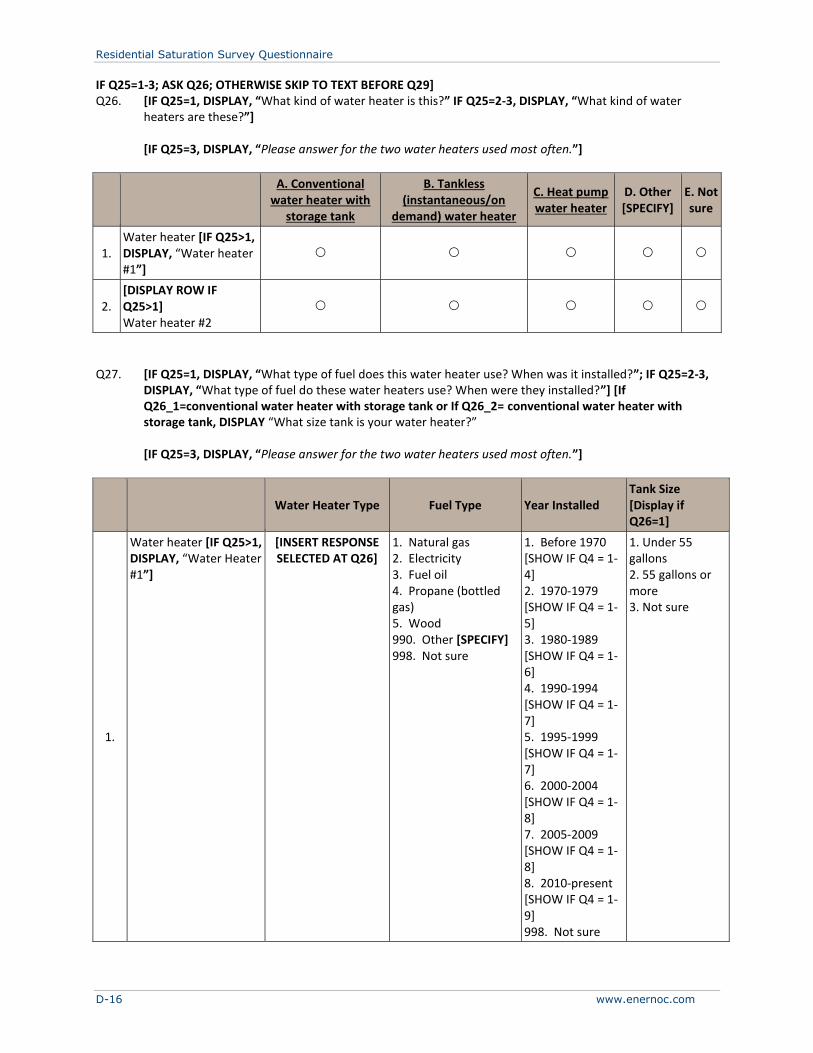
Residential Saturation Survey Questionnaire
D-16 www.enernoc.com
IF Q25=1-3; ASK Q26; OTHERWISE SKIP TO TEXT BEFORE Q29] Q26. [IF Q25=1, DISPLAY, “What kind of water heater is this?” IF Q25=2-3, DISPLAY, “What kind of water
heaters are these?”] [IF Q25=3, DISPLAY, “Please answer for the two water heaters used most often.”]
A. Conventional
water heater with storage tank
B. Tankless (instantaneous/on
demand) water heater
C. Heat pump water heater
D. Other [SPECIFY]
E. Not sure
1. Water heater [IF Q25>1, DISPLAY, “Water heater #1”]
2. [DISPLAY ROW IF Q25>1] Water heater #2
Q27. [IF Q25=1, DISPLAY, “What type of fuel does this water heater use? When was it installed?”; IF Q25=2-3,
DISPLAY, “What type of fuel do these water heaters use? When were they installed?”] [If Q26_1=conventional water heater with storage tank or If Q26_2= conventional water heater with storage tank, DISPLAY “What size tank is your water heater?”
[IF Q25=3, DISPLAY, “Please answer for the two water heaters used most often.”]
Water Heater Type Fuel Type Year Installed Tank Size [Display if Q26=1]
1.
Water heater [IF Q25>1, DISPLAY, “Water Heater #1”]
[INSERT RESPONSE SELECTED AT Q26]
1. Natural gas 2. Electricity 3. Fuel oil 4. Propane (bottled gas) 5. Wood 990. Other [SPECIFY] 998. Not sure
1. Before 1970 [SHOW IF Q4 = 1-4] 2. 1970-1979 [SHOW IF Q4 = 1-5] 3. 1980-1989 [SHOW IF Q4 = 1-6] 4. 1990-1994 [SHOW IF Q4 = 1-7] 5. 1995-1999 [SHOW IF Q4 = 1-7] 6. 2000-2004 [SHOW IF Q4 = 1-8] 7. 2005-2009 [SHOW IF Q4 = 1-8] 8. 2010-present [SHOW IF Q4 = 1-9] 998. Not sure
1. Under 55 gallons 2. 55 gallons or more 3. Not sure
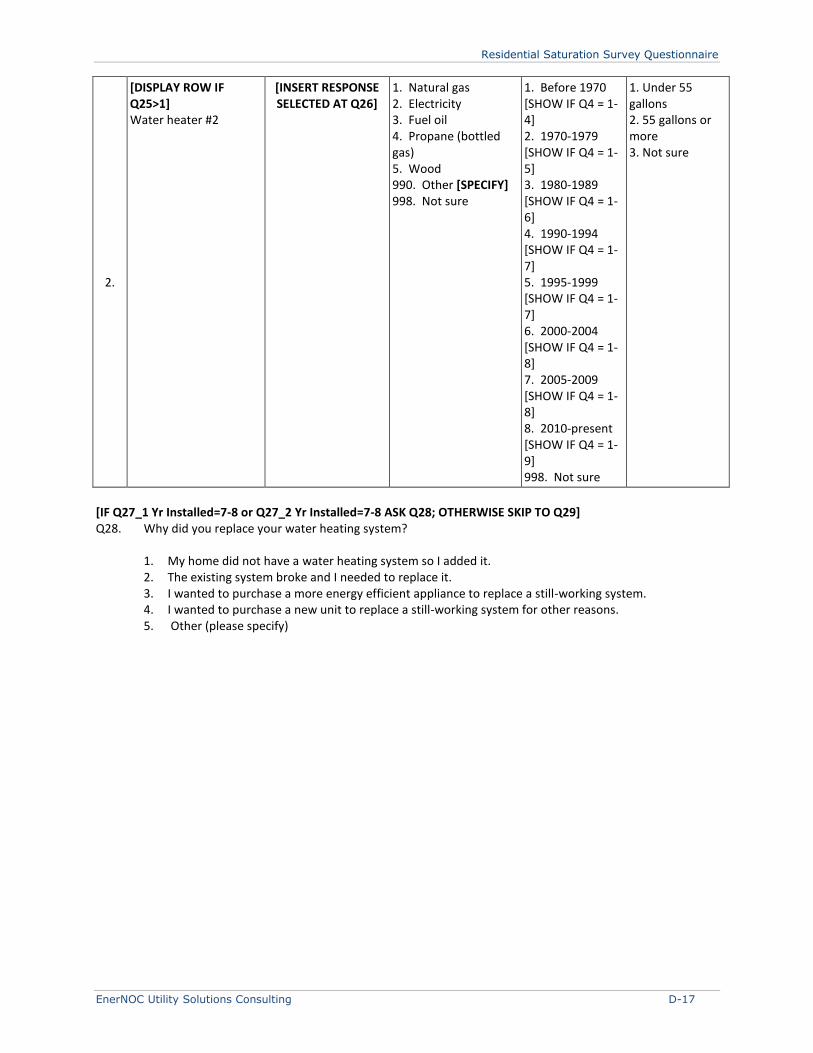
Residential Saturation Survey Questionnaire
EnerNOC Utility Solutions Consulting D-17
2.
[DISPLAY ROW IF Q25>1] Water heater #2
[INSERT RESPONSE SELECTED AT Q26]
1. Natural gas 2. Electricity 3. Fuel oil 4. Propane (bottled gas) 5. Wood 990. Other [SPECIFY] 998. Not sure
1. Before 1970 [SHOW IF Q4 = 1-4] 2. 1970-1979 [SHOW IF Q4 = 1-5] 3. 1980-1989 [SHOW IF Q4 = 1-6] 4. 1990-1994 [SHOW IF Q4 = 1-7] 5. 1995-1999 [SHOW IF Q4 = 1-7] 6. 2000-2004 [SHOW IF Q4 = 1-8] 7. 2005-2009 [SHOW IF Q4 = 1-8] 8. 2010-present [SHOW IF Q4 = 1-9] 998. Not sure
1. Under 55 gallons 2. 55 gallons or more 3. Not sure
[IF Q27_1 Yr Installed=7-8 or Q27_2 Yr Installed=7-8 ASK Q28; OTHERWISE SKIP TO Q29] Q28. Why did you replace your water heating system?
1. My home did not have a water heating system so I added it. 2. The existing system broke and I needed to replace it. 3. I wanted to purchase a more energy efficient appliance to replace a still-working system. 4. I wanted to purchase a new unit to replace a still-working system for other reasons. 5. Other (please specify)
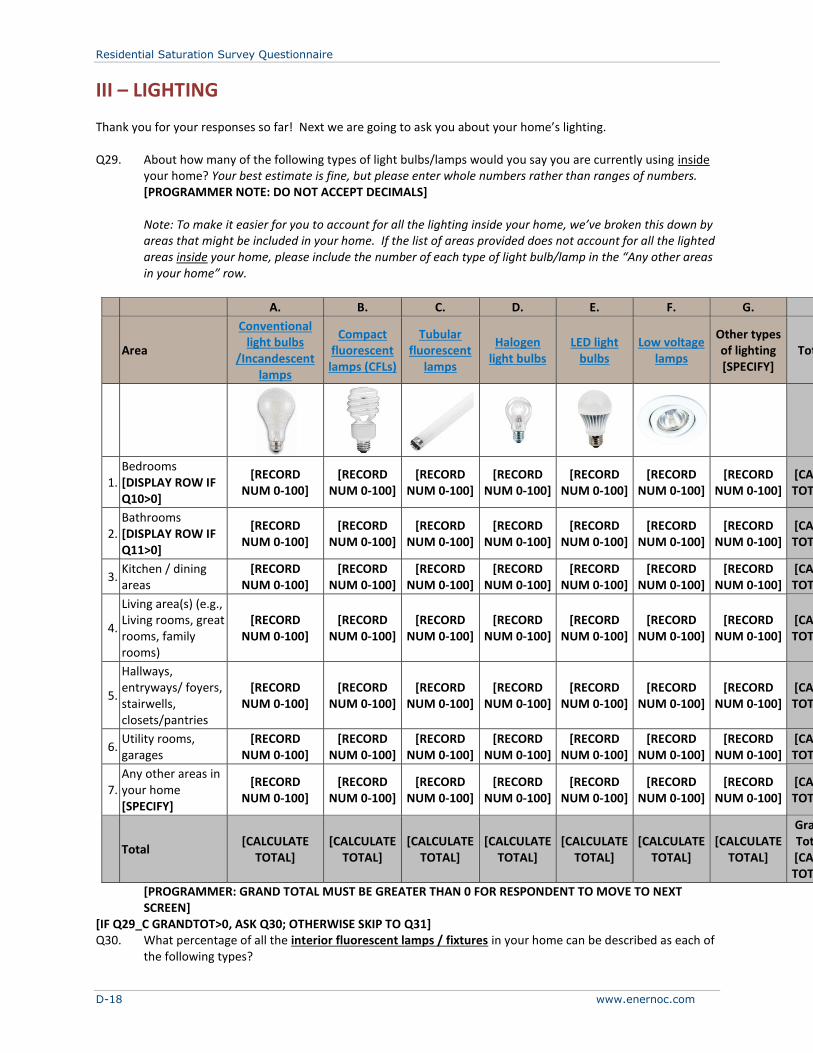
Residential Saturation Survey Questionnaire
D-18 www.enernoc.com
III – LIGHTING
Thank you for your responses so far! Next we are going to ask you about your home’s lighting. Q29. About how many of the following types of light bulbs/lamps would you say you are currently using inside
your home? Your best estimate is fine, but please enter whole numbers rather than ranges of numbers. [PROGRAMMER NOTE: DO NOT ACCEPT DECIMALS]
Note: To make it easier for you to account for all the lighting inside your home, we’ve broken this down by
areas that might be included in your home. If the list of areas provided does not account for all the lighted areas inside your home, please include the number of each type of light bulb/lamp in the “Any other areas in your home” row.
A. B. C. D. E. F. G.
Area
Conventional light bulbs
/Incandescent lamps
Compact fluorescent lamps (CFLs)
Tubular fluorescent
lamps
Halogen light bulbs
LED light bulbs
Low voltage lamps
Other types of lighting [SPECIFY]
Total
1. Bedrooms [DISPLAY ROW IF Q10>0]
[RECORD NUM 0-100]
[RECORD NUM 0-100]
[RECORD NUM 0-100]
[RECORD NUM 0-100]
[RECORD NUM 0-100]
[RECORD NUM 0-100]
[RECORD NUM 0-100]
[CALC. TOTAL]
2. Bathrooms [DISPLAY ROW IF Q11>0]
[RECORD NUM 0-100]
[RECORD NUM 0-100]
[RECORD NUM 0-100]
[RECORD NUM 0-100]
[RECORD NUM 0-100]
[RECORD NUM 0-100]
[RECORD NUM 0-100]
[CALC. TOTAL]
3. Kitchen / dining areas
[RECORD NUM 0-100]
[RECORD NUM 0-100]
[RECORD NUM 0-100]
[RECORD NUM 0-100]
[RECORD NUM 0-100]
[RECORD NUM 0-100]
[RECORD NUM 0-100]
[CALC. TOTAL]
4.
Living area(s) (e.g., Living rooms, great rooms, family rooms)
[RECORD NUM 0-100]
[RECORD NUM 0-100]
[RECORD NUM 0-100]
[RECORD NUM 0-100]
[RECORD NUM 0-100]
[RECORD NUM 0-100]
[RECORD NUM 0-100]
[CALC. TOTAL]
5.
Hallways, entryways/ foyers, stairwells, closets/pantries
[RECORD NUM 0-100]
[RECORD NUM 0-100]
[RECORD NUM 0-100]
[RECORD NUM 0-100]
[RECORD NUM 0-100]
[RECORD NUM 0-100]
[RECORD NUM 0-100]
[CALC. TOTAL]
6. Utility rooms, garages
[RECORD NUM 0-100]
[RECORD NUM 0-100]
[RECORD NUM 0-100]
[RECORD NUM 0-100]
[RECORD NUM 0-100]
[RECORD NUM 0-100]
[RECORD NUM 0-100]
[CALC. TOTAL]
7. Any other areas in your home [SPECIFY]
[RECORD NUM 0-100]
[RECORD NUM 0-100]
[RECORD NUM 0-100]
[RECORD NUM 0-100]
[RECORD NUM 0-100]
[RECORD NUM 0-100]
[RECORD NUM 0-100]
[CALC. TOTAL]
Total [CALCULATE
TOTAL] [CALCULATE
TOTAL] [CALCULATE
TOTAL] [CALCULATE
TOTAL] [CALCULATE
TOTAL] [CALCULATE
TOTAL] [CALCULATE
TOTAL]
Grand Total: [CALC. TOTAL]
[PROGRAMMER: GRAND TOTAL MUST BE GREATER THAN 0 FOR RESPONDENT TO MOVE TO NEXT SCREEN]
[IF Q29_C GRANDTOT>0, ASK Q30; OTHERWISE SKIP TO Q31] Q30. What percentage of all the interior fluorescent lamps / fixtures in your home can be described as each of
the following types?
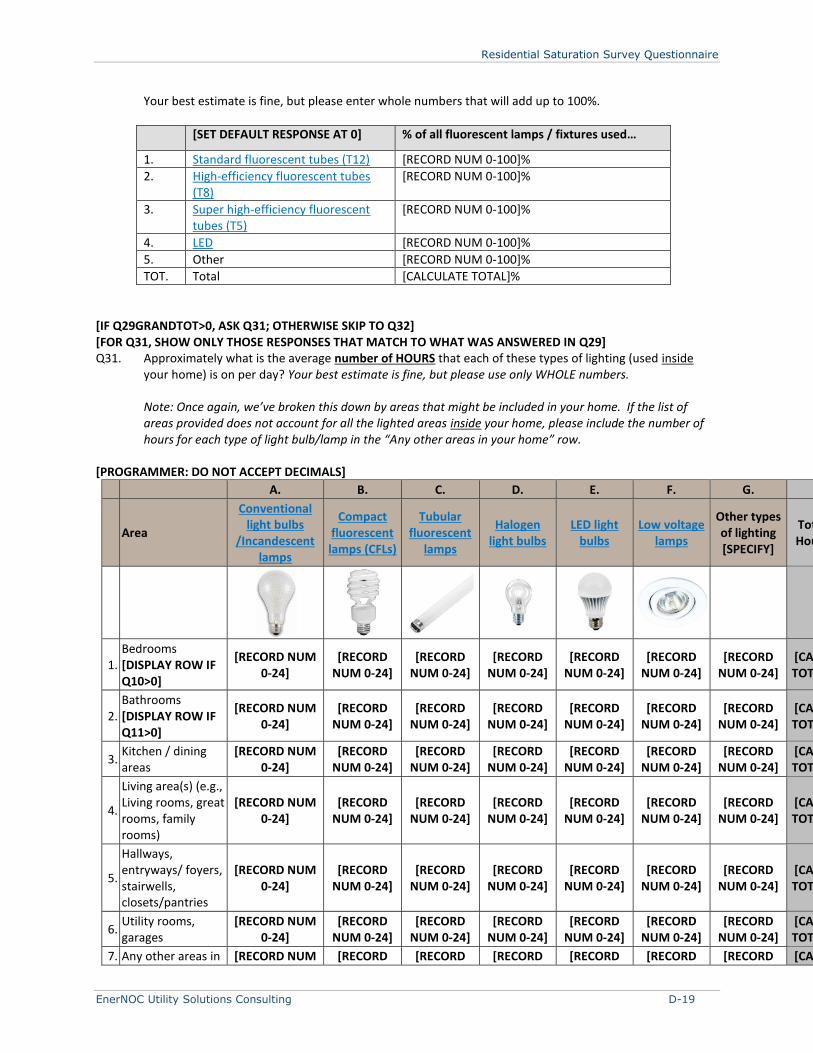
Residential Saturation Survey Questionnaire
EnerNOC Utility Solutions Consulting D-19
Your best estimate is fine, but please enter whole numbers that will add up to 100%.
[SET DEFAULT RESPONSE AT 0] % of all fluorescent lamps / fixtures used…
1. Standard fluorescent tubes (T12) [RECORD NUM 0-100]%
2. High-efficiency fluorescent tubes (T8)
[RECORD NUM 0-100]%
3. Super high-efficiency fluorescent tubes (T5)
[RECORD NUM 0-100]%
4. LED [RECORD NUM 0-100]%
5. Other [RECORD NUM 0-100]%
TOT. Total [CALCULATE TOTAL]%
[IF Q29GRANDTOT>0, ASK Q31; OTHERWISE SKIP TO Q32] [FOR Q31, SHOW ONLY THOSE RESPONSES THAT MATCH TO WHAT WAS ANSWERED IN Q29] Q31. Approximately what is the average number of HOURS that each of these types of lighting (used inside
your home) is on per day? Your best estimate is fine, but please use only WHOLE numbers.
Note: Once again, we’ve broken this down by areas that might be included in your home. If the list of areas provided does not account for all the lighted areas inside your home, please include the number of hours for each type of light bulb/lamp in the “Any other areas in your home” row.
[PROGRAMMER: DO NOT ACCEPT DECIMALS]
A. B. C. D. E. F. G.
Area
Conventional light bulbs
/Incandescent lamps
Compact fluorescent lamps (CFLs)
Tubular fluorescent
lamps
Halogen light bulbs
LED light bulbs
Low voltage lamps
Other types of lighting [SPECIFY]
Total Hours
1. Bedrooms [DISPLAY ROW IF Q10>0]
[RECORD NUM 0-24]
[RECORD NUM 0-24]
[RECORD NUM 0-24]
[RECORD NUM 0-24]
[RECORD NUM 0-24]
[RECORD NUM 0-24]
[RECORD NUM 0-24]
[CALC. TOTAL]
2. Bathrooms [DISPLAY ROW IF Q11>0]
[RECORD NUM 0-24]
[RECORD NUM 0-24]
[RECORD NUM 0-24]
[RECORD NUM 0-24]
[RECORD NUM 0-24]
[RECORD NUM 0-24]
[RECORD NUM 0-24]
[CALC. TOTAL]
3. Kitchen / dining areas
[RECORD NUM 0-24]
[RECORD NUM 0-24]
[RECORD NUM 0-24]
[RECORD NUM 0-24]
[RECORD NUM 0-24]
[RECORD NUM 0-24]
[RECORD NUM 0-24]
[CALC. TOTAL]
4.
Living area(s) (e.g., Living rooms, great rooms, family rooms)
[RECORD NUM 0-24]
[RECORD NUM 0-24]
[RECORD NUM 0-24]
[RECORD NUM 0-24]
[RECORD NUM 0-24]
[RECORD NUM 0-24]
[RECORD NUM 0-24]
[CALC. TOTAL]
5.
Hallways, entryways/ foyers, stairwells, closets/pantries
[RECORD NUM 0-24]
[RECORD NUM 0-24]
[RECORD NUM 0-24]
[RECORD NUM 0-24]
[RECORD NUM 0-24]
[RECORD NUM 0-24]
[RECORD NUM 0-24]
[CALC. TOTAL]
6. Utility rooms, garages
[RECORD NUM 0-24]
[RECORD NUM 0-24]
[RECORD NUM 0-24]
[RECORD NUM 0-24]
[RECORD NUM 0-24]
[RECORD NUM 0-24]
[RECORD NUM 0-24]
[CALC. TOTAL]
7. Any other areas in [RECORD NUM [RECORD [RECORD [RECORD [RECORD [RECORD [RECORD [CALC.
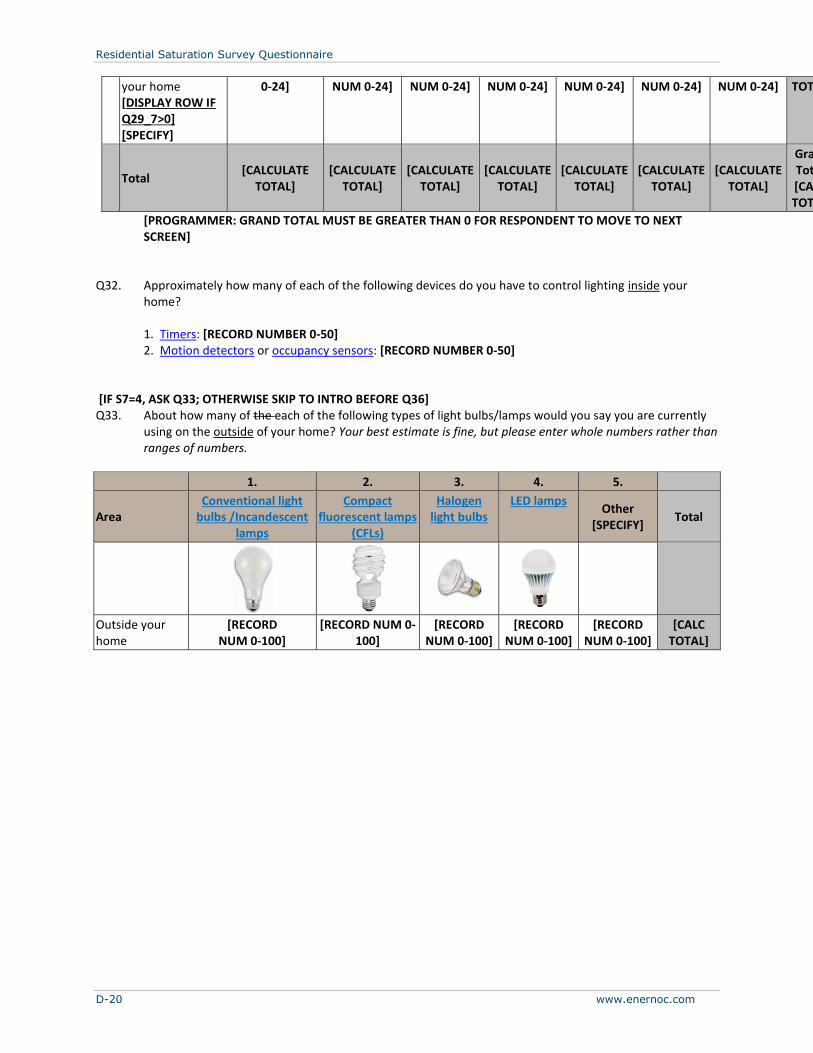
Residential Saturation Survey Questionnaire
D-20 www.enernoc.com
your home [DISPLAY ROW IF Q29_7>0] [SPECIFY]
0-24] NUM 0-24] NUM 0-24] NUM 0-24] NUM 0-24] NUM 0-24] NUM 0-24] TOTAL]
Total [CALCULATE
TOTAL] [CALCULATE
TOTAL] [CALCULATE
TOTAL] [CALCULATE
TOTAL] [CALCULATE
TOTAL] [CALCULATE
TOTAL] [CALCULATE
TOTAL]
Grand Total: [CALC. TOTAL]
[PROGRAMMER: GRAND TOTAL MUST BE GREATER THAN 0 FOR RESPONDENT TO MOVE TO NEXT SCREEN]
Q32. Approximately how many of each of the following devices do you have to control lighting inside your
home?
1. Timers: [RECORD NUMBER 0-50] 2. Motion detectors or occupancy sensors: [RECORD NUMBER 0-50]
[IF S7=4, ASK Q33; OTHERWISE SKIP TO INTRO BEFORE Q36] Q33. About how many of the each of the following types of light bulbs/lamps would you say you are currently
using on the outside of your home? Your best estimate is fine, but please enter whole numbers rather than ranges of numbers.
1. 2. 3. 4. 5.
Area Conventional light
bulbs /Incandescent lamps
Compact fluorescent lamps
(CFLs)
Halogen light bulbs
LED lamps Other
[SPECIFY] Total
Outside your home
[RECORD NUM 0-100]
[RECORD NUM 0-100]
[RECORD NUM 0-100]
[RECORD NUM 0-100]
[RECORD NUM 0-100]
[CALC TOTAL]
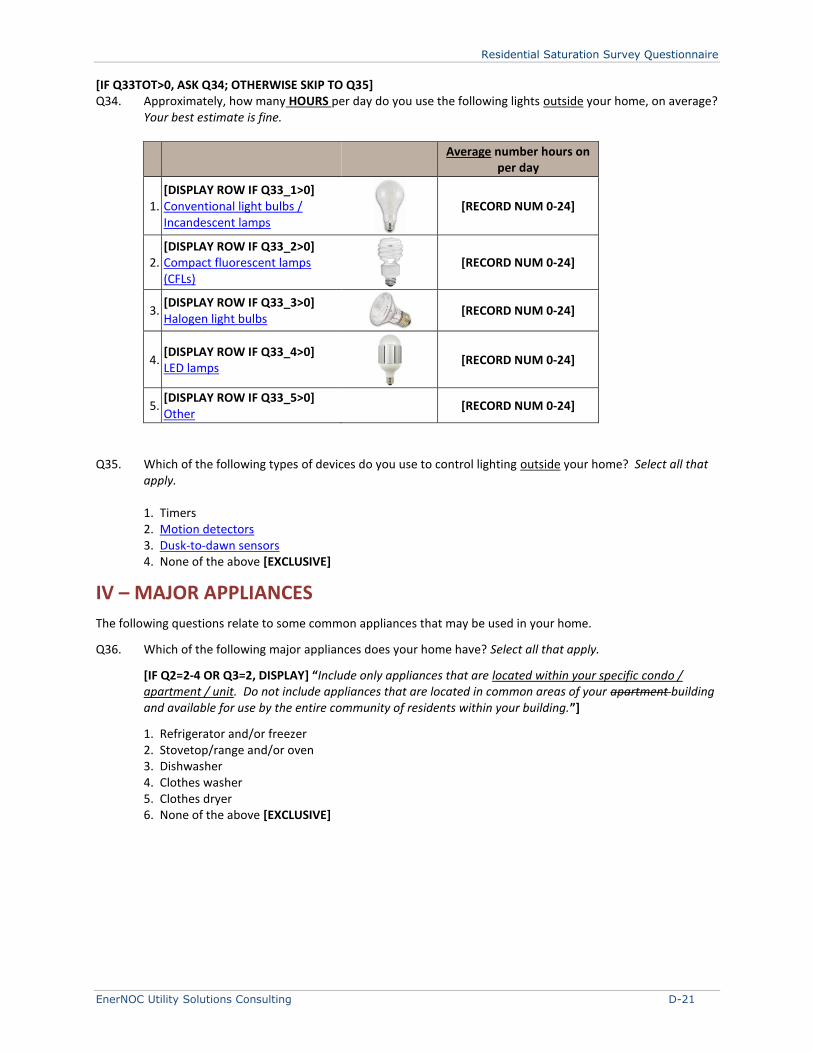
Residential Saturation Survey Questionnaire
EnerNOC Utility Solutions Consulting D-21
[IF Q33TOT>0, ASK Q34; OTHERWISE SKIP TO Q35] Q34. Approximately, how many HOURS per day do you use the following lights outside your home, on average?
Your best estimate is fine.
Average number hours on
per day
1. [DISPLAY ROW IF Q33_1>0] Conventional light bulbs / Incandescent lamps
[RECORD NUM 0-24]
2. [DISPLAY ROW IF Q33_2>0] Compact fluorescent lamps (CFLs)
[RECORD NUM 0-24]
3. [DISPLAY ROW IF Q33_3>0] Halogen light bulbs
[RECORD NUM 0-24]
4. [DISPLAY ROW IF Q33_4>0] LED lamps
[RECORD NUM 0-24]
5. [DISPLAY ROW IF Q33_5>0] Other
[RECORD NUM 0-24]
Q35. Which of the following types of devices do you use to control lighting outside your home? Select all that
apply.
1. Timers 2. Motion detectors 3. Dusk-to-dawn sensors 4. None of the above [EXCLUSIVE]
IV – MAJOR APPLIANCES
The following questions relate to some common appliances that may be used in your home.
Q36. Which of the following major appliances does your home have? Select all that apply.
[IF Q2=2-4 OR Q3=2, DISPLAY] “Include only appliances that are located within your specific condo / apartment / unit. Do not include appliances that are located in common areas of your apartment building and available for use by the entire community of residents within your building.”]
1. Refrigerator and/or freezer 2. Stovetop/range and/or oven
3. Dishwasher 4. Clothes washer 5. Clothes dryer 6. None of the above [EXCLUSIVE]

Residential Saturation Survey Questionnaire
D-22 www.enernoc.com
[IF Q36_1=1, ASK Q37; OTHERWISE AUTOCODE ALL (Q37_1 thru Q37_3)=0 AND SKIP TO FILTER BEFORE Q39] Q37. How many refrigerators, freezers, and refrigerator / freezer combos does your home have? [PROGRAMMER: DEFAULT SHOULD BE ZERO]
Unit Type Number of Units
1. Combination refrigerator / freezer units [RECORD NUM 0-5]
2. Refrigerator-only units [RECORD NUM 0-5]
3. Freezer-only units [RECORD NUM 0-5]
TOT. Total # of units in your home: [CALCULATE TOTAL]
[IF Q37TOT>0, ASK Q38; OTHERWISE SKIP TO FILTER BEFORE Q39] Q38. [IF Q37TOT=1, DISPLAY, “When was this refrigerator, freezer, or refrigerator / freezer combo
purchased?”] [IF Q37TOT>1, DISPLAY, “When were each of these refrigerator, freezer, or refrigerator / freezer combo units purchased?”]
[IF Q37_1>2 OR Q37_2>2 OR Q37_3>2, DISPLAY “When your home has more than two units in a category, please answer for the largest two units in that category.”]
Unit Type [DISPLAY COLUMN IF Q37TOT>1]
Year Purchased
1. [DISPLAY ROW IF Q37_1>=1]
Combination refrigerator / freezer unit [DISPLAY IF Q37_1>1, “#1”]
1. Before 1993 2. 1993-2001 3. 2002-2007 4. 2008- present 5. Not sure
2. [DISPLAY ROW IF Q37_3>=2]
Combination refrigerator / freezer unit #2
1. Before 1993 2. 1993-2001 3. 2002-2007 4. 2008- present 5. Not sure
3. [DISPLAY ROW IF Q37_2>=1]
Refrigerator-only unit [DISPLAY IF Q37_2>1, “#1”]
1. Before 1993 2. 1993-2001 3. 2002-2007 4. 2008- present 5. Not sure
4. [DISPLAY ROW IF Q37_2>=2]
Refrigerator-only unit #2
1. Before 1993 2. 1993-2001 3. 2002-2007 4. 2008- present 5. Not sure
5. [DISPLAY ROW IF Q37_3>=1]
Freezer-only unit [DISPLAY IF Q37_3>1, “#1”]
1. Before 1993 2. 1993-2001 3. 2002-2007 4. 2008- present 5. Not sure
6. [DISPLAY ROW IF Q37_3>=2]
Freezer-only unit #2
1. Before 1993 2. 1993-2001 3. 2002-2007 4. 2008- present 5. Not sure
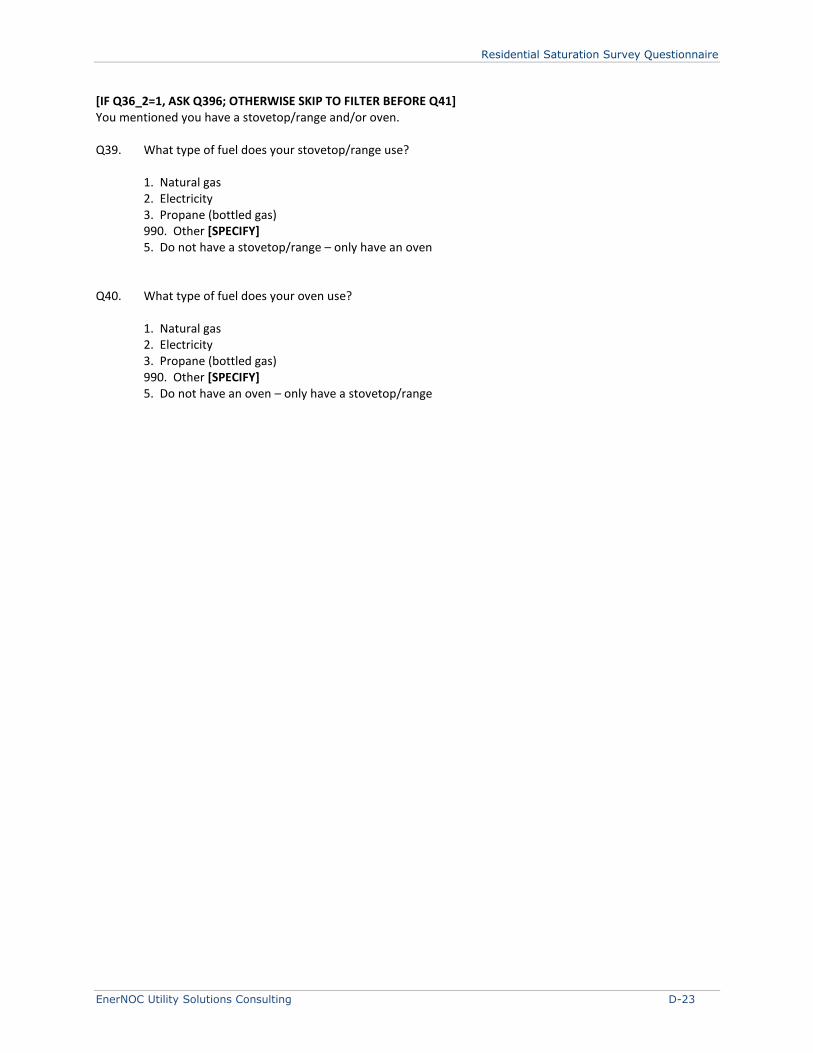
Residential Saturation Survey Questionnaire
EnerNOC Utility Solutions Consulting D-23
[IF Q36_2=1, ASK Q396; OTHERWISE SKIP TO FILTER BEFORE Q41] You mentioned you have a stovetop/range and/or oven. Q39. What type of fuel does your stovetop/range use?
1. Natural gas 2. Electricity 3. Propane (bottled gas) 990. Other [SPECIFY] 5. Do not have a stovetop/range – only have an oven
Q40. What type of fuel does your oven use?
1. Natural gas 2. Electricity 3. Propane (bottled gas) 990. Other [SPECIFY] 5. Do not have an oven – only have a stovetop/range
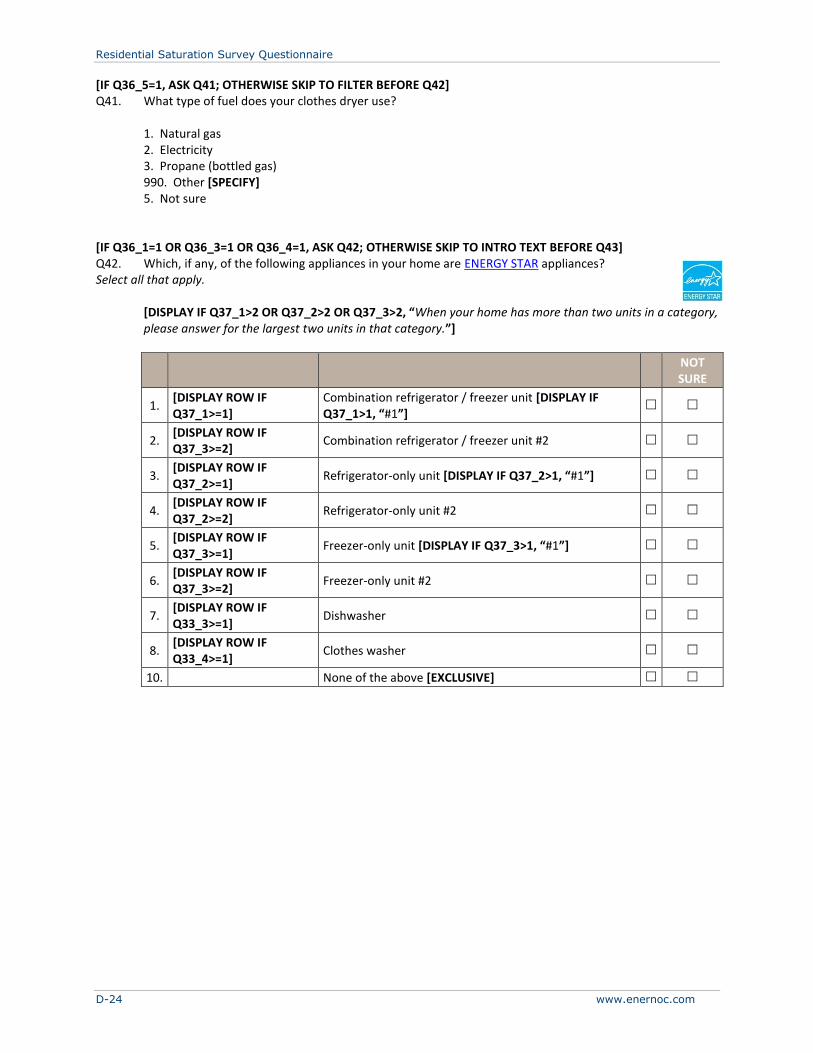
Residential Saturation Survey Questionnaire
D-24 www.enernoc.com
[IF Q36_5=1, ASK Q41; OTHERWISE SKIP TO FILTER BEFORE Q42] Q41. What type of fuel does your clothes dryer use?
1. Natural gas 2. Electricity 3. Propane (bottled gas) 990. Other [SPECIFY] 5. Not sure
[IF Q36_1=1 OR Q36_3=1 OR Q36_4=1, ASK Q42; OTHERWISE SKIP TO INTRO TEXT BEFORE Q43] Q42. Which, if any, of the following appliances in your home are ENERGY STAR appliances? Select all that apply.
[DISPLAY IF Q37_1>2 OR Q37_2>2 OR Q37_3>2, “When your home has more than two units in a category, please answer for the largest two units in that category.”]
NOT SURE
1. [DISPLAY ROW IF Q37_1>=1]
Combination refrigerator / freezer unit [DISPLAY IF Q37_1>1, “#1”]
2. [DISPLAY ROW IF Q37_3>=2]
Combination refrigerator / freezer unit #2
3. [DISPLAY ROW IF Q37_2>=1]
Refrigerator-only unit [DISPLAY IF Q37_2>1, “#1”]
4. [DISPLAY ROW IF Q37_2>=2]
Refrigerator-only unit #2
5. [DISPLAY ROW IF Q37_3>=1]
Freezer-only unit [DISPLAY IF Q37_3>1, “#1”]
6. [DISPLAY ROW IF Q37_3>=2]
Freezer-only unit #2
7. [DISPLAY ROW IF Q33_3>=1]
Dishwasher
8. [DISPLAY ROW IF Q33_4>=1]
Clothes washer
10. None of the above [EXCLUSIVE]
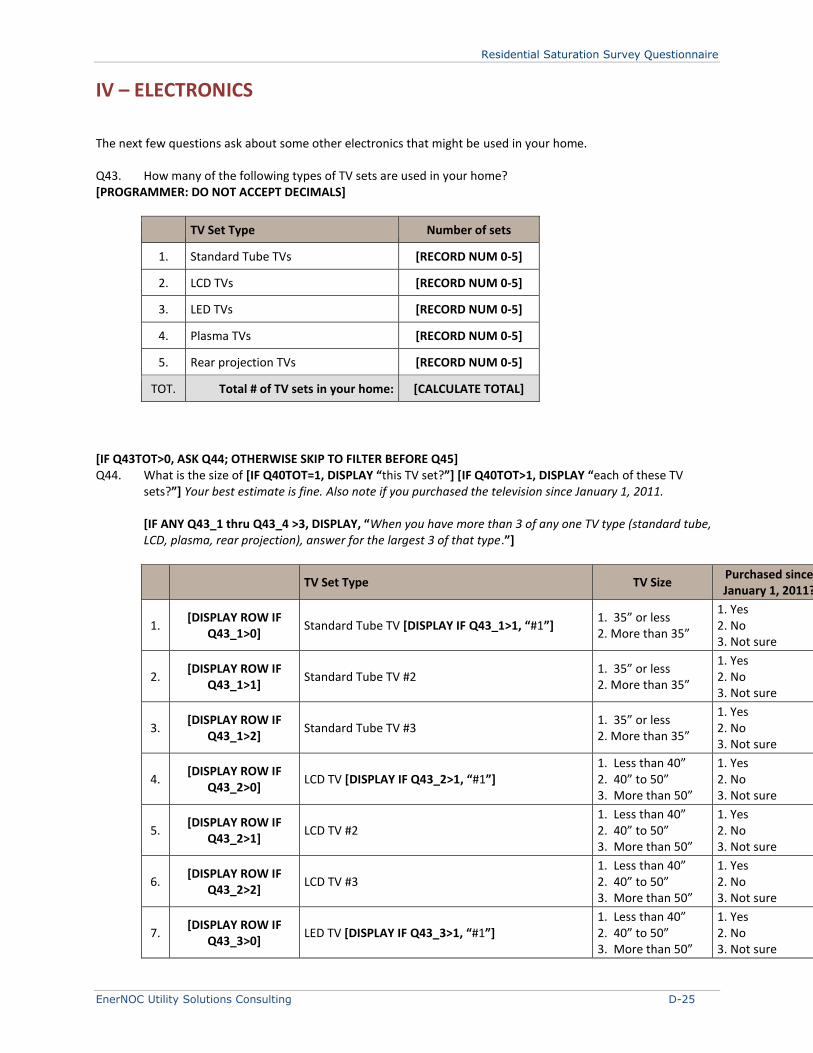
Residential Saturation Survey Questionnaire
EnerNOC Utility Solutions Consulting D-25
IV – ELECTRONICS
The next few questions ask about some other electronics that might be used in your home. Q43. How many of the following types of TV sets are used in your home? [PROGRAMMER: DO NOT ACCEPT DECIMALS]
TV Set Type Number of sets
1. Standard Tube TVs [RECORD NUM 0-5]
2. LCD TVs [RECORD NUM 0-5]
3. LED TVs [RECORD NUM 0-5]
4. Plasma TVs [RECORD NUM 0-5]
5. Rear projection TVs [RECORD NUM 0-5]
TOT. Total # of TV sets in your home: [CALCULATE TOTAL]
[IF Q43TOT>0, ASK Q44; OTHERWISE SKIP TO FILTER BEFORE Q45] Q44. What is the size of [IF Q40TOT=1, DISPLAY “this TV set?”] [IF Q40TOT>1, DISPLAY “each of these TV
sets?”] Your best estimate is fine. Also note if you purchased the television since January 1, 2011.
[IF ANY Q43_1 thru Q43_4 >3, DISPLAY, “When you have more than 3 of any one TV type (standard tube, LCD, plasma, rear projection), answer for the largest 3 of that type.”]
TV Set Type TV Size Purchased since January 1, 2011?
1. [DISPLAY ROW IF
Q43_1>0] Standard Tube TV [DISPLAY IF Q43_1>1, “#1”]
1. 35” or less 2. More than 35”
1. Yes 2. No 3. Not sure
2. [DISPLAY ROW IF
Q43_1>1] Standard Tube TV #2
1. 35” or less 2. More than 35”
1. Yes 2. No 3. Not sure
3. [DISPLAY ROW IF
Q43_1>2] Standard Tube TV #3
1. 35” or less 2. More than 35”
1. Yes 2. No 3. Not sure
4. [DISPLAY ROW IF
Q43_2>0] LCD TV [DISPLAY IF Q43_2>1, “#1”]
1. Less than 40” 2. 40” to 50” 3. More than 50”
1. Yes 2. No 3. Not sure
5. [DISPLAY ROW IF
Q43_2>1] LCD TV #2
1. Less than 40” 2. 40” to 50” 3. More than 50”
1. Yes 2. No 3. Not sure
6. [DISPLAY ROW IF
Q43_2>2] LCD TV #3
1. Less than 40” 2. 40” to 50” 3. More than 50”
1. Yes 2. No 3. Not sure
7. [DISPLAY ROW IF
Q43_3>0] LED TV [DISPLAY IF Q43_3>1, “#1”]
1. Less than 40” 2. 40” to 50” 3. More than 50”
1. Yes 2. No 3. Not sure
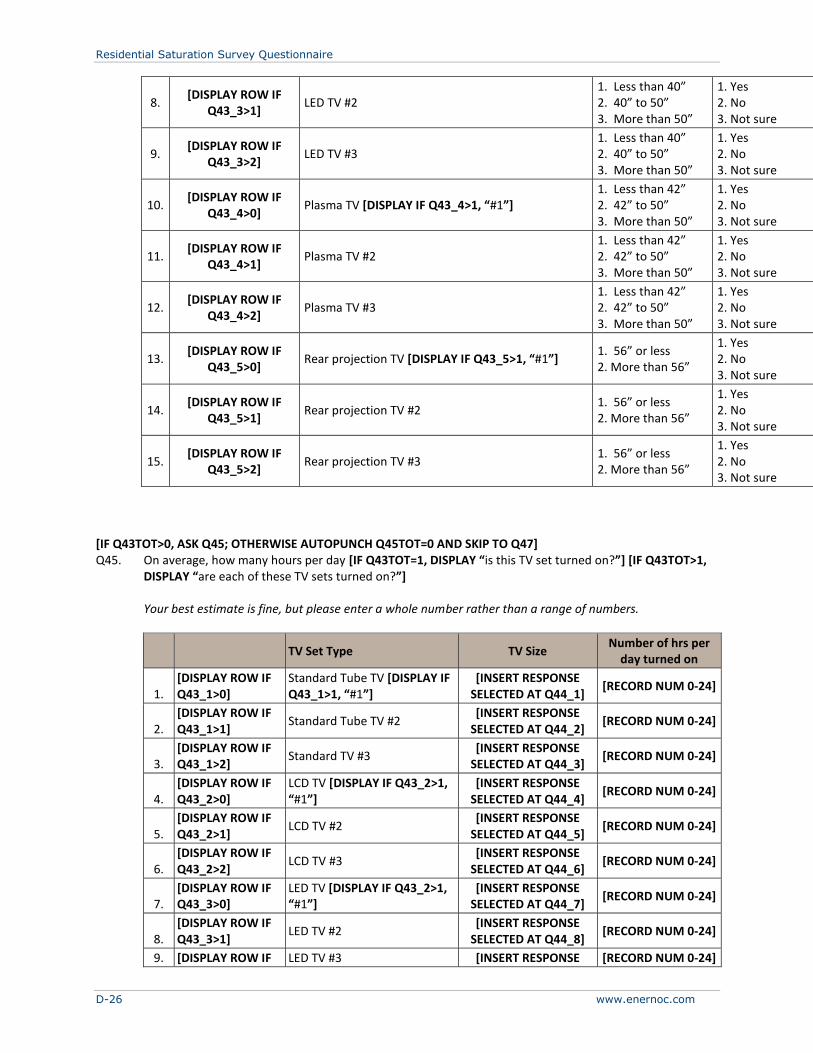
Residential Saturation Survey Questionnaire
D-26 www.enernoc.com
8. [DISPLAY ROW IF
Q43_3>1] LED TV #2
1. Less than 40” 2. 40” to 50” 3. More than 50”
1. Yes 2. No 3. Not sure
9. [DISPLAY ROW IF
Q43_3>2] LED TV #3
1. Less than 40” 2. 40” to 50” 3. More than 50”
1. Yes 2. No 3. Not sure
10. [DISPLAY ROW IF
Q43_4>0] Plasma TV [DISPLAY IF Q43_4>1, “#1”]
1. Less than 42” 2. 42” to 50” 3. More than 50”
1. Yes 2. No 3. Not sure
11. [DISPLAY ROW IF
Q43_4>1] Plasma TV #2
1. Less than 42” 2. 42” to 50” 3. More than 50”
1. Yes 2. No 3. Not sure
12. [DISPLAY ROW IF
Q43_4>2] Plasma TV #3
1. Less than 42” 2. 42” to 50” 3. More than 50”
1. Yes 2. No 3. Not sure
13. [DISPLAY ROW IF
Q43_5>0] Rear projection TV [DISPLAY IF Q43_5>1, “#1”]
1. 56” or less 2. More than 56”
1. Yes 2. No 3. Not sure
14. [DISPLAY ROW IF
Q43_5>1] Rear projection TV #2
1. 56” or less 2. More than 56”
1. Yes 2. No 3. Not sure
15. [DISPLAY ROW IF
Q43_5>2] Rear projection TV #3
1. 56” or less 2. More than 56”
1. Yes 2. No 3. Not sure
[IF Q43TOT>0, ASK Q45; OTHERWISE AUTOPUNCH Q45TOT=0 AND SKIP TO Q47] Q45. On average, how many hours per day [IF Q43TOT=1, DISPLAY “is this TV set turned on?”] [IF Q43TOT>1,
DISPLAY “are each of these TV sets turned on?”]
Your best estimate is fine, but please enter a whole number rather than a range of numbers.
TV Set Type TV Size Number of hrs per
day turned on
1. [DISPLAY ROW IF Q43_1>0]
Standard Tube TV [DISPLAY IF Q43_1>1, “#1”]
[INSERT RESPONSE SELECTED AT Q44_1]
[RECORD NUM 0-24]
2. [DISPLAY ROW IF Q43_1>1]
Standard Tube TV #2 [INSERT RESPONSE
SELECTED AT Q44_2] [RECORD NUM 0-24]
3. [DISPLAY ROW IF Q43_1>2]
Standard TV #3 [INSERT RESPONSE
SELECTED AT Q44_3] [RECORD NUM 0-24]
4. [DISPLAY ROW IF Q43_2>0]
LCD TV [DISPLAY IF Q43_2>1, “#1”]
[INSERT RESPONSE SELECTED AT Q44_4]
[RECORD NUM 0-24]
5. [DISPLAY ROW IF Q43_2>1]
LCD TV #2 [INSERT RESPONSE
SELECTED AT Q44_5] [RECORD NUM 0-24]
6. [DISPLAY ROW IF Q43_2>2]
LCD TV #3 [INSERT RESPONSE
SELECTED AT Q44_6] [RECORD NUM 0-24]
7. [DISPLAY ROW IF Q43_3>0]
LED TV [DISPLAY IF Q43_2>1, “#1”]
[INSERT RESPONSE SELECTED AT Q44_7]
[RECORD NUM 0-24]
8. [DISPLAY ROW IF Q43_3>1]
LED TV #2 [INSERT RESPONSE
SELECTED AT Q44_8] [RECORD NUM 0-24]
9. [DISPLAY ROW IF LED TV #3 [INSERT RESPONSE [RECORD NUM 0-24]

Residential Saturation Survey Questionnaire
EnerNOC Utility Solutions Consulting D-27
Q43_3>2] SELECTED AT Q44_9]
10. [DISPLAY ROW IF Q43_4>0]
Plasma TV [DISPLAY IF Q43_3>1, “#1”]
[INSERT RESPONSE SELECTED AT Q44_10]
[RECORD NUM 0-24]
11. [DISPLAY ROW IF Q43_4>1]
Plasma TV #2 [INSERT RESPONSE
SELECTED AT Q44_11] [RECORD NUM 0-24]
12. [DISPLAY ROW IF Q43_4>2]
Plasma TV #3 [INSERT RESPONSE
SELECTED AT Q44_12] [RECORD NUM 0-24]
13. [DISPLAY ROW IF Q43_5>0]
Rear projection TV [DISPLAY IF Q43_4>1, “#1”]
[INSERT RESPONSE SELECTED AT Q44_13]
[RECORD NUM 0-24]
14. [DISPLAY ROW IF Q43_5>1]
Rear projection TV #2 [INSERT RESPONSE
SELECTED AT Q44_14] [RECORD NUM 0-24]
15. [DISPLAY ROW IF Q43_5>2]
Rear projection TV #3 [INSERT RESPONSE
SELECTED AT Q44_15] [RECORD NUM 0-24]
TOT. [DISPLAY ROW IF Q43TOT>1]
Total # of hours per day a TV is turned on in your home:
[CALCULATE TOTAL]
Q46. [IF Q43TOT=1, DISPLAY “Is this TV set an ENERGY STAR TV set?”] [IF Q43TOT>1, DISPLAY “Are any of
these TV sets ENERGY STAR TV sets?”]
ENERGY STAR?
TV Set Type TV Size
Yes No Not sure
1. [DISPLAY ROW IF
Q43_1>0] Standard Tube TV [DISPLAY IF Q43_1>1, “#1”]
[INSERT RESPONSE SELECTED AT Q44_1]
2. [DISPLAY ROW IF
Q43_1>1] Standard Tube TV #2
[INSERT RESPONSE SELECTED AT Q44_2]
3. [DISPLAY ROW IF
Q43_1>2] Standard TV #3
[INSERT RESPONSE SELECTED AT Q44_3]
4. [DISPLAY ROW IF
Q43_2>0] LCD TV [DISPLAY IF Q43_2>1, “#1”]
[INSERT RESPONSE SELECTED AT Q44_4]
5. [DISPLAY ROW IF
Q43_2>1] LCD TV #2
[INSERT RESPONSE SELECTED AT Q44_5]
6. [DISPLAY ROW IF
Q43_2>2] LCD TV #3
[INSERT RESPONSE SELECTED AT Q44_6]
7. [DISPLAY ROW IF
Q43_3>0] LED TV [DISPLAY IF Q43_3>1, “#1”]
[INSERT RESPONSE SELECTED AT Q44_7]
8. [DISPLAY ROW IF
Q43_3>1] LED TV #2
[INSERT RESPONSE SELECTED AT Q44_8]
9. [DISPLAY ROW IF
Q43_3>2] LED TV #3
[INSERT RESPONSE SELECTED AT Q44_9]
10. [DISPLAY ROW IF
Q43_4>0] Plasma TV [DISPLAY IF Q43_4>1, “#1”]
[INSERT RESPONSE SELECTED AT Q44_10]
11. [DISPLAY ROW IF
Q43_4>1] Plasma TV #2
[INSERT RESPONSE SELECTED AT Q44_11]
12. [DISPLAY ROW IF
Q43_4>2] Plasma TV #3
[INSERT RESPONSE SELECTED AT Q44_12]
13. [DISPLAY ROW IF
Q43_5>0] Rear projection TV [DISPLAY IF Q43_5>1, “#1”]
[INSERT RESPONSE SELECTED AT Q44_13]
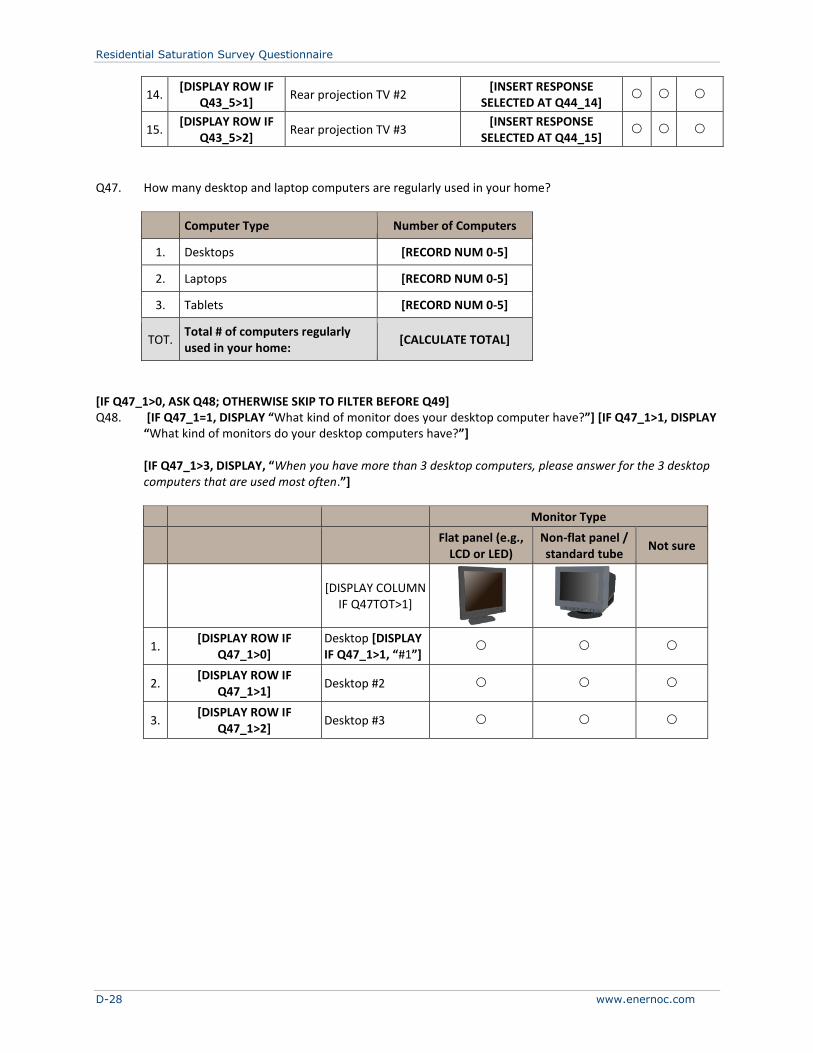
Residential Saturation Survey Questionnaire
D-28 www.enernoc.com
14. [DISPLAY ROW IF
Q43_5>1] Rear projection TV #2
[INSERT RESPONSE SELECTED AT Q44_14]
15. [DISPLAY ROW IF
Q43_5>2] Rear projection TV #3
[INSERT RESPONSE SELECTED AT Q44_15]
Q47. How many desktop and laptop computers are regularly used in your home?
Computer Type Number of Computers
1. Desktops [RECORD NUM 0-5]
2. Laptops [RECORD NUM 0-5]
3. Tablets [RECORD NUM 0-5]
TOT. Total # of computers regularly used in your home:
[CALCULATE TOTAL]
[IF Q47_1>0, ASK Q48; OTHERWISE SKIP TO FILTER BEFORE Q49] Q48. [IF Q47_1=1, DISPLAY “What kind of monitor does your desktop computer have?”] [IF Q47_1>1, DISPLAY
“What kind of monitors do your desktop computers have?”] [IF Q47_1>3, DISPLAY, “When you have more than 3 desktop computers, please answer for the 3 desktop
computers that are used most often.”]
Monitor Type
Flat panel (e.g.,
LCD or LED) Non-flat panel / standard tube
Not sure
[DISPLAY COLUMN
IF Q47TOT>1]
1. [DISPLAY ROW IF
Q47_1>0] Desktop [DISPLAY IF Q47_1>1, “#1”]
2. [DISPLAY ROW IF
Q47_1>1] Desktop #2
3. [DISPLAY ROW IF
Q47_1>2] Desktop #3
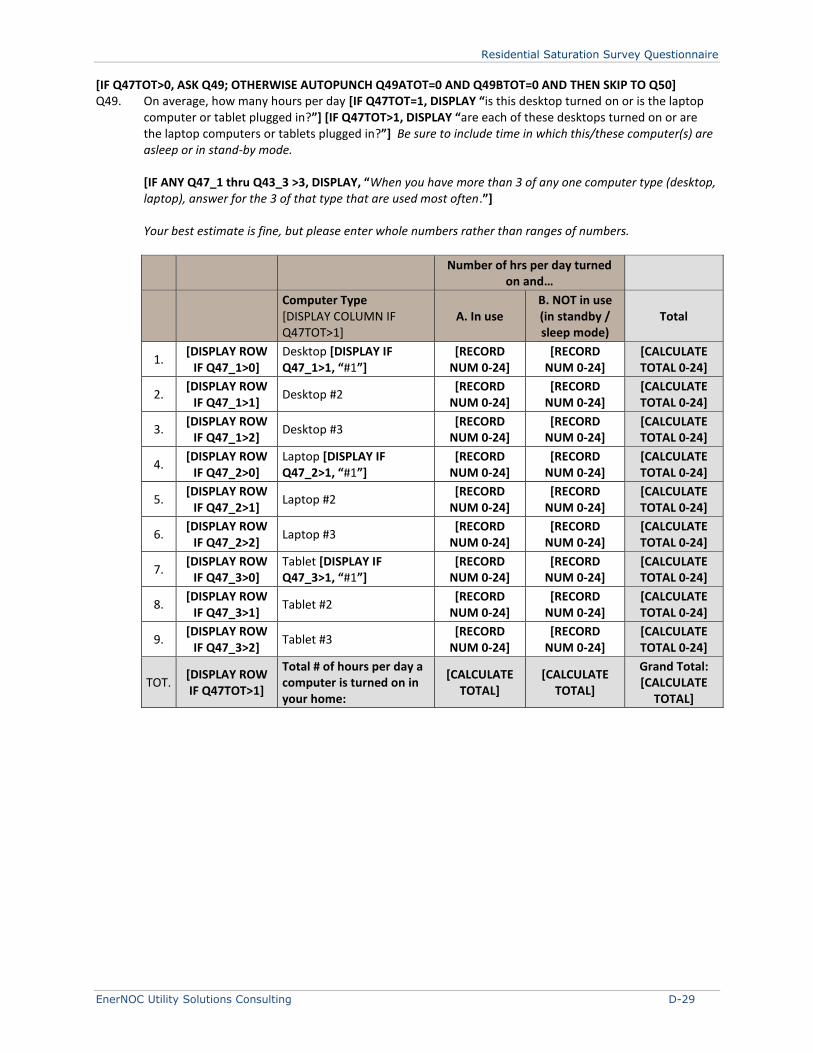
Residential Saturation Survey Questionnaire
EnerNOC Utility Solutions Consulting D-29
[IF Q47TOT>0, ASK Q49; OTHERWISE AUTOPUNCH Q49ATOT=0 AND Q49BTOT=0 AND THEN SKIP TO Q50] Q49. On average, how many hours per day [IF Q47TOT=1, DISPLAY “is this desktop turned on or is the laptop
computer or tablet plugged in?”] [IF Q47TOT>1, DISPLAY “are each of these desktops turned on or are the laptop computers or tablets plugged in?”] Be sure to include time in which this/these computer(s) are asleep or in stand-by mode.
[IF ANY Q47_1 thru Q43_3 >3, DISPLAY, “When you have more than 3 of any one computer type (desktop, laptop), answer for the 3 of that type that are used most often.”] Your best estimate is fine, but please enter whole numbers rather than ranges of numbers.
Number of hrs per day turned
on and…
Computer Type [DISPLAY COLUMN IF Q47TOT>1]
A. In use B. NOT in use (in standby / sleep mode)
Total
1. [DISPLAY ROW
IF Q47_1>0] Desktop [DISPLAY IF Q47_1>1, “#1”]
[RECORD NUM 0-24]
[RECORD NUM 0-24]
[CALCULATE TOTAL 0-24]
2. [DISPLAY ROW
IF Q47_1>1] Desktop #2
[RECORD NUM 0-24]
[RECORD NUM 0-24]
[CALCULATE TOTAL 0-24]
3. [DISPLAY ROW
IF Q47_1>2] Desktop #3
[RECORD NUM 0-24]
[RECORD NUM 0-24]
[CALCULATE TOTAL 0-24]
4. [DISPLAY ROW
IF Q47_2>0] Laptop [DISPLAY IF Q47_2>1, “#1”]
[RECORD NUM 0-24]
[RECORD NUM 0-24]
[CALCULATE TOTAL 0-24]
5. [DISPLAY ROW
IF Q47_2>1] Laptop #2
[RECORD NUM 0-24]
[RECORD NUM 0-24]
[CALCULATE TOTAL 0-24]
6. [DISPLAY ROW
IF Q47_2>2] Laptop #3
[RECORD NUM 0-24]
[RECORD NUM 0-24]
[CALCULATE TOTAL 0-24]
7. [DISPLAY ROW
IF Q47_3>0] Tablet [DISPLAY IF Q47_3>1, “#1”]
[RECORD NUM 0-24]
[RECORD NUM 0-24]
[CALCULATE TOTAL 0-24]
8. [DISPLAY ROW
IF Q47_3>1] Tablet #2
[RECORD NUM 0-24]
[RECORD NUM 0-24]
[CALCULATE TOTAL 0-24]
9. [DISPLAY ROW
IF Q47_3>2] Tablet #3
[RECORD NUM 0-24]
[RECORD NUM 0-24]
[CALCULATE TOTAL 0-24]
TOT. [DISPLAY ROW IF Q47TOT>1]
Total # of hours per day a computer is turned on in your home:
[CALCULATE TOTAL]
[CALCULATE TOTAL]
Grand Total: [CALCULATE
TOTAL]
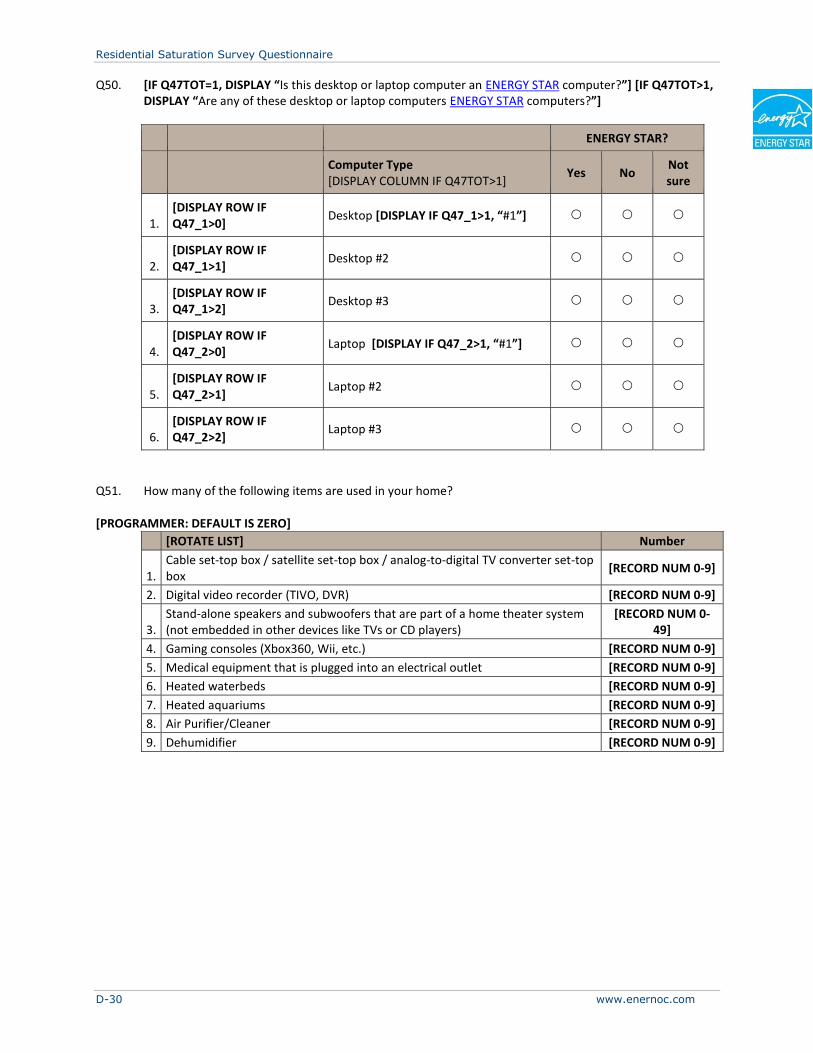
Residential Saturation Survey Questionnaire
D-30 www.enernoc.com
Q50. [IF Q47TOT=1, DISPLAY “Is this desktop or laptop computer an ENERGY STAR computer?”] [IF Q47TOT>1, DISPLAY “Are any of these desktop or laptop computers ENERGY STAR computers?”]
ENERGY STAR?
Computer Type [DISPLAY COLUMN IF Q47TOT>1]
Yes No Not sure
1. [DISPLAY ROW IF Q47_1>0]
Desktop [DISPLAY IF Q47_1>1, “#1”]
2. [DISPLAY ROW IF Q47_1>1]
Desktop #2
3. [DISPLAY ROW IF Q47_1>2]
Desktop #3
4. [DISPLAY ROW IF Q47_2>0]
Laptop [DISPLAY IF Q47_2>1, “#1”]
5. [DISPLAY ROW IF Q47_2>1]
Laptop #2
6. [DISPLAY ROW IF Q47_2>2]
Laptop #3
Q51. How many of the following items are used in your home? [PROGRAMMER: DEFAULT IS ZERO]
[ROTATE LIST] Number
1. Cable set-top box / satellite set-top box / analog-to-digital TV converter set-top box
[RECORD NUM 0-9]
2. Digital video recorder (TIVO, DVR) [RECORD NUM 0-9]
3. Stand-alone speakers and subwoofers that are part of a home theater system (not embedded in other devices like TVs or CD players)
[RECORD NUM 0-49]
4. Gaming consoles (Xbox360, Wii, etc.) [RECORD NUM 0-9]
5. Medical equipment that is plugged into an electrical outlet [RECORD NUM 0-9]
6. Heated waterbeds [RECORD NUM 0-9]
7. Heated aquariums [RECORD NUM 0-9]
8. Air Purifier/Cleaner [RECORD NUM 0-9]
9. Dehumidifier [RECORD NUM 0-9]
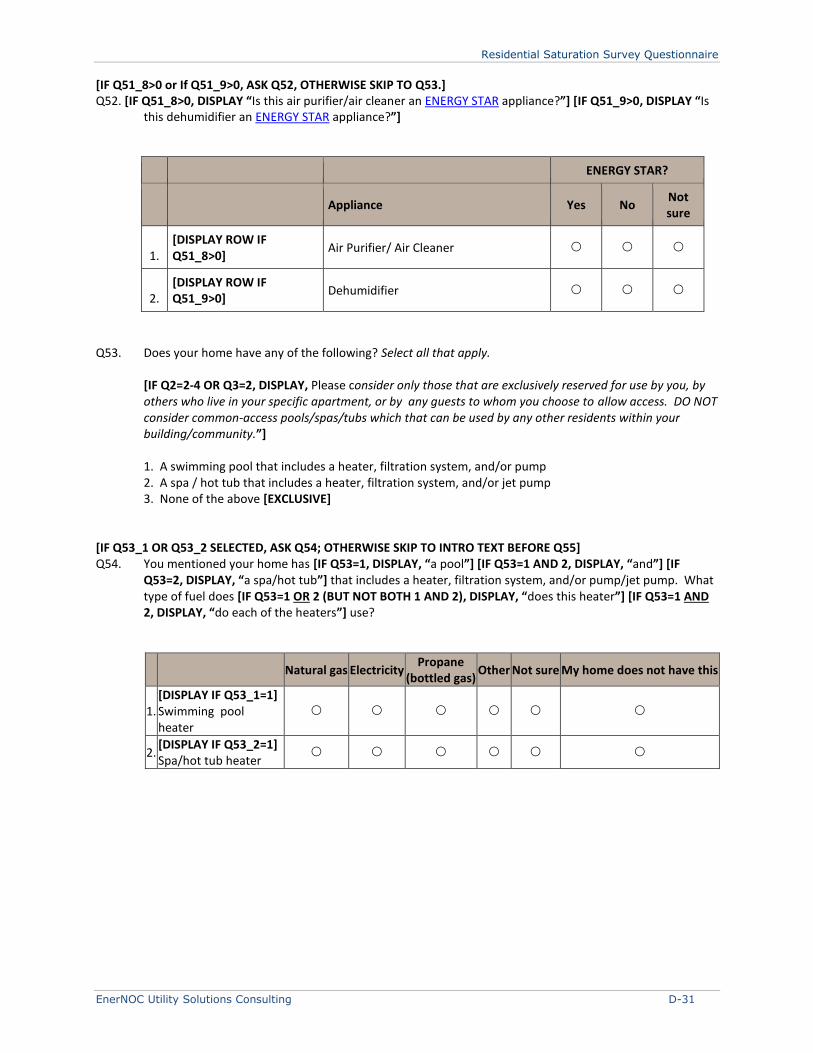
Residential Saturation Survey Questionnaire
EnerNOC Utility Solutions Consulting D-31
[IF Q51_8>0 or If Q51_9>0, ASK Q52, OTHERWISE SKIP TO Q53.] Q52. [IF Q51_8>0, DISPLAY “Is this air purifier/air cleaner an ENERGY STAR appliance?”] [IF Q51_9>0, DISPLAY “Is
this dehumidifier an ENERGY STAR appliance?”]
ENERGY STAR?
Appliance Yes No Not sure
1. [DISPLAY ROW IF Q51_8>0]
Air Purifier/ Air Cleaner
2. [DISPLAY ROW IF Q51_9>0]
Dehumidifier
Q53. Does your home have any of the following? Select all that apply.
[IF Q2=2-4 OR Q3=2, DISPLAY, Please consider only those that are exclusively reserved for use by you, by others who live in your specific apartment, or by any guests to whom you choose to allow access. DO NOT consider common-access pools/spas/tubs which that can be used by any other residents within your building/community.”]
1. A swimming pool that includes a heater, filtration system, and/or pump 2. A spa / hot tub that includes a heater, filtration system, and/or jet pump 3. None of the above [EXCLUSIVE]
[IF Q53_1 OR Q53_2 SELECTED, ASK Q54; OTHERWISE SKIP TO INTRO TEXT BEFORE Q55] Q54. You mentioned your home has [IF Q53=1, DISPLAY, “a pool”] [IF Q53=1 AND 2, DISPLAY, “and”] [IF
Q53=2, DISPLAY, “a spa/hot tub”] that includes a heater, filtration system, and/or pump/jet pump. What type of fuel does [IF Q53=1 OR 2 (BUT NOT BOTH 1 AND 2), DISPLAY, “does this heater”] [IF Q53=1 AND 2, DISPLAY, “do each of the heaters”] use?
Natural gas Electricity Propane
(bottled gas) Other Not sure My home does not have this
1. [DISPLAY IF Q53_1=1] Swimming pool heater
2. [DISPLAY IF Q53_2=1] Spa/hot tub heater

Residential Saturation Survey Questionnaire
D-32 www.enernoc.com
V – ENERGY-RELATED ACTIONS
The next few questions ask you about some actions you might have taken which may affect the amount of energy your home uses. Q55. Which, if any, of the following home improvement / remodeling efforts have you or a previous [IF S4=2,
DISPLAY, “or current”] owner made in the last 5 years? Select all that apply. [IF Q2=2-4 OR Q3=2, DISPLAY, “Please answer only for your particular apartment / unit.”]
1. Enhanced insulation of ducts
2. Enhanced insulation of ceiling
3. Enhanced insulation of walls
4. Enhanced insulation of attic
5. Enhanced insulation of the foundation
6. Enhanced water pipe insulation
7. Installed low-flow showerheads
8. Installed low-flow faucet aerators
9. Installed a furnace with a brushless permanent magnet (BPM) furnace blower motor
10. Installed a high efficiency bathroom exhaust fan
11. Weather stripped/caulked windows and/or doors
12. Installed storm doors
13. None of the above [EXCLUSIVE]
NEWQ56A. Which, if any, of the following actions are you currently taking in your home? NEWQ56B. [ASK ONLY FOR ITEMS NOT SELECTED IN Q56A] You indicated that you are not currently
doing the following. Please tell us if it would physically be possible for you to do the item. For example, if you do not have a clothes dryer, you could NOT use a dryer that has a sensor that turns the dryer off when the clothes are dry.
[ROTATE 1-7] [A] Currently
doing this [B} Could
do this
1. Use a “Smart strip” power strip to turn off electronic equipment when it’s not in use
2. Unplug battery rechargers (e.g., for laptops, cell phones, MP3 players) when they are not being used
3. Perform annual maintenance on your HVAC (heating, ventilation, or air conditioning) equipment
4. Use a water heater insulation blanket/jacket
5. Lower the water heater temperature to 125 degrees F
6. Use a clothes dryer that has a sensor that turns the dryer off when the clothes are dry
7. Regularly turn out the lights when leaving a room
8. None of the above [EXCLUSIVE – DO NOT CARRY TO B SCREEN]

Residential Saturation Survey Questionnaire
EnerNOC Utility Solutions Consulting D-33
VI – UTILITY PROGRAMS
Q57. Some utilities offer rebate, low interest loan or price discount programs to encourage people to purchase
highly energy efficient products such as appliances, furnaces, heat pumps, water heaters, compact fluorescent light bulbs (CFLs), and home insulation.
To the best of your knowledge, does Ameren Illinois offer any such programs that offer customers like you a discount off the purchase price on qualified items?
1. Yes 2. No 3. Not sure [IF Q57=1 ASK Q58, OTHERWISE SKIP TO Q59] Q58. Are you aware of any of the following programs offered by Ameren Illinois? Has your household
participated in any of the following programs in the past 3 years?
Energy Efficiency Program [RANDOMIZE]
A. Aware of program
B. Participated in the last 3 years
1. Appliance Recycling – Room Air Conditioner
2. Appliance Recycling – Refrigerator
3. Appliance Recycling – Freezer
4. Home Energy Performance (HEP)
5. HVAC New Cooling Equipment
6. Lighting discounts online or through a retailer
7. ENERGY STAR New Homes Construction
8. Appliance Rebate – Air Purifier
9. Appliance Rebate – Dehumidifier
10. Appliance Rebate – Room Air Conditioner
11. Appliance Rebate – Heat Pump Water Heater
12. Appliance Rebate – Smart Strip
13. Appliance Rebate – Thermostat
14. Appliance Rebate – Setback Thermostat
15. Appliance Rebate – High Efficiency Gas Water Heater
990. Other program(s) [SPECIFY]
998. NONE [EXCLUSIVE]
[IF 58B SELECTED, AUTOFILL 58A AS SELECTED] [NOTE: CANNOT RANDOMIZE THIS ONE WITHOUT SPLITTING OUT INTO TWO SCREENS]
Residential Saturation Survey Questionnaire
D-34 www.enernoc.com
VII – ADDITIONAL HOUSEHOLD DEMOGRAPHICS
In order to help us classify your responses, the last few questions are on your household’s characteristics. Q59. Does anyone in your household regularly telecommute or work from home during the day on weekdays?
1. Yes 0. No
[IF Q59=1, ASK Q60; OTHERWISE SKIP TO Q61] Q60. On average, how many weekdays does anyone in your household work from home each week?
1. 1 weekday 2. 2 weekdays 3. 3 weekdays 4. 4 weekdays 5. 5 weekdays
Q61. [IF Q59=1, DISPLAY, “Other than those that work from home or telecommute, are”] [IF Q59=0, DISPLAY,
“Are’] there any individuals in your home that regularly stay at home all or most weekdays?
1. Yes 0. No
[IF Q1>1, ASK Q62; OTHERWISE AUTOCODE Q62_5=1 AND SKIP TO Q63] Q62. Of the [INSERT (Q1 RESPONSE MINUS 1)] individuals that currently live in your household besides
yourself, how many are children younger than 18 years old? Select all that apply.
1. Birth to 2 years old [RECORD NUMBER 0-10] 2. 3 to 6 years old [RECORD NUMBER 0-10] 3. 7 to 12 years old [RECORD NUMBER 0-10] 4. 13 to 17 years old [RECORD NUMBER 0-10] 5. There are no children younger than 18 years old in my household. [EXCLUSIVE] [TOTAL OF Q62_1 through Q62_4 MUST BE LESS THAN (Q1 RESPONSE MINUS 1)]
Q63. Which of the following best characterizes the city / town / community in which you live?
1. Urban 2. Suburban 3. Rural
Q64. What is your gender? 1. Male 2. Female
Q65. What is the highest level of education you have completed?

Residential Saturation Survey Questionnaire
EnerNOC Utility Solutions Consulting D-35
1. Less than a high school degree 2. High school degree 3. Technical/trade school program 4. Associates degree or some college 5. Bachelors degree 6. Graduate / professional degree, e.g., J.D., MBA, MD, etc. 7. Professional certification, e.g., CPA, CNP, etc.
Q66. What is your current work status? 1. Employed full-time 2. Employed part-time 3. Not currently employed 4. Retired 990. Other [SPECIFY]
Q67. Which of the following categories includes your household’s total annual income before taxes in 2011?
Please include the income of all people living in your home in this figure.
1. Less than $60,000 2. $60,000 or more
Q68. Which of the following categories includes your household’s total annual income before taxes in 2011?
Please include the income of all people living in your home in this figure. [IF Q67=1, DISPLAY OPTIONS 1-7 AND 13; IF Q67=2, DISPLAY OPTIONS 8-13] 1. Less than $10,000 2. $10,000 – $14,999 3. $15,000 – $19,999 4. $20,000 – $29,999 5. $30,000 – $39,999 6. $40,000 –$49,999 7. $50,000 – $59,999 8. $60,000 – $74,999 9. $75,000 – $99,999 10. $100,000 – $124,999 11. $125,000 – $149,999 12. $150,000 or more 13. Prefer not to say
Residential Saturation Survey Questionnaire
D-36 www.enernoc.com
Q69. How many vehicles are used in your household? By ‘vehicles’ we mean cars, trucks and SUV’s.
1. One 2. Two 3. Three 4. Four or more 0. None
[If Q69=1-4, ASK Q70, OTHERWISE SKIP to Q72] Q70. What type of vehicle do you drive?
Conventional
gasoline Natural gas Diesel
HEV - A hybrid using gas & an electric battery as fuel
(Prius, etc.)
PHEV - Hybrid using gas and a plug-in rechargeable battery (Chevy Volt, etc.)
BEV - All electric
(Tesla, Leaf, etc.)
Other
1. [DISPLAY IF Q69=1-4] Car #1
2. [DISPLAY IF Q69=2-4] Car #2
3. [DISPLAY IF Q69=3-4] Car #3
4. [DISPLAY IF Q69=4-4] Car #4
Q71. What type of car are you considering for your next purchase? Select the one you are most likely going to
purchase.
1. Conventional gasoline 2. Diesel 3. Natural gas 4. Gas/electric hybrid, such as a Prius 5. Plug-in electric, such as a Volt 6. All electric vehicle, such as the Leaf or Tesla 7. Other (please specify) 8. Not sure / Not considering a purchase at this time
Residential Saturation Survey Questionnaire
EnerNOC Utility Solutions Consulting D-37
Q72. Which of the following best describes your race or ethnic background? 1. White, Caucasian 2. Black, African American, Caribbean American 3. American Indian (Native American), Alaska Native 4. Asian 6. Hispanic, Latino 5. Native Hawaiian, Pacific Islander 990. Other [SPECIFY] 7. Prefer not to say

Residential Saturation Survey Questionnaire
D-38 www.enernoc.com
VIII - CONCLUSION
[INCENTIVE NAME/ADDRESS COLLECTION SCREEN] Those are all the questions we have for you today. Thanks for your participation!
Please click ‘Continue’ to proceed to the payment screen.
C0. Please indicate which of the following you would prefer:
4. Please email me a $10 Amazon Gift Card 5. I would prefer to have a $10 check mailed to me 6. I would like to decline and not receive an incentive [IF C0=1, ASK C1; IF C0=2, ASK C2; IF C0=3, ASK C0A]
COA. You have indicated that you do NOT want to receive your $10 payment. Is that correct?
3. Yes 4. No
[IF YES, GO TO THANK YOU SCREEN; IF NO, RE-ASK C0] C1. So that we may mail your incentive to you, please provide your name and address below.
A. Full name
C. Mailing Address Line #1
D. Mailing Address Line #2 (optional)
E. City
F. State
G. ZIP Code
C1. So that we may email your incentive to you, please provide your email address below.
[RECORD EMAIL ADDRESS –VALIDATE FOR FORMAT] [INCENTIVE NAME/ADDRESS VERIFICATION SCREEN] Please review the information you provided and verify that it is complete and correct:
[DISPLAY ALL NAME AND ADDRESS OR EMAIL INFORMATION COLLECTED] If you would like to edit any of this information, please click the “Back” button to go to the previous screen, where you can make any needed changes. Otherwise, please click “Continue” to submit your information. [PROGRAMMER: INCLUDE BACK BUTTON FOR THIS SCREEN DURING LIVE VERSION]
Residential Saturation Survey Questionnaire
EnerNOC Utility Solutions Consulting D-39
[IF CHOOSE TO RECEIVE AN INCENTIVE, DISPLAY:] You have successfully submitted the information we need so we can send you your $10 thank you gift. Your check or gift card will be issued within 4-6 weeks to the address or email address you provided. Thank you and have a nice day! If you would like information on how your household can save money on energy bills, please visit Ameren Illinois at
www.actonenergy.com
[IF CHOOSE NOT TO RECEIVE AN INCENTIVE, DISPLAY:] Thank you for taking the time to answer our survey questions. Have a nice day! If you would like information on how your household can save money on energy bills, please visit Ameren Illinois at
www.actonenergy.com
SURVEY CLOSED MESSAGE
We truly appreciate your time and effort in responding to the survey invitation you received, but the survey sponsored by Ameren Illinois is now closed. In order to achieve a representative sample for this survey, quotas with specific criteria needed to be designated. Because these quotas have now been filled, we are not accepting any more responses.
If you would like information on how your home can save money on your energy bills, please visit us at
http://www.actonenergy.com/.
Thank you. Have a nice day!
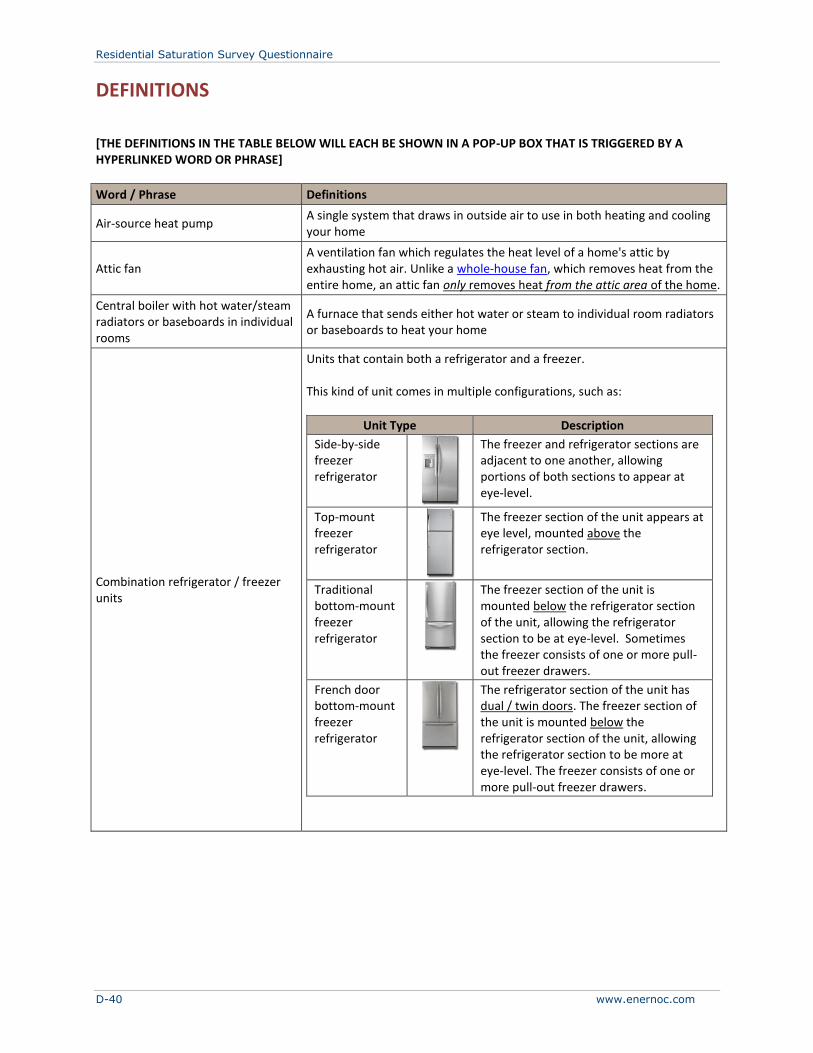
Residential Saturation Survey Questionnaire
D-40 www.enernoc.com
DEFINITIONS
[THE DEFINITIONS IN THE TABLE BELOW WILL EACH BE SHOWN IN A POP-UP BOX THAT IS TRIGGERED BY A HYPERLINKED WORD OR PHRASE]
Word / Phrase Definitions
Air-source heat pump A single system that draws in outside air to use in both heating and cooling your home
Attic fan A ventilation fan which regulates the heat level of a home's attic by exhausting hot air. Unlike a whole-house fan, which removes heat from the entire home, an attic fan only removes heat from the attic area of the home.
Central boiler with hot water/steam radiators or baseboards in individual rooms
A furnace that sends either hot water or steam to individual room radiators or baseboards to heat your home
Combination refrigerator / freezer units
Units that contain both a refrigerator and a freezer. This kind of unit comes in multiple configurations, such as:
Unit Type Description
Side-by-side freezer refrigerator
The freezer and refrigerator sections are adjacent to one another, allowing portions of both sections to appear at eye-level.
Top-mount freezer refrigerator
The freezer section of the unit appears at eye level, mounted above the refrigerator section.
Traditional bottom-mount freezer refrigerator
The freezer section of the unit is mounted below the refrigerator section of the unit, allowing the refrigerator section to be at eye-level. Sometimes the freezer consists of one or more pull-out freezer drawers.
French door bottom-mount freezer refrigerator
The refrigerator section of the unit has dual / twin doors. The freezer section of the unit is mounted below the refrigerator section of the unit, allowing the refrigerator section to be more at eye-level. The freezer consists of one or more pull-out freezer drawers.

Residential Saturation Survey Questionnaire
EnerNOC Utility Solutions Consulting D-41
Compact fluorescent lamp (CFL)
A newer type of light bulb that screws into a light socket, but which is a fluorescent light rather than a traditional incandescent light bulb, and which also often has a non-traditional shape for a light bulb
Conventional bulb / Incandescent lamp
A traditional screw-in light bulb that may range from 15 – 100 watts or more
Standard fluorescent tubes (T12) Traditional fluorescent tube lights with standard efficiency (T12) tubes
Higher than standard efficiency fluorescent tubes (T10)
Fluorescent tube lights that provide more light output than a T12. The T10 lights have a 1 ¼ inch diameter while the T12 lights have a larger diameter of 1 ½ inches.
High-efficiency fluorescent tubes (T8)
Newer fluorescent tubes (T8s) that fit into traditional fixtures, but which represent a more efficient (lower wattage) tube
Super high-efficiency fluorescent tubes (T5)
T5 lamps are high-efficiency fluorescent tubes. T5 lamps further increase efficiency from T8 fluorescent tubes by reducing the lamp diameter to 5/8”.
Conventional water heater with storage tank
A traditional water heater that heats a tank of hot water, and keeps that tank of water hot at all times. Most tanks range from 30-80 gallons in size.
Dimming switches Light switches that can work to dim lights, rather than simply turning them on and off
Double pane windows or better Window systems that have two or more layers of glass with an insulating layer of air (or special gas) added between the glass layers
Dusk-to-dawn sensors Electronic devices that use a light sensor (photocell) to automatically turn on outside lights at dusk and turn them off at dawn
Electric baseboard or electric coil radiant heating
Devices that use electricity directly to produce heat for your home from baseboards or under-floor heating.
ENERGY STAR A label for some new appliances that indicate that the appliance meets the standards for high efficiency appliances
Freezer-only units
Units that function only as freezers (i.e., do NOT function as refrigerators). This kind of unit comes in multiple configurations, such as:
Unit Type Description
Chest freezer
A freezer unit that opens from the top and often contains storage baskets.
Upright freezer
A freezer unit that opens from the front and contains shelf storage.
Geothermal heat pump A single system that uses water or fluid that circulates through underground piping to provide both heating and cooling for your home
Halogen lamp
A type of lamp which uses filaments like a traditional incandescent bulb, but is also filled with inert gas and a small amount of halogen. Compared to traditional incandescent bulbs, halogen lamps get hotter, give off light of a brighter / whiter quality, and have a longer life span.
Heat pump water heater A system that uses a refrigeration cycle in reverse to draw heat out of the

Residential Saturation Survey Questionnaire
D-42 www.enernoc.com
surrounding air to provide hot water in a traditional water heater storage tank
H.I.D. lamp (mercury vapor, metal halide, sodium vapor)
High power outside lights with special bulbs that are typically only used for outside lighting
LED lamp A “light emitting diode” lamp is an electronic form of lighting that does not use filaments like traditional incandescent bulbs, but instead, uses solid state electronics.
Low voltage lighting Low power lights (often used under counters or in other similar situations) that use a much lower wattage than do most traditional incandescent lights
Motion detectors Electronic devices that are used to control lights in a room so that when someone is moving in a room, the lights are on, but when there is no motion in the room for several minutes, the lights are turned off
Occupancy sensors Electronic devices that are used to control lights in a room so that when someone is present the lights are on, but where there is no one in the room for several minutes, the lights are turned off
Refrigerator-only units
Units that have only a refrigerator function (i.e., do NOT have a freezer function). They are much less common than freezer-only units. This kind of unit, which is sometimes called a freezerless refrigerator, comes in multiple configurations, such as:
Unit Type Description
Chest refrigerator
An all-refrigerator unit that opens from the top and often contains storage baskets.
Upright refrigerator
An all-refrigerator unit that opens from the front and contains shelf storage.
Single pane windows
Traditional windows that have only a single pane of glass, without any insulating layer of air, or anything else inserted inside the glass. Note that single pane windows may have reflective film or other additions applied to the single layer of glass.
Smart strip
Controlled Power Strips (or Smart Strips) which are multi-plug power strips with the ability to automatically disconnect specific connected loads depending upon the power draw of a “control” load, also plugged into the strip. For example, if a desktop computer is the control load, when it shuts down it might also disconnect an associated monitor, printer, and scanner, thereby reducing standby power loads. The same can be true for a television controlling a DVD, DVR, and audio system. Uncontrolled outlets are also provided on the strip that are not affected by the control device and so are always providing power to any device plugged into it.
Tankless (instantaneous/on demand) water heater
A water heater that only heats water for delivery to your home when you ask for it by using hot water. These systems do not keep a tank of water hot at all times.
Timers Timers are typically used to control lights, turning them on and off at specific
Residential Saturation Survey Questionnaire
EnerNOC Utility Solutions Consulting D-43
times of the day
Tubular fluorescent lamp Traditional fluorescent lights are generally tubes of 3 or more feet in length and are installed in special fixtures made specifically for these tubes
Wall furnace A furnace that works “through the wall,” meaning that it is a box that draws air directly from the outside and then warms it before sending the resulting warm air into a room.
Whole-house fan
A ventilation fan mounted in the ceiling of a central part of a home that removes heat from the entire home. It does this by first drawing that heat from the living areas of the home into the home’s attic, and then pushing the heat trapped in the attic to the outside through vents. Unlike an attic fan, which only removes heat from a home’s attic, a whole-house fan removes heat from the entire home.

EnerNOC Utility Solutions Consulting E-1
APPENDIX E
BUSINESS PROGRAM INTEREST SURVEY QUESTIONNAIRE
Ameren Illinois DSM Market Potential – Program Interest Questionnaire SMB
FINAL 7/26/2012
QUALIFYING CRITERIA AND QUOTAS
Qualifying Criteria
• The respondent must be knowledgeable about decision-making about energy issues for the business at the specified location
• Utility bills must be paid for that location
Hard Quotas Total: n=700
Additional sample groups to monitor during fielding
• MAIN QUOTA VARIABLE IS ‘Usage-Segment-Stratum’

Business Program Interest Survey Questionnaire
E-2 www.enernoc.com
RESPONDENT IDENTIFICATION / VERIFICATION
Welcome. This survey is sponsored by Ameren Illinois.
[PROGRAMMER: INCLUDE AMEREN ILLINOIS LOGO] Please enter the “Survey ID#” that appears on the survey invitation postcard you received. This Survey ID# should be located just above the mailing address on the front side of your postcard.
Survey ID# : ________________ We at Ameren Illinois and Definitive Insights value your privacy. We will use the information you provide for research purposes only and will NOT share it with third parties for marketing purposes. Information you provide will be stored in a secure database. If you have questions about our privacy practices or would like to get any other information about this study, please contact us via one of the following methods:
e-mail: [email protected]
phone: 1-888-742-4511
postal mail: Definitive Insights ATTN: Ameren Illinois Project Director 601 SW Oak Street Portland, Oregon 97205
[PROGRAMMER: VERIFY VALID CODE AND READ IN ALL VARIABLES FROM SAMPLE FILE]

Business Program Interest Survey Questionnaire
EnerNOC Utility Solutions Consulting E-3
INTRODUCTION
Thank you for taking time to see if you and your business qualify to participate in a new research study about energy. The study is sponsored by Ameren Illinois, and it has a very important purpose. Ameren Illinois is delivering programs to help its customers use energy more efficiently. Your answers to this survey will help the company to improve these programs so that they work best for everyone. Your business is one of a small number being asked to respond to the survey. To show our appreciation for your time and effort, we will send you $25 upon submitting your answers. (Note: Payment may be declined if required by your company’s policies.) You will first be asked a few questions to make sure your business qualifies for participation. If you do qualify, you will then be invited to complete the full survey.
Note: If you need to pause the survey at any time, you can come back later and begin again where you left off. Simply save the URL and the Survey ID# from your survey invitation to access your survey again. The survey will automatically take you to the point where you left off.
Please note: any word or phrase that appears in blue, underlined font will have a hyperlinked definition that pops-up in a separate browser window when you click on that word or phrase. Clicking on any of these hyperlinks will NOT make you navigate away from the survey site. Please click “CONTINUE” to begin.
Business Program Interest Survey Questionnaire
E-4 www.enernoc.com
RESPONDENT SCREENING
A1. Our records indicate that we have reached you at the following address: [ADDRESS] Is this correct?
5. Yes 6. No
A2. Please let us know if this address is for a business or a residence:
1. This is a business address 2. This is a residential address, but a home-operated business is located here 3. This is a residential address – it is not associated with a business
[IF A1=2 OR IF A2=3, TERMINATE AND READ A1-A2 TERMINATE TEXT; OTHERWISE, GO TO S1.] [A1-A2 TERMINATE TEXT:] We truly appreciate your time and effort in responding to our survey, but our questions are related to the energy-related aspects for a specific business address. If you would like information on how you or your business can save money on your energy bills, please visit us at www.actonenergy.com. Thank you. Have a nice day! S1. Which of the following describes how knowledgeable you are about the way your organization makes
decisions about energy-related issues?
1. You are very knowledgeable about all of the issues your organization takes into account as it makes decisions about changing out equipment, or about other energy-related issues
2. You are knowledgeable about most of the factors that your organization takes into account as it makes decisions about changing out equipment, or about other energy-related issues
3. You are not that knowledgeable about how and why your organization makes the decisions it does about energy related issues [REQUEST REFERRAL TO DECISION MAKER AND THEN TERMINATE VIA S2]
4. Don’t know [REQUEST REFERRAL TO DECISION MAKER AND THEN TERMINATE VIA S2]
[IF S1=1-2, SKIP TO S3; OTHERWISE GO TO S2 TERMINATE TEXT] S2. Thank you for taking the time to see if you are eligible to participate in this survey. At this time we need
responses from someone in your organization who has specific knowledge about the way your organization makes decisions about energy-related issues.
We would appreciate it if you would provide that person with the invitation postcard you received or refer them to the following link so that they may complete this survey with the following ID:
Link: [http://tiny.cc/ameren3] ID: [xxxxx]
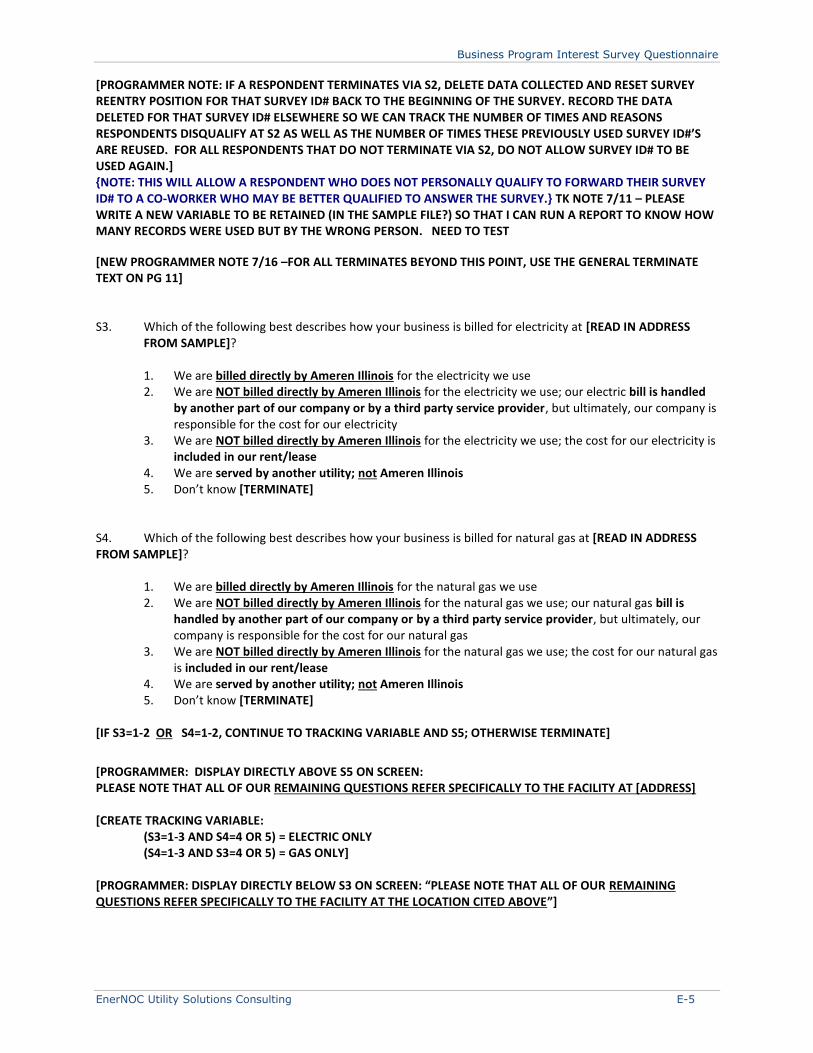
Business Program Interest Survey Questionnaire
EnerNOC Utility Solutions Consulting E-5
[PROGRAMMER NOTE: IF A RESPONDENT TERMINATES VIA S2, DELETE DATA COLLECTED AND RESET SURVEY REENTRY POSITION FOR THAT SURVEY ID# BACK TO THE BEGINNING OF THE SURVEY. RECORD THE DATA DELETED FOR THAT SURVEY ID# ELSEWHERE SO WE CAN TRACK THE NUMBER OF TIMES AND REASONS RESPONDENTS DISQUALIFY AT S2 AS WELL AS THE NUMBER OF TIMES THESE PREVIOUSLY USED SURVEY ID#’S ARE REUSED. FOR ALL RESPONDENTS THAT DO NOT TERMINATE VIA S2, DO NOT ALLOW SURVEY ID# TO BE USED AGAIN.] {NOTE: THIS WILL ALLOW A RESPONDENT WHO DOES NOT PERSONALLY QUALIFY TO FORWARD THEIR SURVEY ID# TO A CO-WORKER WHO MAY BE BETTER QUALIFIED TO ANSWER THE SURVEY.} TK NOTE 7/11 – PLEASE WRITE A NEW VARIABLE TO BE RETAINED (IN THE SAMPLE FILE?) SO THAT I CAN RUN A REPORT TO KNOW HOW MANY RECORDS WERE USED BUT BY THE WRONG PERSON. NEED TO TEST
[NEW PROGRAMMER NOTE 7/16 –FOR ALL TERMINATES BEYOND THIS POINT, USE THE GENERAL TERMINATE TEXT ON PG 11] S3. Which of the following best describes how your business is billed for electricity at [READ IN ADDRESS
FROM SAMPLE]?
1. We are billed directly by Ameren Illinois for the electricity we use 2. We are NOT billed directly by Ameren Illinois for the electricity we use; our electric bill is handled
by another part of our company or by a third party service provider, but ultimately, our company is responsible for the cost for our electricity
3. We are NOT billed directly by Ameren Illinois for the electricity we use; the cost for our electricity is included in our rent/lease
4. We are served by another utility; not Ameren Illinois 5. Don’t know [TERMINATE]
S4. Which of the following best describes how your business is billed for natural gas at [READ IN ADDRESS FROM SAMPLE]?
1. We are billed directly by Ameren Illinois for the natural gas we use 2. We are NOT billed directly by Ameren Illinois for the natural gas we use; our natural gas bill is
handled by another part of our company or by a third party service provider, but ultimately, our company is responsible for the cost for our natural gas
3. We are NOT billed directly by Ameren Illinois for the natural gas we use; the cost for our natural gas is included in our rent/lease
4. We are served by another utility; not Ameren Illinois 5. Don’t know [TERMINATE]
[IF S3=1-2 OR S4=1-2, CONTINUE TO TRACKING VARIABLE AND S5; OTHERWISE TERMINATE]
[PROGRAMMER: DISPLAY DIRECTLY ABOVE S5 ON SCREEN: PLEASE NOTE THAT ALL OF OUR REMAINING QUESTIONS REFER SPECIFICALLY TO THE FACILITY AT [ADDRESS] [CREATE TRACKING VARIABLE: (S3=1-3 AND S4=4 OR 5) = ELECTRIC ONLY (S4=1-3 AND S3=4 OR 5) = GAS ONLY] [PROGRAMMER: DISPLAY DIRECTLY BELOW S3 ON SCREEN: “PLEASE NOTE THAT ALL OF OUR REMAINING QUESTIONS REFER SPECIFICALLY TO THE FACILITY AT THE LOCATION CITED ABOVE”]
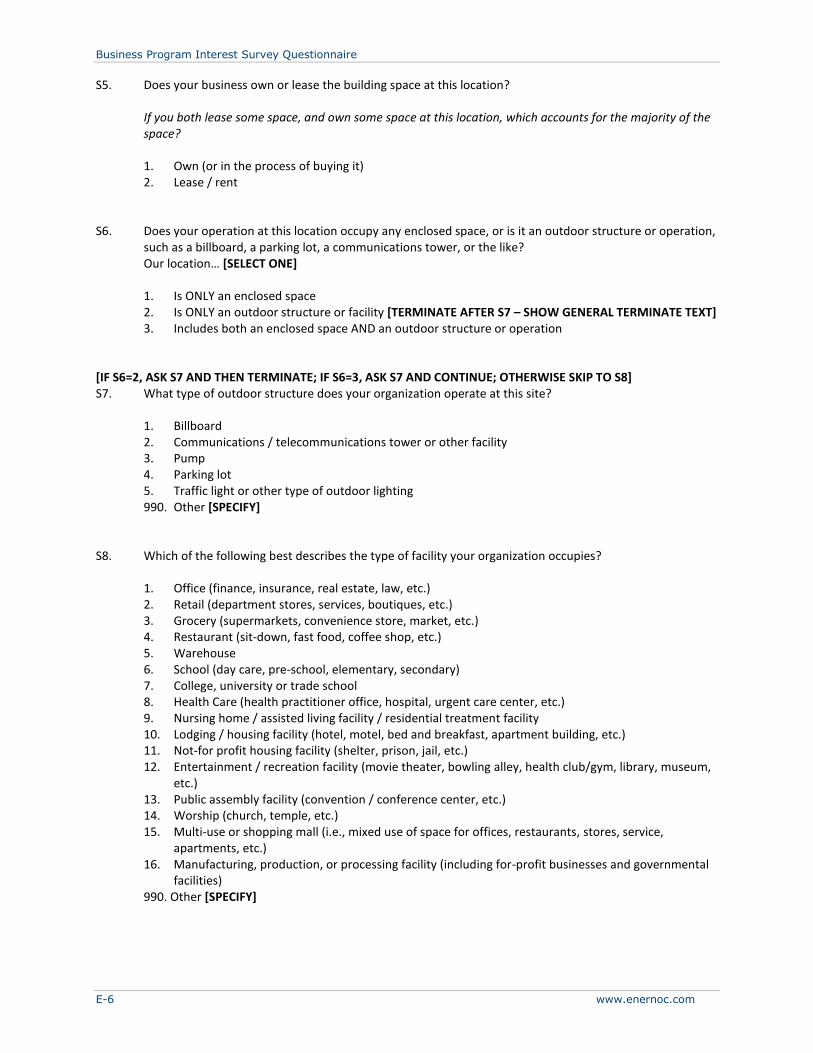
Business Program Interest Survey Questionnaire
E-6 www.enernoc.com
S5. Does your business own or lease the building space at this location?
If you both lease some space, and own some space at this location, which accounts for the majority of the space?
1. Own (or in the process of buying it) 2. Lease / rent
S6. Does your operation at this location occupy any enclosed space, or is it an outdoor structure or operation, such as a billboard, a parking lot, a communications tower, or the like? Our location… [SELECT ONE] 1. Is ONLY an enclosed space 2. Is ONLY an outdoor structure or facility [TERMINATE AFTER S7 – SHOW GENERAL TERMINATE TEXT] 3. Includes both an enclosed space AND an outdoor structure or operation
[IF S6=2, ASK S7 AND THEN TERMINATE; IF S6=3, ASK S7 AND CONTINUE; OTHERWISE SKIP TO S8] S7. What type of outdoor structure does your organization operate at this site?
1. Billboard 2. Communications / telecommunications tower or other facility 3. Pump 4. Parking lot 5. Traffic light or other type of outdoor lighting 990. Other [SPECIFY]
S8. Which of the following best describes the type of facility your organization occupies?
1. Office (finance, insurance, real estate, law, etc.) 2. Retail (department stores, services, boutiques, etc.) 3. Grocery (supermarkets, convenience store, market, etc.) 4. Restaurant (sit-down, fast food, coffee shop, etc.) 5. Warehouse 6. School (day care, pre-school, elementary, secondary) 7. College, university or trade school 8. Health Care (health practitioner office, hospital, urgent care center, etc.) 9. Nursing home / assisted living facility / residential treatment facility 10. Lodging / housing facility (hotel, motel, bed and breakfast, apartment building, etc.) 11. Not-for profit housing facility (shelter, prison, jail, etc.) 12. Entertainment / recreation facility (movie theater, bowling alley, health club/gym, library, museum,
etc.) 13. Public assembly facility (convention / conference center, etc.) 14. Worship (church, temple, etc.) 15. Multi-use or shopping mall (i.e., mixed use of space for offices, restaurants, stores, service,
apartments, etc.) 16. Manufacturing, production, or processing facility (including for-profit businesses and governmental
facilities) 990. Other [SPECIFY]
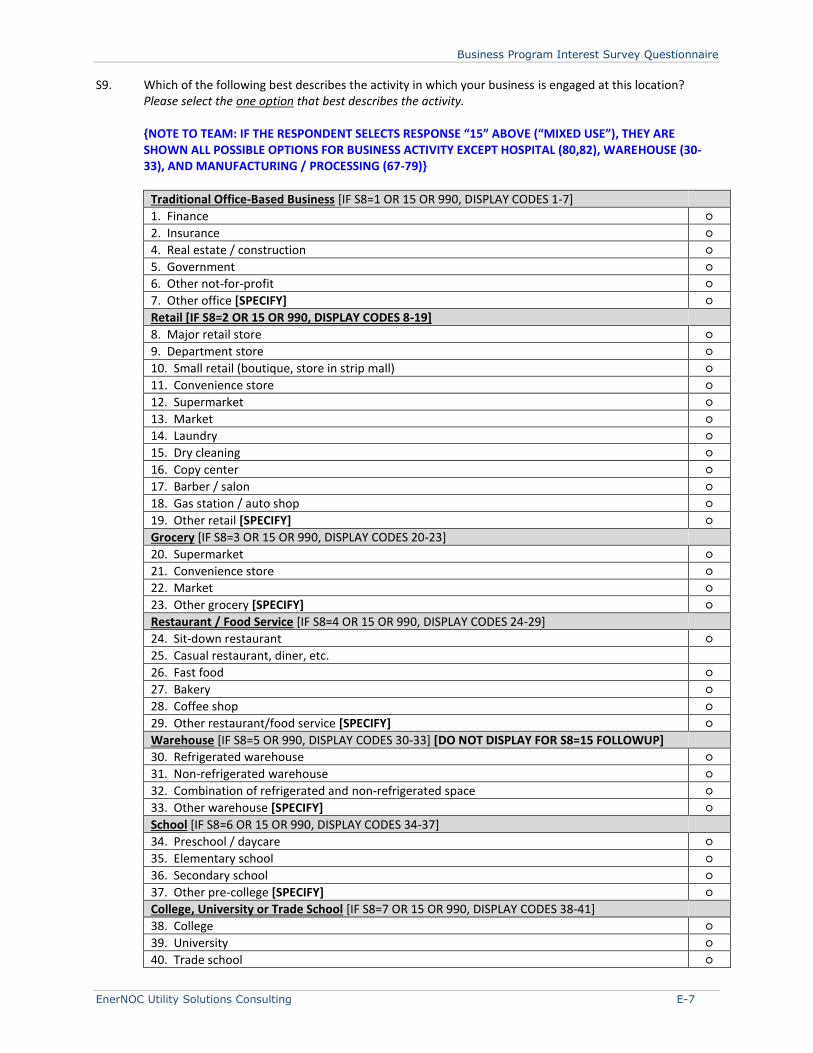
Business Program Interest Survey Questionnaire
EnerNOC Utility Solutions Consulting E-7
S9. Which of the following best describes the activity in which your business is engaged at this location? Please select the one option that best describes the activity.
{NOTE TO TEAM: IF THE RESPONDENT SELECTS RESPONSE “15” ABOVE (“MIXED USE”), THEY ARE SHOWN ALL POSSIBLE OPTIONS FOR BUSINESS ACTIVITY EXCEPT HOSPITAL (80,82), WAREHOUSE (30-33), AND MANUFACTURING / PROCESSING (67-79)}
Traditional Office-Based Business [IF S8=1 OR 15 OR 990, DISPLAY CODES 1-7]
1. Finance ○
2. Insurance ○
4. Real estate / construction ○
5. Government ○
6. Other not-for-profit ○
7. Other office [SPECIFY] ○
Retail [IF S8=2 OR 15 OR 990, DISPLAY CODES 8-19]
8. Major retail store ○
9. Department store ○
10. Small retail (boutique, store in strip mall) ○
11. Convenience store ○
12. Supermarket ○
13. Market ○
14. Laundry ○
15. Dry cleaning ○
16. Copy center ○
17. Barber / salon ○
18. Gas station / auto shop ○
19. Other retail [SPECIFY] ○
Grocery [IF S8=3 OR 15 OR 990, DISPLAY CODES 20-23]
20. Supermarket ○
21. Convenience store ○
22. Market ○
23. Other grocery [SPECIFY] ○
Restaurant / Food Service [IF S8=4 OR 15 OR 990, DISPLAY CODES 24-29]
24. Sit-down restaurant ○
25. Casual restaurant, diner, etc.
26. Fast food ○
27. Bakery ○
28. Coffee shop ○
29. Other restaurant/food service [SPECIFY] ○
Warehouse [IF S8=5 OR 990, DISPLAY CODES 30-33] [DO NOT DISPLAY FOR S8=15 FOLLOWUP]
30. Refrigerated warehouse ○
31. Non-refrigerated warehouse ○
32. Combination of refrigerated and non-refrigerated space ○
33. Other warehouse [SPECIFY] ○
School [IF S8=6 OR 15 OR 990, DISPLAY CODES 34-37]
34. Preschool / daycare ○
35. Elementary school ○
36. Secondary school ○
37. Other pre-college [SPECIFY] ○
College, University or Trade School [IF S8=7 OR 15 OR 990, DISPLAY CODES 38-41]
38. College ○
39. University ○
40. Trade school ○
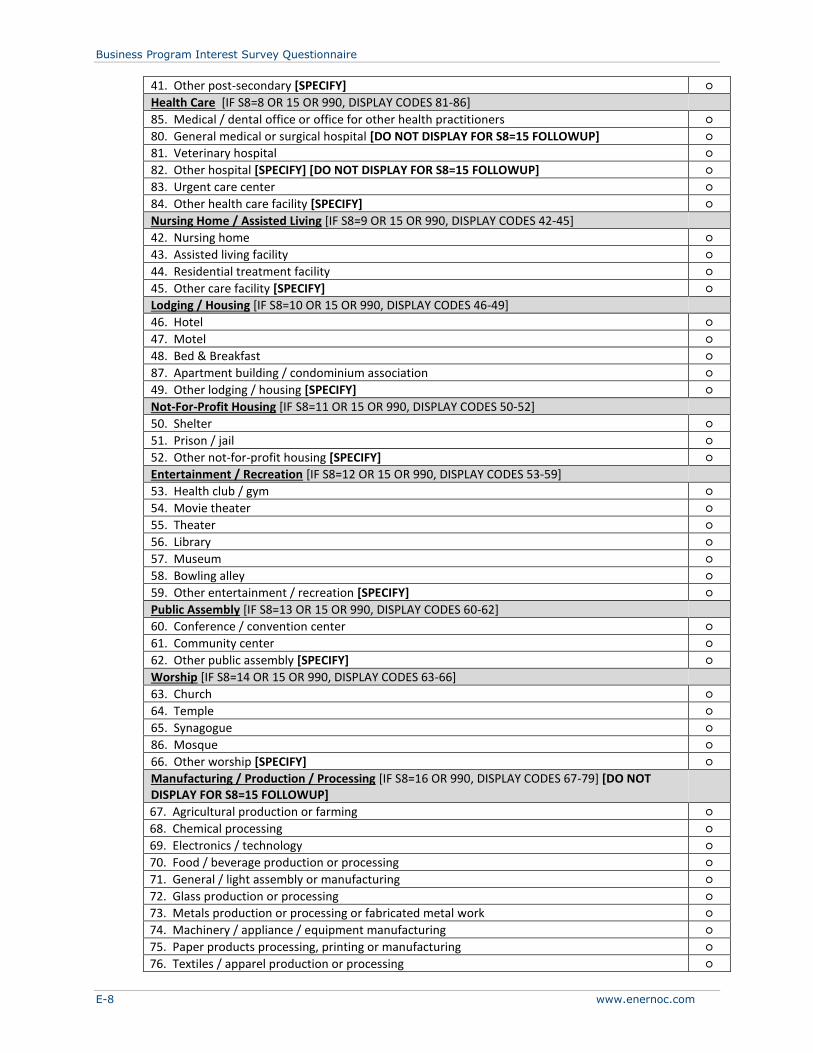
Business Program Interest Survey Questionnaire
E-8 www.enernoc.com
41. Other post-secondary [SPECIFY] ○
Health Care [IF S8=8 OR 15 OR 990, DISPLAY CODES 81-86]
85. Medical / dental office or office for other health practitioners ○
80. General medical or surgical hospital [DO NOT DISPLAY FOR S8=15 FOLLOWUP] ○
81. Veterinary hospital ○
82. Other hospital [SPECIFY] [DO NOT DISPLAY FOR S8=15 FOLLOWUP] ○
83. Urgent care center ○
84. Other health care facility [SPECIFY] ○
Nursing Home / Assisted Living [IF S8=9 OR 15 OR 990, DISPLAY CODES 42-45]
42. Nursing home ○
43. Assisted living facility ○
44. Residential treatment facility ○
45. Other care facility [SPECIFY] ○
Lodging / Housing [IF S8=10 OR 15 OR 990, DISPLAY CODES 46-49]
46. Hotel ○
47. Motel ○
48. Bed & Breakfast ○
87. Apartment building / condominium association ○
49. Other lodging / housing [SPECIFY] ○
Not-For-Profit Housing [IF S8=11 OR 15 OR 990, DISPLAY CODES 50-52]
50. Shelter ○
51. Prison / jail ○
52. Other not-for-profit housing [SPECIFY] ○
Entertainment / Recreation [IF S8=12 OR 15 OR 990, DISPLAY CODES 53-59]
53. Health club / gym ○
54. Movie theater ○
55. Theater ○
56. Library ○
57. Museum ○
58. Bowling alley ○
59. Other entertainment / recreation [SPECIFY] ○
Public Assembly [IF S8=13 OR 15 OR 990, DISPLAY CODES 60-62]
60. Conference / convention center ○
61. Community center ○
62. Other public assembly [SPECIFY] ○
Worship [IF S8=14 OR 15 OR 990, DISPLAY CODES 63-66]
63. Church ○
64. Temple ○
65. Synagogue ○
86. Mosque ○
66. Other worship [SPECIFY] ○
Manufacturing / Production / Processing [IF S8=16 OR 990, DISPLAY CODES 67-79] [DO NOT DISPLAY FOR S8=15 FOLLOWUP]
67. Agricultural production or farming ○
68. Chemical processing ○
69. Electronics / technology ○
70. Food / beverage production or processing ○
71. General / light assembly or manufacturing ○
72. Glass production or processing ○
73. Metals production or processing or fabricated metal work ○
74. Machinery / appliance / equipment manufacturing ○
75. Paper products processing, printing or manufacturing ○
76. Textiles / apparel production or processing ○

Business Program Interest Survey Questionnaire
EnerNOC Utility Solutions Consulting E-9
77. Water / wastewater treatment ○
78. Wood products manufacturing ○
79. Other manufacturing / processing [SPECIFY] ○
Something else [IF S8=15 OR 990, DISPLAY CODE 80]
80. Something else [SPECIFY] ○
S10. Approximately how many employees work at this location?
1. Less than 5 employees 2. 5 – 9 3. 10 – 19 4. 20 – 49 5. 50 – 99 6. 100 – 199 7. 200 – 299 8. 300 – 399 9. 400 – 499 10. 500 – 999 11. 1,000 – 2,499 12. 2,500 – 4,999 13. 5,000 – 9,999 14. 10,000 – 24,999 15. 25,000 or more employees
S11. What is the approximate square footage of all of the enclosed floorspace at your business’s location,
including all buildings and any enclosed parking? Please give your best estimate, including only indoor or enclosed space. If your business shares the space
with other companies / organizations, only list the space your business uses. If your business occupies several floors or buildings, add the square footage together. Please enter a whole number rather than a range of numbers. 1. [RECORD NUMBER] square feet 2. Not sure
[IF S11_1>0, ASK S12 IN ORDER TO VALIDATE S11_1 RESPONSE; OTHERWISE SKIP TO S13] S12. You said the approximate total square footage of all of the enclosed floorspace at your business’s location
is [INSERT S11_1 RESPONSE, USING COMMAS] square feet.
Is this what you intended?
1. Yes 0. No, I would like to edit my response
[IF S12=1, CONTINUE TO FILTER BEFORE S13; IF S12=0 SKIP BACK TO S11] [IF S11=2, ASK S13; OTHERWISE SKIP TO S14]
Business Program Interest Survey Questionnaire
E-10 www.enernoc.com
S13. We understand you aren’t sure, so using the ranges listed below, please just choose the best estimate of the total square footage of all of the enclosed floorspace at this location, including all buildings and any enclosed parking?
Please give your best estimate, including only indoor or enclosed space. If your business shares the space
with other companies / organizations, only list the space your business uses. If your business occupies several floors or buildings, add the square footage together. 1. Less than 1,000 sq. ft. 2. 1,000 – 4,999 3. 5,000 – 9,999 4. 10,000 – 14,999 5. 15,000 – 24,999 6. 25,000 – 49,999 7. 50,000 – 99,999 8. 100,000 – 499,999 9. 500,000 – 1 million 10. 1 million sq. ft. or more
S14. Which of the following uses of electricity and natural gas do you pay for at this location? In other words, does your electric and/or gas bill include the cost of…? Select all that apply.
1. Heating some or all of your space 2. Cooling some or all of your space 3. Providing hot water for your use 4. Interior lighting 5. Exterior lighting
{NOTE TO TEAM: THESE RESPONSES WILL BE USED TO SCREEN RESPONDENTS OUT OF THE RELEVANT END USE SECTIONS BELOW; I.E., IF THEY SAY THEIR ENERGY BILL DOES NOT COVER SPACE HEATING, THEY WILL BE SKIPPED OUT OF THE SPACE HEATING SECTION}
[IF NOT OVER-QUOTA, GO TO INVITATION LANGUAGE; OTHERWISE TERMINATE]
Business Program Interest Survey Questionnaire
EnerNOC Utility Solutions Consulting E-11
ALL TERMINATES AND OQ EXCEPT FOR TERMS AT A1 AND REFERRALS AT S2 SHOULD GET THIS TERM TEXT: TERMINATE LANGUAGE FOR NON-QUALIFYING AFTER QS2.0 OR OVER-QUOTA RESPONDENTS
We appreciate the time and effort you have spent in responding to our survey invitation and answering these initial questions, which were designed to see if you are eligible to participate in this research study. In order to achieve a representative sample, quotas with specific criteria have been designated. At this point, we have reached the number of respondents we can accept from individuals with your type of experience or background. Again, we would like to thank you for your time and effort.
If you would like information on how your business can save money on energy bills, please visit Ameren Illinois at
www.actonenergy.com
[ONLY ASKED IF RESPONDENT TERMINATES OR IS OVER QUOTA] R1. Additionally, if you would like someone from the Ameren Illinois’s energy efficiency implementation team
to contact you about further energy efficiency opportunities, please provide the appropriate contact information below: (NOTE: All other information you have provided in this survey will continue to remain anonymous, even if you choose to be contacted. None of your prior responses will be communicated to the Ameren Illinois energy efficiency implementation team.)
1. Yes, we would like to be contacted by someone from Ameren Illinois’s energy efficiency implementation team. Please supply the appropriate contact information below.
[PROGRAMMER NOTE: RESPONDENT SHOULD NOT BE FORCED TO ENTER ANY INFO IF IT’S NOT FOR THEIR PREFERRED CONTACT METHOD]
Contact Name:____________________________
Business Name:____________________________
Preferred contact method(s) – Select all that apply:
phone e-mail postal mail
Daytime phone number :______________________ [ALLOW UP TO 20 CHARACTERS – ALLOW ALPHA CHARACTERS]
E-mail address:_____________________________
Postal address:_____________________________
_____________________________
_____________________________
2. No, we would NOT like to be contacted
[IF R1=1, GO TO FOLLOW-UP REQUEST VERIFICATION SCREEN] Please review the contact information you provided and verify that it is complete and correct:

Business Program Interest Survey Questionnaire
E-12 www.enernoc.com
IF R1=2, SHOW: Thank you and have a nice day!
INVITATION LANGUAGE FOR QUALIFYING RESPONDENTS
Thank you for your responses so far. You and your business have qualified to complete this survey. As we indicated earlier, only a limited number of individuals have been invited to participate in this survey, so we appreciate your time in filling out the survey as completely as possible. The survey should take about 20 – 25 minutes to complete. Once you complete the survey you will be eligible to receive our $25 thank you payment. Information about how to receive this payment will be provided at the end of the survey. Your responses are important to us, so please press “CONTINUE” to begin answering the survey questions. All information provided in this survey will be kept strictly confidential, and at no time will you be asked to purchase anything. If you need to pause the survey at any time, you can come back later and begin again where you left off. Simply save the personalized URL to access your survey again. The survey will automatically take you to the point where you left off. Please note: any word or phrase that appears in blue, underlined font will have a hyperlinked definition that pops-up in a separate browser window when you click on that word or phrase. Clicking on any of these hyperlinks will NOT make you navigate away from the survey site. As you complete the survey, you will not be able to use your browser’s “back” button. If you mistakenly press your browser’s “back” button, you will need to press the “refresh” button to continue the survey.
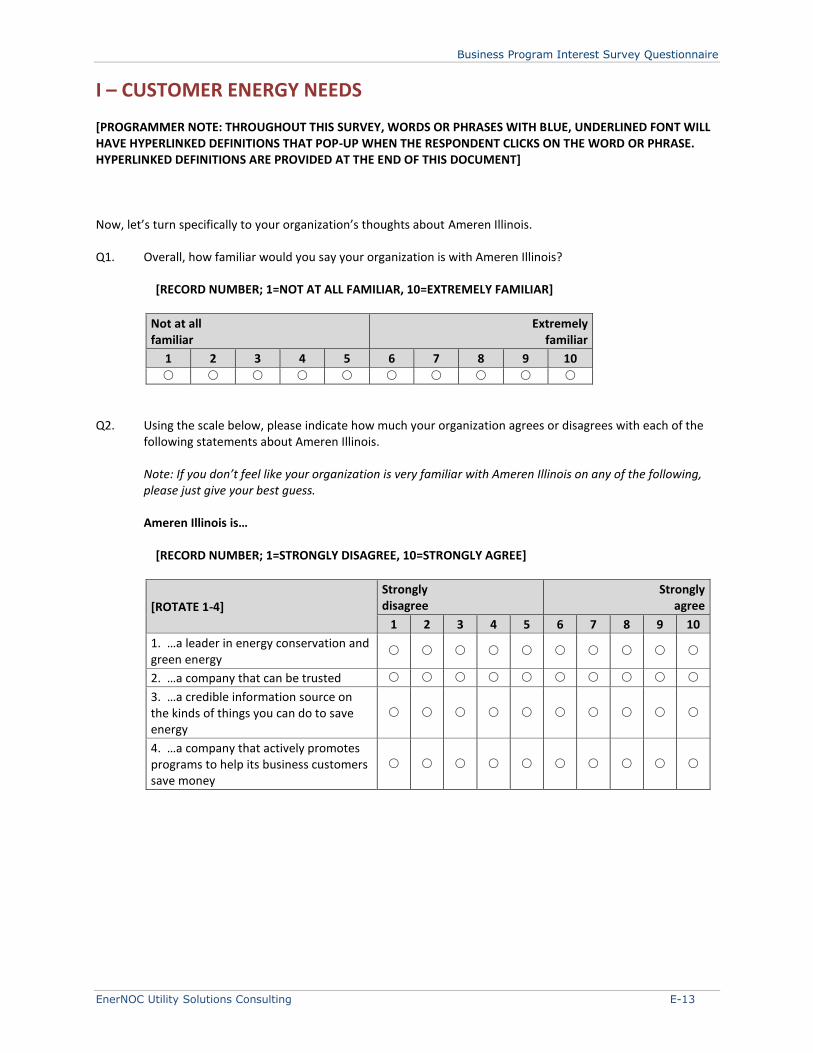
Business Program Interest Survey Questionnaire
EnerNOC Utility Solutions Consulting E-13
I – CUSTOMER ENERGY NEEDS [PROGRAMMER NOTE: THROUGHOUT THIS SURVEY, WORDS OR PHRASES WITH BLUE, UNDERLINED FONT WILL HAVE HYPERLINKED DEFINITIONS THAT POP-UP WHEN THE RESPONDENT CLICKS ON THE WORD OR PHRASE. HYPERLINKED DEFINITIONS ARE PROVIDED AT THE END OF THIS DOCUMENT] Now, let’s turn specifically to your organization’s thoughts about Ameren Illinois. Q1. Overall, how familiar would you say your organization is with Ameren Illinois? [RECORD NUMBER; 1=NOT AT ALL FAMILIAR, 10=EXTREMELY FAMILIAR]
Not at all familiar
Extremely familiar
1 2 3 4 5 6 7 8 9 10
Q2. Using the scale below, please indicate how much your organization agrees or disagrees with each of the
following statements about Ameren Illinois. Note: If you don’t feel like your organization is very familiar with Ameren Illinois on any of the following,
please just give your best guess. Ameren Illinois is… [RECORD NUMBER; 1=STRONGLY DISAGREE, 10=STRONGLY AGREE]
[ROTATE 1-4]
Strongly disagree
Strongly agree
1 2 3 4 5 6 7 8 9 10
1. …a leader in energy conservation and green energy
2. …a company that can be trusted
3. …a credible information source on the kinds of things you can do to save energy
4. …a company that actively promotes programs to help its business customers save money
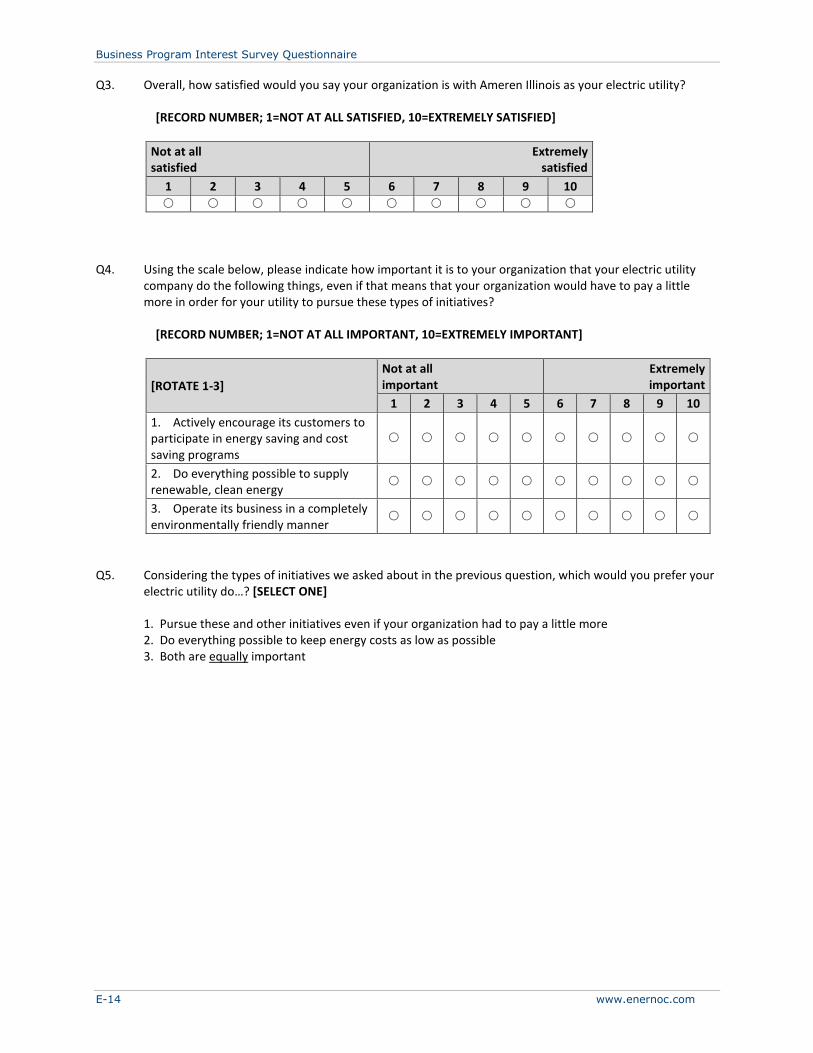
Business Program Interest Survey Questionnaire
E-14 www.enernoc.com
Q3. Overall, how satisfied would you say your organization is with Ameren Illinois as your electric utility? [RECORD NUMBER; 1=NOT AT ALL SATISFIED, 10=EXTREMELY SATISFIED]
Not at all satisfied
Extremely satisfied
1 2 3 4 5 6 7 8 9 10
Q4. Using the scale below, please indicate how important it is to your organization that your electric utility
company do the following things, even if that means that your organization would have to pay a little more in order for your utility to pursue these types of initiatives?
[RECORD NUMBER; 1=NOT AT ALL IMPORTANT, 10=EXTREMELY IMPORTANT]
[ROTATE 1-3]
Not at all important
Extremely important
1 2 3 4 5 6 7 8 9 10
1. Actively encourage its customers to participate in energy saving and cost saving programs
2. Do everything possible to supply renewable, clean energy
3. Operate its business in a completely environmentally friendly manner
Q5. Considering the types of initiatives we asked about in the previous question, which would you prefer your
electric utility do…? [SELECT ONE]
1. Pursue these and other initiatives even if your organization had to pay a little more 2. Do everything possible to keep energy costs as low as possible 3. Both are equally important
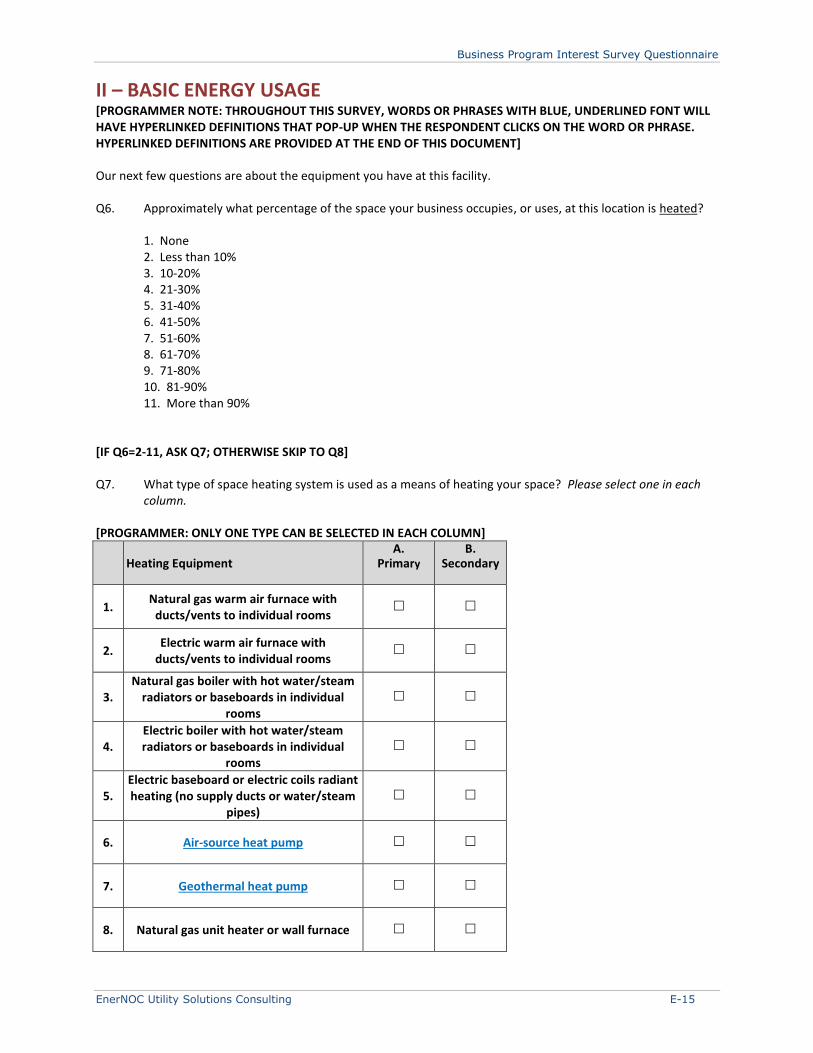
Business Program Interest Survey Questionnaire
EnerNOC Utility Solutions Consulting E-15
II – BASIC ENERGY USAGE
[PROGRAMMER NOTE: THROUGHOUT THIS SURVEY, WORDS OR PHRASES WITH BLUE, UNDERLINED FONT WILL HAVE HYPERLINKED DEFINITIONS THAT POP-UP WHEN THE RESPONDENT CLICKS ON THE WORD OR PHRASE. HYPERLINKED DEFINITIONS ARE PROVIDED AT THE END OF THIS DOCUMENT] Our next few questions are about the equipment you have at this facility. Q6. Approximately what percentage of the space your business occupies, or uses, at this location is heated?
1. None 2. Less than 10% 3. 10-20% 4. 21-30% 5. 31-40% 6. 41-50% 7. 51-60% 8. 61-70% 9. 71-80% 10. 81-90% 11. More than 90%
[IF Q6=2-11, ASK Q7; OTHERWISE SKIP TO Q8] Q7. What type of space heating system is used as a means of heating your space? Please select one in each
column. [PROGRAMMER: ONLY ONE TYPE CAN BE SELECTED IN EACH COLUMN]
Heating Equipment A.
Primary B.
Secondary
1. Natural gas warm air furnace with
ducts/vents to individual rooms
2. Electric warm air furnace with
ducts/vents to individual rooms
3. Natural gas boiler with hot water/steam
radiators or baseboards in individual rooms
4. Electric boiler with hot water/steam radiators or baseboards in individual
rooms
5. Electric baseboard or electric coils radiant heating (no supply ducts or water/steam
pipes)
6. Air-source heat pump
7. Geothermal heat pump
8. Natural gas unit heater or wall furnace

Business Program Interest Survey Questionnaire
E-16 www.enernoc.com
9. Electric unit heater or wall furnace
10. None
999. Not sure [EXCLUSIVE]
990. Other (please specify)
Q8. What type of cooling system is your primary means to cool your space?
By ”primary”, we mean the cooling system that you use for the largest amount of your space.
1. Air cooled chiller 2. Water cooled chiller 3. Central air conditioner 4. Packaged air conditioner units 5. Floor-by-floor packaged water cooled DX (Direct Expansion) units 6. Wall or window air conditioner units 7. Air-source heat pump 8. Geothermal heat pump 9. Other [SPECIFY] 10. Not sure
Q9. What type of water heater does your business use?
1. None 2. Hot water either purchased or provided by building to tenants 3. Self-contained or stand-alone storage water heaters/boilers 4. Central boiler 5. Tankless (instantaneous) water heater 6. Heat pump water heater 7. Heat recovery water heater 8. Other [SPECIFY] 9. Not sure
Q10. What size kitchen, if any, is used for food preparation in your facility, including any kitchens used for
employees’ personal use?
1. None 2. Small kitchenette 3. Residential-scale kitchen 4. Commercial-scale kitchen 5. Institution-scale kitchen (in larger hospitals, universities)
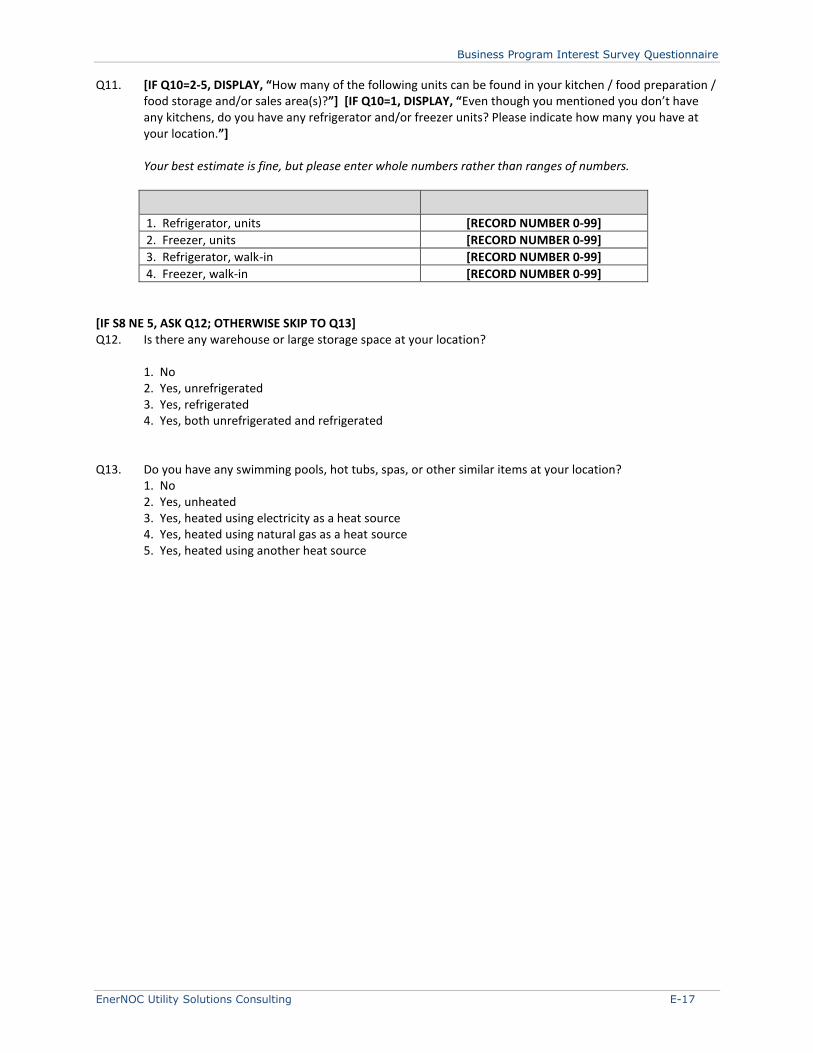
Business Program Interest Survey Questionnaire
EnerNOC Utility Solutions Consulting E-17
Q11. [IF Q10=2-5, DISPLAY, “How many of the following units can be found in your kitchen / food preparation / food storage and/or sales area(s)?”] [IF Q10=1, DISPLAY, “Even though you mentioned you don’t have any kitchens, do you have any refrigerator and/or freezer units? Please indicate how many you have at your location.”]
Your best estimate is fine, but please enter whole numbers rather than ranges of numbers.
1. Refrigerator, units [RECORD NUMBER 0-99]
2. Freezer, units [RECORD NUMBER 0-99]
3. Refrigerator, walk-in [RECORD NUMBER 0-99]
4. Freezer, walk-in [RECORD NUMBER 0-99]
[IF S8 NE 5, ASK Q12; OTHERWISE SKIP TO Q13] Q12. Is there any warehouse or large storage space at your location?
1. No 2. Yes, unrefrigerated 3. Yes, refrigerated 4. Yes, both unrefrigerated and refrigerated
Q13. Do you have any swimming pools, hot tubs, spas, or other similar items at your location?
1. No 2. Yes, unheated 3. Yes, heated using electricity as a heat source 4. Yes, heated using natural gas as a heat source 5. Yes, heated using another heat source

Business Program Interest Survey Questionnaire
E-18 www.enernoc.com
III – ATTITUDES
We’d like to understand how your organization as a whole thinks about using energy at this facility. Q14. At an organizational level, to what extent does your firm agree or disagree with each of the following
statements? Please use a 10-point scale where ‘1’ means you strongly disagree, and ‘10’ means you strongly agree.
We are interested in your firm’s attitudes, regardless of whether or not it has acted on these beliefs.
[RECORD NUMBER; 1=STRONGLY DISAGREE, 10=STRONGLY AGREE]
[ROTATE 1-8]
Strongly disagree
Strongly agree
1 2 3 4 5 6 7 8 9 10
1. We care about the cost of the energy we use, but realistically, other issues take up much more of our management time
2. It is a top priority for our organization to find ways to control our energy costs
3. There is really very little our organization can do to save money on our energy bills
4. Our organization believes that it is socially responsible to limit our use of electricity
5. We would do more to make our facility more energy efficient, but we don’t really know where to start, or what to do next
6. Our organization has made a public commitment to be a “greener” organization
7. Our organization believes that the long-term threat from global warming and climate change is real, and potentially devastating
8. We believe that investing in energy efficiency almost always a good business decision
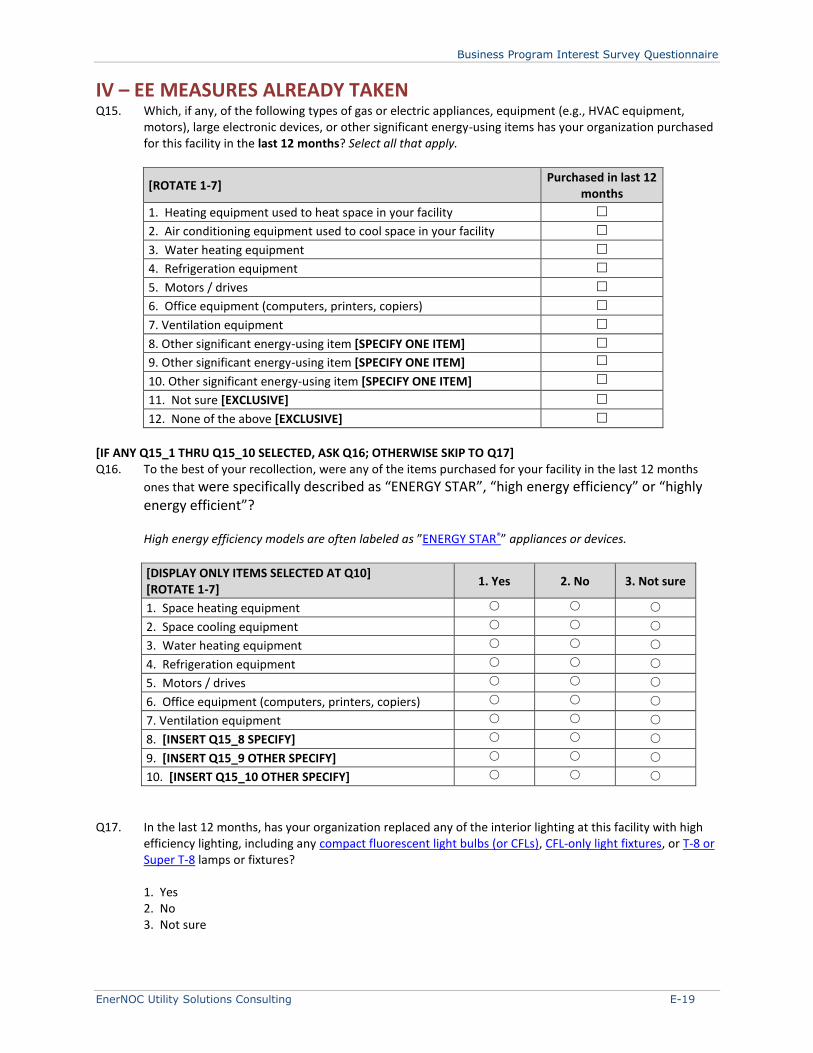
Business Program Interest Survey Questionnaire
EnerNOC Utility Solutions Consulting E-19
IV – EE MEASURES ALREADY TAKEN
Q15. Which, if any, of the following types of gas or electric appliances, equipment (e.g., HVAC equipment, motors), large electronic devices, or other significant energy-using items has your organization purchased for this facility in the last 12 months? Select all that apply.
[ROTATE 1-7] Purchased in last 12
months
1. Heating equipment used to heat space in your facility
2. Air conditioning equipment used to cool space in your facility
3. Water heating equipment
4. Refrigeration equipment
5. Motors / drives
6. Office equipment (computers, printers, copiers)
7. Ventilation equipment
8. Other significant energy-using item [SPECIFY ONE ITEM]
9. Other significant energy-using item [SPECIFY ONE ITEM]
10. Other significant energy-using item [SPECIFY ONE ITEM]
11. Not sure [EXCLUSIVE]
12. None of the above [EXCLUSIVE]
[IF ANY Q15_1 THRU Q15_10 SELECTED, ASK Q16; OTHERWISE SKIP TO Q17] Q16. To the best of your recollection, were any of the items purchased for your facility in the last 12 months
ones that were specifically described as “ENERGY STAR”, “high energy efficiency” or “highly energy efficient”?
High energy efficiency models are often labeled as ”ENERGY STAR®” appliances or devices.
[DISPLAY ONLY ITEMS SELECTED AT Q10] [ROTATE 1-7]
1. Yes 2. No 3. Not sure
1. Space heating equipment
2. Space cooling equipment
3. Water heating equipment
4. Refrigeration equipment
5. Motors / drives
6. Office equipment (computers, printers, copiers)
7. Ventilation equipment
8. [INSERT Q15_8 SPECIFY]
9. [INSERT Q15_9 OTHER SPECIFY]
10. [INSERT Q15_10 OTHER SPECIFY]
Q17. In the last 12 months, has your organization replaced any of the interior lighting at this facility with high
efficiency lighting, including any compact fluorescent light bulbs (or CFLs), CFL-only light fixtures, or T-8 or Super T-8 lamps or fixtures?
1. Yes 2. No 3. Not sure
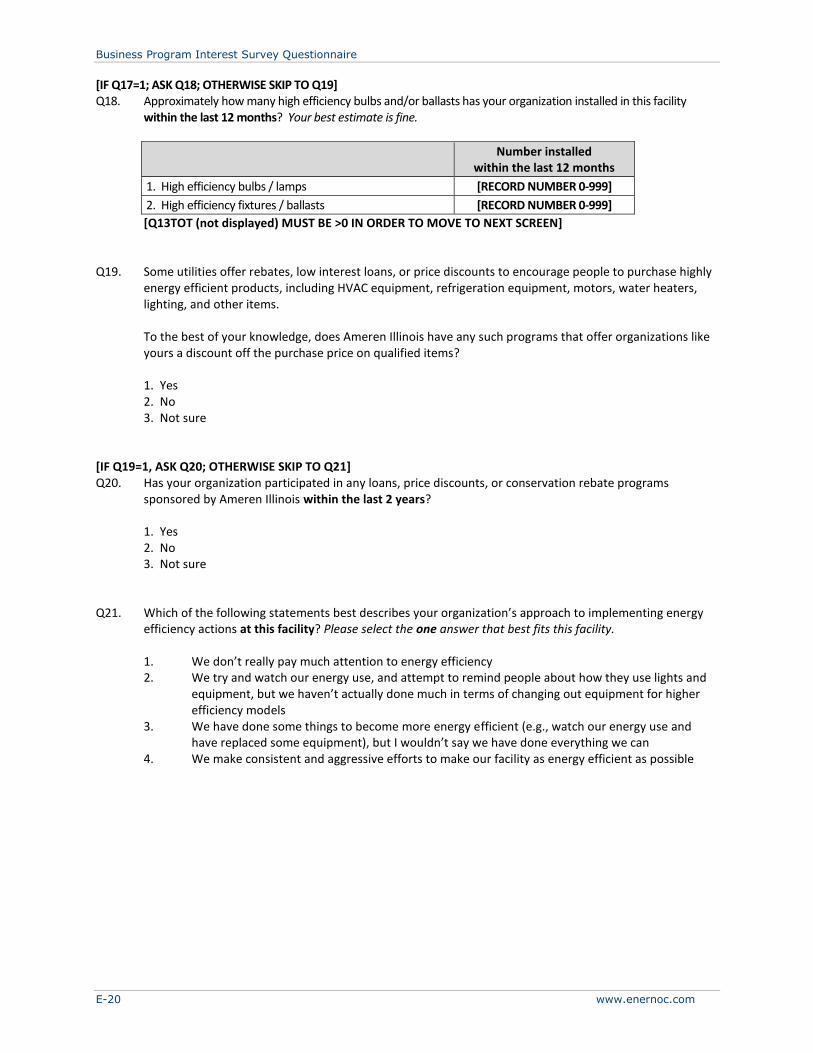
Business Program Interest Survey Questionnaire
E-20 www.enernoc.com
[IF Q17=1; ASK Q18; OTHERWISE SKIP TO Q19] Q18. Approximately how many high efficiency bulbs and/or ballasts has your organization installed in this facility
within the last 12 months? Your best estimate is fine.
Number installed
within the last 12 months
1. High efficiency bulbs / lamps [RECORD NUMBER 0-999]
2. High efficiency fixtures / ballasts [RECORD NUMBER 0-999]
[Q13TOT (not displayed) MUST BE >0 IN ORDER TO MOVE TO NEXT SCREEN] Q19. Some utilities offer rebates, low interest loans, or price discounts to encourage people to purchase highly
energy efficient products, including HVAC equipment, refrigeration equipment, motors, water heaters, lighting, and other items.
To the best of your knowledge, does Ameren Illinois have any such programs that offer organizations like yours a discount off the purchase price on qualified items?
1. Yes 2. No 3. Not sure
[IF Q19=1, ASK Q20; OTHERWISE SKIP TO Q21] Q20. Has your organization participated in any loans, price discounts, or conservation rebate programs
sponsored by Ameren Illinois within the last 2 years?
1. Yes 2. No 3. Not sure
Q21. Which of the following statements best describes your organization’s approach to implementing energy
efficiency actions at this facility? Please select the one answer that best fits this facility.
1. We don’t really pay much attention to energy efficiency 2. We try and watch our energy use, and attempt to remind people about how they use lights and
equipment, but we haven’t actually done much in terms of changing out equipment for higher efficiency models
3. We have done some things to become more energy efficient (e.g., watch our energy use and have replaced some equipment), but I wouldn’t say we have done everything we can
4. We make consistent and aggressive efforts to make our facility as energy efficient as possible
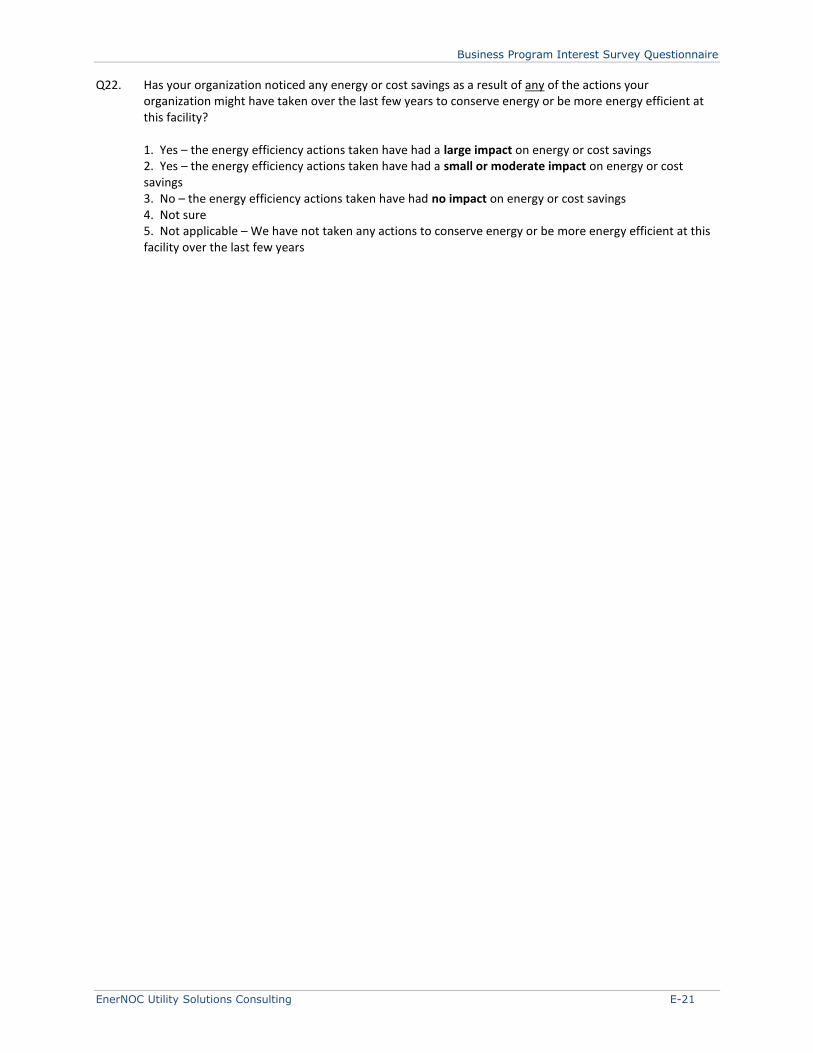
Business Program Interest Survey Questionnaire
EnerNOC Utility Solutions Consulting E-21
Q22. Has your organization noticed any energy or cost savings as a result of any of the actions your organization might have taken over the last few years to conserve energy or be more energy efficient at this facility?
1. Yes – the energy efficiency actions taken have had a large impact on energy or cost savings 2. Yes – the energy efficiency actions taken have had a small or moderate impact on energy or cost savings 3. No – the energy efficiency actions taken have had no impact on energy or cost savings 4. Not sure 5. Not applicable – We have not taken any actions to conserve energy or be more energy efficient at this facility over the last few years
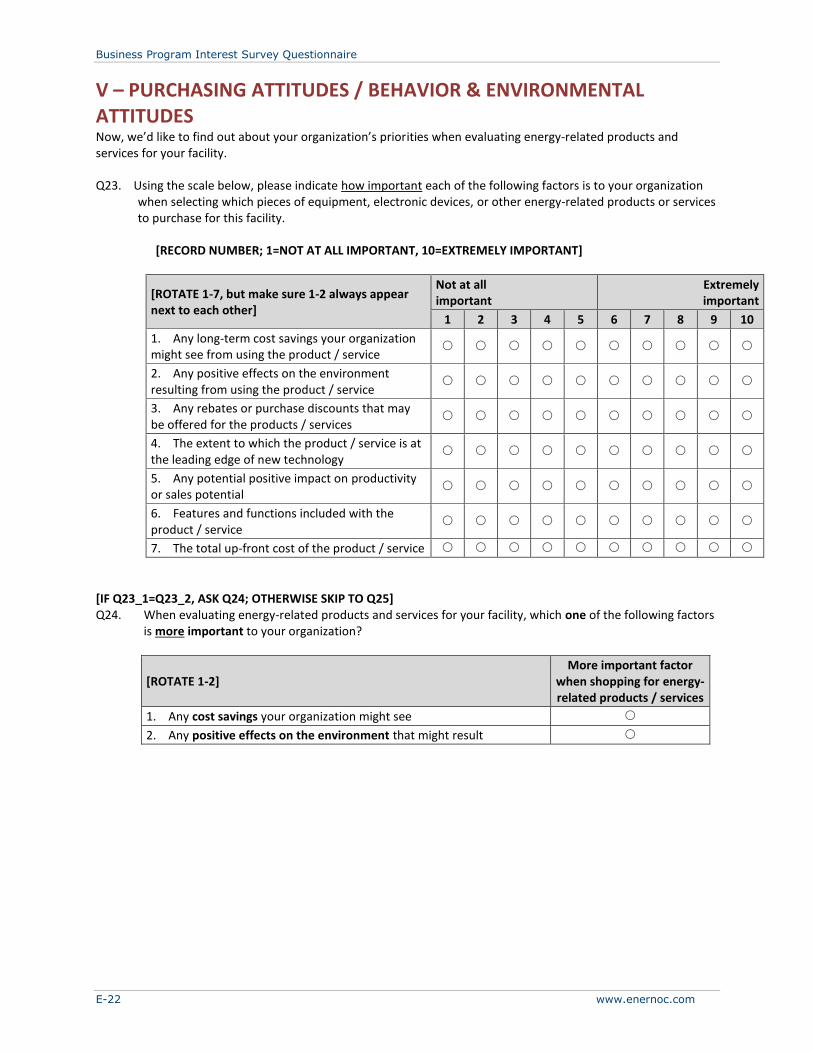
Business Program Interest Survey Questionnaire
E-22 www.enernoc.com
V – PURCHASING ATTITUDES / BEHAVIOR & ENVIRONMENTAL ATTITUDES
Now, we’d like to find out about your organization’s priorities when evaluating energy-related products and services for your facility. Q23. Using the scale below, please indicate how important each of the following factors is to your organization
when selecting which pieces of equipment, electronic devices, or other energy-related products or services to purchase for this facility.
[RECORD NUMBER; 1=NOT AT ALL IMPORTANT, 10=EXTREMELY IMPORTANT]
[ROTATE 1-7, but make sure 1-2 always appear next to each other]
Not at all important
Extremely important
1 2 3 4 5 6 7 8 9 10
1. Any long-term cost savings your organization might see from using the product / service
2. Any positive effects on the environment resulting from using the product / service
3. Any rebates or purchase discounts that may be offered for the products / services
4. The extent to which the product / service is at the leading edge of new technology
5. Any potential positive impact on productivity or sales potential
6. Features and functions included with the product / service
7. The total up-front cost of the product / service
[IF Q23_1=Q23_2, ASK Q24; OTHERWISE SKIP TO Q25] Q24. When evaluating energy-related products and services for your facility, which one of the following factors
is more important to your organization?
[ROTATE 1-2] More important factor
when shopping for energy-related products / services
1. Any cost savings your organization might see
2. Any positive effects on the environment that might result
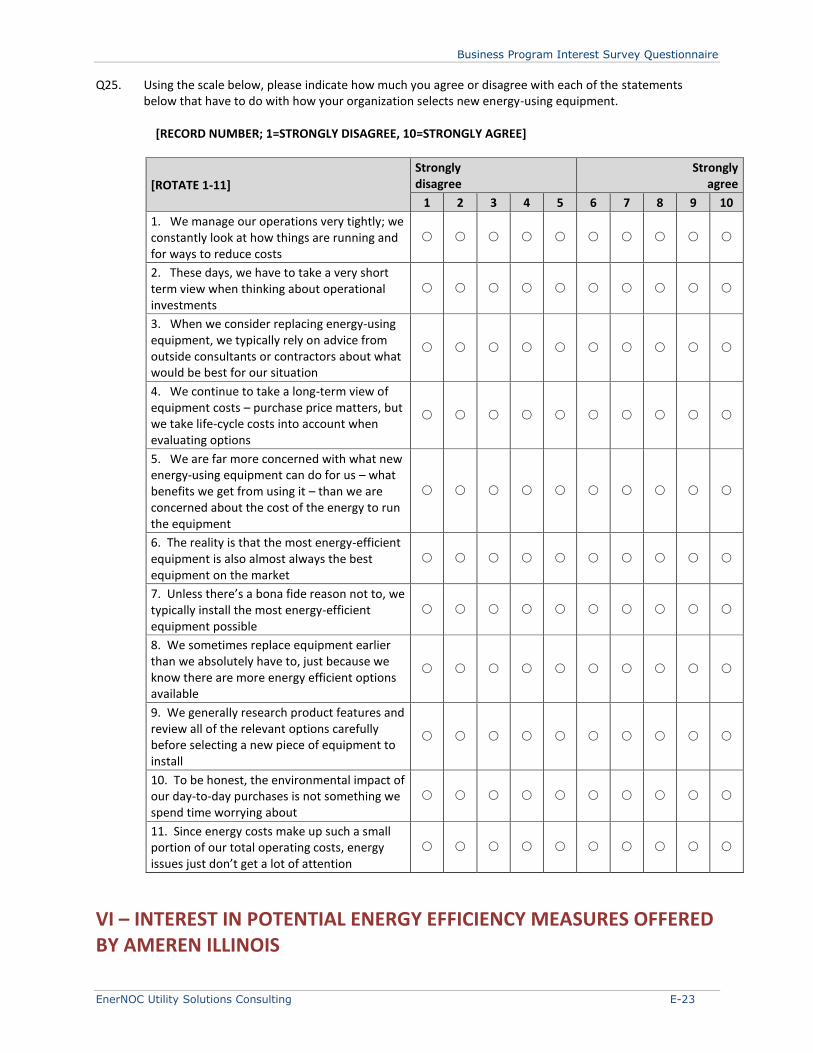
Business Program Interest Survey Questionnaire
EnerNOC Utility Solutions Consulting E-23
Q25. Using the scale below, please indicate how much you agree or disagree with each of the statements below that have to do with how your organization selects new energy-using equipment.
[RECORD NUMBER; 1=STRONGLY DISAGREE, 10=STRONGLY AGREE]
[ROTATE 1-11]
Strongly disagree
Strongly agree
1 2 3 4 5 6 7 8 9 10
1. We manage our operations very tightly; we constantly look at how things are running and for ways to reduce costs
2. These days, we have to take a very short term view when thinking about operational investments
3. When we consider replacing energy-using equipment, we typically rely on advice from outside consultants or contractors about what would be best for our situation
4. We continue to take a long-term view of equipment costs – purchase price matters, but we take life-cycle costs into account when evaluating options
5. We are far more concerned with what new energy-using equipment can do for us – what benefits we get from using it – than we are concerned about the cost of the energy to run the equipment
6. The reality is that the most energy-efficient equipment is also almost always the best equipment on the market
7. Unless there’s a bona fide reason not to, we typically install the most energy-efficient equipment possible
8. We sometimes replace equipment earlier than we absolutely have to, just because we know there are more energy efficient options available
9. We generally research product features and review all of the relevant options carefully before selecting a new piece of equipment to install
10. To be honest, the environmental impact of our day-to-day purchases is not something we spend time worrying about
11. Since energy costs make up such a small portion of our total operating costs, energy issues just don’t get a lot of attention
VI – INTEREST IN POTENTIAL ENERGY EFFICIENCY MEASURES OFFERED BY AMEREN ILLINOIS
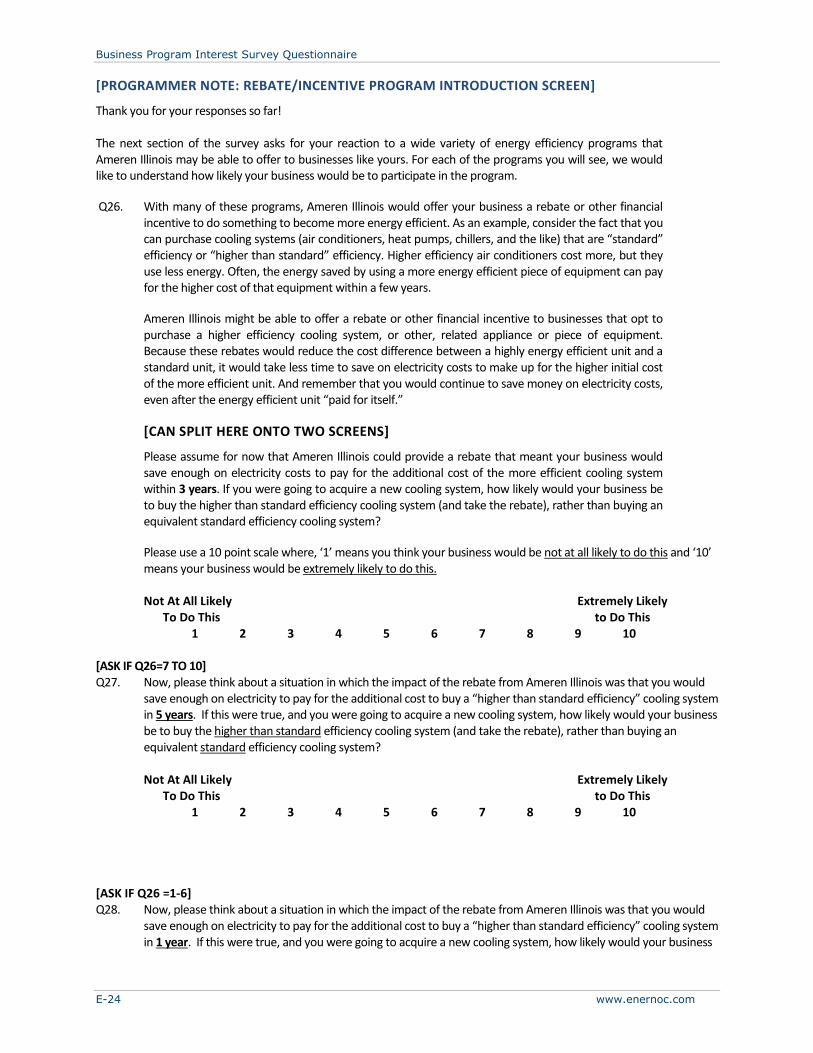
Business Program Interest Survey Questionnaire
E-24 www.enernoc.com
[PROGRAMMER NOTE: REBATE/INCENTIVE PROGRAM INTRODUCTION SCREEN]
Thank you for your responses so far! The next section of the survey asks for your reaction to a wide variety of energy efficiency programs that Ameren Illinois may be able to offer to businesses like yours. For each of the programs you will see, we would like to understand how likely your business would be to participate in the program.
Q26. With many of these programs, Ameren Illinois would offer your business a rebate or other financial incentive to do something to become more energy efficient. As an example, consider the fact that you can purchase cooling systems (air conditioners, heat pumps, chillers, and the like) that are “standard” efficiency or “higher than standard” efficiency. Higher efficiency air conditioners cost more, but they use less energy. Often, the energy saved by using a more energy efficient piece of equipment can pay for the higher cost of that equipment within a few years.
Ameren Illinois might be able to offer a rebate or other financial incentive to businesses that opt to purchase a higher efficiency cooling system, or other, related appliance or piece of equipment. Because these rebates would reduce the cost difference between a highly energy efficient unit and a standard unit, it would take less time to save on electricity costs to make up for the higher initial cost of the more efficient unit. And remember that you would continue to save money on electricity costs, even after the energy efficient unit “paid for itself.”
[CAN SPLIT HERE ONTO TWO SCREENS]
Please assume for now that Ameren Illinois could provide a rebate that meant your business would save enough on electricity costs to pay for the additional cost of the more efficient cooling system within 3 years. If you were going to acquire a new cooling system, how likely would your business be to buy the higher than standard efficiency cooling system (and take the rebate), rather than buying an equivalent standard efficiency cooling system?
Please use a 10 point scale where, ‘1’ means you think your business would be not at all likely to do this and ‘10’ means your business would be extremely likely to do this. Not At All Likely Extremely Likely
To Do This to Do This 1 2 3 4 5 6 7 8 9 10
[ASK IF Q26=7 TO 10] Q27. Now, please think about a situation in which the impact of the rebate from Ameren Illinois was that you would
save enough on electricity to pay for the additional cost to buy a “higher than standard efficiency” cooling system in 5 years. If this were true, and you were going to acquire a new cooling system, how likely would your business be to buy the higher than standard efficiency cooling system (and take the rebate), rather than buying an equivalent standard efficiency cooling system?
Not At All Likely Extremely Likely
To Do This to Do This 1 2 3 4 5 6 7 8 9 10
[ASK IF Q26 =1-6] Q28. Now, please think about a situation in which the impact of the rebate from Ameren Illinois was that you would
save enough on electricity to pay for the additional cost to buy a “higher than standard efficiency” cooling system in 1 year. If this were true, and you were going to acquire a new cooling system, how likely would your business
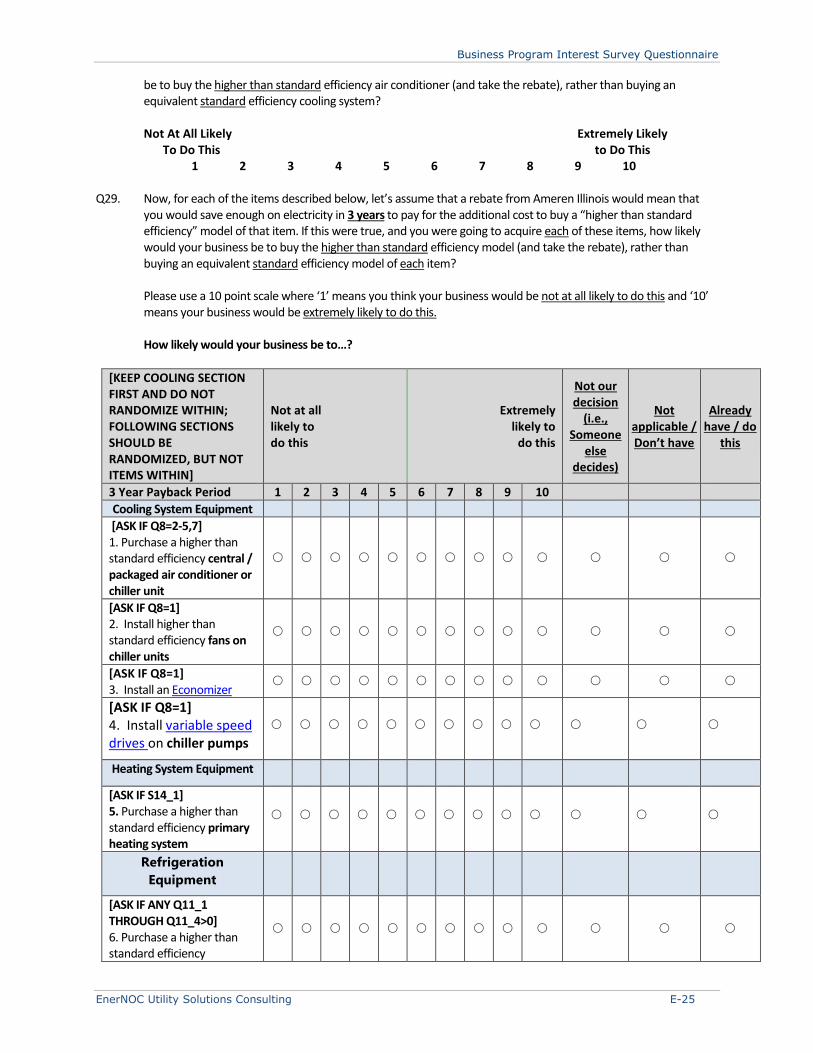
Business Program Interest Survey Questionnaire
EnerNOC Utility Solutions Consulting E-25
be to buy the higher than standard efficiency air conditioner (and take the rebate), rather than buying an equivalent standard efficiency cooling system?
Not At All Likely Extremely Likely
To Do This to Do This 1 2 3 4 5 6 7 8 9 10
Q29. Now, for each of the items described below, let’s assume that a rebate from Ameren Illinois would mean that
you would save enough on electricity in 3 years to pay for the additional cost to buy a “higher than standard efficiency” model of that item. If this were true, and you were going to acquire each of these items, how likely would your business be to buy the higher than standard efficiency model (and take the rebate), rather than buying an equivalent standard efficiency model of each item?
Please use a 10 point scale where ‘1’ means you think your business would be not at all likely to do this and ‘10’
means your business would be extremely likely to do this. How likely would your business be to…?
[KEEP COOLING SECTION FIRST AND DO NOT RANDOMIZE WITHIN; FOLLOWING SECTIONS SHOULD BE RANDOMIZED, BUT NOT ITEMS WITHIN]
Not at all likely to do this
Extremely likely to
do this
Not our decision
(i.e., Someone
else decides)
Not applicable / Don’t have
Already have / do
this
3 Year Payback Period 1 2 3 4 5 6 7 8 9 10
Cooling System Equipment
[ASK IF Q8=2-5,7] 1. Purchase a higher than standard efficiency central / packaged air conditioner or chiller unit
[ASK IF Q8=1] 2. Install higher than standard efficiency fans on chiller units
[ASK IF Q8=1] 3. Install an Economizer
[ASK IF Q8=1] 4. Install variable speed drives on chiller pumps
Heating System Equipment
[ASK IF S14_1] 5. Purchase a higher than standard efficiency primary heating system
Refrigeration
Equipment
[ASK IF ANY Q11_1 THROUGH Q11_4>0] 6. Purchase a higher than standard efficiency
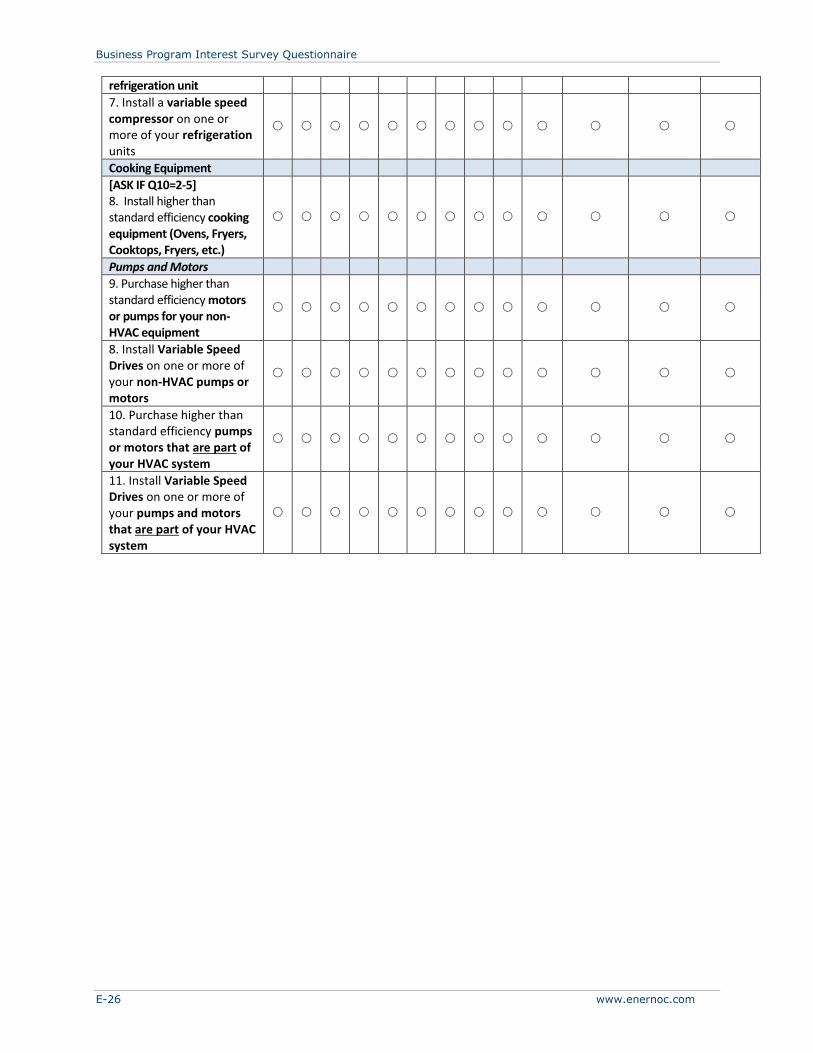
Business Program Interest Survey Questionnaire
E-26 www.enernoc.com
refrigeration unit
7. Install a variable speed compressor on one or more of your refrigeration units
Cooking Equipment
[ASK IF Q10=2-5] 8. Install higher than standard efficiency cooking equipment (Ovens, Fryers, Cooktops, Fryers, etc.)
Pumps and Motors
9. Purchase higher than standard efficiency motors or pumps for your non-HVAC equipment
8. Install Variable Speed Drives on one or more of your non-HVAC pumps or motors
10. Purchase higher than standard efficiency pumps or motors that are part of your HVAC system
11. Install Variable Speed Drives on one or more of your pumps and motors that are part of your HVAC system

Business Program Interest Survey Questionnaire
EnerNOC Utility Solutions Consulting E-27
Q30. In addition to offering programs that would help your business buy more energy efficient equipment, Ameren Illinois might also be able to offer your business a rebate or other financial incentives to install a variety of control systems that could optimize the operational efficiency of your existing equipment. For example, they might provide a rebate to help you install or upgrade an advanced programmable, clock-based thermostat on your HVAC system to provide basic automation for this system. Once this thermostat is installed, the energy saved could potentially make up for the associated cost of installing it within a few years.
Assuming that Ameren Illinois could provide a rebate that meant you would save enough on your electricity costs to pay for the cost of installing the advanced programmable, clock-based thermostat within 3 years, how likely would you be to install this device (and take the rebate)?
Please use a 10 point scale where, ‘1’ means you think your business would be not at all likely to do this and ‘10’ means your business would be extremely likely to do this. Not At All Likely Extremely Likely
To Do This to Do This 1 2 3 4 5 6 7 8 9 10
[ASK IF Q30=7 TO 10] Q31. Now, please think about a situation in which the impact of the rebate from Ameren Illinois was that you would
save enough on electricity in 5 years to pay for the cost of installing an advanced programmable, clock-based thermostat. In this case, how likely would your business be to install the thermostat, and take the rebate?
Not At All Likely Extremely Likely
To Do This to Do This 1 2 3 4 5 6 7 8 9 10
[ASK IF Q30 =1-6] Q32. Now, please think about a situation in which the impact of the rebate from Ameren Illinois was that you would
save enough on electricity in 1 year to pay for the cost of installing an advanced programmable, clock-based thermostat. In this case, how likely would your business be to install the thermostat and take the rebate?
Not At All Likely Extremely Likely
To Do This to Do This 1 2 3 4 5 6 7 8 9 10
Q33. Now, for each of the energy control system improvements below, let’s assume that the impact of the rebate
from Ameren Illinois was that your business would save enough on electricity in 3 years to pay for the cost associated with each control system improvement. If this were true, how likely would your organization be to make each improvement?
Please use a 10 point scale where ‘1’ means you think your business would not be at all likely to do this and ‘10’
means your business would be extremely likely to do this.
How likely would your organization be to…?
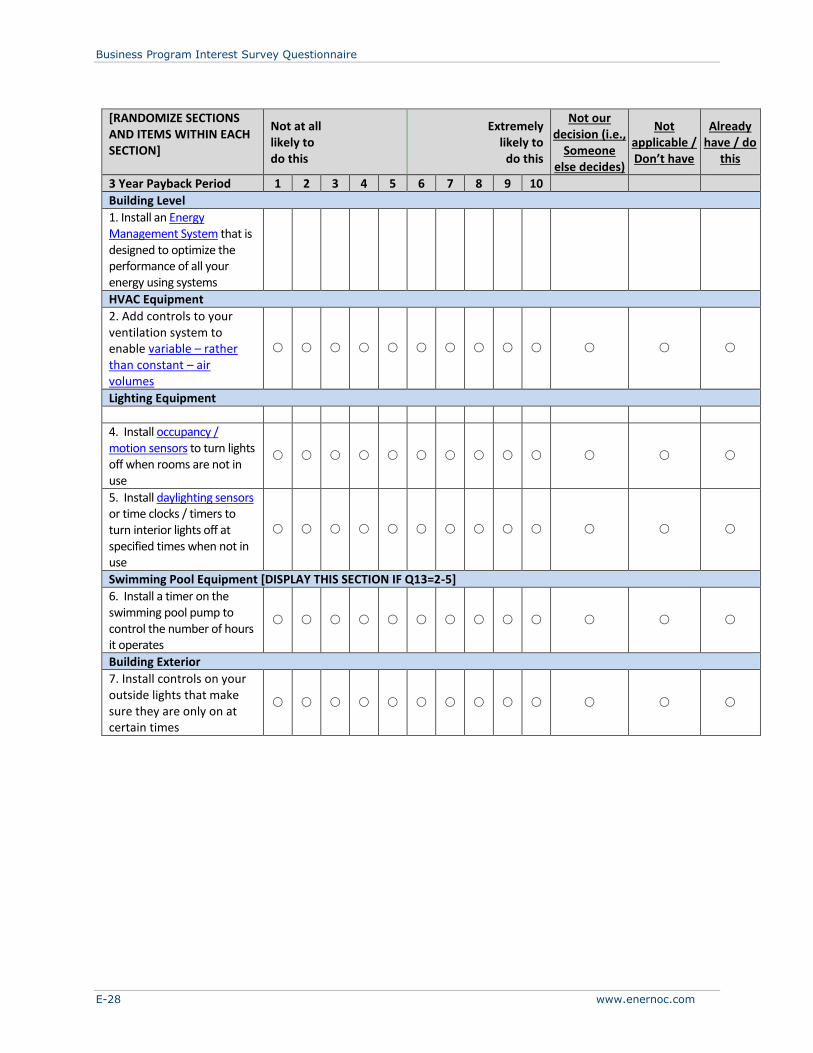
Business Program Interest Survey Questionnaire
E-28 www.enernoc.com
[RANDOMIZE SECTIONS AND ITEMS WITHIN EACH SECTION]
Not at all likely to do this
Extremely likely to
do this
Not our decision (i.e.,
Someone else decides)
Not applicable / Don’t have
Already have / do
this
3 Year Payback Period 1 2 3 4 5 6 7 8 9 10
Building Level
1. Install an Energy Management System that is designed to optimize the performance of all your energy using systems
HVAC Equipment
2. Add controls to your ventilation system to enable variable – rather than constant – air volumes
Lighting Equipment
4. Install occupancy / motion sensors to turn lights off when rooms are not in use
5. Install daylighting sensors or time clocks / timers to turn interior lights off at specified times when not in use
Swimming Pool Equipment [DISPLAY THIS SECTION IF Q13=2-5]
6. Install a timer on the swimming pool pump to control the number of hours it operates
Building Exterior
7. Install controls on your outside lights that make sure they are only on at certain times
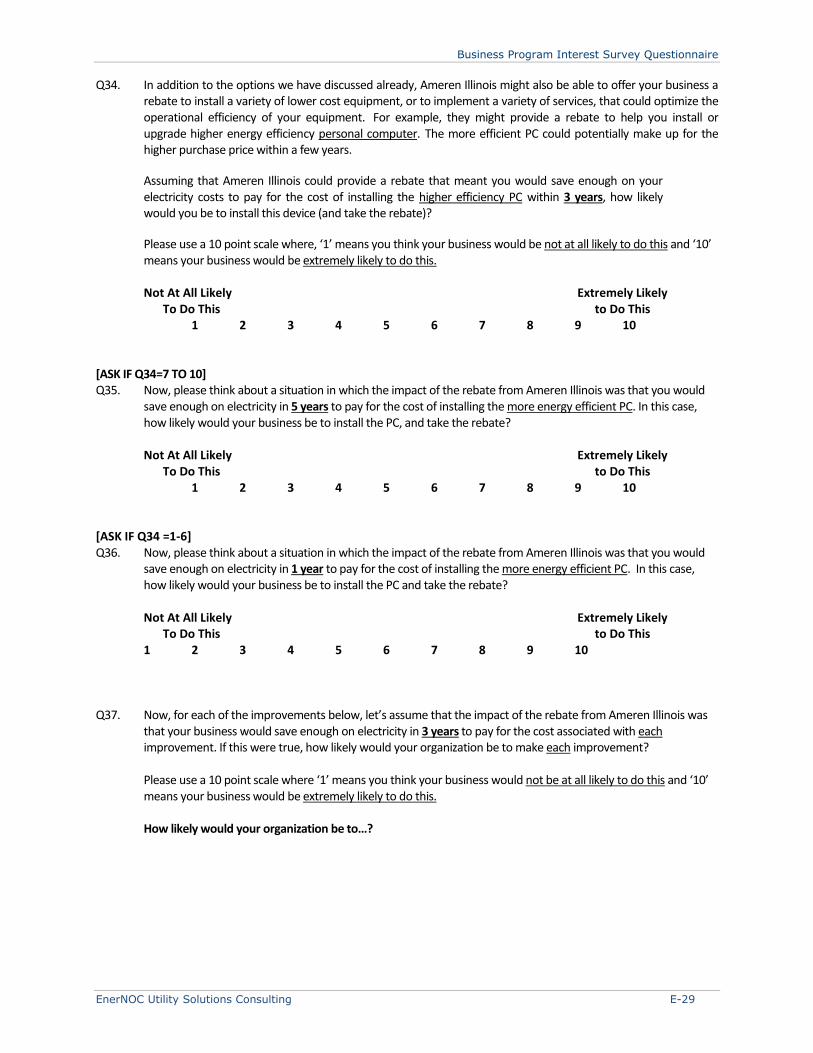
Business Program Interest Survey Questionnaire
EnerNOC Utility Solutions Consulting E-29
Q34. In addition to the options we have discussed already, Ameren Illinois might also be able to offer your business a rebate to install a variety of lower cost equipment, or to implement a variety of services, that could optimize the operational efficiency of your equipment. For example, they might provide a rebate to help you install or upgrade higher energy efficiency personal computer. The more efficient PC could potentially make up for the higher purchase price within a few years.
Assuming that Ameren Illinois could provide a rebate that meant you would save enough on your electricity costs to pay for the cost of installing the higher efficiency PC within 3 years, how likely would you be to install this device (and take the rebate)?
Please use a 10 point scale where, ‘1’ means you think your business would be not at all likely to do this and ‘10’ means your business would be extremely likely to do this. Not At All Likely Extremely Likely
To Do This to Do This 1 2 3 4 5 6 7 8 9 10
[ASK IF Q34=7 TO 10] Q35. Now, please think about a situation in which the impact of the rebate from Ameren Illinois was that you would
save enough on electricity in 5 years to pay for the cost of installing the more energy efficient PC. In this case, how likely would your business be to install the PC, and take the rebate?
Not At All Likely Extremely Likely
To Do This to Do This 1 2 3 4 5 6 7 8 9 10
[ASK IF Q34 =1-6] Q36. Now, please think about a situation in which the impact of the rebate from Ameren Illinois was that you would
save enough on electricity in 1 year to pay for the cost of installing the more energy efficient PC. In this case, how likely would your business be to install the PC and take the rebate?
Not At All Likely Extremely Likely
To Do This to Do This 1 2 3 4 5 6 7 8 9 10
Q37. Now, for each of the improvements below, let’s assume that the impact of the rebate from Ameren Illinois was
that your business would save enough on electricity in 3 years to pay for the cost associated with each improvement. If this were true, how likely would your organization be to make each improvement?
Please use a 10 point scale where ‘1’ means you think your business would not be at all likely to do this and ‘10’
means your business would be extremely likely to do this.
How likely would your organization be to…?
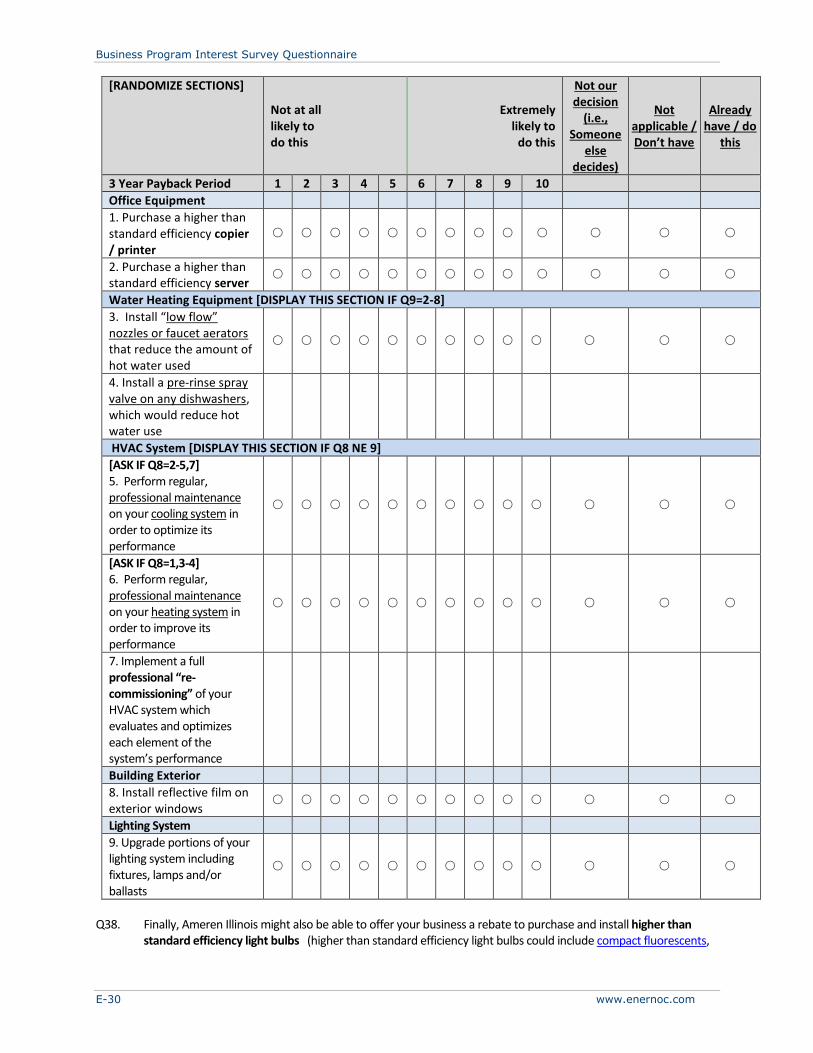
Business Program Interest Survey Questionnaire
E-30 www.enernoc.com
[RANDOMIZE SECTIONS]
Not at all likely to do this
Extremely likely to
do this
Not our decision
(i.e., Someone
else decides)
Not applicable / Don’t have
Already have / do
this
3 Year Payback Period 1 2 3 4 5 6 7 8 9 10
Office Equipment
1. Purchase a higher than standard efficiency copier / printer
2. Purchase a higher than standard efficiency server
Water Heating Equipment [DISPLAY THIS SECTION IF Q9=2-8]
3. Install “low flow” nozzles or faucet aerators that reduce the amount of hot water used
4. Install a pre-rinse spray valve on any dishwashers, which would reduce hot water use
HVAC System [DISPLAY THIS SECTION IF Q8 NE 9]
[ASK IF Q8=2-5,7] 5. Perform regular, professional maintenance on your cooling system in order to optimize its performance
[ASK IF Q8=1,3-4] 6. Perform regular, professional maintenance on your heating system in order to improve its performance
7. Implement a full professional “re-commissioning” of your HVAC system which evaluates and optimizes each element of the system’s performance
Building Exterior
8. Install reflective film on exterior windows
Lighting System
9. Upgrade portions of your lighting system including fixtures, lamps and/or ballasts
Q38. Finally, Ameren Illinois might also be able to offer your business a rebate to purchase and install higher than
standard efficiency light bulbs (higher than standard efficiency light bulbs could include compact fluorescents,

Business Program Interest Survey Questionnaire
EnerNOC Utility Solutions Consulting E-31
T-5, T-8 or Super T-8 fluorescents). The energy saved from installing these higher efficiency lamps could potentially make up for the associated cost of installing them within a few years
. Assuming that Ameren Illinois could provide a rebate that meant you would save enough on your electricity costs to pay for the cost of installing higher efficiency light bulbs within 3 years, how likely would you be to install one or more of these bulbs (and take the rebate)?
Please use a 10 point scale where, ‘1’ means you think your business would be not at all likely to do this and ‘10’ means your business would be extremely likely to do this. Not At All Likely Extremely Likely
To Do This to Do This 1 2 3 4 5 6 7 8 9 10
[ASK IF Q38=7 TO 10] Q39. Now, please think about a situation in which the impact of the rebate from Ameren Illinois was that you would
save enough on electricity in 5 years to pay for the cost of installing the higher efficiency light bulbs. In this case, how likely would your business be to install the one or more of these bulbs, and take the rebate?
Not At All Likely Extremely Likely
To Do This to Do This 1 2 3 4 5 6 7 8 9 10
[ASK IF Q38=1-6] Q40. Now, please think about a situation in which the impact of the rebate from Ameren Illinois was that you would
save enough on electricity in 1 year to pay for the cost of installing the higher efficiency light bulbs. In this case, how likely would your business be to install one or more of the bulbs, and take the rebate?
Not At All Likely Extremely Likely
To Do This to Do This 1 2 3 4 5 6 7 8 9 10
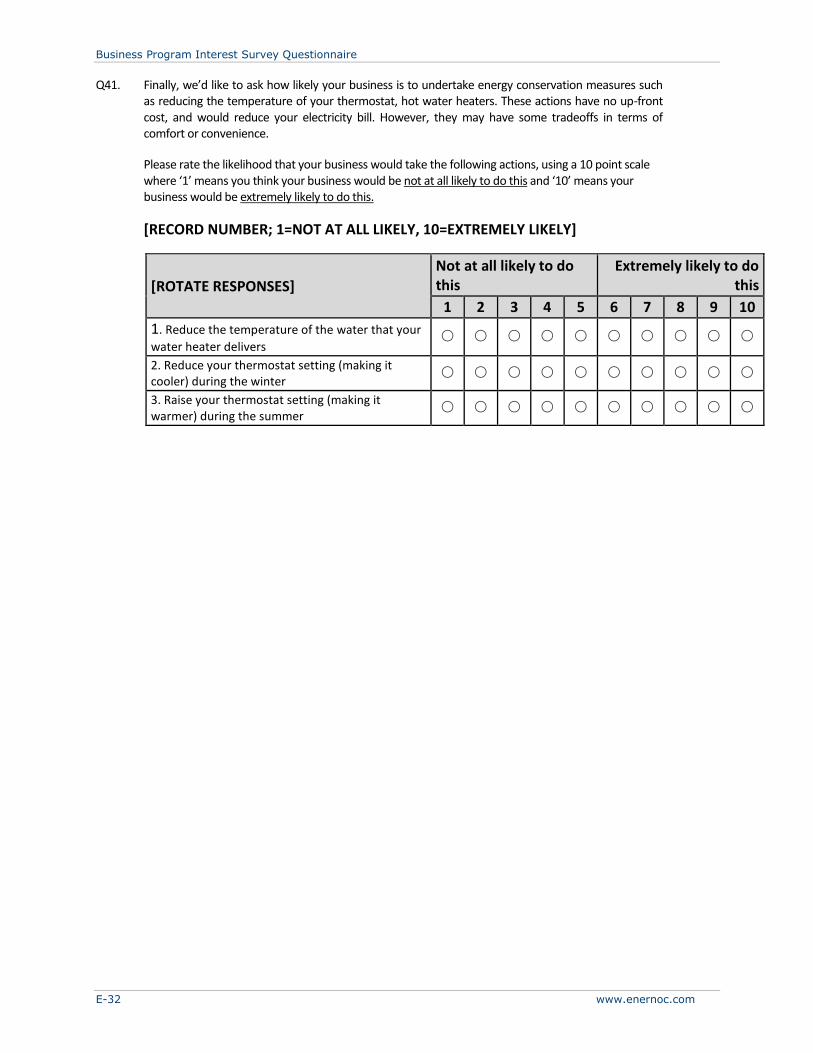
Business Program Interest Survey Questionnaire
E-32 www.enernoc.com
Q41. Finally, we’d like to ask how likely your business is to undertake energy conservation measures such as reducing the temperature of your thermostat, hot water heaters. These actions have no up-front cost, and would reduce your electricity bill. However, they may have some tradeoffs in terms of comfort or convenience.
Please rate the likelihood that your business would take the following actions, using a 10 point scale where ‘1’ means you think your business would be not at all likely to do this and ‘10’ means your business would be extremely likely to do this.
[RECORD NUMBER; 1=NOT AT ALL LIKELY, 10=EXTREMELY LIKELY]
[ROTATE RESPONSES]
Not at all likely to do this
Extremely likely to do this
1 2 3 4 5 6 7 8 9 10
1. Reduce the temperature of the water that your
water heater delivers
2. Reduce your thermostat setting (making it cooler) during the winter
3. Raise your thermostat setting (making it warmer) during the summer
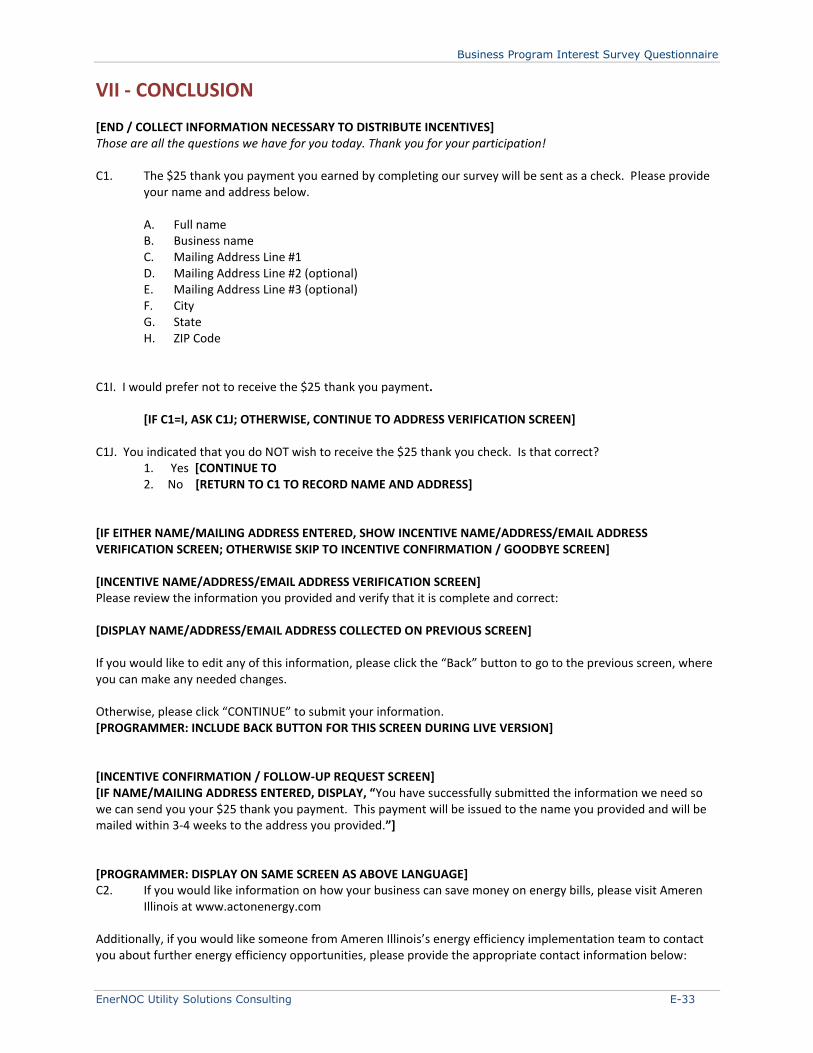
Business Program Interest Survey Questionnaire
EnerNOC Utility Solutions Consulting E-33
VII - CONCLUSION
[END / COLLECT INFORMATION NECESSARY TO DISTRIBUTE INCENTIVES] Those are all the questions we have for you today. Thank you for your participation! C1. The $25 thank you payment you earned by completing our survey will be sent as a check. Please provide
your name and address below.
A. Full name B. Business name C. Mailing Address Line #1 D. Mailing Address Line #2 (optional) E. Mailing Address Line #3 (optional) F. City G. State H. ZIP Code
C1I. I would prefer not to receive the $25 thank you payment.
[IF C1=I, ASK C1J; OTHERWISE, CONTINUE TO ADDRESS VERIFICATION SCREEN]
C1J. You indicated that you do NOT wish to receive the $25 thank you check. Is that correct?
1. Yes [CONTINUE TO 2. No [RETURN TO C1 TO RECORD NAME AND ADDRESS]
[IF EITHER NAME/MAILING ADDRESS ENTERED, SHOW INCENTIVE NAME/ADDRESS/EMAIL ADDRESS VERIFICATION SCREEN; OTHERWISE SKIP TO INCENTIVE CONFIRMATION / GOODBYE SCREEN] [INCENTIVE NAME/ADDRESS/EMAIL ADDRESS VERIFICATION SCREEN] Please review the information you provided and verify that it is complete and correct: [DISPLAY NAME/ADDRESS/EMAIL ADDRESS COLLECTED ON PREVIOUS SCREEN] If you would like to edit any of this information, please click the “Back” button to go to the previous screen, where you can make any needed changes. Otherwise, please click “CONTINUE” to submit your information. [PROGRAMMER: INCLUDE BACK BUTTON FOR THIS SCREEN DURING LIVE VERSION] [INCENTIVE CONFIRMATION / FOLLOW-UP REQUEST SCREEN] [IF NAME/MAILING ADDRESS ENTERED, DISPLAY, “You have successfully submitted the information we need so we can send you your $25 thank you payment. This payment will be issued to the name you provided and will be mailed within 3-4 weeks to the address you provided.”] [PROGRAMMER: DISPLAY ON SAME SCREEN AS ABOVE LANGUAGE] C2. If you would like information on how your business can save money on energy bills, please visit Ameren
Illinois at www.actonenergy.com Additionally, if you would like someone from Ameren Illinois’s energy efficiency implementation team to contact you about further energy efficiency opportunities, please provide the appropriate contact information below:
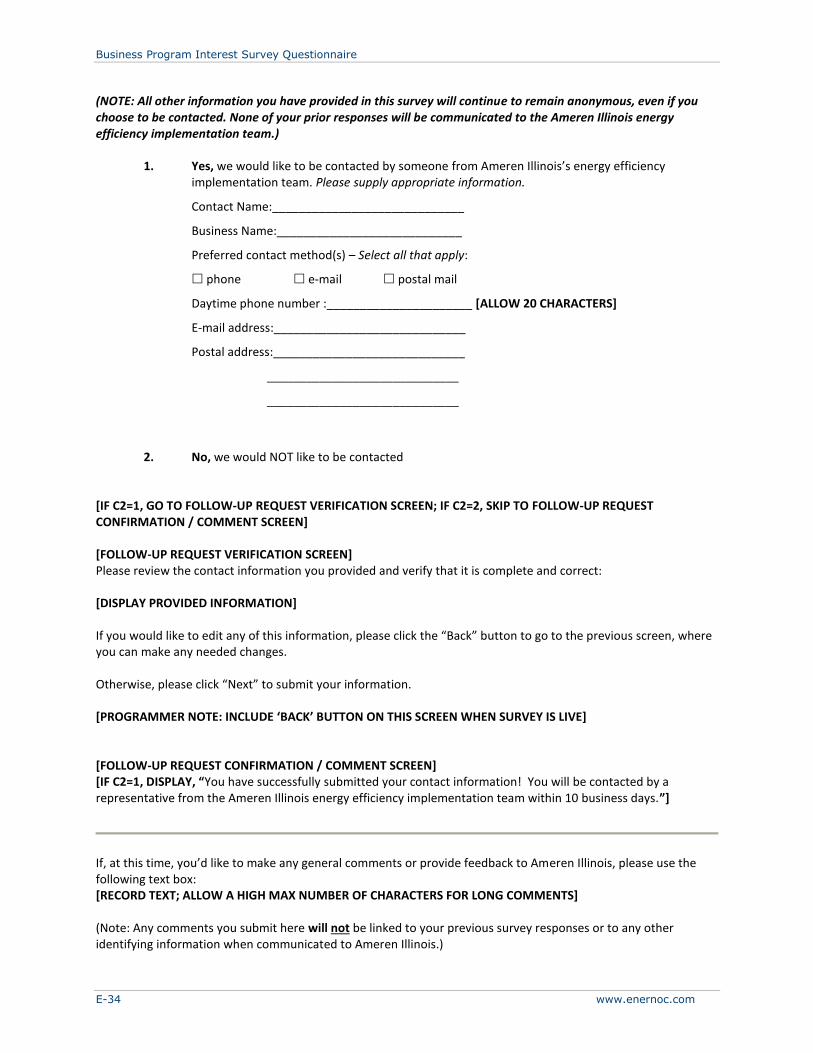
Business Program Interest Survey Questionnaire
E-34 www.enernoc.com
(NOTE: All other information you have provided in this survey will continue to remain anonymous, even if you choose to be contacted. None of your prior responses will be communicated to the Ameren Illinois energy efficiency implementation team.)
1. Yes, we would like to be contacted by someone from Ameren Illinois’s energy efficiency implementation team. Please supply appropriate information.
Contact Name:_____________________________
Business Name:____________________________
Preferred contact method(s) – Select all that apply:
phone e-mail postal mail
Daytime phone number :______________________ [ALLOW 20 CHARACTERS]
E-mail address:_____________________________
Postal address:_____________________________
_____________________________
_____________________________
2. No, we would NOT like to be contacted [IF C2=1, GO TO FOLLOW-UP REQUEST VERIFICATION SCREEN; IF C2=2, SKIP TO FOLLOW-UP REQUEST CONFIRMATION / COMMENT SCREEN] [FOLLOW-UP REQUEST VERIFICATION SCREEN] Please review the contact information you provided and verify that it is complete and correct: [DISPLAY PROVIDED INFORMATION] If you would like to edit any of this information, please click the “Back” button to go to the previous screen, where you can make any needed changes. Otherwise, please click “Next” to submit your information. [PROGRAMMER NOTE: INCLUDE ‘BACK’ BUTTON ON THIS SCREEN WHEN SURVEY IS LIVE] [FOLLOW-UP REQUEST CONFIRMATION / COMMENT SCREEN] [IF C2=1, DISPLAY, “You have successfully submitted your contact information! You will be contacted by a representative from the Ameren Illinois energy efficiency implementation team within 10 business days.”]
If, at this time, you’d like to make any general comments or provide feedback to Ameren Illinois, please use the following text box: [RECORD TEXT; ALLOW A HIGH MAX NUMBER OF CHARACTERS FOR LONG COMMENTS] (Note: Any comments you submit here will not be linked to your previous survey responses or to any other identifying information when communicated to Ameren Illinois.)
Business Program Interest Survey Questionnaire
EnerNOC Utility Solutions Consulting E-35
Please click “Next” to submit your comment or to proceed without leaving a comment. [GOODBYE SCREEN] [IF STATUS=C, DISPLAY, “Thank you very much for your help with our research. It is greatly appreciated! Have a nice day!”] [IF STATUS=T OR O, DISPLAY, “Thank you. Have a nice day!”] [INCLUDE “Close window” BUTTON]
SURVEY CLOSED MESSAGE – DISPLAY ONLY IF RESPONDENT REACHES SITE AFTER WE HAVE CLOSED THE SURVEY We appreciate your time and effort in responding to the survey invitation you received, but the survey sponsored by Ameren Illinois is now closed.
If you would like information on how your business can save money on energy bills, please visit Ameren Illinois at
www.actonenergy.com
Thank you. Have a nice day!
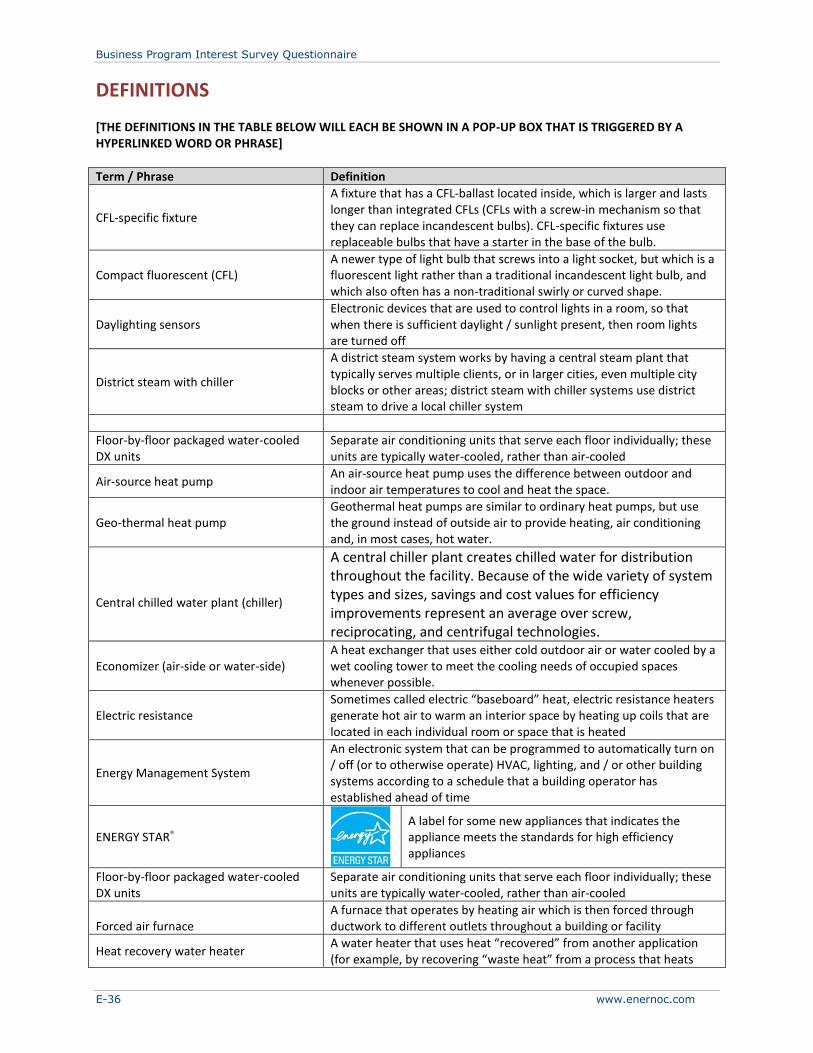
Business Program Interest Survey Questionnaire
E-36 www.enernoc.com
DEFINITIONS [THE DEFINITIONS IN THE TABLE BELOW WILL EACH BE SHOWN IN A POP-UP BOX THAT IS TRIGGERED BY A HYPERLINKED WORD OR PHRASE]
Term / Phrase Definition
CFL-specific fixture
A fixture that has a CFL-ballast located inside, which is larger and lasts longer than integrated CFLs (CFLs with a screw-in mechanism so that they can replace incandescent bulbs). CFL-specific fixtures use replaceable bulbs that have a starter in the base of the bulb.
Compact fluorescent (CFL) A newer type of light bulb that screws into a light socket, but which is a fluorescent light rather than a traditional incandescent light bulb, and which also often has a non-traditional swirly or curved shape.
Daylighting sensors Electronic devices that are used to control lights in a room, so that when there is sufficient daylight / sunlight present, then room lights are turned off
District steam with chiller
A district steam system works by having a central steam plant that typically serves multiple clients, or in larger cities, even multiple city blocks or other areas; district steam with chiller systems use district steam to drive a local chiller system
Floor-by-floor packaged water-cooled DX units
Separate air conditioning units that serve each floor individually; these units are typically water-cooled, rather than air-cooled
Air-source heat pump An air-source heat pump uses the difference between outdoor and indoor air temperatures to cool and heat the space.
Geo-thermal heat pump Geothermal heat pumps are similar to ordinary heat pumps, but use the ground instead of outside air to provide heating, air conditioning and, in most cases, hot water.
Central chilled water plant (chiller)
A central chiller plant creates chilled water for distribution throughout the facility. Because of the wide variety of system types and sizes, savings and cost values for efficiency improvements represent an average over screw, reciprocating, and centrifugal technologies.
Economizer (air-side or water-side) A heat exchanger that uses either cold outdoor air or water cooled by a wet cooling tower to meet the cooling needs of occupied spaces whenever possible.
Electric resistance
Sometimes called electric “baseboard” heat, electric resistance heaters generate hot air to warm an interior space by heating up coils that are located in each individual room or space that is heated
Energy Management System
An electronic system that can be programmed to automatically turn on / off (or to otherwise operate) HVAC, lighting, and / or other building systems according to a schedule that a building operator has established ahead of time
ENERGY STAR®
A label for some new appliances that indicates the appliance meets the standards for high efficiency appliances
Floor-by-floor packaged water-cooled DX units
Separate air conditioning units that serve each floor individually; these units are typically water-cooled, rather than air-cooled
Forced air furnace
A furnace that operates by heating air which is then forced through ductwork to different outlets throughout a building or facility
Heat recovery water heater A water heater that uses heat “recovered” from another application (for example, by recovering “waste heat” from a process that heats
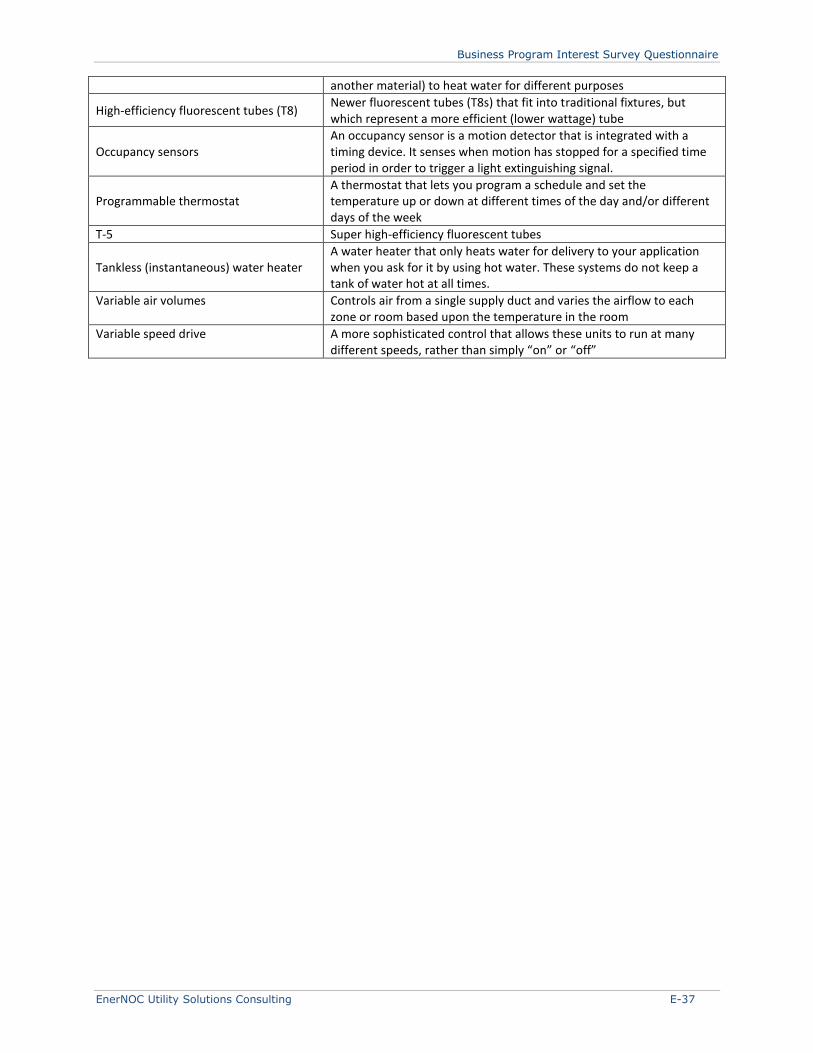
Business Program Interest Survey Questionnaire
EnerNOC Utility Solutions Consulting E-37
another material) to heat water for different purposes
High-efficiency fluorescent tubes (T8) Newer fluorescent tubes (T8s) that fit into traditional fixtures, but which represent a more efficient (lower wattage) tube
Occupancy sensors An occupancy sensor is a motion detector that is integrated with a timing device. It senses when motion has stopped for a specified time period in order to trigger a light extinguishing signal.
Programmable thermostat A thermostat that lets you program a schedule and set the temperature up or down at different times of the day and/or different days of the week
T-5 Super high-efficiency fluorescent tubes
Tankless (instantaneous) water heater A water heater that only heats water for delivery to your application when you ask for it by using hot water. These systems do not keep a tank of water hot at all times.
Variable air volumes Controls air from a single supply duct and varies the airflow to each zone or room based upon the temperature in the room
Variable speed drive A more sophisticated control that allows these units to run at many different speeds, rather than simply “on” or “off”

EnerNOC Utility Solutions Consulting F-1
APPENDIX F
BUSINESS SATURATION SURVEY QUESTIONNAIRE
Ameren Illinois DSM Market Potential – Saturation Questionnaire SMALL TO MEDIUM BUSINESS DRAFT May 30th, 2012
QUALIFYING CRITERIA AND QUOTAS
Qualifying Criteria
• The respondent must be familiar with the energy-related aspects of their business’s operations at that
location
• Utility bills must be paid for that location
Hard Quotas
• Total: n=xxx
• Other hard quotas TBD Soft Quotas
• TBD
Tracking Variables
• Electric Only (S3=1-3 AND S3B=5 OR 6)
• Gas Only (S3B=1-3 AND S3=4 OR 5)
Business Saturation Survey Questionnaire
F-2 www.enernoc.com
RESPONDENT IDENTIFICATION / VERIFICATION
Welcome. This survey is sponsored by Ameren Illinois.
[PROGRAMMER: INCLUDE AMEREN ILLINOIS LOGO]
Survey results will be collected and summarized by Definitive Insights, a market research company.
Please enter the “Survey ID#” that appears on the survey invitation postcard you received. This Survey ID# should be located just above the mailing address on the front side of your postcard.
Survey ID# : ________________
We at Ameren Illinois and Definitive Insights value your privacy. We will use the information you provide for research purposes only and will NOT share it with third parties for marketing purposes. Information you provide will be stored in a secure database. If you have questions about our privacy practices or would like to get any other information about this study, please contact us via one of the following methods:
e-mail: [email protected]
phone: 1-888-742-4511
postal mail: Definitive Insights ATTN: Ameren Illinois Project Director 601 SW Oak Street Portland, Oregon 97205
[PROGRAMMER: VERIFY VALID CODE AND READ IN ALL VARIABLES FROM SAMPLE FILE]
INTRODUCTION
Thank you for taking time to see if you and your business qualify to participate in a new research study about energy. The study is sponsored by Ameren Illinois, and it has a very important purpose. Ameren Illinois is delivering programs to help its customers use energy more efficiently. Your answers to this survey will help the company to improve these programs so that they work best for everyone. Your business represents one of a small number of businesses that are being asked to respond to the survey. To show our appreciation for the time and effort you place into completing the survey, we will offer you a $25 Visa card upon submitting your answers. (Note: Payment may be declined if required by your company’s policies.) You will first be asked a few questions to make sure your business qualifies for participation. If you do qualify, you will then be invited to complete the full survey. If you need to pause the survey at any time, you can come back later and begin again where you left off. Simply save the URL and the Survey ID# from your survey invitation to access your survey again. The survey will automatically take you to the point where you left off. Please note: any word or phrase that appears in blue, underlined font will have a hyperlinked definition that pops-up in a separate browser window when you click on that word or phrase. Clicking on any of these hyperlinks will NOT make you navigate away from the survey site. Please click “Next” to begin.
Business Saturation Survey Questionnaire
EnerNOC Utility Solutions Consulting F-3
RESPONDENT SCREENING
S1. Which of the following best describes your familiarity with the energy-related aspects of your business
operations at [READ IN ADDRESS FROM SAMPLE]?
1. You are very familiar with the energy-related aspects of your operations at this location 2. You are fairly familiar with the energy-related aspects of your operations at this location 3. You are not very familiar with the energy-related aspects of your operations at this location [REQUEST
REFERRAL TO DECISION MAKER AND THEN TERMINATE VIA S2] 4. Don’t know [REQUEST REFERRAL TO DECISION MAKER AND THEN TERMINATE VIA S2]
[IF S1=1-2, SKIP TO S3; OTHERWISE SHOW S2 AND TERMINATE WITHOUT SHOWING STANDARD TERMINATE LANGUAGE] S2. Thank you for taking the time to see if you are eligible to participate in this survey. At this time we need
responses from someone in your organization who is more familiar with the energy-related aspects of your business operations at this location.
We would appreciate it if you would provide that person with the invitation postcard you received or refer them to the following link so that they may complete this survey:
Link: [INSERT URL THAT INCLUDES SURVEY ID#] [PROGRAMMER NOTE: IF A RESPONDENT TERMINATES VIA S2. DELETE DATA COLLECTED AND RESET SURVEY REENTRY POSITION FOR THAT SURVEY ID# BACK TO THE BEGINNING OF THE SURVEY. RECORD THE DATA DELETED FOR THAT SURVEY ID# ELSEWHERE SO WE CAN TRACK THE NUMBER OF TIMES AND REASONS RESPONDENTS DISQUALIFY AT S2 AS WELL AS THE NUMBER OF TIMES THESE PREVIOUSLY USED SURVEY ID#’S ARE REUSED. FOR ALL RESPONDENTS THAT DO NOT TERMINATE VIA S5R, DO NOT ALLOW SURVEY ID# TO BE USED AGAIN.] {NOTE: THIS WILL ALLOW A RESPONDENT WHO DOES NOT PERSONALLY QUALIFY TO FORWARD THEIR SURVEY ID# TO A CO-WORKER WHO MAY BE BETTER QUALIFIED TO ANSWER THE SURVEY.} S3. Which of the following best describes how your business is billed for electricity at [READ IN ADDRESS
FROM SAMPLE]?
1. We are billed directly by Ameren Illinois for the electricity we use 2. We are NOT billed directly by Ameren Illinois for the electricity we use; our electric bill is handled
by another part of our company or by a third party service provider (e.g., City and Village Tax Office, etc.), but ultimately, our company is responsible for the cost for our electricity
3 We are NOT billed directly by Ameren Illinois for the electricity we use; the cost for our electricity is included in our rent/lease
4. We are served by another utility; not Ameren Illinois 5. Don’t know
S3b. Which of the following best describes how your business is billed for natural gas at [READ IN ADDRESS
FROM SAMPLE]?
1. We do not use natural gas 2. We are billed directly by Ameren Illinois for the natural gas we use 3. We are NOT billed directly by Ameren Illinois for the natural gas we use; our electric bill is handled
by another part of our company or by a third party service provider (e.g., City and Village Tax Office), but ultimately, our company is responsible for the cost for our natural gas
4. We are NOT billed directly by Ameren Illinois for the natural gas we use; the cost for our natural gas is included in our rent/lease
Business Saturation Survey Questionnaire
F-4 www.enernoc.com
5. We are served by another utility; not Ameren Illinois 6. Don’t know
[TERMINATE IF S3=4 or 5 AND S3B=5 or 6] [PROGRAMMER: DISPLAY DIRECTLY BELOW S3 ON SCREEN: “PLEASE NOTE THAT ALL OF OUR REMAINING QUESTIONS REFER SPECIFICALLY TO THE FACILITY AT THE LOCATION CITED ABOVE”] [CREATE TRACKING VARIABLE: (S3=1-3 AND S3B=5 OR 6) = ELECTRIC ONLY (S3B=1-3 AND S3=4 OR 5) = GAS ONLY] [IF S3=1,2 OR S3B=1,2, ASK S4; OTHERWISE TERMINATE] S4. Does your business own or lease the building space at this location?
If you both lease some space, and own some space at this location, which accounts for the majority of the space?
1. Own (or in the process of buying it) 2. Lease / rent
S5. Does your operation at this location occupy any enclosed space, or is it an outdoor structure or operation,
such as a billboard, a parking lot, a communications tower, or the like?
1. Occupies enclosed space 2. Is an outdoor structure or facility [TERMINATE AFTER S6]
[IF S5=2, ASK S6 AND THEN TERMINATE; OTHERWISE SKIP TO S7] S6. What type of outdoor structure does your organization operate at this site?
1. Billboard 2. Communications / telecommunications tower or other facility 3. Pump 4. Parking lot 5. Traffic light or other type of outdoor lighting 990. Other [SPECIFY]

Business Saturation Survey Questionnaire
EnerNOC Utility Solutions Consulting F-5
S7. Which of the following best describes the type of facility your organization occupies?
1. Office (finance, insurance, real estate, law, etc.) 2. Retail (department stores, services, boutiques, etc.) 3. Grocery (supermarkets, convenience store, market, etc.) 4. Restaurant (sit-down, fast food, coffee shop, etc.) 5. Warehouse 6. School (day care, pre-school, elementary, secondary) 7. College, university or trade school 8. Health Care (health practitioner office, hospital, urgent care center, etc.) 9. Nursing home / assisted living facility / residential treatment facility 10. Lodging facility (hotel, motel, bed and breakfast, etc.) 11. Not-for profit housing facility (shelter, prison, jail, etc.) 12. Entertainment / recreation facility (movie theater, bowling alley, health club/gym, library, museum,
etc.) 13. Public assembly facility (convention / conference center, etc.) 14. Worship (church, temple, etc.) 15. Multi-use or shopping mall (i.e., mixed use of space for offices, restaurants, stores, service,
apartments, etc.) 16. Manufacturing, production, or processing facility (including for-profit businesses and governmental
facilities) 990. Other [SPECIFY]
S8. Which of the following best describes the activity in which your business is engaged at this location?
Please select the one option that best describes the activity.
{NOTE TO TEAM: IF THE RESPONDENT SELECTS RESPONSE “15” ABOVE (“MIXED USE”), THEY ARE SHOWN ALL POSSIBLE OPTIONS FOR BUSINESS ACTIVITY EXCEPT HOSPITAL, WAREHOUSE, AND MANUFACTURING / PROCESSING}
Traditional Office-Based Business [IF S7=1 OR 15 OR 990, DISPLAY CODES 1-7]
1. Finance
2. Insurance
4. Real estate / construction
5. Government
6. Other not-for-profit
7. Other office [SPECIFY]
Retail [IF S7=2 OR 15 OR 990, DISPLAY CODES 8-19]
8. Major retail store
9. Department store
10. Small retail (boutique, store in strip mall)
11. Convenience store
12. Supermarket
13. Market
14. Laundry
15. Dry cleaning
16. Copy center
17. Barber / salon
18. Gas station / auto shop
19. Other retail [SPECIFY]
Grocery [IF S7=3 OR 15 OR 990, DISPLAY CODES 20-23]
20. Supermarket
21. Convenience store
Business Saturation Survey Questionnaire
F-6 www.enernoc.com
22. Market
23. Other grocery [SPECIFY]
Restaurant / Food Service [IF S7=4 OR 15 OR 990, DISPLAY CODES 24-28]
24. Sit-down restaurant
25. Fast food diner
26. Bakery
27. Coffee shop
28. Other restaurant [SPECIFY]
Warehouse [IF S7=5 OR 990, DISPLAY CODES 29-32]
29. Refrigerated warehouse
30. Non-refrigerated warehouse
31. Combination of refrigerated and non-refrigerated space
32. Other warehouse [SPECIFY]
School [IF S7=6 OR 15 OR 990, DISPLAY CODES 33-36]
33. Preschool / daycare
34. Elementary school
35. Secondary school
36. Other pre-college [SPECIFY]
College, University or Trade School [IF S7=7 OR 15 OR 990, DISPLAY CODES 37-40]
37. College
38. University
39. Trade school
40. Other post-secondary [SPECIFY]
Health Care [IF S7=8 OR 15 OR 990, DISPLAY CODES 80-84]
85. Medical / dental office or office for other health practitioners
80. General medical or surgical hospital
81. Veterinary hospital
82. Other hospital [SPECIFY]
83. Urgent care center
84. Other health care facility [SPECIFY]
Nursing Home / Assisted Living [IF S7=9 OR 15 OR 990, DISPLAY CODES 41-44]
41. Nursing home
42. Assisted living facility
43. Residential treatment facility
44. Other care facility [SPECIFY]
Lodging [IF S7=10 OR 15 OR 990, DISPLAY CODES 41-44]
45. Hotel
46. Motel
47. Bed & Breakfast
48. Other lodging [SPECIFY]
Not-For-Profit Housing [IF S7=11 OR 15 OR 990, DISPLAY CODES 45-47]
49. Shelter
50. Prison / jail
51. Other not-for-profit housing [SPECIFY]
Entertainment / Recreation [IF S7=12 OR 15 OR 990, DISPLAY CODES 48-54]
52. Health club / gym
53. Movie theater
54. Theater
55. Library
56. Museum
57. Bowling alley
58. Other entertainment / recreation [SPECIFY]
Public Assembly [IF S7=13 OR 15 OR 990, DISPLAY CODES 55-57]
Business Saturation Survey Questionnaire
EnerNOC Utility Solutions Consulting F-7
59. Conference / convention center
60. Community center
61. Other public assembly [SPECIFY]
Worship [IF S7=14 OR 15 OR 990, DISPLAY CODES 58-61]
62. Church
63. Temple
64. Synagogue
65. Other worship [SPECIFY]
Manufacturing / Production / Processing [IF S7=16 OR 990, DISPLAY CODES 62-74]
66. Agricultural production or farming
67. Chemical processing
68. Electronics / technology
69. Food / beverage production or processing
70. General / light assembly or manufacturing
71. Glass production or processing
72. Metals production or processing or fabricated metal work
73. Machinery / appliance / equipment manufacturing
74. Paper products processing, printing or manufacturing
75. Textiles / apparel production or processing
76. Water / wastewater treatment
77. Wood products manufacturing
78. Other manufacturing / processing [SPECIFY]
Something else [IF S7=15 OR 990, DISPLAY CODE 79]
79. Something else [SPECIFY]
S9. Approximately how many people are employed full-time at this location?
1. Less than 5 employees 2. 5 – 9 3. 10 – 19 4. 20 – 49 5. 50 – 99 6. 100 – 199 7. 200 – 299 8. 300 – 399 9. 400 – 499 10. 500 – 999 11. 1,000 – 2,499 12. 2,500 – 4,999 13. 5,000 – 9,999 14. 10,000 – 24,999 15. 25,000 or more employees
S10. Which of the following uses of electricity and natural gas do you pay for at this location? In other words,
does your electric and/or gas bill include the cost to…? Select all that apply.
1. Heat some or all of your space 2. Cool some or all of your space 3. Provide hot water for your use 4. Provide interior lighting 5. Provide exterior lighting
Business Saturation Survey Questionnaire
F-8 www.enernoc.com
{NOTE TO TEAM: THESE RESPONSES WILL BE USED TO SCREEN RESPONDENTS OUT OF THE RELEVANT END USE SECTIONS BELOW; I.E., IF THEY SAY THEIR ENERGY BILL DOES NOT COVER SPACE HEATING, THEY WILL BE SKIPPED OUT OF THE SPACE HEATING SECTION} S11. Which of the following are present at this location? Select all that apply.
1. Natural gas service 2. Propane service 3. Purchased steam or hot water 4. Fuel oil for one or more end uses 5. Electric Vehicle charging stations 6. None of the above [EXCLUSIVE]
[IF NOT OVER-QUOTA, GO TO INVITATION LANGUAGE; OTHERWISE TERMINATE]
Business Saturation Survey Questionnaire
EnerNOC Utility Solutions Consulting F-9
TERMINATE LANGUAGE FOR NON-QUALIFYING OR OVER-QUOTA RESPONDENTS We appreciate the time and effort you have spent in responding to our survey invitation and answering these initial questions, which were designed to see if you are eligible to participate in this research study. In order to achieve a representative sample, quotas with specific criteria have been designated. At this point, we have reached the number of respondents we can accept from individuals with your type of experience or background. Again, we would like to thank you for your time and effort.
If you would like information on how your business can save money on energy bills, please visit us at www.actonenergy.com.
Q76. Additionally, if you would like someone from Ameren Illinois energy efficiency implementation team to
contact you about further energy efficiency opportunities, please provide the appropriate contact information below: (NOTE: All other information you have provided in this survey will continue to remain anonymous, even if you choose to be contacted. None of your prior responses will be communicated to the Ameren Illinois energy efficiency implementation team.)
1. Yes, we would like to be contacted by someone from Ameren Illinois energy efficiency implementation team. Please supply the appropriate contact information below.
Contact Name:____________________________
Business Name:____________________________
Preferred contact method(s) – Select all that apply:
phone e-mail postal mail
Daytime phone number :______________________
E-mail address:_____________________________
Postal address:_____________________________
_____________________________
_____________________________
2. No, we would NOT like to be contacted
[IF Q76=1, GO TO CONTACT INFORMATION FOR AMEREN ILLINOIS VERIFICATION SCREEN; IF Q76=2, SKIP TO GOOD-BYE SCREEN]
Business Saturation Survey Questionnaire
F-10 www.enernoc.com
INVITATION LANGUAGE FOR QUALIFYING RESPONDENTS
Thank you for your responses so far. You and your business have qualified to complete this survey. As we indicated earlier, only a limited number of individuals will be able to complete this survey, so we appreciate your time in filling out the survey as completely as possible. The survey should take about 20 minutes to complete. Once you complete the survey you will be eligible to receive our $25 thank you payment. Information about how to receive the payment will be provided at the end of the survey. Your responses are important to us, so please press “Next” to begin answering the survey questions. All information provided in this survey will be kept strictly confidential, and at no time will you be asked to purchase anything. If you need to pause the survey at any time, you can come back later and begin again where you left off. Simply save the personalized URL to access your survey again. The survey will automatically take you to the point where you left off. Please note: any word or phrase that appears in blue, underlined font will have a hyperlinked definition that pops-up in a separate browser window when you click on that word or phrase. Clicking on any of these hyperlinks will NOT make you navigate away from the survey site. As you complete the survey, you will not be able to use your browser’s “back” button. If you mistakenly press your browser’s “back” button, you will need to press the “refresh” button to continue the survey.
BUILDING TYPE – BUSINESS-USE AREA [PROGRAMMER NOTE: THROUGHOUT THIS SURVEY, WORDS OR PHRASES WITH BLUE, UNDERLINED FONT WILL HAVE HYPERLINKED DEFINITIONS THAT POP-UP WHEN THE RESPONDENT CLICKS ON THE WORD OR PHRASE. HYPERLINKED DEFINITIONS ARE PROVIDED AT THE END OF THIS DOCUMENT. ] The first several questions are about the building areas, your company uses or occupies at [READ IN ADDRESS FROM SAMPLE]. Q1. Approximately when was the facility your business uses at this location constructed? If your business is located in several buildings across a campus/complex, please estimate the average year
across all buildings. 1. Before 1900
2. 1900-1919 3. 1920-1929 4. 1930-1939 5. 1940-1949 6. 1950-1959 7. 1960-1969 8. 1970-1979 9. 1980-1989 10. 1990-1999 11. 2000-2009 12. 2010-present 13. Not sure
Q2. How many years has your business occupied this facility?
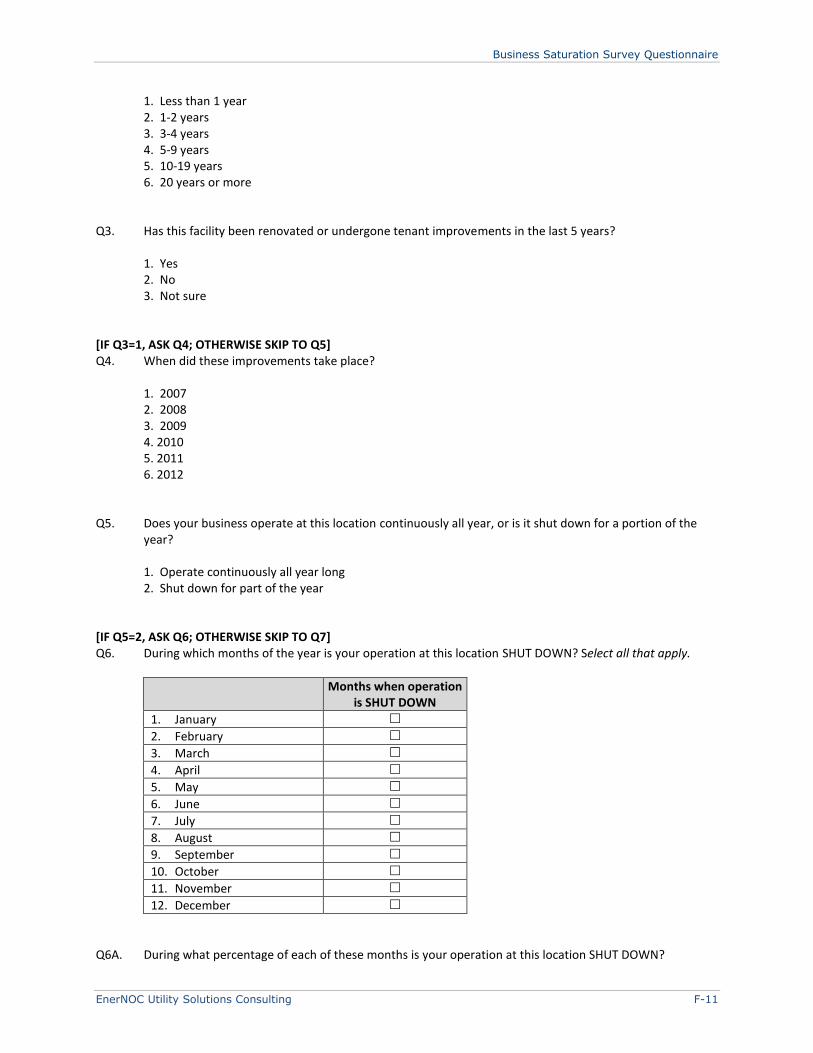
Business Saturation Survey Questionnaire
EnerNOC Utility Solutions Consulting F-11
1. Less than 1 year 2. 1-2 years 3. 3-4 years 4. 5-9 years 5. 10-19 years 6. 20 years or more
Q3. Has this facility been renovated or undergone tenant improvements in the last 5 years?
1. Yes 2. No 3. Not sure
[IF Q3=1, ASK Q4; OTHERWISE SKIP TO Q5] Q4. When did these improvements take place?
1. 2007 2. 2008 3. 2009 4. 2010 5. 2011 6. 2012
Q5. Does your business operate at this location continuously all year, or is it shut down for a portion of the year?
1. Operate continuously all year long 2. Shut down for part of the year
[IF Q5=2, ASK Q6; OTHERWISE SKIP TO Q7] Q6. During which months of the year is your operation at this location SHUT DOWN? Select all that apply.
Months when operation
is SHUT DOWN
1. January
2. February
3. March
4. April
5. May
6. June
7. July
8. August
9. September
10. October
11. November
12. December
Q6A. During what percentage of each of these months is your operation at this location SHUT DOWN?
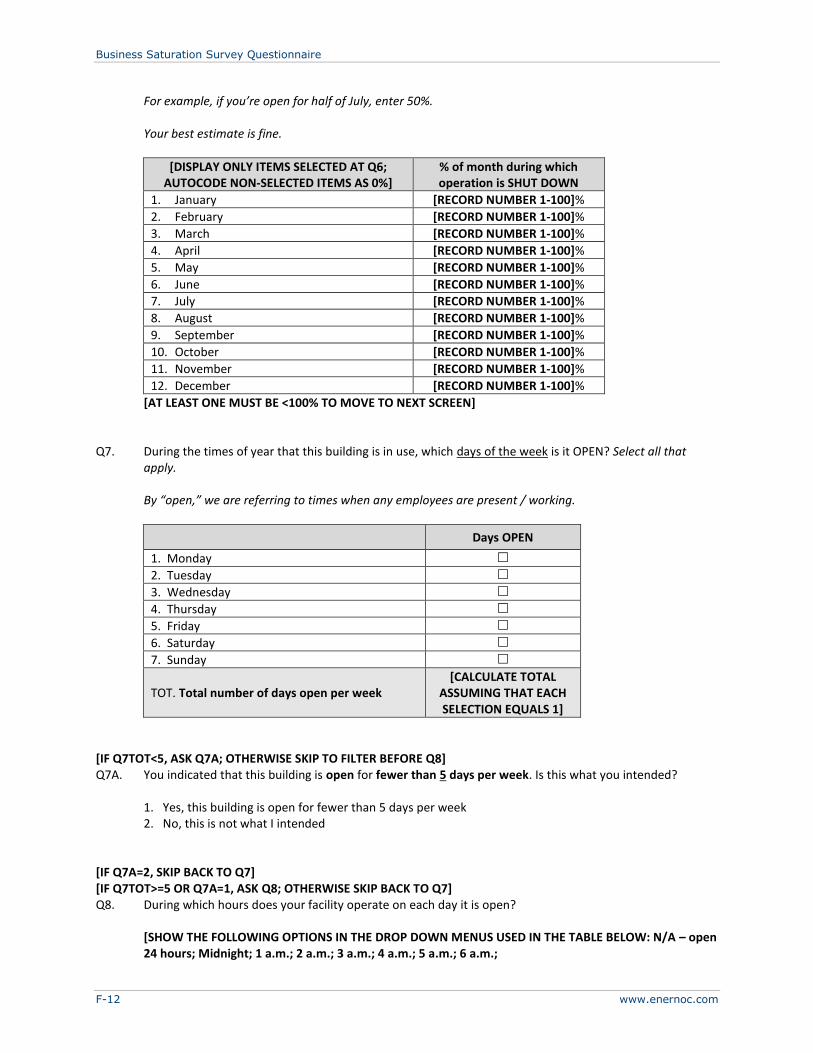
Business Saturation Survey Questionnaire
F-12 www.enernoc.com
For example, if you’re open for half of July, enter 50%.
Your best estimate is fine.
[DISPLAY ONLY ITEMS SELECTED AT Q6; AUTOCODE NON-SELECTED ITEMS AS 0%]
% of month during which operation is SHUT DOWN
1. January [RECORD NUMBER 1-100]%
2. February [RECORD NUMBER 1-100]%
3. March [RECORD NUMBER 1-100]%
4. April [RECORD NUMBER 1-100]%
5. May [RECORD NUMBER 1-100]%
6. June [RECORD NUMBER 1-100]%
7. July [RECORD NUMBER 1-100]%
8. August [RECORD NUMBER 1-100]%
9. September [RECORD NUMBER 1-100]%
10. October [RECORD NUMBER 1-100]%
11. November [RECORD NUMBER 1-100]%
12. December [RECORD NUMBER 1-100]%
[AT LEAST ONE MUST BE <100% TO MOVE TO NEXT SCREEN] Q7. During the times of year that this building is in use, which days of the week is it OPEN? Select all that
apply. By “open,” we are referring to times when any employees are present / working.
Days OPEN
1. Monday
2. Tuesday
3. Wednesday
4. Thursday
5. Friday
6. Saturday
7. Sunday
TOT. Total number of days open per week [CALCULATE TOTAL
ASSUMING THAT EACH SELECTION EQUALS 1]
[IF Q7TOT<5, ASK Q7A; OTHERWISE SKIP TO FILTER BEFORE Q8] Q7A. You indicated that this building is open for fewer than 5 days per week. Is this what you intended?
1. Yes, this building is open for fewer than 5 days per week 2. No, this is not what I intended
[IF Q7A=2, SKIP BACK TO Q7] [IF Q7TOT>=5 OR Q7A=1, ASK Q8; OTHERWISE SKIP BACK TO Q7] Q8. During which hours does your facility operate on each day it is open? [SHOW THE FOLLOWING OPTIONS IN THE DROP DOWN MENUS USED IN THE TABLE BELOW: N/A – open
24 hours; Midnight; 1 a.m.; 2 a.m.; 3 a.m.; 4 a.m.; 5 a.m.; 6 a.m.;
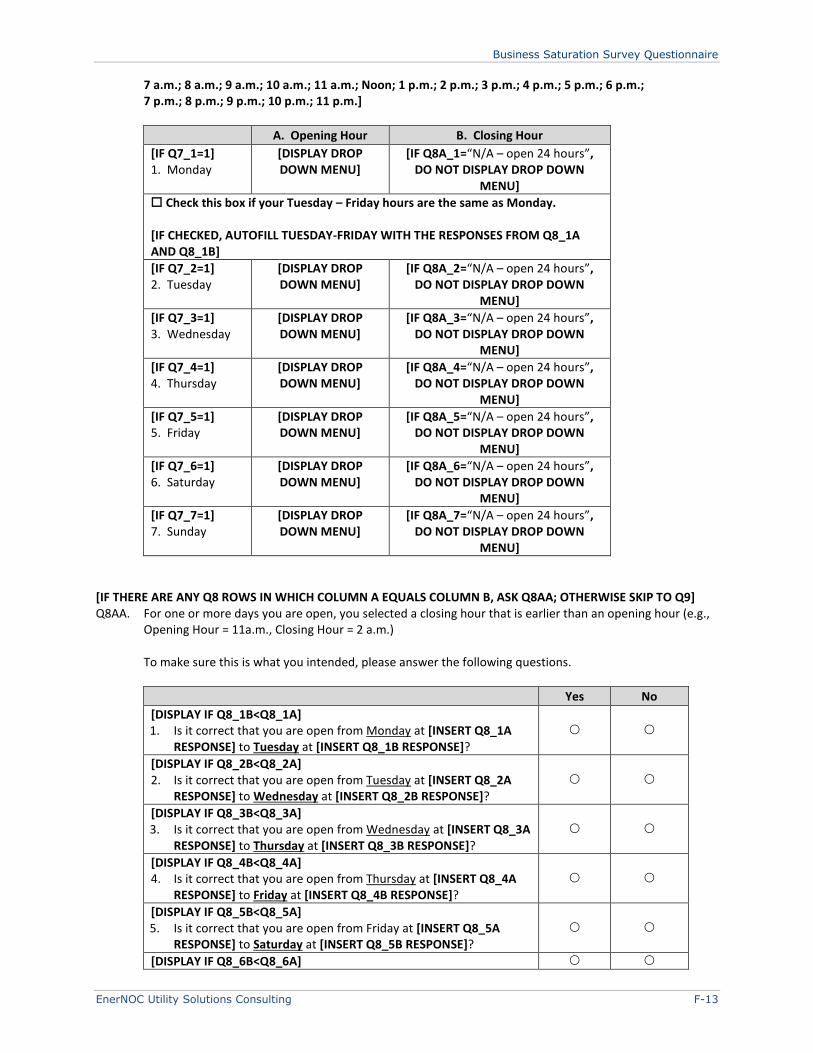
Business Saturation Survey Questionnaire
EnerNOC Utility Solutions Consulting F-13
7 a.m.; 8 a.m.; 9 a.m.; 10 a.m.; 11 a.m.; Noon; 1 p.m.; 2 p.m.; 3 p.m.; 4 p.m.; 5 p.m.; 6 p.m.; 7 p.m.; 8 p.m.; 9 p.m.; 10 p.m.; 11 p.m.]
A. Opening Hour B. Closing Hour
[IF Q7_1=1] 1. Monday
[DISPLAY DROP DOWN MENU]
[IF Q8A_1=“N/A – open 24 hours”, DO NOT DISPLAY DROP DOWN
MENU]
Check this box if your Tuesday – Friday hours are the same as Monday. [IF CHECKED, AUTOFILL TUESDAY-FRIDAY WITH THE RESPONSES FROM Q8_1A AND Q8_1B]
[IF Q7_2=1] 2. Tuesday
[DISPLAY DROP DOWN MENU]
[IF Q8A_2=“N/A – open 24 hours”, DO NOT DISPLAY DROP DOWN
MENU]
[IF Q7_3=1] 3. Wednesday
[DISPLAY DROP DOWN MENU]
[IF Q8A_3=“N/A – open 24 hours”, DO NOT DISPLAY DROP DOWN
MENU]
[IF Q7_4=1] 4. Thursday
[DISPLAY DROP DOWN MENU]
[IF Q8A_4=“N/A – open 24 hours”, DO NOT DISPLAY DROP DOWN
MENU]
[IF Q7_5=1] 5. Friday
[DISPLAY DROP DOWN MENU]
[IF Q8A_5=“N/A – open 24 hours”, DO NOT DISPLAY DROP DOWN
MENU]
[IF Q7_6=1] 6. Saturday
[DISPLAY DROP DOWN MENU]
[IF Q8A_6=“N/A – open 24 hours”, DO NOT DISPLAY DROP DOWN
MENU]
[IF Q7_7=1] 7. Sunday
[DISPLAY DROP DOWN MENU]
[IF Q8A_7=“N/A – open 24 hours”, DO NOT DISPLAY DROP DOWN
MENU]
[IF THERE ARE ANY Q8 ROWS IN WHICH COLUMN A EQUALS COLUMN B, ASK Q8AA; OTHERWISE SKIP TO Q9] Q8AA. For one or more days you are open, you selected a closing hour that is earlier than an opening hour (e.g.,
Opening Hour = 11a.m., Closing Hour = 2 a.m.)
To make sure this is what you intended, please answer the following questions.
Yes No
[DISPLAY IF Q8_1B<Q8_1A] 1. Is it correct that you are open from Monday at [INSERT Q8_1A
RESPONSE] to Tuesday at [INSERT Q8_1B RESPONSE]?
[DISPLAY IF Q8_2B<Q8_2A] 2. Is it correct that you are open from Tuesday at [INSERT Q8_2A
RESPONSE] to Wednesday at [INSERT Q8_2B RESPONSE]?
[DISPLAY IF Q8_3B<Q8_3A] 3. Is it correct that you are open from Wednesday at [INSERT Q8_3A
RESPONSE] to Thursday at [INSERT Q8_3B RESPONSE]?
[DISPLAY IF Q8_4B<Q8_4A] 4. Is it correct that you are open from Thursday at [INSERT Q8_4A
RESPONSE] to Friday at [INSERT Q8_4B RESPONSE]?
[DISPLAY IF Q8_5B<Q8_5A] 5. Is it correct that you are open from Friday at [INSERT Q8_5A
RESPONSE] to Saturday at [INSERT Q8_5B RESPONSE]?
[DISPLAY IF Q8_6B<Q8_6A]
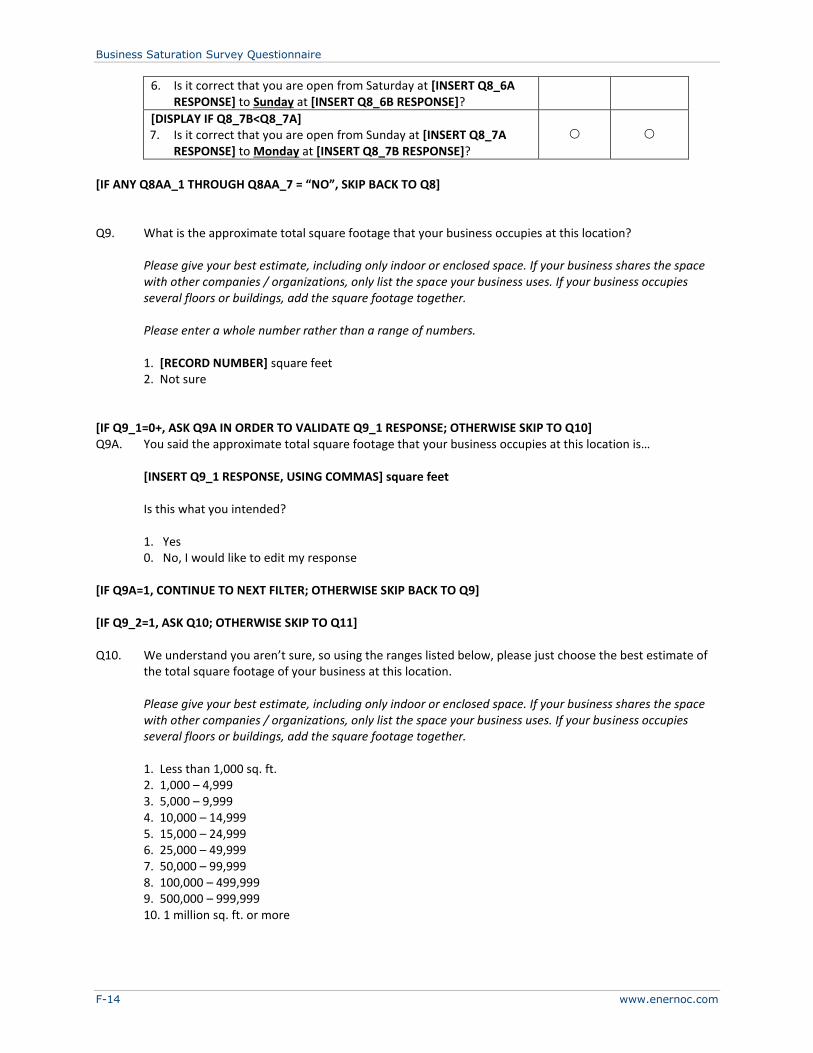
Business Saturation Survey Questionnaire
F-14 www.enernoc.com
6. Is it correct that you are open from Saturday at [INSERT Q8_6A RESPONSE] to Sunday at [INSERT Q8_6B RESPONSE]?
[DISPLAY IF Q8_7B<Q8_7A] 7. Is it correct that you are open from Sunday at [INSERT Q8_7A
RESPONSE] to Monday at [INSERT Q8_7B RESPONSE]?
[IF ANY Q8AA_1 THROUGH Q8AA_7 = “NO”, SKIP BACK TO Q8] Q9. What is the approximate total square footage that your business occupies at this location?
Please give your best estimate, including only indoor or enclosed space. If your business shares the space with other companies / organizations, only list the space your business uses. If your business occupies several floors or buildings, add the square footage together. Please enter a whole number rather than a range of numbers. 1. [RECORD NUMBER] square feet
2. Not sure [IF Q9_1=0+, ASK Q9A IN ORDER TO VALIDATE Q9_1 RESPONSE; OTHERWISE SKIP TO Q10] Q9A. You said the approximate total square footage that your business occupies at this location is… [INSERT Q9_1 RESPONSE, USING COMMAS] square feet
Is this what you intended?
1. Yes 0. No, I would like to edit my response
[IF Q9A=1, CONTINUE TO NEXT FILTER; OTHERWISE SKIP BACK TO Q9] [IF Q9_2=1, ASK Q10; OTHERWISE SKIP TO Q11] Q10. We understand you aren’t sure, so using the ranges listed below, please just choose the best estimate of
the total square footage of your business at this location. Please give your best estimate, including only indoor or enclosed space. If your business shares the space
with other companies / organizations, only list the space your business uses. If your business occupies several floors or buildings, add the square footage together. 1. Less than 1,000 sq. ft. 2. 1,000 – 4,999 3. 5,000 – 9,999 4. 10,000 – 14,999 5. 15,000 – 24,999 6. 25,000 – 49,999 7. 50,000 – 99,999 8. 100,000 – 499,999 9. 500,000 – 999,999 10. 1 million sq. ft. or more
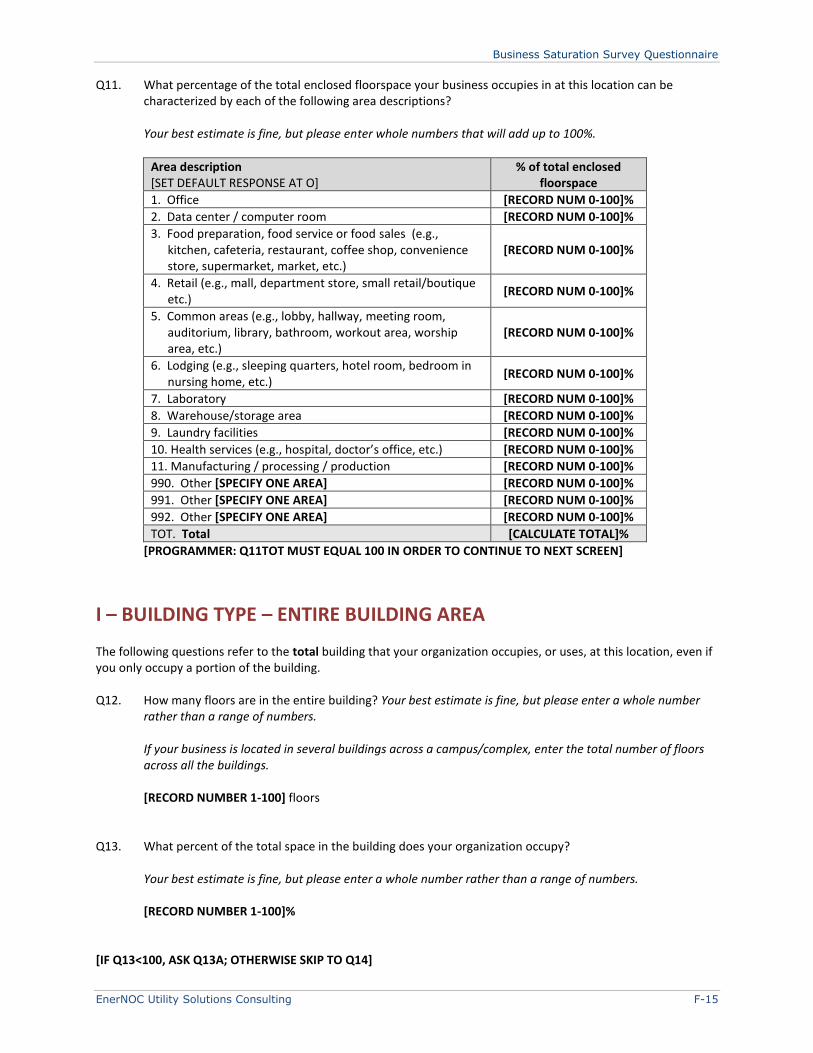
Business Saturation Survey Questionnaire
EnerNOC Utility Solutions Consulting F-15
Q11. What percentage of the total enclosed floorspace your business occupies in at this location can be characterized by each of the following area descriptions?
Your best estimate is fine, but please enter whole numbers that will add up to 100%.
Area description [SET DEFAULT RESPONSE AT O]
% of total enclosed floorspace
1. Office [RECORD NUM 0-100]%
2. Data center / computer room [RECORD NUM 0-100]%
3. Food preparation, food service or food sales (e.g., kitchen, cafeteria, restaurant, coffee shop, convenience store, supermarket, market, etc.)
[RECORD NUM 0-100]%
4. Retail (e.g., mall, department store, small retail/boutique etc.)
[RECORD NUM 0-100]%
5. Common areas (e.g., lobby, hallway, meeting room, auditorium, library, bathroom, workout area, worship area, etc.)
[RECORD NUM 0-100]%
6. Lodging (e.g., sleeping quarters, hotel room, bedroom in nursing home, etc.)
[RECORD NUM 0-100]%
7. Laboratory [RECORD NUM 0-100]%
8. Warehouse/storage area [RECORD NUM 0-100]%
9. Laundry facilities [RECORD NUM 0-100]%
10. Health services (e.g., hospital, doctor’s office, etc.) [RECORD NUM 0-100]%
11. Manufacturing / processing / production [RECORD NUM 0-100]%
990. Other [SPECIFY ONE AREA] [RECORD NUM 0-100]%
991. Other [SPECIFY ONE AREA] [RECORD NUM 0-100]%
992. Other [SPECIFY ONE AREA] [RECORD NUM 0-100]%
TOT. Total [CALCULATE TOTAL]%
[PROGRAMMER: Q11TOT MUST EQUAL 100 IN ORDER TO CONTINUE TO NEXT SCREEN]
I – BUILDING TYPE – ENTIRE BUILDING AREA
The following questions refer to the total building that your organization occupies, or uses, at this location, even if you only occupy a portion of the building. Q12. How many floors are in the entire building? Your best estimate is fine, but please enter a whole number
rather than a range of numbers.
If your business is located in several buildings across a campus/complex, enter the total number of floors across all the buildings. [RECORD NUMBER 1-100] floors
Q13. What percent of the total space in the building does your organization occupy?
Your best estimate is fine, but please enter a whole number rather than a range of numbers. [RECORD NUMBER 1-100]% [IF Q13<100, ASK Q13A; OTHERWISE SKIP TO Q14]
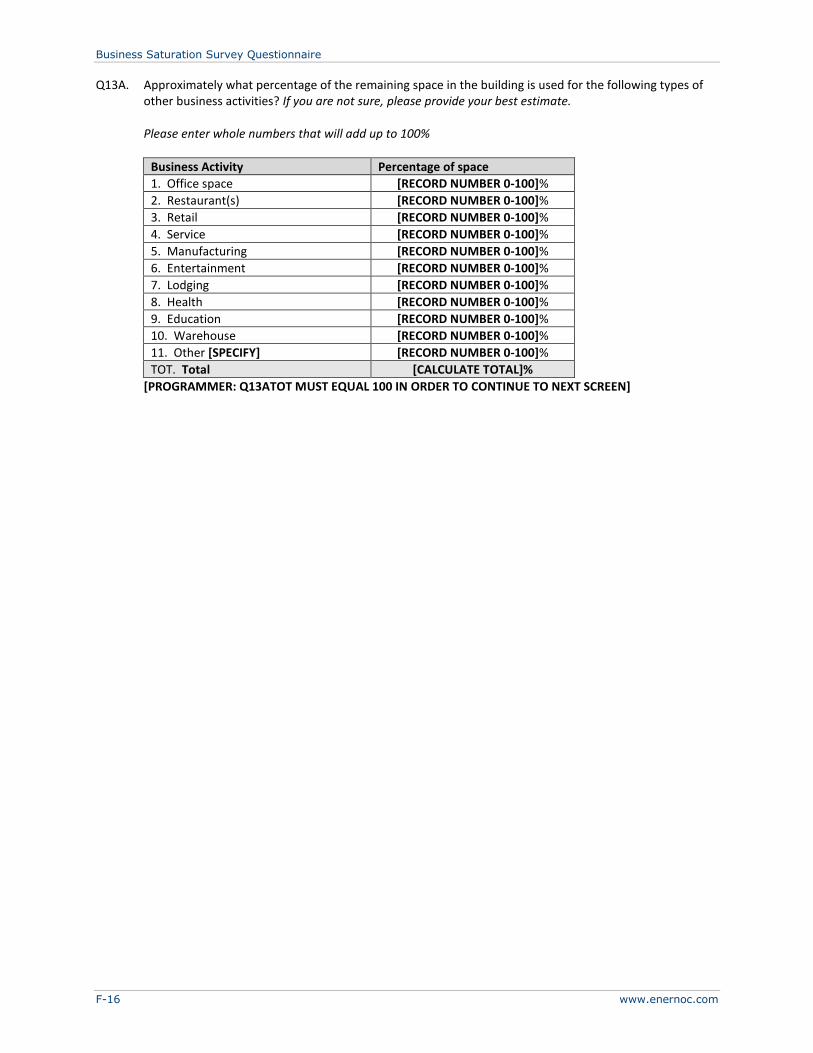
Business Saturation Survey Questionnaire
F-16 www.enernoc.com
Q13A. Approximately what percentage of the remaining space in the building is used for the following types of other business activities? If you are not sure, please provide your best estimate.
Please enter whole numbers that will add up to 100%
Business Activity Percentage of space
1. Office space [RECORD NUMBER 0-100]%
2. Restaurant(s) [RECORD NUMBER 0-100]%
3. Retail [RECORD NUMBER 0-100]%
4. Service [RECORD NUMBER 0-100]%
5. Manufacturing [RECORD NUMBER 0-100]%
6. Entertainment [RECORD NUMBER 0-100]%
7. Lodging [RECORD NUMBER 0-100]%
8. Health [RECORD NUMBER 0-100]%
9. Education [RECORD NUMBER 0-100]%
10. Warehouse [RECORD NUMBER 0-100]%
11. Other [SPECIFY] [RECORD NUMBER 0-100]%
TOT. Total [CALCULATE TOTAL]%
[PROGRAMMER: Q13ATOT MUST EQUAL 100 IN ORDER TO CONTINUE TO NEXT SCREEN]
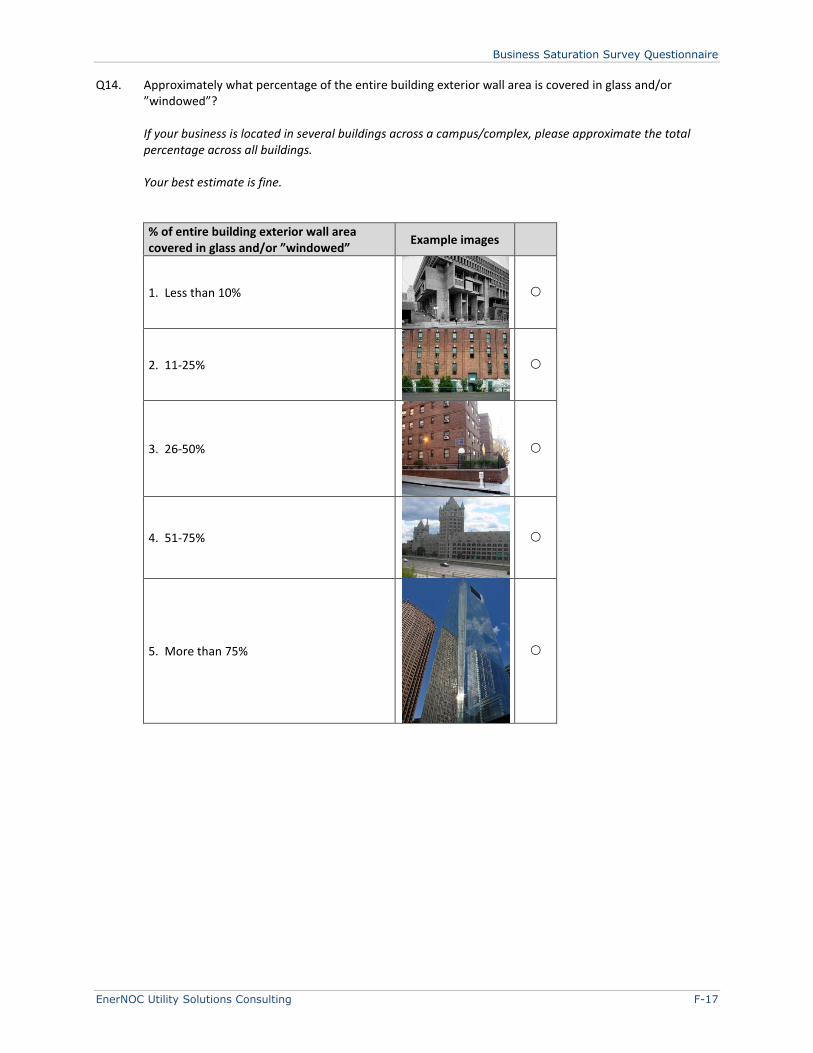
Business Saturation Survey Questionnaire
EnerNOC Utility Solutions Consulting F-17
Q14. Approximately what percentage of the entire building exterior wall area is covered in glass and/or ”windowed”?
If your business is located in several buildings across a campus/complex, please approximate the total percentage across all buildings. Your best estimate is fine.
% of entire building exterior wall area covered in glass and/or ”windowed”
Example images
1. Less than 10%
2. 11-25%
3. 26-50%
4. 51-75%
5. More than 75%
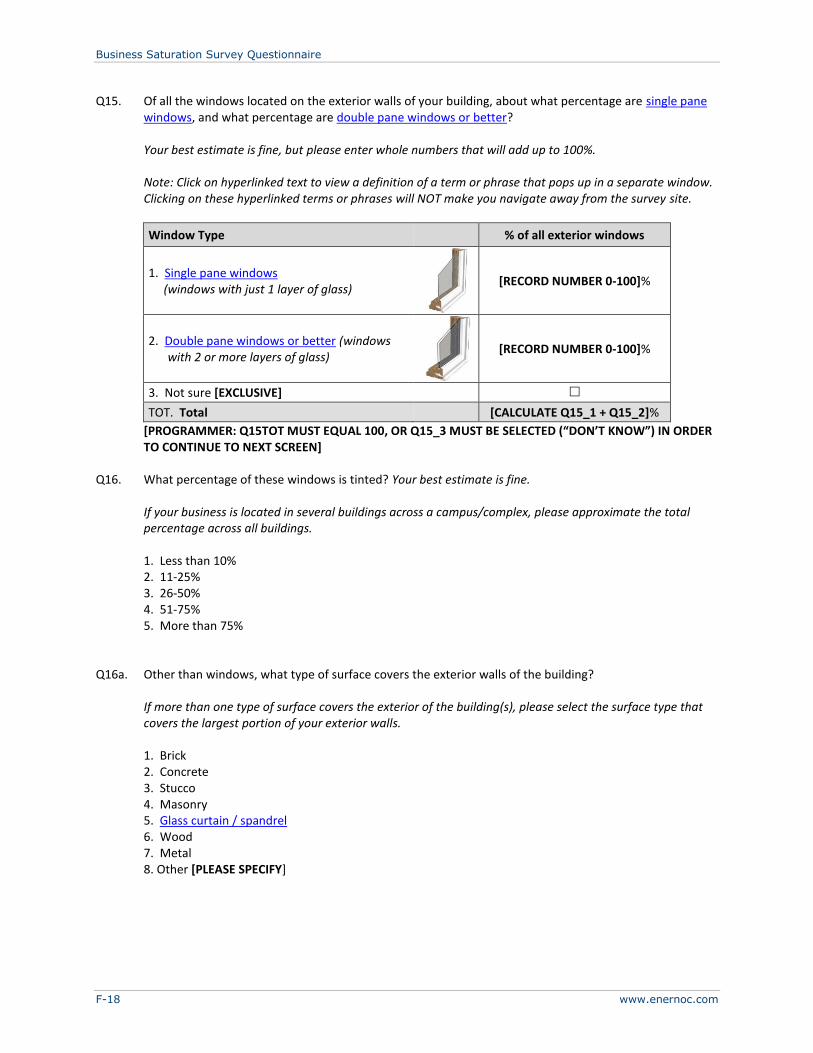
Business Saturation Survey Questionnaire
F-18 www.enernoc.com
Q15. Of all the windows located on the exterior walls of your building, about what percentage are single pane
windows, and what percentage are double pane windows or better?
Your best estimate is fine, but please enter whole numbers that will add up to 100%. Note: Click on hyperlinked text to view a definition of a term or phrase that pops up in a separate window. Clicking on these hyperlinked terms or phrases will NOT make you navigate away from the survey site.
Window Type % of all exterior windows
1. Single pane windows (windows with just 1 layer of glass)
[RECORD NUMBER 0-100]%
2. Double pane windows or better (windows with 2 or more layers of glass)
[RECORD NUMBER 0-100]%
3. Not sure [EXCLUSIVE]
TOT. Total [CALCULATE Q15_1 + Q15_2]%
[PROGRAMMER: Q15TOT MUST EQUAL 100, OR Q15_3 MUST BE SELECTED (“DON’T KNOW”) IN ORDER TO CONTINUE TO NEXT SCREEN]
Q16. What percentage of these windows is tinted? Your best estimate is fine.
If your business is located in several buildings across a campus/complex, please approximate the total percentage across all buildings.
1. Less than 10% 2. 11-25% 3. 26-50% 4. 51-75% 5. More than 75%
Q16a. Other than windows, what type of surface covers the exterior walls of the building?
If more than one type of surface covers the exterior of the building(s), please select the surface type that covers the largest portion of your exterior walls.
1. Brick 2. Concrete 3. Stucco 4. Masonry 5. Glass curtain / spandrel 6. Wood 7. Metal 8. Other [PLEASE SPECIFY]
Business Saturation Survey Questionnaire
EnerNOC Utility Solutions Consulting F-19
Q16b. How would you characterize the insulation level of the exterior walls of the building(s)? If the level of insulation varies within or between the buildings at your business’s location, please answer
for the building that has the largest amount of occupied floorspace.
1. High level of insulation 2. Medium level of insulation 3. Low level of insulation 4. No insulation 5. Not sure
Q17. Which of the following best describes the building roof?
If more than one description applies, please select the option that accounts for the majority of the roof(s).
1. Steep 2. Moderately slanted 3. Flat 4. Not sure
Q18. Which of the following best describes the color of the building roof?
If more than one description applies, please select the option that accounts for the majority of the roof(s).
1. Dark 2. Medium-dark 3. White or light 4. “Green roof” (partially or completely covered with vegetation and soil) 5. Not sure
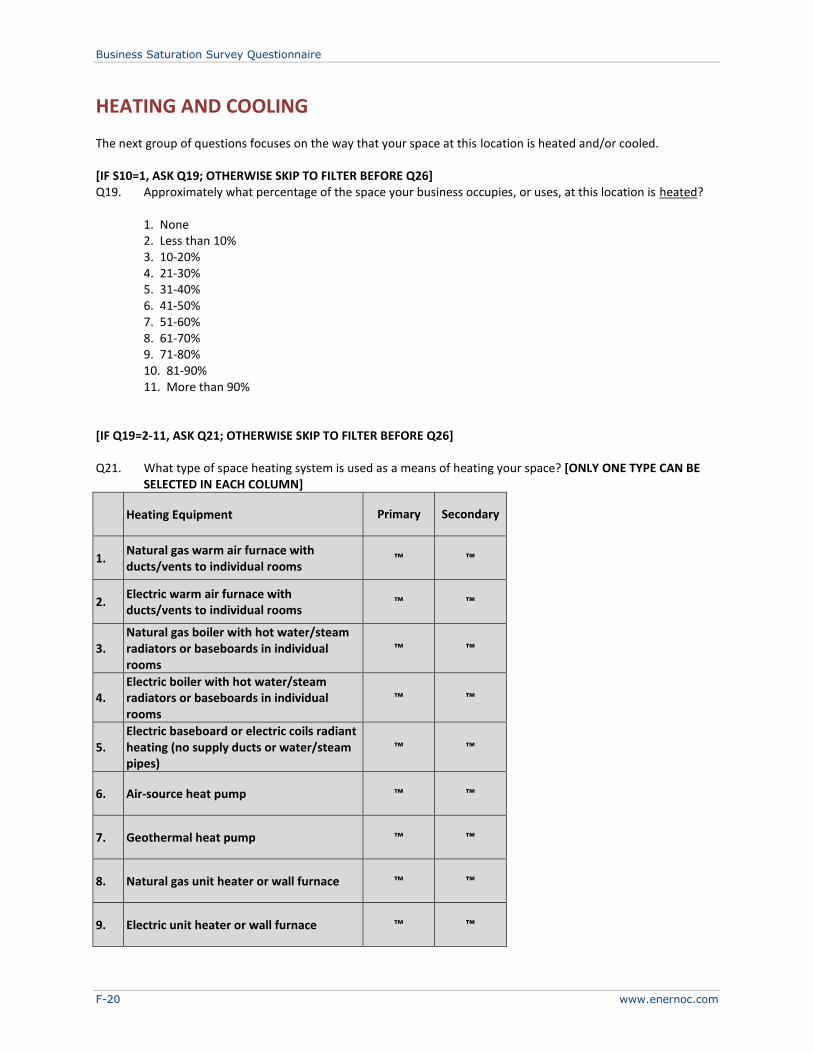
Business Saturation Survey Questionnaire
F-20 www.enernoc.com
HEATING AND COOLING The next group of questions focuses on the way that your space at this location is heated and/or cooled. [IF S10=1, ASK Q19; OTHERWISE SKIP TO FILTER BEFORE Q26] Q19. Approximately what percentage of the space your business occupies, or uses, at this location is heated?
1. None 2. Less than 10% 3. 10-20% 4. 21-30% 5. 31-40% 6. 41-50% 7. 51-60% 8. 61-70% 9. 71-80% 10. 81-90% 11. More than 90%
[IF Q19=2-11, ASK Q21; OTHERWISE SKIP TO FILTER BEFORE Q26] Q21. What type of space heating system is used as a means of heating your space? [ONLY ONE TYPE CAN BE
SELECTED IN EACH COLUMN]
Heating Equipment Primary Secondary
1. Natural gas warm air furnace with ducts/vents to individual rooms
™ ™
2. Electric warm air furnace with ducts/vents to individual rooms
™ ™
3. Natural gas boiler with hot water/steam radiators or baseboards in individual rooms
™ ™
4. Electric boiler with hot water/steam radiators or baseboards in individual rooms
™ ™
5. Electric baseboard or electric coils radiant heating (no supply ducts or water/steam pipes)
™ ™
6. Air-source heat pump ™ ™
7. Geothermal heat pump ™ ™
8. Natural gas unit heater or wall furnace ™ ™
9. Electric unit heater or wall furnace ™ ™
Business Saturation Survey Questionnaire
EnerNOC Utility Solutions Consulting F-21
10. None ™ ™
999. Not sure ™ ™
990. Other (please specify) ™ ™
Business Saturation Survey Questionnaire
F-22 www.enernoc.com
[IF Q21 PRIMARY AND Q21 SECONDARY BOTH EQUAL 11 OR 999, SKIP TO FILTER BEFORE Q26, OTHERWISE ASK
Q22] Q22. When was your primary space heating equipment installed?
Your best estimate is fine.
1. Before 1960 2. 1961-1970 3. 1971-1980 4. 1981-1990 5. 1991-1995 6. 1996-2000 7. 2001-2003 8. 2004-2006 9. 2007-2009 10. 2010-present
Q22b. Which of the following best describes how your system is maintained?
1. Regularly each month 2. Regularly each season / quarter 3. Regularly each year 4. As needed 5. Not sure
[ASK IF ANY 1-10 OR 990 AT Q21=SECONDARY, IF 11-999 AT Q21=SECONDARY, SKIP TO Q26] Q23. What percentage of your total business space is heated with a supplemental heating system?
1. None 2. Less than 10% 3. 11-25% 4. 26-50% 5. 51-75% 6. More than 75%
Q25. When was your supplemental heating system installed? Your best estimate is fine. 1. Before 1990 2. 1990-1995 3. 1996-2000 4. 2001-2003 5. 2004-2006 6. 2007-2009 7. 2010- present
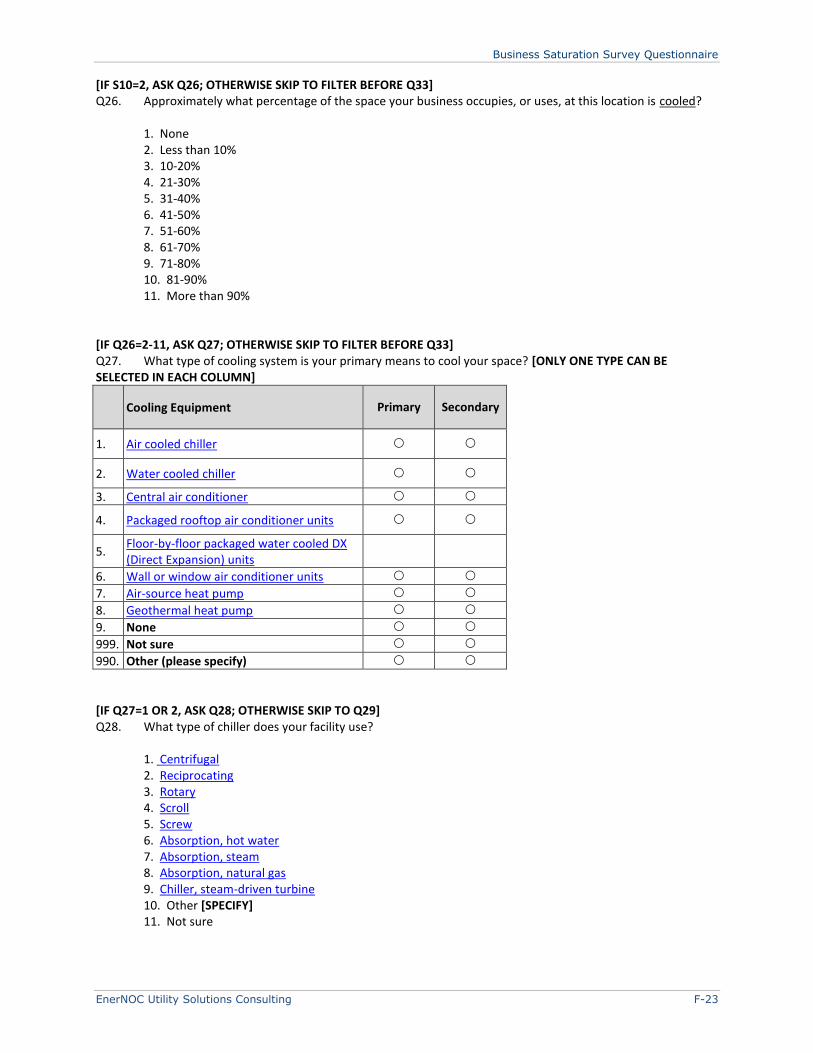
Business Saturation Survey Questionnaire
EnerNOC Utility Solutions Consulting F-23
[IF S10=2, ASK Q26; OTHERWISE SKIP TO FILTER BEFORE Q33] Q26. Approximately what percentage of the space your business occupies, or uses, at this location is cooled?
1. None 2. Less than 10% 3. 10-20% 4. 21-30% 5. 31-40% 6. 41-50% 7. 51-60% 8. 61-70% 9. 71-80% 10. 81-90% 11. More than 90%
[IF Q26=2-11, ASK Q27; OTHERWISE SKIP TO FILTER BEFORE Q33] Q27. What type of cooling system is your primary means to cool your space? [ONLY ONE TYPE CAN BE SELECTED IN EACH COLUMN]
Cooling Equipment Primary Secondary
1. Air cooled chiller
2. Water cooled chiller
3. Central air conditioner
4. Packaged rooftop air conditioner units
5. Floor-by-floor packaged water cooled DX (Direct Expansion) units
6. Wall or window air conditioner units
7. Air-source heat pump
8. Geothermal heat pump
9. None
999. Not sure
990. Other (please specify)
[IF Q27=1 OR 2, ASK Q28; OTHERWISE SKIP TO Q29] Q28. What type of chiller does your facility use?
1. Centrifugal 2. Reciprocating 3. Rotary 4. Scroll 5. Screw 6. Absorption, hot water 7. Absorption, steam 8. Absorption, natural gas 9. Chiller, steam-driven turbine 10. Other [SPECIFY] 11. Not sure

Business Saturation Survey Questionnaire
F-24 www.enernoc.com
[IF Q21_7 = Primary and Q27_7 NE Primary or Secondary] or [If Q21_8 = Primary and Q21_8 NE Primary or Secondary] ASK Q29; OTHERWISE SKIP TO Q21]
Q29. You indicated that you use a heat pump to heat your space in the winter, but do not use it to cool your space in the summer. For verification purposes, please select your primary heating and cooling system.
Q29A. Heating Equipment [Show any for which Q21=Primary or Secondary]
Q29B. Cooling Equipment [Show any for which Q27=Primary or Secondary]
Electric packaged unit(s)/ Roof-top unit(s) Air cooled chiller
Electric central warm air furnace with ducts/vents to individual rooms
Water cooled chiller
Natural gas central warm air furnace with ducts/vents to individual rooms
Central air conditioner
Electric central boiler with hot water/steam radiators or baseboards in individual rooms
Packaged air conditioner units
Natural gas central boiler Floor-by-floor packaged water cooled DX (Direct Expansion) units
Electric baseboard or electric coils radiant heating Wall or window air conditioner units
Air-source heat pump Air-source heat pump
Geothermal heat pump Geothermal heat pump
Wall furnace(s) None
Unit heater(s) Not sure
None Other
Not sure
Other
Q30. When was your primary cooling system installed? Your best estimate is fine.
1. Before 1980 2. 1980-1989 3. 1990-1994 4. 1995-2000 5. 2001-2003 6. 2004-2006 7. 2007-2009 8. 2010-present
Q30a. Which of the following best describes how your system is maintained?
1. Regularly each month 2. Regularly each season / quarter 3. Regularly each year 4. As needed 5. Not sure
[ASK IF ANY 1-8 OR 990 AT Q27=SECONDARY, IF 9-999 AT Q27=SECONDARY, SKIP TO Q33] Q31. What percentage of your total business space is cooled with a supplemental cooling system?
1. None 2. Less than 10% 3. 11-25% 4. 26-50%

Business Saturation Survey Questionnaire
EnerNOC Utility Solutions Consulting F-25
5. 51-75% 6. More than 75%
Q32. When was the supplemental cooling system installed? Your best estimate is fine.
1. Before 1980 2. 1980-1989 3. 1990-1994 4. 1995-2000 5. 2001-2003 6. 2004-2006 7. 2007-2009 8. 2010-present
[IF Q19=2-11 OR Q26=2-11, ASK Q33; OTHERWISE SKIP TO FILTER BEFORE Q36] Q33. What type of temperature control is primarily used in your heating and/or cooling system(s)?
1. Manual thermostat 2. Programmable thermostat 3. Energy management system 4. Always on 5. Manual on/off 6. Time clock 7. None of the above
[IF Q26=2-11 AND Q33=1-6, ASK Q34; OTHERWISE SKIP TO FILTER BEFORE Q35] Q34. For each of the times listed below, what is the typical cooling temperature for the thermostat in summer
(June through August)?
Please select a range from each drop down menu. [PROGRAMMER: PLACE DROP DOWN MENU TO INCLUDE THE FOLLOWING OPTIONS:
1=Less than 60°F; 2=60-64°F; 3=65-69°F; 4=70-74°F; 5=75-78°F; and 6=79°F or higher]
1. Day [DROP DOWN MENU]
2. Night [DROP DOWN MENU]
Business Saturation Survey Questionnaire
F-26 www.enernoc.com
[IF Q19=2-11 AND Q33=1-6, ASK Q35; OTHERWISE SKIP TO FILTER BEFORE Q36] Q35. For each of the times listed below, what is the typical heating temperature for the thermostat in winter
(December through February)?
Please select a range from each drop down menu. [PROGRAMMER: PLACE DROP DOWN MENU TO INCLUDE THE FOLLOWING OPTIONS:
1=Less than 60°F; 2=60-64°F; 3=65-69°F; 4=70-74°F; 5=75-78°F; and 6=79°F or higher]
1. Day [DROP DOWN MENU]
2. Night [DROP DOWN MENU]
[IF S10=3, ASK Q36; OTHERWISE SKIP TO FILTER BEFORE Q41] The next few questions focus on any water heating used by your business. Q36. What type of water heater does your business use? If more than one type of water heater, indicate the one that is used most often.
1. None 2. Hot water either purchased or provided by building to tenants 3. Self-contained or stand-alone storage water heater/boiler 4. Central boiler 5. Tankless (instantaneous) water heater 6. Heat pump water heater 7. Heat recovery water heater 8. Domestic-type water heater 9. Other [SPECIFY] 10. Not sure
[IF Q36=2-9, ASK Q37; OTHERWISE SKIP TO FILTER BEFORE Q41] Q37. How many water heater units do you have?
Your best estimate is fine, but please enter a whole number rather than a range of numbers. [RECORD NUMBER 1-100]
[IF Q36=2-4 OR 6-9, ASK Q38; OTHERWISE SKIP TO Q39] Q38. What is the [IF Q37>1, DISPLAY, “average”] tank size of these water heater unit(s)? Your best estimate is
fine.
1. Less than 30 gallons 2. 30-54 gallons 3. 55-69 gallons 4. 70-89 gallons 5. 90-119 gallons 6. 120-150 gallons 7. More than 150 gallons 8. Not sure
Business Saturation Survey Questionnaire
EnerNOC Utility Solutions Consulting F-27
Q39. What type of fuel is used by the water heater(s)?
1. Natural gas 2. Electricity 3. Steam 4. Other [SPECIFY] 5. Not sure
Q40. On average, when were the water heaters installed? Your best estimate is fine.
1. Before 1980 2. 1980-1989 3. 1990-1994 4. 1995-2000 5. 2001-2003 6. 2004-2006 7. 2007-2009 8. 2010-present 9. Not sure
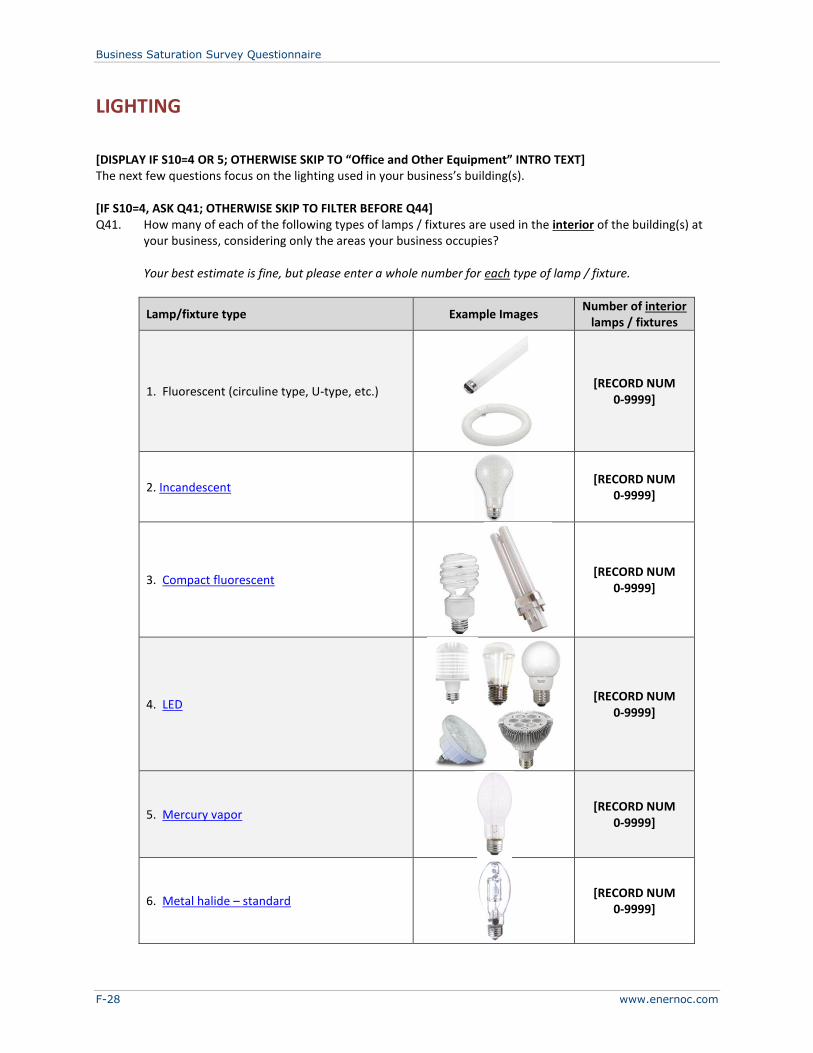
Business Saturation Survey Questionnaire
F-28 www.enernoc.com
LIGHTING [DISPLAY IF S10=4 OR 5; OTHERWISE SKIP TO “Office and Other Equipment” INTRO TEXT] The next few questions focus on the lighting used in your business’s building(s). [IF S10=4, ASK Q41; OTHERWISE SKIP TO FILTER BEFORE Q44] Q41. How many of each of the following types of lamps / fixtures are used in the interior of the building(s) at
your business, considering only the areas your business occupies?
Your best estimate is fine, but please enter a whole number for each type of lamp / fixture.
Lamp/fixture type Example Images Number of interior
lamps / fixtures
1. Fluorescent (circuline type, U-type, etc.)
[RECORD NUM 0-9999]
2. Incandescent
[RECORD NUM 0-9999]
3. Compact fluorescent
[RECORD NUM 0-9999]
4. LED
[RECORD NUM 0-9999]
5. Mercury vapor
[RECORD NUM 0-9999]
6. Metal halide – standard
[RECORD NUM 0-9999]

Business Saturation Survey Questionnaire
EnerNOC Utility Solutions Consulting F-29
7. Metal halide – Pulse start
[RECORD NUM 0-9999]
8. High pressure sodium
[RECORD NUM 0-9999]
9. Low pressure sodium
[RECORD NUM 0-9999]
10. Neon
[RECORD NUM 0-9999]
11. Self / battery powered exit signs
[RECORD NUM 0-9999]
12. Quartz / halogen
[RECORD NUM 0-9999]
13. Induction
[RECORD NUM 0-9999]
14. Other [SPECIFY] [RECORD NUM
0-9999]
TOT. Total number of lamps / fixtures [CALCULATE
TOTAL]
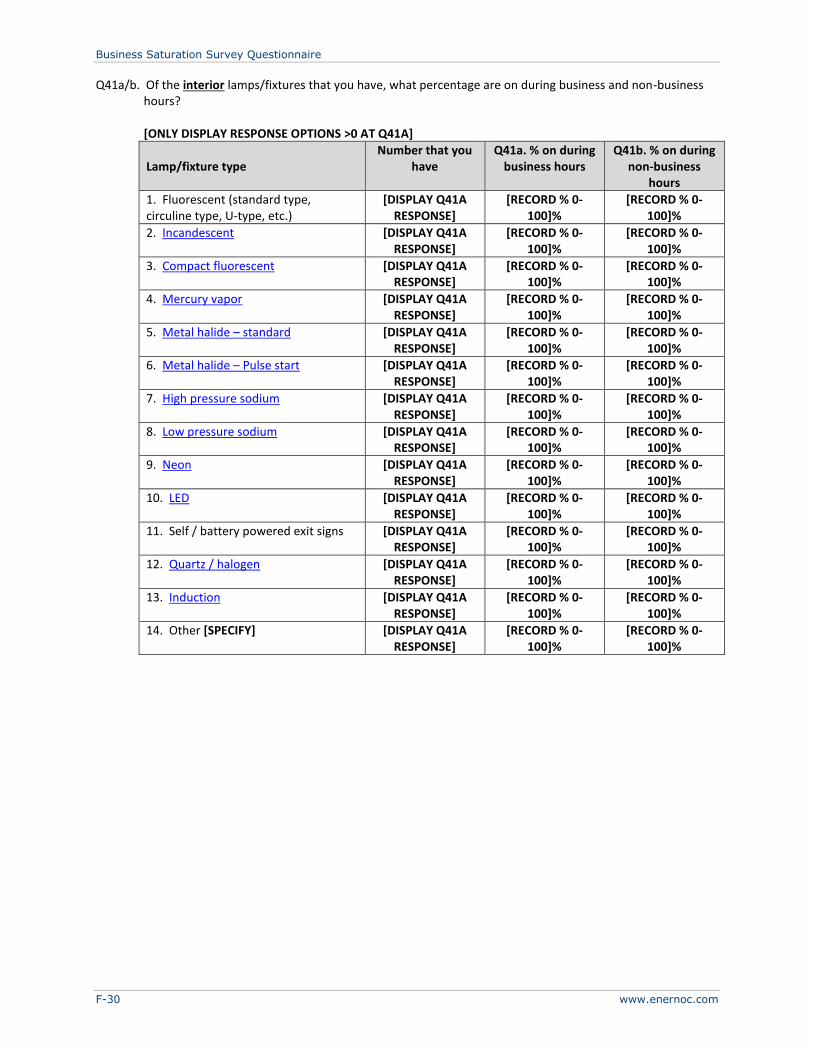
Business Saturation Survey Questionnaire
F-30 www.enernoc.com
Q41a/b. Of the interior lamps/fixtures that you have, what percentage are on during business and non-business hours?
[ONLY DISPLAY RESPONSE OPTIONS >0 AT Q41A]
Lamp/fixture type Number that you
have Q41a. % on during
business hours Q41b. % on during
non-business hours
1. Fluorescent (standard type, circuline type, U-type, etc.)
[DISPLAY Q41A RESPONSE]
[RECORD % 0-100]%
[RECORD % 0-100]%
2. Incandescent [DISPLAY Q41A RESPONSE]
[RECORD % 0-100]%
[RECORD % 0-100]%
3. Compact fluorescent [DISPLAY Q41A RESPONSE]
[RECORD % 0-100]%
[RECORD % 0-100]%
4. Mercury vapor [DISPLAY Q41A RESPONSE]
[RECORD % 0-100]%
[RECORD % 0-100]%
5. Metal halide – standard [DISPLAY Q41A RESPONSE]
[RECORD % 0-100]%
[RECORD % 0-100]%
6. Metal halide – Pulse start [DISPLAY Q41A RESPONSE]
[RECORD % 0-100]%
[RECORD % 0-100]%
7. High pressure sodium [DISPLAY Q41A RESPONSE]
[RECORD % 0-100]%
[RECORD % 0-100]%
8. Low pressure sodium [DISPLAY Q41A RESPONSE]
[RECORD % 0-100]%
[RECORD % 0-100]%
9. Neon [DISPLAY Q41A RESPONSE]
[RECORD % 0-100]%
[RECORD % 0-100]%
10. LED [DISPLAY Q41A RESPONSE]
[RECORD % 0-100]%
[RECORD % 0-100]%
11. Self / battery powered exit signs [DISPLAY Q41A RESPONSE]
[RECORD % 0-100]%
[RECORD % 0-100]%
12. Quartz / halogen [DISPLAY Q41A RESPONSE]
[RECORD % 0-100]%
[RECORD % 0-100]%
13. Induction [DISPLAY Q41A RESPONSE]
[RECORD % 0-100]%
[RECORD % 0-100]%
14. Other [SPECIFY] [DISPLAY Q41A RESPONSE]
[RECORD % 0-100]%
[RECORD % 0-100]%
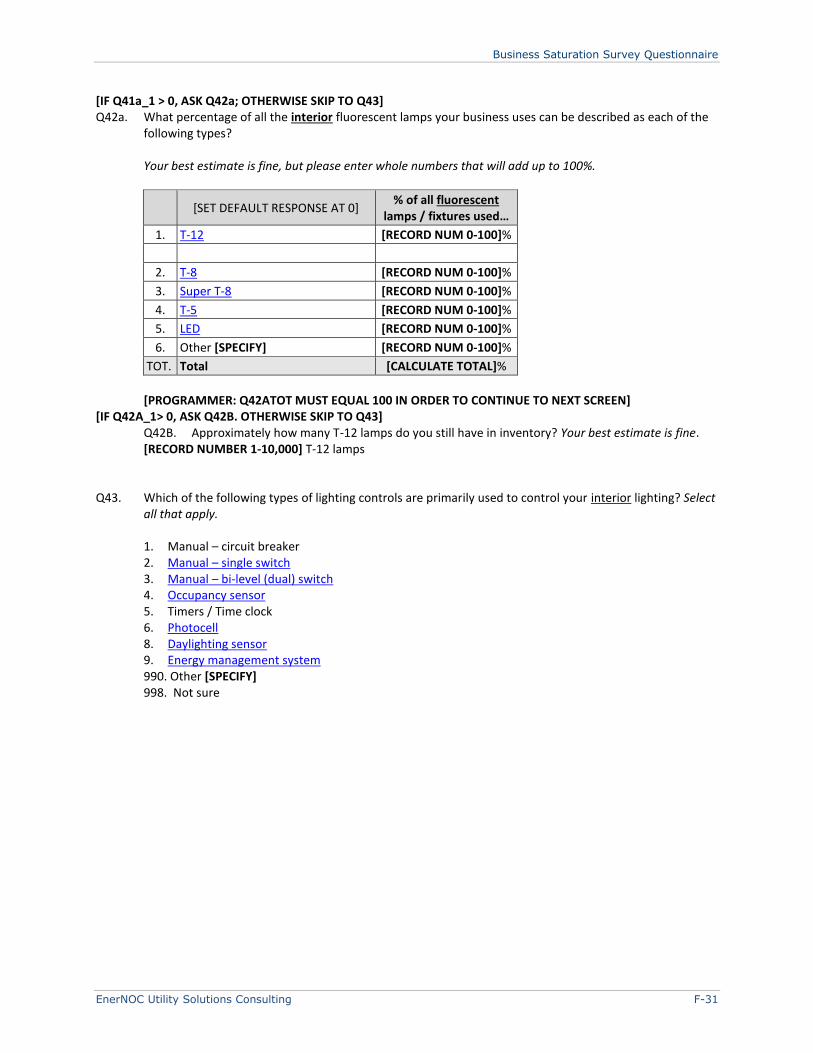
Business Saturation Survey Questionnaire
EnerNOC Utility Solutions Consulting F-31
[IF Q41a_1 > 0, ASK Q42a; OTHERWISE SKIP TO Q43] Q42a. What percentage of all the interior fluorescent lamps your business uses can be described as each of the
following types?
Your best estimate is fine, but please enter whole numbers that will add up to 100%.
[SET DEFAULT RESPONSE AT 0] % of all fluorescent
lamps / fixtures used…
1. T-12 [RECORD NUM 0-100]%
2. T-8 [RECORD NUM 0-100]%
3. Super T-8 [RECORD NUM 0-100]%
4. T-5 [RECORD NUM 0-100]%
5. LED [RECORD NUM 0-100]%
6. Other [SPECIFY] [RECORD NUM 0-100]%
TOT. Total [CALCULATE TOTAL]%
[PROGRAMMER: Q42ATOT MUST EQUAL 100 IN ORDER TO CONTINUE TO NEXT SCREEN]
[IF Q42A_1> 0, ASK Q42B. OTHERWISE SKIP TO Q43] Q42B. Approximately how many T-12 lamps do you still have in inventory? Your best estimate is fine. [RECORD NUMBER 1-10,000] T-12 lamps
Q43. Which of the following types of lighting controls are primarily used to control your interior lighting? Select all that apply.
1. Manual – circuit breaker 2. Manual – single switch 3. Manual – bi-level (dual) switch 4. Occupancy sensor 5. Timers / Time clock 6. Photocell 8. Daylighting sensor 9. Energy management system 990. Other [SPECIFY] 998. Not sure

Business Saturation Survey Questionnaire
F-32 www.enernoc.com
[IF S10=5, ASK Q44; OTHERWISE SKIP TO INTRO TEXT BEFORE Q47] Q44. Thinking about the exterior lighting that you pay for in your electric bill, how many of each of the
following types of lamps / fixtures are used on the exterior of your business’s building(s)?
Your best estimate is fine, but please enter a whole number for each type of lamp / fixture.
Lamp/fixture type Example Images
Number of exterior lamps / fixtures
Q44a. % on during
business hours
Q44b. % on during non-
business hours
1. Fluorescent (standard type, circuline type, U-type, etc.)
[RECORD NUM
0-9999]
[RECORD % 0-100]%
[RECORD % 0-100]%
2. Incandescent
[RECORD NUM
0-9999]
[RECORD % 0-100]%
[RECORD % 0-100]%
3. Compact fluorescent
[RECORD NUM
0-9999]
[RECORD % 0-100]%
[RECORD % 0-100]%
4. Mercury vapor
[RECORD NUM
0-9999]
[RECORD % 0-100]%
[RECORD % 0-100]%
5. Metal halide – standard
[RECORD NUM
0-9999]
[RECORD % 0-100]%
[RECORD % 0-100]%
6. Metal halide – Pulse start
[RECORD NUM
0-9999]
[RECORD % 0-100]%
[RECORD % 0-100]%
7. High pressure sodium
[RECORD NUM
0-9999]
[RECORD % 0-100]%
[RECORD % 0-100]%
8. Low pressure sodium
[RECORD NUM
0-9999]
[RECORD % 0-100]%
[RECORD % 0-100]%
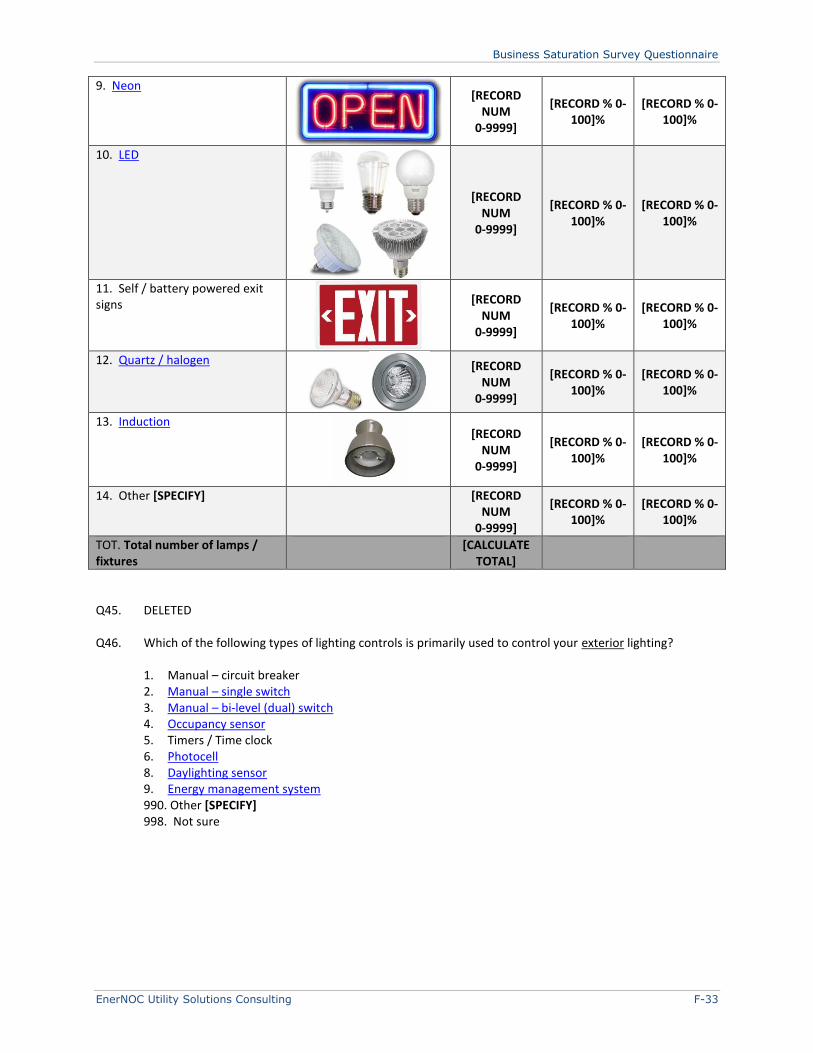
Business Saturation Survey Questionnaire
EnerNOC Utility Solutions Consulting F-33
9. Neon
[RECORD NUM
0-9999]
[RECORD % 0-100]%
[RECORD % 0-100]%
10. LED
[RECORD NUM
0-9999]
[RECORD % 0-100]%
[RECORD % 0-100]%
11. Self / battery powered exit signs
[RECORD NUM
0-9999]
[RECORD % 0-100]%
[RECORD % 0-100]%
12. Quartz / halogen
[RECORD NUM
0-9999]
[RECORD % 0-100]%
[RECORD % 0-100]%
13. Induction
[RECORD NUM
0-9999]
[RECORD % 0-100]%
[RECORD % 0-100]%
14. Other [SPECIFY] [RECORD NUM
0-9999]
[RECORD % 0-100]%
[RECORD % 0-100]%
TOT. Total number of lamps / fixtures
[CALCULATE TOTAL]
Q45. DELETED Q46. Which of the following types of lighting controls is primarily used to control your exterior lighting?
1. Manual – circuit breaker 2. Manual – single switch 3. Manual – bi-level (dual) switch 4. Occupancy sensor 5. Timers / Time clock 6. Photocell 8. Daylighting sensor 9. Energy management system 990. Other [SPECIFY] 998. Not sure
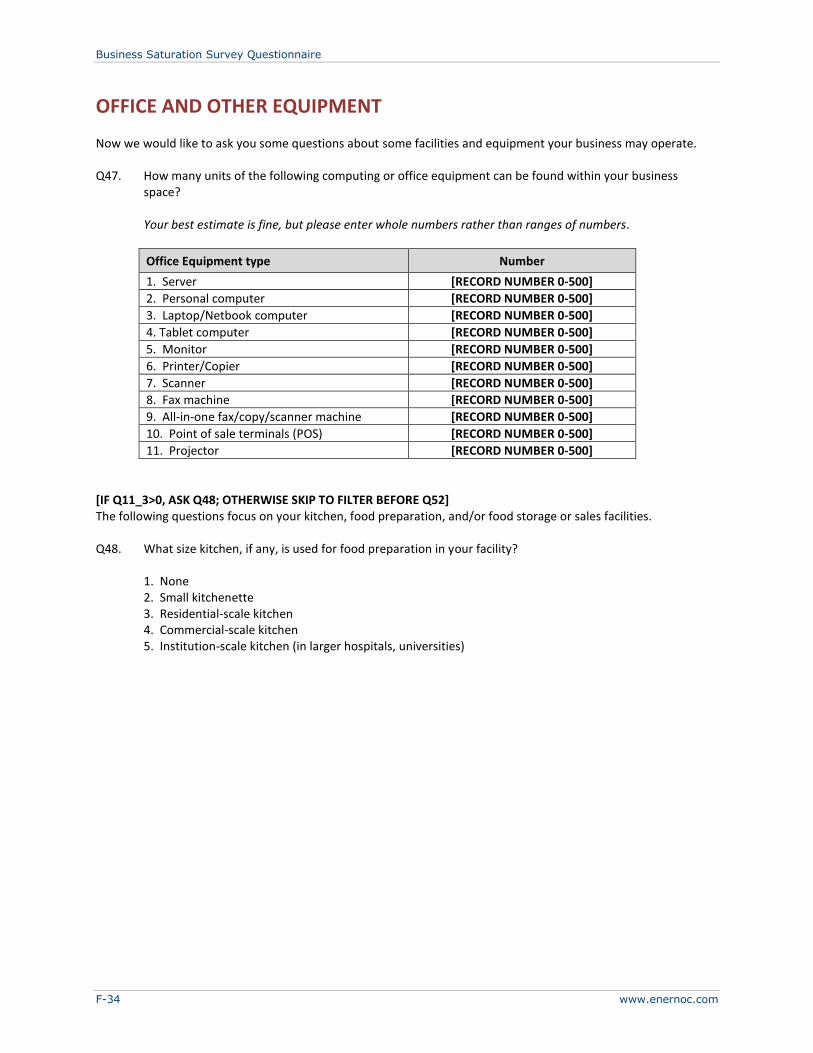
Business Saturation Survey Questionnaire
F-34 www.enernoc.com
OFFICE AND OTHER EQUIPMENT
Now we would like to ask you some questions about some facilities and equipment your business may operate. Q47. How many units of the following computing or office equipment can be found within your business
space?
Your best estimate is fine, but please enter whole numbers rather than ranges of numbers.
Office Equipment type Number
1. Server [RECORD NUMBER 0-500]
2. Personal computer [RECORD NUMBER 0-500]
3. Laptop/Netbook computer [RECORD NUMBER 0-500]
4. Tablet computer [RECORD NUMBER 0-500]
5. Monitor [RECORD NUMBER 0-500]
6. Printer/Copier [RECORD NUMBER 0-500]
7. Scanner [RECORD NUMBER 0-500]
8. Fax machine [RECORD NUMBER 0-500]
9. All-in-one fax/copy/scanner machine [RECORD NUMBER 0-500]
10. Point of sale terminals (POS) [RECORD NUMBER 0-500]
11. Projector [RECORD NUMBER 0-500]
[IF Q11_3>0, ASK Q48; OTHERWISE SKIP TO FILTER BEFORE Q52] The following questions focus on your kitchen, food preparation, and/or food storage or sales facilities. Q48. What size kitchen, if any, is used for food preparation in your facility?
1. None 2. Small kitchenette 3. Residential-scale kitchen 4. Commercial-scale kitchen 5. Institution-scale kitchen (in larger hospitals, universities)
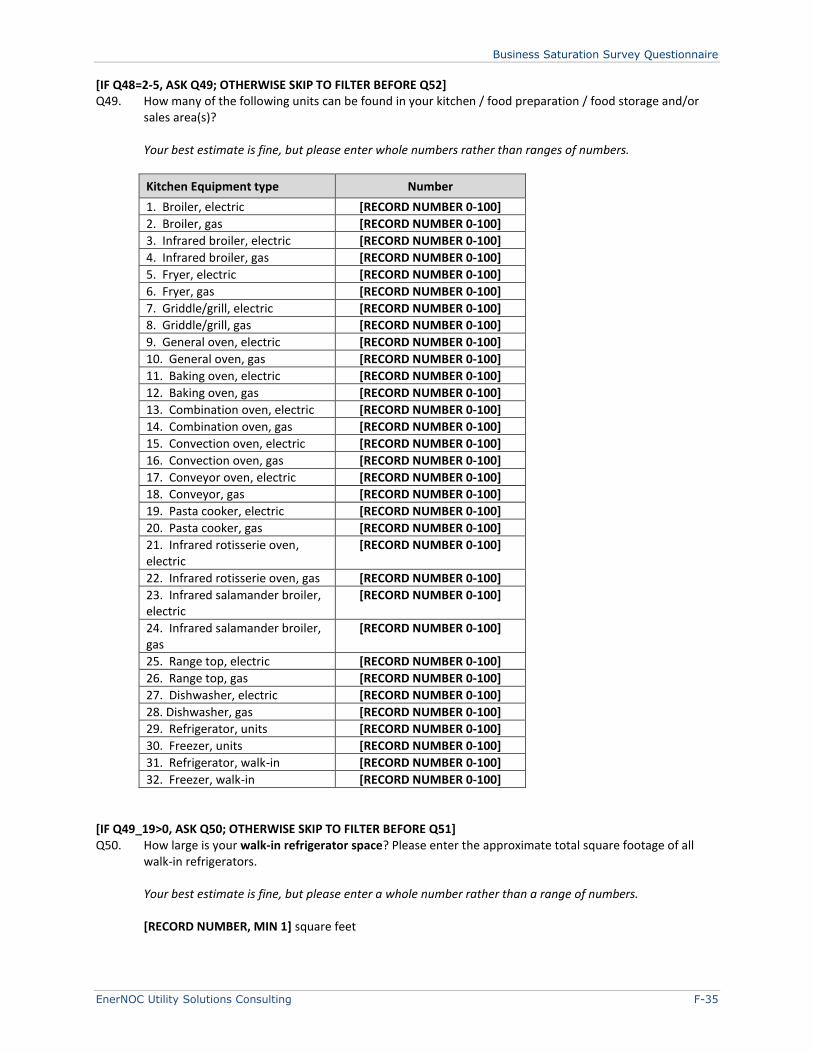
Business Saturation Survey Questionnaire
EnerNOC Utility Solutions Consulting F-35
[IF Q48=2-5, ASK Q49; OTHERWISE SKIP TO FILTER BEFORE Q52] Q49. How many of the following units can be found in your kitchen / food preparation / food storage and/or
sales area(s)?
Your best estimate is fine, but please enter whole numbers rather than ranges of numbers.
Kitchen Equipment type Number
1. Broiler, electric [RECORD NUMBER 0-100]
2. Broiler, gas [RECORD NUMBER 0-100]
3. Infrared broiler, electric [RECORD NUMBER 0-100]
4. Infrared broiler, gas [RECORD NUMBER 0-100]
5. Fryer, electric [RECORD NUMBER 0-100]
6. Fryer, gas [RECORD NUMBER 0-100]
7. Griddle/grill, electric [RECORD NUMBER 0-100]
8. Griddle/grill, gas [RECORD NUMBER 0-100]
9. General oven, electric [RECORD NUMBER 0-100]
10. General oven, gas [RECORD NUMBER 0-100]
11. Baking oven, electric [RECORD NUMBER 0-100]
12. Baking oven, gas [RECORD NUMBER 0-100]
13. Combination oven, electric [RECORD NUMBER 0-100]
14. Combination oven, gas [RECORD NUMBER 0-100]
15. Convection oven, electric [RECORD NUMBER 0-100]
16. Convection oven, gas [RECORD NUMBER 0-100]
17. Conveyor oven, electric [RECORD NUMBER 0-100]
18. Conveyor, gas [RECORD NUMBER 0-100]
19. Pasta cooker, electric [RECORD NUMBER 0-100]
20. Pasta cooker, gas [RECORD NUMBER 0-100]
21. Infrared rotisserie oven, electric
[RECORD NUMBER 0-100]
22. Infrared rotisserie oven, gas [RECORD NUMBER 0-100]
23. Infrared salamander broiler, electric
[RECORD NUMBER 0-100]
24. Infrared salamander broiler, gas
[RECORD NUMBER 0-100]
25. Range top, electric [RECORD NUMBER 0-100]
26. Range top, gas [RECORD NUMBER 0-100]
27. Dishwasher, electric [RECORD NUMBER 0-100]
28. Dishwasher, gas [RECORD NUMBER 0-100]
29. Refrigerator, units [RECORD NUMBER 0-100]
30. Freezer, units [RECORD NUMBER 0-100]
31. Refrigerator, walk-in [RECORD NUMBER 0-100]
32. Freezer, walk-in [RECORD NUMBER 0-100]
[IF Q49_19>0, ASK Q50; OTHERWISE SKIP TO FILTER BEFORE Q51] Q50. How large is your walk-in refrigerator space? Please enter the approximate total square footage of all
walk-in refrigerators. Your best estimate is fine, but please enter a whole number rather than a range of numbers.
[RECORD NUMBER, MIN 1] square feet

Business Saturation Survey Questionnaire
F-36 www.enernoc.com
[IF Q49_20>0, ASK Q51; OTHERWISE SKIP TO FILTER BEFORE Q52] Q51. How large is your walk-in freezer space? Please enter the approximate total square footage of all walk-in
freezers.
Your best estimate is fine, but please enter a whole number rather than a range of numbers. [RECORD NUMBER, MIN 1] square feet
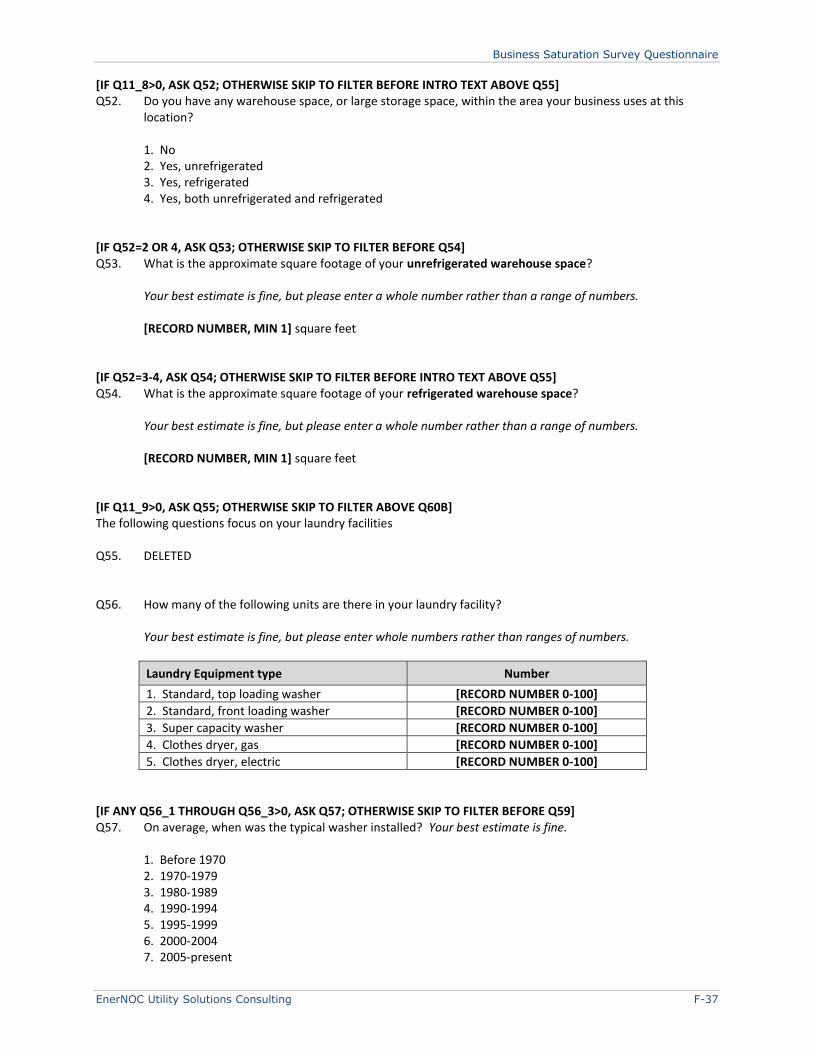
Business Saturation Survey Questionnaire
EnerNOC Utility Solutions Consulting F-37
[IF Q11_8>0, ASK Q52; OTHERWISE SKIP TO FILTER BEFORE INTRO TEXT ABOVE Q55] Q52. Do you have any warehouse space, or large storage space, within the area your business uses at this
location?
1. No 2. Yes, unrefrigerated 3. Yes, refrigerated 4. Yes, both unrefrigerated and refrigerated
[IF Q52=2 OR 4, ASK Q53; OTHERWISE SKIP TO FILTER BEFORE Q54] Q53. What is the approximate square footage of your unrefrigerated warehouse space?
Your best estimate is fine, but please enter a whole number rather than a range of numbers.
[RECORD NUMBER, MIN 1] square feet [IF Q52=3-4, ASK Q54; OTHERWISE SKIP TO FILTER BEFORE INTRO TEXT ABOVE Q55] Q54. What is the approximate square footage of your refrigerated warehouse space?
Your best estimate is fine, but please enter a whole number rather than a range of numbers.
[RECORD NUMBER, MIN 1] square feet [IF Q11_9>0, ASK Q55; OTHERWISE SKIP TO FILTER ABOVE Q60B] The following questions focus on your laundry facilities Q55. DELETED Q56. How many of the following units are there in your laundry facility?
Your best estimate is fine, but please enter whole numbers rather than ranges of numbers.
Laundry Equipment type Number
1. Standard, top loading washer [RECORD NUMBER 0-100]
2. Standard, front loading washer [RECORD NUMBER 0-100]
3. Super capacity washer [RECORD NUMBER 0-100]
4. Clothes dryer, gas [RECORD NUMBER 0-100]
5. Clothes dryer, electric [RECORD NUMBER 0-100]
[IF ANY Q56_1 THROUGH Q56_3>0, ASK Q57; OTHERWISE SKIP TO FILTER BEFORE Q59] Q57. On average, when was the typical washer installed? Your best estimate is fine.
1. Before 1970 2. 1970-1979 3. 1980-1989 4. 1990-1994 5. 1995-1999 6. 2000-2004 7. 2005-present
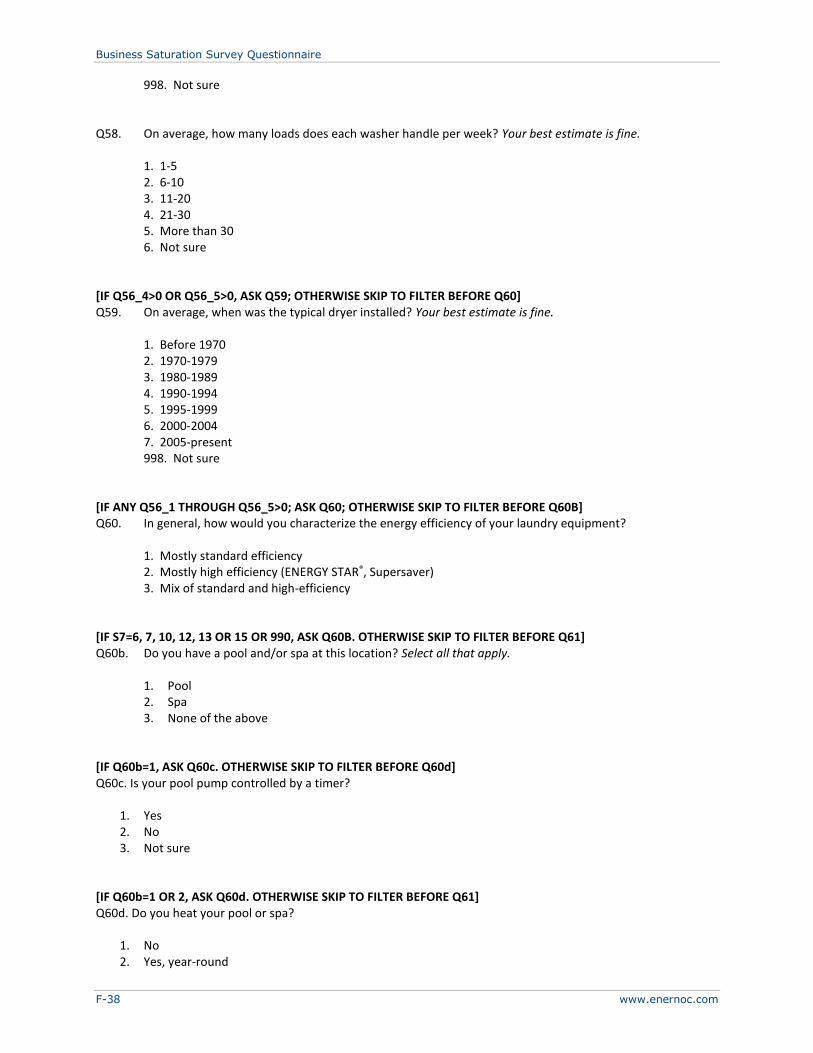
Business Saturation Survey Questionnaire
F-38 www.enernoc.com
998. Not sure Q58. On average, how many loads does each washer handle per week? Your best estimate is fine.
1. 1-5 2. 6-10 3. 11-20 4. 21-30 5. More than 30 6. Not sure
[IF Q56_4>0 OR Q56_5>0, ASK Q59; OTHERWISE SKIP TO FILTER BEFORE Q60] Q59. On average, when was the typical dryer installed? Your best estimate is fine.
1. Before 1970 2. 1970-1979 3. 1980-1989 4. 1990-1994 5. 1995-1999 6. 2000-2004 7. 2005-present 998. Not sure
[IF ANY Q56_1 THROUGH Q56_5>0; ASK Q60; OTHERWISE SKIP TO FILTER BEFORE Q60B] Q60. In general, how would you characterize the energy efficiency of your laundry equipment?
1. Mostly standard efficiency 2. Mostly high efficiency (ENERGY STAR®, Supersaver) 3. Mix of standard and high-efficiency
[IF S7=6, 7, 10, 12, 13 OR 15 OR 990, ASK Q60B. OTHERWISE SKIP TO FILTER BEFORE Q61] Q60b. Do you have a pool and/or spa at this location? Select all that apply.
1. Pool 2. Spa 3. None of the above
[IF Q60b=1, ASK Q60c. OTHERWISE SKIP TO FILTER BEFORE Q60d] Q60c. Is your pool pump controlled by a timer?
1. Yes 2. No 3. Not sure
[IF Q60b=1 OR 2, ASK Q60d. OTHERWISE SKIP TO FILTER BEFORE Q61] Q60d. Do you heat your pool or spa?
1. No 2. Yes, year-round
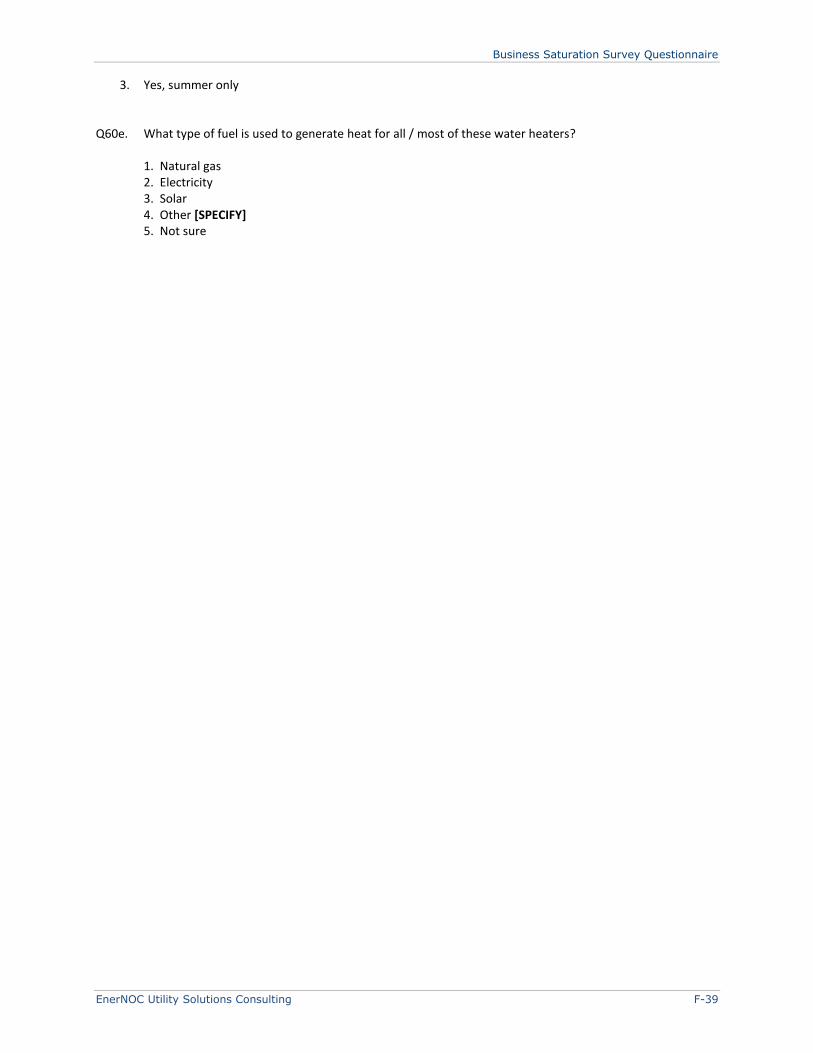
Business Saturation Survey Questionnaire
EnerNOC Utility Solutions Consulting F-39
3. Yes, summer only
Q60e. What type of fuel is used to generate heat for all / most of these water heaters?
1. Natural gas 2. Electricity 3. Solar 4. Other [SPECIFY] 5. Not sure
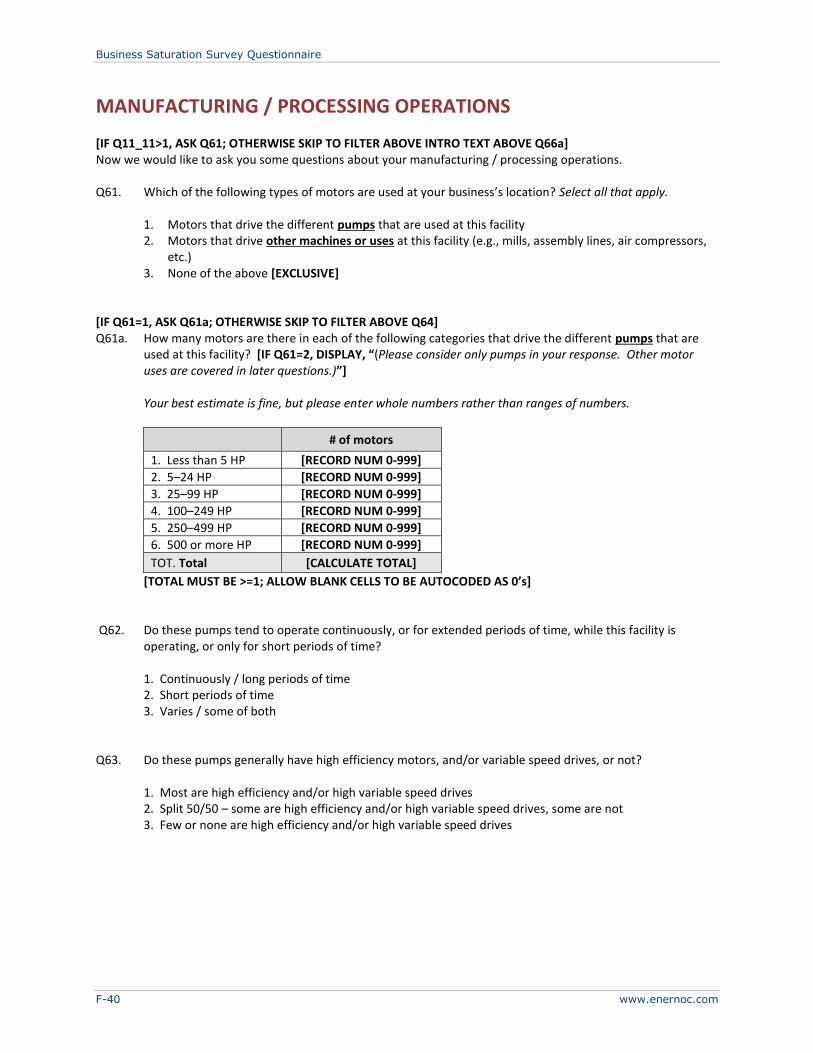
Business Saturation Survey Questionnaire
F-40 www.enernoc.com
MANUFACTURING / PROCESSING OPERATIONS
[IF Q11_11>1, ASK Q61; OTHERWISE SKIP TO FILTER ABOVE INTRO TEXT ABOVE Q66a] Now we would like to ask you some questions about your manufacturing / processing operations. Q61. Which of the following types of motors are used at your business’s location? Select all that apply.
1. Motors that drive the different pumps that are used at this facility 2. Motors that drive other machines or uses at this facility (e.g., mills, assembly lines, air compressors,
etc.) 3. None of the above [EXCLUSIVE]
[IF Q61=1, ASK Q61a; OTHERWISE SKIP TO FILTER ABOVE Q64] Q61a. How many motors are there in each of the following categories that drive the different pumps that are
used at this facility? [IF Q61=2, DISPLAY, “(Please consider only pumps in your response. Other motor uses are covered in later questions.)”] Your best estimate is fine, but please enter whole numbers rather than ranges of numbers.
# of motors
1. Less than 5 HP [RECORD NUM 0-999]
2. 5–24 HP [RECORD NUM 0-999]
3. 25–99 HP [RECORD NUM 0-999]
4. 100–249 HP [RECORD NUM 0-999]
5. 250–499 HP [RECORD NUM 0-999]
6. 500 or more HP [RECORD NUM 0-999]
TOT. Total [CALCULATE TOTAL]
[TOTAL MUST BE >=1; ALLOW BLANK CELLS TO BE AUTOCODED AS 0’s] Q62. Do these pumps tend to operate continuously, or for extended periods of time, while this facility is
operating, or only for short periods of time? 1. Continuously / long periods of time 2. Short periods of time 3. Varies / some of both Q63. Do these pumps generally have high efficiency motors, and/or variable speed drives, or not? 1. Most are high efficiency and/or high variable speed drives 2. Split 50/50 – some are high efficiency and/or high variable speed drives, some are not
3. Few or none are high efficiency and/or high variable speed drives
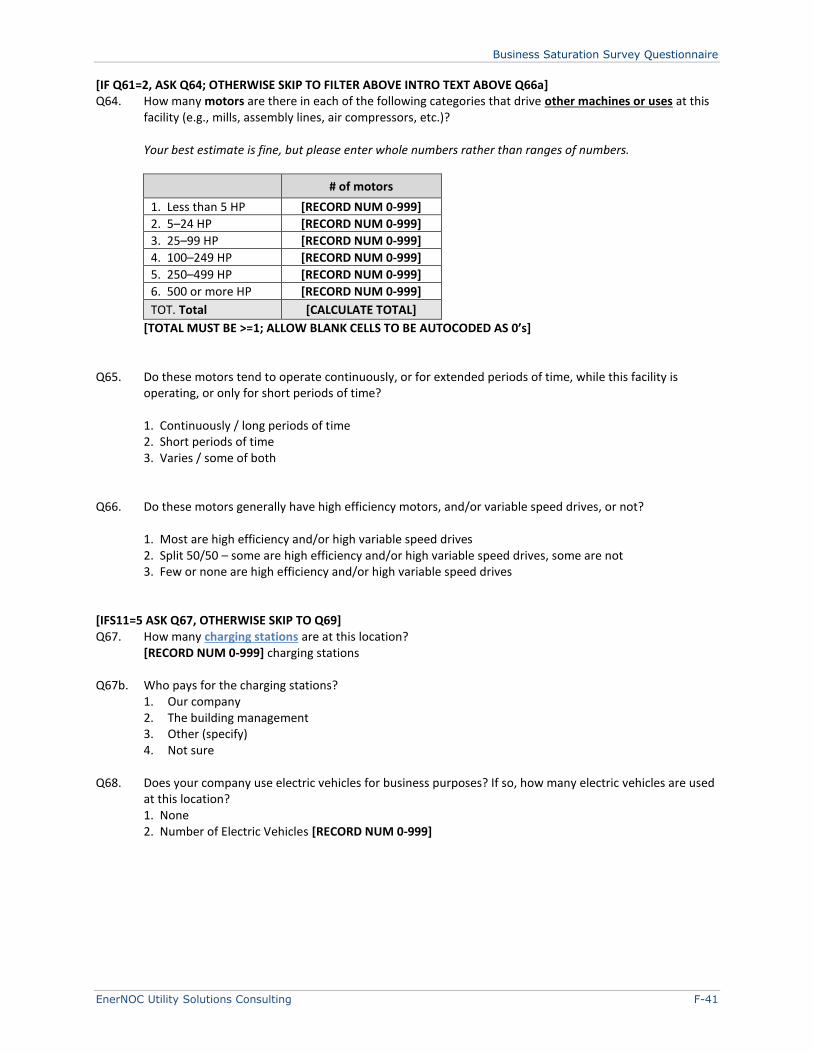
Business Saturation Survey Questionnaire
EnerNOC Utility Solutions Consulting F-41
[IF Q61=2, ASK Q64; OTHERWISE SKIP TO FILTER ABOVE INTRO TEXT ABOVE Q66a] Q64. How many motors are there in each of the following categories that drive other machines or uses at this
facility (e.g., mills, assembly lines, air compressors, etc.)?
Your best estimate is fine, but please enter whole numbers rather than ranges of numbers.
# of motors
1. Less than 5 HP [RECORD NUM 0-999]
2. 5–24 HP [RECORD NUM 0-999]
3. 25–99 HP [RECORD NUM 0-999]
4. 100–249 HP [RECORD NUM 0-999]
5. 250–499 HP [RECORD NUM 0-999]
6. 500 or more HP [RECORD NUM 0-999]
TOT. Total [CALCULATE TOTAL]
[TOTAL MUST BE >=1; ALLOW BLANK CELLS TO BE AUTOCODED AS 0’s] Q65. Do these motors tend to operate continuously, or for extended periods of time, while this facility is
operating, or only for short periods of time? 1. Continuously / long periods of time 2. Short periods of time 3. Varies / some of both Q66. Do these motors generally have high efficiency motors, and/or variable speed drives, or not? 1. Most are high efficiency and/or high variable speed drives 2. Split 50/50 – some are high efficiency and/or high variable speed drives, some are not
3. Few or none are high efficiency and/or high variable speed drives
[IFS11=5 ASK Q67, OTHERWISE SKIP TO Q69] Q67. How many charging stations are at this location? [RECORD NUM 0-999] charging stations Q67b. Who pays for the charging stations?
1. Our company 2. The building management 3. Other (specify) 4. Not sure
Q68. Does your company use electric vehicles for business purposes? If so, how many electric vehicles are used
at this location? 1. None 2. Number of Electric Vehicles [RECORD NUM 0-999]

Business Saturation Survey Questionnaire
F-42 www.enernoc.com
ENERGY EFFICIENCY MEASURES
Finally, we’d like to ask you about some energy efficiency measures you may have implemented at this location in the recent past, as well as some that you may be planning on implementing in the near future. Q68. Which of the following energy efficiency measures related to lighting have been implemented at this
location within the last three years?
Select all that apply for each time period. Select “NONE” in the appropriate column if you have not implemented / do not plan to implement any of the measures within that time period.
Energy Efficiency Measures: Interior and Exterior Lighting Have
implemented in last 3 years
1. Upgrading or renovating fluorescent lighting system(s)
2.
Eliminating some fluorescent fixtures and adding reflectors to others to reduce the total number of lighting fixtures or lamps without reducing the total light available (this is sometimes called “delamping”)
3. Replacing traditional incandescent lights with CFLs or higher efficiency light bulbs in lighting fixtures
4. Replacing general overhead lighting with specific task lighting
5. Installing occupancy/motion sensors to turn lights off when rooms are not in use
6. Installing daylighting sensors to turn interior lights off when sufficient daylight is available
990. Other energy efficiency lighting measure(s) [SPECIFY]
998. NONE / No energy efficiency lighting measures implemented / planned / possible [EXCLUSIVE]
Q69. Which of the following energy efficiency measures related to heating / cooling have been implemented
at this location within the last three years?
Which of these measures does your business plan to implement at this location within the next two years?
Select all that apply for each time period. Select “NONE” in the appropriate column if you have not implemented / do not plan to implement any of the measures within that time period.
Energy Efficiency Measures: Heating / Cooling (HVAC) Have
implemented in last 3 years
Plan to implement in next 2 years
1. Purchasing a more energy efficient air conditioner, chiller, furnace or boiler when needing to replace a unit
3. Installing solar panels on your roof that would provide power for some portion of your heating, cooling or water heating needs
4. Installing a heat recovery system that would capture waste heat from chillers or refrigeration systems to use for heating
5. Adding insulation to the ductwork that serves your heating and/or cooling systems
6. Conducting a “retrocommissioning” of your HVAC systems –
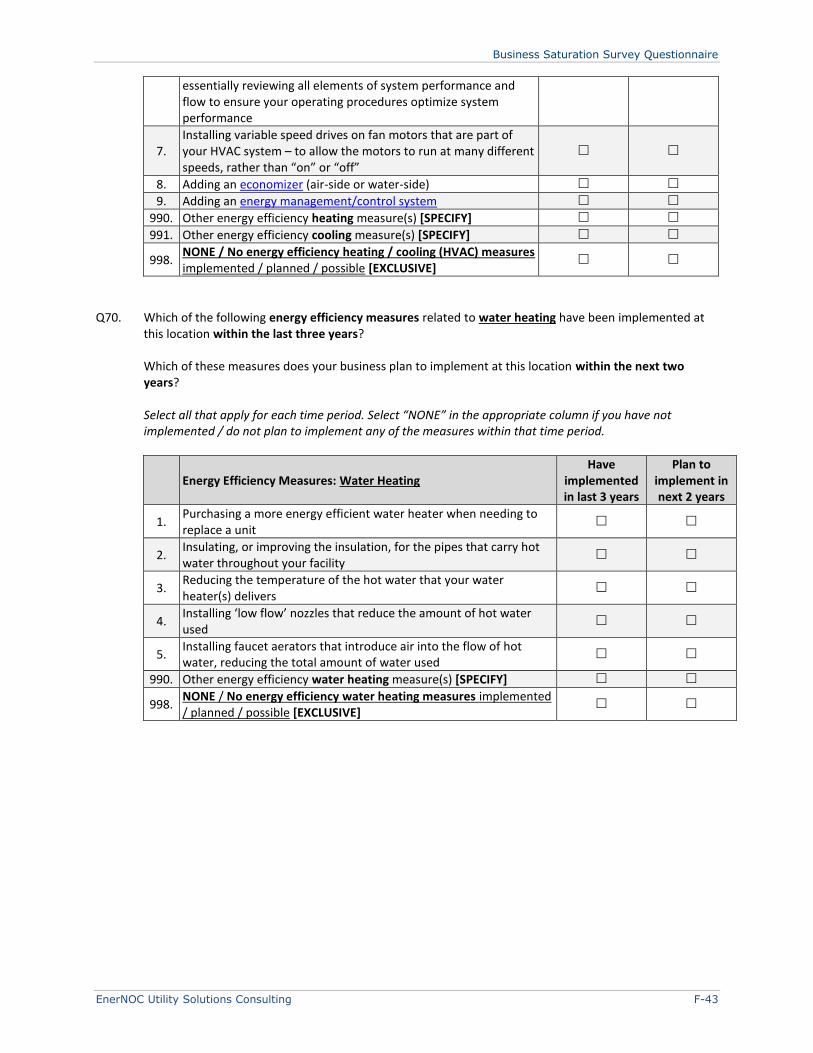
Business Saturation Survey Questionnaire
EnerNOC Utility Solutions Consulting F-43
essentially reviewing all elements of system performance and flow to ensure your operating procedures optimize system performance
7. Installing variable speed drives on fan motors that are part of your HVAC system – to allow the motors to run at many different speeds, rather than “on” or “off”
8. Adding an economizer (air-side or water-side)
9. Adding an energy management/control system
990. Other energy efficiency heating measure(s) [SPECIFY]
991. Other energy efficiency cooling measure(s) [SPECIFY]
998. NONE / No energy efficiency heating / cooling (HVAC) measures implemented / planned / possible [EXCLUSIVE]
Q70. Which of the following energy efficiency measures related to water heating have been implemented at
this location within the last three years?
Which of these measures does your business plan to implement at this location within the next two years?
Select all that apply for each time period. Select “NONE” in the appropriate column if you have not implemented / do not plan to implement any of the measures within that time period.
Energy Efficiency Measures: Water Heating Have
implemented in last 3 years
Plan to implement in next 2 years
1. Purchasing a more energy efficient water heater when needing to replace a unit
2. Insulating, or improving the insulation, for the pipes that carry hot water throughout your facility
3. Reducing the temperature of the hot water that your water heater(s) delivers
4. Installing ‘low flow’ nozzles that reduce the amount of hot water used
5. Installing faucet aerators that introduce air into the flow of hot water, reducing the total amount of water used
990. Other energy efficiency water heating measure(s) [SPECIFY]
998. NONE / No energy efficiency water heating measures implemented / planned / possible [EXCLUSIVE]
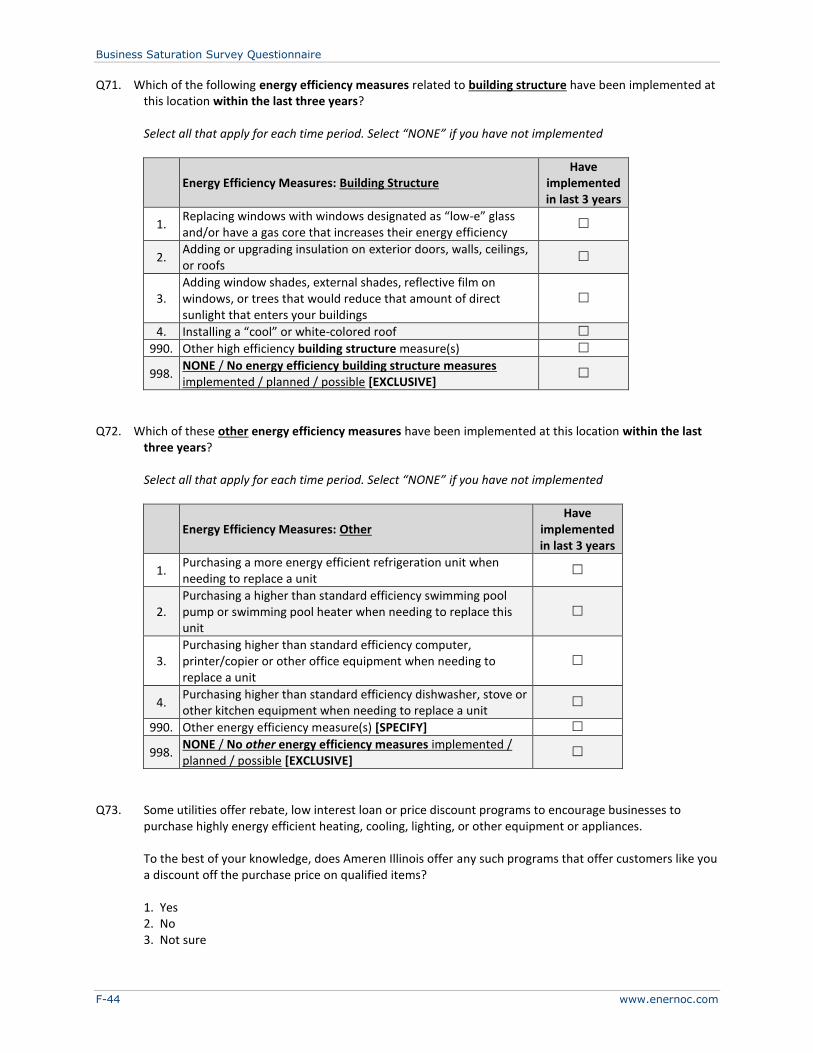
Business Saturation Survey Questionnaire
F-44 www.enernoc.com
Q71. Which of the following energy efficiency measures related to building structure have been implemented at this location within the last three years?
Select all that apply for each time period. Select “NONE” if you have not implemented
Energy Efficiency Measures: Building Structure Have
implemented in last 3 years
1. Replacing windows with windows designated as “low-e” glass and/or have a gas core that increases their energy efficiency
2. Adding or upgrading insulation on exterior doors, walls, ceilings, or roofs
3. Adding window shades, external shades, reflective film on windows, or trees that would reduce that amount of direct sunlight that enters your buildings
4. Installing a “cool” or white-colored roof
990. Other high efficiency building structure measure(s)
998. NONE / No energy efficiency building structure measures implemented / planned / possible [EXCLUSIVE]
Q72. Which of these other energy efficiency measures have been implemented at this location within the last
three years?
Select all that apply for each time period. Select “NONE” if you have not implemented
Energy Efficiency Measures: Other Have
implemented in last 3 years
1. Purchasing a more energy efficient refrigeration unit when needing to replace a unit
2. Purchasing a higher than standard efficiency swimming pool pump or swimming pool heater when needing to replace this unit
3. Purchasing higher than standard efficiency computer, printer/copier or other office equipment when needing to replace a unit
4. Purchasing higher than standard efficiency dishwasher, stove or other kitchen equipment when needing to replace a unit
990. Other energy efficiency measure(s) [SPECIFY]
998. NONE / No other energy efficiency measures implemented / planned / possible [EXCLUSIVE]
Q73. Some utilities offer rebate, low interest loan or price discount programs to encourage businesses to
purchase highly energy efficient heating, cooling, lighting, or other equipment or appliances.
To the best of your knowledge, does Ameren Illinois offer any such programs that offer customers like you a discount off the purchase price on qualified items?
1. Yes 2. No 3. Not sure

Business Saturation Survey Questionnaire
EnerNOC Utility Solutions Consulting F-45
[IF Q73=1, ASK Q73B; OTHERWISE SKIP TO Q74B] Q73B. Are you aware of any of the following programs being offered by Ameren Illinois? Have you participated
in any of the following programs in the past 3 years?
Energy Efficiency Program Aware of program
Participated in the last 3 years
1. Standard Lighting
2. Standard HVAC/Water Heater
3. Standard VFD (Variable Frequency Drive)
4. Standard Commercial Kitchen
5. Standard Lodging
6. Standard Grocery
7. Standard Agriculture
8. Standard Steam Trap
9. Standard Leak Survey and Repair
10. Competitive Large Project Incentive (CLPI)
11. Staffing Grant
12. New Construction
13. Feasibility Study
14. Retro-commissioning Compressed Air
15. Retro-commissioning Commercial Building
16. Retro-commissioning Healthcare
17. Custom Program
18. Online store
19. Multi-Family Properties
990. Other program(s) [SPECIFY]
998. NONE [EXCLUSIVE]
Q74A. If we have any questions regarding your responses to the survey, may we contact you via email? 1. Yes
0. No [IF Q74A=1, ASK Q74B; OTHERWISE SKIP TO Q75] Q74B. Please provide your email address. It will only be used to contact you about this survey. [RECORD EMAIL ADDRESS]
Business Saturation Survey Questionnaire
F-46 www.enernoc.com
CONCLUSION
[INCENTIVE NAME/ADDRESS COLLECTION SCREEN] Those are all the questions we have for you today. Thank you for your participation! Q75. To receive the $25 Visa Card thank you payment you earned by completing our survey, please provide
your name and address below.
A. Full name B. Business name (optional) C. Mailing Address Line #1 D. Mailing Address Line #2 (optional) E. Mailing Address Line #3 (optional) F. City G. State H. ZIP Code
[PROGRAMMER: INCLUDE OPTIONS FOR “I would prefer not to receive the $25 Visa Card thank you payment” AND “I would prefer not to receive this special report”]
[IF EITHER NAME/MAILING ADDRESS ENTERED, SHOW INCENTIVE NAME/ADDRESS/EMAIL ADDRESS VERIFICATION SCREEN; OTHERWISE SKIP TO INCENTIVE CONFIRMATION / GOODBYE SCREEN] [INCENTIVE NAME/ADDRESS/EMAIL ADDRESS VERIFICATION SCREEN] Please review the information you provided and verify that it is complete and correct: [DISPLAY NAME/ADDRESS/EMAIL ADDRESS COLLECTED ON PREVIOUS SCREEN] If you would like to edit any of this information, please click the “Back” button to go to the previous screen, where you can make any needed changes. Otherwise, please click “Next” to submit your information. [PROGRAMMER: INCLUDE BACK BUTTON FOR THIS SCREEN DURING LIVE VERSION] [INCENTIVE CONFIRMATION / FOLLOW-UP REQUEST SCREEN] [IF NAME/MAILING ADDRESS ENTERED, DISPLAY, “You have successfully submitted the information we need so we can send you your $25 Visa card thank you payment. This payment will be issued to the name you provided and will be mailed within 3-4 weeks to the address you provided.”] [PROGRAMMER: DISPLAY ON SAME SCREEN AS ABOVE LANGUAGE] Q76. If you would like information on how your business can save money on energy bills, please visit us at
www.actonenergy.com.

Business Saturation Survey Questionnaire
EnerNOC Utility Solutions Consulting F-47
Additionally, if you would like someone from the Ameren Illinois energy efficiency implementation team to contact you about further energy efficiency opportunities, please provide the appropriate contact information below: (NOTE: All other information you have provided in this survey will continue to remain anonymous, even if you choose to be contacted. None of your prior responses will be communicated to the Ameren Illinois energy efficiency implementation team.)
1. Yes, we would like to be contacted by someone from the Ameren Illinois energy efficiency implementation team. Please supply appropriate information.
Contact Name:____________________________
Business Name:____________________________
Preferred contact method(s) – Select all that apply:
phone e-mail postal mail
Daytime phone number :________________ [ALLOW UP TO 20 CHARACTERS]
E-mail address:_____________________________
Postal address:_____________________________
_____________________________
_____________________________
2. No, we would NOT like to be contacted
[IF Q76=1, GO TO FOLLOW-UP REQUEST VERIFICATION SCREEN; IF Q76=2, SKIP TO FOLLOW-UP REQUEST CONFIRMATION / COMMENT SCREEN] [FOLLOW-UP REQUEST VERIFICATION SCREEN] Please review the contact information you provided and verify that it is complete and correct: [DISPLAY PROVIDED INFORMATION] If you would like to edit any of this information, please click the “Back” button to go to the previous screen, where you can make any needed changes. Otherwise, please click “Next” to submit your information. [PROGRAMMER NOTE: INCLUDE ‘BACK’ BUTTON ON THIS SCREEN WHEN SURVEY IS LIVE] [FOLLOW-UP REQUEST CONFIRMATION / COMMENT SCREEN] [IF Q76=1, DISPLAY, “You have successfully submitted your contact information! You will be contacted by a representative from the Ameren Illinois energy efficiency implementation team within 10 business days.”]
If, at this time, you’d like to make any general comments or provide feedback to Ameren Illinois, please use the following text box: [RECORD TEXT; ALLOW A HIGH MAX NUMBER OF CHARACTERS FOR LONG COMMENTS]

Business Saturation Survey Questionnaire
F-48 www.enernoc.com
(Note: Any comments you submit here will not be linked to your previous survey responses or to any other identifying information when communicated to Ameren Illinois.) Please click “Next” to submit your comment or to proceed without leaving a comment. [GOODBYE SCREEN] [IF STATUS=C, DISPLAY, “Thank you very much for your help with our research. It is greatly appreciated! Have a nice day!”] [IF STATUS=T OR O, DISPLAY, “Thank you. Have a nice day!”] [INCLUDE “Close window” BUTTON]
SURVEY CLOSED MESSAGE
We appreciate your time and effort in responding to the survey invitation you received, but the survey sponsored by Ameren Illinois is now closed. In order to achieve a representative sample for this survey, quotas with specific criteria needed to be designated. Because these quotas have now been filled, we are not accepting any more responses.
If you would like information on how your business can save money on energy bills, please visit us at
http://www.actonenergy.com
Thank you. Have a nice day!
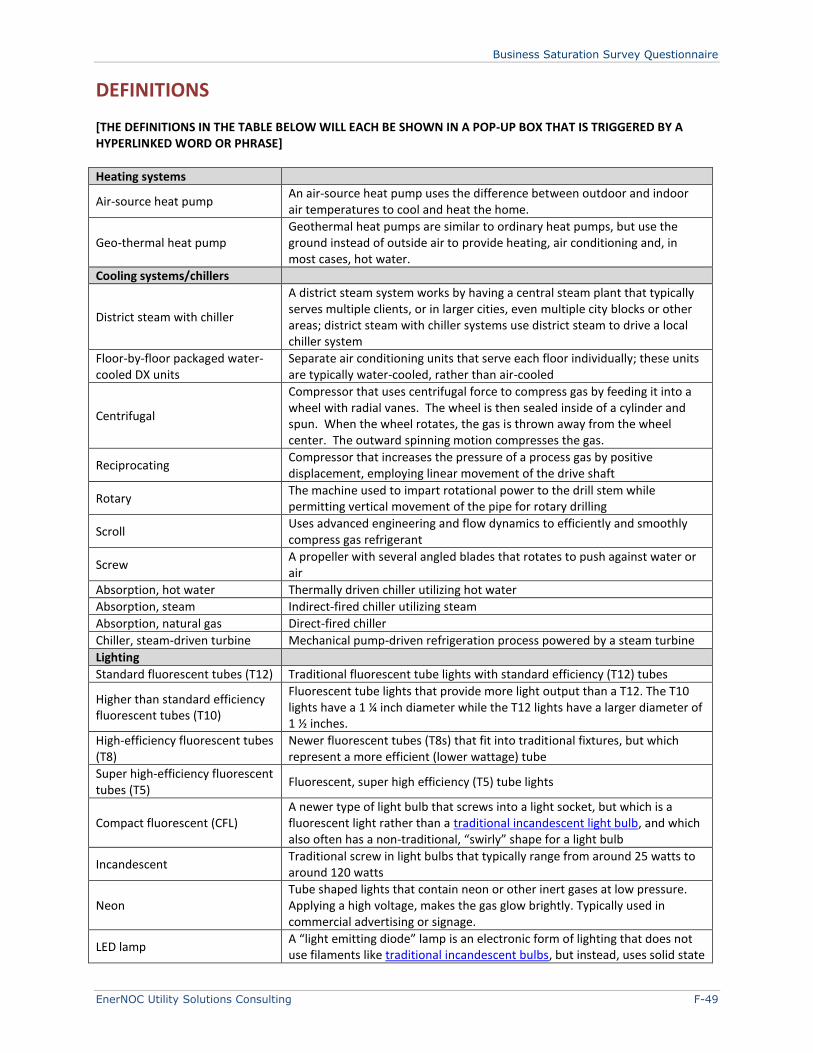
Business Saturation Survey Questionnaire
EnerNOC Utility Solutions Consulting F-49
DEFINITIONS
[THE DEFINITIONS IN THE TABLE BELOW WILL EACH BE SHOWN IN A POP-UP BOX THAT IS TRIGGERED BY A HYPERLINKED WORD OR PHRASE]
Heating systems
Air-source heat pump An air-source heat pump uses the difference between outdoor and indoor air temperatures to cool and heat the home.
Geo-thermal heat pump Geothermal heat pumps are similar to ordinary heat pumps, but use the ground instead of outside air to provide heating, air conditioning and, in most cases, hot water.
Cooling systems/chillers
District steam with chiller
A district steam system works by having a central steam plant that typically serves multiple clients, or in larger cities, even multiple city blocks or other areas; district steam with chiller systems use district steam to drive a local chiller system
Floor-by-floor packaged water-cooled DX units
Separate air conditioning units that serve each floor individually; these units are typically water-cooled, rather than air-cooled
Centrifugal
Compressor that uses centrifugal force to compress gas by feeding it into a wheel with radial vanes. The wheel is then sealed inside of a cylinder and spun. When the wheel rotates, the gas is thrown away from the wheel center. The outward spinning motion compresses the gas.
Reciprocating Compressor that increases the pressure of a process gas by positive displacement, employing linear movement of the drive shaft
Rotary The machine used to impart rotational power to the drill stem while permitting vertical movement of the pipe for rotary drilling
Scroll Uses advanced engineering and flow dynamics to efficiently and smoothly compress gas refrigerant
Screw A propeller with several angled blades that rotates to push against water or air
Absorption, hot water Thermally driven chiller utilizing hot water
Absorption, steam Indirect-fired chiller utilizing steam
Absorption, natural gas Direct-fired chiller
Chiller, steam-driven turbine Mechanical pump-driven refrigeration process powered by a steam turbine
Lighting
Standard fluorescent tubes (T12) Traditional fluorescent tube lights with standard efficiency (T12) tubes
Higher than standard efficiency fluorescent tubes (T10)
Fluorescent tube lights that provide more light output than a T12. The T10 lights have a 1 ¼ inch diameter while the T12 lights have a larger diameter of 1 ½ inches.
High-efficiency fluorescent tubes (T8)
Newer fluorescent tubes (T8s) that fit into traditional fixtures, but which represent a more efficient (lower wattage) tube
Super high-efficiency fluorescent tubes (T5)
Fluorescent, super high efficiency (T5) tube lights
Compact fluorescent (CFL) A newer type of light bulb that screws into a light socket, but which is a fluorescent light rather than a traditional incandescent light bulb, and which also often has a non-traditional, “swirly” shape for a light bulb
Incandescent Traditional screw in light bulbs that typically range from around 25 watts to around 120 watts
Neon Tube shaped lights that contain neon or other inert gases at low pressure. Applying a high voltage, makes the gas glow brightly. Typically used in commercial advertising or signage.
LED lamp A “light emitting diode” lamp is an electronic form of lighting that does not use filaments like traditional incandescent bulbs, but instead, uses solid state
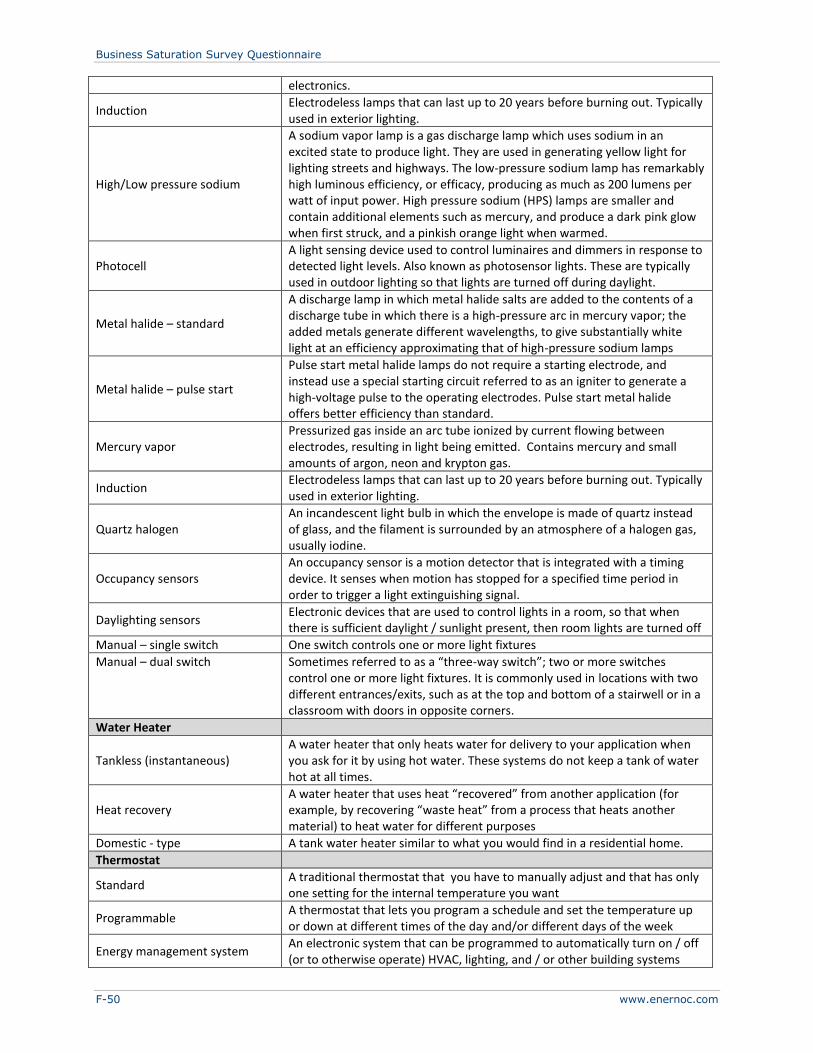
Business Saturation Survey Questionnaire
F-50 www.enernoc.com
electronics.
Induction Electrodeless lamps that can last up to 20 years before burning out. Typically used in exterior lighting.
High/Low pressure sodium
A sodium vapor lamp is a gas discharge lamp which uses sodium in an excited state to produce light. They are used in generating yellow light for lighting streets and highways. The low-pressure sodium lamp has remarkably high luminous efficiency, or efficacy, producing as much as 200 lumens per watt of input power. High pressure sodium (HPS) lamps are smaller and contain additional elements such as mercury, and produce a dark pink glow when first struck, and a pinkish orange light when warmed.
Photocell A light sensing device used to control luminaires and dimmers in response to detected light levels. Also known as photosensor lights. These are typically used in outdoor lighting so that lights are turned off during daylight.
Metal halide – standard
A discharge lamp in which metal halide salts are added to the contents of a discharge tube in which there is a high-pressure arc in mercury vapor; the added metals generate different wavelengths, to give substantially white light at an efficiency approximating that of high-pressure sodium lamps
Metal halide – pulse start
Pulse start metal halide lamps do not require a starting electrode, and instead use a special starting circuit referred to as an igniter to generate a high-voltage pulse to the operating electrodes. Pulse start metal halide offers better efficiency than standard.
Mercury vapor Pressurized gas inside an arc tube ionized by current flowing between electrodes, resulting in light being emitted. Contains mercury and small amounts of argon, neon and krypton gas.
Induction Electrodeless lamps that can last up to 20 years before burning out. Typically used in exterior lighting.
Quartz halogen An incandescent light bulb in which the envelope is made of quartz instead of glass, and the filament is surrounded by an atmosphere of a halogen gas, usually iodine.
Occupancy sensors An occupancy sensor is a motion detector that is integrated with a timing device. It senses when motion has stopped for a specified time period in order to trigger a light extinguishing signal.
Daylighting sensors Electronic devices that are used to control lights in a room, so that when there is sufficient daylight / sunlight present, then room lights are turned off
Manual – single switch One switch controls one or more light fixtures
Manual – dual switch Sometimes referred to as a “three-way switch”; two or more switches control one or more light fixtures. It is commonly used in locations with two different entrances/exits, such as at the top and bottom of a stairwell or in a classroom with doors in opposite corners.
Water Heater
Tankless (instantaneous) A water heater that only heats water for delivery to your application when you ask for it by using hot water. These systems do not keep a tank of water hot at all times.
Heat recovery A water heater that uses heat “recovered” from another application (for example, by recovering “waste heat” from a process that heats another material) to heat water for different purposes
Domestic - type A tank water heater similar to what you would find in a residential home.
Thermostat
Standard A traditional thermostat that you have to manually adjust and that has only one setting for the internal temperature you want
Programmable A thermostat that lets you program a schedule and set the temperature up or down at different times of the day and/or different days of the week
Energy management system An electronic system that can be programmed to automatically turn on / off (or to otherwise operate) HVAC, lighting, and / or other building systems
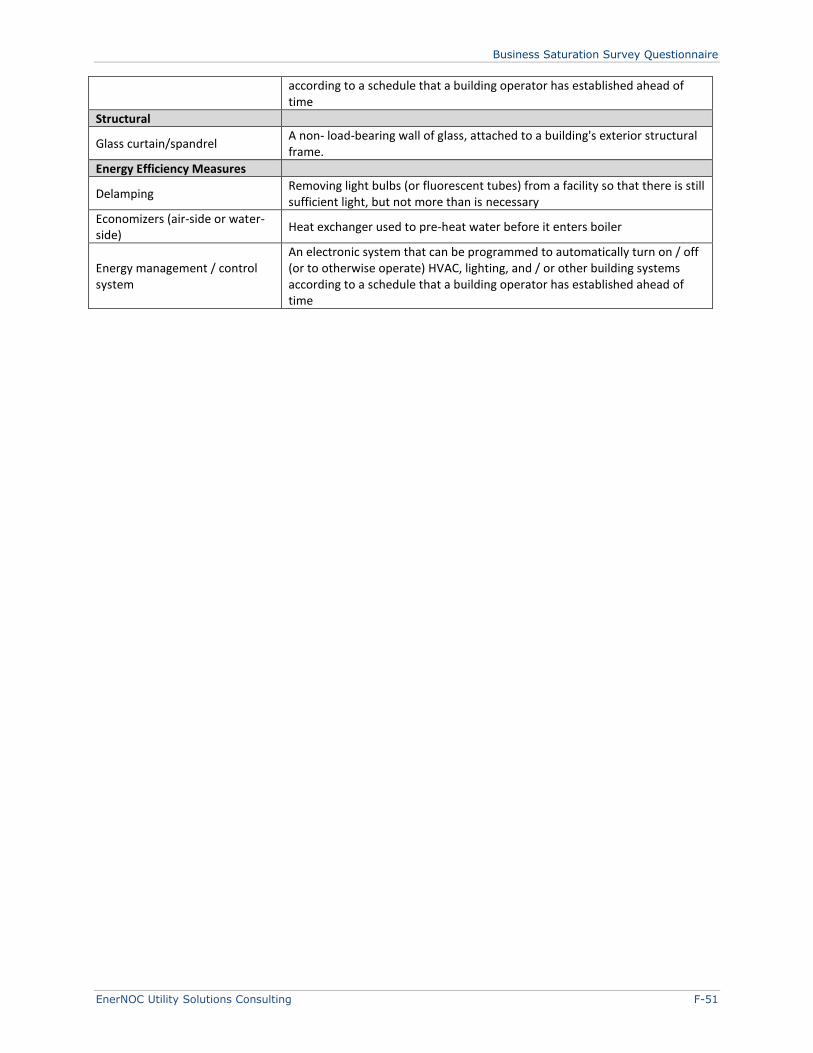
Business Saturation Survey Questionnaire
EnerNOC Utility Solutions Consulting F-51
according to a schedule that a building operator has established ahead of time
Structural
Glass curtain/spandrel A non- load-bearing wall of glass, attached to a building's exterior structural frame.
Energy Efficiency Measures
Delamping Removing light bulbs (or fluorescent tubes) from a facility so that there is still sufficient light, but not more than is necessary
Economizers (air-side or water-side)
Heat exchanger used to pre-heat water before it enters boiler
Energy management / control system
An electronic system that can be programmed to automatically turn on / off (or to otherwise operate) HVAC, lighting, and / or other building systems according to a schedule that a building operator has established ahead of time
EnerNOC Utility Solutions Consulting 500 Ygnacio Valley Road, Suite 450 Walnut Creek, CA 94596
P: 925.482.2000 F: 925.284.3147
About EnerNOC Utility Solutions Consulting
EnerNOC Utility Solutions Consulting is part of EnerNOC Utility Solutions group, which
provides a comprehensive suite of demand-side management (DSM) services to
utilities and grid operators worldwide. Hundreds of utilities have leveraged our
technology, our people, and our proven processes to make their energy efficiency
(EE) and demand response (DR) initiatives a success. Utilities trust EnerNOC to work
with them at every stage of the DSM program lifecycle – assessing market potential,
designing effective programs, implementing those programs, and measuring program
results.
EnerNOC Utility Solutions delivers value to our utility clients through two separate
practice areas – Program Implementation and EnerNOC Utility Solutions Consulting.
• Our Program Implementation team leverages EnerNOC’s deep “behind-the-meter
expertise” and world-class technology platform to help utilities create and
manage DR and EE programs that deliver reliable and cost-effective energy
savings. We focus exclusively on the commercial and industrial (C&I) customer
segments, with a track record of successful partnerships that spans more than a
decade. Through a focus on high quality, measurable savings, EnerNOC has
successfully delivered hundreds of thousands of MWh of energy efficiency for
our utility clients, and we have thousands of MW of demand response capacity
under management.
• The EnerNOC Utility Solutions Consulting team provides expertise and analysis
to support a broad range of utility DSM activities, including: potential
assessments; end-use forecasts; integrated resource planning; EE, DR, and
smart grid pilot and program design and administration; load research;
technology assessments and demonstrations; evaluation, measurement and
verification; and regulatory support.
The EnerNOC Utility Solutions Consulting team has decades of combined experience
in the utility DSM industry. The staff is comprised of professional electrical,
mechanical, chemical, civil, industrial, and environmental engineers as well as
economists, business planners, project managers, market researchers, load research
professionals, and statisticians. Utilities view our experts as trusted advisors, and we
work together collaboratively to make any DSM initiative a success.


![€¦ · Web viewCONFIRMATION AGREEMENT. Between [Winning Bidder] and. Ameren Illinois Company d/b/a Ameren Illinois. This Confirmation Agreement is entered into this [____] day](https://static.fdocuments.net/doc/165x107/5f1eab8599413a706b6628ae/web-view-confirmation-agreement-between-winning-bidder-and-ameren-illinois-company.jpg)
