AMC Entertainment Holdings, Inc.
44
AMC Entertainment Holdings, Inc. Building the cinema experience of tomorrow. Turnaround Management Final Project Professor Kathryn Harrigan December 18, 2020 Kartikeya Dar | Nazar Kamenchenko | Tae Kim | Konstantin Malyshkin Cover Photo: “AMC Dine- In Theater, Disney Springs” by Michael Rivera CC BY 4.0 Disclaimer: the report colors are based on Columbia University and not AMC’s design.
Transcript of AMC Entertainment Holdings, Inc.

AMC Entertainment Holdings, Inc. Building the cinema experience of tomorrow.
Turnaround Management Final Project
Professor Kathryn Harrigan
December 18, 2020
Kartikeya Dar | Nazar Kamenchenko | Tae Kim | Konstantin Malyshkin
Cover Photo: “AMC Dine-In Theater, Disney Springs” by Michael Rivera CC BY 4.0
Disclaimer: the report colors are based on Columbia University and not AMC’s design.
2
TABLE OF CONTENTS
1. Executive Summary ........................................................................................................4
2. Company Overview ........................................................................................................5
3. Industry and Competition ................................................................................................7
Industry Overview ............................................................................................. 7
Competitive Landscape..................................................................................... 7
SWOT Analysis ............................................................................................... 10
Peer benchmarking ......................................................................................... 12
Key Competitors’ Response to COVID-19 ...................................................... 13
Near-term Catalysts ........................................................................................ 16
4. Situation Overview ....................................................................................................... 17
COVID-19 Pandemic ....................................................................................... 17
Capital Structure ............................................................................................. 23
Leases and Rent Expense .............................................................................. 24
Ownership Structure and Creditor Relations .................................................. 25
5. Turnaround Proposal ................................................................................................... 26
Strategic RECOMMENDATIONS ................................................................... 26
Operational RECOMMENDATIONS ............................................................... 28
Financial RECOMMENDATIONS AND Restructuring Options....................... 29
Implementation ................................................................................................ 30
Valuation Analysis .............................................................................................................. 32
Liquidation ....................................................................................................... 32
Going-concern valuation ................................................................................. 34
Recovery waterfall ........................................................................................... 35
6. Conclusion ................................................................................................................... 36
Summary of recommendation ......................................................................... 36
Short-term Outcomes ...................................................................................... 36
Long-term Perspective .................................................................................... 36
Monitoring Progress ........................................................................................ 36
REFERENCES ................................................................................................................... 37
Appendix ............................................................................................................................ 38


AMC Entertainment Holdings
Turnaround Plan
4
1. EXECUTIVE SUMMARY
AMC Entertainment Holdings, Inc. (“AMC”) is a
leading global operator of cinemas, boasting an
expansive geographical footprint over 15 countries
and strong revenue growth over the recent years.
Despite a comparatively strong attendance (by
industry’s metrics), the company’s diverse offerings
and immersive theatres have failed to materialize
into superior profitability, with AMC lagging its peers
in terms of EBITDA margins.
The 2020 COVID-19 pandemic and the related
shutdowns caused an industry-wide drop in revenue.
The negative impact on AMC’s earnings was
amplified by the firm’s significant operating leverage,
forcing the company to implement operational
changes and engage with lenders to amend its
existing debt.
Although AMC was able to buy itself some time, the
company is facing an imminent liquidity crisis, as it
heads into the 2021. We believe this situation
presents an opportunity for AMC to calibrate its long-
term strategic vision and realign operations with a
view towards the long-term sustainable profitability.
The below proposal is composed of specific
strategic, operational, and financial
recommendations, along with their respective
implementation timelines. Inter alia, it highlights
short-term initiatives to improve profitability and long-
term market positioning, combining AMC’s rich
history and understanding of theatre operations with
innovative approaches like dynamic pricing and real-
time customer engagement.
By delivering immersive experiences (the future of
cinemas), we believe AMC will continue to draw a
meaningful audience to support top and bottom line
growth. But before the company can begin to
undertake some of the longer-term initiatives, it
needs to address its capital structure and liquidity
situation. While our analysis suggests AMC has
potential to deliver attractive returns to its investors,
the immediate situation requires the company to
address its balance sheet obligations in a way that
will allow it to emerge, as attendance rebounds.
While we have formulated a wide array of potential
short- and long-term changes, we urge the company
to begin experimenting with different initiatives,
scrutinize the impact of these efforts, and double
down on those, which show the most promising
results. Ultimately, their effectiveness can only be
verified with localized execution.
All we got to do is raise a little money and we’ll be just fine.
Adam M. Aron
President, CEO and Director
AMC’s quarterly earnings call on November 2, 2020

AMC Entertainment Holdings
Turnaround Plan
5
2. COMPANY OVERVIEW
Company Background1
Originally formed as Durwood Theatres, AMC was founded in 1920 by Maurice, Edward, and Barney Dubinsky in
Kansas, Missouri. When Edward’s son, Stanley Durwood, took control of Durwood Theatres in 1961 and renamed
the firm as American Multi-Cinema (AMC), it was a 10-theatre chain.
AMC is now the largest theatre operator in the world. Before the COVID-19 struck, the firm commanded a market
share of ~22% in the US, ahead of Cineworld as the second at ~17% and Cinemark third at ~14%. As of
December 31, 2019 (pre-COVID-19), AMC operated 1,004 theatres and 11,041 screens in 15 countries, including
636 theatres and 8,094 screens in the US, and 368 theatres and 2,947 screens internationally. 356 million
customers attended AMC theatres in 2019, and AMC employed 3,952 full-time and 34,920 part-time employees
as of 2019-end. The Dalian Wanda Group (“Wanda”) and Silver Lake Partners collectively hold the majority of
AMC’s outstanding common stock and voting power.
AMC grew significantly, primarily inorganically, after its acquisition in 2012 by Wanda for ~$2.6B. In 2016, AMC
completed a transaction to acquire Carmike Cinemas and became the largest theatre operator in the US. Further,
in 2016 and 2017, AMC made a concerted push to expand into Europe. As a result, it acquired Odeon and UCI
Cinemas Holdings (“Odeon”) and Nordic Cinemas Group Holding (“Nordic”). These three acquisitions, which
cumulated to ~$3B, were funded with a substantial amount of debt and required AMC to assume each of the
targets’ debt. Consequently, AMC became highly leveraged. A refinancing in 2019 reduced AMC’s ongoing
interest service, however did not materially reduce its debt burden. Going into the 2020, such leverage caused
AMC to be particularly susceptible to distress because of the pandemic.
iSource: Company Filings, team analysis
AMC is well known for its innovation. In 1962, AMC introduced the world to multiplexes. In 1981, it was the first
theatre chain to introduce cup-holder armrests. In 1995, AMC opened the first megaplex. After a century of
existence, has the sheen worn off?
1 AMC’s website, presentations and filings
Historical Financial Performance Mar-19 Jun-19 Sep-19 Dec-19 Mar-20 Jun-20 Sep-20
Revenue 1,200$ 1,506$ 1,317$ 1,448$ 942$ 19$ 120$
EBITDA 87 226 140 238 (9) (346) (352)
% Margin 7% 15% 11% 16% (1%) (1,833%) (294%)
Net Income (130) 49 (55) (13) (2,176) (561) (906)
Non-Cash Charges 181 120 124 172 2,153 159 612
Change in NWC (50) (17) (12) 210 (161) 170 (62)
Cash Flow From Operations 1$ 152$ 57$ 369$ (184)$ (232)$ (356)$
CapEx (115) (127) (118) (170) (92) (35) (29)
Free Cash Flow (113)$ 25$ (62)$ 199$ (276)$ (267)$ (385)$

AMC Entertainment Holdings
Turnaround Plan
6
Geographical Footprint2
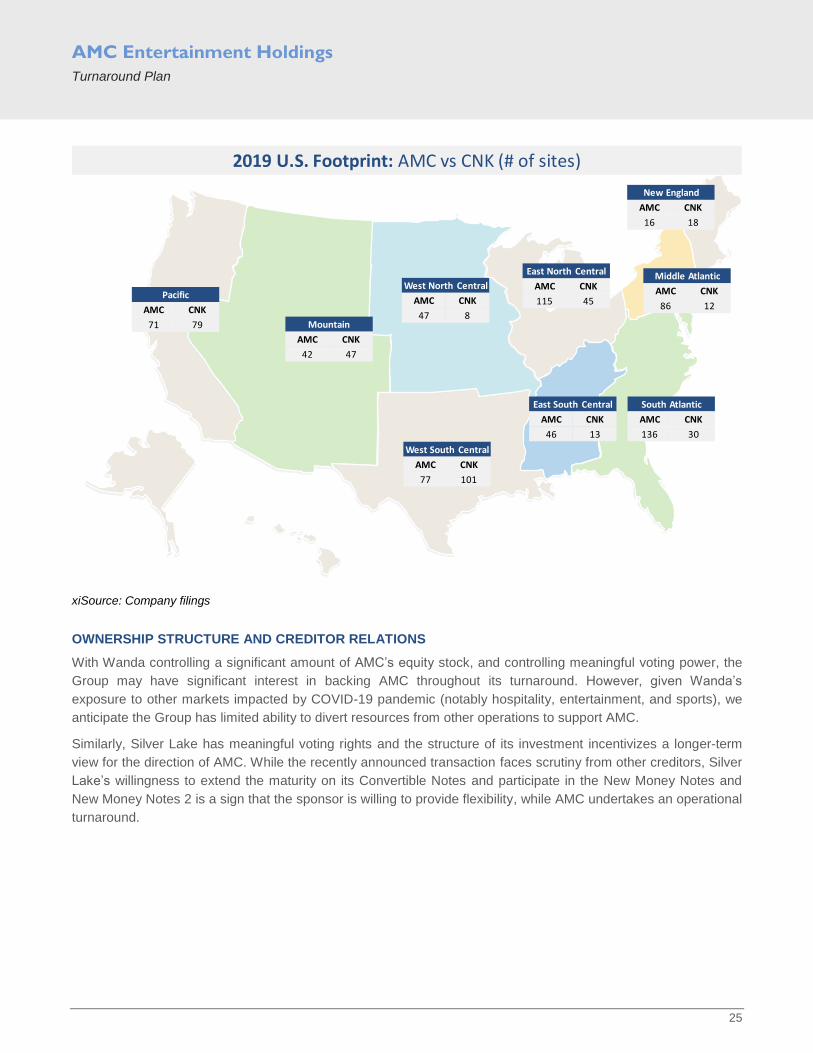
AMC’s business is divided into two geographical segments: US markets and international markets. While it
competes in terms of number of screens in other regions, it dominates the market in the Mid-Atlantic, South
Atlantic, and East North Central regions. A significant number of AMC theatres are in the metropolitan areas of
New York, Los Angeles, Chicago, Atlanta, and Washington, DC (in each of which it is the market leader) and
other large cities. Consequently, it is exposed to greater rent expenses per theatre than its competitors and was
also unable to open theatres in many of these key regions because of stricter COVID-19 restrictions.
Of the 368 theatres and 2,947 screens it operated internationally as of December 31, 2019, 366 theatres and
2,938 screens were in Europe, primarily in high-density areas. It became the market leader in Italy, Spain,
Sweden, Norway, Finland, Latvia, and Lithuania, as well as a leading operator in the UK, Ireland, Portugal, and
Germany. Outside of Europe, it has operations in the Kingdom of Saudi Arabia. In 4Q19 and 1Q20, AMC
emphasized that it planned to direct a sizable chunk of capex towards growing European operations. Revenue
and cash burn across the two geographical segments are roughly proportional to the number of screens.
Revenue Mix3
For 2018-19, ~60-63% of AMC’s revenues came from admissions, ~29-32% from F&B sales, and ~2.5% from
advertising. In terms of absolute revenue, AMC has kept its average ticket price above $9, though we see
segmentation based on the geographical region in which a theatre is located and the type of seat. F&B revenue
per patron is typically over $4.5. Although admissions revenue decreased marginally during 2018-19, F&B
revenue has seen consistent increases.
F&B also contributes meaningfully to AMC’s margins. The gross margin from F&B was ~84% in 2019, while the
gross margin from admissions was ~49%. While the margin from F&B trends lower internationally compared to
the US, the margin from admissions is higher.
2 AMC’s website, presentations and filings
3 AMC’s website, presentations and filings

AMC Entertainment Holdings
Turnaround Plan
7
3. INDUSTRY AND COMPETITION
INDUSTRY OVERVIEW
The U.S. movie theatre industry consists of traditional cinemas, drive-in, and outdoor movie theatres, along with
film festival exhibitors. The industry is relatively concentrated and dominated by three major players: Cineworld
(25.2% market share post-COVID-19), AMC (20.3% market share), and Cinemark (12.6% market share), together
constituting 58.1%4 of the overall market share. The industry generates revenue from 4 major streams, of which
admissions constitutes the lion’s share of 66.8% and F&B revenues placing second at 29.8%.
During the last 20 years (2001 – 2019), the mature industry has exhibited stable annual revenues between ~$14.5
- 18.5B (CAGR of 1.2% per annum, fluctuating between –5.2% and +7.3% Y-o-Y). Revenue growth was
sustained by a 61.8%5 increase (2.6% CAGR) in the average price of a movie ticket in the U.S. While the annual
number of movie tickets sold has not declined dramatically, the total number of movie tickets sold as a percentage
of the U.S. population has decreased by ~25% over the same period. This partly suggests that the emergence of
online movie streaming services is clearly materializing as a structural headwind.
COVID-19 has accelerated this trend, as the
industry experienced unprecedented revenue
declines of –62.6% Y-o-Y, bringing expected
2020FY revenues to $6.9B in the U.S.
As such, we expect the movie theatre industry
to continue facing material headwinds,
especially as prices of movie tickets and F&B
sales approach their respective ceilings.
However, strategies to preserve, or improve
profitability by restructuring value propositions
and business operations do exist and prove
vital in shaping the industry landscape in the
near-to-medium term future.
COMPETITIVE LANDSCAPE
The movie theatre industry in the US is fragmented, with ~50% of screens owned by the three largest theatre
circuits and the remaining screens owned by an estimated 800 smaller operators.6 AMC Entertainment is the
largest circuit operator in North America, with approximately 634 locations and 8,043 screens in the region.7
In the US, ever since the 1948 US v. Paramount Pictures, Inc. ruling, when the US Supreme Court applied
antitrust laws and prohibited content producers from monopolizing (or oligopolizing) the distribution, the movie
theatre landscape has gradually expanded and changed (e.g. drive-in theatres, multiplex since 1960s - first by
4 IBIS World, Movie Theaters in the US Industry Report, 2020
5 Motion Pictures Association, THEME Report 2019. Available at: https://www.motionpictures.org/wp-
content/uploads/2020/03/MPA-THEME-2019.pdf 6 Marcus Corp. Investor Reports
7 National Association of Theatre Owners, as of 1 July 2020 (includes US and Canada screens only)
Annual Ticket Sales
iiSource:TheNumbers

AMC Entertainment Holdings
Turnaround Plan
8
AMC indeed, megaplex - also by AMC, 3D/IMAX screens). Local and regional chains have been consolidating
since the 1990’s, driven by several factors - the gradual rise of nontraditional competitors (especially since the
DotCom Boom in late 1990’s), and pressure to create scale and expand nationally and overseas, with markets
opening due to geopolitical changes.
iiiNational Association of Theatre Owners
For AMC, this means that the competitive landscape has expanded from traditional rivals - such as Regal (now
part of Cineworld), Cinemark, Cinepolis, Cineplex, and, to a lesser extent IMAX, since the latter has diverse JV
sharing agreements with AMC and other industry players on utilizing its IMAX theatres and technology. Gradually
non-traditional competitors such as Netflix, Amazon’s Prime Video and then Twitch, as well as Hulu and
Alphabet’s YouTube Originals, among others, have become an ever-posing threat to AMC’s and its traditional
rivals’ business models of distribution (please see the SWOT analysis below). Please refer to the below “AMC
Competitive Positioning” Graph, where brands, circled in red, constitute an ever-growing area of competition and
customer interest. To complicate matters, just in the US, aside from the above competition, AMC has studios and
major telecoms running their online subscription platforms like AppleTV+ (Apple), Disney+ (Disney),
NBCUniversal (Comcast), Sling TV (Dish Network), and internationally - various domestic digital platforms,
notably in China - YoukuTudou (Alibaba), Tencent Video (Tencent), iQiyi (Baidu), all with ~100MM audiences. In
fact, AMC is majority owned (38%) since 2012 by 1 of its international competitors - Dalian Wanda Group (as
discussed), which operates Wanda Cinemas across Asia.
363
363
414
419
490
515
1,106
1,676
4,345
7,220
8,043
35
34
41
49
55
34
91
164
345
548
634
Malco Theatres Inc.
Studio Movie Grill
CMX Cinemas
B&B Theatres
Landmark / MJR
Harkins Theatres
Marcus Theatres
Cineplex
Cinemark
Regal Cinemas
AMC Entertainment
Circuit Sites Screens

AMC Entertainment Holdings
Turnaround Plan
9
In short, there is competition on all fronts - from traditional space, from content creators, and from non-traditional
space, all moving towards, or are fundamentally digital. Technological innovation and disruptions, such as the
COVID-19, demonstrate the threats that AMC is facing. While physical movie experiences are unlikely to
disappear anytime soon (certainly not 100%), at the same time the customer migration towards digital world is
undoubtable. For example, in North America audience attendance, on average, has plummeted 30% from 2002 to
20198; the COVID-19 health crisis saw multi-month attendance declines of 100% in 2020, with gradual openings
and reduced admissions rates. Concurrently, major studios are increasingly considering shifting from theatrical
releases to VOD (video-on-demand), and theatrical releases (traditionally enjoying benefits such as early release
vs VOD, known as theatric window) are gradually declining. The change in audiences is different in diverse
countries and regions, however grater move towards digital is secular and consistent globally.
8 Hall, S and Pasquini, S, Can there be a fairy-tale ending for Hollywood after COVID-19? Available at:
https://www.weforum.org/agenda/2020/07/impact-coronavirus-covid-19-hollywood-global-film-industry-movie-theatres

AMC Entertainment Holdings
Turnaround Plan
10
SWOT ANALYSIS
As we compare AMC to its traditional and non-traditional rivals, we highlight each of the internal (Strengths and
Weaknesses) and external (Opportunities and Threats) elements, summarized in the Graph, titled “SWOT
Analysis” below:
Strengths:
Scale of physical operations - despite a 2017 acquisition of Regal by Cineworld, creating a solid world’s
second largest movie theatre operator, AMC remains #1, despite technically IMAX Corporation holding this
title, mainly because IMAX counts partnership screens (including AMC). This scale, the use of multiplexes,
and megaplexes (both pioneered by AMC) allows AMC to offer an unparalleled choice to customers and
achieve some economies of scale, mainly in spreading its content acquisition costs.
More viewing formats - this strength mainly applies when compared against digital rivals, because most big
cinema chains also offer IMAX, RealD’s 3D, and Dolby. That said, customers do occasionally complain about
“LieMAX” experience, meaning not an authentic IMAX or 3D experience, something that AMC (among others)
has been accused of as well, despite its extensive JVs with IMAX.
Existing relationships with original content creators - this is especially advantageous vis-a-vis new content
creators (e.g. Netflix, Hulu, AMZN, YouTube), although such strength has been gradually dwindling over the
last decade. About 13-14 years ago, when most of today’s rivals (except Netflix) were getting their footing in
the industry, they could not dream of achieving same concessions from studios like Universal, as could big
distributions like AMC. This is gradually changing, more on this in the “Threats” sub-section.
Prime locations (at least in the US) with larger audience and average spend, compared to smaller competitors
such as Cinemark. This, at times, can be a double-edged sword, because while prime locations, on average,
draw bigger crowds and with potentially higher per capita spend, operating in such locations is also, on
average, more expensive. It comes down to balancing the location choice with customer experience in each
screen and/or location.
Average content experience is higher, with specialized equipment and settings of screen rooms - this is a
strength compared with digital rivals, however an approximately equivalent experience with physical rivals.
Despite certain customers able to afford home theatres and top-line equipment, most would be happy with a

AMC Entertainment Holdings
Turnaround Plan
11
hand-held, or portable device to watch the content. Therefore, for a premium experience (sound and video
effects), most would choose to visit a cinema.
Weaknesses
High capex and operating expenses, compared to all-digital competitors (Amazon, YouTube, Tencent, etc.).
The costs of acquisition, or lease of physical properties, as well as staff for maintenance and operation is
certainly higher vs 0 for digital platforms.
As a result of #1, average cost and price of content is higher for in-person/theatre viewership compared to
digital. When trying to appeal to greater audiences and when your price may be x2-5 higher and for more
limited amount of content, the advantages of digital become considerable.
Low (although gradually rising) in-house content generation - AMC traditionally focused on distribution.
However, due to the below threats (“Threats” sub-section and what was described in the “Competitive
Landscape”), it moved into content generation as well.
Despite historical successes in customer satisfaction, gradual decline in differentiation versus key rivals
(especially in customer experience) - although some customers are not enjoying the “corporate” feel of large
cinema chains like AMC and, instead, choosing smaller/local ones, an even bigger complaint is mediocre
quality experience not substantiating the premium paid over consuming content at home or on-the-go via
digital channels.
Opportunities
Traditional antitrust regulation, separating content production and distribution, is becoming blurred due to
digitization of consumption. This means AMC should go more into content creation. Focusing purely on
distribution can work (being a digital platform), however shedding surplus physical assets would be a must
(more on this in the “Turnaround Proposal” section and related recommendations).
Lower operating, marketing, and distribution costs with digitization, savings from which can go into #1. This is
an outcome of operating leaner and more digital businesses. More of SG&A would then go to content
creation, as opposed to distribution.
"Democratization" of content - there is a historically greater showing of content, developed not just by large
studios, but by small firms or even individuals from all walks of life, mainly driven by access to information and
technology. This is also supported by societies, with newer awards specifically for less known, or small-scale
producers. Consequently, whether a young student, a large studio, or AMC - all have ability to source talent
and develop content that may go viral and drive sales.
Potential audience increase from where cinemas are to, effectively, anywhere globally. This means whether
you have 1 physical theatre, or 978 (like AMC, with even larger number of screens), you now have potential
access to anyone globally who will understand your content (unless language translation is needed) and is
willing to pay for it anywhere in the world. This partly drives how content is developed and communicated.
Threats
A secular trend towards greater digital content consumption vs in-theatre, even despite advanced viewing
priority over digital. It used to be that in-theatre performances would be given a time slot, when releases could
only be viewed in theatres (known as a theatrical window). With COVID-19 and more generally digitization
trend, VOD (video-on-demand) releases are gaining at least equal priority over theatre releases.
Over the years, AMC has innovated with theatre formats, catering, customized discounts, and subscriptions to
focus on customers. Given its size, competitors imitated and withered away these low-barrier advantages.
Customer experience and catering to viewer’s content preferences should be key drivers of focus not to
simply differentiate, but to survive in a greater competition pool and finds its Blue Ocean strategic advantage.

AMC Entertainment Holdings
Turnaround Plan
12
With "glut" of quality content, there is an exponential pressure in creating differentiated theatre experience vs
at-home. Related to #2 above, with new TV series, movies, and cartoons are being released on a constant-
basis, the search for “gems” (content that becomes viral and develops consistent viewership) is much harder
and requires finding talent (both in writing, directing, and performing). This may also lead to competitors
bidding up salaries for top and consistent talent.
Any risks associated with running public gathering events - examples include COVID-19, terrorist or lone-wolf
attacks, natural disasters, or poor weather, government regulations (prohibiting complete operation, or
specific content). All such events have negative impact on in-theatre viewership, however, certainly have not
eliminated it completely and are not likely to 100% over the long-run (in decades to come). Despite this, in-
theatre viewership is very unlikely to reach levels of 1990s or earlier due to the above threats.
PEER BENCHMARKING
iivSource: Company filings, team analysis
The company lags similarly positioned peers in terms of operating margin, even when considering all EBITDA
adjustments employed by management. While AMC charges the highest average ticket price and benefits from
~16% greater concession spend per customer, its operating margins suggest that the company may have
significant cost cutting opportunities.
Benchmarking against publically traded peers
Screens(July 2020)
10,697 5,974 9,500 1,110
2019 Traffic 356k 280k 275k –
Employees 39k 22k 30k –
2019 Revenue $5,471m $3,283m $4,370m $557m
2019 Adj. EBITDA margin
14.1% 22.7% 23.6% n.a.
U.S. Sales % total 73.5% 79.0% 73.0% 100.0%
Admissions revenue % total
60.3% 55.0% 58.0% 51.0%
Concessions revenue % total
31.4% 35.4% 28.0% 41.5%
Average Ticket Price $9.43 $6.46 – –
Concession revenue per patron
$4.82 ~$4.15 – –

AMC Entertainment Holdings
Turnaround Plan
13
vSource: Company filings
KEY COMPETITORS’ RESPONSE TO COVID-19
CINEMARK9
After five consecutive years of record revenues and with a strong balance sheet, Cinemark, the 3rd
largest motion
picture exhibitor in the US and one of the largest in the world, was better placed to handle COVID-19 because,
led by its highly experience management team, it had been proactive in maintaining low leverage levels. As of
December 31, 2019, Cinemark had 554 theatres with 6,132 screens. With 202 theatres and 1,457 screens in
South and Latin America, it was a leading cinema operator in the region (with the highest market share in Brazil
and Argentina). It boasted the highest average attendance per screen among leading exhibitors in North America
and had invested in converting 60% of its seating in the US to recliners. The company acted quickly to cut costs
and bolster liquidity, as well as approached reopenings with caution.
Operational changes
Other than the usual (well-packaged) COVID-19 health and safety measures, Cinemark implemented the
following:
In mid-March 2020, Cinemark closed all its theatres and in 2Q20, it permanently shut down 21 theatres
(primarily discount-run theatres), resulting in over $10M of annual benefit to EBITDA and cash flow. Also, in
mid-June, in order to assess safety protocols and reopening efficiencies, Cinemark reopened 5 theatres in a
9 Unless otherwise specified, Cinemark’s presentations, filings and earnings calls
74%
27%
2019 Revenue mix
100%
79%
21%
73%
27%
Rest of WorldU.S.
60%
31%
8%
Geogrpahy Segment
51%42%
8%
55%35%
10%
58%28%
14%
OtherBox office Concessions

AMC Entertainment Holdings
Turnaround Plan
14
test-and-learn phase, followed by another 10 in July. Applying learnings from this phase, further theatres were
opened in August and September. Openings were far more staggered and cautious than they were for AMC.
A key innovation was the introduction of the Private Watch Party concept, launched by Cinemark in July 2020.
By October 31, watch parties had become hugely popular, contributing 17% of $14.9M US revenues in 3Q20
and were slated to contribute 20% of revenues in 4Q20. This initiative inspired AMC to introduce private
theatre rentals in November of the same year.
After finally hinting at specific negotiations during the November 3 conference call, on November 16,
Cinemark and Universal announced a deal, whereas if a film grosses more than $50M in the US during its
first weekend, it will be shown in theatres exclusively for 5 weekends, and otherwise - for 3 weekends. After
this period, it may be available on PVOD for a revenue share with Cinemark.10
This deal is better for
Cinemark than the AMC-Universal one would have been, because the segregation of windows based on
opening weekends would ensure Cinemax gets a larger revenue share from bigger films. More recently in
2020 Cinemark was reported collaborating with Netflix to test providing a short exclusivity window to Netflix11
.
Cinemark exhibited an ability to right-size operations and staffing as required, and indicated that Cinemark
could operate profitably at occupancy levels of ~10%.
Cinemark laid off ~17,500 hourly theatre employees, but kept skeletal staff available for a ramp-up.
As of April 13, Cinemark had closed all offices, furloughed 50% of headquarter employees to a salary of 20%,
and reduced salaries of all other employees by 50%. Its directors and the CEO elected to take no salary, and
many executives voluntarily reduced their salaries by 80% while Cinemark’s theatres were closed. By August
4, the company had affected a permanent reduction in headcount.
Cinemark negotiated with landlords to modify, or defer rent payments, and was open to the idea of not
renewing some leases.
It halted all non-essential operating and capital expenditures and lowered 2020 capex estimate from $300M to
$100M, with $34M in Q1-20 and $12M in Q2-20.
Cinemark implemented a formal daily review and approval process for all outgoing procurement and payment
requests.
Financial measures
On March 25, Cinemark drew $98.8M under its revolver. As of March 31, Cinemark had a cash balance of
$480M including the drawdown on the revolver. On April 20, Cinemark announced a private offering of $250M
8.750% senior secured notes due 2025 at par by its subsidiary, Cinemark USA. It also obtained a waiver for
the senior secured leverage covenants (4.25x) under its revolving credit facility agreement for 3Q-20 and 4Q-
20. In addition, on August 21, it completed an offering of $460M 4.50% convertible senior notes due 2025,
with a conversion price of $14.35 per share (i.e. at a premium of 30% over the then share price). It also
suspended dividend payments, resulting in quarterly savings of $42M. The terms of the revolving credit facility
were further amended to extend the waiver of the leverage covenant through September 30, 2021 and relax
the EBITDA calculation for testing the covenant going forward. Flush with cash by 3Q-20, Cinemark repaid its
revolver balance.
10
Giblom, K, Universal, Cinemark Agree to Change the Way Movies Are Released. Available at: https://www.bloomberg.com/news/articles/2020-11-16/universal-cinemark-agree-to-change-the-way-movies-are-released 11
D’Alessandro, A, Cinemark & Netflix Testing ’Christmas Chronicles 2’ As Town Ponders Whether Big Circults Will Book Rival Streamers’ Pics Post-’WW84’/HBO Max Deal. Available at: https://deadline.com/2020/11/wonder-woman-1984-netflix-cinemark-christmas-chornicles-2-hbo-max-1234618909/

AMC Entertainment Holdings
Turnaround Plan
15
These efforts ensured that Cinemark’s liquidity has not dipped below $480M this year. It ended 3Q20 with an
anticipated liquidity runway till 4Q21 to 1Q22 and is in a good position to lead any industry consolidation in 2021.
CINEWORLD12
Cineworld is the 2nd
largest cinema chain in the world, with 787 theatres as of March 12 and operations primarily
under the Regal and Cineworld names in the US, UK, Ireland, Poland, Czech Republic, Slovakia, Hungary,
Romania Bulgaria and Israel. It claimed to be the only cinema chain with adjusted EBITDA of over $1B EBITDA in
2019 and had been on an aggressive refurbishment drive in 2019. Perhaps because going into the crisis
Cineworld was even more leveraged than AMC was (primarily because of its acquisition of Regal for $3.6B and
entry into the US in 201713
), it has had a particularly rough ride:
At the beginning of the year, it expected capex spend over 2020-2022 to be $500-800M for refurbishment of
theatres. However, these plans had to be put on hold
In December 2019, Cineworld announced a proposed acquisition of Cineplex, Canada’s largest cinema chain,
for $2.3B. However, citing breaches by Cineplex, it backed out of the deal in June 2020
In mid-March, Cineworld closed all its theatres and furloughed the bulk of its employees. It gradually began
reopening theatres in June in all territories except Israel
As of June 2020, Cineworld had obtained a $110.8M incremental revolving credit facility and a $250M private
loan and had negotiated covenant waivers on debt for June 2020 and higher covenant threshold for
December 2020
However, Cineworld was swiftly running out of cash and by October, it announced the closure of all theatres
globally.14
Finally, in November, it obtained a $450M loan, extended maturity on its $111M incremental
revolving debt facility from December 2020 to May 2024 and obtained certain bank covenant waivers until
June 2022.15
These measures, along with an anticipated early tax refund of $200m, enhanced Cineworld’s
liquidity by ~$750M.16
Based on monthly cash burn of $60M, Cineworld would be able to survive deep into
2021
12
Unless otherwise specified, Cineworld’s presentations, filings and earnings calls 13
Ahmed, M and Martin K, Cineworld clinches $3.6bn reverse takeover of Regal. Available at: https://www.ft.com/content/6cadfe02-d995-11e7-a039-c64b1c09b482 14
Kirka, D and Bahr, L, Hundreds of Regal, Cineworld movie theaters to close. Available at: https://apnews.com/article/virus-outbreak-archive-15b02bbef2949f6c61fbc8f1cab8cbce 15
Sweney, M, Cineworld secures £560m cash lifelines as Covid closes cinemas. Available at: https://www.theguardian.com/business/2020/nov/23/cineworld-cash-covid-cinemas-660-movie-theatres-us-uk 16
Id.

AMC Entertainment Holdings
Turnaround Plan
16
NEAR-TERM CATALYSTS
The pandemic delayed a number of highly anticipated films planned for 2020 release – including the No Time To
Die (final James Bond installment to feature Daniel Craig), Suicide Squad 2, and The Boss Baby 217
– all of which
are slated to premier in 2021. While some titles may draw significant crowds, we note that of the 74 movies listed
below, 10 are expected to be released simultaneously on HBO Max, likely dampening theatre attendance.
viSource: RottenTomatoes
17
We note these titles not for insight into the anticipated box office sales, but solely to express the sophisticated pallet for fine cinema.
Q1 Q4Q3Q2
2021 Movie Release Schedule
The Last Duel Raya and the Last Dragon
F9 Godzilla vs. Kong Minions Deep Water Dune Mission
Peter Rabbit 2 Masters of the Universe
No Time To Die Spiral Top Gun The Hitman's Wife's Bodyguard
Uncharted West Side Story
355 Tom and Jerry Vivo Cruella Shang-Chi and the Legend …
Candyman Halloween Kills The Matrix 4
Rugrats Jackass 4 BIOS Sesame Street Space Jam 2 The Beatles Snake Eyes Hotel Transylvania 4
Cinderella The King's Man A Quiet Place Part II Micronauts The Suicide Squad Death on the Nile Untitled Elvis Film Sing 2
Nomadland The Many Saints of Newark
Last Night in Soho The Conjuring Eternals Sherlock Holmes 3
The Father Morbius Ron's Gone Wrong In the Heights Untitled Spider-Man Sequel
Babylon
Untitled M Night Shyamalan Project
Untitled Paranormal Activity Movie
Black Widow Luca Fantastic Beasts and Where to Find Them
Ghostbusters Tomb Raider 2 Free Guy
Coming 2 America The Boss Baby
Mortal Kombat The SpongeBob Movie Stillwater Wicked Blazing Samurai Pinocchio The French Dispatch The French Dispatch
Escape Room 2 Black Adam The Power of the Dog Antlers
+ TBD Schedule
Simultaneuous release on HBO Max

AMC Entertainment Holdings
Turnaround Plan
17
4. SITUATION OVERVIEW
COVID-19 PANDEMIC
Business Impact
While the pandemic affected traffic uniformly across all movie theatres, AMC suffered a more significant hit to
profitability due to its operating leverage.
vSource: Company filings
Company Response18
Heading into the crisis
In its financial statements for 4Q19, FY19, and the corresponding earnings call on February 27, 2020, AMC stated
that though the US box office attendance and revenue declined in 2019, AMC had seen a smaller decline in
attendance and a slight increase in revenue globally. It was bullish on international operations and indicated that it
would focus capex on theatres in Europe and the Middle East in 2020. However, AMC generated $771M of
Adjusted EBITDA (14.1% margin) in 2019, and ended a debt burden of $4,911M at the end of the year. The firm
concluded 2019 with total liquidity of $597M (including $322M of revolver availability), 1,004 theatres and an
average operating screen count of 10,656.
Before the COVID-19 struck, AMC had been working on cost reduction and margin improvement. A $50M profit
improvement plan to optimize operations and cost structures was initiated in 2019. This plan had yielded a 150
bps EBITDA margin improvement for 4Q19, and margins were expected to improve further in 2020. Additionally,
as a result of AMC’s renovation drive in recent years, capex was anticipated to be $110-135M lower in 2020
compared to 2019. AMC further indicated that EBITDA growth and decline in capex would naturally reduce
18
Unless otherwise specified, AMC’s presentations and filings and earnings calls
17
7
143
136
180
13
7
13
9
61
46
48
AMCEntertainment
Cinemark Cineworld **
Traffic (mm)
1H'19 2H'19 1H'20
2,70
7
1,67
3
2,15
1
2,76
5
1,61
1
2,21
9
960
54
4
712
AMCEntertainment
Cinemark Cineworld **
Revenue ($mm)
1H'19 2H'19 1H'20
Operational leverage amplified disruptions caused by the pandemic
346 39
7
759
42
6
348
274
(337
)
(51)
53
AMCEntertainment
Cinemark Cineworld **
EBITDA ($mm)
1H'19 2H'19 1H'20

AMC Entertainment Holdings
Turnaround Plan
18
leverage. A reduction in senior executive cash compensation by 15% (in exchange for out-of-the-money share
grants indicating executives’ faith in the business) was also envisaged.
On the COVID-19, AMC’s executives were cautious but optimistic – they stated that AMC did not have any
exposure anywhere in Asia, nor in Iran, and has 47 theatres in Italy, of which 22 were closed for a week. They
also mentioned that AMC did not have any business interruption insurance for COVID-19.
On February 27, 2020, AMC announced a cash dividend payable in March 2020, and an intention of increasing
shareholder return through a $200M stock repurchase program over 3 years.
By March 17, 2020, AMC had closed all its theatres globally.
Initial attempts to enhance liquidity
On March 24, 2020, AMC announced that it had drawn down all availability under its $225M senior secured
revolving credit facility due April 22, 2024 (“RCF 1”), and £100M revolving credit facility secured by assets of the
Odeon subsidiary (“RCF 2”). This improved its cash balance by $215M under RCF 1 and £89.2M under RCF 2.
Clearly the impact of COVID-19 had prompted this action.
In an attempt to further bolster its liquidity, on April 17, 2020, AMC issued a press release announcing the
commencement of a private offering of $500M 10.5% first lien guaranteed notes due 2025 (“New Notes”). In
disclosures regarding the New Notes, it highlighted that as of March 31, 2020, AMC had a cash balance of
$299.8M. The disclosures mentioned that AMC was taking all actions to reduce its cash burn and did not expect
to continue making dividend repayments or make stock repurchases recently authorized. It also mentioned that
under the terms of RCF 1, it was required to maintain a “secured leverage ratio” of 6x and under RCF 2 a
leverage ratio of 3x. It was in negotiations with lenders to waive these covenants for quarters ending June 30,
2020 onwards for RCF 1 and September 30, 2020 onwards for RCF 2. The closing of the New Notes offering
would be contingent on these waivers being obtained.
On April 24, 2020, AMC disclosed that the New Notes had been issued and it had obtained a waiver of the above
covenant under RCF 1 until March 31, 2021 or (at the election of AMC) earlier. Under the terms of the waiver,
AMC was required to maintain “liquidity” of at least $50M. It also obtained a similar waiver under RCF 2, except
without the condition regarding liquidity.
An exchange offer and 1Q20 results
On June 3, 2020, the company disclosed that it had commenced private offers to exchange (“Exchange Offers”)
its outstanding £500M 6.375% senior subordinated notes due 2024, $600M 5.75% senior subordinated notes due
2025, $595M 5.875% senior subordinated notes due 2026, $475M 6.125% senior subordinated notes due 2027
(collectively “Original Subordinated Notes”) for newly issued 10% cash/12% PIK second lien subordinated
secured notes due 2026 (“Exchange Notes”). It also sought from the Original Subordinated Noteholders waivers
of certain restrictive covenants and the release of certain subsidiary guarantees. It also noted that as of April 30,
2020, it had a cash balance of $718.3M.
In its financial statements for 1Q20 released on June 6, 2020, AMC disclosed an adjusted EBITDA of $2.8M,
adjusted FCF of $(220M) and a net loss of $2,176M (including $1,852M of non-cash impairment charges because
of theatre closures). As on March 31, 2020, it had 996 theatres with an average operating screen count of 8,873.
In the corresponding earnings call on June 9, 2020, the extent of impact of COVID-19 on AMC was revealed. To
manage the cash burn, AMC had in recent months:
Effected full or partial furloughs of all corporate-level company employees, including senior executives with
salary reductions from 20%-100%, and cancellation of most benefits. AMC also fully furloughed domestic
theatre-level crew members and reduced theatre-level management to the minimum levels necessary to

AMC Entertainment Holdings
Turnaround Plan
19
maintain reopening capabilities. Nearly all contractor roles were also cut, as were all nonessential operating
expenditures. A total of around 35,000 people had been furloughed
Been working with landlords to defer or abate the vast majority of rent due during the period theatres were
shut. AMC had managed to defer some rent payments, reduce rent for some properties going forward or
convert rent from fixed price to a % of revenue for some locations. It was trying to extend rent repayment till at
least the end of 2021. The management indicated that for some locations which had lease expirations coming
up, AMC could look at feasibility and not renew
Reduced capex to minimum maintenance level. Total capex for the year expected to be $130-160M (down
from $400M in 2019 and $600M in 2018) of which $80M was incurred in January and February when most
theatres were operational
Through drawing RCF 1 and RCF 2 and issuing the New Notes, grown its cash balance to $718M as of April
30, 2020
Initiated a debt exchange offer for exchange of existing senior subordinated debt due 2024 to 2027 for second
lien secured notes due in 2026
A plan to shed, or defer almost 90% of ongoing cash expenditures was in place. Despite these measures, the
cash burn was about $800M over 8 months, i.e., just south of $100M/month including debt servicing costs of
~$24M/month.
It was also in this period that AMC had declared that it would not show any Universal-produced films. This was
later revealed to be a move to gain leverage to enter into a beneficial deal with Universal.
New money and the Universal deal
On July 10, 2020, AMC announced that, it had entered into a transaction support agreement with certain Original
Subordinated Noteholders holding more than 73% of the principal amount of the Original Subordinated Notes
(“AHG”). The AHG committed to offer to tender the Original Subordinated Notes held by them and backstop
Exchange Notes with a 10%/12% cash/PIK toggle, and to provide $200M new money in the form of 10.5% first
lien secured notes due 2026 (“New Money Notes”) and would receive certain backstop commitment fees in the
form of cash, common shares and an arranger discount. In addition, Silver Lake, the holder of existing $600M
2.95% senior convertible notes due 2024 (“Convertible Notes”) had committed to purchase an additional $100M
of notes on terms identical to the New Money Notes (“New Money Notes 2”) at a purchase price of 90% of
principal less an arranger discount.
In a perhaps hasty disclosure on July 23, 2020, AMC announced that it planned to reopen its US movie theatres
in mid to late August. Further, on July 31, 2020, AMC announced the completion of the transactions under the
Exchange Offer. $1.46B of Exchange Notes were issued and ~72-99% of Original Subordinated Noteholders had
tendered the Original Subordinated Notes held by them in the Exchange Offer. It also announced that the PIK
interest component of the Exchange Notes would apply for 18 months at the option of AMC, and then cash
interest would apply. The disclosure also revealed that the New Money Notes and the New Money Notes 2 had
been issued and that the terms of the Convertible Notes had been amended to extend their maturity to 2026.
In its financial statements for 2Q20 released on August 6, 2020, AMC disclosed an adjusted EBITDA of
$(340.3M), adjusted FCF of $(244.3M) and a net loss of $561.2M. As on June 30, 2020, it had 978 theatres with
an average operating screen count of 60(!). On the impact of COVID-19, the management revealed that:
Total cash burn for 2Q-20 was $292M (~$100M/month) and AMC had $498M of cash as of June 30, 2020
Because of the Exchange Offer, $555M of debt had been eliminated and the maturity of $1.7B of debt had
been deferred to 2026, as was the maturity of the Convertible Notes. The terms of the Convertible Notes had
also been amended to introduce a PIK interest option, resulting in a cash interest reduction of $120-180M

AMC Entertainment Holdings
Turnaround Plan
20
over the subsequent 4-6 quarter. Also, through the issuance of New Money Notes 1 and 2, AMC’s liquidity
runway had been extended through early 2021
AMC had managed to agree to rent deferral or abatement for ~75% of leases, and overall rent had been
lowered permanently by at least $35M 2021 onwards. Deferment was typically for ~24 months
AMC’s earlier capex guidance stood, and staff headcount at its corporate headquarters had been
permanently reduced by a third
AMC’s theatres would be better off being open if AMC could reach occupancy levels 25% of 2019 levels
The landmark agreement between Universal and AMC was also discussed. Under the terms of the agreement,
AMC would provide Universal a shortened theatrical exclusivity window of at least 3 weekends (17 days; when
~80% of theatre revenues are booked on an average). After the expiry of the window, Universal could make its
films available on premium video-on-demand (PVOD) platforms, and AMC would receive a share of each film’s
PVOD revenue stream for Universal, irrespective of the platform on which it was made available. Films could not
be retailed on PVOD for <$20. As per the management, this was an indication that studios recognized the
necessity of theatrical releases. AMC claimed to have succeeded in being included in the economics of all film
viewing, whether on couch or in theatres, as well as being protected from the cannibalism of streaming. AMC
expected the PVOD deal economics to be positive. AMC made similar offers to all other studio partners.
Nearing the endgame
It was in August that AMC and its major shareholders began getting desperate to raise cash. As of August 31,
2020, its cash balance had declined to $507.9M. On this date, AMC announced a sale of 9 theatres in Latvia,
Lithuania and Estonia for $77M, implying a price of 9.3x pre-COVID anticipated EBITDA. In September, AMC
announced an exchange of the Convertible Notes into $600M 2.95% convertible senior secured notes due 2026
(“Convertible First Lien Notes”). The Convertible First Lien Notes were stated as being convertible at a new
price of $13.51, which would give noteholders 30% of AMC’s common stock. Further, an intention to sell up to
15M common stock (announced in September) and an additional 15M common stock (October) through at-the-
market offerings was disclosed.
In its financial statements for 3Q20 released on November 2, 2020, AMC disclosed an adjusted EBITDA of
$(334.5M), adjusted FCF of $(372.4M) and a net loss of $905.8M. As on September 30, 2020, it had 958 theatres
with an average operating screen count of 4,022. In the corresponding earnings call, in the midst of quotes from
Churchill invoking people to action during WWII, management revealed that:
Domestic attendance was 97% below 3Q19 levels and international attendance was 82% below 3Q19 levels.
With ~90% US theatres open by November 2, 2020, attendance levels were 10-20% of 2019 levels. Yet, AMC
was continuing to expand in the Middle East. Had AMC jumped the gun on opening theatres? The
management argued that they were keeping their operating model flexible and were saving costs by reducing
show times per day, and that keeping theatres operational is also useful because it is much more expensive
to reopen theatres after a dead stop
Cash as of September 30, 2020 was $418M; total cash burn for 3Q20 was $324M and average monthly cash
burn had increased to $108M due to costs associated with theatre reopenings and increased rent payments.
For 4Q-20, cash burn could be 5-10% higher than the $115M seen in July and August, as additional rental
expenses would be incurred due to reopenings
In addition to the sale of theatres in the Baltic, AMC had sold some real estate for $7M. Also, it cumulatively
raised $97.7M through at-the-money offerings of common stock. Also, it explained the reducing theatre count
by stating that AMC had not renewed about 40 loss-making theatre leases in Europe and the US. The
management also mentioned that it was willing to button down capex to the lowest conceivable number
(~$100M a year potentially), until AMC is out of the woods

AMC Entertainment Holdings
Turnaround Plan
21
AMC’s liquidity runway would last through the beginning of 2021, even in a worst-case scenario (surprisingly,
the management kept stating that the current scenario is the worst case). The management clearly signaled
an intent (and desperate need) to raise cash to be able to extend the runway deep into 2021. Raising money
was also essential because AMC’s debt covenant holiday was only till March 2021
Deals with studios for AMC deferring payments to them were being negotiated
Perhaps exhibiting misplaced optimism, AMC management also waxed eloquent about a soon to be launched
private theatre rental program where consumers could book auditoria for between $99 and $349 + tax
Desperate times call for desperate measures?
On November 10, 2020, AMC revealed its intent to sell up to 20M common stock through an at-the-market
offering. Finally, on December 10, 2020, AMC announced that it had entered into a commitment letter with
Mudrick Capital Management (“Mudrick”) to issue $100M of new 15%/17% cash/PIK toggle first lien secured
notes due 2026. Interest could be paid in PIK for the first 18 months at the option of AMC. Mudrick would receive
a commitment fee in ~8.2M common stock and would exchange the Exchange Notes held by it into ~13.7M
common stock.
The disclosure in relation to this issuance clearly illustrates the panic AMC’s management is in and it has realized
that it is quickly running out of options:
As on December 10, 2020, AMC had cash of ~$320M and an incurred a monthly cash burn of $125M for
October and November 2020. Commencing 2021, it expected cash rent expense to increase significantly
because of $400M of rent obligations deferred until 2021 and beyond, and this would seriously hamper
liquidity.
AMC emphasized that it expects to run out of cash in January 2021 and would need at least $750M additional
liquidity to remain viable through 2021. It also stated that if attendance levels do not increase to 20% of pre-
COVID levels in the first half of 2021 and 85% of pre-COVID levels in the second half of 2021, the liquidity
shortfall would be greater than $750M.
AMC it intends to pursue an at-the-market program that includes up to ~178M shares. As of December 10,
2020, it had raised $155.2M through the sale of 50M shares.
AMC is specifically looking for additional financing particularly for its European operations and has been
otherwise actively engaged with creditors. It expects holders of its second lien debt will be particularly
sympathetic to its cause because of the priority first lien debt enjoys in case of bankruptcy.
It remains to be seen whether there will be any appetite for another $750M of AMC stocks and bonds, and
whether it can even be leveraged further. It is worth noting that the New Notes are currently trading at 67c (please
refer to the Appendix for a chart illustrating how AMC’s bonds have traded over the past year), and the most
recently proposed issuance is at an absurd interest rate of 15%/17%. AMC will clearly need to pay an
astronomical rate on any subsequent debt issuance and should AMC issue equity, the existing shareholders will
not take too kindly to being further diluted.

AMC Entertainment Holdings
Turnaround Plan
22
viiiSource: CapitalIQ
Chronology of Key Events
1 February 27: Cash dividend and share buyback scheme announced on earnings call
2 April 24: Issuance of $500M notes and waivers under RCFs obtained
3 May 11: Rumors that Amazon may be in talks to buy AMC`
4 June 15: Warner Bros. pushes back Tenet release
5August 6: Earnings call paints a rosy picture – agreement with Universal and recent successes in paring down debt and extending maturities discussed
6 August 31: Sale of theatres in the Baltic announced
7October 20: Announcement of proposed sale of 15 million common stock; disclosure emphasizes urgent need for liquidity
8 November 9: Pfizer and BioNTech announce COVID-19 vaccine shows >90% efficacy in interim analysis
9December 2: Warner Bros. announces intent to make 2021 releases available on HBO Max the same day they release in theatres
10 December 10: Desperation for $750M liquidity to extend cash runway beyond January 2021 revealed

AMC Entertainment Holdings
Turnaround Plan
23
CAPITAL STRUCTURE
iviSource: Company filings
Amount
Interest Maturity Outstanding
1L Secured Debt
Senior Secured Credit Facility-Term Loan due 2026 4.080% 2026 1,970$
Senior Secured Credit Facility-Revolving Credit Facility Due 2024 2.700% 2024 213
Odeon Revolving Credit Facility Due 2022 2.579% 2022 88
Odeon Revolving Credit Facility Due 2022 2.600% 2022 25
10.5% First Lien Notes due 2025 10.500% 2025 500
2.95% Senior Secured Convertible Notes due 2026 2.950% 2026 600
10.5% First Lien Notes due 2026 10.500% 2026 300
2L Secured Debt
10%/12%/Cash/PIK/Toggle Second Lien Subordinated Notes due 2026 12.000% 2026 1,462
Subordinated Debt:
6.375% Senior Subordinated Notes due 2024 (£4.0 million par value) 6.375% 2024 5
5.75% Senior Subordinated Notes due 2025 5.750% 2025 98
5.875% Senior Subordinated Notes due 2026 5.875% 2026 56
6.125% Senior Subordinated Notes due 2027 6.125% 2027 131
Total Funded Debt 5,448$
Finance lease obligations 95
Paid-in-kind interest for PIK/Toggle 2L Notes due 2026 30
Deferred financing costs (44)
Net premium (discount) (1) 390
Total Corporate Borrowings 5,919$
Current maturities of corporate borrowings (20)
Current maturities of finance lease obligations (11)
Long-Term Obligations 5,888$
Less: Total Cash (429)
Net Debt 5,459$
Capital Structure (as of 9/30/2020)
Liquidity and runway (as of 9/30/2020)Cash (excl. Resticted Cash) 418$
Revolver Availability -
Total Liquidity 418$
Estimated Monthly Cash Burn 125$
Estimated runway (months) 3.3
Runway through: Between Dec-20 and Jan-21

AMC Entertainment Holdings
Turnaround Plan
24
LEASES AND RENT EXPENSE
AMC pays a significantly greater rent expense per theatre compared to its peers. This is driven in part by lower
screens per theatre, and geographical presence in higher-cost markets.
xSource: Company filings, team analysis
We suspect AMC’s exposure to higher cost markets has a net negative impact on the Company’s margins. While
it may increase average ticket prices, the cost of rent appears to overwhelm any perceived benefits. For example,
AMC has 29 theatres in the state of New York, approximately 15 of which are in the NYC area. Cinemark only has
a single theatre in New York, and generally has a greater footprint in lower-cost areas. Illustratively, Cinemark has
29 theatres in Ohio (approximately 5% of its total US theatres), compared to AMC’s 16 in the state (representing
2.5% of US total). While we do not recommend exit from high-cost markets, we believe AMC has room to improve
its pricing and value-add offerings to support healthy long-term margins.
Rent expense and theatre utilization
FY2018 FY2019
Leased Rent Cost/ Est. Cost/ Leased Rent Cost/ Cost/
Sites Exp. (mm) Site (k) Screen Sites Exp. (mm) Site (k) Site (k)
AMC Entertainment 881 787.8$ 894.2$ 81.1$ 875 967.8$ 1,106.1$ 100.6$
Cinemark 503 323.3$ 642.8$ 58.0$ 511 346.1$ 677.3$ 61.2$
FY2018 FY2019
Total Total Screens/ Total Total Screens/
Sites Screens Site Sites Screens Site
AMC Entertainment 1,006 11,091 11.02 1,004 11,041 11.00
Cinemark 546 6,048 11.08 554 6,132 11.07
Cineworld 790 9,518 12.05 787 9,500 12.07
As of 3Q20 COVID-10 Response
Total Total Screens/ # Closed % Closed
Sites Screens Site Sites Screens Sites Screens
AMC Entertainment 958 10,697 11.17 46 344 4.6% 3.1%
Cinemark 533 5,974 11.21 21 158 3.8% 2.6%
Cineworld 778 9,391 12.07 9 109 1.1% 1.1%
Lower Screens / TheaterHigher Avg. Rent / Theatre Lower Margins+ =
AMC Entertainment Holdings
Turnaround Plan
25
xiSource: Company filings
OWNERSHIP STRUCTURE AND CREDITOR RELATIONS
With Wanda controlling a significant amount of AMC’s equity stock, and controlling meaningful voting power, the
Group may have significant interest in backing AMC throughout its turnaround. However, given Wanda’s
exposure to other markets impacted by COVID-19 pandemic (notably hospitality, entertainment, and sports), we
anticipate the Group has limited ability to divert resources from other operations to support AMC.
Similarly, Silver Lake has meaningful voting rights and the structure of its investment incentivizes a longer-term
view for the direction of AMC. While the recently announced transaction faces scrutiny from other creditors, Silver
Lake’s willingness to extend the maturity on its Convertible Notes and participate in the New Money Notes and
New Money Notes 2 is a sign that the sponsor is willing to provide flexibility, while AMC undertakes an operational
turnaround.
2019 U.S. Footprint: AMC vs CNK (# of sites)
Mountain
AMC CNK
42 47
East South Central
AMC CNK
46 13
Pacific
AMC CNK
71 79
New England
AMC CNK
16 18
West South Central
AMC CNK
77 101
South Atlantic
AMC CNK
136 30
Middle Atlantic
AMC CNK
86 12
East North Central
AMC CNK
115 45
West North Central
AMC CNK
47 8

AMC Entertainment Holdings
Turnaround Plan
26
5. TURNAROUND PROPOSAL
STRATEGIC RECOMMENDATIONS
Although the company needs to address immediate operational concerns, we believe it is also important for AMC
to rethink its strategic direction for the long term. Beyond outlining clear goals, this will assist in evaluating which
tactical steps the company needs to undertake in the short term. We outline four strategic pillars to guide the
company’s direction over the next two to ten years.
Real-asset-light strategy and balance sheet realignment: this starts with the vision for the initial balance sheet
rationalization, followed by asset focus realignment, and feeds into operational recommendations of selling
underperforming theatres and cutting SG&A, with some being redeployed to performing operations. For example,
certain competitors such as Cinemark are already doing this in 2020. Without a mindset shift towards the long-
term growth, AMC is at the risk of losing its status as the industry leader.
More broadly, of the 15 countries where AMC currently operates, the company is the clear leader in eight markets
– the U.S., Finland, Italy, Latvia, Lithuania, Norway, Spain, and Sweden. A deeper assessment of AMC’s
differentiation and competitive advantage in these markets should be conducted, with asset rationalization, where
necessary. In remaining markets, including the Kingdom of Saudi Arabia, which company entered in 2018, AMC
needs to be even more conservative with physical presence. For example, in 2018, management communicated
intention to open up to 100 theatres in Saudi Arabia over the proceeding decade. While we expect the company’s
international footprint to grow, management must be thoughtful in deciding the balance between in-theatre and
VOD releases, under which the company can benefit from revenue and marketing cost-sharing agreements with
key producers.
Content creation: this is an extremely competitive space and the outlined “glut” of quality content referenced in
the SWOT analysis holds. Therefore, given that AMC’s original focus was on the marketing and distribution side,
we recommend the company pursue the content creation strategy from two sides:
Focus on 1-3 key projects per season: From the funnels of ideas, concentrate on 1-3 top ones that are
highly likely to generate the expected outcome in terms of viewership and desire to view the content both in
theatres and online.
Key partnerships: With the Paramount Consent Decrees under review by the US DOJ, largely driven the
COVID-19’s impact on film-related industries, and with content co-creation not in violation of any of the five
tenets of the Decrees, as long as AMC complies on the distribution side, there is a window for the Company
to find key partnerships both in the US and overseas.
Historically, AMC has partnered on revenue sharing and theatrical window terms with big studios. However, with
digitization and content “democratization,” there is a growing opportunity to partner with diverse content creators
and actors. Another big driver behind the focus on content is that if the quality is not there (and we have seen
several years recently and in the past, when this occurs), by extension people will not be interested in going and
seeing this anywhere (whether digitally, or in theatres).
Furthermore, as an American company with deep roots in the US, AMC will continue to focus on its home market,
and yet with multi-billion audiences globally, the Company will increasingly focus on content partnerships
overseas as well. At this point, AMC management and BOD would require in-depth feasibility and market studies
from different market angles, which will be agglomerated over the next 6 months to drive the decision-making in
terms of the type of content and partnerships to pursue.

AMC Entertainment Holdings
Turnaround Plan
27
Greater focus on digital: The world is changing rapidly, customer and industry secular trends cannot be ignored,
and so AMC will walk with times. This means that the firm’s digital portfolio of offerings (incorporated through
pillars #1-2 above) will continue to grow.
Additionally, due to the COVID-19, some digital movie releases such as Disney’s new Mulan, skipped the
theatrical window, albeit only in the US and Canada, with mixed offerings outside of North America. While in-
theatre offerings are crucial for both producers and distributors of content and while they will not fade away in any
foreseeable future, we believe the in-theatre experience needs to demonstrate clear value add to attract and
engage the audience. A good example are drive-in theatres, which saw a precipitous decline over decades,
although never went away in some traditional markets like the US and, in fact, saw a renewed interest from
customers during the COVID-19. Some of the proposals, focusing on digital, revolve around greater collaboration
with content creators on VODs, as well as greater use of technology to deliver an immersive experience for the
viewers.
Revive AMC Brand: in three core steps of repurpose spaces, “bring back smiles”, and have customer want more.
In line with AMC’s mission statement – “We make smiles happen” – the firm is off to the next stage of AMC’s
journey in bringing back smiles, especially as the COVID-19 vaccine progress brings medical and psychological
help to so many citizens of the world.
First, in the states and jurisdictions where theatres have reopened (despite reduced capacity, which the Company
does not see as a major problem, given that average pre-pandemic auditorium fill rates were ~17%19
), we
recommmend AMC to begin piloting newer and health-safe viewing formats. For instance, some auditoriums may
be reformatted for smaller spaces (with health safety measures in place) to provide for a more personal
experience and viewership, targeting private parties who can lock-in special rates for such viewings. Additionally,
we anticipate newer seating equipment, allowing for motion feedback to enhance the viewing experience.
Second, we recommend a redesign of certain AMC sites to provide more experiential offerings to meet consumer
demands. The relative and absolute historical ticket sales have been on a gradual decline since early 2000s.20
While tickets make up the bulk of revenues, operators are getting more attractive gross margins from concession
sales (~80% contribution from concessions) vs ~50% from ticket sales. This has 2 implications for AMC, as well
as for the broader industry: (i) current in-theatre experience (even pre-COVID-19) is not as cherished as it was
pre-2000s, and (ii) concessions are an important part of the business.
Currently patrons visit the ticket booth, purchase some snacks, and either wait, or head to AMC’s auditoriums. We
suggest a redesigned experience to be engaging pre-movie and memorable during after the theatre visit.
We anticipate individual facilities to feature unique designs and offerings to encourage customers to visit a variety
of theatres in their region. Greater deployment of self-service stations for maps, movie times, and other
information, will help reduce staff load, leading to improved operating margins.
Concession partnerships should be re-evaluated. The traditional offerings of popcorn or sodas will still be in place,
but the menu should evolve to include healthier options to match evolving tastes. Our Operational
Recommendations sub-section and the attached AMC Model file include figures on the estimated capex and
operating expenses involved with such changes. As it relates to dining, our smaller auditoriums will also
experiment with robots delivering, picking up meals, and interacting with customers, while they watch movies (of
which they will have an option to select at their seat’s convenience).
19
AMC CEO Adam Aron, October 2020 interview with CNBC 20
National Association of Theatre Owners

AMC Entertainment Holdings
Turnaround Plan
28
Lastly, locally-exclusive content can support the brand’s engagement with the communities in which it operates.
We anticipate these to be lower budget films, but will help improve fill rates during off-peak times and support
concession sales.
In summary, the above strategic pillars form our conception of AMC’s future and, to that extent, of the whole
industry. AMC has a proud history of innovation with customer experience design, whether it was with multi- or
megaplexes, or special promotions and offerings available to AMC’s members. With these four pillars in
execution, AMC will be building on this strong legacy and revolutionizing what it means to visit its theatres.
OPERATIONAL RECOMMENDATIONS
The Strategic Recommendations above provide an overall informed direction of AMC. However, it is through the
Operational and Financial Recommendations on a daily basis that the firm ends up implementing these. This sub-
section covers Operational Recommendations, generally broken down into 2 categories - Short-term (within the
next 12mo) and Long-term (1 year+). More specifically:
Short-term Operational Recommendations (within the next 12 months):
So far, AMC has turned to capital markets activities and reducing operating expenses by headcount reductions to
maximize liquidity. Revenues have declined by ~70% YoY, 2020YTD, driven by a mix of government-imposed
shutdowns and voluntary culling from customers. As the pandemic continues, causing short-term topline-driven
liquidity crunches, AMC should explore the following short-term tactics to maximize cash flows in the short-run.
COVID-19 Operational Measures:
Leverage Global Experience and Data to Demonstrate Leadership of Safety Protocols. In addition to its
current efforts of coordinating with government entities globally to open/close locations, AMC should identify
best practices in the 15 countries they currently operate in, apply them in all of their facilities for the safety of
both customers and employees, and actively communicate these measures to restore confidence. AMC’s
group insurance policy for full-time employees and contractual obligations for contractor employees will be
fulfilled for treatment and recovery.
Prevention Equipment and Supplies. AMC should commit an additional ~$6.6MM in 2021 (figures based
on RFQ prices already negotiated with suppliers, including bulk discounts) on COVID-19 prevention
equipment and supplies. The commitment would secure temperature checking stands (~$0.5MM), safety
masks (~USD 3MM) for both employees and patrons, and gloves and disinfectant supplies (~USD 3.1MM).
Real-time Vacancy Updates to Customers. While government-imposed shutdowns and capacity restrictions
cannot be controlled, voluntary culling from customers may be better managed. The latter is driven mainly by
safety considerations, the most representative of which is social distancing. In addition to its current
communication of maximum capacity, AMC could provide real-time vacancy / occupancy metrics to potential
customers through its existing ticketing platform and AMC Stubs (loyalty program) mobile application.
Tracking and communicating real-time occupancy figures provide two main benefits: first, it communicates
AMC’s commitment to tracking and implementing social distancing measures, and second, allows customers
to choose optimal times to make their visits at their perceived lowest-rick time slots.
Dynamic Pricing Options. In addition to communication of occupancy, AMC can offer dynamic pricing
options to encourage moviegoers during low-occupancy timeslots. By focusing on AMC loyalty program
subscribers through its mobile application and digital communication, discount offers could be provided in
addition to the loyalty discounts already available. Furthermore, AMC could extend dynamic pricing benefits to
those referred by loyalty program members (additional points / benefits to accrue to members). Such offers
should be extended to private bookings (cinema rentals) in addition to single box office sales. Please note
that AMC currently has 22.5 million families subscribed to its loyalty program in the U.S. alone. Loyalty

AMC Entertainment Holdings
Turnaround Plan
29
program members constitute ~45% of all US AMC cinema attendees and have generated 2.2x revenues vs.
non-members historically.
Select Balance Sheet Rationalization. AMC currently operates 900+ cinemas globally, of which 50+ are
owned. AMC and its secured creditors should contemplate monetizing at least a portion of its assets through
clean sales, or sale and leaseback structures, after evaluating the profitability and potential value of each
asset. We expect substantial value to be embedded in these assets, judging by the fact that 52% of the entire
US population resides within a 10mile radius of its properties. Although secured creditors likely have access
to these assets, we are of the view that AMC’s value as a going-concern, and ultimately, as a cinema
operator (not a real estate owner) is greater than its liquidation value. The risk of further liquidity challenges
and subsequent value destruction may outweigh the loss of security (effectively, in exchange for liquidity) for
creditors.
Long-term Operational Recommendations (1 year and beyond):
Partly financial and partly operational, AMC will be reducing the DSO, by both accelerating A/R collections
and partly delaying (to the extent possible, as to avoid penalties) the A/P. A bigger change, of course, would
be the needed increase in operating cash flows from the growth in the underlying net revenue. This, in turn,
fundamentally depends on AMC’s effective and consistent execution of the 4 pillars outlined in the Strategic
Recommendations. The outcomes of such execution AMC can post in the upcoming quarterly filings and
MD&As.
Further streamline the balance sheet to achieve initial rationalization, with subsequent realignment towards a
balanced in-theatre, VOD, and content creation revenues. In 3Q'19, AMC launched AMC Theatres On-
Demand, a service, where AMC loyalty members can rent, or buy movies on demand. The above %
estimates may increase in certain geographies, depending on the gradual successes of initial changes.
Based on our Base Case analysis (please refer to Appendices and the “AMC Financial Model.xlsx”), AMC will
need to fund its recent quarterly and annual loses with more debt (in the short term, as equity financing is not
likely realistic, partly due to NYSE: AMC price tanking and partly due to the threat of significant dilution of existing
shareholders (including Wanda Group majority shareholder), driven by the need of several billion of financing vs
potential ~2-8B implied TEV. Therefore, we would fund the net losses with ~USD 2.5B debt financing (please
refer to financing recommendations for further details), which will support our operations over the coming years.
FINANCIAL RECOMMENDATIONS AND RESTRUCTURING OPTIONS
Liquidation: Based on the analysis below, we believe that AMC has greater potential as a going concern
compared to the realizable liquidation value of its assets (please refer to Section #6 below for details).
Out-of-court restructuring: Despite the recent efforts, we anticipate the company will require further
amendments to its capital structure in the near term. We considered out-of-court options, including the debt-for-
equity exchange, new equity offering to bolster liquidity, interest forbearance, covenant holidays, and maturity
extensions. While credit markets remain open (in part due to the support from the Fed), we believe AMC would
have limited success achieving meaningful deleveraging in the open market. Furthermore, as evidenced by the
Liquidation Analysis, the low estimated recovery %s for, mainly, the top secured creditor (in the low-recovery
scenario), will likely force AMC and capital providers to move to an in-court solution.
Court-supervised restructuring (Chapter 11): The Chapter 11 process would enable the company to not only
affect a meaningful debt reduction, but also reevaluate its lease agreements and other long-term contracts, as
well as consider labor and vendor relations. Based on our analysis of debt capacity and despite higher costs of in-
court solution (as referenced earlier), we believe a Chapter 11 bankruptcy would be required to achieve desired
levels of leverage and position AMC for long-term growth, as well as to find equitable solution among diverse
secured and unsecured creditors.
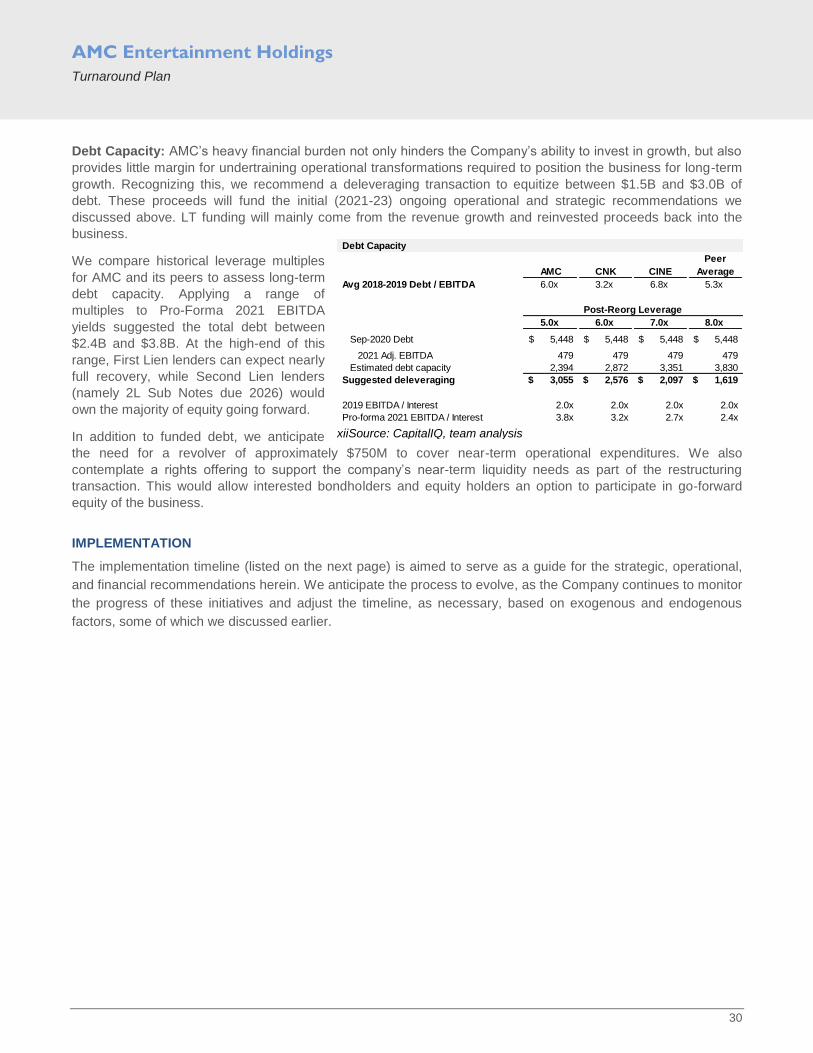
AMC Entertainment Holdings
Turnaround Plan
30
xiiSource: CapitalIQ, team analysis
Debt Capacity: AMC’s heavy financial burden not only hinders the Company’s ability to invest in growth, but also
provides little margin for undertraining operational transformations required to position the business for long-term
growth. Recognizing this, we recommend a deleveraging transaction to equitize between $1.5B and $3.0B of
debt. These proceeds will fund the initial (2021-23) ongoing operational and strategic recommendations we
discussed above. LT funding will mainly come from the revenue growth and reinvested proceeds back into the
business.
We compare historical leverage multiples
for AMC and its peers to assess long-term
debt capacity. Applying a range of
multiples to Pro-Forma 2021 EBITDA
yields suggested the total debt between
$2.4B and $3.8B. At the high-end of this
range, First Lien lenders can expect nearly
full recovery, while Second Lien lenders
(namely 2L Sub Notes due 2026) would
own the majority of equity going forward.
In addition to funded debt, we anticipate
the need for a revolver of approximately $750M to cover near-term operational expenditures. We also
contemplate a rights offering to support the company’s near-term liquidity needs as part of the restructuring
transaction. This would allow interested bondholders and equity holders an option to participate in go-forward
equity of the business.
IMPLEMENTATION
The implementation timeline (listed on the next page) is aimed to serve as a guide for the strategic, operational,
and financial recommendations herein. We anticipate the process to evolve, as the Company continues to monitor
the progress of these initiatives and adjust the timeline, as necessary, based on exogenous and endogenous
factors, some of which we discussed earlier.
Debt Capacity
Peer
AMC CNK CINE Average
Avg 2018-2019 Debt / EBITDA 6.0x 3.2x 6.8x 5.3x
Post-Reorg Leverage
5.0x 6.0x 7.0x 8.0x
Sep-2020 Debt 5,448$ 5,448$ 5,448$ 5,448$
2021 Adj. EBITDA 479 479 479 479
Estimated debt capacity 2,394 2,872 3,351 3,830
Suggested deleveraging 3,055$ 2,576$ 2,097$ 1,619$
2019 EBITDA / Interest 2.0x 2.0x 2.0x 2.0x
Pro-forma 2021 EBITDA / Interest 3.8x 3.2x 2.7x 2.4x

AMC Entertainment Holdings
Turnaround Plan
31
xiiiSource:Team analysis
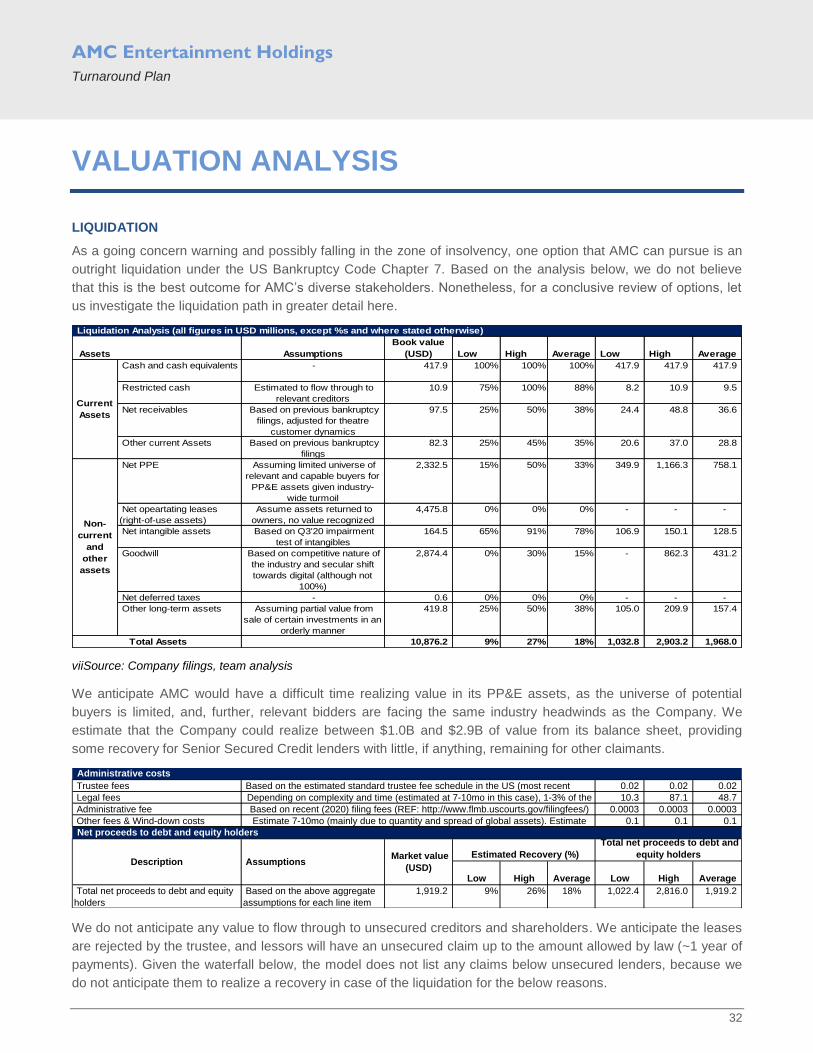
AMC Entertainment Holdings
Turnaround Plan
32
VALUATION ANALYSIS
LIQUIDATION
As a going concern warning and possibly falling in the zone of insolvency, one option that AMC can pursue is an
outright liquidation under the US Bankruptcy Code Chapter 7. Based on the analysis below, we do not believe
that this is the best outcome for AMC’s diverse stakeholders. Nonetheless, for a conclusive review of options, let
us investigate the liquidation path in greater detail here.
viiSource: Company filings, team analysis
We anticipate AMC would have a difficult time realizing value in its PP&E assets, as the universe of potential
buyers is limited, and, further, relevant bidders are facing the same industry headwinds as the Company. We
estimate that the Company could realize between $1.0B and $2.9B of value from its balance sheet, providing
some recovery for Senior Secured Credit lenders with little, if anything, remaining for other claimants.
We do not anticipate any value to flow through to unsecured creditors and shareholders. We anticipate the leases
are rejected by the trustee, and lessors will have an unsecured claim up to the amount allowed by law (~1 year of
payments). Given the waterfall below, the model does not list any claims below unsecured lenders, because we
do not anticipate them to realize a recovery in case of the liquidation for the below reasons.
Liquidation Analysis (all figures in USD millions, except %s and where stated otherwise)
Assets Assumptions
Book value
(USD) Low High Average Low High Average
Cash and cash equivalents - 417.9 100% 100% 100% 417.9 417.9 417.9
Restricted cash Estimated to flow through to
relevant creditors
10.9 75% 100% 88% 8.2 10.9 9.5
Net receivables Based on previous bankruptcy
filings, adjusted for theatre
customer dynamics
97.5 25% 50% 38% 24.4 48.8 36.6
Other current Assets Based on previous bankruptcy
filings
82.3 25% 45% 35% 20.6 37.0 28.8
Net PPE Assuming limited universe of
relevant and capable buyers for
PP&E assets given industry-
wide turmoil
2,332.5 15% 50% 33% 349.9 1,166.3 758.1
Net opeartating leases
(right-of-use assets)
Assume assets returned to
owners, no value recognized
4,475.8 0% 0% 0% - - -
Net intangible assets Based on Q3'20 impairment
test of intangibles
164.5 65% 91% 78% 106.9 150.1 128.5
Goodwill Based on competitive nature of
the industry and secular shift
towards digital (although not
100%)
2,874.4 0% 30% 15% - 862.3 431.2
Net deferred taxes - 0.6 0% 0% 0% - - -
Other long-term assets Assuming partial value from
sale of certain investments in an
orderly manner
419.8 25% 50% 38% 105.0 209.9 157.4
10,876.2 9% 27% 18% 1,032.8 2,903.2 1,968.0 Total Assets
Current
Assets
Non-
current
and
other
assets
Administrative costs
0.02 0.02 0.02
10.3 87.1 48.7
0.0003 0.0003 0.0003
0.1 0.1 0.1
Net proceeds to debt and equity holders
Low High Average Low High Average
Based on the above aggregate
assumptions for each line item
1,919.2 9% 26% 18% 1,022.4 2,816.0 1,919.2
Total net proceeds to debt and
equity holders Assumptions
Market value
(USD)
Estimated Recovery (%)
Total net proceeds to debt and equity
holders
Description
Trustee fees
Legal fees
Administrative fee
Other fees & Wind-down costs
Based on the estimated standard trustee fee schedule in the US (most recent
Depending on complexity and time (estimated at 7-10mo in this case), 1-3% of the
Based on recent (2020) filing fees (REF: http://www.flmb.uscourts.gov/filingfees/)
Estimate 7-10mo (mainly due to quantity and spread of global assets). Estimate

AMC Entertainment Holdings
Turnaround Plan
33
Benefits of Liquidation
Relatively prompt method for senior creditors to recognize cash recovery;
Limit the amount of pressure for management, trying to turn around the Company.
Drawbacks of Liquidation
Overall, high costs of bankruptcy, especially since AMC has plenty of potential to turn around, despite a going
concern and zone of insolvency signs;
AMC is one of the current leaders in the industry with plenty of “ammunition” in the form of assets and
talented employees. A liquidation would mean an abrupt exit of one of the leaders and failure of its leadership
to turn around a multi-decade successful business, despite industry challenges;
Compared with other restructuring solutions discussed herein, AMC’s stakeholders will be receiving
significantly lower recoveries under the liquidation.
Takeaways: On balance, AMC’s leadership, employees, and diverse stakeholders stand a much better outcome
with either the out-of-court (if possible and as we discussed earlier), or in-court reorganization (less preferred, yet
necessary, such as in this case with creditors), comprised of operational, financial, and strategic
recommendations, all of which we discussed earlier.
Liquidation Waterfall
Secured lenders
Low High Average Low High Average
N/A in case of liquidation - - - - - - -
1,970$ 52% 100% 97% 1,022$ 1,970$ 1,919$
213 0% 100% 0% - 213 -
88 0% 100% 0% - 88 -
25 0% 100% 0% - 25 -
500 0% 100% 0% - 500 -
600 0% 3% 0% - 20 -
300 0% 0% 0% - - -
1,462 0% 0% 0% - - -
5 0% 100% 50% - - -
98 0% 100% 50% - - -
56 0% 100% 50% - - -
131 0% 100% 50% - - -
0.6 0% 100% 50% - - -
0.5 0% 100% 100% - - -
Estimated Recovery (%)
Total net proceeds to debt
and equity holders
Class A common
Class B common
Equity holders
Each class liquidation proceeds
based on the liquidation priority
Each class liquidation proceeds
based on the liquidation priority
Each class liquidation proceeds
based on the liquidation priority
Unsecured lenders
Net proceeds to 6.375% Senior
Subordinated Notes due 2024 (£4.0
million par value)
Net proceeds to 5.75% Senior
Subordinated Notes due 2025
Net proceeds to 5.875% Senior
Subordinated Notes due 2026
Net proceeds to 6.125% Senior
Subordinated Notes due 2027
Net proceeds to Odeon Revolving
Credit Facility Due 2022, 2.5786%
Net proceeds to Odeon Revolving
Credit Facility Due 2022, 2.6%
Net proceeds to 10.5% First Lien
Notes due 2025
Net proceeds to 2.95% Senior
Secured Convertible Notes due 2026
Net proceeds to 10.5% First Lien
Notes due 2026
Net proceeds to
10%/12%/Cash/PIK/Toggle Second
Net proceeds to DIP financiers
Net proceeds to Senior Secured Credit
Facility-Term Loan due 2026
Net proceeds to Senior Secured Credit
Facility-Revolving Credit Facility Due
Description Assumptions Claim

AMC Entertainment Holdings
Turnaround Plan
34
GOING-CONCERN VALUATION
Our going-concern valuation incorporates operational initiatives discussed in Section 5 (Turnaround Proposal).
The Base Case assumes ~16 months recovery of in-theatre attendance and incremental margin improvements,
and yields an implied Total Enterprise Value (TEV) of $8.2B. Upside Case similarly assumes a ~16-month
recovery, yet models a quicker ramp based on highly-anticipated 2021 movie releases; it also incorporates more
aggressive margin improvements, assuming the ability to execute on all of the proposed operational initiatives,
resulting in TEV of $15B.
The valuation methodology is an average of two DCF outputs – one with Terminal Value based on Terminal
UFCF Growth rate, and the other - based on a Terminal TEV/EBITDA Multiple. The Terminal Rate is based on
long-term industry forecasts, while the multiple is based on historical trading multiple for the company and its
peers pre-COVID-19 pandemic.
viiiSource: Company filings, Capital IQ, team analysis
Valuation Summary
WACC Build-up
Cost of Debt 5.3% Debt / Equity
Cost of Equity 30.8% Equity Market Cap (as of 9/30/20) 507
Risk-free Rate 5Y Treasury) 0.3% Book Value of Debt 5,448
Beta 2.620 Total Capitalization 5,956
Unlevered Beta 0.289
Levered Beta 4.111 WACC 7.5%
Equity Risk Premium 5.0%
Distress Premium 10.0%
Market Book Value Tax Unlevered
Comparable Betas Beta Cap of Debt Rate Beta
Cinemark 2.61 1,167 3,910 25.0% 0.74
Cineworld 3.30 560 6,231 19.0% 0.33
AMC 0.29
Avg. 0.45
Valuation
Tax Rate 25.0%
WACC 7.5% Terminal TEV / EBITDA Multiple 7.0x
Terminal Growth Rate 3.0% Implied terminal growth rate 5.7%
PV of Forecasted UFCF 2,655 PV of Forecasted UFCF 2,655
Terminal Value (perp growth) 1,251 Terminal Value based on mult 13,584
PV of Terminal Value 938 PV of Terminal Value 10,188
Implied TEV 3,593 Implied TEV 12,843
Downside Base Upside
Case Case Case
Average Implied TEV 2,061$ 8,218$ 15,174$

AMC Entertainment Holdings
Turnaround Plan
35
RECOVERY WATERFALL
Our long-term valuation suggests that the Company has the capacity to generate attractive returns for its
investors. While our proposal addresses the urgent liquidity situation, we believe that lenders who are comfortable
to ride out the trough will reap significant rewards once attendance rebounds. Based on our Base Case valuation
of $8.2B and exit leverage of 7.0x 2021 EBITDA, we expect that 2L lenders would receive a significant portion of
the go-forward equity. Further, our recommendation is only marginally dilutive to the equity holders. Unlike many
restructurings, which wipe out virtually all value from shareholders, this proposal would only dilute the equity
holders to 40-50% of their ownership stake, while positioning the company for long-term growth. Given where the
equity trades today (as of 12/2020) – and, more importantly, the negative equity value implied by bond prices –
under our proposal, existing shareholders would receive significant ownership in a well-positioned company.
ixSource: team analysis
Chapter 11 Recovery Waterfall
Recovery Scenario ($mm) Recovery Scenario (%)
Claim Downside Base Upside Downside Base Upside
1L lenders 3,696 1,014 3,696 3,696 27.4% 100.0% 100.0%
2L lenders 1,462 - 1,462 1,462 - 100.0% 100.0%
Subordinated Bondholders 290 - 290 290 - 100.0% 100.0%
Unsecured Creditors 1,047 1,047 1,047 1,047 100.0% 100.0% 100.0%
Residual Value for Equity - 1,723 8,679
Takeback Debt Based on Leverage Pro-forma Equity Ownership
at Exit & Base Case Valuation Based on Exit Leverage
6.0x 7.0x 8.0x 6.0x 7.0x 8.0x
1L lenders 2,872 3,351 3,696 19.2% 9.0% -
2L lenders - - 133 34.0% 38.3% 39.8%
Subordinated Bondholders - - - 6.7% 7.6% 8.7%
Unsecured Creditors - - - - - -
New Debt 1,047 1,047 1,047 - - -
Existing Equity Holders 40.1% 45.1% 51.6%
Note: Assumes cash recovery for Unsecured creditors, to be financed with new debt

AMC Entertainment Holdings
Turnaround Plan
36
6. CONCLUSION
SUMMARY OF RECOMMENDATION
As we went through various facets of AMC’s competition, customers, internal performance, conducted the SWOT
and longer-term ratio analyses, in the process we have developed a series of strategic, operational, and financial
recommendations. All three feed and build on each other, which is very important. The Strategic
Recommendations are comprised of the 4 self-reinforcing pillars, which were developed based operational and
financial analyses, to then be applied back into the operational and financial implementation. Operational
Recommendations focused on short- and long-term initiatives, so have Financial Recommendations, with slightly
greater focus on short-to-medium term (through 2024).
Striving towards operational excellence: As we note a number of short-term cost-containment initiatives, our
core recommendation in this regard is to leverage AMC’s leading market position in order to position the
Company for the long-term sustainable profitability. Our top-line initiatives include leveraging nostalgic themes, as
they reemerge into popular culture and implementing real-time dynamic pricing to improve fill rates. We also
recommend expanding the dining options to improve concession spend, improving revenue per patron.
Deleveraging: While an out-of-court restructuring is preferred, in terms of both saving on advisor fees and
avoiding potential damage to customer and vendor relations, we anticipate the recommended debt reduction will
not be received favorably by lenders due to the earlier-referenced reasons. While creditors may be willing to
amend and extend current debt obligations, we believe that the immediate reduction in cash interest payments
will free up cash flow and enable AMC to invest in immediate operational improvements through 2024, as well as
undertake longer-term investments for sustainable future growth and ability to reinvest later retained earnings
back into the business.
SHORT-TERM OUTCOMES
In the immediate term, we recommend the company focus on cash preservation, while putting in place operational
initiatives for a strong post-pandemic comeback. The proposed debt reduction through a Chapter 11 process will
enable the company to emerge well-capitalized and prepared to address the rebound in demand for high-quality
cinema experience.
LONG-TERM PERSPECTIVE
Our proposal aims to position the company to take advantage of emerging industry trends and evolving consumer
preferences. The strategic initiatives are meant to align the Company’s offerings with demand, from healthier
concession options to deepening operating communities’ engagement through regional content.
MONITORING PROGRESS
We recommend that AMC institute formal monitoring not only of the key financial metrics, but also for all the
operational initiatives it undertakes. Instead of speculation on the optimal path forward, we advise that the
Company apply all the Recommendations, use the Implementation timeline as a guide, closely monitor the
progress, and adjust, when applies in each specific market. This will enable AMC to rapidly adapt, shift focus,
and/or double down on initiatives, which illustrate most promising results.
With respect to accountability, we further recommend strengthening the relation between management
compensation and shareholder value creation. We believe implementing target metrics for profitability and return
on invested capital will align incentives and help focus management on the long-term benefit of the Company.

AMC Entertainment Holdings
Turnaround Plan
37
REFERENCES
1. Cover Photo: “AMC Dine-In Theater, Disney Springs” by Michael Rivera CC BY 4.0
2. AMC’s public website, presentations, and filings
3. IBIS World, Movie Theaters in the US Industry Report, 2020
4. Motion Pictures Association, THEME Report 2019. < https://www.motionpictures.org/wp-
content/uploads/2020/03/MPA-THEME-2019.pdf>
5. Marcus Corp, Investor Reports
6. National Association of Theatre Owners, as of 1 July 2020 (includes US and Canada screens only)
7. Hall, S and Pasquini, S, “Can there be a fairy-tale ending for Hollywood after COVID-19?”
<https://www.weforum.org/agenda/2020/07/impact-coronavirus-covid-19-hollywood-global-film-industry-
movie-theatres>
8. Cinemark’s public presentations, filings, and earnings calls
9. Giblom, K, Universal, “Cinemark Agree to Change the Way Movies Are Released”.
<https://www.bloomberg.com/news/articles/2020-11-16/universal-cinemark-agree-to-change-the-way-
movies-are-released>
10. D’Alessandro, A, Cinemark & Netflix Testing ’Christmas Chronicles 2’ As Town Ponders Whether Big
Circults Will Book Rival Streamers’ Pics Post-’WW84’/HBO Max Deal.
<https://deadline.com/2020/11/wonder-woman-1984-netflix-cinemark-christmas-chornicles-2-hbo-max-
1234618909/>
11. Cineworld’s public presentations, filings, and earnings calls
12. Ahmed, M and Martin K, Cineworld clinches $3.6bn reverse takeover of Regal.
<https://www.ft.com/content/6cadfe02-d995-11e7-a039-c64b1c09b482>
13. Kirka, D and Bahr, L, Hundreds of Regal, Cineworld movie theaters to close.
<https://apnews.com/article/virus-outbreak-archive-15b02bbef2949f6c61fbc8f1cab8cbce>
14. Sweney, M, Cineworld secures £560m cash lifelines as Covid closes cinemas.
<https://www.theguardian.com/business/2020/nov/23/cineworld-cash-covid-cinemas-660-movie-theatres-
us-uk>
15. AMC CEO Adam Aron, October 2020 interview with CNBC
16. National Association of Theatre Owners
17. The remaining list of references is sited throughout the report.

AMC Entertainment Holdings
Turnaround Plan
38
APPENDIX
YEARLY FINANCIAL STATEMENTS: BASE CASE
Income Statement Dec-18 Dec-19 Dec-20 Dec-21 Dec-22 Dec-23 Dec-24
Revenues
Food and Beverage 1,672 1,720 359 873 1,627 1,718 1,814
Admissions 3,385 3,301 722 1,888 3,503 3,630 3,757
Other Theatre 404 450 175 550 728 756 785
Total revenues 5,461 5,471 1,256 3,311 5,858 6,104 6,356
Operating costs and expenses
Operating Expenses (1,655) (1,687) (753) (909) (1,248) (1,308) (1,371)
Food and Beverage Cost (271) (279) (77) (142) (260) (275) (290)
Film Exhibition Costs (1,710) (1,699) (343) (944) (1,751) (1,815) (1,879)
Rent (798) (968) (880) (720) (679) (698) (718)
Others (179) (153) (118) (137) (158) (164) (171)
Merger, Acquisition and Other Costs (31) (16) (3) - - - -
Depreciation and Amortization (538) (450) (489) (724) (586) (610) (636)
Impairment of Long-lived Assets (14) (84) (2,048) - - - -
Operating Costs (5,196) (5,335) (4,711) (3,577) (4,683) (4,871) (5,064)
Opearing Income 265 136 (3,455)$ (265) 1,175 1,233 1,291
Total Interest Expense (342) (341) (369) (268) (223) (223) (223)
Net Total Other Income (Expense) 201 33 (175) 2,932 - - -
Total Other Income (Expense) (141) (308) (544) 2,663 (223) (223) (223)
EBT 124 (172) (4,000)$ 2,398 952 1,010 1,068
Provision for Income Tax (14) 23 39 133 (238) (252) (267)
Net Income (Loss) 110 (149) (3,961)$ 2,532 714 757 801
EBITDA Reconciliation Dec-18 Dec-19 Dec-20 Dec-21 Dec-22 Dec-23 Dec-24
2. Calculated EBITDA
Opearting Income 265$ 136$ (3,455)$ (265)$ 1,175$ 1,233$ 1,291$
Depreciation and amortization 538 450 489 724 586 610 636
Impairment of long-lived assets, indefinite-lived intangible assets and goodwill14 84 2,048 - - - -
Merger, acquisition and other costs 31 16 3 - - - -
Stock-based compensation expense 15 4 12 20 12 13 14
Adj. EBITDA 863 690 (903) 479 1,773 1,856 1,941

AMC Entertainment Holdings
Turnaround Plan
39
Balance Sheet - Restated Dec-18 Dec-19 Dec-20 Dec-21 Dec-22 Dec-23 Dec-24
Current Assets
Cash and Cash Equivalents 313 265 31 0 350 1,147 1,989
Receivables 260 254 106 186 224 233 242
Restricted Cash 11 11 11 11 11 11 11
Other Current Assets 198 143 88 124 149 155 162
Total Current Assets 781 673 236 321 734 1,546 2,404
Non Current Assets
Operating Right of Use Asset, Net - 4,796 4,594 4,744 4,744 4,744 4,744
Property-net 3,040 2,649 2,234 1,946 1,946 1,946 1,946
Deferred Tax Asset-net 29 70 - - - - -
Goodwill 4,789 4,789 2,874 2,874 2,874 2,874 2,874
Intangible Assets, Net 352 195 165 165 165 165 165
Other Long-term Assets 506 503 441 434 522 543 566
Total Assets 9,496 13,676 10,544 10,485 10,985 11,818 12,699
Current Liabilities
Accounts Payable 453 543 324 411 476 495 515
Accrued Expenses and Other Liabilities 379 325 249 359 416 433 450
Current Maturities of Debt and Lease Obligations82 616 567 442 420 420 420
Deferred Revenue and Income 415 449 441 310 373 388 404
Total Current Liabilities 1,328 1,933 1,581 1,523 1,686 1,736 1,789
Non Current Liabilities
Corporate Borrowing 4,708 4,733 5,804 3,311 2,872 2,872 2,872
Lease obligations 493 5,003 4,994 4,994 4,994 4,994 4,994
Exhibitor Services Agreement 564 550 542 542 542 542 542
Other Long-term Liabilities 1,005 242 308 248 298 310 323
Total Liabilities 8,098 12,462 13,228 10,618 10,392 10,455 10,520
Shareholders' Equity
Class A common par 0.5 0.5 1 0.5 0.5 0.5 0.5
Class B common Par 0.5 0.5 1 0.6 0.6 0.6 0.6
Additional Paid in Capital 1,998 2,002 2,128 2,147 2,160 2,173 2,187
Treasury Stock - Common (56) (56) (56) (56) (56) (56) (56)
Accumulated Earnings (Deficit) (551) (706) (4,705) (2,173) (1,460) (702) 99
Accumulated Other Comprehensive Income (Loss)6 (26) (52) (52) (52) (52) (52)
Total Shareholders Equity 1,398 1,214 (2,685) (133) 593 1,363 2,178
Total Liabilities & Shareholders Equity 9,496 13,676 10,544 10,485 10,985 11,818 12,699

AMC Entertainment Holdings
Turnaround Plan
40
Cash Flow Statement - Restated Dec-18 Dec-19 Dec-20 Dec-21 Dec-22 Dec-23 Dec-24
Net Income 110$ (149)$ (3,961)$ 2,532$ 714$ 757$ 801$
Depreciation & Amort., Total 538 456 489 724 586 610 636
Change in Working Capital
Decrease (Inc.) in AR 5 148 (80) (37) (9) (10)
Decrease (Inc.) in Other Current Assets 54 55 (36) (25) (6) (6)
Increase (Dec.) in AP 91 (219) 87 65 19 20
Increase (Dec.) in Accrued Exp & Other (54) (75) 110 57 17 17
Increase (Dec.) in Deferred Revenue 34 (9) (130) 62 15 16
Stock-Based Compensation 4 12 20 12 13 14
(Gain) Loss from Sale of Assets (17) (3) - - - -
(Income) Loss on Equity Invest. 3 40 - - - -
Asset Writedown & Restructuring Costs 84 2,048 - - - -
Net Other Operating Activities 67 341 (328) (59) (9) (10)
Cash From Operating Activities 523 579 (1,133) 2,898 1,375 1,407 1,478
Capital Expenditure (576) (530) (181) (437) (586) (610) (636)
Other Investing Activities 259 14 1 - - - -
Cash From Investing (317) (516) (179) (437) (586) (610) (636)
Net Debt Issued (Repaid) 526 0 1,063 (2,492) (439) - -
Issuance (Repurchase) of Common Stock (447) (1) 2 - - - -
Total Dividends Paid (258) (84) (4) - - - -
Other Financing Activities (16) (28) 22 - - - -
Cash From Financing (195) (113) 1,083 (2,492) (439) - -
Foreign Exchange Rate Adj. (6) 2 (3) - - - -
Net Change in Cash 6 (49) (233) (31) 350 797 842

AMC Entertainment Holdings
Turnaround Plan
41
PEER BENCHMARKS
Quarterly Performance Mar-19 Jun-19 Sep-19 Dec-19 Mar-20 Jun-20 Sep-20
Revenue
AMC Entertainment 1,200$ 1,506$ 1,317$ 1,448$ 942$ 19$ 120$
Cinemark 715 958 822 789 535 9 36
Marcus * 115 162 137 143 109 2 7
Cineworld ** 2,151 2,219 712
EBITDA
AMC Entertainment 108$ 238$ 157$ 269$ 3$ (340)$ (335)$
Cinemark 152 245 170 178 66 (118) (128)
Cineworld ** 759 274 53
EBITDA Margins
AMC Entertainment 9.0% 15.8% 11.9% 18.6% 0.3% (1,800.5%) (279.9%)
Cinemark 21.3% 25.6% 20.7% 22.6% 12.4% (1,306.9%) (360.6%)
Cineworld ** 35.3% 12.4% 7.4%
Traffic (000s)
AMC Entertainment 79,825 96,955 87,100 92,563 60,495 100 6,503
Cinemark 62,300 80,200 73,300 63,800 45,800 n.a. 1,900
Cineworld ** 136,000 139,000 47,500
Avg Ticket Price (consolidated)
AMC Entertainment 9.16$ 9.24$ 9.15$ 9.47$ 9.39$ 9.00$ 9.67$
Cinemark 6.35 6.50 6.20 n.a. 6.39 n.a. 7.96
Marcus *
Cineworld **
Concession rev per patron
AMC Entertainment 4.62$ 5.08$ 4.82$ 4.74$ 4.76$ 4.00$ 4.47$
Cinemark 4.03 4.31 3.95 n.a. 4.16 n.a. 4.87
Cineworld **
Notes:
* Marcus data is for reported Theatre Segment only
** Cineworld shown on semi-annual basis, as reported by the company

AMC Entertainment Holdings
Turnaround Plan
42
Long-term performance Dec-15A Dec-16A Dec-17A Dec-18A Dec-19A Dec-20E Dec-21E
Revenue
AMC Entertainment 2,947 3,236 5,079 5,461 5,471 1,261 3,544
Cinemark 2,853 2,919 2,992 3,222 3,283 682 1,924
Cineworld 1,079 1,083 1,147 4,119 4,370 1,080 2,649
Revenue Growth
AMC Entertainment 9.8% 57.0% 7.5% 0.2% (77.0%) 181.0%
Cinemark 2.3% 2.5% 7.7% 1.9% (79.2%) 182.0%
Cineworld 0.3% 6.0% 259.1% 6.1% (75.3%) 145.3%
Adj. EBITDA
AMC Entertainment 536 488 823 929 771 (996) 48
Cinemark 664 706 724 782 745 (289) 195
Cineworld 229 217 255 925 1,033 (86) 805
Adj. EBITDA Margin
AMC Entertainment 18.2% 15.1% 16.2% 17.0% 14.1% (79.0%) 1.3%
Cinemark 23.3% 24.2% 24.2% 24.3% 22.7% (42.3%) 10.1%
Cineworld 21.2% 20.0% 22.3% 22.5% 23.6% (7.9%) 30.4%
Peer average (excl. AMC) 22.2% 22.1% 23.2% 23.4% 23.2% (25.1%) 20.2%
Altman Z-Score
AMC Entertainment 1.25 0.73 0.72 0.68 0.33 n.a. n.a.
AMC Long-term improvement opportunity
Dec-21E Dec-22E Dec-23E Dec-24E
Revenue 2,840 4,860 5,014 5,171
Base case Margin (5.3%) 14.8% 14.3% 13.8%
Estimated Peer Group 10.0% 20.0% 20.0% 20.0%
Base Case EBITDA (150) 718 717 714
Pro-forma EBITDA /Margin improvement 284 972 1,003 1,034
Improvement Potential 434 254 286 320

AMC Entertainment Holdings
Turnaround Plan
43
CASH FLOW AND LIQUIDITY FORECAST
$(188)
$(25)
$(130)
$50
$160
$327 $232 $203
$250
$31
$312 $312
$116
$311
$552
$733
$899
$1,100
$(600)
$(400)
$(200)
$-
$200
$400
$600
$800
$1,000
$1,200
Dec-20 Mar-21 Jun-21 Sep-21 Dec-21 Mar-22 Jun-22 Sep-22 Dec-22
Base Case Post-Reorganization
UFCF Cash Balance Total Liquidity
$(574)
$193
$(200)
$(53)
$20 $111
$47 $52 $70
$(262)
$(416)
$(550) $(600)
$(400)
$(200)
$-
$200
$400
$600
$800
$1,000
$1,200
Dec-20 Mar-21 Jun-21 Sep-21 Dec-21 Mar-22 Jun-22 Sep-22 Dec-22
Status Quo
UFCF Cash Balance Total Liquidity

AMC Entertainment Holdings
Turnaround Plan
44
U.S. MOVIE INDUSTRY AND MARKET SHARE
AMC DEBT PRICES (APRIL 2020 TO DECEMBER 2020)
U.S. Movie Theatres Dec-15 Dec-16 Dec-17 Dec-18 Dec-19 Dec-20 Dec-21 Dec-22 Dec-23 Dec-24
Industry
Revenue 17,112$ 17,743$ 16,827$ 18,082$ 18,473$ 6,915$ 17,088$ 17,674$ 18,377$ 19,044$
Number of Theatres 4,620 4,620 4,603 4,630 4,672 4,451 4,418 4,408 4,414 4,416
Industry growth rates
Revenue 3.7% (5.2%) 7.5% 2.2% (62.6%) 147.1% 3.4% 4.0% 3.6%
Number of Theatres - (0.4%) 0.6% 0.9% (4.7%) (0.7%) (0.2%) 0.1% 0.0%
Top Competitors
Revenue
AMC Entertainment 2,947 3,236 5,079 5,461 5,471 1,256 3,311 5,858 6,104 6,356
Cinemark 2,853 2,919 2,992 3,222 3,283 682 1,924
Cineworld 1,079 1,083 1,147 4,119 4,370 1,080 2,649
Estimated U.S. Revenue
AMC Entertainment 2,167 2,380 3,735 4,013 4,023 924 2,435 4,308 4,489 4,674
Cinemark 2,254 2,306 2,364 2,546 2,594 539 1,520
Cineworld 788 790 837 3,007 3,190 788 1,934
Estimated Market Share
AMC Entertainment 12.7% 13.4% 22.2% 22.2% 21.8% 13.4% 14.3% 24.4% 24.4% 24.5%
Cinemark 13.2% 13.0% 14.0% 14.1% 14.0% 7.8% 8.9%
Cineworld 4.6% 4.5% 5.0% 16.6% 17.3% 11.4% 11.3%