Ambient resonance of Mesa Arch, Canyonlands National Park...
7
Ambient resonance of Mesa Arch, Canyonlands National Park, Utah Alison M. Starr 1 , Jeffrey R. Moore 1 , and Michael S. Thorne 1 1 Department of Geology and Geophysics, University of Utah, Salt Lake City, Utah, USA Abstract We analyzed the resonance characteristics of a prominent natural arch in Canyonlands National Park, Mesa Arch, as measured from ambient seismic data. Evaluating spectral and polarization attributes, we distinguished the first four resonant frequencies of the arch, 2.9, 6.0, 6.9, and 8.5 Hz, as well as basic properties of the associated mode shapes. We then affirmed experimental data using 3-D numerical modal analysis, providing estimates of material properties and clarifying vibrational mode shapes. Monitoring resonant frequencies over time, we searched for shifts associated with changing environmental conditions and long-term progressive damage. We measured ~3% direct daily variation in resonant frequency associated with changing rock temperature, thermal stress, and stiffening of the rock matrix. Independent tilt data showed similar diurnal cycles associated with thermoelastic stresses and deformation of the arch. We observed no permanent resonant frequency shifts related to irreversible damage of Mesa Arch during our study period. 1. Introduction Rock arches are dynamic natural structures that vibrate with measurable resonant frequencies and mode shapes. Vibration characteristics are in turn tied to fundamental material properties, density, and elastic modulus, making ambient vibration monitoring a powerful, noninvasive tool for assessment of changing structural integrity. However, the resonance properties of natural arches have not been previously studied in detail, despite the prevalent use of related structural health monitoring (SHM) techniques in civil enginee- ring [e.g., Carder, 1936; Crawford and Ward, 1964; Sohn et al., 1999]. Central to the idea of SHM is that a change in the deformability of mechanical elements within a system leads to a change in the global vibrational response [Farrar et al., 2001]. Measurements of vibration characteristics over time may thus provide evidence of internal mechanical change, while short- and long-term monitoring can differentiate reversible versus irreversible signals [Clinton et al., 2006]. Application of SHM techniques to natural rock structures is an emerging method in surface processes research. Lévy et al. [2010], for example, showed that the fundamental frequency of an unstable rock column dropped by 24% prior to collapse. They posited that a growing fracture separating the column increased the volume of the body, decreasing the resonant frequency. Superposed reversible fluctuations were attributed to thermal and hydrological effects. Bottelin et al. [2013a, 2013b] analyzed thermal and spectral data at a similar rock column, monitoring daily and seasonal changes in resonant frequency. Frequency shifts were related to thermal expansion and winter ice stiffening the connection between the column and cliff. Meanwhile, Burjanek et al. [2010, 2012] and Moore et al. [2011] used ambient vibration measurements to identify anisotropy, wavefield polarization, and spectral amplification within large unstable rock masses, results with implications for seismic slope stability. We document the resonant frequencies and mode shapes of a prominent rock arch in Canyonlands National Park, Utah, as measured from ambient seismic data. We identify reversible changes in resonant frequencies associated with environmental effects, search for signals of irreversible change linked to internal damage, and ultimately aim to develop new methodology for quantitative evaluation of the changing structural health of natural rock arches. 2. Study Site Mesa Arch is one of the premier attractions of Canyonlands National Park, Utah (Figure 1). The arch measures ~2.5 m thick and ~3 m wide and spans 27 m at the edge of a plateau. On close inspection, Mesa Arch is seen to be part of a large vertical slab of Navajo sandstone partly detached from the plateau edge (Figure 1b). A crack STARR ET AL. RESONANCE OF A ROCK ARCH 1 PUBLICATION S Geophysical Research Letters RESEARCH LETTER 10.1002/2015GL064917 Key Points: • Resonant frequencies of a natural arch deduced from ambient seismic data • Numerical modal analysis used to clarify resonant mode shapes • Diurnal frequency shifts ascribed to thermal stresses Supporting Information: • Figures S1–S5, Movie S1 caption, Data Set S1 description, and Text S1 • Movie S1 • Data Set S1 Correspondence to: J. R. Moore, [email protected] Citation: Starr, A. M., J. R. Moore, and M. S. Thorne (2015), Ambient resonance of Mesa Arch, Canyonlands National Park, Utah, Geophys. Res. Lett., 42, doi:10.1002/ 2015GL064917. Received 11 JUN 2015 Accepted 24 JUL 2015 Accepted article online 5 AUG 2015 ©2015. American Geophysical Union. All Rights Reserved.
Transcript of Ambient resonance of Mesa Arch, Canyonlands National Park...
Ambient resonance of Mesa Arch, CanyonlandsNational Park, UtahAlison M. Starr1, Jeffrey R. Moore1, and Michael S. Thorne1
1Department of Geology and Geophysics, University of Utah, Salt Lake City, Utah, USA
Abstract We analyzed the resonance characteristics of a prominent natural arch in Canyonlands NationalPark, Mesa Arch, as measured from ambient seismic data. Evaluating spectral and polarization attributes, wedistinguished the first four resonant frequencies of the arch, 2.9, 6.0, 6.9, and 8.5Hz, as well as basic properties ofthe associated mode shapes. We then affirmed experimental data using 3-D numerical modal analysis, providingestimates of material properties and clarifying vibrational mode shapes. Monitoring resonant frequencies overtime, we searched for shifts associated with changing environmental conditions and long-term progressivedamage. We measured ~3% direct daily variation in resonant frequency associated with changing rocktemperature, thermal stress, and stiffening of the rock matrix. Independent tilt data showed similar diurnalcycles associatedwith thermoelastic stresses and deformation of the arch. We observed no permanent resonantfrequency shifts related to irreversible damage of Mesa Arch during our study period.
1. Introduction
Rock arches are dynamic natural structures that vibrate with measurable resonant frequencies and modeshapes. Vibration characteristics are in turn tied to fundamental material properties, density, and elasticmodulus, making ambient vibration monitoring a powerful, noninvasive tool for assessment of changingstructural integrity. However, the resonance properties of natural arches have not been previously studiedin detail, despite the prevalent use of related structural health monitoring (SHM) techniques in civil enginee-ring [e.g., Carder, 1936; Crawford andWard, 1964; Sohn et al., 1999]. Central to the idea of SHM is that a changein the deformability of mechanical elements within a system leads to a change in the global vibrationalresponse [Farrar et al., 2001]. Measurements of vibration characteristics over time may thus provide evidenceof internal mechanical change, while short- and long-term monitoring can differentiate reversible versusirreversible signals [Clinton et al., 2006].
Application of SHM techniques to natural rock structures is an emerging method in surface processesresearch. Lévy et al. [2010], for example, showed that the fundamental frequency of an unstable rock columndropped by 24% prior to collapse. They posited that a growing fracture separating the column increased thevolume of the body, decreasing the resonant frequency. Superposed reversible fluctuations were attributedto thermal and hydrological effects. Bottelin et al. [2013a, 2013b] analyzed thermal and spectral data at asimilar rock column, monitoring daily and seasonal changes in resonant frequency. Frequency shifts wererelated to thermal expansion and winter ice stiffening the connection between the column and cliff.Meanwhile, Burjanek et al. [2010, 2012] and Moore et al. [2011] used ambient vibration measurements toidentify anisotropy, wavefield polarization, and spectral amplification within large unstable rock masses,results with implications for seismic slope stability.
We document the resonant frequencies and mode shapes of a prominent rock arch in Canyonlands NationalPark, Utah, as measured from ambient seismic data. We identify reversible changes in resonant frequenciesassociated with environmental effects, search for signals of irreversible change linked to internal damage,and ultimately aim to develop new methodology for quantitative evaluation of the changing structuralhealth of natural rock arches.
2. Study Site
Mesa Arch is one of the premier attractions of Canyonlands National Park, Utah (Figure 1). The arch measures~2.5m thick and ~3m wide and spans 27m at the edge of a plateau. On close inspection, Mesa Arch is seento be part of a large vertical slab of Navajo sandstone partly detached from the plateau edge (Figure 1b). A crack
STARR ET AL. RESONANCE OF A ROCK ARCH 1
PUBLICATIONSGeophysical Research Letters
RESEARCH LETTER10.1002/2015GL064917
Key Points:• Resonant frequencies of a natural archdeduced from ambient seismic data
• Numerical modal analysis used toclarify resonant mode shapes
• Diurnal frequency shifts ascribed tothermal stresses
Supporting Information:• Figures S1–S5, Movie S1 caption, DataSet S1 description, and Text S1
• Movie S1• Data Set S1
Correspondence to:J. R. Moore,[email protected]
Citation:Starr, A. M., J. R. Moore, and M. S. Thorne(2015), Ambient resonance of MesaArch, Canyonlands National Park, Utah,Geophys. Res. Lett., 42, doi:10.1002/2015GL064917.
Received 11 JUN 2015Accepted 24 JUL 2015Accepted article online 5 AUG 2015
©2015. American Geophysical Union.All Rights Reserved.
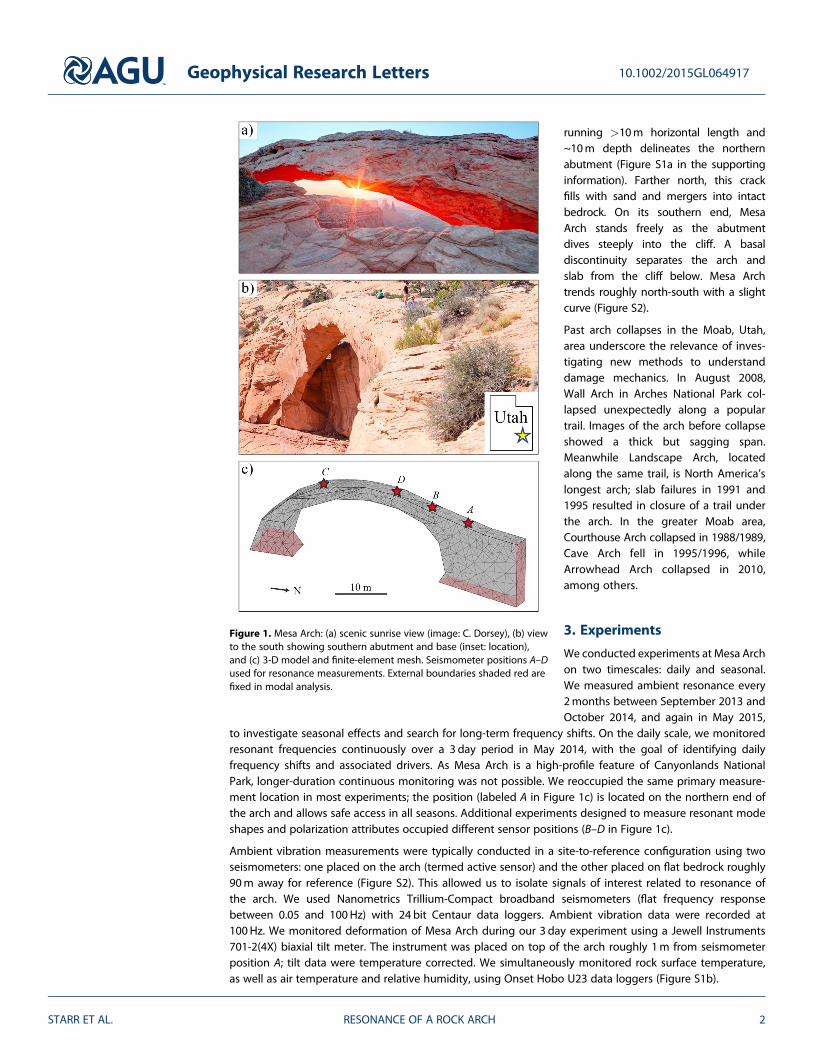
running >10m horizontal length and~10m depth delineates the northernabutment (Figure S1a in the supportinginformation). Farther north, this crackfills with sand and mergers into intactbedrock. On its southern end, MesaArch stands freely as the abutmentdives steeply into the cliff. A basaldiscontinuity separates the arch andslab from the cliff below. Mesa Archtrends roughly north-south with a slightcurve (Figure S2).
Past arch collapses in the Moab, Utah,area underscore the relevance of inves-tigating new methods to understanddamage mechanics. In August 2008,Wall Arch in Arches National Park col-lapsed unexpectedly along a populartrail. Images of the arch before collapseshowed a thick but sagging span.Meanwhile Landscape Arch, locatedalong the same trail, is North America’slongest arch; slab failures in 1991 and1995 resulted in closure of a trail underthe arch. In the greater Moab area,Courthouse Arch collapsed in 1988/1989,Cave Arch fell in 1995/1996, whileArrowhead Arch collapsed in 2010,among others.
3. Experiments
We conducted experiments at Mesa Archon two timescales: daily and seasonal.We measured ambient resonance every2months between September 2013 andOctober 2014, and again in May 2015,
to investigate seasonal effects and search for long-term frequency shifts. On the daily scale, we monitoredresonant frequencies continuously over a 3 day period in May 2014, with the goal of identifying dailyfrequency shifts and associated drivers. As Mesa Arch is a high-profile feature of Canyonlands NationalPark, longer-duration continuous monitoring was not possible. We reoccupied the same primary measure-ment location in most experiments; the position (labeled A in Figure 1c) is located on the northern end ofthe arch and allows safe access in all seasons. Additional experiments designed to measure resonant modeshapes and polarization attributes occupied different sensor positions (B–D in Figure 1c).
Ambient vibration measurements were typically conducted in a site-to-reference configuration using twoseismometers: one placed on the arch (termed active sensor) and the other placed on flat bedrock roughly90m away for reference (Figure S2). This allowed us to isolate signals of interest related to resonance ofthe arch. We used Nanometrics Trillium-Compact broadband seismometers (flat frequency responsebetween 0.05 and 100Hz) with 24 bit Centaur data loggers. Ambient vibration data were recorded at100Hz. We monitored deformation of Mesa Arch during our 3 day experiment using a Jewell Instruments701-2(4X) biaxial tilt meter. The instrument was placed on top of the arch roughly 1m from seismometerposition A; tilt data were temperature corrected. We simultaneously monitored rock surface temperature,as well as air temperature and relative humidity, using Onset Hobo U23 data loggers (Figure S1b).
Figure 1. Mesa Arch: (a) scenic sunrise view (image: C. Dorsey), (b) viewto the south showing southern abutment and base (inset: location),and (c) 3-D model and finite-element mesh. Seismometer positions A–Dused for resonance measurements. External boundaries shaded red arefixed in modal analysis.
Geophysical Research Letters 10.1002/2015GL064917
STARR ET AL. RESONANCE OF A ROCK ARCH 2
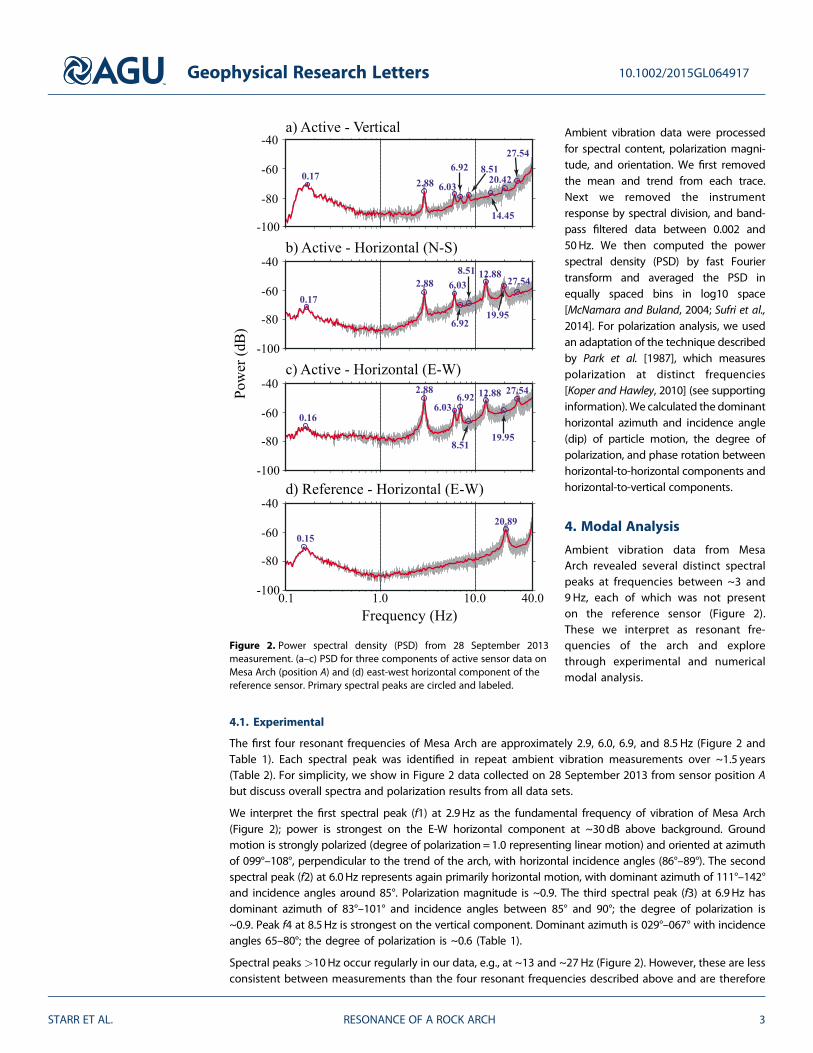
Ambient vibration data were processedfor spectral content, polarization magni-tude, and orientation. We first removedthe mean and trend from each trace.Next we removed the instrumentresponse by spectral division, and band-pass filtered data between 0.002 and50Hz. We then computed the powerspectral density (PSD) by fast Fouriertransform and averaged the PSD inequally spaced bins in log10 space[McNamara and Buland, 2004; Sufri et al.,2014]. For polarization analysis, we usedan adaptation of the technique describedby Park et al. [1987], which measurespolarization at distinct frequencies[Koper and Hawley, 2010] (see supportinginformation). We calculated the dominanthorizontal azimuth and incidence angle(dip) of particle motion, the degree ofpolarization, and phase rotation betweenhorizontal-to-horizontal components andhorizontal-to-vertical components.
4. Modal Analysis
Ambient vibration data from MesaArch revealed several distinct spectralpeaks at frequencies between ~3 and9 Hz, each of which was not presenton the reference sensor (Figure 2).These we interpret as resonant fre-quencies of the arch and explorethrough experimental and numericalmodal analysis.
4.1. Experimental
The first four resonant frequencies of Mesa Arch are approximately 2.9, 6.0, 6.9, and 8.5 Hz (Figure 2 andTable 1). Each spectral peak was identified in repeat ambient vibration measurements over ~1.5 years(Table 2). For simplicity, we show in Figure 2 data collected on 28 September 2013 from sensor position Abut discuss overall spectra and polarization results from all data sets.
We interpret the first spectral peak (f1) at 2.9Hz as the fundamental frequency of vibration of Mesa Arch(Figure 2); power is strongest on the E-W horizontal component at ~30dB above background. Groundmotion is strongly polarized (degree of polarization=1.0 representing linear motion) and oriented at azimuthof 099°–108°, perpendicular to the trend of the arch, with horizontal incidence angles (86°–89°). The secondspectral peak (f2) at 6.0Hz represents again primarily horizontal motion, with dominant azimuth of 111°–142°and incidence angles around 85°. Polarization magnitude is ~0.9. The third spectral peak (f3) at 6.9Hz hasdominant azimuth of 83°–101° and incidence angles between 85° and 90°; the degree of polarization is~0.9. Peak f4 at 8.5Hz is strongest on the vertical component. Dominant azimuth is 029°–067° with incidenceangles 65–80°; the degree of polarization is ~0.6 (Table 1).
Spectral peaks >10Hz occur regularly in our data, e.g., at ~13 and ~27Hz (Figure 2). However, these are lessconsistent between measurements than the four resonant frequencies described above and are therefore
Figure 2. Power spectral density (PSD) from 28 September 2013measurement. (a–c) PSD for three components of active sensor data onMesa Arch (position A) and (d) east-west horizontal component of thereference sensor. Primary spectral peaks are circled and labeled.
Geophysical Research Letters 10.1002/2015GL064917
STARR ET AL. RESONANCE OF A ROCK ARCH 3
not interpreted in further detail here. An additional spectral peak recorded in all data sets (including thereference sensor) was identified at ~0.15 Hz, which is at the microseism peak related to ocean-generatedseismic waves [Longuet-Higgins, 1950].
Phase relations were explored from simultaneous data generated at sensor positions B and C (Figure 1).E-W horizontal records were found to be in phase at f1 and out of phase at f2, while vertical recordswere found to be in phase at f3 and out of phase at f4. These results provide experimental insightinto the vibrational mode shapes, suggesting that f1 represents the first horizontal bending mode(shape akin to a half sine wave), f2 represents the second horizontal bending mode (shape akin to a fullsine wave), while f3 and f4 are the first and second vertical bending modes, respectively (compare tomode shapes shown in Figure 3).
4.2. Numerical
Numerical modal analysis explored the anticipated mode shapes at f1 through f4. We used the finite-elementsoftware Comsol Multiphysics for Eigenfrequency analysis; input data included geometry, boundary conditions,and material properties. We measured the geometry of Mesa Arch in the field using a laser rangefinder com-bined with tape measurements where possible. The resulting 3-D model was simple but captured the overalldistribution of mass within the arch. Boundary conditions were based on field assessment; on the southernend the arch was attached to the cliff at the bottom and a small portion of the back side (Figure 1c), whilethe northern abutment terminated into intact rock and was held fixed at the bottom and northern sides. Formaterial properties, we assumed a uniform density (ρ) for Navajo sandstone of 2000 kg/m3 [Schultz et al.,2010] and then varied Young’s modulus (E) to achieve the best fit with measured resonant frequencies.E = 5.5 GPa was found to provide optimum match to measured values of f1–f4, which is within the rangeof expected values for a weathered sandstone rock mass [Hoek and Diederichs, 2006].
Predicted resonant frequencies for Mesa Arch are 3.0, 6.0, 7.1, and 8.1Hz (Table 1). Despite minor variationsbetween predicted and measured values, our simplified, uniform numerical model was able to closely reproducethe first four resonant frequencies of the arch. Refinements could include a more sophisticated geometricalmodel, as well as inclusion of material compartments or discontinuities.
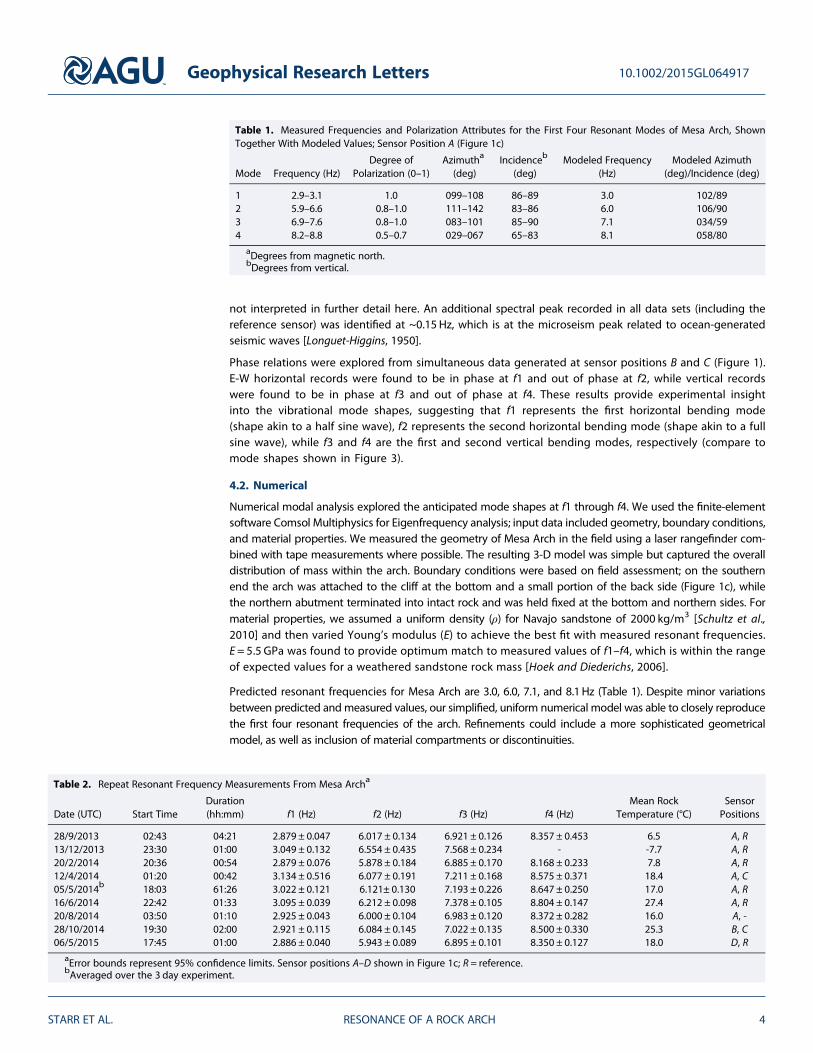
Table 1. Measured Frequencies and Polarization Attributes for the First Four Resonant Modes of Mesa Arch, ShownTogether With Modeled Values; Sensor Position A (Figure 1c)
Mode Frequency (Hz)Degree of
Polarization (0–1)Azimutha
(deg)Incidenceb
(deg)Modeled Frequency
(Hz)Modeled Azimuth
(deg)/Incidence (deg)
1 2.9–3.1 1.0 099–108 86–89 3.0 102/892 5.9–6.6 0.8–1.0 111–142 83–86 6.0 106/903 6.9–7.6 0.8–1.0 083–101 85–90 7.1 034/594 8.2–8.8 0.5–0.7 029–067 65–83 8.1 058/80
aDegrees from magnetic north.bDegrees from vertical.
Table 2. Repeat Resonant Frequency Measurements From Mesa Archa
Date (UTC) Start TimeDuration(hh:mm) f1 (Hz) f2 (Hz) f3 (Hz) f4 (Hz)
Mean RockTemperature (°C)
SensorPositions
28/9/2013 02:43 04:21 2.879 ± 0.047 6.017 ± 0.134 6.921 ± 0.126 8.357 ± 0.453 6.5 A, R13/12/2013 23:30 01:00 3.049 ± 0.132 6.554 ± 0.435 7.568 ± 0.234 - -7.7 A, R20/2/2014 20:36 00:54 2.879 ± 0.076 5.878 ± 0.184 6.885 ± 0.170 8.168 ± 0.233 7.8 A, R12/4/2014 01:20 00:42 3.134 ± 0.516 6.077 ± 0.191 7.211 ± 0.168 8.575 ± 0.371 18.4 A, C05/5/2014b 18:03 61:26 3.022 ± 0.121 6.121± 0.130 7.193 ± 0.226 8.647 ± 0.250 17.0 A, R16/6/2014 22:42 01:33 3.095 ± 0.039 6.212 ± 0.098 7.378 ± 0.105 8.804 ± 0.147 27.4 A, R20/8/2014 03:50 01:10 2.925 ± 0.043 6.000 ± 0.104 6.983 ± 0.120 8.372 ± 0.282 16.0 A, -28/10/2014 19:30 02:00 2.921 ± 0.115 6.084 ± 0.145 7.022 ± 0.135 8.500 ± 0.330 25.3 B, C06/5/2015 17:45 01:00 2.886 ± 0.040 5.943 ± 0.089 6.895 ± 0.101 8.350 ± 0.127 18.0 D, R
aError bounds represent 95% confidence limits. Sensor positions A–D shown in Figure 1c; R = reference.bAveraged over the 3 day experiment.
Geophysical Research Letters 10.1002/2015GL064917
STARR ET AL. RESONANCE OF A ROCK ARCH 4
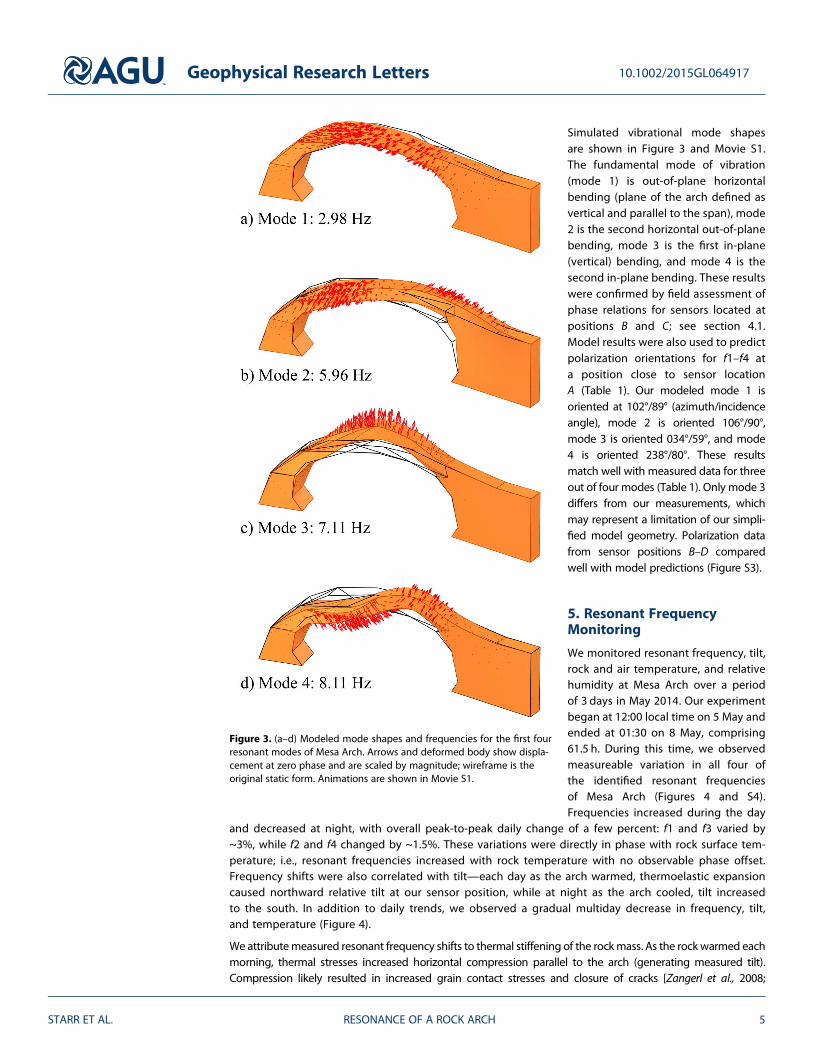
Simulated vibrational mode shapesare shown in Figure 3 and Movie S1.The fundamental mode of vibration(mode 1) is out-of-plane horizontalbending (plane of the arch defined asvertical and parallel to the span), mode2 is the second horizontal out-of-planebending, mode 3 is the first in-plane(vertical) bending, and mode 4 is thesecond in-plane bending. These resultswere confirmed by field assessment ofphase relations for sensors located atpositions B and C; see section 4.1.Model results were also used to predictpolarization orientations for f1–f4 ata position close to sensor locationA (Table 1). Our modeled mode 1 isoriented at 102°/89° (azimuth/incidenceangle), mode 2 is oriented 106°/90°,mode 3 is oriented 034°/59°, and mode4 is oriented 238°/80°. These resultsmatch well with measured data for threeout of four modes (Table 1). Only mode 3differs from our measurements, whichmay represent a limitation of our simpli-fied model geometry. Polarization datafrom sensor positions B–D comparedwell with model predictions (Figure S3).
5. Resonant FrequencyMonitoring
We monitored resonant frequency, tilt,rock and air temperature, and relativehumidity at Mesa Arch over a periodof 3 days in May 2014. Our experimentbegan at 12:00 local time on 5 May andended at 01:30 on 8 May, comprising61.5 h. During this time, we observedmeasureable variation in all four ofthe identified resonant frequenciesof Mesa Arch (Figures 4 and S4).Frequencies increased during the day
and decreased at night, with overall peak-to-peak daily change of a few percent: f1 and f3 varied by~3%, while f2 and f4 changed by ~1.5%. These variations were directly in phase with rock surface tem-perature; i.e., resonant frequencies increased with rock temperature with no observable phase offset.Frequency shifts were also correlated with tilt—each day as the arch warmed, thermoelastic expansioncaused northward relative tilt at our sensor position, while at night as the arch cooled, tilt increasedto the south. In addition to daily trends, we observed a gradual multiday decrease in frequency, tilt,and temperature (Figure 4).
We attributemeasured resonant frequency shifts to thermal stiffening of the rockmass. As the rockwarmed eachmorning, thermal stresses increased horizontal compression parallel to the arch (generating measured tilt).Compression likely resulted in increased grain contact stresses and closure of cracks [Zangerl et al., 2008;
Figure 3. (a–d) Modeled mode shapes and frequencies for the first fourresonant modes of Mesa Arch. Arrows and deformed body show displa-cement at zero phase and are scaled by magnitude; wireframe is theoriginal static form. Animations are shown in Movie S1.
Geophysical Research Letters 10.1002/2015GL064917
STARR ET AL. RESONANCE OF A ROCK ARCH 5
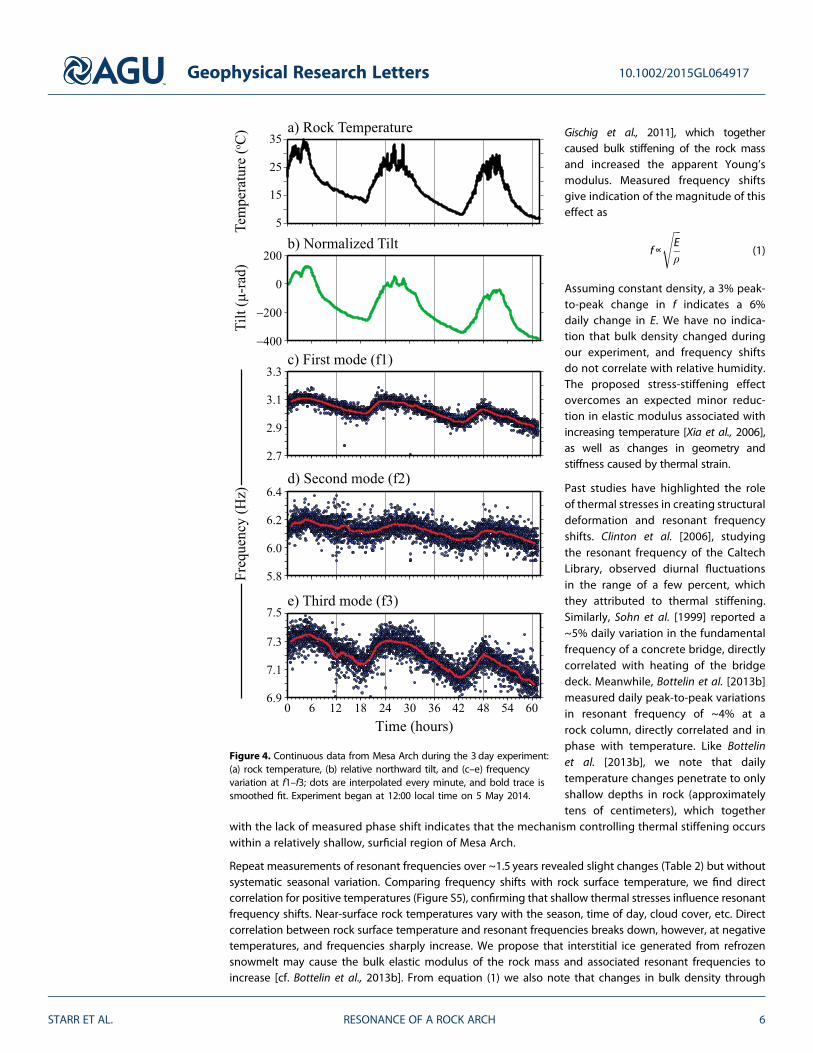
Gischig et al., 2011], which togethercaused bulk stiffening of the rock massand increased the apparent Young’smodulus. Measured frequency shiftsgive indication of the magnitude of thiseffect as
f∝
ffiffiffiEρ
s(1)
Assuming constant density, a 3% peak-to-peak change in f indicates a 6%daily change in E. We have no indica-tion that bulk density changed duringour experiment, and frequency shiftsdo not correlate with relative humidity.The proposed stress-stiffening effectovercomes an expected minor reduc-tion in elastic modulus associated withincreasing temperature [Xia et al., 2006],as well as changes in geometry andstiffness caused by thermal strain.
Past studies have highlighted the roleof thermal stresses in creating structuraldeformation and resonant frequencyshifts. Clinton et al. [2006], studyingthe resonant frequency of the CaltechLibrary, observed diurnal fluctuationsin the range of a few percent, whichthey attributed to thermal stiffening.Similarly, Sohn et al. [1999] reported a~5% daily variation in the fundamentalfrequency of a concrete bridge, directlycorrelated with heating of the bridgedeck. Meanwhile, Bottelin et al. [2013b]measured daily peak-to-peak variationsin resonant frequency of ~4% at arock column, directly correlated and inphase with temperature. Like Bottelinet al. [2013b], we note that dailytemperature changes penetrate to onlyshallow depths in rock (approximatelytens of centimeters), which together
with the lack of measured phase shift indicates that the mechanism controlling thermal stiffening occurswithin a relatively shallow, surficial region of Mesa Arch.
Repeat measurements of resonant frequencies over ~1.5 years revealed slight changes (Table 2) but withoutsystematic seasonal variation. Comparing frequency shifts with rock surface temperature, we find directcorrelation for positive temperatures (Figure S5), confirming that shallow thermal stresses influence resonantfrequency shifts. Near-surface rock temperatures vary with the season, time of day, cloud cover, etc. Directcorrelation between rock surface temperature and resonant frequencies breaks down, however, at negativetemperatures, and frequencies sharply increase. We propose that interstitial ice generated from refrozensnowmelt may cause the bulk elastic modulus of the rock mass and associated resonant frequencies toincrease [cf. Bottelin et al., 2013b]. From equation (1) we also note that changes in bulk density through
Figure 4. Continuous data from Mesa Arch during the 3 day experiment:(a) rock temperature, (b) relative northward tilt, and (c–e) frequencyvariation at f1–f3; dots are interpolated every minute, and bold trace issmoothed fit. Experiment began at 12:00 local time on 5 May 2014.
Geophysical Research Letters 10.1002/2015GL064917
STARR ET AL. RESONANCE OF A ROCK ARCH 6
varying saturation should contribute to short-term resonant frequency shifts. However, measurements on20 August 2014 shortly after an intense rain storm showed no apparent offset from the temperature-frequencytrend (Figure S5). In addition, we witnessed several periods of strong winds during our 3 day test at Mesa Arch,and while we have no wind speed data from the time, we found no notable resonant frequency shiftsassociated with documented windy periods [cf. Lévy et al., 2010]. We did not identify any long-term trendsor permanent offsets in resonant frequencies during our study period, which might indicate internal damage.
6. Conclusions
We combined ambient vibration data with 3-D numerical analysis to measure and interpret the resonantfrequencies and mode shapes of Mesa Arch in Canyonlands National Park, Utah. In doing so, we haveestablished new methodology to evaluate the response of Mesa Arch to changes in environmentalconditions and created a baseline to monitor relative changes in the arch’s long-term structural health.We measured daily resonant frequency shifts of up to 3%, correlated with rock temperature and arch defor-mation, which we propose are generated through thermal stress cycles and associated stiffening and relaxa-tion of the rock mass. Similar scale variations were seen in repeat measurements over>1.5 years but withoutclear seasonal pattern. Characterizing the magnitude and drivers of these reversible effects is crucial in ourultimate aim of identifying permanent change associated with internal damage. Our study creates newopportunities for geoscientists to draw on the field of structural health monitoring in developing novelmeans for evaluating damage in natural rock landforms.
ReferencesBottelin, P., et al. (2013a), Spectral analysis of prone-to-fall rock compartments using ambient vibrations, J. Environ. Eng. Geophys., 18,
205–217.Bottelin, P., C. Levy, L. Baillet, D. Jongmans, and P. Gueguen (2013b), Modal and thermal analysis of Les Arches unstable rock column
(Vercors Massif, French Alps), Geophys. J. Int., 194, 849–858.Burjanek, J., G. Stamm, V. Poggi, J. R. Moore, and D. Fäh (2010), Ambient vibration analysis of an unstable mountain slope, Geophys. J. Int., 180,
820–828.Burjanek, J., J. R. Moore, F. X. Yugsi-Molina, and D. Fäh (2012), Instrumental evidence of normal mode rock slope vibration, Geophys. J. Int.,
188, 559–569.Carder, D. S. (1936), Observed vibrations of buildings, Bull. Seismol. Soc. Am., 26(3), 245–277.Clinton, J. F., S. Case Bradford, T. H. Heaton, and J. Favela (2006), The observed wander of the natural frequencies in a structure, Bull. Seismol.
Soc. Am., 96(1), 237–257.Crawford, R., and H. S. Ward (1964), Determination of the natural periods of buildings, Bull. Seismol. Soc. Am., 54(6A), 1743–1756.Farrar, C. R., S. W. Doebling, and D. A. Nix (2001), Vibration–based structural damage identification, Philos. Trans. R. Soc. London, Ser. A,
359(1778), 131–149.Gischig, V. S., J. R. Moore, K. F. Evans, F. Amann, and S. Loew (2011), Thermomechanical forcing of deep rock slope deformation: Part 1.
Conceptual study of a simplified slope, J. Geophys. Res., 116, F04010, doi:10.1029/2011JF002006.Hoek, E., and M. S. Diederichs (2006), Empirical estimation of rock mass modulus, Int. J. Rock Mech. Min. Sci., 43(2), 203–215.Koper, K. D., and V. L. Hawley (2010), Frequency dependent polarization analysis of ambient seismic noise recorded at a broadband
seismometer in the central United States, Earthquake Sci., 23, 439–447, doi:10.1007/s11589-010-0743-5.Lévy, C., L. Baillet, D. Jongmans, P. Mourot, and D. Hantz (2010), Dynamic response of the Chamousset rock column (Western Alps, France),
J. Geophys. Res., 115, F04043, doi:10.1029/2009JF001606.Longuet-Higgins, M. S. (1950), A theory of the origin of microseisms, Philos. Trans. R. Soc. London A, 243, 1–35.McNamara, D. E., and R. P. Buland (2004), Ambient noise levels in the continental United States, Bull. Seismol. Soc. Am., 94(4), 1517–1527.Moore, J. R., V. Gischig, J. Burjanek, S. Loew, and D. Fäh (2011), Site effects in unstable rock slopes: Dynamic behavior of the Randa instability
(Switzerland), Bull. Seismol. Soc. Am., 101(6), 3110–3116.Park, J., F. L. Vernon, and C. R. Lindberg (1987), Frequency dependent polarization analysis of high-frequency seismograms, J. Geophys. Res.,
92(12), 12,644–12,674.Schultz, R. A., C. H. Okubo, and H. Fossen (2010), Porosity and grain size controls on compaction band formation in Jurassic Navajo
Sandstone, Geophys. Res. Lett., 37, L22306, doi:10.1029/2010GL044909.Sohn, H., M. Dzwonczyk, E. G. Straser, A. S. Kiremidjian, K. H. Law, and T. Meng (1999), An experimental study of temperature effect on modal
parameters of the Alamosa Canyon Bridge, Earthquake Eng. Struct. Dyn., 28(8), 879–897.Sufri, O., K. D. Koper, R. Burlacu, and B. de Foy (2014), Microseisms from superstorm Sandy, Earth Planet. Sci. Lett., 402, 324–336.Wessel, P., and W. H. F. Smith (1998), New, improved version of generic mapping tools released, Eos Trans. AGU, 79(47), 579, doi:10.1029/
98EO00426.Xia, Y., H. Hao, G. Zanardo, and A. Deeks (2006), Long term vibration monitoring of an RC slab: Temperature and humidity effect, Eng. Struct.,
28(3), 441–452.Zangerl, C., K. F. Evans, E. Eberhardt, and S. Loew (2008), Normal stiffness of fractures in granitic rock: A compilation of laboratory and in-situ
experiments, Int. J. Rock Mech. Min. Sci., 8, 1500–1507.
AcknowledgmentsThis study was funded in part by theUniversity of Utah Research Foundation,the National Park Service, and theNational Science Foundation grantEAR-1424896 to Moore and Thorne. Wethank Jordan Culp and BenWhite for theirhelp in the field and Keith Koper for hisadvice with polarization processing.Comments from two anonymousreviewers are appreciated. We gratefullyacknowledge the University of UtahCenter for High Performance Computingfor computer resources and support.Some figures were created using theGeneric Mapping Tools [Wessel and Smith,1998]. Data generated in this study areavailable for download at the author’swebsite: http://geohazards.earth.utah.edu/data.html.
The Editor thanks two anonymousreviewers for their assistance inevaluating this paper.
Geophysical Research Letters 10.1002/2015GL064917
STARR ET AL. RESONANCE OF A ROCK ARCH 7