
ama nov 09
80
1 PAPER – 5 : ADVANCED MANAGEMEN T ACCOUN TING QUESTIONS Developments in the Business Environment: Total Quality Management & Value Chain Analysi s 1. (a) Define Tota l Quali ty Manage ment ( TQM). Expla in in br ief si x C s of T.Q.M. for its succes sful implementat ion. (b) Haw c an Val ue Chain Analysis be use d to assess competitiv e advan tage. Give a diagram for value chain activities within the firm with suitable classifications under primary and support activities and also the industry value chain indicating what the end use consumer pays for. Developments in th e Business Environment: Target Costing & Life Cycle Costing 2. (a) What i s Target Costi ng and what a re the sta ges to the met hodol ogy ? (b) What is tot al-l ife- cyc le cos ting appro ach? Why is i t impo rtan t? Developments in the Business Environment: Just in Time ( JIT) & Concept of Back Flushing in JIT 3. (a) Descr ibe the conce pt o f Back flushing as used in the JIT syste m. What probl ems need to be addressed before implementing such a concept? Briefly discuss. (b) Littlefie ld Compa ny use s a bac kflush costing system with three trigger points: Purchase of direct materials Completion of good finished units of product Sale of finished goods There are no beginning inventories. Information for March, 2008 is: Rs. Rs. Di rect materi als purchased 4, 40, 000 Conversi on cost s al located 2, 00, 000 Direct materials used 4,25,000 Cost transferred to finished goods 6,25,000 Conversion cost s incurred 2,11, 000 Cost of goods sol d 5,95,000 Required: 1. Pr epare journal en tries for Apri l (wi tho ut di sposing of underall ocate d or overallocated conversion costs). Assume there are no direct materials variances. 2. Under an id eal JIT production s yst em, how would the amount s in your journal entries differ from the journal entries in requirement 1?
-
Upload
sandeep-tank -
Category
Documents
-
view
221 -
download
0
Transcript of ama nov 09

8/3/2019 ama nov 09
http://slidepdf.com/reader/full/ama-nov-09 1/80
1
PAPER – 5 : ADVANCED MANAGEMENT ACCOUNTING
QUESTIONS
Developments in the Business Environment: Total Quality Management & Value
Chain Analysi s
1. (a) Define Total Quality Management (TQM). Explain in brief six Cs of T.Q.M. for itssuccessful implementation.
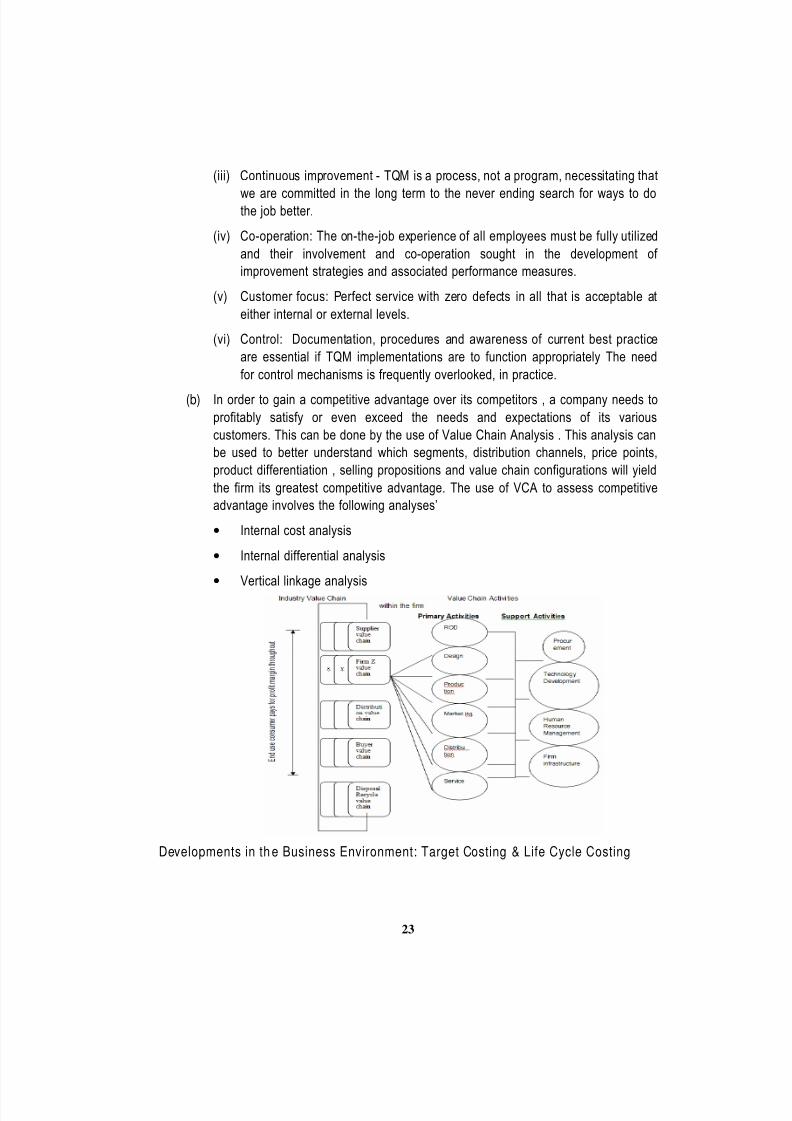
(b) Haw can Value Chain Analysis be used to assess competitive advantage. Give a
diagram for value chain activities within the firm with suitable classifications under
primary and support activities and also the industry value chain indicating what the
end use consumer pays for.
Developments in th e Business Environment: Target Costing & Life Cycle Costing
2. (a) What is Target Costing and what are the stages to the methodology ?
(b) What is total-life-cycle costing approach? Why is it important?
Developments in the Business Environment: Just in Time ( JIT) & Concept of Back
Flushing in JIT
3. (a) Describe the concept of Back flushing as used in the JIT system. What problems
need to be addressed before implementing such a concept? Briefly discuss.
(b) Littlefield Company uses a backflush costing system with three trigger points:
Purchase of direct materials
Completion of good finished units of product
Sale of finished goods
There are no beginning inventories. Information for March, 2008 is:
Rs. Rs.
Direct materials purchased 4,40,000 Conversion costs allocated 2,00,000
Direct materials used 4,25,000 Cost transferred to finishedgoods
6,25,000
Conversion costs incurred 2,11,000 Cost of goods sold 5,95,000
Required:
1. Prepare journal entries for April (without disposing of underallocated or overallocated conversion costs). Assume there are no direct materialsvariances.
2. Under an ideal JIT production system, how would the amounts in your journalentries differ from the journal entries in requirement 1?

8/3/2019 ama nov 09
http://slidepdf.com/reader/full/ama-nov-09 2/80
2
Cost Concept in Decisi on Making: Opportunity Cost and Differential Cost
4. (a) What is Opportunity Cost? Explain with suitable examples.
(b) What are the areas in which differential cost technique is used in managerialdecision.
(c) Salabhi Arora, Sales Manager for Green Industries, has been asked by a potential
foreign customer to sell 10,000 units of a certain gear for Rs. 100 per unit. Green
normally sells this item for Rs. 150 per unit, but they have had some excess
manufacturing capacity in recent months. It is anticipated that this would be a one-
time order from this customer. The product unit cost report for this type gear is as
follows:
Rs.
Direct materials 30
Direct labour 25
Variable manufacturing overhead 12.50
Fixed manufacturing overhead 25
Variable selling and administrative expense 17.50
Fixed selling and administrative expense 22.50
Total per unit cost 132.50
After looking at the product cost report, Salabhi advises the customer as follows:
“I may not be an accountant, but I am smart enough to know that I will lose Rs.
32.50 per unit if I make this sale. Therefore, I must refuse your offer.”Required:
(i) From the list of costs in the product cost report, which costs would be relevant
to the decision to sell at the special price ?
(ii) What will be the amount of the total relevant cost per unit in regard to thisorder ?
(iii) What would be the differential income (loss) to Green Industries if this order
were accepted ?
(iv) Are there any non-financial factors that you would consider in making this
decision ?
Cost Concept in Decision Making: Break-even Point, Absorption and Variable
costing
5. Amazing Products Company has a maximum productive capacity of 1,00,000 units per
year. Normal capacity is 90,000 units per year. Standard variable manufacturing costs

8/3/2019 ama nov 09
http://slidepdf.com/reader/full/ama-nov-09 3/80
3
are Rs. 20 per unit. Fixed factory overhead is Rs. 4,50,000 per year. Variable selling
expense is Rs. 10 per unit and fixed selling expense is Rs. 3,00,000 per year. The unitsales price is Rs. 50.
The operating results for the year are as follows:
Sales, 80,000 units;
Production 85,000 units and beginning inventory 5,000 units.
All variances ae written off as addit ions to (for deductions from) the standard cost of
sales.
Required:
(i) What is the break-even point expressed in rupees sales?
(ii) How many units must be sold to earn a net income of Rs. 50,000 per year?
(iii) Prepare a formal income statement for the year ended December 31, 2008, under
the following:
(a) Absorption costing.
(b) Variable costing.
Decision Making and Process Costing
6. A company is organised into two processes. Raw material is introduced into Process A
and its output becomes the raw material for Process B. The finished goods of Process B
is sold in the market. Process A has a capacity to process an input of 200,000 kg. of raw
material per annum. The normal scrap is 10% and 5% of input in Process A and ProcessB respectively. The realizable value of scrap is Re.1 and Rs.2 per kg. respectively for
Processes A and B. The operating data for a year are as under:
Process A Process B
Direct Wages Rs.22,00,000 21,00,000
Overheads Rs. 9,56,000 13,45,800
There are three suppliers of raw material whose price quotations and terms are as under:
Supplier Price Rs./Kg. Terms
P 10.00 Maximum quantity offered is Rs.1,20,000 kg.
Q 11.20 Maximum quantity offered is 1,60,000 kg.R 11.00 If the entire quantity of 2,00,000 kg. is ordered.
Otherwise, for any quantity less than 2,00,000 kg. theprice charged is Rs.11.60 per kg.

8/3/2019 ama nov 09
http://slidepdf.com/reader/full/ama-nov-09 4/80
4
In each case, the raw material is to be collected from the supplier’s factory. The variable
transport cost for bringing the raw materials is as under:Supplier P Q R
Variable transport cost per Kg. Rs.1.20 1.00 1.00
The fixed transport cost will be Rs.2,00,000 per annum irrespective of the supplier from
whom the raw material is purchased.
The output of the company emerging from Process B can be sold to three customers at
the prices and terms given below:
Customer
Price Rs./Kg.
Discount
Condition
K 65.00 2% Maximum quantity acceptable to K is 80,000 Kg.
L 64.00 2% Maximum quantity acceptable to L is 1,60,000 Kg.
M 61.80 Provided the entire production of the company is
sold to M
In the case of customers K and L, fixed delivery costs of Rs.5,000 in total per month will
be incurred. The variable delivery costs in respect of customers K and L respectively are
Rs.2.60 and Rs.1.44 per Kg. Customer M will collect the output from the company’s
factory at his own cost.
(i) You are required to indicate with supporting calculations the choice of (a) suppliersand (b) customers.
(ii) Based on your recommendation in (i) above, prepare a statement showing theprocess wise costs and profit of the company for the year.
CVP Analysis & Decision Making: Product Mix Decisi ons
7. A market gardener is planning his production for next season, and he has asked you as a
cost accountant, to recommend the optimal mix of vegetable production for the coming
year. He has given you the following data relating to the current year.
Potatoes Turnips Parsnips Carrots
Area occupied (acres) 25 20 30 25
Yield per acre (tonnes) 10 8 9 12
Selling price per tonne (Rs.) 100 125 150 135
Variable cost per acre (Rs.)
Fertilizers 30 25 45 40
Seeds 15 20 30 25

8/3/2019 ama nov 09
http://slidepdf.com/reader/full/ama-nov-09 5/80
5
Pesticides 25 15 20 25
Direct wages 400 450 500 570
Fixed overhead per annum Rs. 54000
The land that is being used for the production of carrots and parsnips can be used for
either crop, but not for potatoes or turnips. The land being used for potatoes and turnips
can be used for either crop, but not for carrots or parsnips. In order to provide an
adequate market service, the gardener must produce each year at least 40 tonnes each
of potatoes and turnips and 36 tonnes each of parsnips and carrots.
(a) You are required to present a statement to show:
(i) the profit for the current year;
(ii) the profit for the production mix that you would recommend.
(b) Assuming that the land could be cultivated in such a way that any of the above
crops could be produced and there was no market commitment, you are required to:
(i) advise the market gardener on which crop he should concentrate hisproduction;
(ii) calculate the profit if he were to do so;
(iii) calculate in rupees the break-even point of sales.
CVP Analysis & Decision Making: Accepting & Rejecting of an Order
8. A company has been making a machine to order for a customer, but the customer has
since gone into liquidation, and there is no prospect that any money will be obtained from
the winding up of the company.
Costs incurred to date in manufacturing the machine are Rs. 50,000 and progress
payments of Rs. 15,000 had been received from the customer prior to the liquidation.
The sale department has found another company willing to buy the machine for Rs.
34,000 once it has been completed.
To complete the work, the following costs would be incurred.
(a) Materials: these have been bought at a cost of Rs. 6,000. They have no other use,
and if the machine is not finished, they would be sold for scrap for Rs. 2,000.
(b) Further labour costs would be Rs. 8,000. Labour is in short supply, and if the
machine is not finished, the work force would be switched to another job, whichwould earn Rs. 30,000 in revenue, and incur direct costs of Rs. 12,000 and
absorbed (fixed) overhead of Rs. 8,000.
8/3/2019 ama nov 09
http://slidepdf.com/reader/full/ama-nov-09 6/80
6
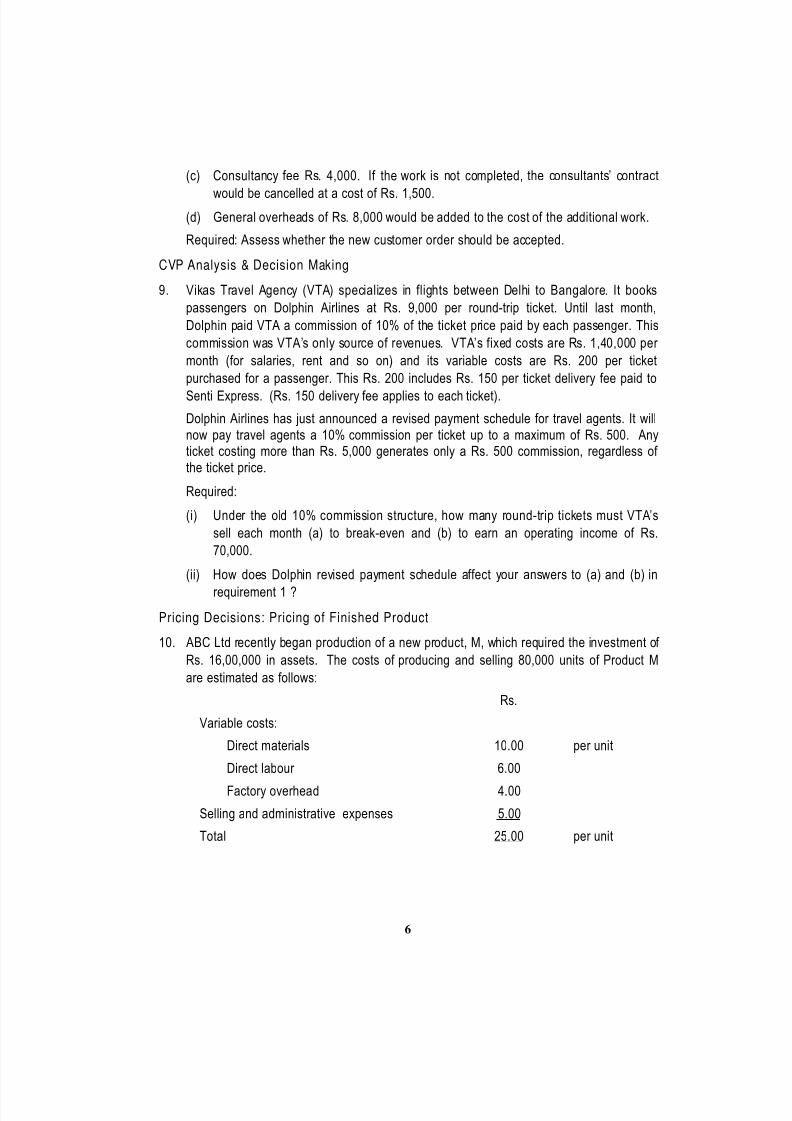
(c) Consultancy fee Rs. 4,000. If the work is not completed, the consultants’ contract
would be cancelled at a cost of Rs. 1,500.(d) General overheads of Rs. 8,000 would be added to the cost of the additional work.
Required: Assess whether the new customer order should be accepted.
CVP Analysis & Decision Making
9. Vikas Travel Agency (VTA) specializes in flights between Delhi to Bangalore. It books
passengers on Dolphin Airlines at Rs. 9,000 per round-trip ticket. Until last month,
Dolphin paid VTA a commission of 10% of the ticket price paid by each passenger. This
commission was VTA’s only source of revenues. VTA’s fixed costs are Rs. 1,40,000 per
month (for salaries, rent and so on) and its variable costs are Rs. 200 per ticket
purchased for a passenger. This Rs. 200 includes Rs. 150 per ticket delivery fee paid to
Senti Express. (Rs. 150 delivery fee applies to each ticket).
Dolphin Airlines has just announced a revised payment schedule for travel agents. It will
now pay travel agents a 10% commission per ticket up to a maximum of Rs. 500. Anyticket costing more than Rs. 5,000 generates only a Rs. 500 commission, regardless of
the ticket price.
Required:
(i) Under the old 10% commission structure, how many round-trip tickets must VTA’s
sell each month (a) to break-even and (b) to earn an operating income of Rs.
70,000.
(ii) How does Dolphin revised payment schedule affect your answers to (a) and (b) in
requirement 1 ?
Pricing Decisions: Pricing of Finished Product
10. ABC Ltd recently began production of a new product, M, which required the investment of
Rs. 16,00,000 in assets. The costs of producing and selling 80,000 units of Product M
are estimated as follows:
Rs.
Variable costs:
Direct materials 10.00 per unit
Direct labour 6.00
Factory overhead 4.00
Selling and administrative expenses 5.00
Total 25.00 per unit

8/3/2019 ama nov 09
http://slidepdf.com/reader/full/ama-nov-09 7/80
7
Fixed costs:
Factory overhead 8,00,000
Selling and administrative expenses 4,00,000
ABC Ltd is currently considering establishing a selling price for Product M. The
President of ABC Ltd has decided to use the cost-plus approach to product pricing and
has indicated that Product M must earn a 10% rate of return on invested assets.
Instructions:
(i) Determine the amount of desired profit from the production and sale of Product M.
(ii) Assuming that the total cost concept is used, determine (a) the cost amount per
unit, (b) the markup percentage, and (c) the selling price of Product M.
(iii) Assuming that the product cost concept is used, determine (a) the cost amount per unit, (b) the mark up percentage, and (c) the selling price of Product M.
(iv) Assuming that the variable cost concept is used, determine (a) the cost amount per
unit, (b) the markup percentage, and (c) the selling price of Product M.
(v) Assume that for the current year, the selling price of Product M was Rs. 42 per unit.
To date, 60,000 units have been produced and sold, and analysis of the domestic
market indicates that 15,000 additional units are expected to be sold during the
remainder of the year. Recently, ABC Ltd received an offer from XYZ Ltd for 4,000
units of product M at Rs. 28 each. XYZ Ltd. will market the units in Korea under its
own brand name, and no additional selling and administrative expenses associated
with the sale will be incurred by ABC Ltd. The additional business is not expectedto affect the domestic sales of Product M, and the additional units could be
produced during the current year, using existing capacity. (a) Prepare a differential
analysis report of the proposed sale to XYZ Ltd (b) Based upon the differential
analysis report in (a), should the proposal be accepted?
Pricing Decisions: Computing Minimum Selling Price
11. The Directors of Domestic Ltd. are considering a new type of Kitchen Gadget which their
Research Department has developed. The expenditure so far on research has been Rs.
40,000 and a Consultant's report has been prepared at a cost of Rs. 7,500. The report
provides the following information:
A. Cost of Product ion per unit Rs.Materials 22.50
Labour 37.50
Fixed overheads (based on company's normal allocation rates) 10.00
70.00

8/3/2019 ama nov 09
http://slidepdf.com/reader/full/ama-nov-09 8/80
8
B. Anticipated additional fixed costs:
Rent for additional space Rs. 75,000 per annum.
Other additional Fixed costs Rs. 37,500 per annum.
A new machine will be built with the available facil ities at a cost of Rs. 60,000
(Materials Rs. 50,000 and Labour Rs. 10,000). The materials are readily available instores which are regularly used. However, these are to be immediately replenished.
The price of these materials has since risen by 40%. Scrap value of the machine at
the end of 10th year is 10,000. The product scraps generated can be disposed off atthe end of year 10 for a price of Rs. 71,920.
The estimated demand for product is as follows:
Year 1-5 Year 6-10
Demand (units) Probability Demand (units) Probability
20,000 0.10 12,000 0.2
10,000 0.65 8,000 0.5
6,000 0.25 2,000 0.3
It is expected that the commercial life of the Gadget will be no longer than 10 years and
the after tax cost of Capital is 10%. The full cost of the machine will be depreciated on
straight line basis which is allowed for taxation also, over a period of 10 years. Tax rate
is 40%. DCF Factors
1-5 Years (cumulative) 3.79
6-10 Years (cumulative) 2.35510th Year 0.386
Compute Minimum Selling Price of the Gadget.
Pricing Decisions: Pareto Analysis
12. The following information of manufacture and sale is obtained from the records of Vee
Aar Ltd. for the 12 months ending 31.12.2008:
Product Contribution
(Rs.)
A 500
B 200
C 1,500
D 75

8/3/2019 ama nov 09
http://slidepdf.com/reader/full/ama-nov-09 9/80
9
E 100
F 125
Total 2,500
You are required to prepare a Pareto product contribution chart and comment on the
results.
Budget & Budgetary Control: Flexible Budget
13. A single product company having a normal capacity of 8,00,000 units per annum has
prepared the following cost sheet:
Rs. per unit
Direct materials 5
Direct labour 2
Factory overheads (50% fixed) 4
Selling & Administrative overheads (1/3 variable) 3
Selling price 18
The Company achieved a sales volume of 6,00,000 units during the last year. During the
current year, since the market is buoyant the company has launched an expansion
programme. The proposed operational details for the current year are as under:
The capacity will be increased to 12,00,000 units.
The additional fixed overheads will amount to Rs.8 lacs upto 10,00,000 units and
will increase by Rs.4 lacs more beyond 10 lac unit level. The expansion scheme involving a capital cost of Rs.20 lacs will be financed
through borrowings at an interest rate of 15% per annum.
Depreciation on new investment is 20% on straight line basis.
The company has two proposals for operating the expanded plant during current year as
under:
(i) Sales can be increased to 10 lac units by spending Rs.2, 00,000 on special
advertisement; or
(ii) Sales can be increased to 12 lac units subject to the following:
by an overall price reduction of Rs.2/- per unit on all units sold. by increasing the variable selling and administrative expenses by Rs.1,00,000.
by a reduction in direct material cost by 5% due to bulk buying discount.

8/3/2019 ama nov 09
http://slidepdf.com/reader/full/ama-nov-09 10/80
10
Required:
(i) Construct a flexible budget at 6 lacs, 10 lacs and 12 lacs units of production.
(ii) Advise which level of output should be chosen by the company.
Budget & Budgetary Control: Functional Budget
14. RNRB Company’s budgeted unit sales for the year 2008 were:
Bike tyres 60,000
Bus tyres 12,500
The budgeted selling price for Bus tryes was Rs. 15,000 per tyre and for Bike tyres was
Rs. 4,500 per tyre. The beginning finished goods inventories were expected to be 2,500
Bus tyres and 6,000 Bike tyres, for a total cost of Rs. 2,00,25,500, with desired ending
inventories at 2,000 and 5,000, respectively, with a total cost of Rs. 1,63,23,900. Therewas no anticipated beginning or ending work in process inventory for either type of tyre.
The standard materials quantities for each type of tyre were as follows:
Bus Bike
Rubber 35 lbs. 15 lbs.
Steel belts 4.5 lbs. 2.0 lbs.
The purchase prices of rubber and steel were Rs. 150 and Rs. 100 per pound,
respectively. The desired ending inventories for rubber and steel were 60,000 and 6,000
pounds, respectively. The estimated beginning inventories for rubber and steel were75,000 and 7,500 pounds, respectively.
The direct labour hours required for each type of tyre were as follows:
Molding
Department
Finishing
Department
Bus tyre 0.20 0.10
Bike tyre 0.10 0.05
The direct labour rate for each department is as follows:
Molding Department Rs. 650 per hour
Finishing Department Rs. 750 per hour

8/3/2019 ama nov 09
http://slidepdf.com/reader/full/ama-nov-09 11/80

8/3/2019 ama nov 09
http://slidepdf.com/reader/full/ama-nov-09 12/80
12
Code Budget Actual
Rs. Rs.
301 Sales’ Salary 30,000 33,750
302 Staff Commission 30,000 28,500
303 Staff Expenses 15,000 13,000
431 Underwriting Staff 45,000 50,000
599 Other Admin. Cost 30,000 33,000
1,50,000 1,58,250
At the end of the year, it was ascertained that
1. 6,750 new life policies had been issued.
2. the sales staff and underwriting staff received as salaries pay award of 12½%
which had been back-dated to the beginning of the year and this had not been
included in the budget.
3. expenses on codes 302, 303 and 431 are regarded as direct costs which varywith activity, and those on code 301 are treated as a direct fixed cost whilethose on code 599 are an indirect fixed cost.
You are required to
(A) present a statement (or control report) for the life business manager showing
the variances which have arisen,
(B) comment on the likely cause or causes for each variance identifying, so far as
you can from the information given, how much of each variance arises fromprice differences and how much can be related to efficiency or inefficiency.
Standard Costing : Variance Analysi s
16. ABC Limited manufactures three types of products namely Product 1, Product 2 and
Product 3. The production process requires a single input raw material, a single type of
direct labour and a single energy input, electricity. Overheads are shared by all three
products. Budgeted details of the three products are shown below;
Product 1 Product 2 Product 3
Labour hours per unit 0.20 0.25 0.40
Material kg per unit 1.0 1.1 1.3
Kilowatt hours per unit(kwhr) 0.5 0.6 0.8
Budgeted sales in units 10,000 6,000 2,000
Forecasted price (Rs) 15 20 40

8/3/2019 ama nov 09
http://slidepdf.com/reader/full/ama-nov-09 13/80

8/3/2019 ama nov 09
http://slidepdf.com/reader/full/ama-nov-09 14/80
14
Direct materials used were 8,800 kilograms. The standard direct materials input allowed
for one output unit is 2 kilograms at Rs. 15 per kilogram. S.T. purchased 10,000kilograms of materials at Rs. 16.50 per kilogram, a total of Rs. 1,65,000.
Actual direct manufacturing labour-hours were 6,500 at a tota l cost of Rs. 1,32,600.
Standard manufacturing labour time allowed is 1.5 hours per output unit, and the
standard direct manufacturing labour cost is Rs. 20 per hour.
Required:
1. Calculate the direct materials price variance and efficiency variance, and the direct
manufacturing labour price variance and efficiency variance. Base the direct
materials price variance on a flexible budget for actual quantity purchased, but base
the direct materials efficiency variance on a flexible budget for actual quantity used.
2. Prepare journal entries for a standard costing system that isolates variances at theearliest possible time.
Costing of Servic e Sector
18. An airline company operates a single aircraft from station A to Station B. It is licensed to
operate 3 flights in a week each way thereby making a total of 312 flights in a year. While
the seating capacity of the aircraft is 160 passengers, the average number of passengers
actually caused per flight is 120 only. The fare charged per passenger for one way flight
is Rs.8000. The cost data are as under:
Variable fuel costs per flight Rs.1,60,000
Food served on board the flight (not charged to
passengers)
Rs.200 per passenger
Commission paid to travel agents (on an average 80%
of the seats are booked through travel agents
5% of fare
Fixed annual lease costs allocated to each flight Rs.4,00,000 per flight
Fixed ground and landing charges Rs.1,00,000 per flight
Fixed salaries of flight crew allocated to each flight Rs.60,000 per flight
Required:
(i) Compute the operating income on each one-way flight between stations A and B.
(ii) The company has been advised that in case the fare is reduced to Rs.7500 per
flight per passenger, the average number of passengers per flight will increase to
132. Should this proposal be implemented? Show your calculations.

8/3/2019 ama nov 09
http://slidepdf.com/reader/full/ama-nov-09 15/80
15
Transfer Prici ng
19. L Ltd. and M Ltd. are subsidiaries of the same group of companies. L Ltd. produces a
branded product sold in drums at a price of Rs. 20 per drum.
Its direct product costs per drum are:
Raw material from M Ltd.: At a transfer price of Rs. 9 for 25 litres.
Other products and services from outside the group: At a cost of Rs. 3.
L Ltd.’s fixed costs are Rs. 40,000 per month. These costs include process labour whose
costs will not alter until L Ltd.’s output reaches twice its present level.
A market research study has indicated that L Ltd. ’s market could increase by 80% in
volume if it were to reduce its price by 20%.
M Ltd. produces a fairly basic product, which can be converted into a wide range of end
products. It sells one third of its output to L Ltd. and the remainder to customers outside
the group.
M Ltd.’s production capacity is 10,00,000 kilolitres per month, but competition is keen
and it budgets to sell no more than 7,50,000 kilolitres per month for the year ending 31
December.
Its variable costs are Rs. 0.20 per Kilolitre and its fixed costs are Rs. 60,000 per month.
The current policy of the group is to use market prices, where known, as the transfer
price between its subsidiaries. This is the basis of the transfer prices between M Ltd. and
L Ltd.
You are required to calculate
(a) the monthly profit position for each of L Ltd. and M Ltd. if the sales of L Ltd. are
(i) at their present level, and
(ii) at the higher potential level indicated by the market research, subject to a cutin price of 20%.
(b) (i) Explain why the use of a market price as the transfer price produces difficulties
under the conditions outlined in (a) (ii) above;
(ii) Explain briefly, as Chief Accountant of the group, what factors you would
consider in arriving at a proposal to overcome these difficulties;
Uniform Costing : Inter-Firm Comparison
20. Describe the requisites to be considered while installing a system of inter-firm
comparison by an industry.

8/3/2019 ama nov 09
http://slidepdf.com/reader/full/ama-nov-09 16/80
16
Cost Sheet, Profitabili ty Analysis & Reporting : The Balance Scorecard
21. (a) What do you understand by a Balanced Scorecard? Give reasons why BalancedScorecards sometimes fail to provide for the desired results. Do you think that such
a scorecard is useful for external reporting purposes?
(b) Kitchen King company makes a high-end kitchen range hood ‘Maharaja’. The
company presents the data for the year 2007 and 2008:
2007 2008
1. Units or maharaja produced and sold 40,000 42,000
2. Selling Price per unit in Rs. 1,000 1,100
3. Total Direct Material (Square feet) 1,20,000 1,23,000
4. Direct material cost per square feet in Rs. 100 110
5. Manufacturing Capacity (in units) 50,000 50,000
6. Total Conversion cost in Rs. 1,00,00,000 1,10,00,000
7. Conversion cost per unit of capacity (6)/(5) 200 220
8. Selling and customer service capacity 300customer
290customer
9. Total selling and customer service cost in Rs. 72,00,000 72,50,000
10. Cost per customer of selling and customer service capacity (9)/(8)
24,000 25,000
Kitchen King produces no defective units, but it reduces direct material used per
unit in 2008. Conversion cost in each year depends on production capacity definedin terms of Maharaja units that can be produced. Selling and Customer service cost
depends on the number of customers that the selling and service functions are
designed to support. Kitchen King has 230 customers in 2007 and 250 customers
in 2008.
You are required
1. Describe briefly key elements that would include in Kitchen King’s Balance
Score Card.
2. Calculate the Growth, Price-recovery and productivity component that explain
the change in operating income from 2007 to 2008.
Cost Sheet, Profitability Analysis & Reporting : Product Cost Sheet & ProfitabilityAnalysis
22. EXE Wood Company is a metal and woodcutting manufacturer, selling products to the
home construction market. Consider the following data for 2008:

8/3/2019 ama nov 09
http://slidepdf.com/reader/full/ama-nov-09 17/80
17
Rs.
Sandpaper 1,000
Materials-handling costs 35,000
Lubricants and coolants 2,500
Miscellaneous indirect manufacturing labour 20,000
Direct manufacturing labour 1,50,000
Direct materials inventory, Jan. 1, 2008 20,000
Direct materials inventory, Dec. 31, 2008 25,000
Finished goods inventory, Jan. 1, 2008 50,000
Finished goods inventory, Dec. 31, 2008 75,000
Work in process inventory, Jan. 1, 2008 5,000Work in process inventory, Dec. 31, 2008 7,000
Plant-leasing costs 27,000
Depreciation – plant equipment 18,000
Property taxes on plant equipment 2,000
Fire insurance on plant equipment 1,500
Direct materials purchased 2,30,000
Revenues 6,80,000
Marketing promotions 30,000
Marketing salaries 50,000Distribution costs 35,000
Customer-service costs 50,000
Required:
1. Prepare an income statement with a separate supporting schedule of cost of goods
manufactured. For all manufacturing items, classify costs as direct costs or indirectcosts and indicate by V or F whether each is basically a variable cost or a fixed cost
(when the cost object is a product unit). If in doubt, decide on the basis of whether
the total cost will change substantially over a wide range of units produced.
2. Suppose that both the direct material costs and the plant-leasing costs are for theproduction of 4,50,000 units. What is the direct material cost of each unit produced
? What is the plant-leasing cost per unit ? Assume the plant-leasing cost is a fixed
cost.

8/3/2019 ama nov 09
http://slidepdf.com/reader/full/ama-nov-09 18/80
18
3. Suppose EXE Wood Company manufactures 5,00,000 units next year. Repeat the
computation in requirement 2 for direct materials and plant-leasing costs. Assumethe implied cost-behaviour patterns persist.
Linear Programming
23. Using Simplex Method to solve the following L.P.P.
Minimize1 2
2 Z x x
Subject to
1 23 3 x x
1 24 3 6 x x
1 22 3 x x
1 2, 0 x x .
Linear Programming
24. Solve graphically the following L.P.P.
Maximize Z =1 2 x x
Subject to1 22 x x 1
1 x 2
1 2 x x 3
1 2, x x 0.
Transportation Problem
25. Find the optimum solution of the following transportations problem.
The Assignment Problem
26. Find the assignment of salesman to district that will result in maximum sales.

8/3/2019 ama nov 09
http://slidepdf.com/reader/full/ama-nov-09 19/80
19
Critical Path Analysis and PERT
27. A project schedule has the following characteristic
(i) construct the network
(ii) compute E and L per each event, and
(ii i) find critical path.
Critical Path Analysis and PERT
28. The following tables gives data on normal time and cost and crash time and cost for a
project.
(a) Draw the network and identity the critical path.
(b) What is the normal project duration and associated cost ?
(c) Find out total float for each activity.
(d) Crash the relevant activities systematically and determine the optimum project timeand cost.
Salesmen

8/3/2019 ama nov 09
http://slidepdf.com/reader/full/ama-nov-09 20/80
20
4220
Indirect costs are Rs. 50 per week.
Simulation
29. A car manufacturing company manufacturers 40 cars per day. The sale of cars depends
upon demand which has the following distribution.
Sales of Cars Probability
37 0.10
38 0.15
39 0.20
40 0.35
41 0.15
42 0.05
The production cost and sale price of each car are Rs. 4 lakhs and Rs. 5 lakhs
respectively. Any unsold car is to be disposed off at a loss of Rs. 2 lakhs per car. There
8/3/2019 ama nov 09
http://slidepdf.com/reader/full/ama-nov-09 21/80
21
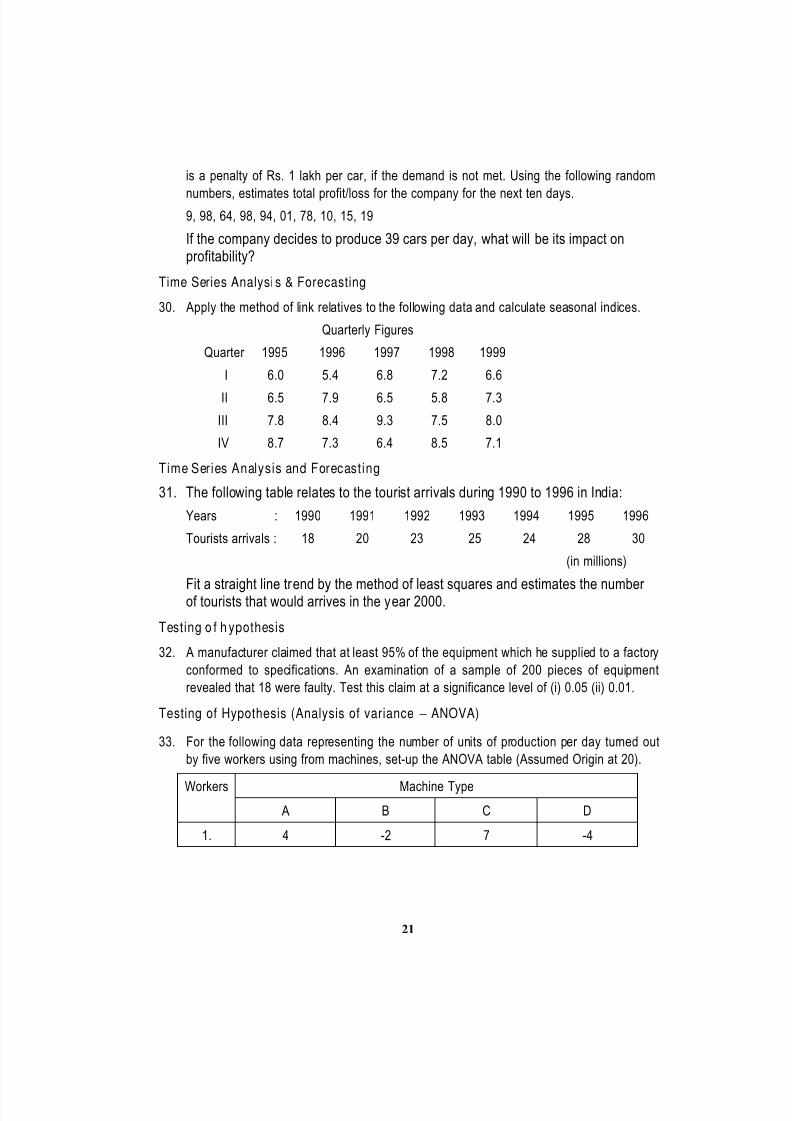
is a penalty of Rs. 1 lakh per car, if the demand is not met. Using the following random
numbers, estimates total profit/loss for the company for the next ten days.9, 98, 64, 98, 94, 01, 78, 10, 15, 19
If the company decides to produce 39 cars per day, what will be its impact onprofitability?
Time Series Analysi s & Forecasting
30. Apply the method of link relatives to the following data and calculate seasonal indices.
Quarterly Figures
Quarter 1995 1996 1997 1998 1999
I 6.0 5.4 6.8 7.2 6.6
II 6.5 7.9 6.5 5.8 7.3
III 7.8 8.4 9.3 7.5 8.0
IV 8.7 7.3 6.4 8.5 7.1
Time Series Analysis and Forecasting
31. The following table relates to the tourist arrivals during 1990 to 1996 in India:
Years : 1990 1991 1992 1993 1994 1995 1996
Tourists arrivals : 18 20 23 25 24 28 30
(in millions)
Fit a straight line trend by the method of least squares and estimates the number of tourists that would arrives in the year 2000.
Testing o f h ypothesis
32. A manufacturer claimed that at least 95% of the equipment which he supplied to a factory
conformed to specifications. An examination of a sample of 200 pieces of equipment
revealed that 18 were faulty. Test this claim at a significance level of (i) 0.05 (ii) 0.01.
Testing of Hypothesis (Analysis of variance ANOVA)
33. For the following data representing the number of units of production per day turned out
by five workers using from machines, set-up the ANOVA table (Assumed Origin at 20).
Machine TypeWorkers
A B C D
1. 4 -2 7 -4

8/3/2019 ama nov 09
http://slidepdf.com/reader/full/ama-nov-09 22/80
22
2. 6 0 12 3
3. -6 -4 4 -8
4. 3 -2 6 -7
5. -2 2 9 -1
Testing of Hypothesis (Chi-Square Distribut ion)
34. Given below in the contingency table for production is three shifts and the number of
defective good turn out- Find the value of C. It is possible that the number defective
goods depends on the shifts then by them, No of Shifts:
Shift I Week II Week III Week Total
I 15 5 20 40
II 20 10 20 50
III 25 15 20 60
60 30 60 150
SUGGESTED ANSWERS / HINTS
Developments in the Business Environment: Total Quality Management & Value
Chain Analysi s
1. (a) To tal Qual it y Management: Traditional focus was primarily on the financialperformance of an organisation. Now a days it is crucial for organisation to monitor performance in many non financial areas as well. For many companies, quality is atthe forefront of the area in which non financial performance is critically important.Monitoring product quality coupled with measuring and reporting quality costs helpscompanies program of total quality management (TQM) . TQM refers to the broadset of management and control processes designed to focus the entire organisationand all of its employees on providing products or services that do the best possible job of sat isfying the customers.
Six Cs of TQM
(i) Commitment - If a TQM culture is to be developed, so that quality improvement
becomes normal part of everyone's job, a clear commitment, from the top mustbe provided. Without this all else fails.
(ii) Culture - Training lies at the centre of effecting a change -in culture and attitudes.
Negative perceptions must be changed to encourage individual contributions.
8/3/2019 ama nov 09
http://slidepdf.com/reader/full/ama-nov-09 23/80

8/3/2019 ama nov 09
http://slidepdf.com/reader/full/ama-nov-09 24/80
24
2. (a) Target Costing: It is a management tool used for reducing a product cost over its
entire life cycle. It is driven by external Market factors. Marketing management prior to designing and introducing a new product determines a target market price. Thistarget price is set at a level that will permit the company to achieve a desired market
share and sales volume. A desired profit margin is then deducted to determine the
target maximum allowable product cost. Target costing also develops methods for
achieving those targets and means to test the cost effectiveness of different cost-cutting scenarios.
Stages of Target Costing:
1. Conception (planning) Phase: Under this stage of life cycle, competitors
products are to be analysed, with regard to price, quality, service and support,delivery and technology. The features which consumers would like to have like
consumer value etc. established. After preliminary testing, the company may
be asked to pinpoint a market niche, it believes, is under supplied and which
might have some competitive advantage.
2. Development phase: The design department should select the most
competitive product in the market and study in detail the requirement of
material, manufacturing process along with competitors cost structure. The
firm should also develop estimates of internal cost structure based on internalcost of similar products being produced by the company. If possible the
company should develop both the cost structures (competitors and own) in
terms of cost drivers for better analysis and cost reduction.
3. Pro du cti on p hase: This phase concentrates its search for better and lessexpensive products, cost benefit analysis in different features of a product
priority wise, more towards less expensive means of production, as well asproduction techniques etc.
(b) Total life cycle costing approach: Life cycle costing estimates, tracks and
accumulates the costs over a product’s entire life cycle from its inception to
abandonment or from the initial R & D stage till the final customer servicing and
support of the product. It aims at tracing of costs and revenues on product by
product basis over several calendar periods throughout their life cycle. Costs are
incurred along the product’s life cycle starting from product’s design, development,
manufacture, marketing, servicing and final disposal. The objective is to
accumulate all the costs over a product life cycle to determine whether the profits
earned during the manufacturing phase will cover the costs incurred during the pre
and post manufacturing stages of product life cycle.
Product life cycle costing is important for the following reasons:
(i) When non-production costs like costs associated with R & D, design,
marketing, distribution and customer service are significant, it is essential to

8/3/2019 ama nov 09
http://slidepdf.com/reader/full/ama-nov-09 25/80
25
identify them for target pricing, value engineering and cost management. For
example, a poorly designed software package may involve higher costs onmarketing, distribution and after sales service.
(ii) There may be instances where the pre-manufacturing costs like R & D anddesign are expected to constitute a sizeable portion of life cycle costs. When
a high percentage of total life cycle costs are likely to be so incurred before the
commencement of production, the firm needs an accurate prediction of costsand revenues during the manufacturing stage to decide whether the costly R &
D and design activities should be undertaken.
(iii) Many costs are locked in at R & D and design stages. Locked in or Committed
costs are those costs that have not been incurred at the initial stages of R & Dand design but that will be incurred in the future on the basis of the decisions
that have already been taken. For example, the adoption of a certain design
will determine the product’s material and labour inputs to be incurred during
the manufacturing stage. A complicated design may lead to greater expenditure on material and labour costs every time the product is produced.
Life cycle budgeting highlights costs throughout the product life cycle and
facilitates value engineering at the design stage before costs are locked in.
Total life-cycle costing approach accumulates product costs over the valuechain. It is a process of managing all costs along the value chain starting from
product’s design, development, manufacturing, marketing, service and finally
disposal.
Developments in the Business Environment: Just in Time ( JIT) & Concept of Back
Flushing in JIT
3. (a) Traditional accounting systems record the flow of inventory through elaborate
accounting procedures. Such systems are required in those manufacturingenvironment where inventory/WIP values are large. However, since JIT systems
operate in modern manufacturing environment characterized by low inventory and
WIP values, usually also associated with low cost variances, the requirements of such elaborate accounting procedures does not exist.
Back flushing requires no data entry of any kind until a finished product is
completed. At that time the total amount finished is entered into the computer
system which is multiplied by all components as per the Bill of materials (BOM) for each item produced. This yields a lengthy list of components that should have been
used in the production process and this is subtracted from the opening stock to
arrive at the closing stock to arrive at the closing stock/inventory.
The problems with back flushing that must be corrected before it works properly are:
(i) The total production quantity entered into the system must be absolutely correct, if
not, then wrong components and quantities will be subtracted from the stock.
8/3/2019 ama nov 09
http://slidepdf.com/reader/full/ama-nov-09 26/80
26
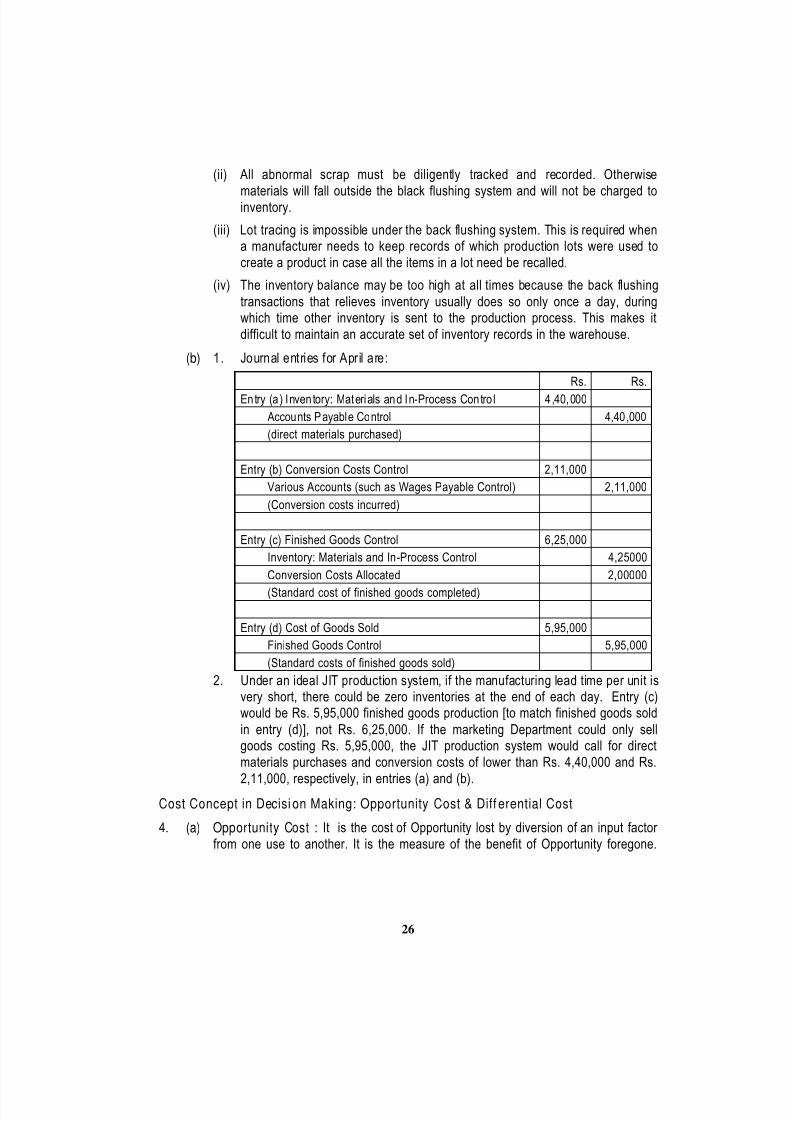
(ii) All abnormal scrap must be diligently tracked and recorded. Otherwise
materials will fall outside the black flushing system and will not be charged toinventory.
(iii) Lot tracing is impossible under the back flushing system. This is required whena manufacturer needs to keep records of which production lots were used to
create a product in case all the items in a lot need be recalled.
(iv) The inventory balance may be too high at all times because the back flushing
transactions that relieves inventory usually does so only once a day, duringwhich time other inventory is sent to the production process. This makes it
difficult to maintain an accurate set of inventory records in the warehouse.
(b) 1. Journal entries for April are:
Rs. Rs.
Entry (a ) Inventory: Materials and In-Process Contro l 4 ,40,000
Accounts Payable Control 4,40,000
(direct materials purchased)
Entry (b) Conversion Costs Control 2,11,000
Various Accounts (such as Wages Payable Control) 2,11,000
(Conversion costs incurred)
Entry (c) Finished Goods Control 6,25,000
Inventory: Materials and In-Process Control 4,25000
Conversion Costs Allocated 2,00000
(Standard cost of finished goods completed)
Entry (d) Cost of Goods Sold 5,95,000
Finished Goods Control 5,95,000
(Standard costs of finished goods sold)
2. Under an ideal JIT production system, if the manufacturing lead time per unit isvery short, there could be zero inventories at the end of each day. Entry (c)would be Rs. 5,95,000 finished goods production [to match finished goods sold
in entry (d)], not Rs. 6,25,000. If the marketing Department could only sellgoods costing Rs. 5,95,000, the JIT production system would call for direct
materials purchases and conversion costs of lower than Rs. 4,40,000 and Rs.
2,11,000, respectively, in entries (a) and (b).Cost Concept in Decisi on Making: Opportunity Cost & Diff erential Cost
4. (a) Opportunity Cost : It is the cost of Opportunity lost by diversion of an input factor
from one use to another. It is the measure of the benefit of Opportunity foregone.

8/3/2019 ama nov 09
http://slidepdf.com/reader/full/ama-nov-09 27/80
27
The introduction of opportunity cost concept is helpful to the management in making
profitability calculations when one or more of the inputs required by one or more of the alternative courses of action are already available. These inputs maynevertheless have a cost and this is measured by the sacrifice made by the
alternative action chosen or the cost that is given up in order to make them
available for the current proposal.
The examples of Opportunity cost are :-
(i) The opportunity cost of using a machine to produce a particular product is theforegone earnings that would have been possible if the machine was used to
produce other products.
(ii) The opportunity cost of funds invested in a business is the interest that could
have been earned by investing the funds in alternative avenues say Bank
deposit.(iii) The opportunity cost of one’s time is the salary which he would have earned by
his profession.
(b) The differential cost technique is used for making the following managerial
decisions:
(i) Whether to process a product further or not: Many companies manufacture
certain products which can be sold as such or can be subjected to further
processing. It is also possible that waste emanating from one operation can besold after further processing. In such cases, the matter for consideration is
whether the incremental revenues arising from further processing is sufficientto cover the incremental cost involved.
(ii) Dropping or adding a product line: Often a firm manufacturing a number of products may find that one or more of its products are not profitable. In such
cases, the firm may have two alternatives as under :-
(iii) To drop the non-remunerative product and leave the capacity unutilized.
(iv) To drop the non-remunerative product and to utilize the capacity freed to
manufacture of a more remunerative product.
(c) (i) The relevant costs in this case are the ones that will change if the special
order is accepted. These include the variable costs, which are:
Direct materials
Direct labour Variable manufacturing overhead
Variable selling and administrative expenses*
*Some of the usual variable selling and administrative expenses may not be
8/3/2019 ama nov 09
http://slidepdf.com/reader/full/ama-nov-09 28/80
28
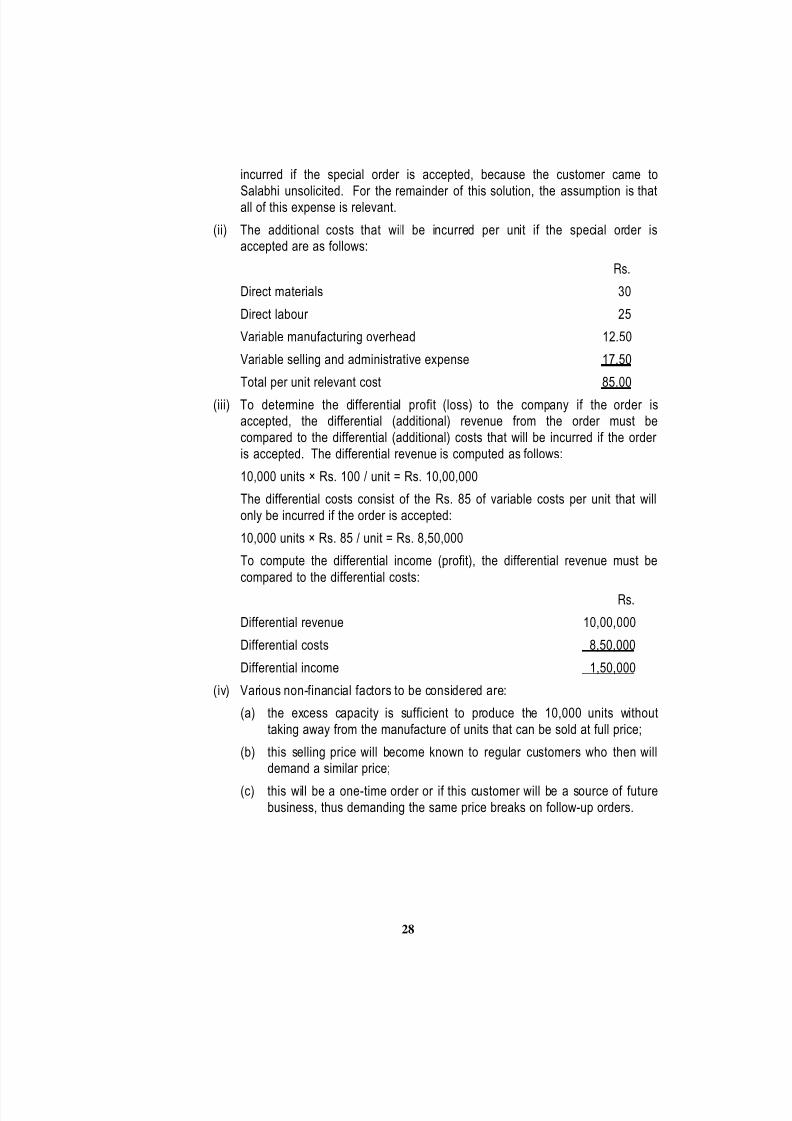
incurred if the special order is accepted, because the customer came to
Salabhi unsolicited. For the remainder of this solution, the assumption is thatall of this expense is relevant.
(ii) The additional costs that will be incurred per unit if the special order isaccepted are as follows:
Rs.
Direct materials 30
Direct labour 25
Variable manufacturing overhead 12.50
Variable selling and administrative expense 17.50
Total per unit relevant cost 85.00
(iii) To determine the differential profit (loss) to the company if the order isaccepted, the differential (additional) revenue from the order must be
compared to the differential (additional) costs that will be incurred if the order
is accepted. The differential revenue is computed as follows:
10,000 units × Rs. 100 / unit = Rs. 10,00,000
The differential costs consist of the Rs. 85 of variable costs per unit that will
only be incurred if the order is accepted:
10,000 units × Rs. 85 / unit = Rs. 8,50,000
To compute the differential income (profit), the differential revenue must be
compared to the differential costs:
Rs.
Differential revenue 10,00,000
Differential costs 8,50,000
Differential income 1,50,000
(iv) Various non-financial factors to be considered are:
(a) the excess capacity is sufficient to produce the 10,000 units without
taking away from the manufacture of units that can be sold at full price;
(b) this selling price will become known to regular customers who then willdemand a similar price;
(c) this will be a one-time order or if this customer will be a source of futurebusiness, thus demanding the same price breaks on follow-up orders.
8/3/2019 ama nov 09
http://slidepdf.com/reader/full/ama-nov-09 29/80
29
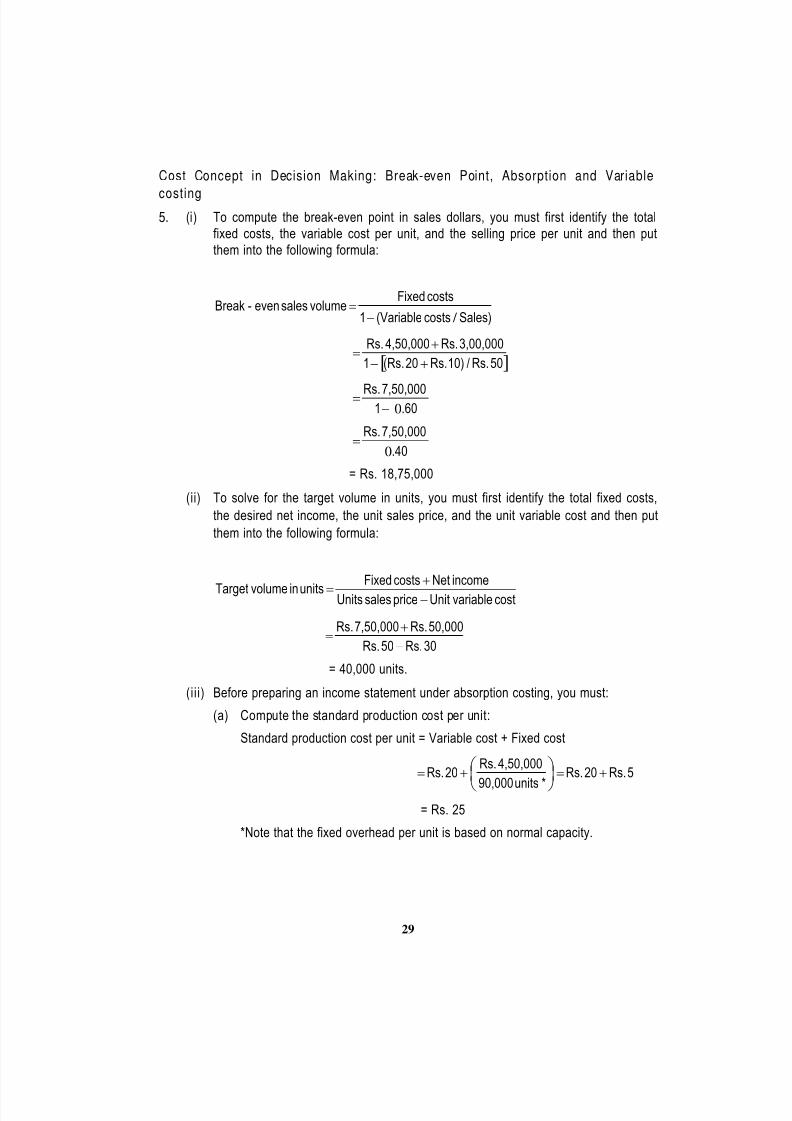
Cost Concept in Decision Making: Break-even Point, Absorption and Variable
costing5. (i) To compute the break-even point in sales dollars, you must first identify the total
fixed costs, the variable cost per unit, and the selling price per unit and then put
them into the following formula:
Sales)costs(Variable1
costsFixedvolumesaleseven-Break
/
50Rs./10)Rs.20(Rs.1
3,00,000Rs.4,50,000Rs.
.6017,50,000Rs.
0
.40
7,50,000Rs.
0
= Rs. 18,75,000
(ii) To solve for the target volume in units, you must first identify the total fixed costs,
the desired net income, the unit sales price, and the unit variable cost and then put
them into the following formula:
costvariableUnitpricesalesUnits
incomeNetcostsFixedunitsinvolumeTarget
30Rs.50Rs.
50,000Rs.7,50,000Rs.
= 40,000 units.
(iii) Before preparing an income statement under absorption costing, you must:
(a) Compute the standard production cost per unit:
Standard production cost per unit = Variable cost + Fixed cost
5Rs.20Rs.
*units90,000
4,50,000Rs.20Rs.
= Rs. 25
*Note that the fixed overhead per unit is based on normal capacity.

8/3/2019 ama nov 09
http://slidepdf.com/reader/full/ama-nov-09 30/80
30
(b) Compute the ending inventory:
Beginning inventory 5,000
Add: Production 85,000
Inventory available for sale 90,000
Less: Sales 80,000
Ending inventory 10,000
(c) Determine the unfavourable volume variance:
Normal capacity 90,000
Actual Production 85,000
Volume variance in units 5,000
Fixed overhead per unit Rs. 5
Unfavourable volume variance Rs. 25,000
Amazing Products CompanyAbsorption Costing Income Statementfor the year ended December 31, 2008
Rs. Rs.
Sales (80,000 × Rs. 50) 40,00,000
Less: Difference
Beginning inventory (5,000 × Rs. 25) 1,25,000Cost of goods manufactured (85,000 × Rs. 25) 21,25,000
Goods available for sale 22,50,000
Closing inventory (10,000 × Rs. 25) 2,50,000
Cost of goods sold at standard cost 20,00,000
Add: Unfavourable volume variance 25,000
20,25,000
Gross Margin (Sales – Cost of Goods sold) 19,75,000
Selling expenses:
Variable (80,000 × Rs. 10) 8,00,000
Fixed 3,00,000 11,00,000
Net income (Gross Margin – Selling Expenses) 8,75,000

8/3/2019 ama nov 09
http://slidepdf.com/reader/full/ama-nov-09 31/80
31
Before preparing an income statement under variable, you must:
(a) Realise that the variable production cost per unit is only Rs. 20.
(b) Use the contribution margin format for your income statement, where
Sales – Variable cost of goods sold = Manufacturing margin
Manufacturing margin – Variable selling and administrative = contribution margin
Contribution margin – Fixed costs = Net income
Amazing Products CompanyVariable Income Statement
for the year ended December 31, 2008Rs. Rs.
Sales 40,00,000
Variable costs:
Beginning inventory (5,000 × Rs. 20) 1,00,000
Cost of goods manufactured (85,000 × Rs. 20 17,00,000
Goods available for sale 18,00,000
Ending inventory (10,000 × Rs. 20) 2,00,000
Variable cost of goods sold 16,00,000
The Manufacturing margin 24,00,000
Variable selling expenses (80,000 × Rs. 10) 8,00,000
Contribution margin 16,00,000
Fixed costs:
Fixed factory overhead 4,50,000
Fixed selling expense 3,00,000 7,50,000
Net income 8,50,000
Decision Making and Process Costing
6. (i) (a) Purchases:
P Q R
Upto Upto Any Equal to
1,20,000 kg 1,60,000 kg quantity 2,00,000 kg.
Price (Rs.) 10.00 11.20 11.60 11.00

8/3/2019 ama nov 09
http://slidepdf.com/reader/full/ama-nov-09 32/80
32
Variable transport cost (Rs.) 1.20 1.00 1.00 .00
Total 11.20 12.20 12.60 12.00
Plan I Quantity (kgs.) 1,20,000 80,000
Cost (Rs.) 13,44,000 9,76,000 Total 23,20,000
Plan II Quantity (kgs.) 2,00,000
Cost (Rs.) 24,00,000
Plan I being lesser in cost therefore it should be adopted, buy 1,20,000 kg from
P and 80,000 kg from Q.
Fixed transport cost being constant is not relevant to the decision.
(b) Kg.
Production: Process A Input 2,00,000
Loss 10% 20,000
Output 1,80,000
Process B Loss 5% 9,000
Final output 1,71,000
Sales K L M
Upto Upto 1,71,000 kg
80,000 kg 1,60,000 kgSelling Price Rs. 65.00 64.00 61.80
Discount 2% 1.30 1.28
Net selling price 63.70 62.72 61.80
Transport (V) 2.60 1.44
Net realisation 61.10 61.28 61.80
Plan I sell quantity 1,71,000 kg to M Sales Revenue (Rs.) 1,05,67,800
Plan II sell quantity (kgs.)11,000 to K 1,60,000 to L
(Rs.) 6,72,100 98,04,800 1,04,76,900Fixed delivery charges Rs. 5,000 12 60,000
Sales Revenue (Rs.) 1,04,16,900
Since sales realisation is greater on selling to M, entire quantity should be sold to M

8/3/2019 ama nov 09
http://slidepdf.com/reader/full/ama-nov-09 33/80
33
(ii) Costs & profit statement
Process A Kg. Rs.Raw materials 2,00,000 23,20,000Fixed transport 2,00,000Wages 22,00,000Overheads 9,56,000Total 56,76,00Sale of scrap 20,000 @ 1/- (20,000)
Net cost 1,80,000 56,56,000
Process B
Process A 1,80,000 56,56,000
Wages 21,00,000
Overheads 13,45,800
Total 1,80,000 91,01,800
Sale of scrap 9,000 @ 2/- (18,000)
Net cost 1,71,000 90,83,800
Net sales 1,05,67,800
Profit (Rs.) 14,84,000
CVP Analysis & Decision Making: Product Mix Decision s
7. (a) Preliminary calculations
Variable costs are quoted per acre, but selling prices are quoted per tonne.
Therefore, it is necessary to calculate the planned sales revenue per acre. The
calculation of the selling price and contribution per acre is as follows:
Potatoes Turnips Parsnips Carrots
(a) Yield per acre in tonnes 10 8 9 12
(b) Selling price per tonne Rs. 100 Rs. 125 Rs. 150 Rs. 135
(c) Sales revenue per acre,
(a)(b)
Rs. 1,000 Rs. 1,000 Rs. 1,350 Rs. 1,620
(d) Variable cost per acre Rs. 470 Rs. 510 Rs. 595 Rs. 660
(e) Contribution per acre(Sales – Variable cost)
Rs. 530 Rs. 490 Rs. 755 Rs. 960
8/3/2019 ama nov 09
http://slidepdf.com/reader/full/ama-nov-09 34/80
34
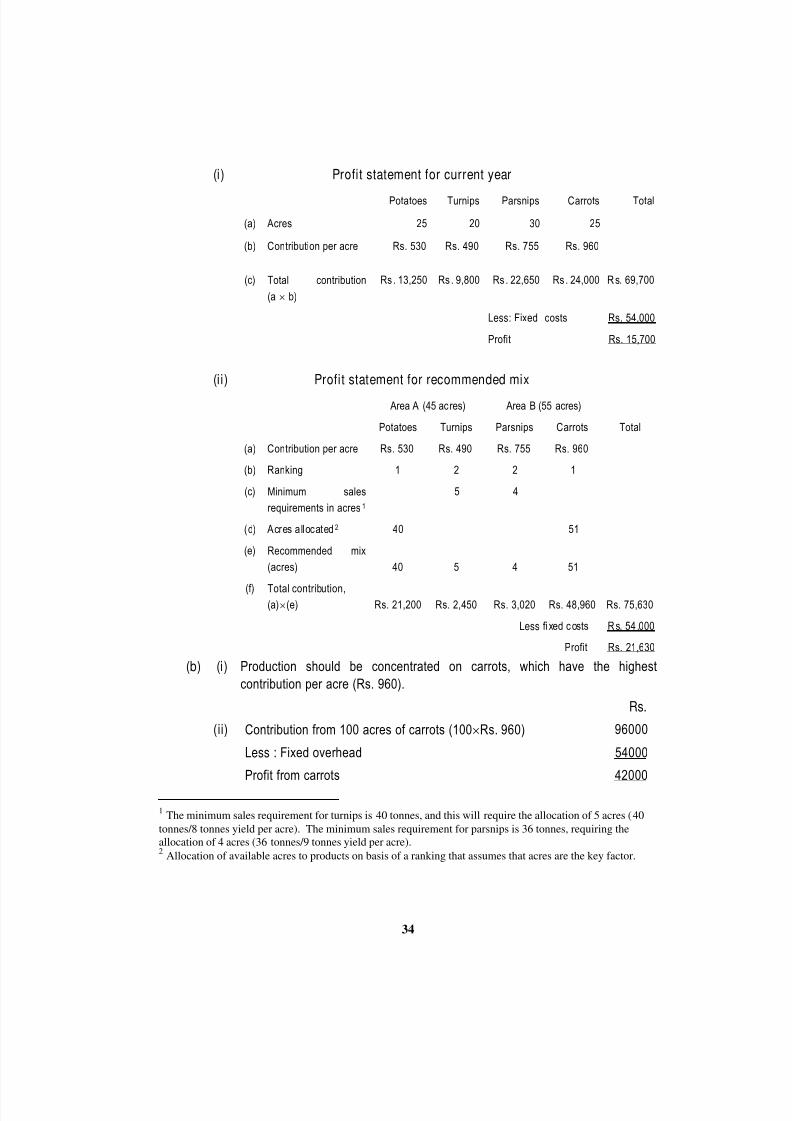
(i) Profit statement for current year
Potatoes Turnips Parsnips Carrots Total
(a) Acres 25 20 30 25
(b) Contribution per acre Rs. 530 Rs. 490 Rs. 755 Rs. 960
(c) Total contribution
(a b)
Rs . 13,250 Rs . 9,800 Rs . 22,650 Rs . 24,000 Rs. 69,700
Less: Fixed costs Rs. 54,000
Profit Rs. 15,700
(ii) Profit statement for recommended mix
Area A (45 acres) Area B (55 acres)
Potatoes Turnips Parsnips Carrots Total
(a) Contribution per acre Rs. 530 Rs. 490 Rs. 755 Rs. 960
(b) Ranking 1 2 2 1
(c) Minimum sales
requirements in acres1
5 4
(d) Acres allocated2 40 51
(e) Recommended mix
(acres) 40 5 4 51
(f) Total contribution,(a)(e) Rs. 21,200 Rs. 2,450 Rs. 3,020 Rs. 48,960 Rs. 75,630
Less fi xed costs Rs. 54 ,000
Profit Rs. 21,630
(b) (i) Production should be concentrated on carrots, which have the highest
contribution per acre (Rs. 960).
Rs.
(ii) Contribution from 100 acres of carrots (100Rs. 960) 96000
Less : Fixed overhead 54000
Profit from carrots 42000
1The minimum sales requirement for turnips is 40 tonnes, and this will require the allocation of 5 acres (40
tonnes/8 tonnes yield per acre). The minimum sales requirement for parsnips is 36 tonnes, requiring the
allocation of 4 acres (36 tonnes/9 tonnes yield per acre).2
Allocation of available acres to products on basis of a ranking that assumes that acres are the key factor.

8/3/2019 ama nov 09
http://slidepdf.com/reader/full/ama-nov-09 35/80
35
(iii) Break-even point in acres for carrots =960)(Rs.acreper oncontributi
54000)(Rs.costsfixed = 56.25 acres
Contribution in sales value for carrots
= Rs. 91125 (56.25 acres at Rs. 1620 sales revenue per acre).
CVP Analysis & Decisi on Making: Ac cepting & Rejecting an Order
8. (a) Costs incurred in the past, or revenue received in the past are not relevant becausethey cannot affect a decision about what is best for the future. Costs incurred to
date of Rs. 50,000 and revenue received of Rs. 15,000 are ‘sunk’ and should be
ignored.
(b) Similarly, the price paid in the past for the materials is irrelevant. The only relevantcost of materials affecting the decision is the opportunity cost of the revenue from
scrap which would be forgone – Rs. 2,000.
(c) Labour Costs
Rs.
Labour costs required to complete work 8,000
Opportunity costs : contribution forgone by losing other work Rs.(30,000 – 12,000)
18,000
Relevant cost of labour 26,000
(d) The incremental cost of consultancy from completing the work is Rs. 2,500
Rs.Cost of completing work 4,000
Cost of cancelling contract 1,500
Incremental cost of completing work 2,500
(e) Absorbed overhead is a notional accounting cost and should be ignored. Actual
overhead incurred is the only overhead cost to consider. General overhead costs
(and the absorbed overhead of the alternative work for the labour force) should be
ignored.
(f) Relevant costs may be summarised as follows.
Rs. Rs.Revenue from completing work 34,000
Less : Relevant costs
Materials: Opportunity cost 2,000
8/3/2019 ama nov 09
http://slidepdf.com/reader/full/ama-nov-09 36/80
36
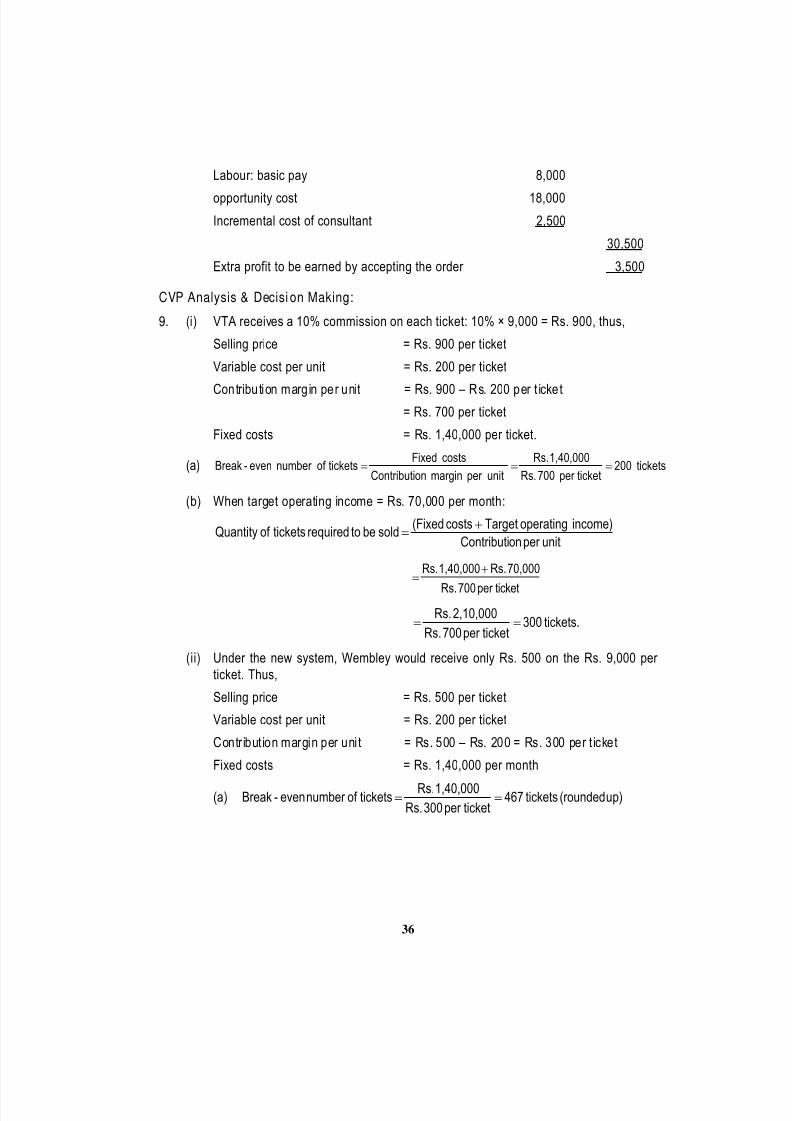
Labour: basic pay 8,000
opportunity cost 18,000
Incremental cost of consultant 2,500
30,500
Extra profit to be earned by accepting the order 3,500
CVP Analysis & Decisi on Making:
9. (i) VTA receives a 10% commission on each ticket: 10% × 9,000 = Rs. 900, thus,
Selling price = Rs. 900 per ticket
Variable cost per unit = Rs. 200 per ticket
Contribution margin per unit = Rs. 900 – Rs. 200 per t icket= Rs. 700 per ticket
Fixed costs = Rs. 1,40,000 per ticket.
(a) tickets200ticketper 700Rs.
1,40,000Rs.
unitper marginonContributi
costsFixedticketsof number even-Break
(b) When target operating income = Rs. 70,000 per month:
unitper onContributi
income)operatingTargetcosts(Fixedsoldbetorequiredticketsof Quantity
ticketper 700Rs.
70,000Rs.1,40,000Rs.
tickets.300ticketper 700Rs.
2,10,000Rs.
(ii) Under the new system, Wembley would receive only Rs. 500 on the Rs. 9,000 per
ticket. Thus,
Selling price = Rs. 500 per ticket
Variable cost per unit = Rs. 200 per ticket
Contr ibution margin per uni t = Rs. 500 – Rs. 200 = Rs. 300 per t icket
Fixed costs = Rs. 1,40,000 per month
(a) up)(roundedtickets467ticketper 300Rs.
1,40,000Rs.ticketsof number even-Break

8/3/2019 ama nov 09
http://slidepdf.com/reader/full/ama-nov-09 37/80
37
(b) tickets700ticketper 300Rs.
2,10,000Rs.soldbetorequiredticketsof Quantity
The Rs. 500 cap on the commission paid per ticket causes the break-even point to
more than double (from 200 to 467 tickets) and the tickets required to be sold to
earn Rs. 70,000 per month to also more than double (from 300 to 700 tickets). As
would be expected, travel agents reacted very negatively to the Dolphin Airlines
decision to change commission payments.
Pricing Decisions: Pricing of Finished Product
10. (i) Desired profit from the production and sale of product M =
Rs. 1,60,000 (Rs. 16,00,000 10%)
(ii) a. Total costs:Rs.
Variable (Rs. 25 80,000 units) 20,00,000
Fixed (Rs. 8,00,000 + Rs. 4,00,000) 12,00,000
Total 32,00,000
Cost per unit = Rs. 32,00,000 ÷ 80,000 units = Rs. 40.00
b.costsTotal
profitDesiredpercentageMarkup
5%32,00,000Rs.
1,60,000Rs.
c.
Rs.
Cost amount per unit 40.00
Markup (Rs. 40 5%) 2.00
Selling price 42.00
(iii) a. Total manufacturing costs:
Rs.
Variable (Rs. 20 80,000 units) 16,00,000
Fixed factory overhead 8,00,000
Total 24,00,000
Cost amount per unit: Rs. 24,00,000 ÷ 80,000 units = Rs. 30.00

8/3/2019 ama nov 09
http://slidepdf.com/reader/full/ama-nov-09 38/80
38
b.
costsingmanufactur Total
expensestiveadministraandsellingTotalprofitDesiredpercentageMarkup
24,00,000Rs.
units)80,0005(Rs.4,00,000Rs.1,60,000Rs.
24,00,000Rs.
4,00,000Rs.4,00,000Rs.1,60,000Rs.
40%24,00,000Rs.
9,60,000Rs.
c. Rs.
Cost amount per unit 30.00
Markup (Rs. 30 40%) 12.00
Selling price 42.00
(iv) a. Variable cost amount per unit = Rs. 25
Total variable costs = Rs. 25 80,000 units = Rs. 20,00,000
b.costsvariableTotal
costsfixedTotalprofitDesiredpercentageMarkup
20,00,000Rs.
4,00,000Rs.8,00,000Rs.1,60,000Rs.
68%20,00,000Rs.
13,60,000Rs.
c. Rs.
Cost amount per unit 25.00
Markup (Rs. 25 68%) 17.00
Selling price 42.00
(v) a. Proposal to Sell to XYZ Ltd.
Rs.
Differential revenue from accepting offer:
Revenue from sale of 4,000 additional units at Rs. 28 1,12,000
Differential cost from accepting offer:
Variable production costs of 4,000 additional units at Rs. 20 80,000
Differential income from accepting offer 32,000
b. The proposal should be accepted.

8/3/2019 ama nov 09
http://slidepdf.com/reader/full/ama-nov-09 39/80
39
Pricing Decisions: Computing Minimum Selling Price
11.
Particulars Year Year Year Year
0 1-5 6-10 10
Outflow (Rs.)
(Refer to working note 1)
80,000
Inflow
Sales volume (units)
(Refer to working note2)
10,000 7,000
Selling price (Rs.) X X
Total sales revenue : (Rs.) (A) 10,000X 7,000X
Cost
Materials and labour cost (Rs.) 6,00,000 4,20,000
Incremental fixed overhead
(Rs.)
1,12,500 1,12,500
Depreciation of machine (Rs.) 8,000 8,000
Total cost: (Rs.) (B) 7,20,500 5,40,500
Profit before tax : (Rs.) (A) – (B) (10,000X – 7 ,20,500) (7,000X -5,40,500)
Less : Tax @ 40% (4000 X 2,88,200) (2800 X 2,16,200)
Profit after tax beforedepreciation(Rs.)
(6000 X – 4,24,300) (4200 X – 3,16,300)
Salvage / Scrap (Rs.) 6,000
Values net of tax 43,152
Net Flows : ( C) (80000) (6000 X – 424300) (4200 X – 316300) (6,000 + 43,152)
DCF Factors: (D) 3.79 2.355 0.386
Discounted Value of Cash
Inflows: (C) (D)
(80,000) (6,000 X 4 ,24, 300) 3 .79 ( 4, 200 X 3,16,300)2.355 (6,000 + 43,152) 0.386
Sum of the discounted inflows:[22740 X + 9891 X] – [16,08,097 + 744887 ] + [ 2316 + 16657]
= [32631 X – 23,34,011]
Sum of the discounted cash outflows = Rs.80,000

8/3/2019 ama nov 09
http://slidepdf.com/reader/full/ama-nov-09 40/80
40
Net cash inflows:
= Rs.32,631 X Rs.23,34,011 Rs.80,000
Minimum selling price: For determining minimum selling price the net cash inflows should be
zero i.e.
32,631 X = Rs. 24,14,011
or X = Rs. 73.98 or (Rs.74)
Notes:
1. (i) Expenditure on R & D and consulting reports are treated as sunk costs.
(ii) Relevant cost of the machine is based on replenished purchased materials
= Rs. 50,000 + 40% of Rs.50,000 (increase) + labour cost
= Rs. 70,000 + Rs.10,000 = Rs. 80,000
2. Expected sales volume
1-5 yrs = (20000 0.1)+ (10,000 0.65) + (6000 0.25) = 10,000 units
6-10 yrs = (12000 0.2) + (8000 0.5) + (2000 0.3) = 7000 units
Pricing Decisions: Pareto Analysis
12. Let us rearrange the products in descending order of contribution and find out the
cumulative contribution percentage.
Product Contribution Cumulativecontribution
Cumulative contribution
(Rs.) (Rs.) (%)
C 1,500 1,500 60
A 500 2,000 80
B 200 2,200 88
F 125 2,325 93
E 100 2,425 97
D 75 2,500 100
2,500
On analysis it is found that 80% of the total contribution is earned by two products C and
A. The posit ion of these products needs protecting, perhaps through careful attention tobranding and promotion. The other products should be investigated to see whether their
contribution can be improved through increased prices, reduced costs, increased sales
volume, etc.
8/3/2019 ama nov 09
http://slidepdf.com/reader/full/ama-nov-09 41/80
41
Budget & Budgetary Control: Flexible Budget
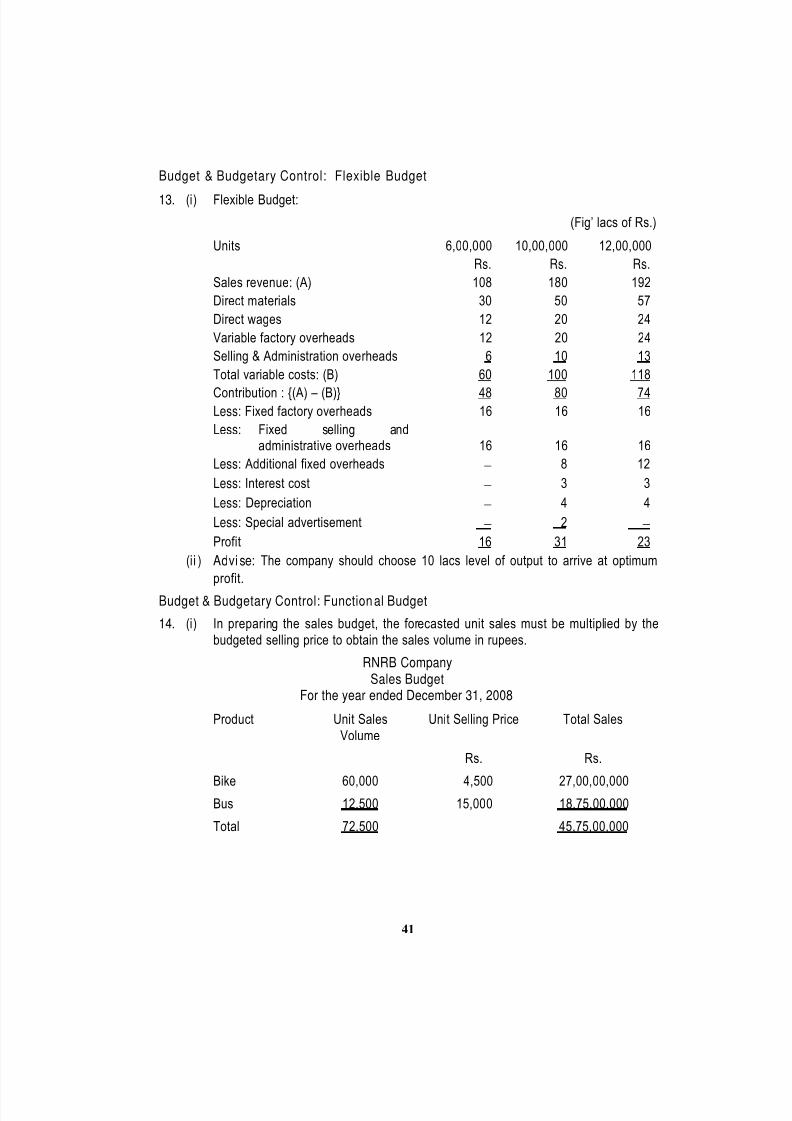
13. (i) Flexible Budget:
(Fig’ lacs of Rs.)
Units 6,00,000 10,00,000 12,00,000
Rs. Rs. Rs.
Sales revenue: (A) 108 180 192
Direct materials 30 50 57
Direct wages 12 20 24
Variable factory overheads 12 20 24
Selling & Administration overheads 6 10 13
Total variable costs: (B) 60 100 118
Contribution : {(A) – (B)} 48 80 74Less: Fixed factory overheads 16 16 16
Less: Fixed selling andadministrative overheads 16 16 16
Less: Additional fixed overheads 8 12
Less: Interest cost 3 3
Less: Depreciation 4 4
Less: Special advertisement 2 Profit 16 31 23
(ii ) Advi se: The company should choose 10 lacs level of output to arrive at optimum
profit.
Budget & Budgetary Control: Function al Budget
14. (i) In preparing the sales budget, the forecasted unit sales must be multiplied by the
budgeted selling price to obtain the sales volume in rupees.
RNRB CompanySales Budget
For the year ended December 31, 2008
Product Unit Sales
Volume
Unit Selling Price Total Sales
Rs. Rs.
Bike 60,000 4,500 27,00,00,000Bus 12,500 15,000 18,75,00,000
Total 72,500 45,75,00,000

8/3/2019 ama nov 09
http://slidepdf.com/reader/full/ama-nov-09 42/80
42
(ii) In preparing the production budget, the forecasted unit sales from the sales budget
are added to the desired ending inventory to determine the total units needed, thenthe estimated beginning inventory is deducted from that total to determine the unit
production needed.
RNRB CompanyProduction Budget
For the year ended December 31, 2008
Units
Bike tyres Bus tyres
Sales (from sales budget) 60,000 12,500
Plus desired ending inventory, Dec. 31 5,000 2,000
Total 65,000 14,500Less estimated beginning inventory, Jan. 1 6,000 2,500
Total production 59,000 12,000
(iii) In preparing the direct materials budget the quantities of materials needed for
production must be added to the desired ending inventory of materials to determine
the materials needed. Then, the estimated beginning inventory must be subtracted
from this total to determine the quantity of materials to be purchased.
RNRB Tyre CompanyDirect Materials Budget
For the year ended December 31, 2008
Direct Materials TotalRubber Steel Belts
(lbs.) (lbs.)
Quantities required for production:
Bike tyres:
59,000 × 15 lbs. 8,85,000
59,000 × 2.0 lbs. 1,18,500
Bus tyres:
12,000 × 35 lbs. 4,20,000
12,000 × 4.5 lbs. 54,000Plus desired endinginventory, Dec. 31
60,000 6,000
Total 13,65,000 1,78,000

8/3/2019 ama nov 09
http://slidepdf.com/reader/full/ama-nov-09 43/80
43
Less: Estimated beginning
inventory, Jan. 1
75,000 7,500
Total quantity to bepurchased
12,90,000 1,70,500
Unit price Rs. 150 Rs. 100
Total direct materialspurchases
Rs. 19,35,00,000 Rs. 1,70,50,000 Rs. 21,05,50,000
(iv) In preparing the direct labour budget the total direct labour hours that should be
worked on all products must be determined for each department, and then
multiplied by the wage rate for that department.
RNRB Tyre CompanyDirect Labour Budget
for the year ended December 31, 2008Department Total
Molding Finishing
Hours required for production:
Bike tyres:
59,000 × .10 5,900
59,000 × .05 2,950
Bus tyres:
12,000 × .20 2,400
12,000 × .10 1,200
Total 8,300 4,150
Hourly rate Rs. 650 Rs. 750
Total direct labour cost Rs. 53,95,000 Rs. 31,12,500 Rs. 85,07,500
(v) In this problem, the budgeted costs for each factory overhead item are given. In
practice, the challenge is to determine the variable and fixed components of semi-
variable factory overhead costs.
RNRB CompanyFactory Overhead Budget
for the year ended December 31, 2008
Rs.
Indirect materials 85,28,000
Indirect labour 79,40,000
Depreciation of building and equipment 49,16,000
Power and light 63,00,000
Total factory overhead cost 2,76,84,000

8/3/2019 ama nov 09
http://slidepdf.com/reader/full/ama-nov-09 44/80
44
(vi) The information from the direct materials, direct labour and factory overhead
budgets, in addition to data on desired beginning and ending inventories, is used toprepare the cost of goods sold budget.
RNRB CompanyCost of Goods Sold Budget
for the year ended December 31, 2008
Rs. Rs.
Finished goods inventory, Jan. 1 200,25,500
Direct materials inventory Jan. 11 1,20,00,000
Direct materials purchases 21,05,50,000
Total direct materials available 22,25,50,000
Less: Direct materials inventory, Dec. 312 96,00,000Cost of direct materials used 21,29,50,000
Direct labour 85,07,500
Factory overhead 2,76,84,000
Cost of goods manufactured 24,91,41,500
Cost of goods available for sale 26,91,67,000
Less: Finished goods inventory, Dec. 31 1,63,23,900
Cost of goods sold 25,28,43,100
1. Rubber 75,000 lbs. × 150 Rs. 1,12,50,000
Steel belts 7,500 lbs. × 100 7,50,000
Rs. 1,20,00,000
2. Rubber 60,000 lbs. × 150 Rs. 90,00,000
Steel belts 6,000 lbs. × 100 6,00,000
Rs. 96,00,000
Standard Costing : Variance Analysis
15. (i) (1) The fixed overhead volume variance shows the amount of over- or under absorption of fixed overheads based upon the actual level of output compared
with the budgeted level of output. The capacity utilisation component arises
because of the change in the level of output at a fixed (budgeted) overheadrate of absorption. The efficiency component occurs when the actual rate of
overhead absorption is greater or less than that budgeted for a given level of output. This may be illustrated by the following example.
8/3/2019 ama nov 09
http://slidepdf.com/reader/full/ama-nov-09 45/80
45
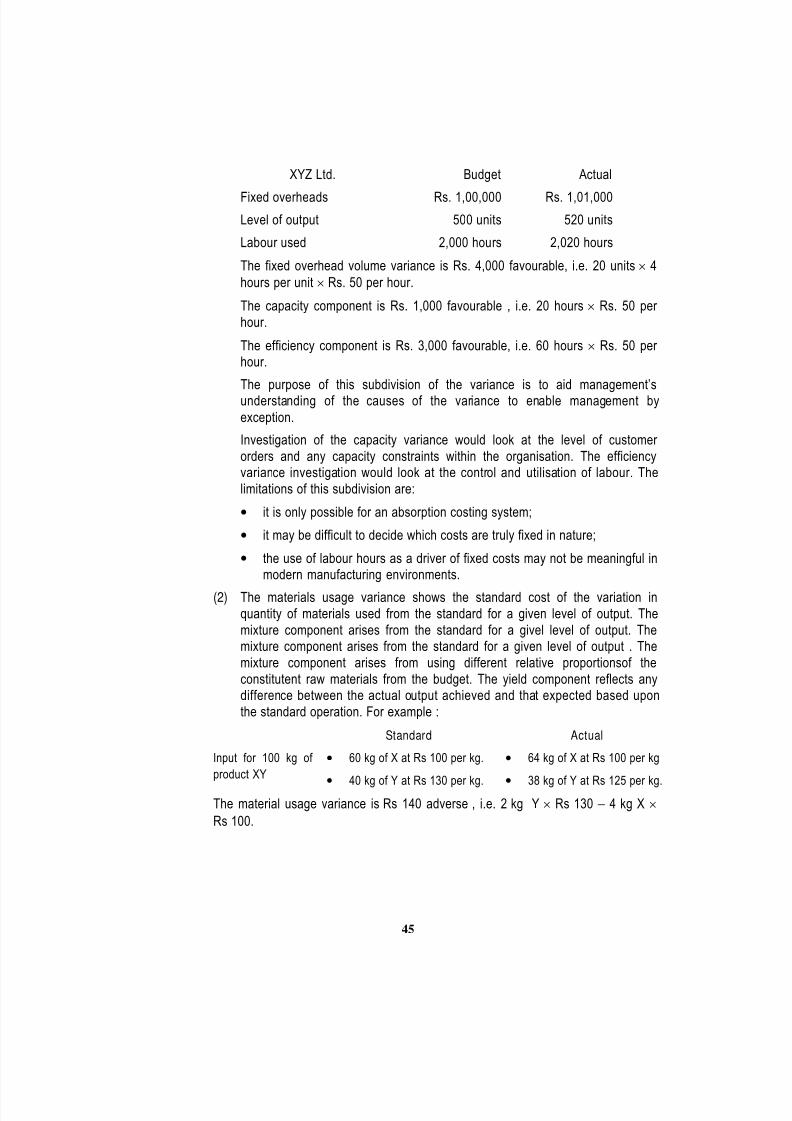
XYZ Ltd. Budget Actual
Fixed overheads Rs. 1,00,000 Rs. 1,01,000
Level of output 500 units 520 units
Labour used 2,000 hours 2,020 hours
The fixed overhead volume variance is Rs. 4,000 favourable, i.e. 20 units 4
hours per unit Rs. 50 per hour.
The capacity component is Rs. 1,000 favourable , i.e. 20 hours Rs. 50 per
hour.
The efficiency component is Rs. 3,000 favourable, i.e. 60 hours Rs. 50 per hour.
The purpose of this subdivision of the variance is to aid management’sunderstanding of the causes of the variance to enable management by
exception.
Investigation of the capacity variance would look at the level of customer
orders and any capacity constraints within the organisation. The efficiencyvariance investigation would look at the control and utilisation of labour. The
limitations of this subdivision are:
it is only possible for an absorption costing system;
it may be difficult to decide which costs are truly fixed in nature;
the use of labour hours as a driver of fixed costs may not be meaningful inmodern manufacturing environments.
(2) The materials usage variance shows the standard cost of the variation in
quantity of materials used from the standard for a given level of output. The
mixture component arises from the standard for a givel level of output. Themixture component arises from the standard for a given level of output . The
mixture component arises from using different relative proportionsof the
constitutent raw materials from the budget. The yield component reflects anydifference between the actual output achieved and that expected based upon
the standard operation. For example :
Standard Actual
Input for 100 kg of
product XY
60 kg of X at Rs 100 per kg.
40 kg of Y at Rs 130 per kg.
64 kg of X at Rs 100 per kg
38 kg of Y at Rs 125 per kg.The material usage variance is Rs 140 adverse , i.e. 2 kg Y Rs 130 4 kg X Rs 100.

8/3/2019 ama nov 09
http://slidepdf.com/reader/full/ama-nov-09 46/80
46
The material mixture component is Rs 84 favourable , i.e. 2.8 kg X Rs 130 2.8
kg X Rs 100.The material yeld component is Rs 224 adverse , i.e. 2 kg of XY at standard cost of
(0.6 100 + 0.4 130).
The purpose is the same for part (a). The limitation is that this model assumes that
there is no change in the quality of the product XY produced from different
proportions of X and Y . This is not likely to be true in actual practice where side
chemical reactions may become more prevalent which may render the product
unsuitable for its intended purpose. Investigation of the variances would consider:
Mixture variance : ingredients used , material control and wastage;
Yield variance : efficiency of equipment and the quality of materials used.
(3) The labour rate variance is the difference between the actual cost incurred for the
actual hours worked and the cost for working the actual amount of hours using the
budgeted labour rate. The operational component arises from any changes in the
rate of pay, which were a consequence of the way labour was operated, e.g.
allowing a discretionary extra payment for poor working conditions. The planning
component shows the change in labour rate due to inadequacies or inaccuracies in
the preparation of the original budget. For example, the anticipated annual pay rise
may have been different from that obtained from the workforce:
Actual hours worked 100
Actual wages paid Rs. 500
Original standard wage rate Rs. 4 per hor
Revised standard wage rate for the period Rs. 5.20 per hour
The labour rate variance is Rs 100 adverse i.e. (500 (4 100))
The operational component is Rs 20 favourable, i.e. (500 (5.20 100))
The planning component is Rs 120 adverse, i.e.(100 1.20)
Again, the purpose is the same as for part (a). The limitation for this subdivision is
that it is rare for there to be a controllable (operational) reason for the labour rate
variance. In general labour rates are fixed by the market place, i.e., they are
uncontrollable (planning) variances.
Thus, this subdivision is an unnecessary complication that will rarely provide aninsight which is an improvement on that provided by the labour rate variance.
However, any investigation would focus on the establishment of wage rates and

8/3/2019 ama nov 09
http://slidepdf.com/reader/full/ama-nov-09 47/80
47
labour recruitment, whereas investigation of the operational variance would look at
the actual payment of wages and control of payroll.(i i) (A ) Con tr ol Repor t
Code Fixed
budget
Flexible
Budget
Actua l Variances
7,500 units 6,750 units 6750
301 Sales salaries Rs. 30,000 Rs. 30,000 33,750 Rs. 3750 (A)
302 Staff Commission 30,000 27,000 28,500 1,500 (A)
303 Staff expenses 15,000 13,500 13,000 500 (F)
431 Underwriting Staff 45,000 40,500 50,000 9,500 (A)
599 Other Admin Costs 30,000 30,000 33,000 3,000 (A)
1,50,000 1,41,000 158,250 17,250 (A)
(B) Sales Salaries – Rs. 3,750 (A) Rate Variance is due to unanticipated pay
award.
Sales Commission – Rs. 3,000 (F) is due to drop in activity and Rs. 1,500 (A)may be due to increasing sales commission on selected policies or due to
inefficiency.
Sales Expenses – Rs. 1,500 reduction due to drop in activity and Rs. 500 (F)
for improved control.
Underwriting Salaries – Rs. 4,500 (F) due to drop in activity, Rs. 5062 (A) due
to unbudgeted salaries increases and Rs. 4,438 (A) due to inefficiency.Other Administration – Rs. 3,000 (A) seem to have been caused by changes
due to high cost suppliers or hiring temporary office staff.
Standard Costing : Variance Analysis
16. Computation of Standard Margin
Product 1 Product 2 Product 3
Selling Price Rs 15.00 Rs 20.00 Rs 40.00
Labour Rs 4.00 Rs 5.00 Rs 8.00
Material 4.00 4.40 5.20
Energy 3.00 3.60 4.80
Variable costs Rs 11.00 Rs 13.00 Rs 18.00
Contribution margin 4.00 7.00 22.00

8/3/2019 ama nov 09
http://slidepdf.com/reader/full/ama-nov-09 48/80
48
(a) Sales Activity Variance = (Actual output – Budgeted output) × Standard margin
= (12,000 – 10,000) × 4 + (5,500 – 6,000) × 7 +(1,800 – 2,000) × 22
= Rs. 100 Favourable
(b) Price –Recovery Variance = Sales Price Variance – Input Cost Variance
Where,
Sales Price Variance = (Actual price – Budgeted price) × Actual sales volume
Input cost variance = (Actual unit cost of input – Standard unit cost of input) ×
Actual inputs consumed.
Sales Price Variance = [(16 – 15) × 12,000 + (22 – 20) × 5,500 + (40 – 40) ×
1,800]= Rs. 23,000 Favourable
Input Cost Variance
Actual
unit costs
Budgeted
unit costs
Difference Actua l
Inputs
Input Cost
Variances
Labour 21.00 20 1 5,212 hr. Rs. 5,212
Materials 4.40 4 0.40 21,920 kg. 8,768
Energy (kw hr.) 5.80 6 – 0.20 10,633 kwhr (2,127)
Committed overhead 84,000 80,000 4,000 4,000Input cost variance Rs. 15,853
Hence Price Recovery Variance = Rs. 23,000 – Rs. 15,853
= Rs. 7,147 Favourable.
(c) Productivity Variance
Productivity Variance = (Std. Consumption @ actual output – Actual Consumption) x Std. Price
Standard consumption@actual output
Product1
Product2
Product3
Total ActualConsumption
Diff StdPrice
UsageVariance
Labour 2,400 1,375 720 4,495 5,212 717 Rs. 20 Rs.14,340
Material 12,000 6,050 2,340 20,390 21,920 1,530 4 6,120
Energy 6,000 3,300 1,440 10,740 10,633 - 107 6 (642)
Productivity Variance Rs.19,818

8/3/2019 ama nov 09
http://slidepdf.com/reader/full/ama-nov-09 49/80
49
Standard Costing : Variance Analysis
17. (1) Mater ial Var iance:
(i) Direct Material Price Variance = (Actual Input Quantity × Actual Price – ActualInput Quantity × Budgeted Price)
= (Rs. 16.50 – Rs. 15) 10,000 kg.
= Rs. 15,000 (A)
(ii) Direct Material Efficiency Variance
[Actual Input Quantity × Budgeted Price – Budgeted Input Quantity Allowed for
Actual Output × Budgeted Price]
= (8,800 kg. × Rs. 15 – 4,000 units × 2 kg. / unit × Rs. 15)
= Rs. 12,000 (A)
Labour Variance:
(i) Direct Manufacturing Labour Price Variance
(Actual Hours × Actual Rate – Actual Hours × Standard Rate)
= (6,500 hours × Rs. 20.40 – 6,500 hours × Rs. 20)
= Rs. 2,600 (A)
(ii) Direct Manufacturing Labour Efficiency Variance
(Actual Hours × Standard Rate – Budgeted Hours allowed for Actual Output ×
Standard Rate)
= (6,500 hours × Rs. 20 – 4,000 units × 1.50 hours / unit × Rs. 20)
= Rs. 10,000 (A)
(2) Journal Entries
Rs. Rs.
Material Control 1,50,000
Direct Material Price Variance 15,000
Accounts Payable Control 1,65,000
Work in Process Control 1,20,000
Direct Materials Efficiency Variance 12,000
Materials Control 1,32,000

8/3/2019 ama nov 09
http://slidepdf.com/reader/full/ama-nov-09 50/80
50
Work in Process Control 1,20,000
Direct Manufacturing Labour Price Variance 2,600
Direct Manufacturing Labour Eff ic iency Variance 10,000
Wages Payable Control 1,32,600
Costing of Servic e Sector
18.
(i) Per flight basis:
Rs.
Fare collection 9,60,000
120 Rs. 8000Commission (5% of 80% of 9,60,000) 38,400
Net fare 9,21,600
Expenses:
Fuel 1,60,000
Food (120 Rs. 200) 24,000
Total variable cost 1,84,000
Contribution 7,37,600
Less : Fixed costs:
Annual lease apport ioned 4,00,000
Ground handling charges 1,00,000
Crew salaries 60,000 5,60,000
Operating income 1,77,600
(ii) Calculation of profit as per given proposal:
Fare collections (132 Rs.7,500) 9,90,000
Commission (5% of 80% of 9,90,000) 39,600
Net fare 9,50,400
Expenses:
Fuel 1,60,000
Food (132 Rs.200) 26,400
Total variable cost 1,86,400
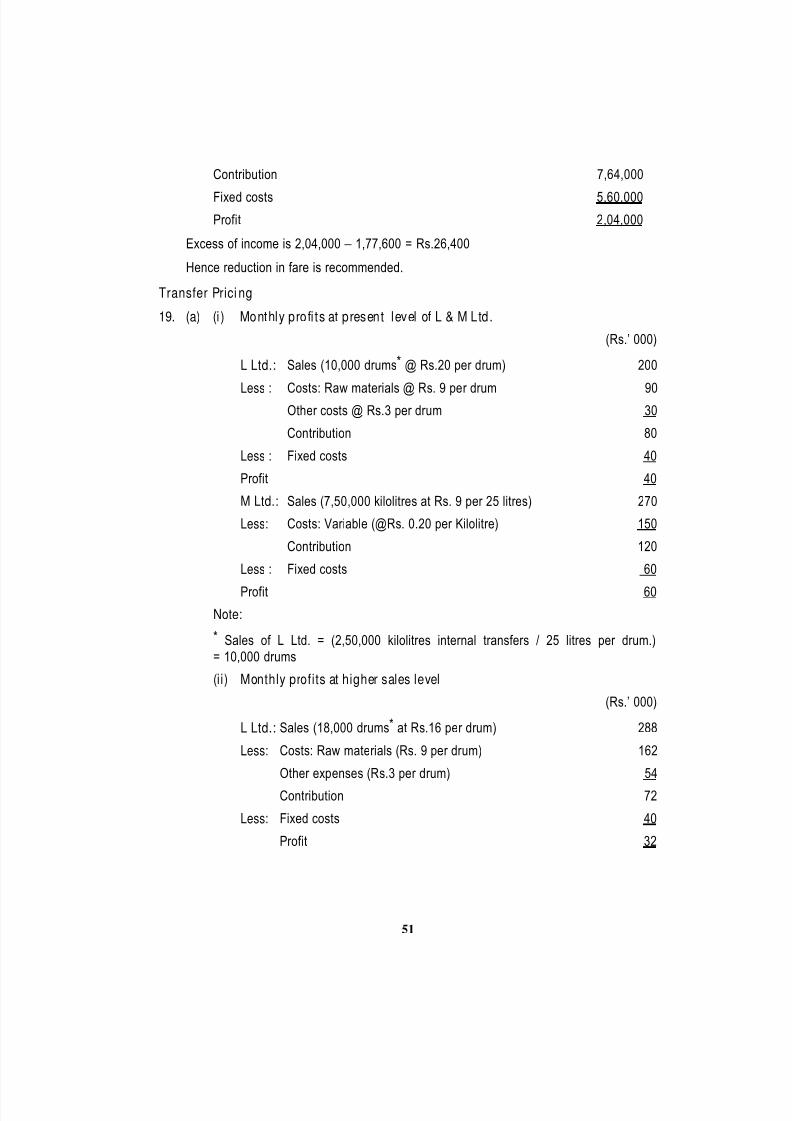
8/3/2019 ama nov 09
http://slidepdf.com/reader/full/ama-nov-09 51/80
51
Contribution 7,64,000
Fixed costs 5,60,000
Profit 2,04,000
Excess of income is 2,04,000 1,77,600 = Rs.26,400
Hence reduction in fare is recommended.
Transfer Prici ng
19. (a) (i ) Monthly profi ts at present level of L & M Ltd.
(Rs.’ 000)
L Ltd.: Sales (10,000 drums* @ Rs.20 per drum) 200
Less : Costs: Raw materials @ Rs. 9 per drum 90Other costs @ Rs.3 per drum 30
Contribution 80
Less : Fixed costs 40
Profit 40
M Ltd.: Sales (7,50,000 kilolitres at Rs. 9 per 25 litres) 270
Less: Costs: Variable (@Rs. 0.20 per Kilolitre) 150
Contribution 120
Less : Fixed costs 60
Profit 60
Note:
* Sales of L Ltd. = (2,50,000 kilolitres internal transfers / 25 litres per drum.)
= 10,000 drums
(ii) Monthly profits at higher sales level
(Rs.’ 000)
L Ltd.: Sales (18,000 drums* at Rs.16 per drum) 288
Less: Costs: Raw materials (Rs. 9 per drum) 162
Other expenses (Rs.3 per drum) 54
Contribution 72
Less: Fixed costs 40
Profit 32

8/3/2019 ama nov 09
http://slidepdf.com/reader/full/ama-nov-09 52/80
52
M Ltd. Sales (9,50,000 kilolitres* at Rs. 9 per 25 litres) 342
Costs: Variable (@ Rs.0.20 per kilolitre) 190
Contribution 152
Less : Fixed costs 60
Profit 92
Note:
* Internal transfers (18,000 drums of 25 litres per drum) plus 5,00,000 kilolitres
external sales.
(b) (i) The use of a market price as the transfer price produces difficulties because L
Ltd. is not motivated to reduce the selling price, in order to increase volume,
because its profit declines from Rs. 40,000 to Rs. 32,000. However, the profitsof M Ltd. increase from Rs. 60,000 to Rs. 92,000. Thus, the profits for the
company as a whole increase by Rs. 24,000. Hence the transfer price does
not encourage goal congruence in this particular situation.
(ii) In order to overcome the above difficulties, there is a need to offer someinducement to L Ltd. such that its profits will increase as a result of lowering
the selling price in order to increase volume. Factors to consider are the
following:
1. The significance of the loss in profits arising from the difference betweenprofits at the optimum output level and profits based on the output using
the current transfer pricing system.
2. Savings in selling and distribution costs arising from internal transferscompared with external sales. The savings per unit should be deductedfrom the market price.
Uniform Costing & Inter-Firm Comparison
20. Requisites of inter-firm comparison system: The following requisites should be
considered while installing a system of inter-firm comparison:–
1. Centre for Inter-Comparison ─ For collection and analysing data received from
member units, for doing a comparative study and for dissemination of the results of
study a Central body is necessary. The functions of such a body may be :–
(a) Collection of data and information from its members;
(b) Dissemination of results to its members;
(c) Undertaking research and development for common and individual benefit of its members;
(d) Organising training programmes and publishing magazines.
8/3/2019 ama nov 09
http://slidepdf.com/reader/full/ama-nov-09 53/80
53
2. Membership ─ Another requirement for the success of inter-firm comparison is that
the firms of different sizes should become members of the Centre entrusted with thetask of carrying out inter-firm comparison.
3. Nature of information to be collected ─ Although there is no limit to information, yet
the following information useful to the management is in general collected by the
Centre for inter-firm comparison.
a. Information regarding costs and cost structures.
b. Raw material consumption.
c. Stock of raw material, wastage of materials, etc.
d. Labour efficiency and labour utilisation.
e. Machine utilisation and machine efficiency.
f. Capital employed and Return on capital.
g. Liquidity of the organisation.
h. Reserve and appropriation of profit.
i. Creditors and debtors.
j. Methods of product ion and technical aspects.
4. Method of Collection and presentation of information ─ The Centre collects
information at fixed intervals in a prescribed form from its members. Sometimes a
questionnaire is sent to each member; the replies of the questionnaire received by
the Centre constitute the information/data. The information is generally collected at
the end of the year as it is mostly related with final accounts and Balance Sheet.
The information supplied by firms is generally in the form of ratios and not inabsolute figures. The information collected as above is stored and presented to its
members in the form of a report. Such reports are not made available to non-
members.
Cost Sheet, Profitabili ty analysis & Reporti ng: th e Balance Scorecard
21. (a) The Balanced Scorecard can be defined as ‘an approach to the provision of
information to management to assist strategic policy formulation and achievement.It emphasises the need to provide the user with a set of information, whichaddresses all relevant areas of performance in an objective and unbiased fashion.
The information provided may include both financial and non financial elements, andcover areas such as profitability, customer satisfaction, internal efficiency and
innovation’.
It is clear from the above definition that the central idea of the Balanced Scorecard
is that managers should develop the measures on which they manage the business
from four different perspectives:
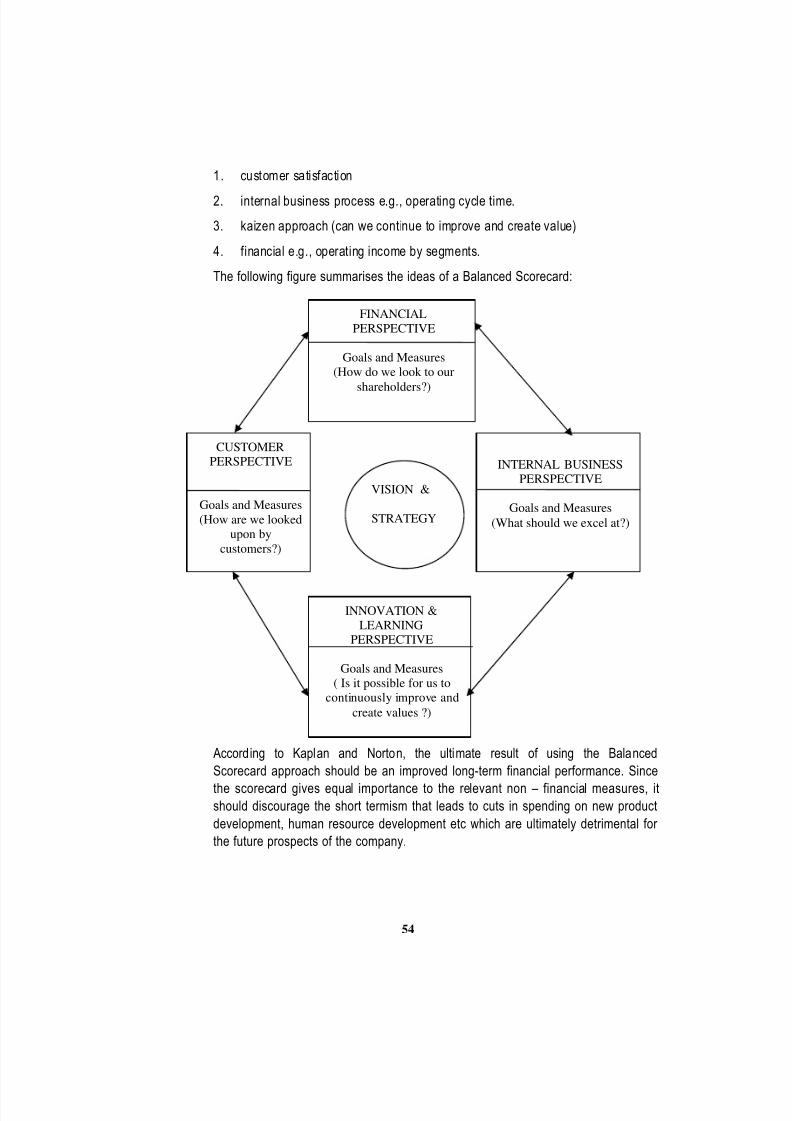
8/3/2019 ama nov 09
http://slidepdf.com/reader/full/ama-nov-09 54/80
54
1. customer satisfaction
2. internal business process e.g., operating cycle time.
3. kaizen approach (can we continue to improve and create value)
4. financial e.g., operating income by segments.
The following figure summarises the ideas of a Balanced Scorecard:
According to Kaplan and Norton, the ultimate result of using the Balanced
Scorecard approach should be an improved long-term financial performance. Since
the scorecard gives equal importance to the relevant non – financial measures, itshould discourage the short termism that leads to cuts in spending on new product
development, human resource development etc which are ultimately detrimental for
the future prospects of the company.
INTERNAL BUSINESSPERSPECTIVE
Goals and Measures
(What should we excel at?)
INNOVATION &
LEARNINGPERSPECTIVE
Goals and Measures
( Is it possible for us to
continuously improve and
create values ?)
FINANCIAL
PERSPECTIVE
Goals and Measures
(How do we look to our
shareholders?)
CUSTOMERPERSPECTIVE
Goals and Measures
(How are we looked
upon by
customers?)
VISION &
STRATEGY

8/3/2019 ama nov 09
http://slidepdf.com/reader/full/ama-nov-09 55/80
55
The responsibility to devise and implement a Balanced Scorecard should be that of
the managers working with the business. Since every company is different, it shallneed to work out for itself the various financial and non – financial measures, which
need to be focussed upon for its own development. Since the Balanced Scorecard
is recommended as a management tool used both for internal and external reporting
purposes, it is again the manager’s responsibility to decide as to what information
needs to be disclosed and how any problems of confidentiality can best be
overcome.
The following are some reasons why Balanced Scorecards sometimes fail to
provide for the desired results;
The use of non financial measures leads managers to think that they have a
Balanced Scorecard already working for strategic purposes.
Senior executives misguidedly delegate the responsibility of the Scorecard
implementation to middle level managers.
Company’s try to copy measures and strategies used by the best companiesrather than developing their own measures suited for the environment under
which they function.
There are times when Balanced Scorecards are thought to be meant for reporting purposes only. This notion does not allow a Business to use the
Scorecard to manage Business in a new and more effective way.
It may be noted that the above-mentioned difficulties refer to the internal use of the
Scorecard. It remains a matter of debate whether a Balanced Scorecard is
applicable to external reporting. Critics argue that if the Scorecard is indeed arelevant driver of long term performance, shouldn’t the information generated be of
interest to the investment community? However, it has been noticed that the
Scorecard does not translate easily to the investment community for the simple
reason that it makes sense for individual business units and different individual
projects rather than the company as a whole. Most companies have different
divisions with their own mission and strategy and hence these individual scorecards
cannot be aggregated into an overall corporate scorecard. However, in case the
company somehow manages to overcome such a problem and indeed use its
Scorecard for external reporting, it may end up passing sensitive information to its
competitors which may end up being detrimental to the company in the long run.
However, with changes in the thinking process of the investment community, suchstrategic reporting could well be accepted in the near future.
For a further understanding of the concept, please refer to chapter 14 of the
Institute’s Cost Management book.

8/3/2019 ama nov 09
http://slidepdf.com/reader/full/ama-nov-09 56/80
56
(b) Kitchen King’s Score card should describe its product differentiation strategy. The
key points that should be included in its balance score card are Financial Perspective – Increase in operating income by charging higher
margins on Maharaja.
Customer Perspective – Market share in high-end kitchen range market and
customer satisfaction.
Internal business Perspectives: Manufacturing quality, order delivery time, on
time delivery and new product feature added.
Learning and Growth Perspective: Development time for designing new end
product and improvement in manufacturing process.
Operative Income:
(Amount in 000’ Rs.)
2007 2008
Revenue (40,000 ×1,000: 42,000 × 1,100) 40,000 46,200
Direct Material 12,000 13,530
Conversion cost 10,000 11,000
Selling and Customer service 7,200 7,250
Total cost 29,200 31,780
Operative Income 10,800 14,420
Change in operating Income is Rs. 36,20,000 (F)
A. Growth Component
(a) Revenue effect = Output Price in 2007 {Actual units sold in 08 – Actual
units sold in 07}
= Rs. 1, 000 (42,000 units – 40,000 units)
= Rs. 20, 00,000 (F)
(b) The cost effect = Input price in 2007 {Actual units of input to produce
2007 output less Actual units of input which would have been used toproduce year 2008 output on the basis of 2007}
(i) Di rect Material = Rs. 100 [1, 20,000 sq.f t. – 1, 20,000 sq. ft .
×units40,000units42,000 ]
= Rs. 6,00,000 (A)

8/3/2019 ama nov 09
http://slidepdf.com/reader/full/ama-nov-09 57/80
57
(ii) Conversion cost and selling and customer service will not change
since adequate capacity exists in 2007 to support 2008 output andcustomers. Hence variance
Conversion cost = 200 (50,000 – 50,000) = 0
S & Customer Service = 25,000 (300 – 300) = 0
Increase in operating effect of Growth component is
Rs. 14,00,000 (F)
B. Price recovery Component:
(i) Revenue effect = Actual output in 2008 [Selling price per unit in 2008
less Selling price per unit in 2007]
= 42,000 units (Rs. 1,100 – Rs. 1,000)
= Rs. 42,00,000 (F)
(ii) Cost effect = Unit of input based on 2007 actual that would have been
used to produce 2008 output {Input prices per unit in 2007 less Input
prices per unit in 2008}
(a) Direct material = 1,26,000 sq. ft. (Rs. 100/sq. ft. –Rs. 110/sq. ft.)
= Rs. 12, 60,000 (A)
(b) Conversion Cost = 50,000 units (Rs. 200/unit – Rs. 220/unit)
= Rs. 10,00,000 (A)
(c) S & Customer Service = 300 customers (Rs. 24,000 – Rs. 25,000)
= Rs. 3,00,000 (A)
= Rs. 25,60,000 (A)
Increase in Operating income due to Price Recovery is Rs. 16,40,000 (F){Rs. 42,00,000 – Rs. 25,60,000}
(C) Productivity Component
Productivity component = Input Prices in 08{Actual units of input which would
have been used to produce year 2008 output on the basis of 2007 actual less Actual Input}
(i) Direct Material: Rs. 110/sqft
(1,26,000 units – 1,23,000 units) = Rs. 3,30,000 (F)
(ii) Conversion Cost: Rs. 200/unit
(50,000 units – 50,000 units) = 0

8/3/2019 ama nov 09
http://slidepdf.com/reader/full/ama-nov-09 58/80
58
(iii) Selling & Customer = Rs. 25,000
(300 customers – 290 customers) = Rs. 2,50,000 (F)
= Rs. 5,80,000 (F)
The change in operating income from 2007 to 2008 is analysed as follows:
(Amount in 000’ Rs.)
2007 Growth
component
Price
recovery
Cost effect of
productivity
component
2008
Revenue 40,000 2,000 (F) 4,200 (F) ─ 46,200
Cost 29,200 600 (A) 2,560 (A) 580 (F) 31,780
Operating Income 10,800 1,400(F) 1,640 (F) 580 (F) 14,420
Cost Sheet, Profitability Analysis & Reporting: Product Cost Sheet & Profitability
Analysis
22. 1. EXE Wood Company
Income StatementFor the year ended December 31, 2008
Rs. Rs.
Revenues 6,80,000
Cost of goods sold:
Beginning finished goods, January 1, 2008 50,000
Cost of goods manufactured (see schedule below) 4,80,000
Cost of goods available for sale 5,30,000
Deduct ending f inished goods, December 31, 2008 75,000 4,55,000
Gross margin (or gross profit) 2,25,000
Operating costs
Marketing promotions 30,000
Marketing salaries 50,000
Distribution costs 35,000Customer-service costs 50,000 1,65,000
Operating income 60,000

8/3/2019 ama nov 09
http://slidepdf.com/reader/full/ama-nov-09 59/80
59
EXE Wood Company
Schedule of Cost of Goods ManufacturedFor the year ended December 31, 2008
Rs. Rs.
Direct materials:
Beginning inventory, January 1, 2008 20,000
Purchases of direct materials 2,30,000
Cost of direct materials available for use 2,50,000
Ending inventory, December 31, 2008 25,000
Direct materials used 2,25,000 (v)
Direct manufacturing labour 1,50,000 (v)
Manufacturing overhead costs:
Sandpaper 1,000 (v)Materials-handling costs 35,000 (v)
Lubricants and coolants 2,500 (v)
Miscellaneous indirect manufacturing labour 20,000 (v)
Plant-leasing costs 27,000 (F)
Depreciation – plant equipment 18,000 (F)
Property taxes on plant equipment 2,000 (F)
Fire insurance on plant equipment 1,500 (F) 1,07,000
Manufacturing costs incurred during 2007 4,82,000
Beginning work in process, January 1, 2007 5,000
Total manufacturing costs to account for 4,87,000
Ending work in process, December 31, 2007 7,000Cost of goods manufactured (to income statement) 4,80,000
2. Direct material unit cost = direct materials used ÷ Units produced
= Rs. 2,25,000 ÷ 4,50,000 units = Re. 0.50 per unit
Plant-leasing unit cost = Plant-leasing costs ÷ Units produced
= Rs. 27,000 ÷ 4,50,000 units = Re. 0.06 per unit
3. The direct material costs are variable, so they would increase in total from Rs.2,25,000 to Rs. 2,50,000 (5,00,000 units × Re. 0.50 per unit). However, their unit
cost would be unaffected: Rs. 2,50,000 ÷ 5,00,000 units = Re. 0.50 per unit.
In contrast, the plant-leasing costs of Rs. 27,000 are fixed, so they would not
increase in total. However, the plant leasing cost per unit would decline from Re.0.060 to Re. 0.054: Rs. 27,000 ÷ 5,00,000 units = Re. 0.054 per unit.

8/3/2019 ama nov 09
http://slidepdf.com/reader/full/ama-nov-09 60/80
60
Note : All the Questions are arranged in a sequence as per the syllabus of ‘Advanced
Management Accounting’ (AMA) [Paper 5 of Final (New) Course]. This RTP containschapter name followed by the topic against each theory/practical question
Linear Programming
24. The given L.P.P. is
Minimize Z = 2 x1 + x2
Subject to
1 23 x x = 3
1 24 3 x x 6
1 2
2 x x 3,1 2
, 0 x x
We shall converts the constraints into eqn.
1 23 x x = 3
1 2 34 3 x x x = 6
1 2 42 x x x = 3
Where1 2 3 4, , , 0 x x x x and
3 x is called surplus variables and4 x is called slack
variable.
We shall add artificial variables in the above equations.
1 2 53 x x x = 3
1 2 3 64 3 x x x x = 6
1 2 42 x x x = 3
Here,5 6, x x are called artificial variable.
The no. of variables n = 6
The no. of constraints m = 3
n – m = 6 – 3 = 3.
Let us assumes that
x1 = 0, x2 = 0, x3 = 0
The starting basic feasible solution is
5 6 43, 6, 3 x x x

8/3/2019 ama nov 09
http://slidepdf.com/reader/full/ama-nov-09 61/80
61
Now, then new objective function.
Z = 2 x1 + x2 + 0 x3 + 0 x4 + M x5 + M x6
There Y1 is the entering variable
Y5 is the leaving variable
and 3 is the leading common element.
C (2 1 0 M 0)
CB YB XB Y1 Y2 Y3 Y6 Y4 Min. Ratio
2 Y1 1 1 1/3 0 0 03
1/3
1
M Y6 2 0 1 1 0
5
32
=
O Y4 2 0 5/3 0 0 11.2
5
6
Z = 2M+2 0
5
15M M 0 0
Y2 is the entering variable
Y6 is the leaving variable
5
3is the leading common element.
5/3
1.2

8/3/2019 ama nov 09
http://slidepdf.com/reader/full/ama-nov-09 62/80
62
Since all the element Zj – Cj of non-positive. The above table gives the optimum solution.
The solution is1
3,
5 x x2 =
5
6and
12
5 Z
Linear Programming
25. We shall converts the in-eqn. Given in L.P.P. as eqn.
1 22 x x = 1 …(1)
x1 = 2 …(2)
1 2 x x = 3 …(3)
Consider the line (1)
1 22 x x = 1
When x2 = 0
12 x = 1
1 x =1
0.52
then line (1) cuts x1 axis at (– 0.5, 0)
When1 2
0, 1 x x
The line (1) cuts x1 axis at (0, 1)
Consider the line (2), x1 = 2
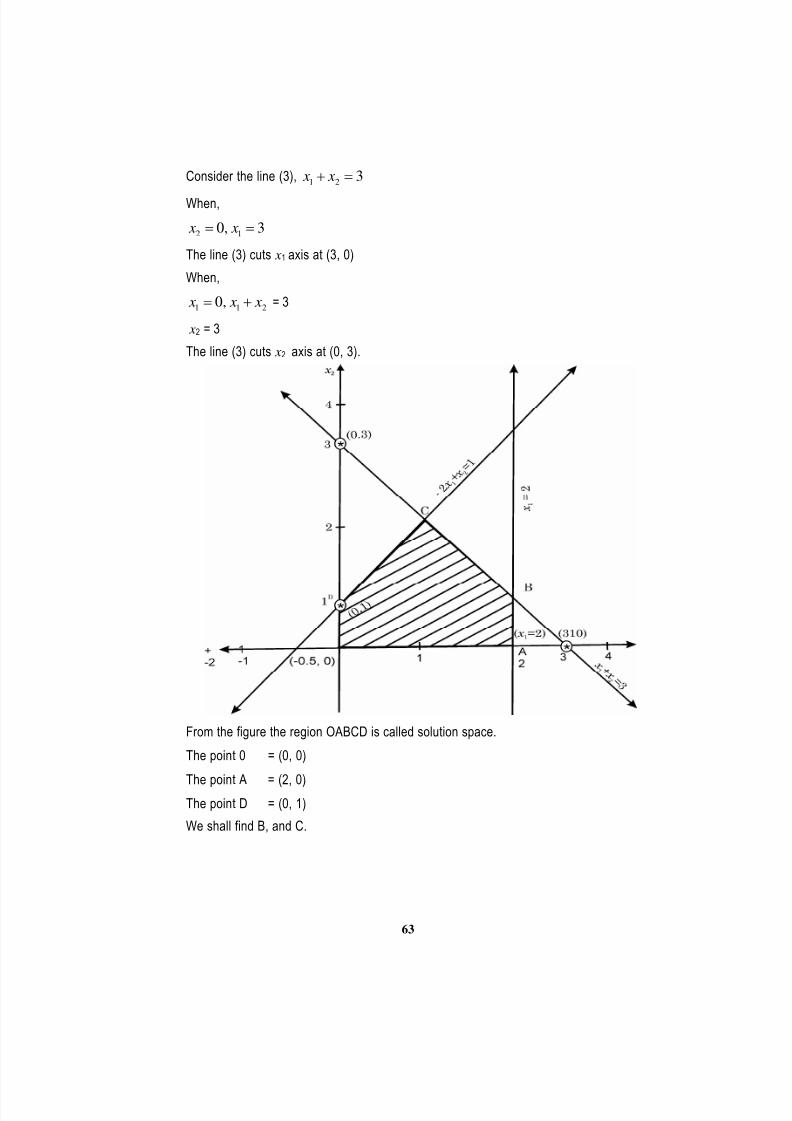
8/3/2019 ama nov 09
http://slidepdf.com/reader/full/ama-nov-09 63/80
63
Consider the line (3),1 2
3 x x
When,
2 10, 3 x x
The line (3) cuts x1 axis at (3, 0)
When,
1 1 20, x x x = 3
x2 = 3
The line (3) cuts x2 axis at (0, 3).
From the figure the region OABCD is called solution space.
The point 0 = (0, 0)
The point A = (2, 0)The point D = (0, 1)
We shall find B, and C.

8/3/2019 ama nov 09
http://slidepdf.com/reader/full/ama-nov-09 64/80
64
We shall solve B
1 x = 2,
1 2 x x = 3
22 3 x
2 x = 1
The point B (2, 1)
We shall solve C
1 22 x x = 1
1 2 x x = 3
13 x = – 2
1
2.666 .67
3 x
1 2 x x = 3
2.67 x = 3
2 x = 3 .67 2.33
The point C (.67, 2.33)
No at 0 = (0, 0), Z = 0
At A = (2, 0), Z = 2 + 0 = 2
At B = (2, 1), Z = 2 + 1 = 3
At C = (0.67, 2.33) Z = 0.67 + 2.33 = 3.0
At D = (0, 1), Z = 0 + 1 = 1
The solutions are1 22, 1 x x and
1 20.67, 2.33 x x
and Minimum Z = 3
Transportation Problem
26. The given problem is un-balanced T.P.
We add dummy column (E).

8/3/2019 ama nov 09
http://slidepdf.com/reader/full/ama-nov-09 65/80
65
Now, the above problem is balanced.
(i) First, using VAM method to find basic feasible solution.
The transportation cost= 37 × 160 + 40 × 80 + 52 × 10 + 0 × 60 + 38 × 90 + 40 × 100
= 5,920 + 3,200 + 520 + 3,420 + 4,000
= 17,060.
39

8/3/2019 ama nov 09
http://slidepdf.com/reader/full/ama-nov-09 66/80
66
(ii) To find optimum solution using Modi Method.

8/3/2019 ama nov 09
http://slidepdf.com/reader/full/ama-nov-09 67/80
67

8/3/2019 ama nov 09
http://slidepdf.com/reader/full/ama-nov-09 68/80
68
The above table gives the optimum cost.
The optimum T. P. cost = 38 × 0 + 37 × 60 + 40 × 80 + 49 × 10 + 0 × 60 + 38 ×80 + 40 × 110
= 5,920 + 3,200 + 490 + 3,040 + 4,400 = 17,050.
The optimum cost = Rs. 17,050
The Assignment Problem
27.
In table 2, the minimum number of lines = N = 4
The order of matrix = n = 5
N < n.
We can set allocation assignment schedule.

8/3/2019 ama nov 09
http://slidepdf.com/reader/full/ama-nov-09 69/80
69
1 B
2 E
3 A
4 C
5 D
Maximum Sales = 38 + 36 + 41 + 41 + 35
= 191 units.
Critical Path Analysis and PERT
28. The given data results in a network shown in the figure. The figure along the
arrows represent the activity times.
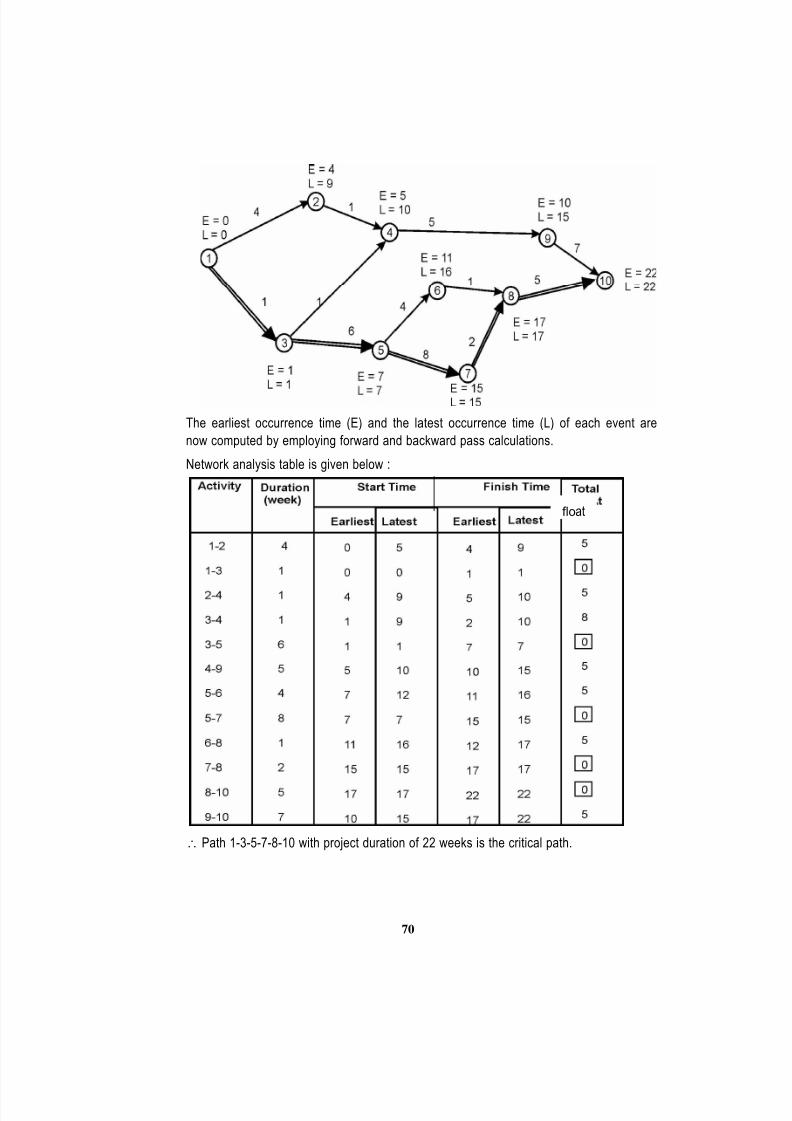
8/3/2019 ama nov 09
http://slidepdf.com/reader/full/ama-nov-09 70/80
70
The earliest occurrence time (E) and the latest occurrence time (L) of each event are
now computed by employing forward and backward pass calculations.
Network analysis table is given below :
Path 1-3-5-7-8-10 with project duration of 22 weeks is the critical path.
float
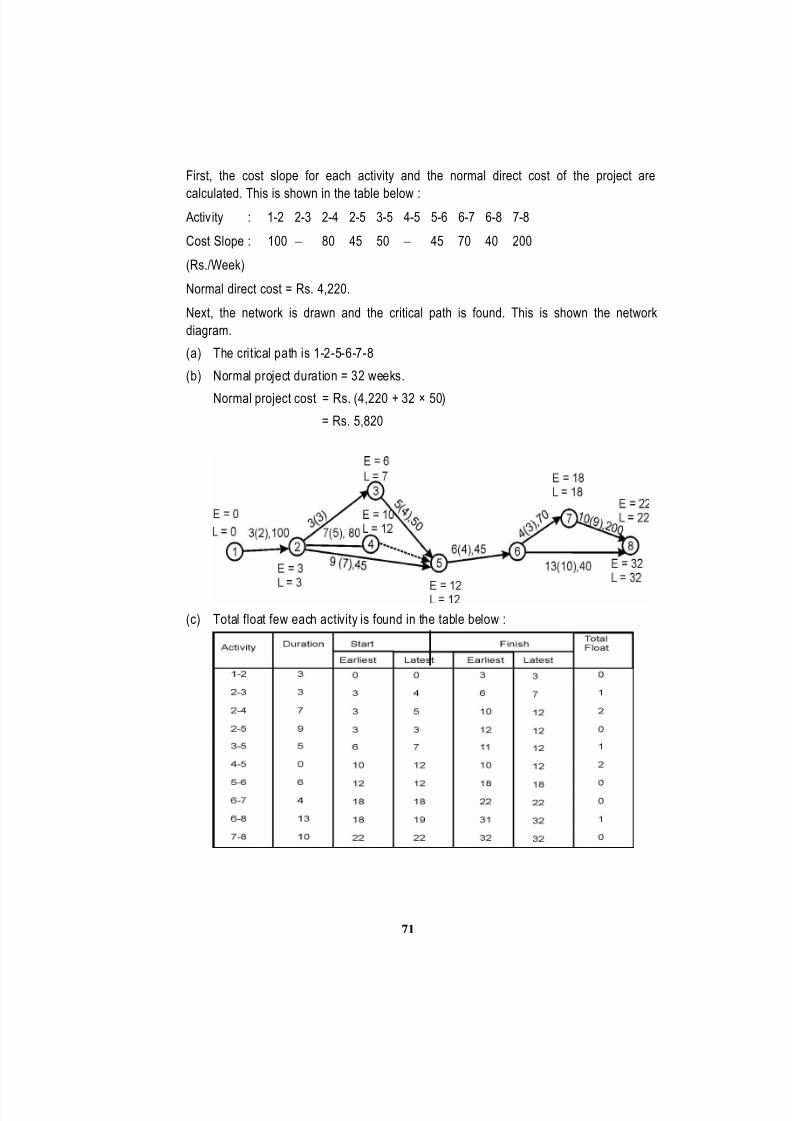
8/3/2019 ama nov 09
http://slidepdf.com/reader/full/ama-nov-09 71/80
71
First, the cost slope for each activity and the normal direct cost of the project are
calculated. This is shown in the table below : Activ ity : 1-2 2-3 2-4 2-5 3-5 4-5 5-6 6-7 6-8 7-8
Cost Slope : 100 80 45 50 45 70 40 200
(Rs./Week)
Normal direct cost = Rs. 4,220.
Next, the network is drawn and the critical path is found. This is shown the network
diagram.
(a) The critical path is 1-2-5-6-7-8
(b) Normal project duration = 32 weeks.
Normal project cost = Rs. (4,220 + 32 × 50)
= Rs. 5,820
(c) Total float few each activity is found in the table below :

8/3/2019 ama nov 09
http://slidepdf.com/reader/full/ama-nov-09 72/80
72
(d) Since the indirect cost is Rs. 50. Week and the network is to be crashed only upto
optimum time and cost, only those activities need to be crashed for which the totalcost slope is Rs. 50/- week. The time scaled diagram of the network is in thefigure:
Crash activity 5-6 by 2 days at a crash cost of Rs. 45 per week.
Crash cost = Rs. (2 × 45) = Rs. 90
Project duration = 30 weeks.
Crash activity 2-5 by 1 day at a crash cost of Rs. 45 per week
Crash cost = Rs. (90 + 45) = Rs. 135.
Project duration = 29 weeks.
Critical Path Analysis and PERT
29. If the activities are crashed future the crash cost/week will be more than Rs. 50and hence further crashing is not done. The project is in figure.

8/3/2019 ama nov 09
http://slidepdf.com/reader/full/ama-nov-09 73/80
73
The above results are summarized in the table below:
Duration Normal direct Crash cost Indirect cost Total Cost
(Week) cost (Rs.) (Rs.) (Rs.) (Rs.)
32 4220 1600 5820
31 4220 45 1550 5815
30 4220 90 1500 5810
29 4220 135 1450 5805
Optimum project duration = 29 weeks.
Optimum total project cost = Rs. 5805.
Simulation
30. First of all, random numbers 00-99 are allocated in proportion to the probabilities
associated with the sales of cars as given below:
Table 1
Based on the given random numbers, we simulate the estimated sales and calculate the
profit/loss on the basis of specified units of production.
95-99

8/3/2019 ama nov 09
http://slidepdf.com/reader/full/ama-nov-09 74/80
74
Table 2 :
Total = 359 Total = 359
There is no additional profit or loss if the company decides to reduce production to 39
cars per day.
Time Series Analysis & Forecasting
31. Calculation of seasonal indices by the method of link relatives.

8/3/2019 ama nov 09
http://slidepdf.com/reader/full/ama-nov-09 75/80
75
Arithmetic average = 86.35
4
345.4 108.28
5
541
121.665
608.3 93.86
5
469.3
Chain relatives 100 108.28100
108.28100
131.73100
108.28121.66
123.65100
131.7393.86
Corrected chain relatives 100 108 – 1.675 = 106.605
131.73 – 3.35 = 128.38
123.64 – 5.025 = 118.615
Seasonal indices 100113.4
128.38100
113.4
106.605
113.4
100100
100113.4
118.615
= 88.18 = 94.01 = 113.21 = 104.60
The calculation in the above table are explained below :
Chain relative of the first quarter (on the basis of first quarter = 100)
Chain relative of the first quarter (on the basis of the last quarter)
106.7100
123.6486.35
The difference between these chain relatives = 106.7 – 100 = 6.7
Difference per quarter 1.6754
6.7
Adjusted chain relat ives are obtained by subtracting 1 × 1.675, 2 × 1.675, 3 × 1.675 from
the chain relatives of the 2nd, 3rd and 4th quarters respectively.

8/3/2019 ama nov 09
http://slidepdf.com/reader/full/ama-nov-09 76/80
76
Average of corrected chain relatives
113.44
453.6
4
118.615128.38106.605100
Seasonal variation index 100113.4
relativeschainCorrect
Time Series Analysis and Forecasting
32. Fitting straight line Trend by the Method of Least squire
N = 7 y = 168 x = 0 xy = 53 x2 = 28
The equation of the straight line trend is :
Y = a + b x
Since
247
168
N
ya0,x
And 1.89328
53
x
xyb
2
Hence Y = 24 + 1.893x
Estimated Number of tourists that would arrive in 2000
Y = 24 + 1.893 (7) = 24 + 13.251 = 37.251 million.

8/3/2019 ama nov 09
http://slidepdf.com/reader/full/ama-nov-09 77/80
77
Testing of hypothesis
34. In the usual notations, we are given n = 200. x = No. of pieces conforming tospecifications in the sample = 200 – 18 = 182.
P = Proport ion of pieces conforming to speci fications in the sample 0.91200
182 .
Null hypothesis. H0 : P≥ 0.95, i.e., the proportion of pieces conforming to specifications in
the lot is at least 95%.
Alternative Hypothesis. H1 ; P < 0.95 (Left-tailed alternative).
It will suffice to test H0 : P = 0.95 Q = 1 – P = 0.05
Level of significance (i) = 0.05, (ii) = 0.01
Test statistic. Under H0, the test statistic isnPQI
PP
(P)SE
E(P)PZ
N (0,1),
Since sample is large
2.6.0.0154
0.04
0.00237
0.04
0.05/2000.95
0.950.91
(i) Significance at 5% level of significance.
Since the alternative hypothesis is one-sided (left-tailed), we shall apply left-tailedtest for testing significance of Z. The significant value of Z at 5% level significance
for left-tail test is—1.645.
Since computed value of Z = – 2.6 is less than – 1.645 (or since |z| > 1.645), we sayZ is significant (as it lies in the critical region) and we reject the null hypothesis at5% level of significances. Hence, the manufacturer’s claim is rejected at 5% level of
significance.
(ii) Significance at 1% level of significance. The critical value of Z at 1% level of
significance for single-tailed (left-tailed) test is – 2.33. Since the computed value Z = – 2.6 is less than – 2.33 (is |z| > 2.33),
H0 is rejected at 1% level of significance also.
Testing of Hypothesis (Analysis of variance ANOVA)
35. Null Hypothesis
(a) The machines are homogenous
i.e., DCBA μ

8/3/2019 ama nov 09
http://slidepdf.com/reader/full/ama-nov-09 78/80
78
(b) The workers are homogeneous
i.e., 54321μ
Alternative Hypothesis
(a) At least two of the machines differ significantly
(b) At least two of the workers differ significantly
In the usual notation, we have:
K = 5, H = 4, N = KH = 5 × 4 = 20
G = Σ Σ Xij = 20;
Calculation for Various S.S
Machine TypeWorkers A B C D
Total
I 4 -2 7 -4 5R1
II 6 0 12 3 21R 2
III -6 -4 4 -8 14-R 3
IV 3 -2 6 -7 0R 4
V -2 2 9 -1 8R 5
Total 5C1
6-C2
38C3
-17C4
G = 20
Corrector Factor (CF) =n
G 2
= 2020
202
Raw S.S (RSS)= Σ Σ Xij2
= [(16+4+49+16) + (36+0+144+9) + (36+16+16+64) + (9+4+36+49) +
(4+4+81+1)]
= 594
Total S.S = 57420-594CF-RSS
S.S Rows (Workers) =4
RRRRR2
52
42
32
22
1 CF
=4
80)14(215 2222 20

8/3/2019 ama nov 09
http://slidepdf.com/reader/full/ama-nov-09 79/80
79
=
4
806419644125
4
646=161.5
S.S Columns (Machine Type) =5
CCCC2
4
2
32
22
1 CF
=5
(-17)38(-6)5 2222 20
=5
100289444,13625
5
694,1 8.338
: SSE = Error S.S = TSS SSR SSC
= 574 161.5 338.8
= 73.7
Since the various sum of the squares are not affected by change of origin, the ANOVA
table for the original data and the given data obtained on changing the origin to 20 will be
same and in given in following table.
Degrees of Freedom for various S.S
d.f for TSS = 191-201-n d.f for Rows (Workers) = 41-5
d.f for Column (Machines ) = 31-4
d.f for SSE = 123)(4-19
OR d.f for SSE = (d.f for Rows) × (d.f for columns)
= (3 × 4) = 12
ANOVA TABLE
Sources of variation d.f S.Sd.f
S.SMSS Variance Radio (F)
Rows (Workmen) 4 161.5 40.38 58.66.14
40.38 ~F(4,12)

8/3/2019 ama nov 09
http://slidepdf.com/reader/full/ama-nov-09 80/80
Columns (Machine) 3 33.8 112.93 14.6
93.11218.39~F(3,12)
Errors 12 73.7 6.14
Total 19 574
Testing of Hypothesis (Chi-Square Distribut ion)
36. Let Ho: Defective is good does not depend upon the shift run by the factory the first
Expected value is
16150
6040E
0 E 0-E (0-E)² (0-E)²/E
15 16 -1 1 0.063
20 20 0 0 0
25 24 1 1 0.042
5 8 -3 9 1.125
10 10 0 0 0
15 12 3 9 0.750
20 16 4 16 1.0
20 20 0 0 0
20 24 -4 16 0.667
3.647
D: F = V= 41)-1)(3-(31)-(c1)-(r
:2 (4, 0.05) = 9.488
Here, the calculated value of 2 is less then of table value.
Hence, the hypothesis is accepted.
i.e., the number of defective does not depend m shift run by the factory.


![[Gokigenyou] Aya e Ama v.1 C.09](https://static.fdocuments.net/doc/165x107/577cd2be1a28ab9e7895e276/gokigenyou-aya-e-ama-v1-c09.jpg)
