Alzheimer's Disease Neuroimaging Initiative (ADNI)
84
Neil Buckholtz, Ph.D. National Institute on Aging/NIH
-
Upload
national-press-foundation -
Category
Documents
-
view
133 -
download
9
description
Dr. Neil Buckholtz, National Institute on Aging/ NIH
Transcript of Alzheimer's Disease Neuroimaging Initiative (ADNI)
Neil Buckholtz, Ph.D.
National Institute on Aging/NIH
70 yo
Normal
72 yo MCI
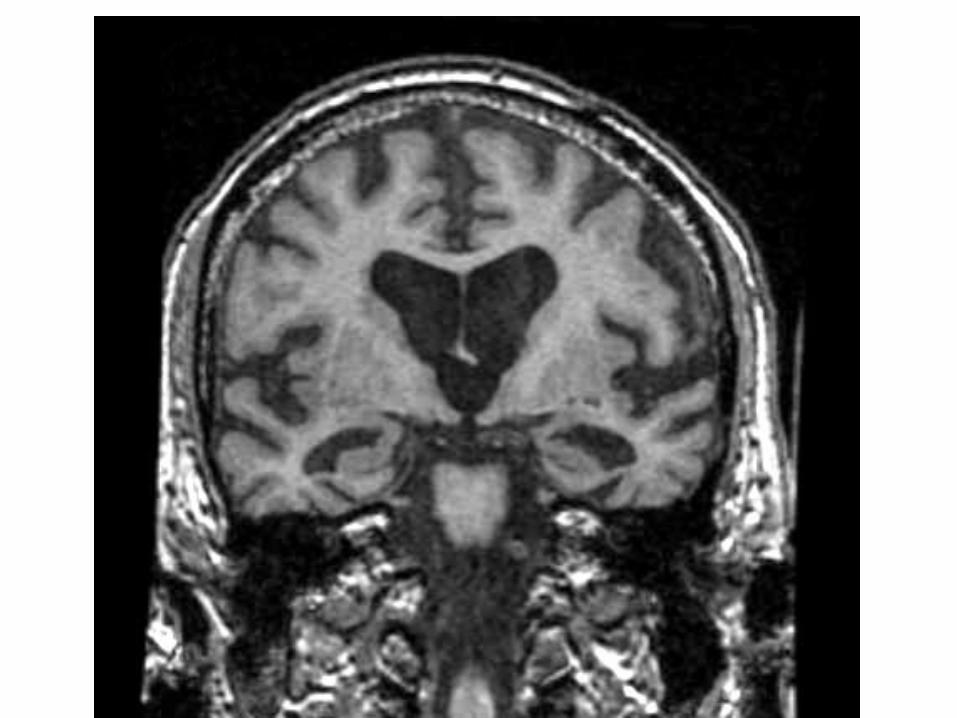
74 yo AD
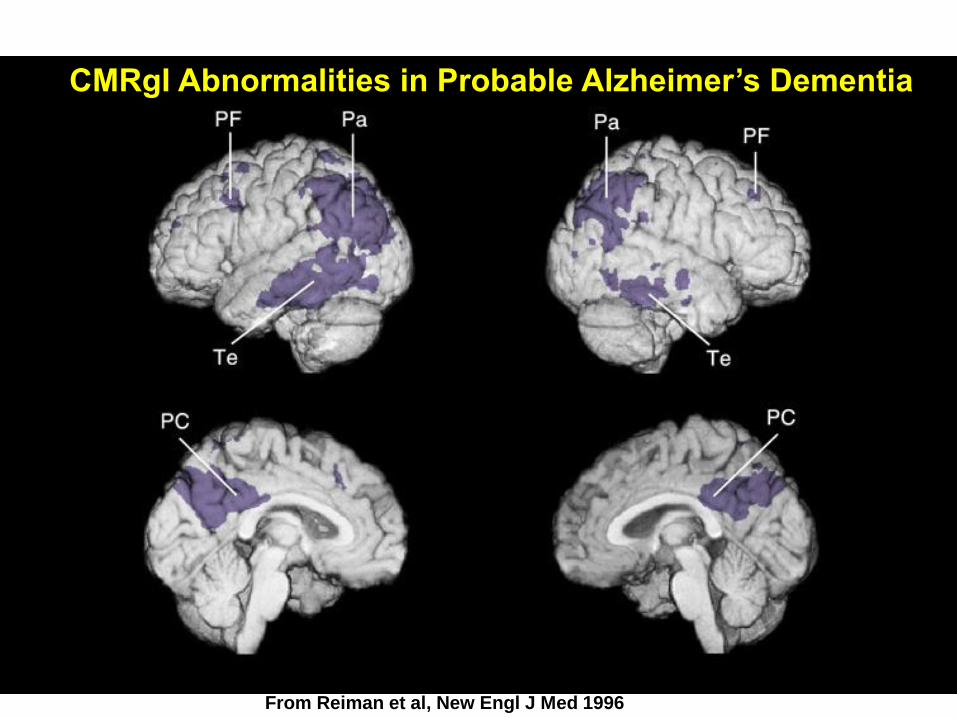
CMRgI Abnormalities in Probable Alzheimer’s Dementia
From Reiman et al, New Engl J Med 1996
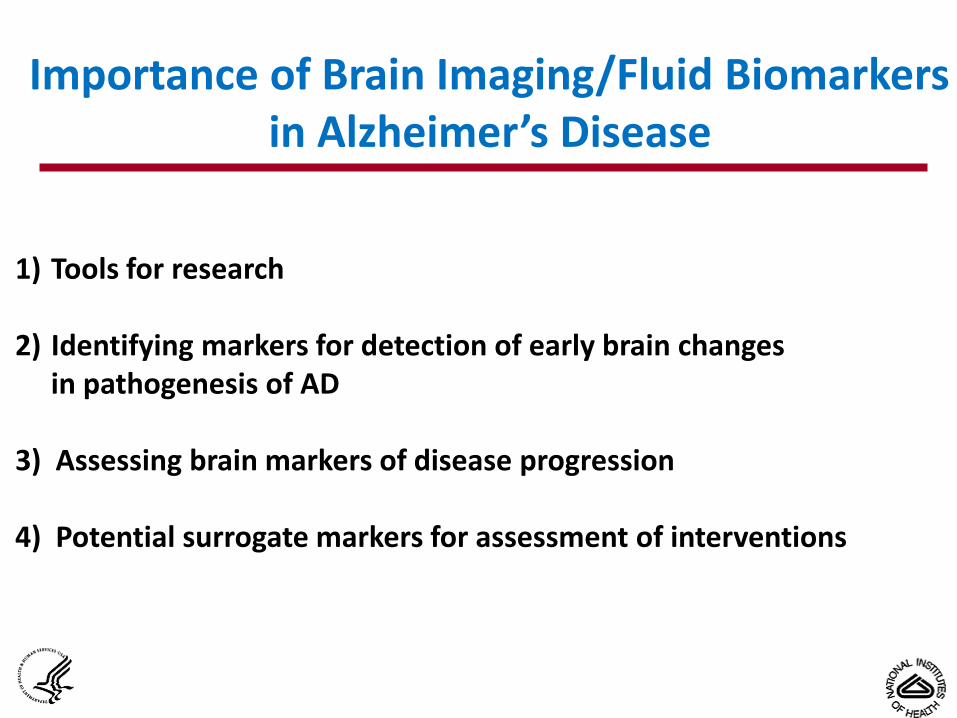
Importance of Brain Imaging/Fluid Biomarkers in Alzheimer’s Disease
1) Tools for research
2) Identifying markers for detection of early brain changes in pathogenesis of AD 3) Assessing brain markers of disease progression 4) Potential surrogate markers for assessment of interventions
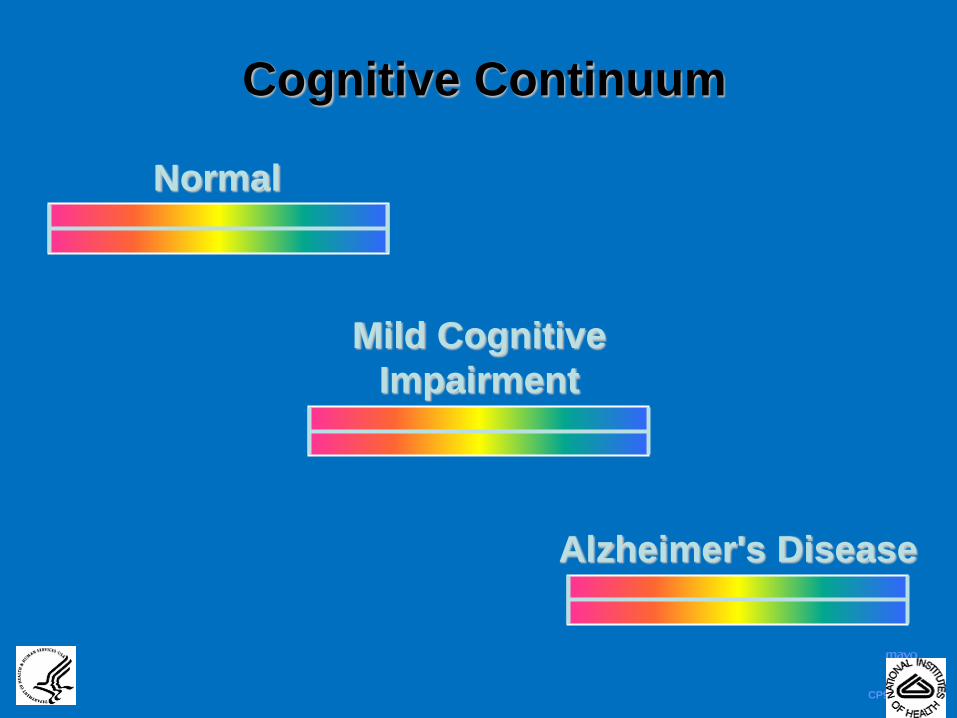
Cognitive Continuum
Mild Cognitive
Impairment
Normal
Alzheimer's Disease
CP926864- 35
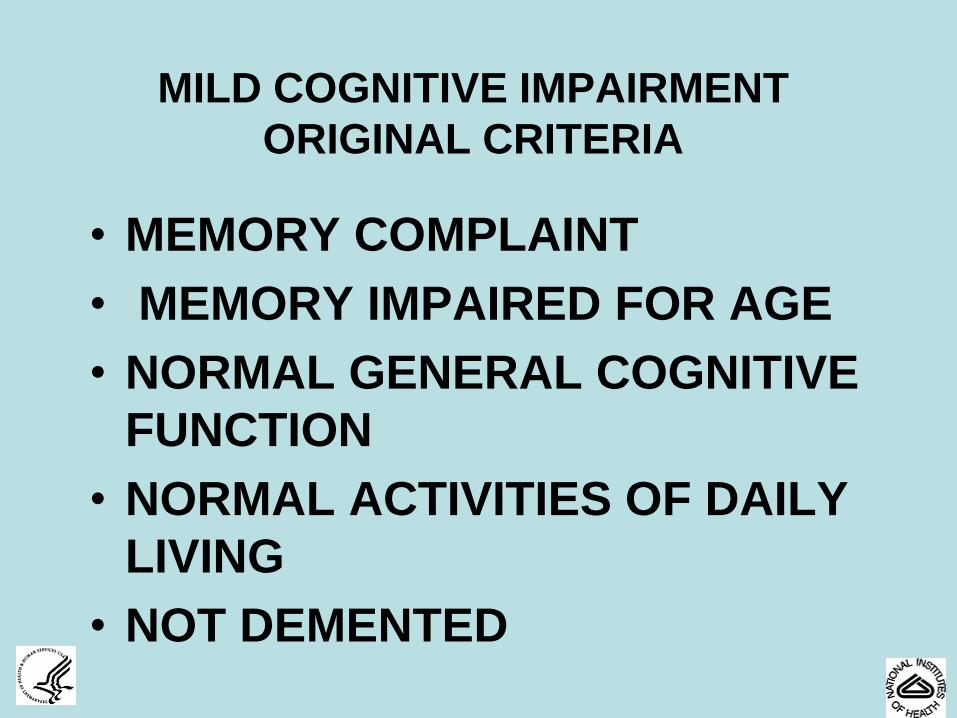
MILD COGNITIVE IMPAIRMENT
ORIGINAL CRITERIA
• MEMORY COMPLAINT
• MEMORY IMPAIRED FOR AGE
• NORMAL GENERAL COGNITIVE
FUNCTION
• NORMAL ACTIVITIES OF DAILY
LIVING
• NOT DEMENTED
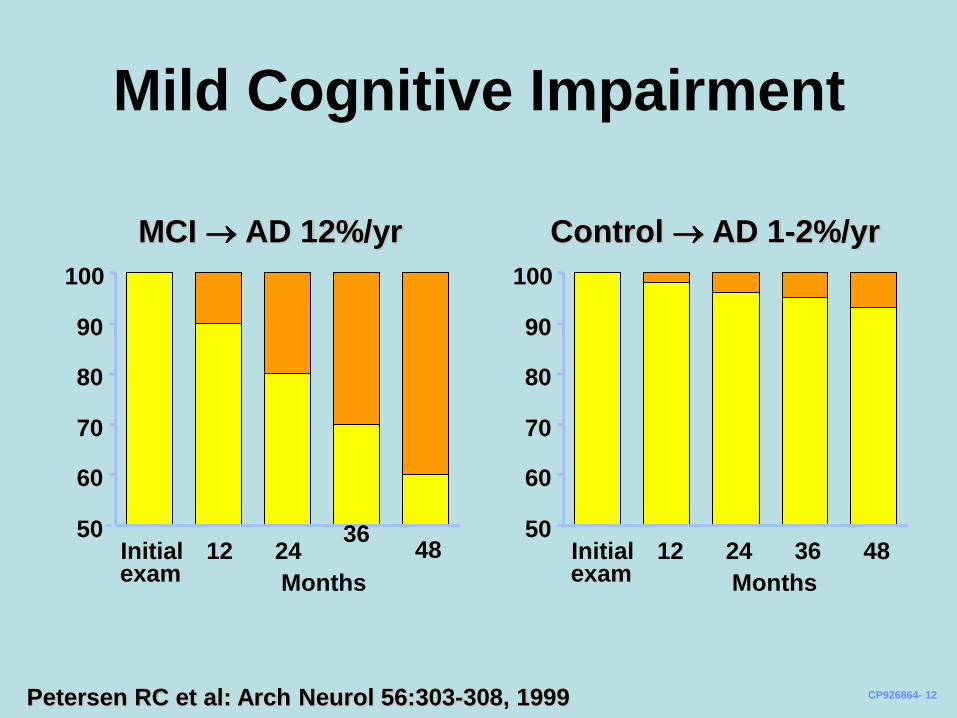
Mild Cognitive Impairment
MCI AD 12%/yr Control AD 1-2%/yr
Petersen RC et al: Arch Neurol 56:303-308, 1999
50
60
70
80
90
100
50
60
70
80
90
100
Initial 12 24 36
48 exam
CP926864- 12
Months
Initial 12 24 36 48 exam Months
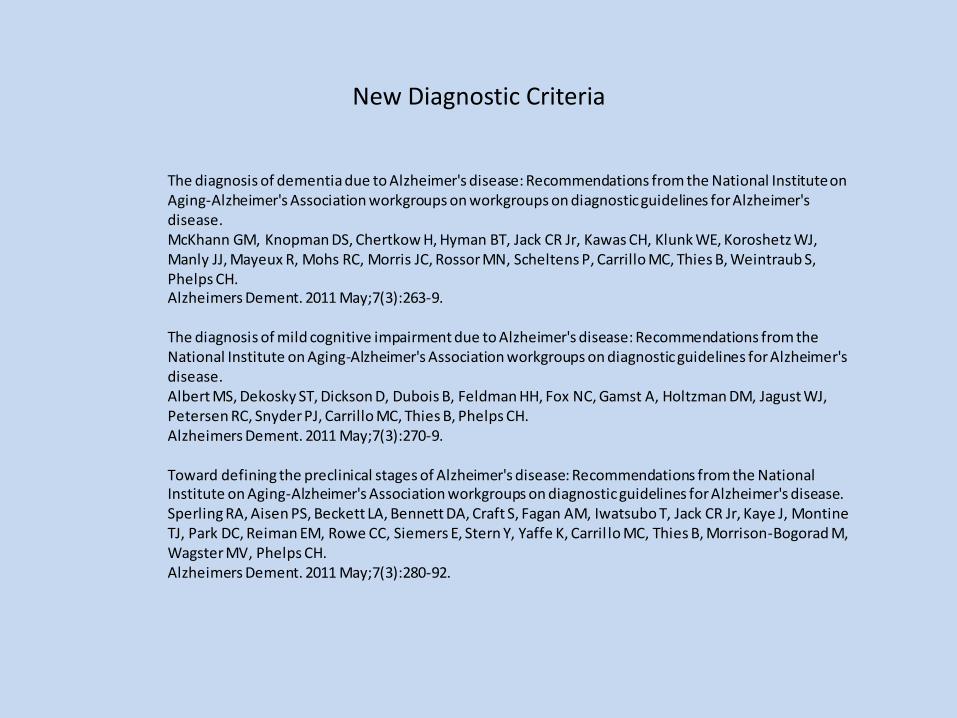
New Diagnostic Criteria
The diagnosis of dementia due to Alzheimer's disease: Recommendations from the National Institute on Aging-Alzheimer's Association workgroups on workgroups on diagnostic guidelines for Alzheimer's disease. McKhann GM, Knopman DS, Chertkow H, Hyman BT, Jack CR Jr, Kawas CH, Klunk WE, Koroshetz WJ, Manly JJ, Mayeux R, Mohs RC, Morris JC, Rossor MN, Scheltens P, Carrillo MC, Thies B, Weintraub S, Phelps CH. Alzheimers Dement. 2011 May;7(3):263-9. The diagnosis of mild cognitive impairment due to Alzheimer's disease: Recommendations from the National Institute on Aging-Alzheimer's Association workgroups on diagnostic guidelines for Alzheimer's disease. Albert MS, Dekosky ST, Dickson D, Dubois B, Feldman HH, Fox NC, Gamst A, Holtzman DM, Jagust WJ, Petersen RC, Snyder PJ, Carrillo MC, Thies B, Phelps CH. Alzheimers Dement. 2011 May;7(3):270-9. Toward defining the preclinical stages of Alzheimer's disease: Recommendations from the National Institute on Aging-Alzheimer's Association workgroups on diagnostic guidelines for Alzheimer's disease. Sperling RA, Aisen PS, Beckett LA, Bennett DA, Craft S, Fagan AM, Iwatsubo T, Jack CR Jr, Kaye J, Montine TJ, Park DC, Reiman EM, Rowe CC, Siemers E, Stern Y, Yaffe K, Carril lo MC, Thies B, Morrison-Bogorad M, Wagster MV, Phelps CH. Alzheimers Dement. 2011 May;7(3):280-92.
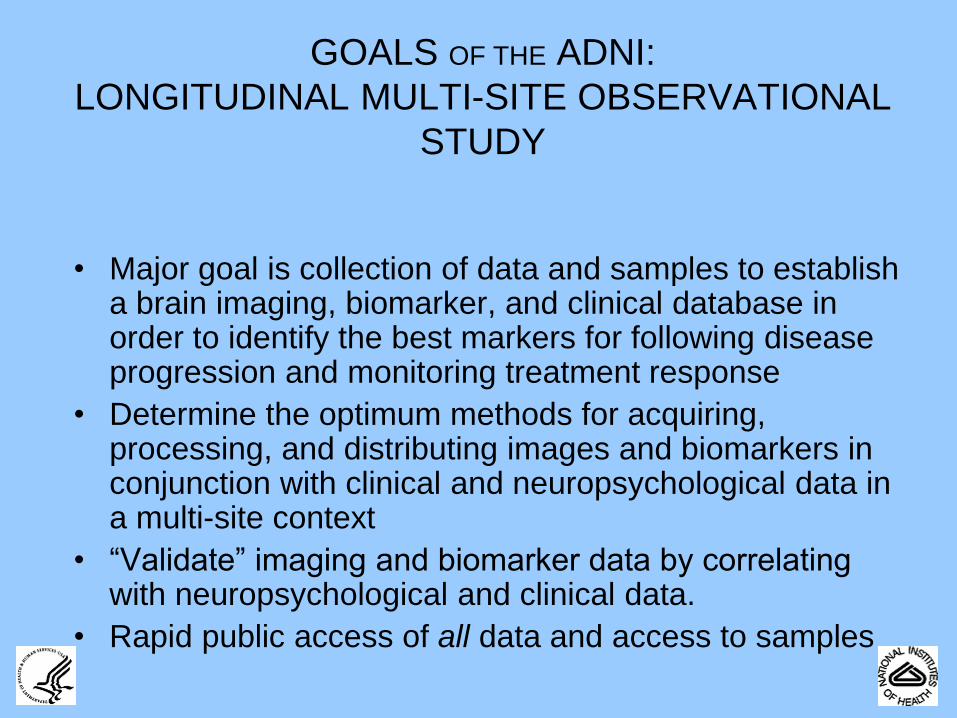
GOALS OF THE ADNI:
LONGITUDINAL MULTI-SITE OBSERVATIONAL
STUDY
• Major goal is collection of data and samples to establish a brain imaging, biomarker, and clinical database in order to identify the best markers for following disease progression and monitoring treatment response
• Determine the optimum methods for acquiring, processing, and distributing images and biomarkers in conjunction with clinical and neuropsychological data in a multi-site context
• “Validate” imaging and biomarker data by correlating with neuropsychological and clinical data.
• Rapid public access of all data and access to samples
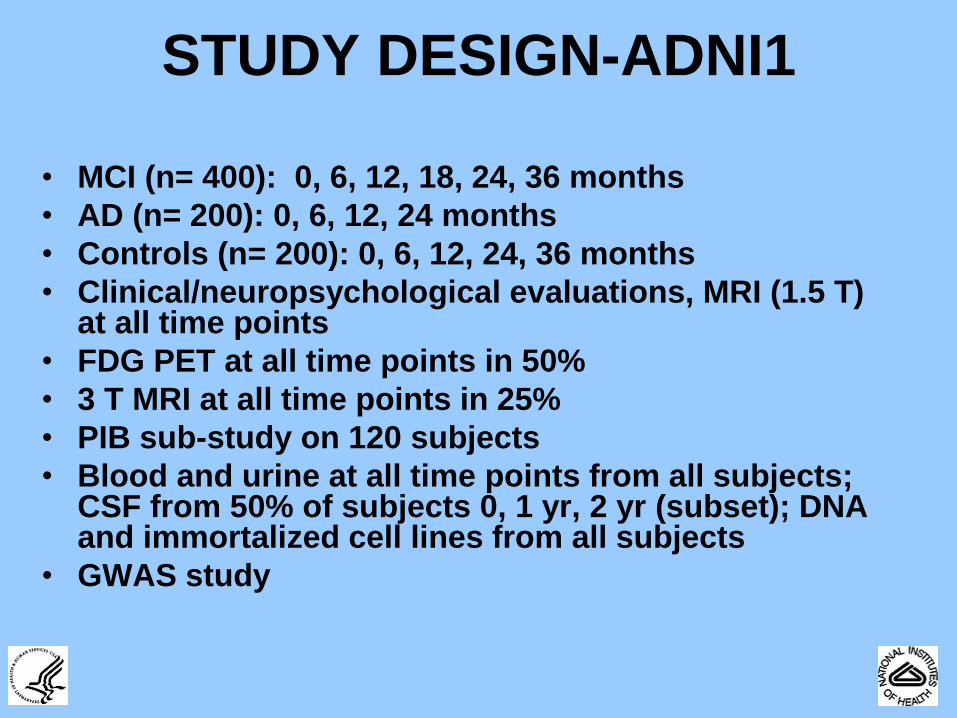
STUDY DESIGN-ADNI1
• MCI (n= 400): 0, 6, 12, 18, 24, 36 months
• AD (n= 200): 0, 6, 12, 24 months
• Controls (n= 200): 0, 6, 12, 24, 36 months
• Clinical/neuropsychological evaluations, MRI (1.5 T) at all time points
• FDG PET at all time points in 50%
• 3 T MRI at all time points in 25%
• PIB sub-study on 120 subjects
• Blood and urine at all time points from all subjects; CSF from 50% of subjects 0, 1 yr, 2 yr (subset); DNA and immortalized cell lines from all subjects
• GWAS study
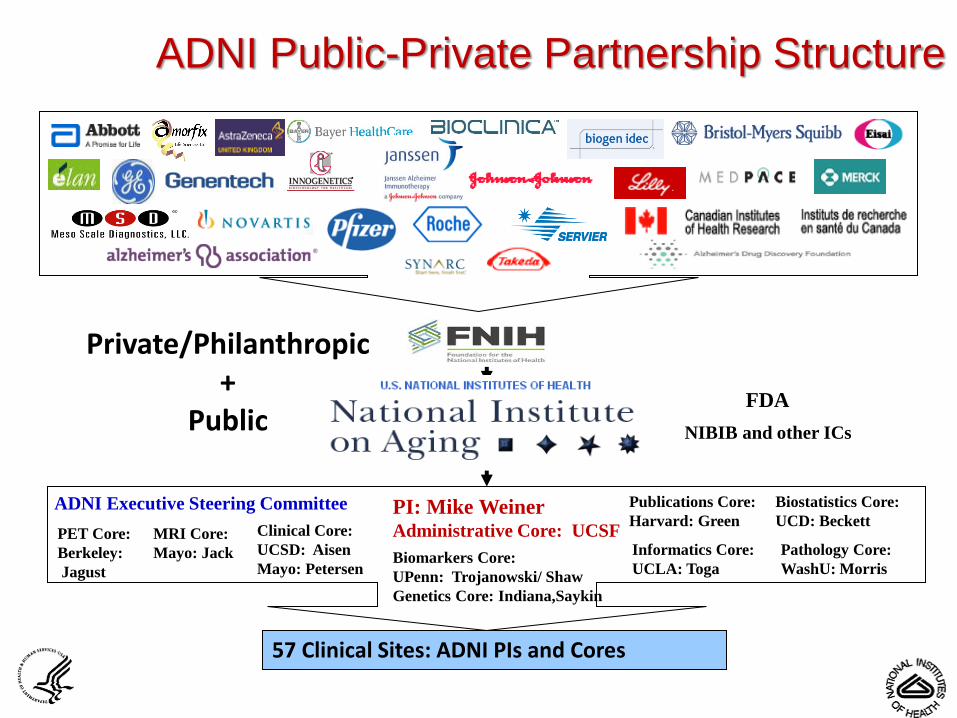
ADNI Public-Private Partnership Structure
NIBIB and other ICs
PI: Mike Weiner Administrative Core: UCSF
FDA
Biostatistics Core:
UCD: Beckett
Biomarkers Core:
UPenn: Trojanowski/ Shaw
Genetics Core: Indiana,Saykin
MRI Core:
Mayo: Jack
Clinical Core:
UCSD: Aisen
Mayo: Petersen
PET Core:
Berkeley:
Jagust
Informatics Core:
UCLA: Toga
Publications Core:
Harvard: Green
Pathology Core:
WashU: Morris
57 Clinical Sites: ADNI PIs and Cores
ADNI Executive Steering Committee
Private/Philanthropic +
Public
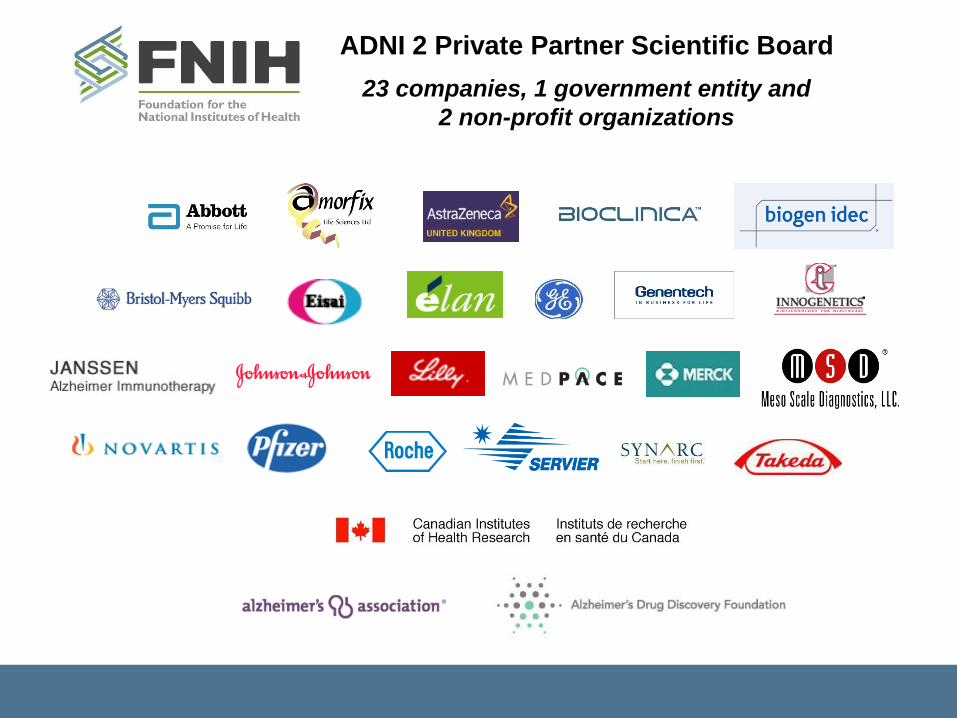
ADNI 2 Private Partner Scientific Board
23 companies, 1 government entity and
2 non-profit organizations
ADNI MRI
Standardization Methods
Steps taken before Subject
Enrollment Began
Our goal: Standardization of image qualities (CNR, spatial resolution, resistance to artifact, reliability) across sites/platforms, and consistency across time in the face of ongoing upgrades
Site equipment survey – determine technical specifications for each potential scanner in the study, select optimum scanner at each site
Create a generic, non-platform specific MRI protocol
Organize vendor support
With vendor support, create a platform specific protocol for each scanner – 91 scanners, 48 distinct compiled versions of the ADNI protocol
Deliver protocol to each scanner electronically, not manual creation
Create an ADNI MRI procedures manual and deliver to sites
Phone/email training of MRI site personnel by ADNI MR tech
Site certification – phantom and human volunteer scans
Ongoing Standardization
Methods During Study Recertification of scanners after upgrades (79 scanners re- certified to
date, some numerous times)
Hands-on trouble shooting by ADNI technical personal (ie MR physicist,
MR tech, radiologist)
QA of images: visual + electronic inspection in 3 areas
protocol compliance – electronically check every relevant MRI
parameter against the master protocol for that system for each image
acquired in the study, also identify scanner upgrades that were not
reported by sites
Visual inspection and rating of image quality – request patient re scan
if necessary
Identify medical abnormalities – for inclusion/exclusion as well as
medical care purposes
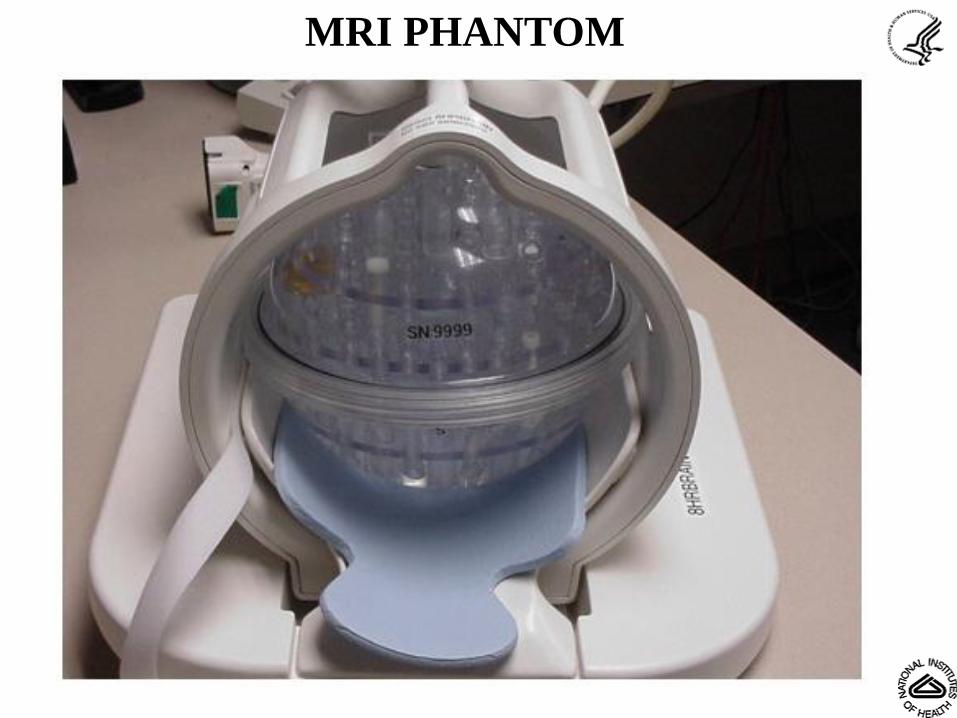
MRI PHANTOM

Data and Sample Sharing
• Goal is rapid public access of all raw and processed data
• Central repository for all QA’d MRI and PET [Laboratory of Neuroimaging, UCLA (LONI)]
• Clinical data base at UCSD is linked to LONI
• Databases- in the public domain, available to all qualified investigators
• Sample sharing-Resource Allocation Review Committee
• No special access
• Data Sharing & Publication Committee (DPC)
-ADNI Data Use Agreement

ADNI1 Demographics
CP1307278-1
Normal controls MCI AD (n=229) (n=398) (n=192) P
Age, mean (SD) 76.4 (5.0) 75.3 (7.5) 75.8 (7.4) 0.15
Female (%) 48.0 35.4 47.4 0.002
Years of education, 15.6 (3.1) 16.0 (2.9) 14.7 (3.1) <0.001 mean (SD)
Apolipoprotein E e4: 26.6 53.5 65.6 <0.001 Positive (%)
Subject Evaluation
• Baseline/screening eval and q 6 mo. – Labs, Apo E
– Hamilton(S)
– Beck
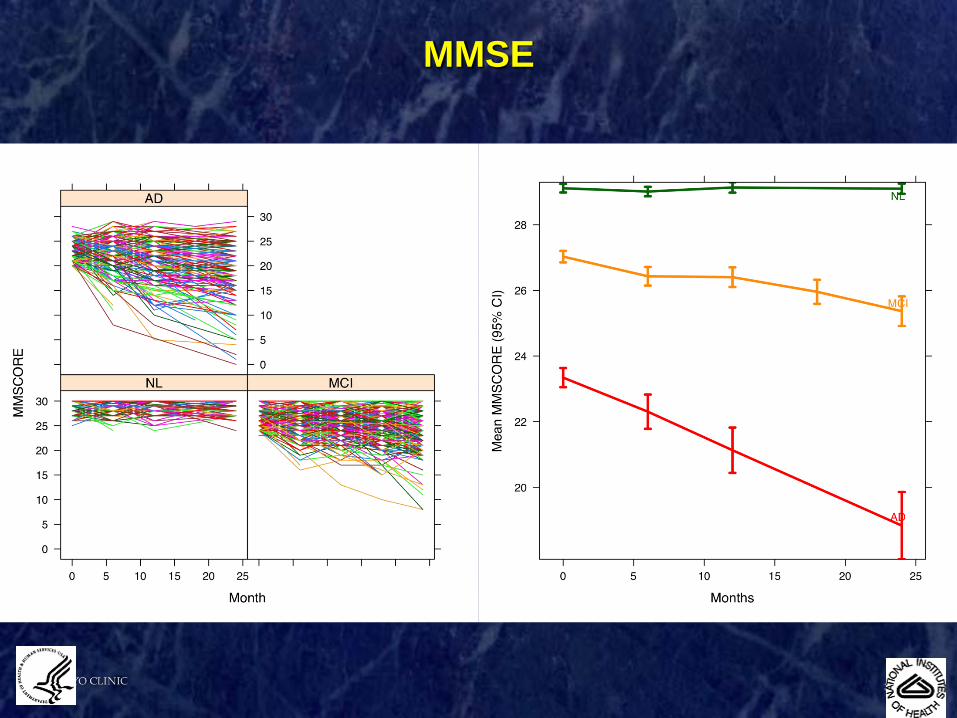
– MMSE
– ANART
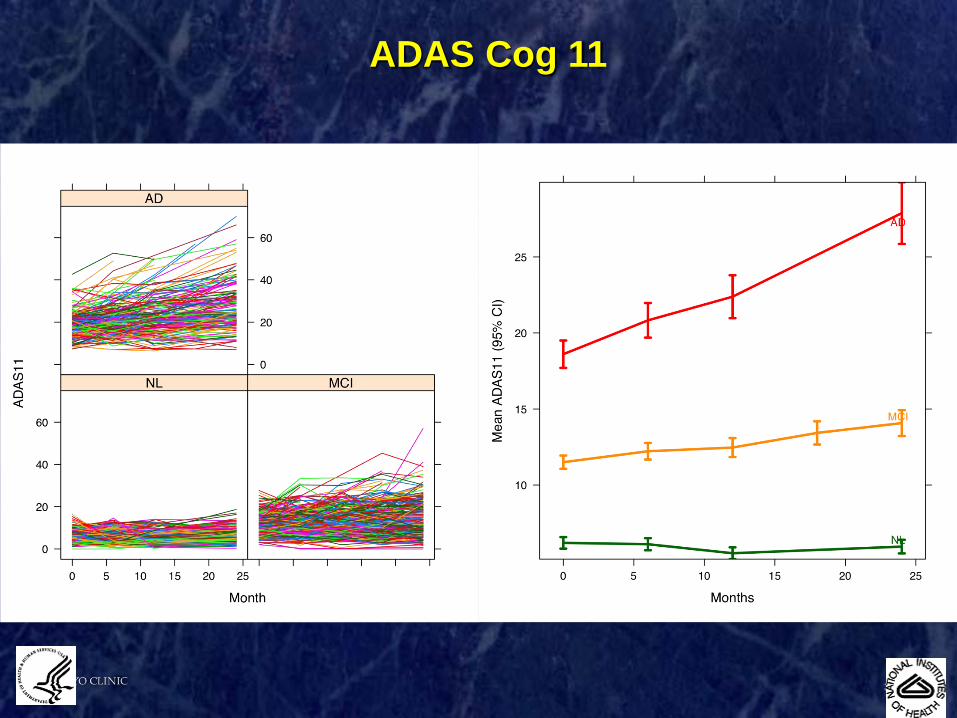
– ADAS-cog
– NPI
– CDR
– ADL
• Neuropsyc(B and q 6 mo) – Logical Memory(S)
– AVLT
– BNT
– Trails A &B
– Symbol digit
– Clock drawing
– Category fluency
3003731-7
ADAS Cog 11
3003731-9
MMSE
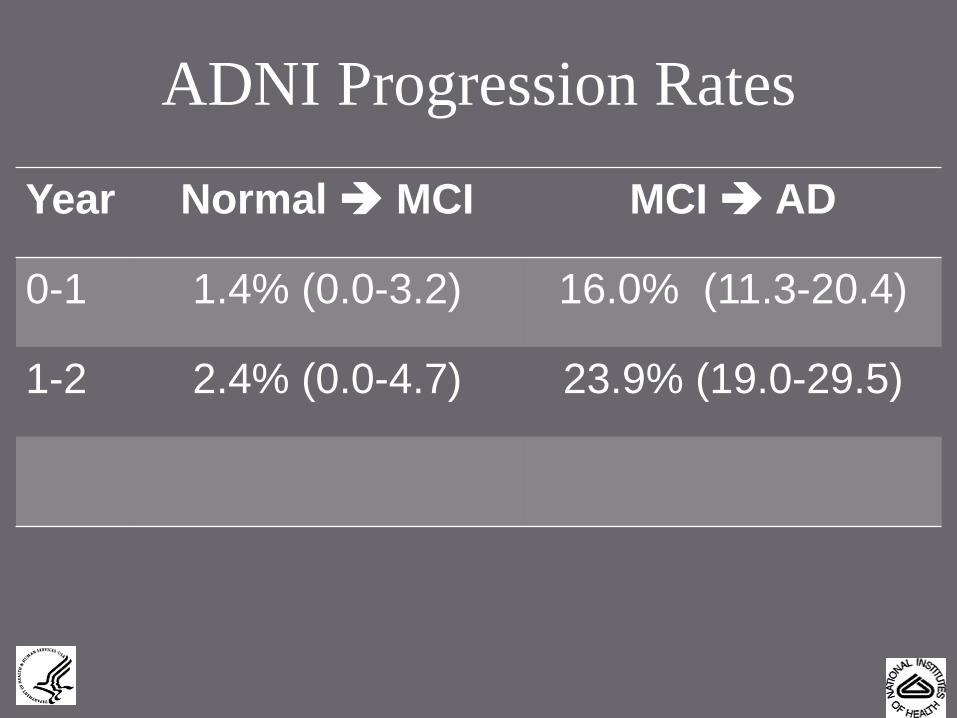
ADNI Progression Rates
Year Normal MCI MCI AD
0-1 1.4% (0.0-3.2) 16.0% (11.3-20.4)
1-2 2.4% (0.0-4.7) 23.9% (19.0-29.5)
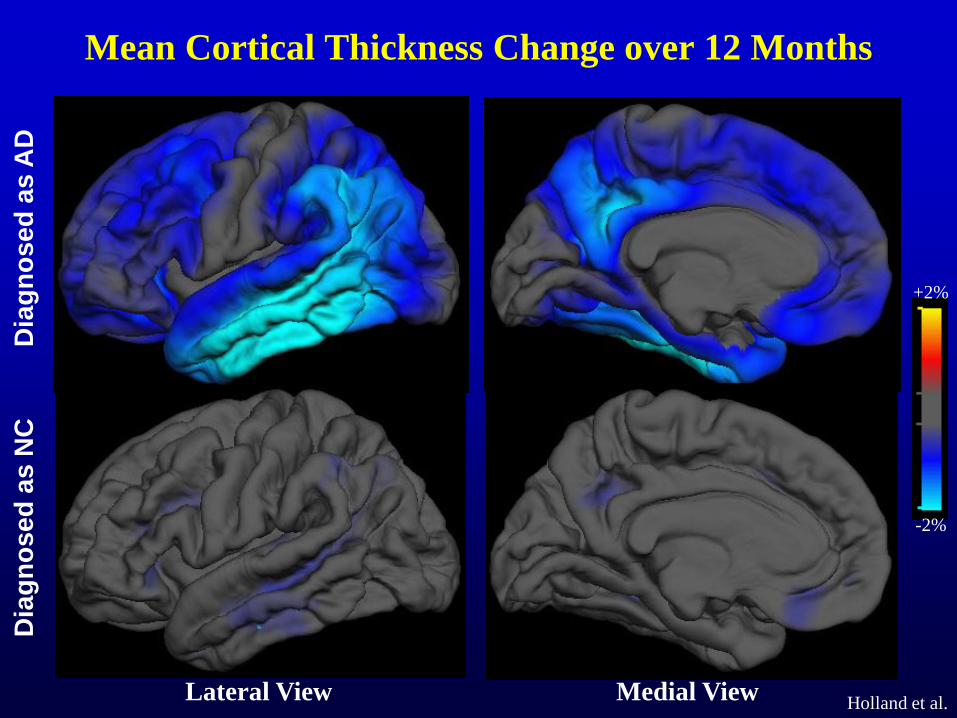
Mean Cortical Thickness Change over 12 Months
Holland et al.
Dia
gn
os
ed
as
NC
D
iag
no
se
d a
s A
D
+2%
-2%
Lateral View Medial View
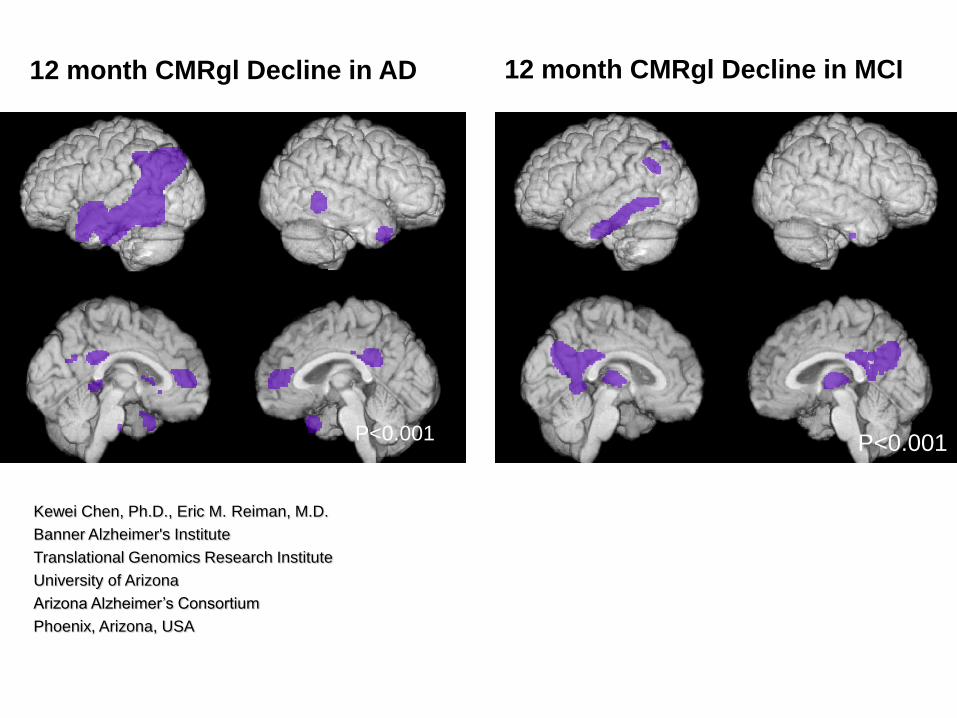
12 month CMRgl Decline in AD
P<0.001
P<0.001
12 month CMRgl Decline in MCI
P<0.001
Kewei Chen, Ph.D., Eric M. Reiman, M.D.
Banner Alzheimer's Institute
Translational Genomics Research Institute
University of Arizona
Arizona Alzheimer’s Consortium
Phoenix, Arizona, USA
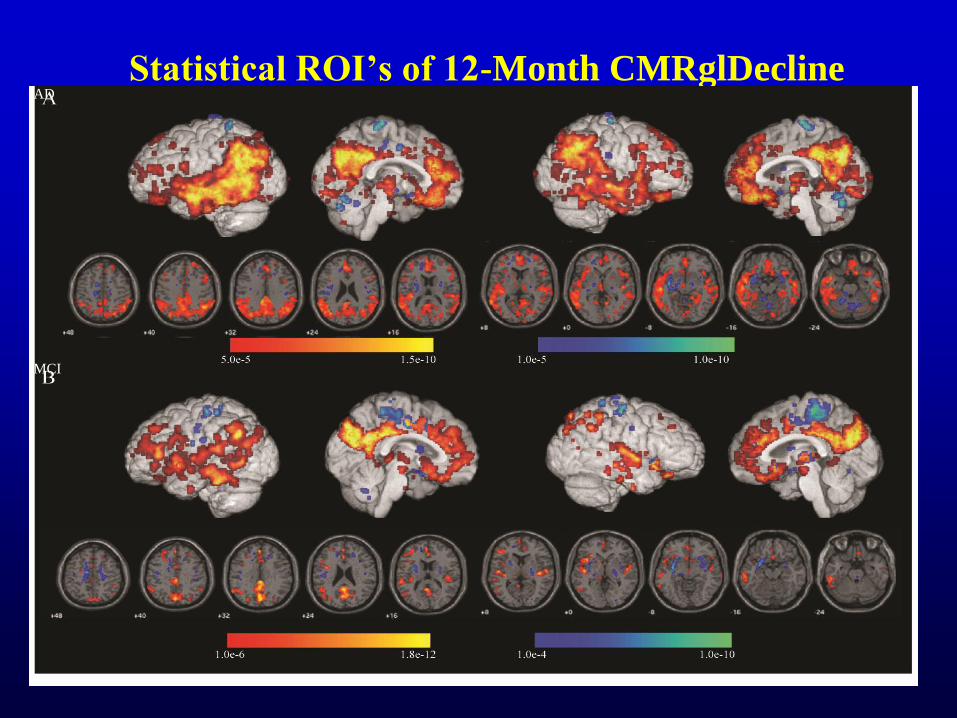
Statistical ROI’s of 12-Month CMRglDecline AD
MCI
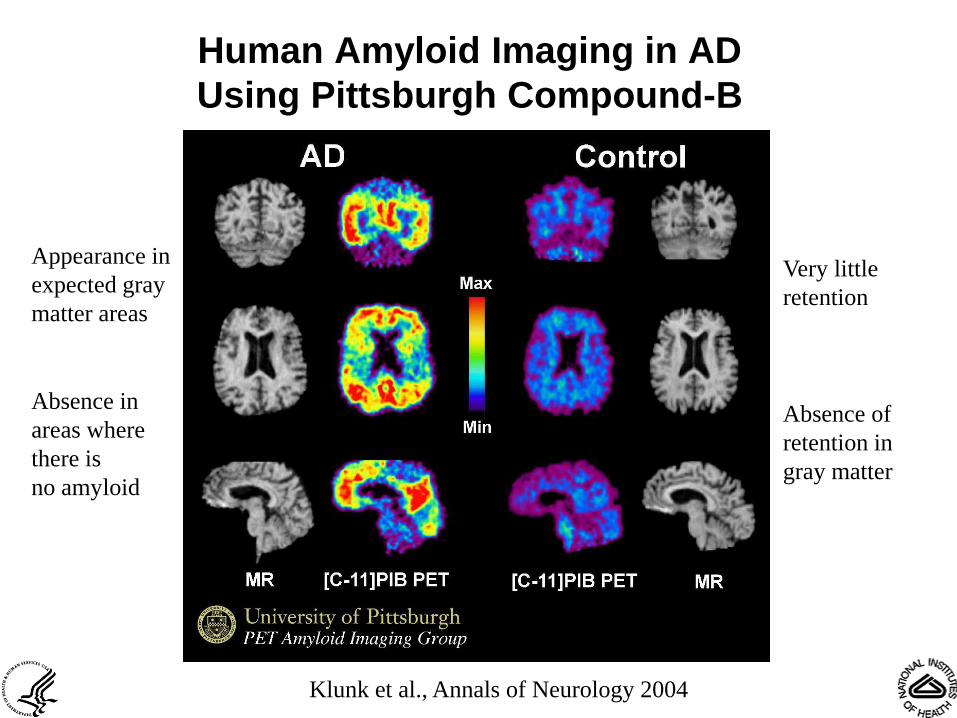
Human Amyloid Imaging in AD
Using Pittsburgh Compound-B
Very little
retention
Absence of
retention in
gray matter
Appearance in
expected gray
matter areas
Absence in
areas where
there is
no amyloid
Klunk et al., Annals of Neurology 2004
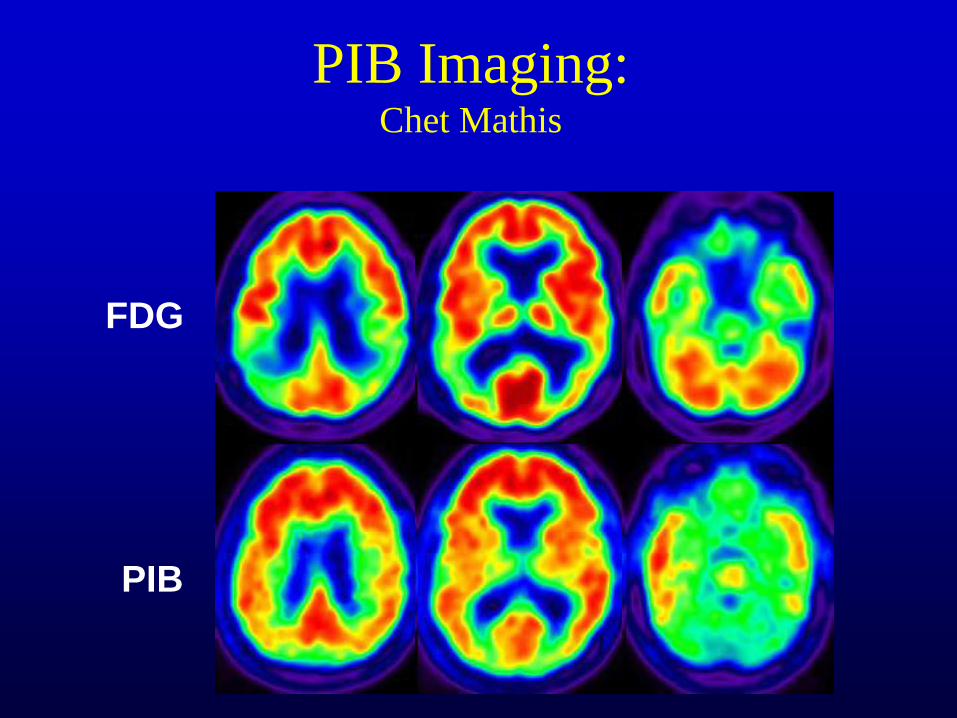
PIB Imaging: Chet Mathis
FDG
PIB
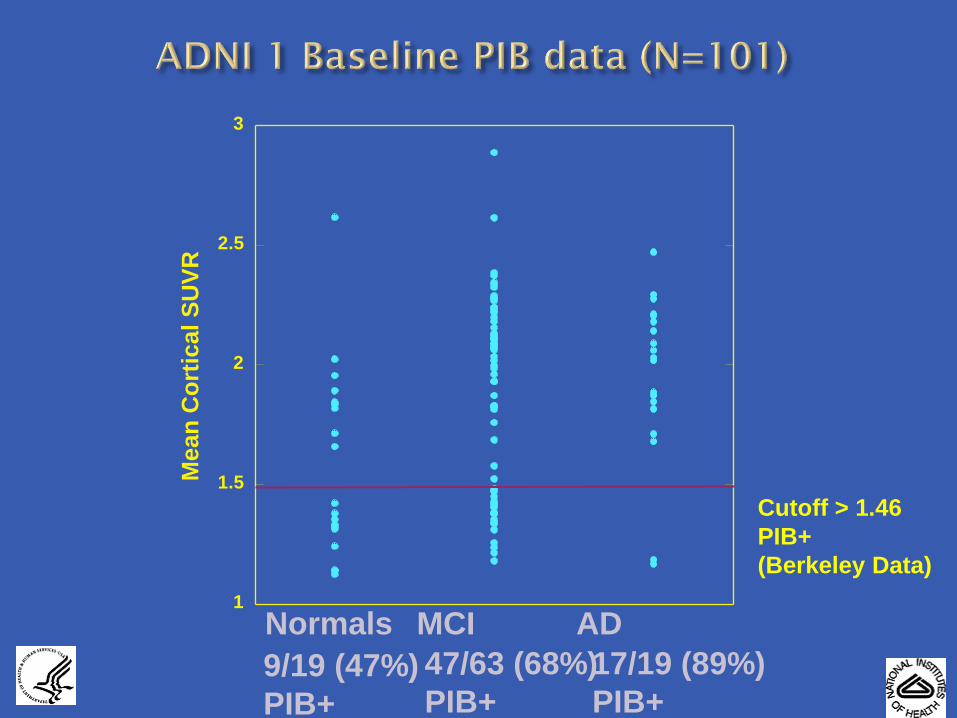
1
1.5
2
2.5
3
Me
an
Co
rtic
al
SU
VR
Cutoff > 1.46
PIB+
(Berkeley Data)
Normals
9/19 (47%)
PIB+
MCI
47/63 (68%)
PIB+
AD
17/19 (89%)
PIB+

Follow-Up of PIB-Positive ADNI MCI’s
PiB(+) 47
Converters to AD 21
PiB(-) 18
Converters to AD 3
ADNI PiB MCI’s
N = 65, 12 mo. follow-up

HC
(n=106)
MCI
(n=65)
PiB-ve Subjects: 74
Converters to naMCI 2 (3%)
PiB+ve Subjects: 32
Converters to MCI/AD 8 (25%)
PiB+ve Subjects: 45
Converters to AD 32 (71%)
PiB-ve Subjects: 20
Converters to AD: 1 (5%)
Converters to DLB: 2 (10%)
Converters to FTD: 1 (5%)
Converters to VaD: 1 (5%)
Prediction of Conversion (3 yrs):AIBL Study
Rowe et al
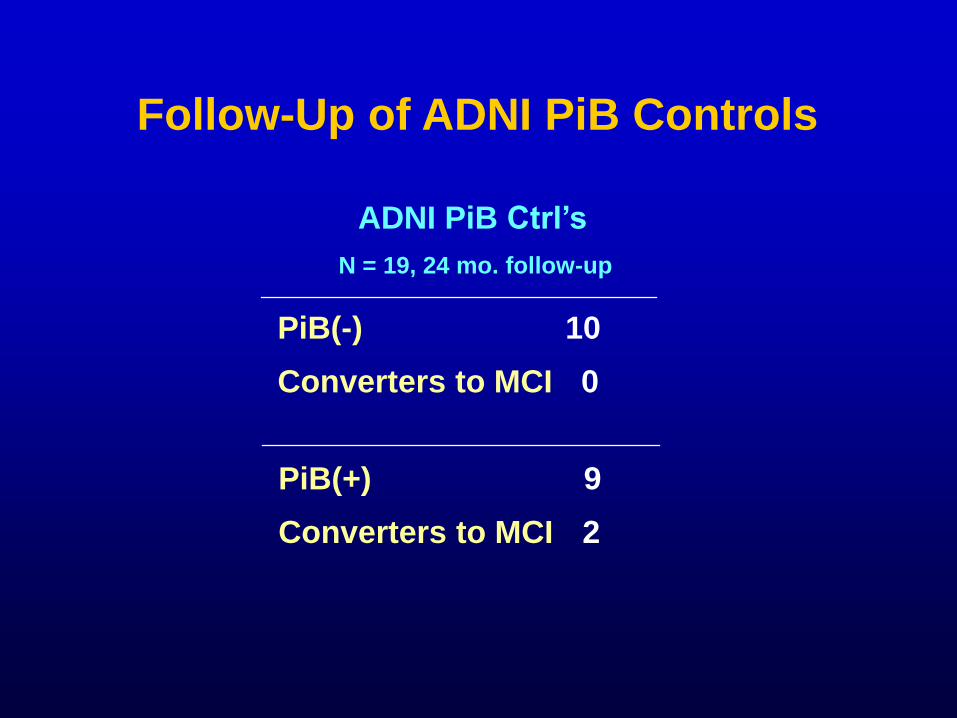
Follow-Up of ADNI PiB Controls
ADNI PiB Ctrl’s
N = 19, 24 mo. follow-up
PiB(+) 9
Converters to MCI 2
PiB(-) 10
Converters to MCI 0
Total Tau, p-Tau181p and Ab1-42 in
CSF of ADNI subjects at Baseline
using a bioanalytically validated
xMAP Luminex immunoassay
system and Innogenetics
immunoassay reagents
Clinical Core
Leslie M Shaw, John Trojanowski
University of Pennsylvania Medical Center
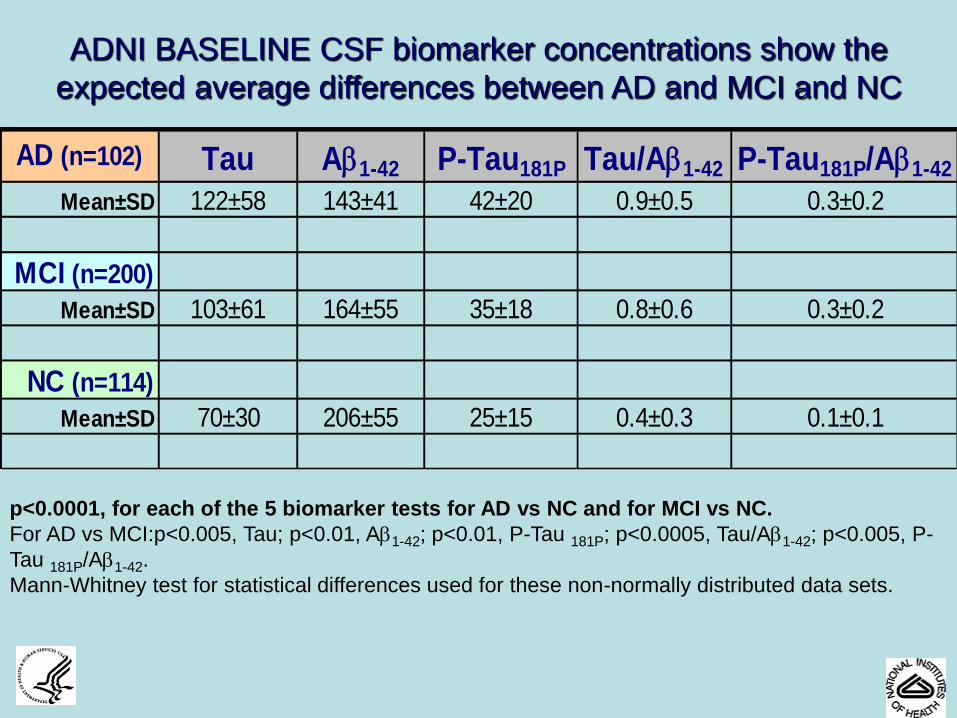
AD (n=102) Tau Ab1-42 P-Tau181P Tau/Ab1-42 P-Tau181P/Ab1-42
Mean±SD 122±58 143±41 42±20 0.9±0.5 0.3±0.2
MCI (n=200)
Mean±SD 103±61 164±55 35±18 0.8±0.6 0.3±0.2
NC (n=114)
Mean±SD 70±30 206±55 25±15 0.4±0.3 0.1±0.1
ADNI BASELINE CSF biomarker concentrations show the
expected average differences between AD and MCI and NC
p<0.0001, for each of the 5 biomarker tests for AD vs NC and for MCI vs NC.
For AD vs MCI:p<0.005, Tau; p<0.01, Ab1-42; p<0.01, P-Tau 181P; p<0.0005, Tau/Ab1-42; p<0.005, P-
Tau 181P/Ab1-42.
Mann-Whitney test for statistical differences used for these non-normally distributed data sets.
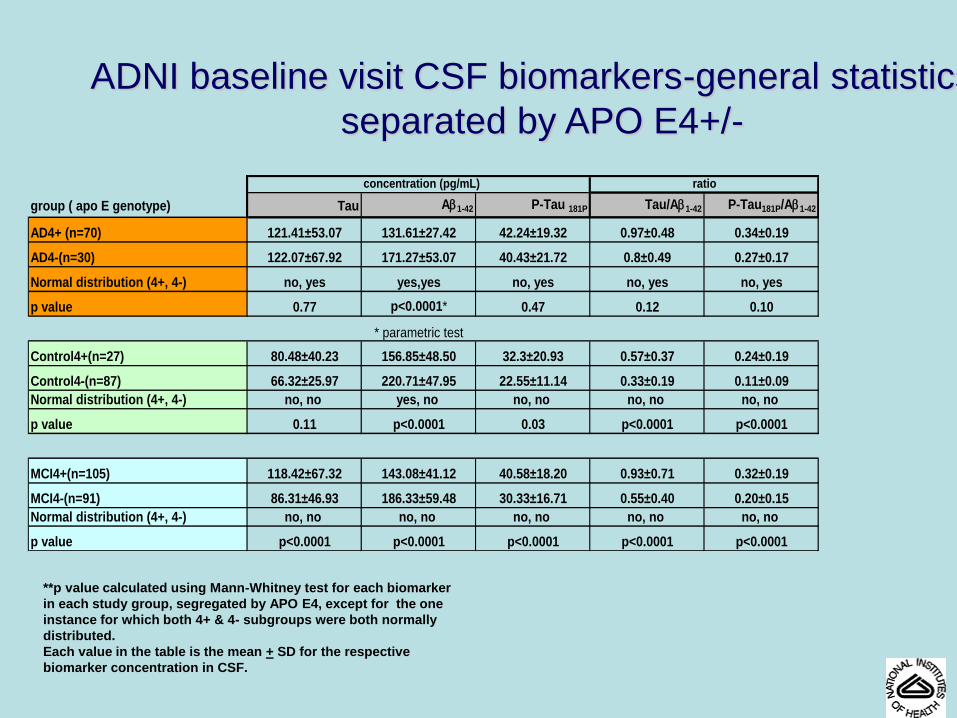
ADNI baseline visit CSF biomarkers-general statistics,
separated by APO E4+/-
concentration (pg/mL)
group ( apo E genotype) Tau Ab1-42 P-Tau 181P Tau/Ab1-42 P-Tau181P/Ab1-42
AD4+ (n=70) 121.41±53.07 131.61±27.42 42.24±19.32 0.97±0.48 0.34±0.19
AD4-(n=30) 122.07±67.92 171.27±53.07 40.43±21.72 0.8±0.49 0.27±0.17
Normal distribution (4+, 4-) no, yes yes,yes no, yes no, yes no, yes
p value 0.77 p<0.0001* 0.47 0.12 0.10
* parametric test
Control4+(n=27) 80.48±40.23 156.85±48.50 32.3±20.93 0.57±0.37 0.24±0.19
Control4-(n=87) 66.32±25.97 220.71±47.95 22.55±11.14 0.33±0.19 0.11±0.09
Normal distribution (4+, 4-) no, no yes, no no, no no, no no, no
p value 0.11 p<0.0001 0.03 p<0.0001 p<0.0001
MCI4+(n=105) 118.42±67.32 143.08±41.12 40.58±18.20 0.93±0.71 0.32±0.19
MCI4-(n=91) 86.31±46.93 186.33±59.48 30.33±16.71 0.55±0.40 0.20±0.15
Normal distribution (4+, 4-) no, no no, no no, no no, no no, no
p value p<0.0001 p<0.0001 p<0.0001 p<0.0001 p<0.0001
ratio
**p value calculated using Mann-Whitney test for each biomarker
in each study group, segregated by APO E4, except for the one
instance for which both 4+ & 4- subgroups were both normally
distributed.
Each value in the table is the mean + SD for the respective
biomarker concentration in CSF.
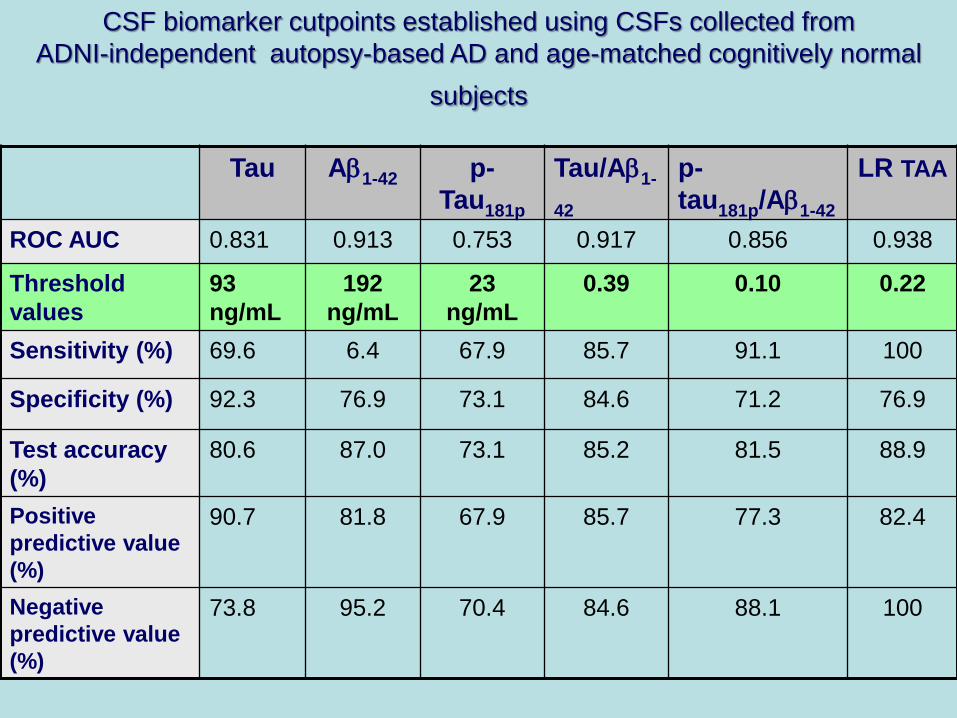
Tau Ab1-42 p-
Tau181p
Tau/Ab1-
42
p-
tau181p/Ab1-42
LR TAA
ROC AUC 0.831 0.913 0.753 0.917 0.856 0.938
Threshold
values
93
ng/mL
192
ng/mL
23
ng/mL
0.39 0.10 0.22
Sensitivity (%) 69.6 6.4 67.9 85.7 91.1 100
Specificity (%) 92.3 76.9 73.1 84.6 71.2 76.9
Test accuracy
(%)
80.6 87.0 73.1 85.2 81.5 88.9
Positive
predictive value
(%)
90.7 81.8 67.9 85.7 77.3 82.4
Negative
predictive value
(%)
73.8 95.2 70.4 84.6 88.1 100
CSF biomarker cutpoints established using CSFs collected from
ADNI-independent autopsy-based AD and age-matched cognitively normal
subjects
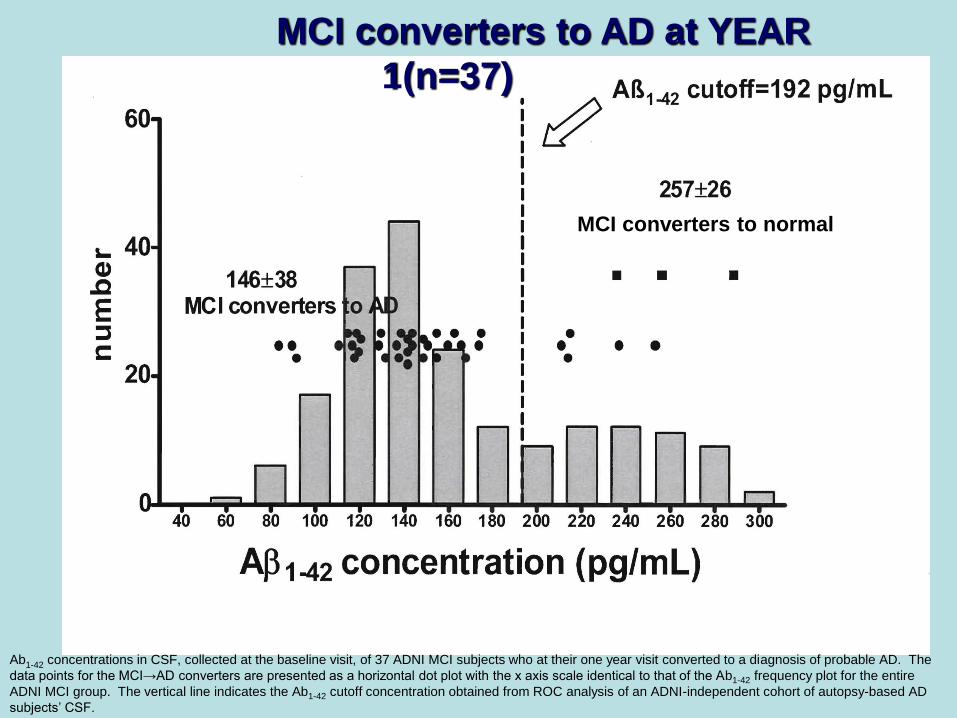
Ab1-42 concentrations in CSF, collected at the baseline visit, of 37 ADNI MCI subjects who at their one year visit converted to a diagnosis of probable AD. The
data points for the MCI→AD converters are presented as a horizontal dot plot with the x axis scale identical to that of the Ab1-42 frequency plot for the entire
ADNI MCI group. The vertical line indicates the Ab1-42 cutoff concentration obtained from ROC analysis of an ADNI-independent cohort of autopsy-based AD
subjects’ CSF.
MCI converters to AD at YEAR
1(n=37)
MCI converters to normal
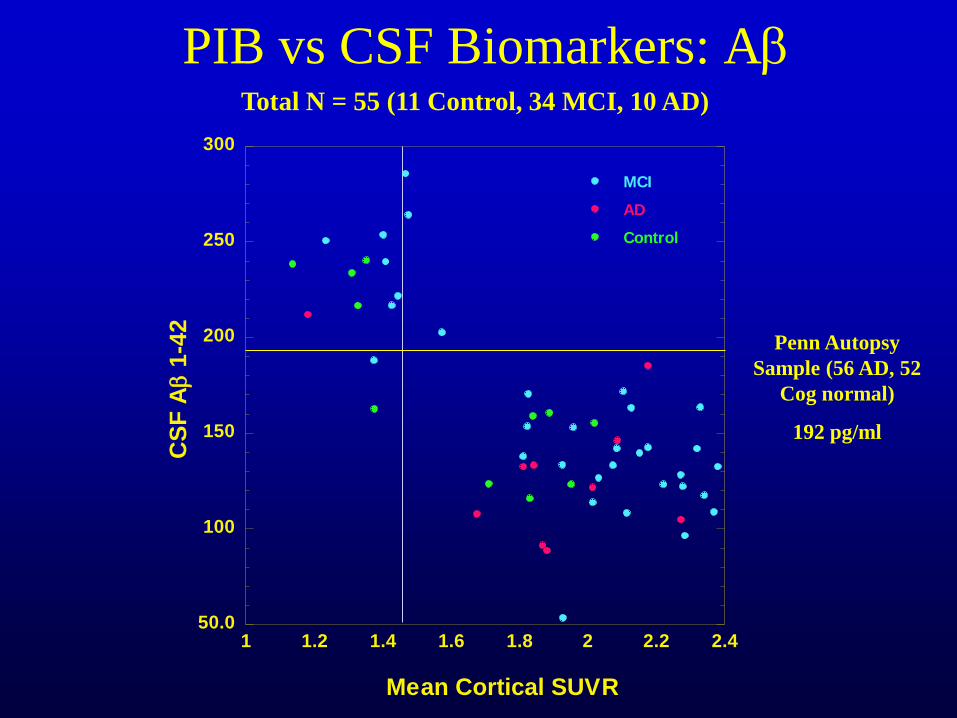
PIB vs CSF Biomarkers: Ab
Penn Autopsy
Sample (56 AD, 52
Cog normal)
192 pg/ml
50.0
100
150
200
250
300
1 1.2 1.4 1.6 1.8 2 2.2 2.4
MCI
AD
Control
CS
F Ab 1
-42
Mean Cortical SUVR
Total N = 55 (11 Control, 34 MCI, 10 AD)
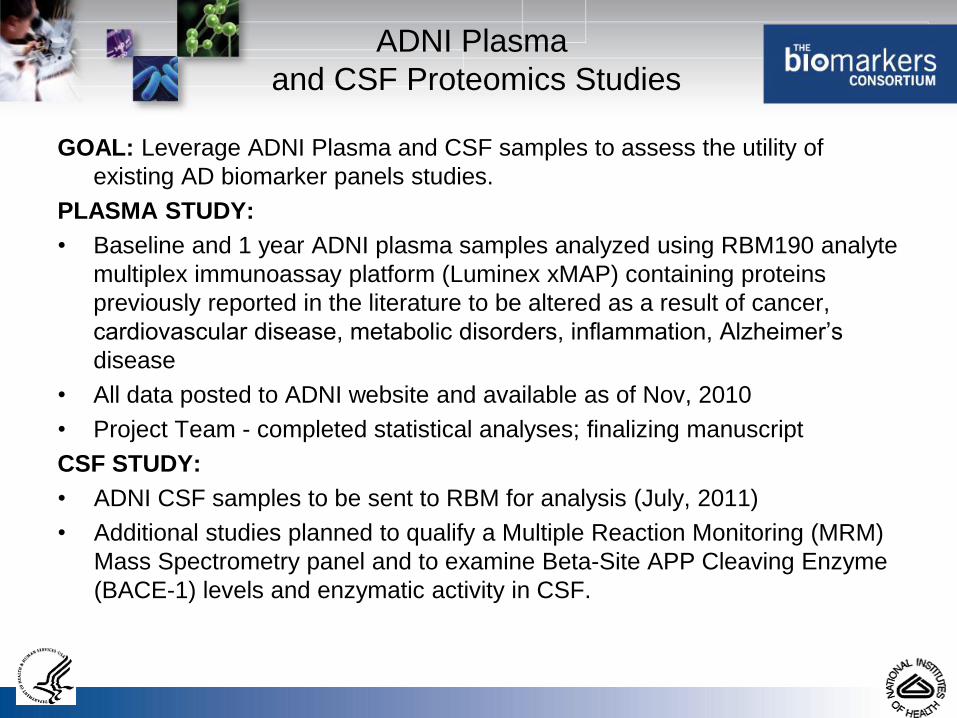
GOAL: Leverage ADNI Plasma and CSF samples to assess the utility of
existing AD biomarker panels studies.
PLASMA STUDY:
• Baseline and 1 year ADNI plasma samples analyzed using RBM190 analyte
multiplex immunoassay platform (Luminex xMAP) containing proteins
previously reported in the literature to be altered as a result of cancer,
cardiovascular disease, metabolic disorders, inflammation, Alzheimer’s
disease
• All data posted to ADNI website and available as of Nov, 2010
• Project Team - completed statistical analyses; finalizing manuscript
CSF STUDY:
• ADNI CSF samples to be sent to RBM for analysis (July, 2011)
• Additional studies planned to qualify a Multiple Reaction Monitoring (MRM)
Mass Spectrometry panel and to examine Beta-Site APP Cleaving Enzyme
(BACE-1) levels and enzymatic activity in CSF.
ADNI Plasma
and CSF Proteomics Studies
• Using data from two independent cohorts (Penn & WU) we identified 16 analytes that were associated with MCI and AD and 5 of them were validated in a third independent cohort (ADNI).
• In addition two of the five analytes that were validated in the final step correlated with the CSF Aβ 1-42 and tau.
• Validation of new potential biomarkers using independent cohorts is a powerful and essential screening and validation tool.
• More work needed on analytes that were replicated in 2 cohorts (Penn&WU, WU&ADNI, Penn&ADNI)
Plasma RBM studies

Hippocampal atrophy rates (L+R) – free surfer data – in ADNI
subjects with CSF Ab1-42 >192 pg/mL or <192 pg/mL
Ab1-42
<192pg/mL
Ab1-42
>192pg/mL
ALL -5.6±4.7 -2.6±4.1
AD -8.0±5.9 -4.2±3.5
MCI -4.8±3.6 -2.9±3.7
NC -3.6±3.2 -2.2±4.3
Hippocampal % atrophy rates
(BL→12 mos), for ADNI subjects
with Ab1-42< 192 or >192 pg/mL
These data show that in ADNI AD, MCI and NC
subjects the rate of hippocampal atrophy
increases at a significantly higher rate in
subjects with Ab1-42 <192 pg/mL cutoff
concentration compared to those >192 pg/mL
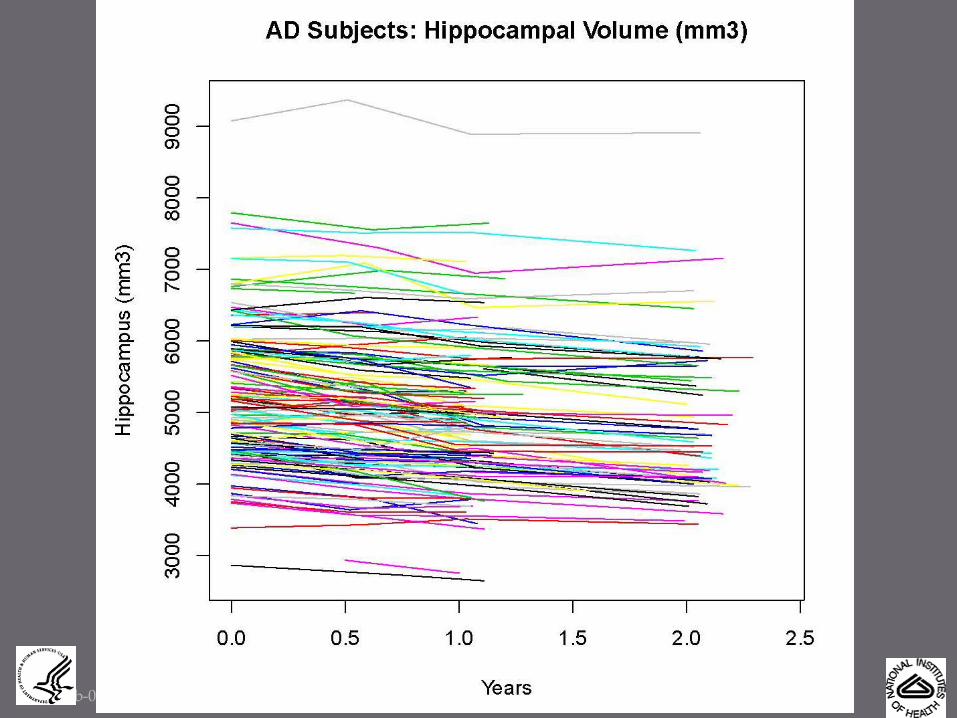
Feb-09; N. Schuff
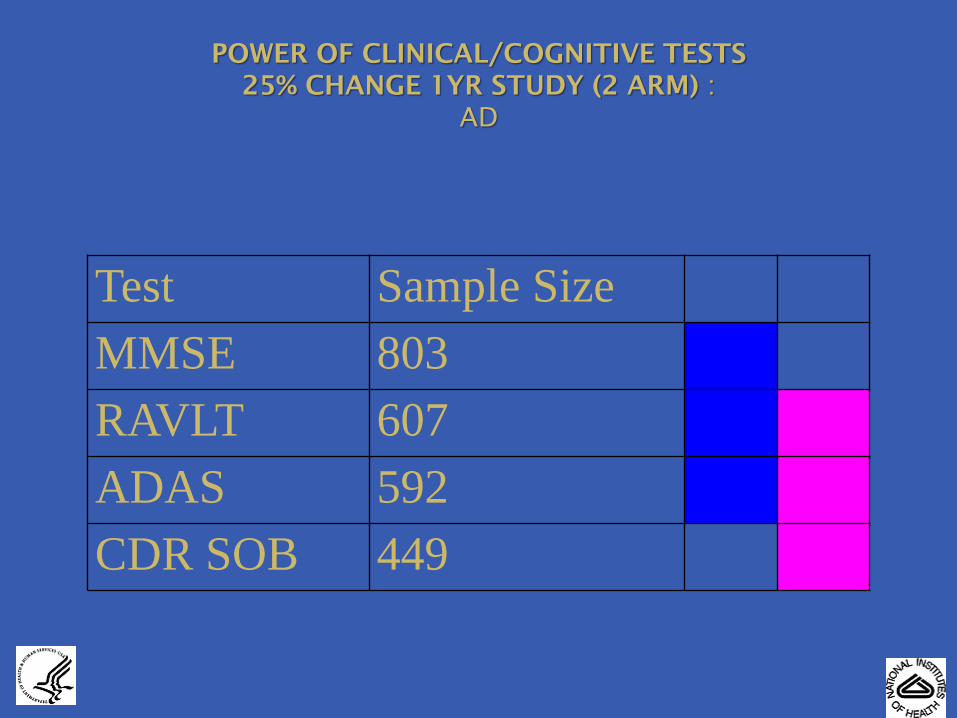
Test Sample Size
MMSE 803
RAVLT 607
ADAS 592
CDR SOB 449
POWER OF CLINICAL/COGNITIVE TESTS
25% CHANGE 1YR STUDY (2 ARM) :
AD
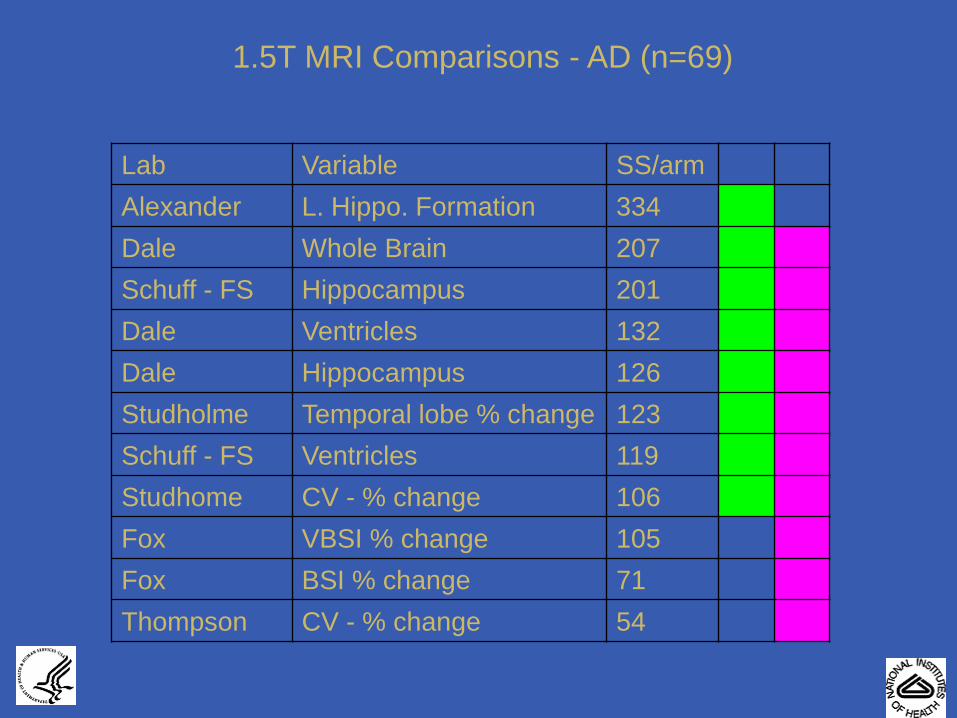
45
1.5T MRI Comparisons - AD (n=69)
Lab Variable SS/arm
Alexander L. Hippo. Formation 334
Dale Whole Brain 207
Schuff - FS Hippocampus 201
Dale Ventricles 132
Dale Hippocampus 126
Studholme Temporal lobe % change 123
Schuff - FS Ventricles 119
Studhome CV - % change 106
Fox VBSI % change 105
Fox BSI % change 71
Thompson CV - % change 54
ADNI Genotyping • Initial goal: high density genome wide scan
– Identified major microarray platforms for GWAS
• Compared marker selection strategies, HapMap coverage of genome, performance & reliability, as well as cost/sample
– Illumina platform was selected by consensus of the Genetics Committee & ISAB for this project
– TGen (Phoenix, AZ) was selected to perform the assays
– Illumina Human 610-Quad
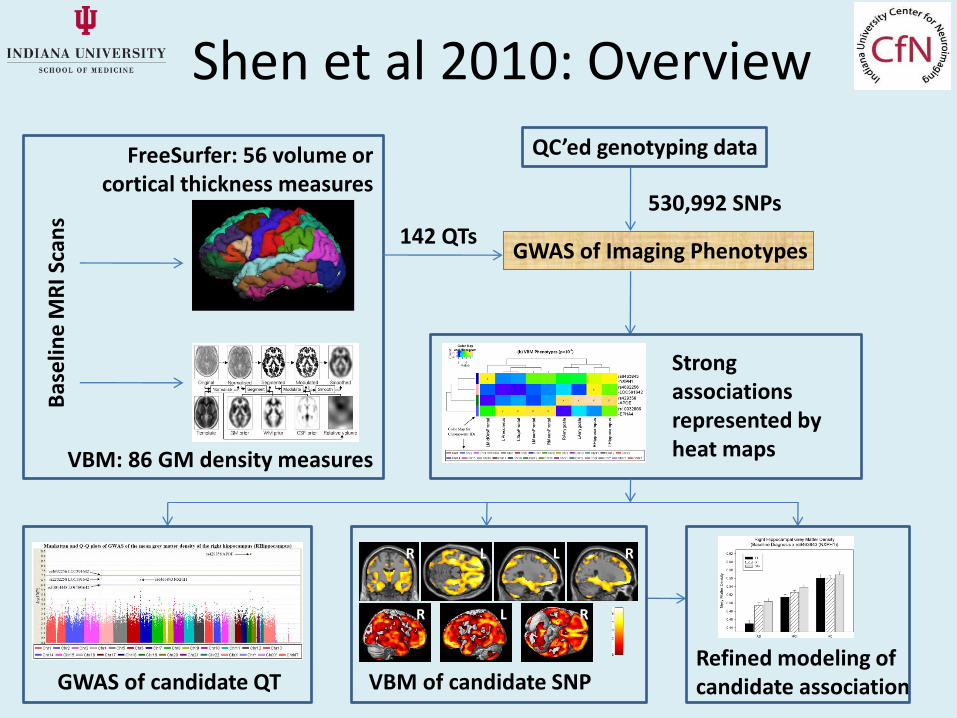
Shen et al 2010: Overview B
ase
line
MR
I Sca
ns
FreeSurfer: 56 volume or cortical thickness measures
VBM: 86 GM density measures
QC’ed genotyping data
GWAS of Imaging Phenotypes
Strong associations represented by heat maps
R L L R
R L R
GWAS of candidate QT VBM of candidate SNP Refined modeling of candidate association
530,992 SNPs
142 QTs
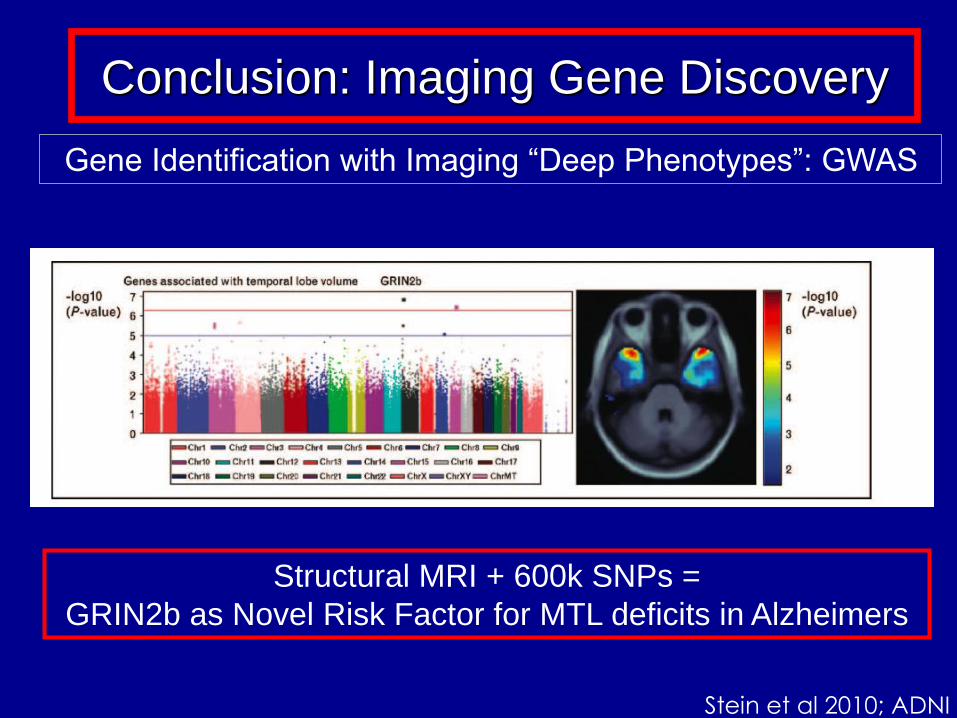
Gene Identification with Imaging “Deep Phenotypes”: GWAS
Conclusion: Imaging Gene Discovery
Structural MRI + 600k SNPs =
GRIN2b as Novel Risk Factor for MTL deficits in Alzheimers
Stein et al 2010; ADNI
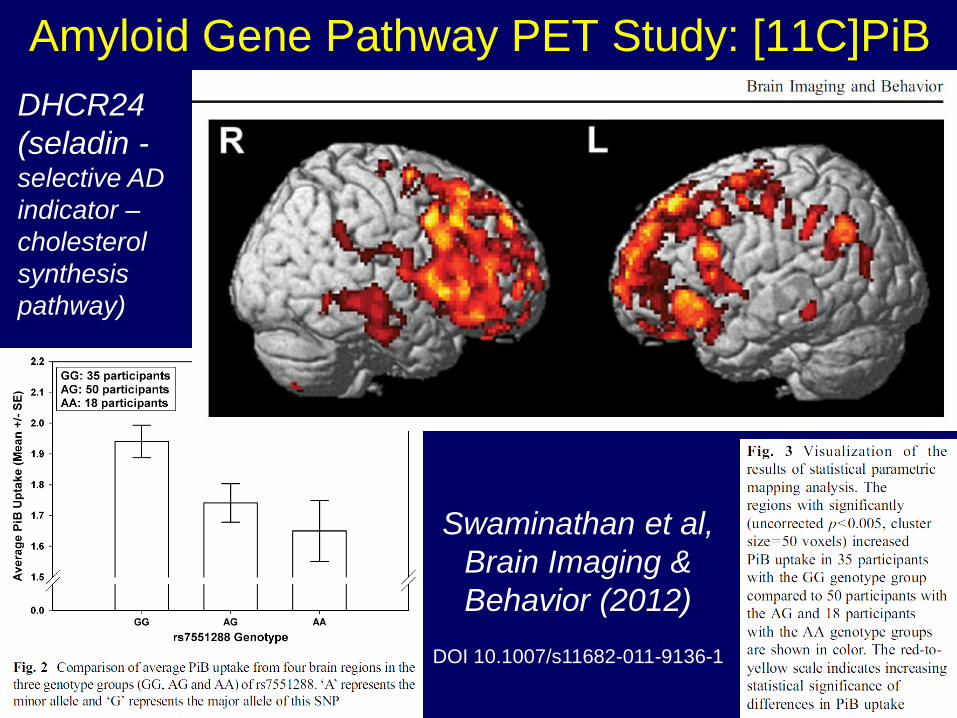
Amyloid Gene Pathway PET Study: [11C]PiB
Swaminathan et al,
Brain Imaging &
Behavior (2012)
DOI 10.1007/s11682-011-9136-1
DHCR24
(seladin - selective AD
indicator –
cholesterol
synthesis
pathway)
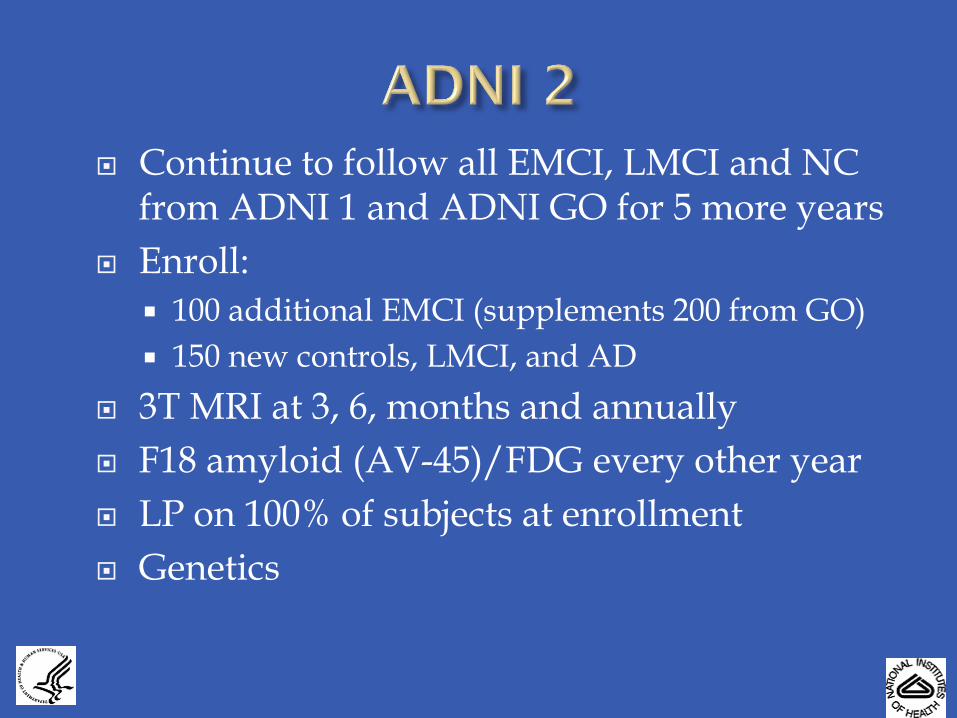
Continue to follow all EMCI, LMCI and NC from ADNI 1 and ADNI GO for 5 more years
Enroll:
100 additional EMCI (supplements 200 from GO)
150 new controls, LMCI, and AD
3T MRI at 3, 6, months and annually
F18 amyloid (AV-45)/FDG every other year
LP on 100% of subjects at enrollment
Genetics
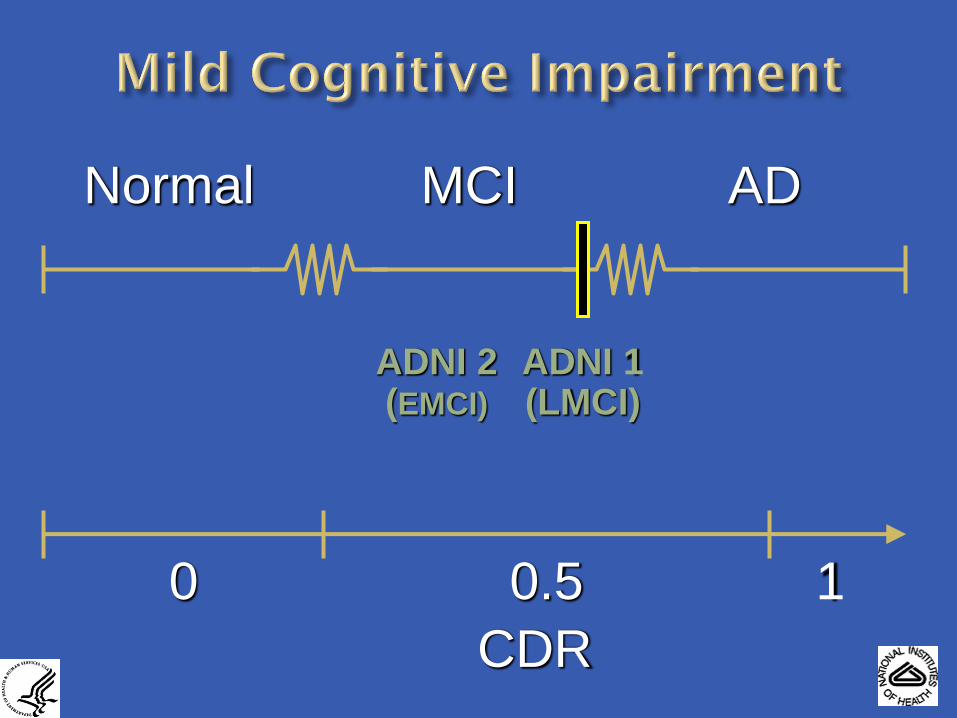
Normal MCI AD
0 0.5 1
CDR 3004153-1
ADNI 1 (LMCI)
ADNI 2 (EMCI)
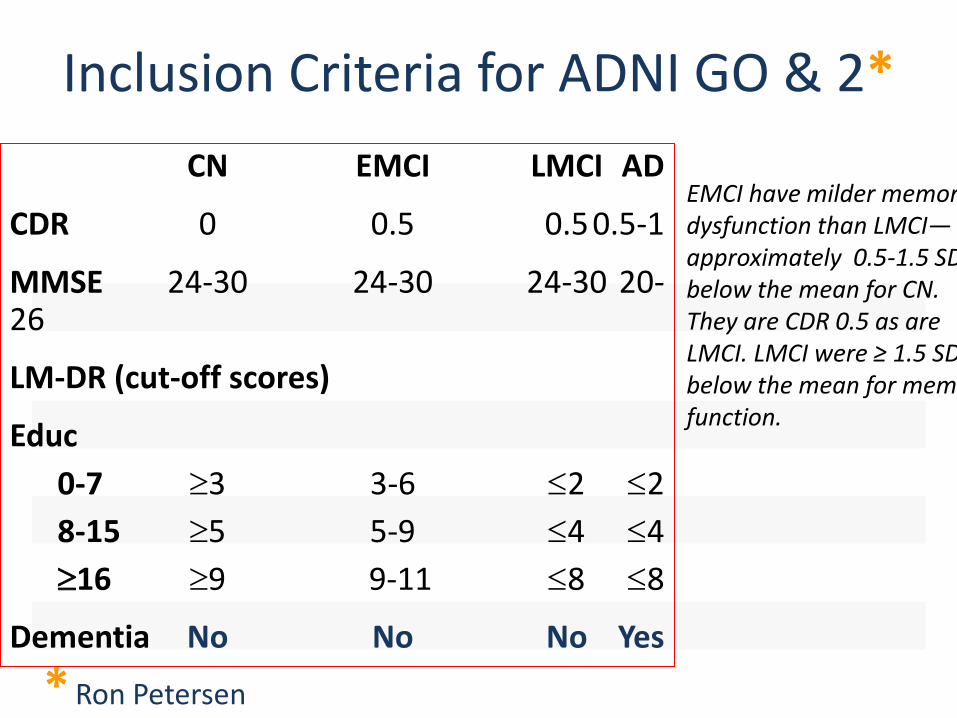
Inclusion Criteria for ADNI GO & 2*
CN EMCI LMCI AD
CDR 0 0.5 0.5 0.5-1
MMSE 24-30 24-30 24-30 20-26
LM-DR (cut-off scores)
Educ
0-7 3 3-6 2 2
8-15 5 5-9 4 4
16 9 9-11 8 8
Dementia No No No Yes
* Ron Petersen
EMCI have milder memory dysfunction than LMCI— approximately 0.5-1.5 SD below the mean for CN. They are CDR 0.5 as are LMCI. LMCI were ≥ 1.5 SD below the mean for memory function.
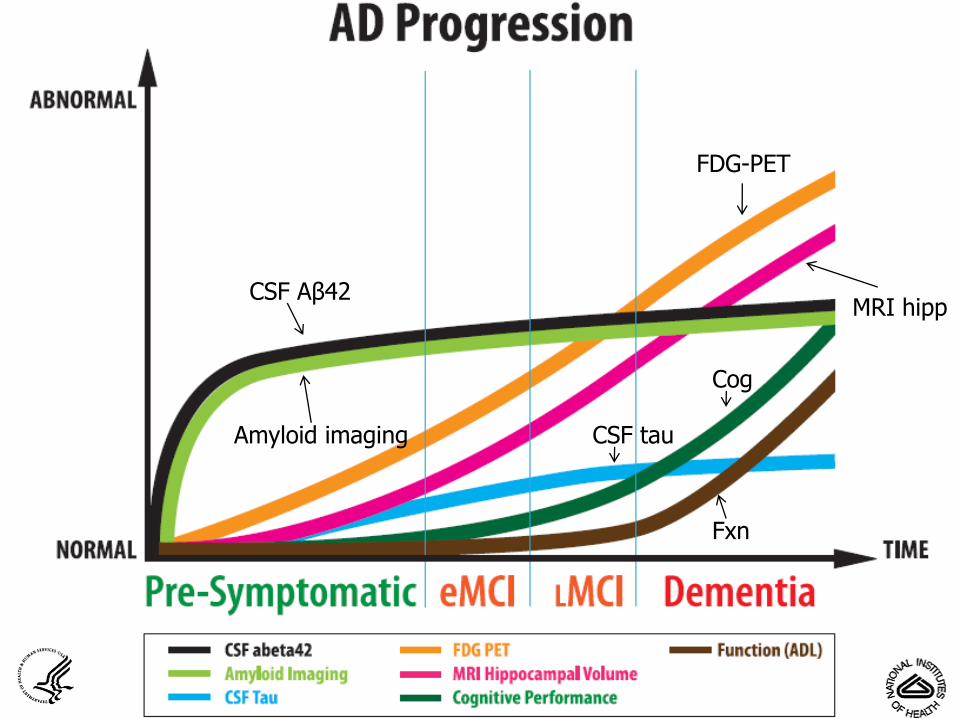
CSF Aβ42
Amyloid imaging
FDG-PET
MRI hipp
CSF tau
Cog
Fxn
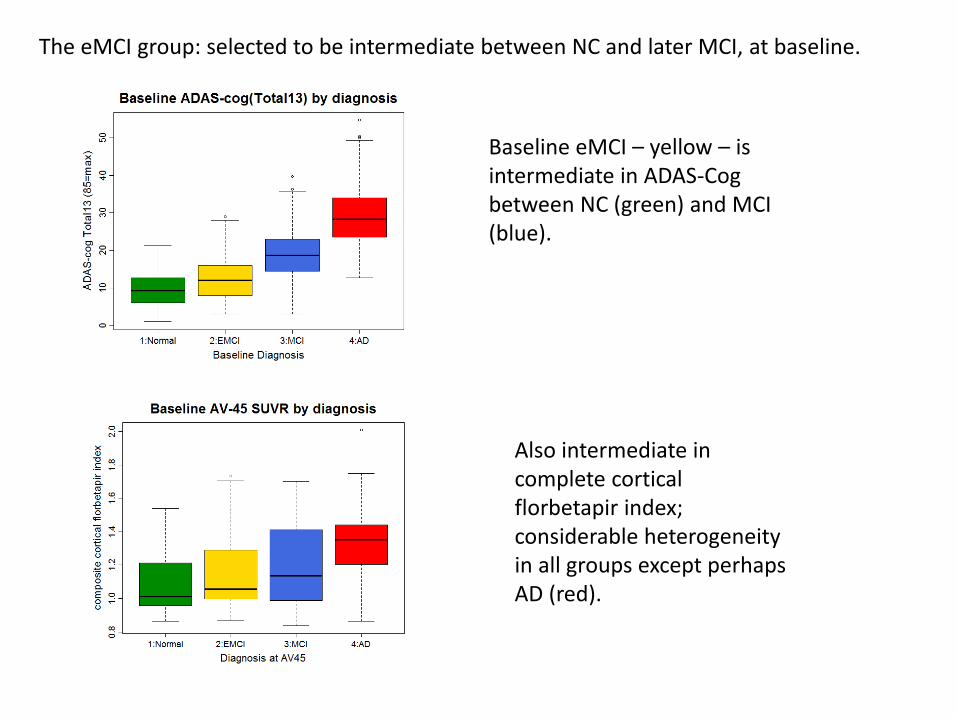
The eMCI group: selected to be intermediate between NC and later MCI, at baseline.
Baseline eMCI – yellow – is intermediate in ADAS-Cog between NC (green) and MCI (blue).
Also intermediate in complete cortical florbetapir index; considerable heterogeneity in all groups except perhaps AD (red).
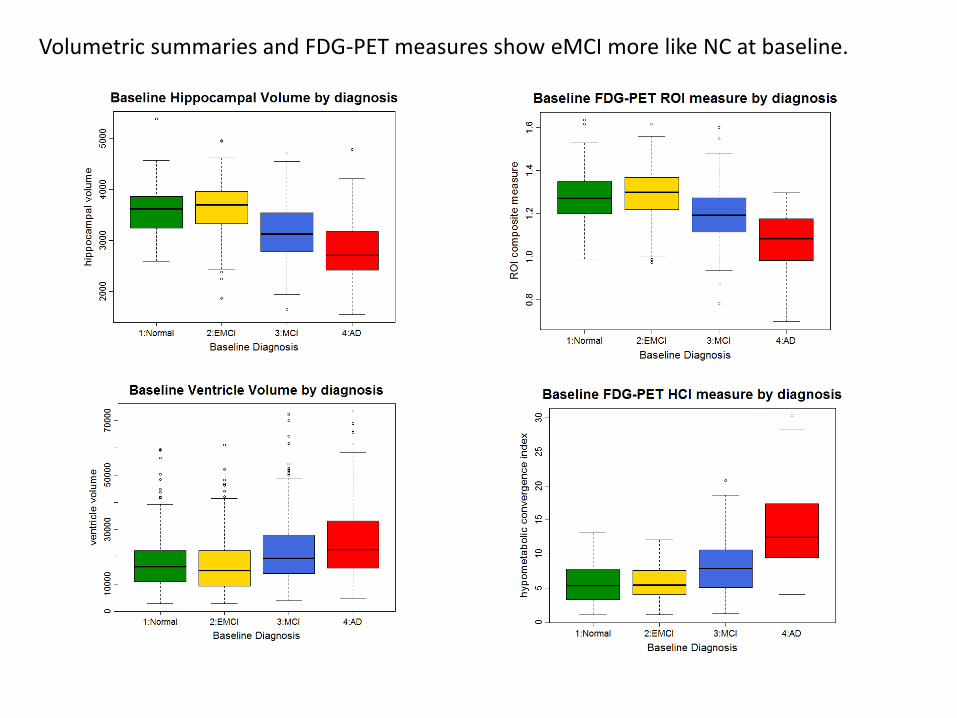
Volumetric summaries and FDG-PET measures show eMCI more like NC at baseline.
©2012 MFMER | 3188678-56
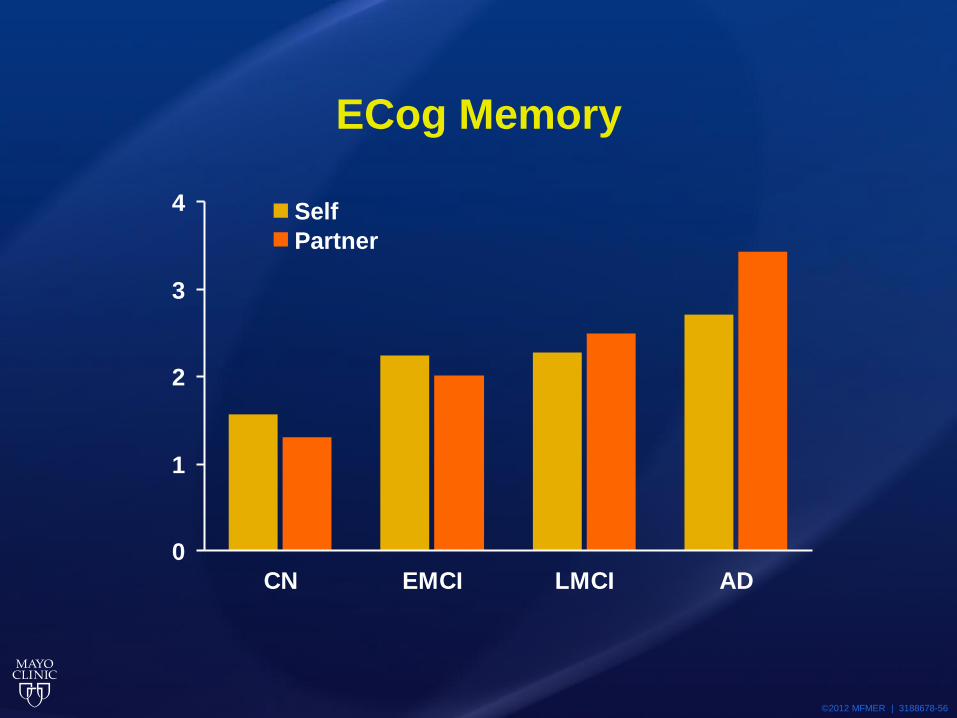
ECog Memory
0
1
2
3
4
CN EMCI LMCI AD
Self
Partner

New functional measure: everyday cognitive function (ECog). Can be self-reported or informant-reported (better!)
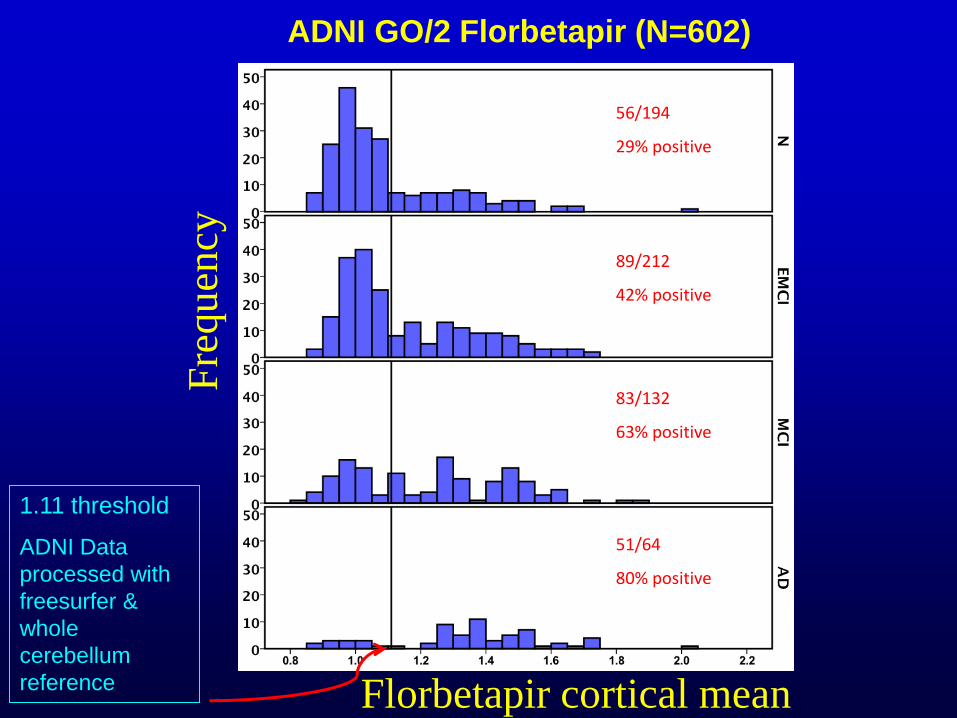
ADNI GO/2 Florbetapir (N=602)
1.11 threshold
ADNI Data
processed with
freesurfer &
whole
cerebellum
reference
Fre
qu
ency
56/194
29% positive
89/212
42% positive
83/132
63% positive
51/64
80% positive
Florbetapir cortical mean
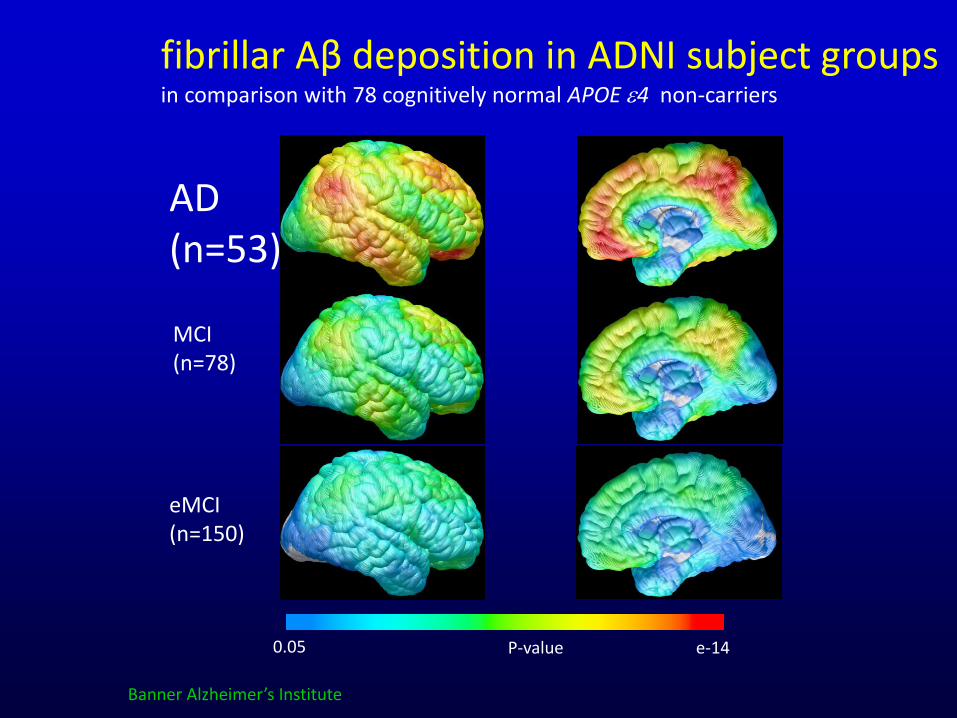
fibrillar Aβ deposition in ADNI subject groups in comparison with 78 cognitively normal APOE e4 non-carriers
AD (n=53)
MCI (n=78)
eMCI (n=150)
0.05 e-14 P-value
Banner Alzheimer’s Institute
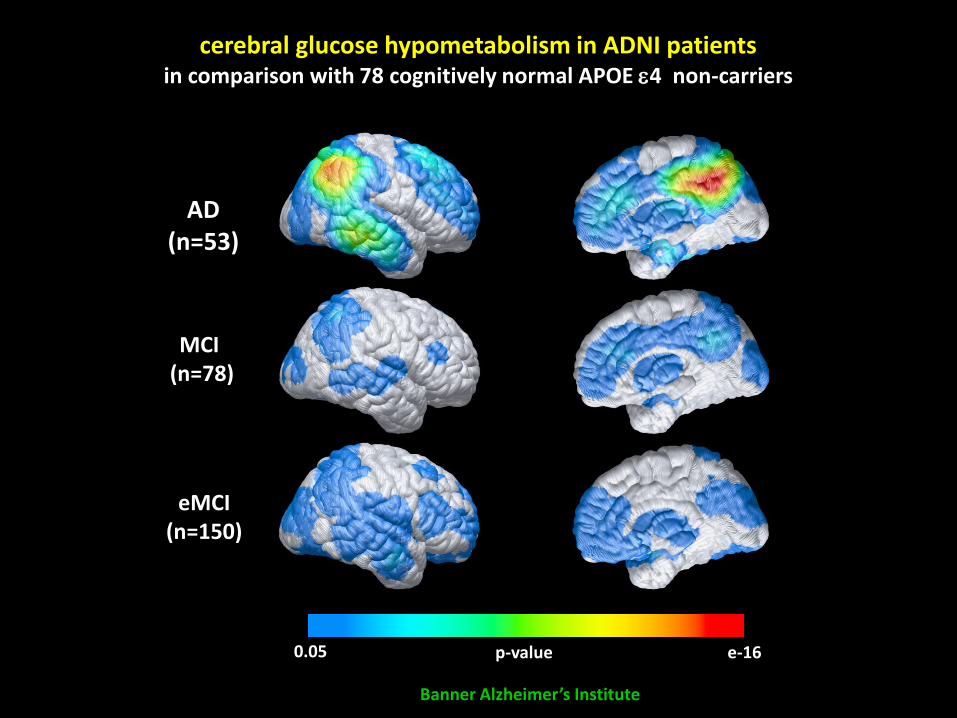
0.05 e-16 p-value
AD (n=53)
MCI (n=78)
eMCI (n=150)
cerebral glucose hypometabolism in ADNI patients in comparison with 78 cognitively normal APOE e4 non-carriers
Banner Alzheimer’s Institute
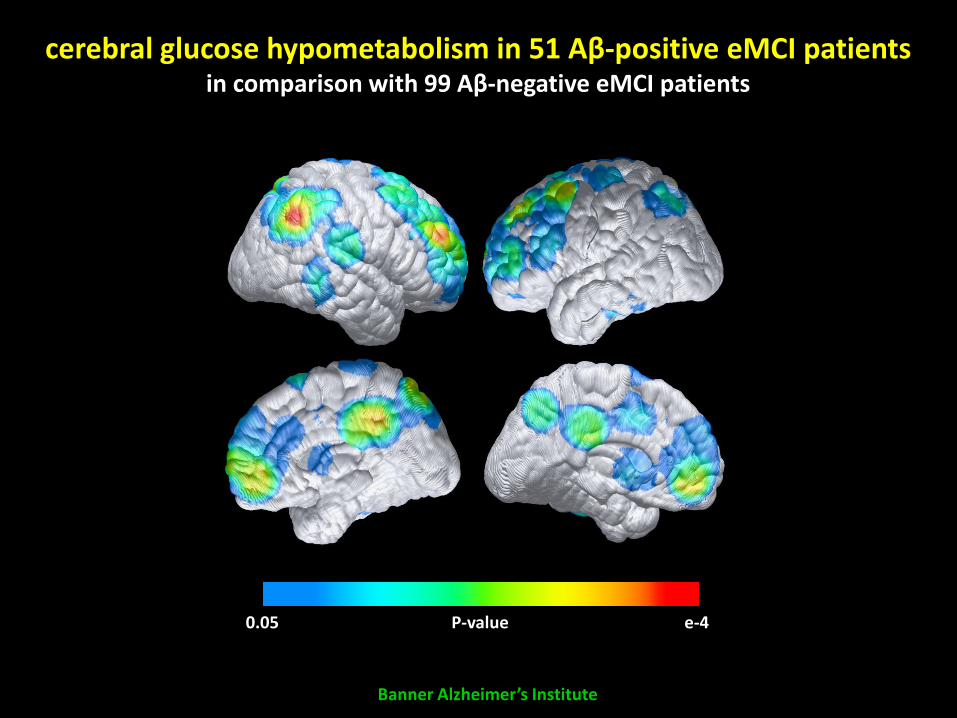
0.05 e-4 P-value
Banner Alzheimer’s Institute
cerebral glucose hypometabolism in 51 Aβ-positive eMCI patients in comparison with 99 Aβ-negative eMCI patients
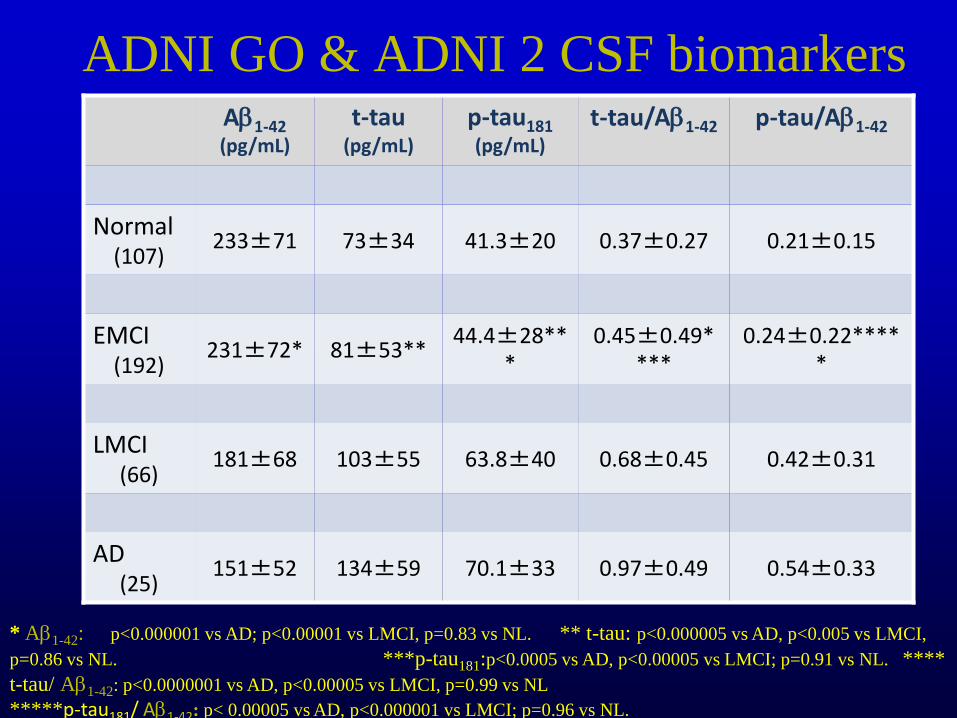
ADNI GO & ADNI 2 CSF biomarkers Ab1-42 (pg/mL)
t-tau (pg/mL)
p-tau181 (pg/mL)
t-tau/Ab1-42 p-tau/Ab1-42
Normal (107)
233±71 73±34 41.3±20 0.37±0.27 0.21±0.15
EMCI (192)
231±72* 81±53** 44.4±28**
* 0.45±0.49*
*** 0.24±0.22****
*
LMCI (66)
181±68 103±55 63.8±40 0.68±0.45 0.42±0.31
AD (25)
151±52 134±59 70.1±33 0.97±0.49 0.54±0.33
* Ab1-42: p<0.000001 vs AD; p<0.00001 vs LMCI, p=0.83 vs NL. ** t-tau: p<0.000005 vs AD, p<0.005 vs LMCI,
p=0.86 vs NL. ***p-tau181:p<0.0005 vs AD, p<0.00005 vs LMCI; p=0.91 vs NL. ****
t-tau/ Ab1-42: p<0.0000001 vs AD, p<0.00005 vs LMCI, p=0.99 vs NL
*****p-tau181/ Ab1-42: p< 0.00005 vs AD, p<0.000001 vs LMCI; p=0.96 vs NL.
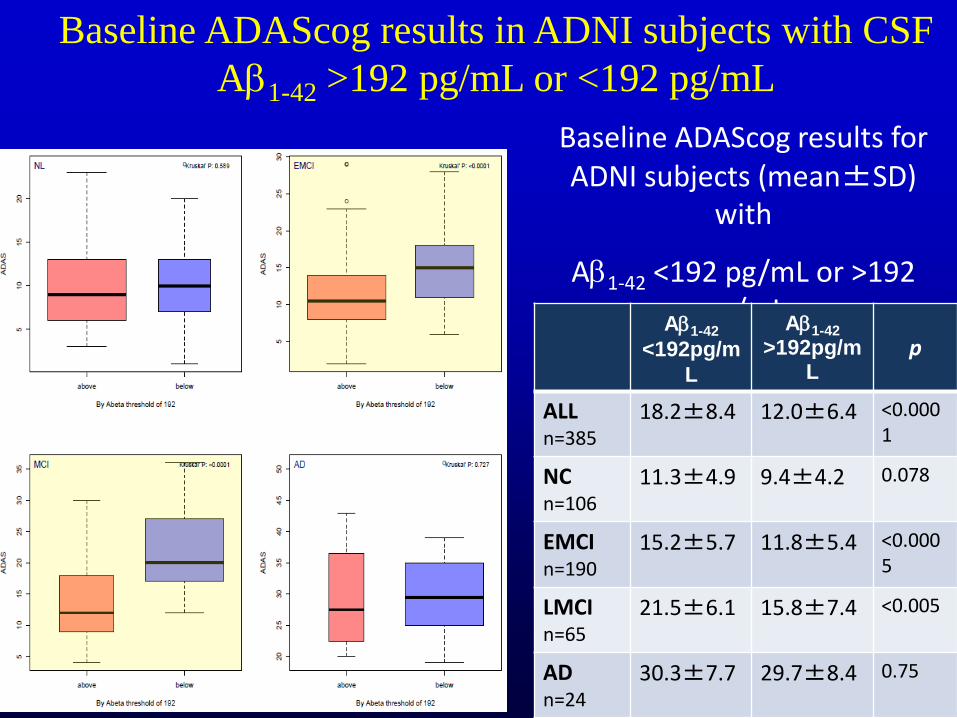
Baseline ADAScog results in ADNI subjects with CSF
Ab1-42 >192 pg/mL or <192 pg/mL
Baseline ADAScog results for ADNI subjects (mean±SD)
with
Ab1-42 <192 pg/mL or >192 pg/mL
Ab1-42
<192pg/m
L
Ab1-42
>192pg/mL
p
ALL n=385
18.2±8.4 12.0±6.4 <0.0001
NC n=106
11.3±4.9 9.4±4.2 0.078
EMCI n=190
15.2±5.7 11.8±5.4 <0.0005
LMCI n=65
21.5±6.1 15.8±7.4 <0.005
AD n=24
30.3±7.7 29.7±8.4 0.75
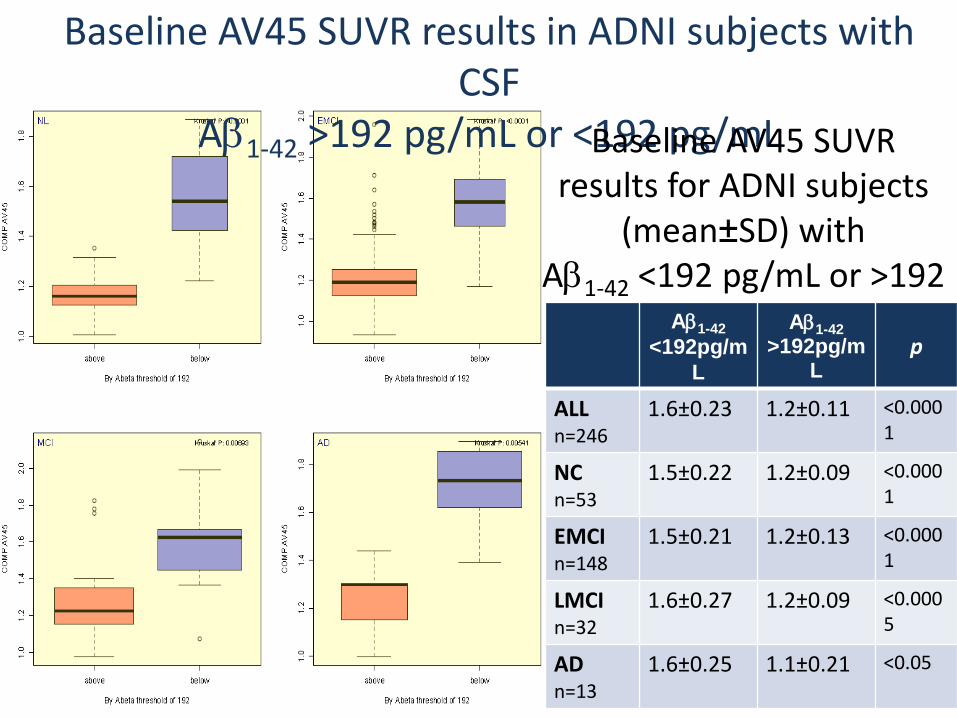
Baseline AV45 SUVR results in ADNI subjects with CSF
Ab1-42 >192 pg/mL or <192 pg/mL Baseline AV45 SUVR results for ADNI subjects
(mean±SD) with Ab1-42 <192 pg/mL or >192
pg/mL Ab1-42
<192pg/m
L
Ab1-42
>192pg/mL
p
ALL n=246
1.6±0.23 1.2±0.11 <0.0001
NC n=53
1.5±0.22 1.2±0.09 <0.0001
EMCI n=148
1.5±0.21 1.2±0.13 <0.0001
LMCI n=32
1.6±0.27 1.2±0.09 <0.0005
AD n=13
1.6±0.25 1.1±0.21 <0.05
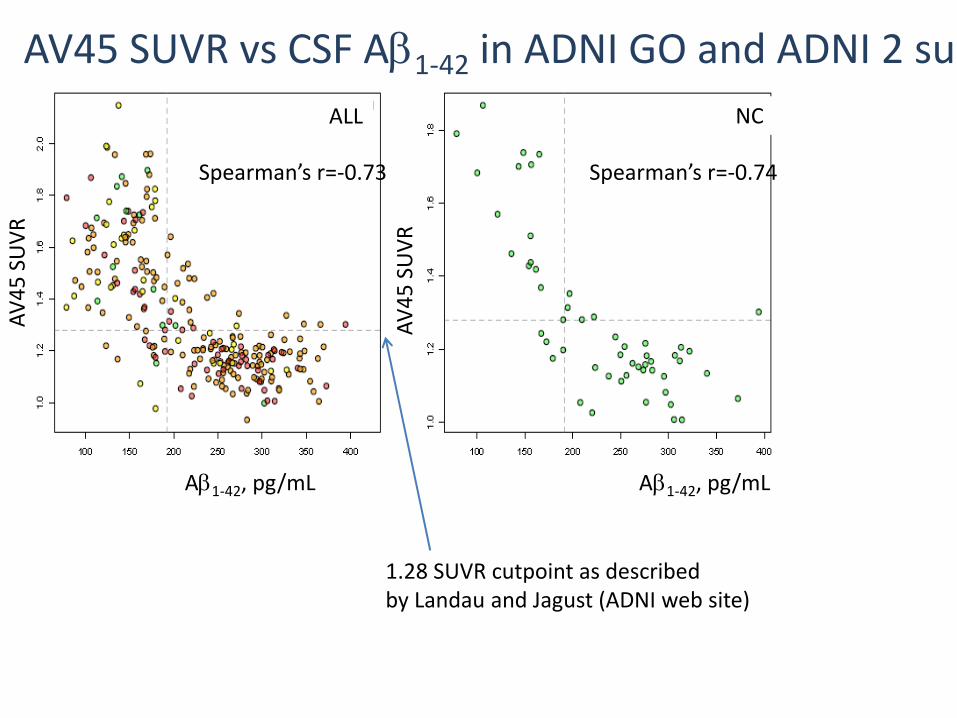
AV45 SUVR vs CSF Ab1-42 in ADNI GO and ADNI 2 subjects
ALL
Ab1-42, pg/mL Ab1-42, pg/mL
AV
45
SU
VR
AV
45
SU
VR
NC
Spearman’s r=-0.73 Spearman’s r=-0.74
1.28 SUVR cutpoint as described by Landau and Jagust (ADNI web site)
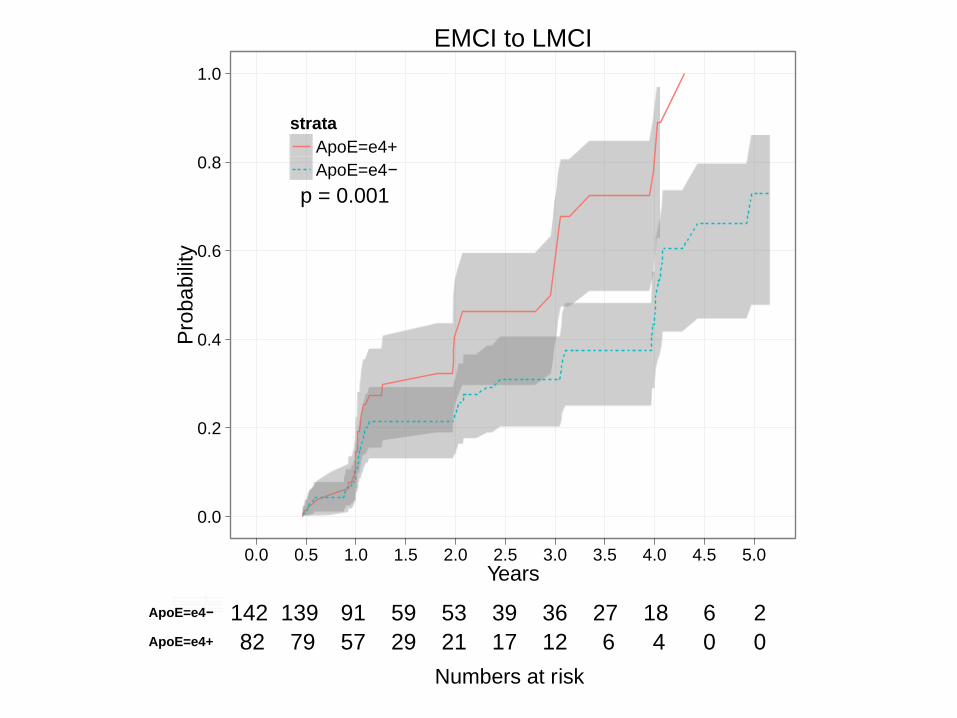
0.0
0.2
0.4
0.6
0.8
1.0
0.0 0.5 1.0 1.5 2.0 2.5 3.0 3.5 4.0 4.5 5.0
EMCI to LMCI
Years
Pro
ba
bili
ty
strata
ApoE=e4+
ApoE=e4−
p = 0.001
ApoE=e4+
ApoE=e4−
82 79 57 29 21 17 12 6 4 0 0
142 139 91 59 53 39 36 27 18 6 2
Numbers at risk
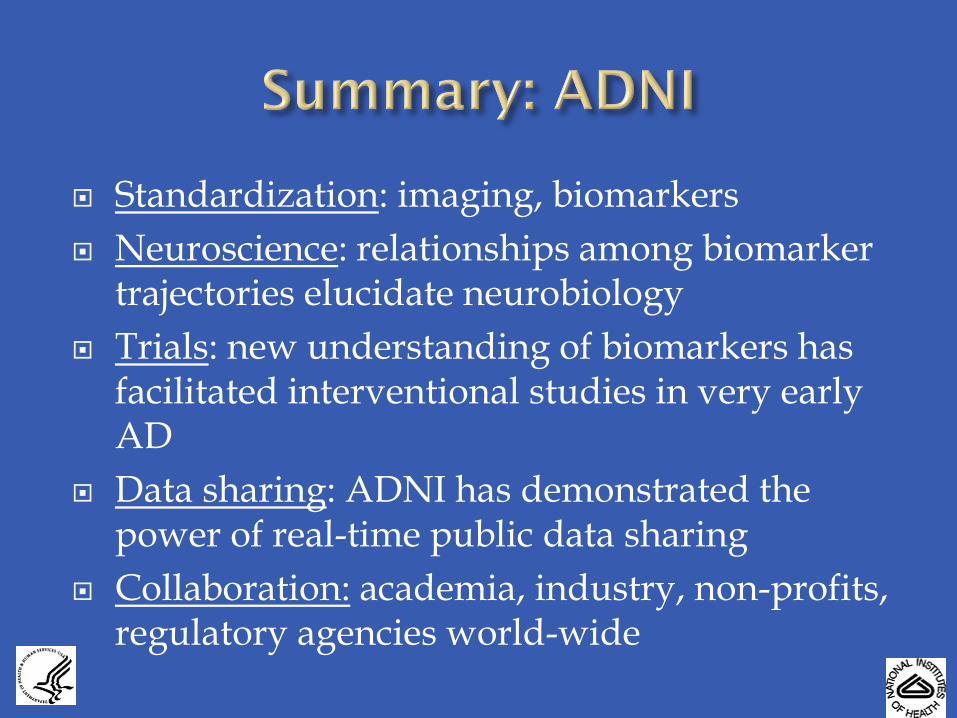
Standardization: imaging, biomarkers
Neuroscience: relationships among biomarker trajectories elucidate neurobiology
Trials: new understanding of biomarkers has facilitated interventional studies in very early AD
Data sharing: ADNI has demonstrated the power of real-time public data sharing
Collaboration: academia, industry, non-profits, regulatory agencies world-wide
9/2009 N. Schuff
http://www.adni-info.org
http://www.loni.ucla.edu/ADNI
Parkinson’s disease
FTD
Autism

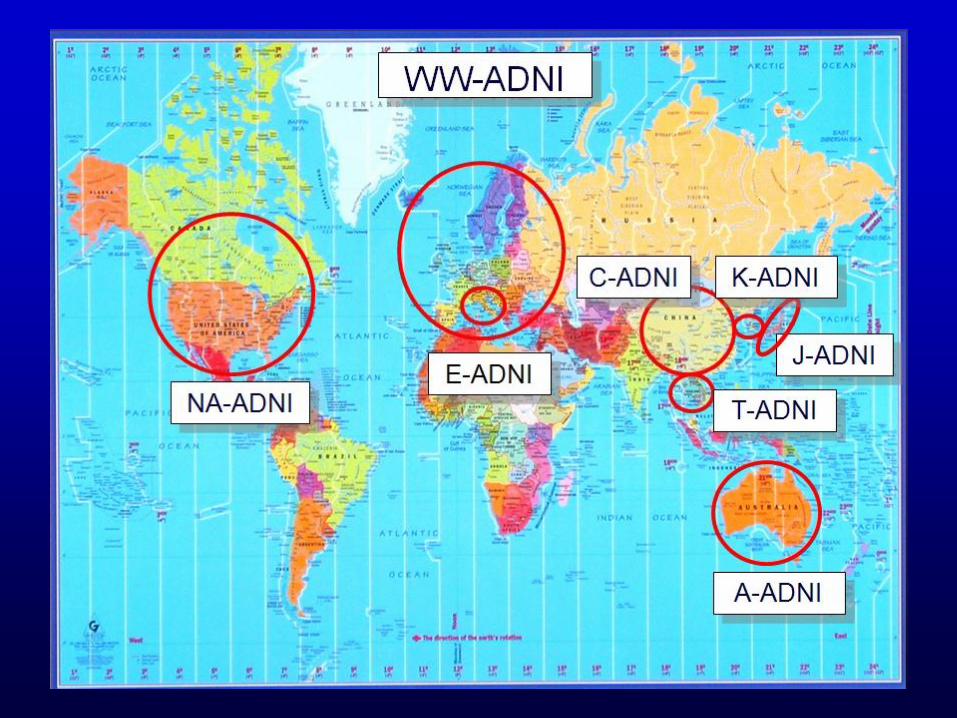
World-Wide Standardization
• Alzheimer’s Association efforts to
standardize CSF and hippocampal volume
measures
CAMD
• Utilization of ADNI data to develop
documents to qualify CSF and MRI
measures for regulatory purposes to FDA
and EMA for enrolling subjects at high risk
National Alzheimer’s Project Act (NAPA) Update
Draft framework for National Plan to Address Alzheimer’s proposed January 2012
National Plan released May 15
http://aspe.hhs.gov/daltcp/napa/
NAPA Goals
1. Prevent and effectively treat Alzheimer’s disease by 2025
2. Optimize care quality and efficiency
3. Expand patient and family support
4. Enhance public awareness and engagement
5. Track progress and drive improvement

Identify Research Strategies for Alzheimer’s Disease
NIH/NIA hosted AD Research Summit May 14-15,
2012
Research recommendations released May 18 • http://www.nia.nih.gov/newsroom/alzheimers-disease-research-summit-2012-recommendations
• Day One Webcast
• http://videocast.nih.gov/summary.asp?Live=11196
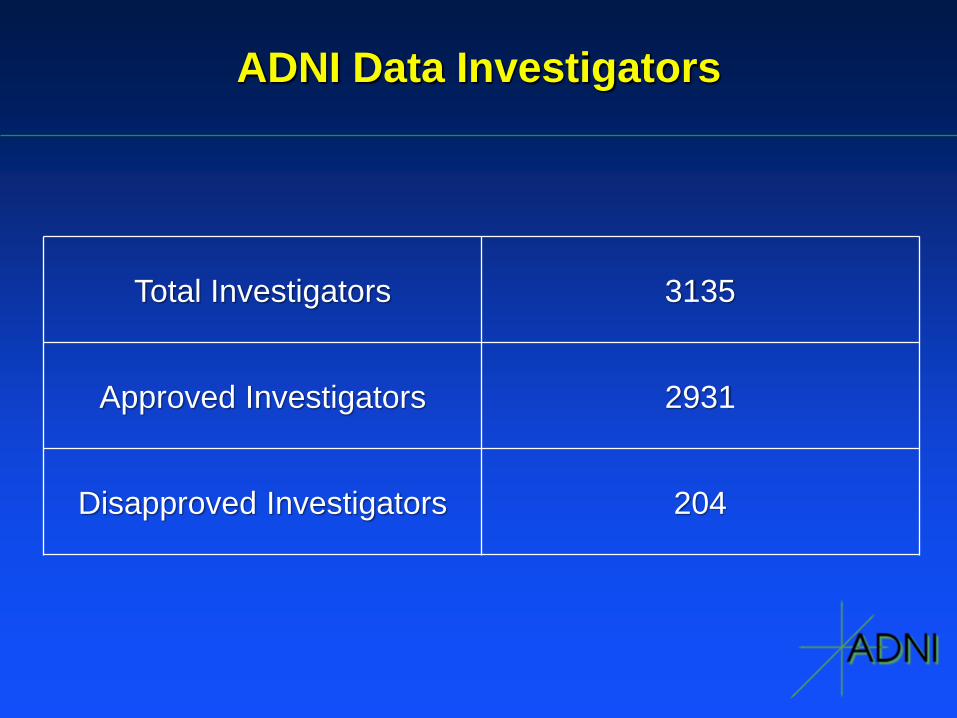
ADNI Data Investigators
Total Investigators 3135
Approved Investigators 2931
Disapproved Investigators 204
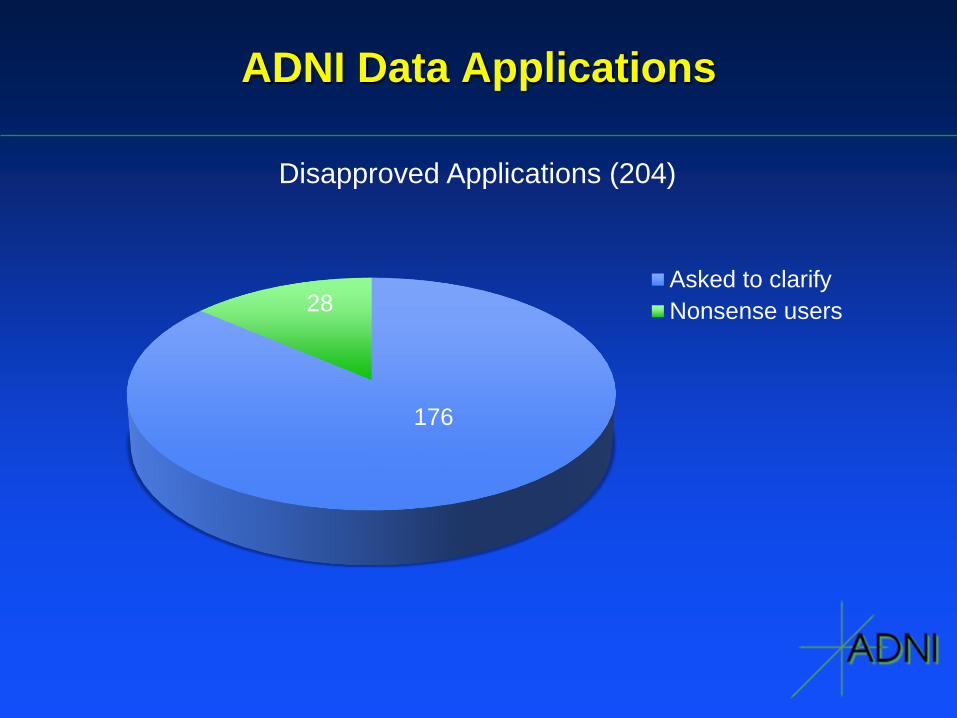
ADNI Data Applications
Disapproved Applications (204)
Asked to clarify
Nonsense users
176
28
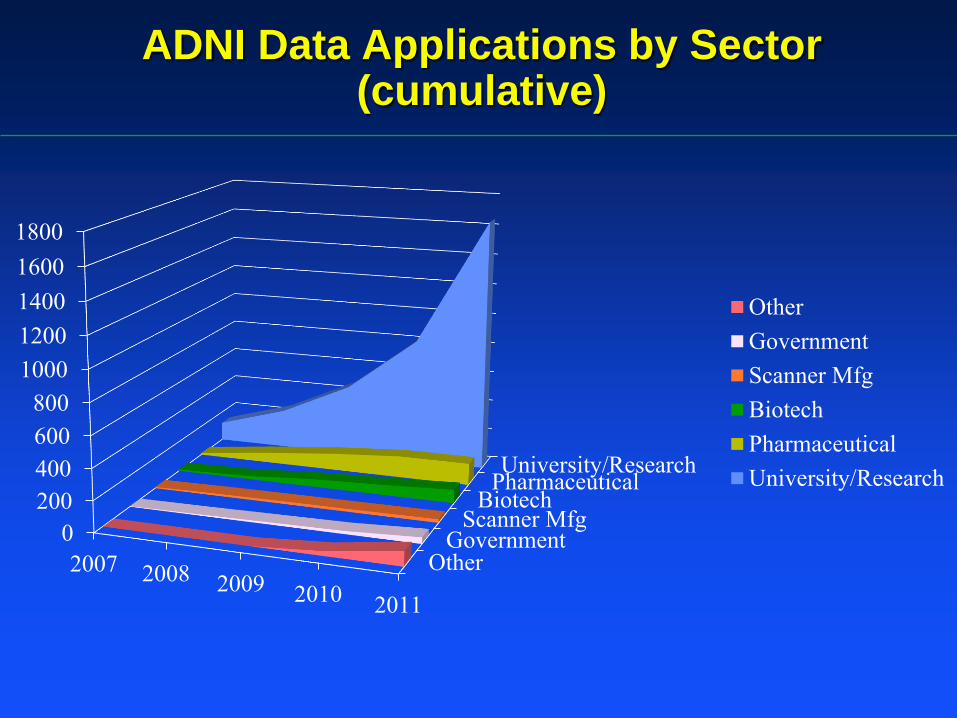
OtherGovernment
Scanner MfgBiotech
PharmaceuticalUniversity/Research
0
200
400
600
800
1000
1200
1400
1600
1800
2007 2008 2009 2010 2011
Other
Government
Scanner Mfg
Biotech
Pharmaceutical
University/Research
ADNI Data Applications by Sector (cumulative)
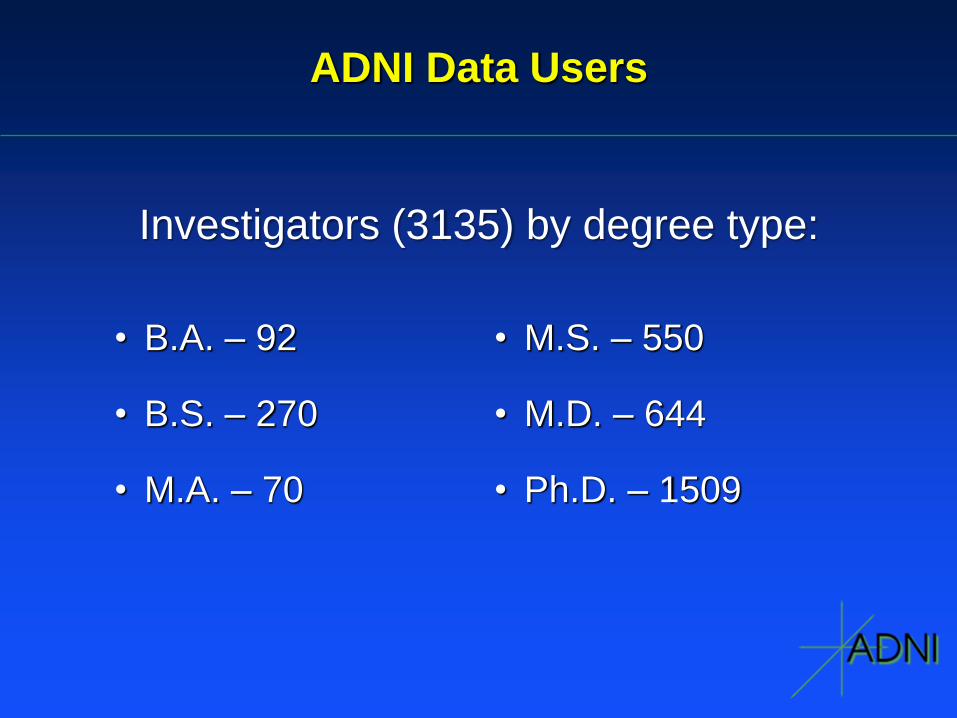
ADNI Data Users
• B.A. – 92
• B.S. – 270
• M.A. – 70
• M.S. – 550
• M.D. – 644
• Ph.D. – 1509
Investigators (3135) by degree type:
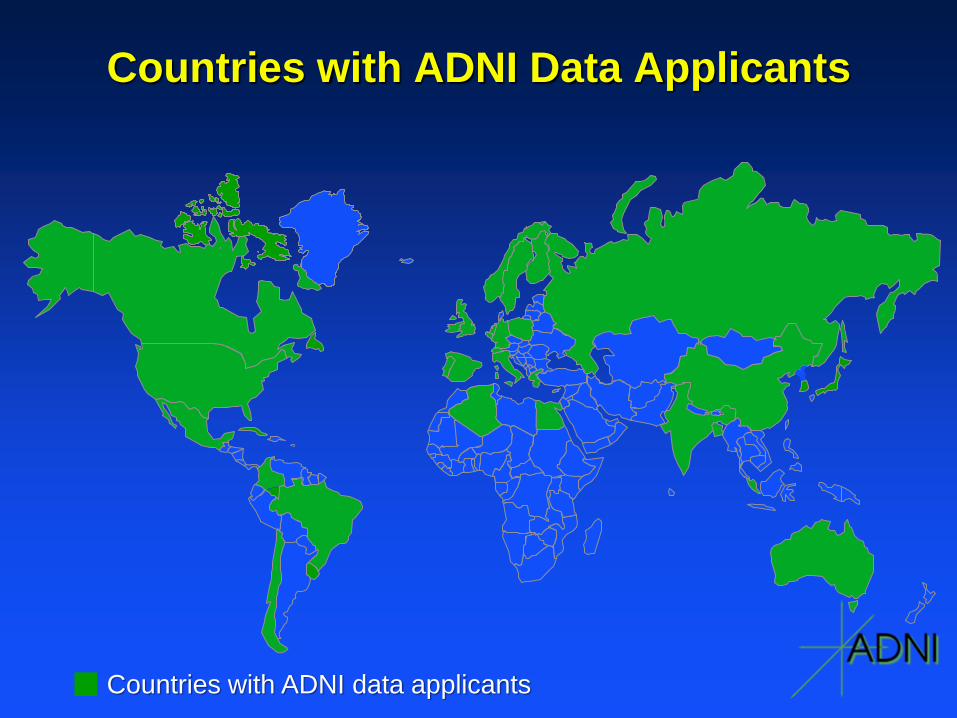
Countries with ADNI Data Applicants
Countries with ADNI data applicants
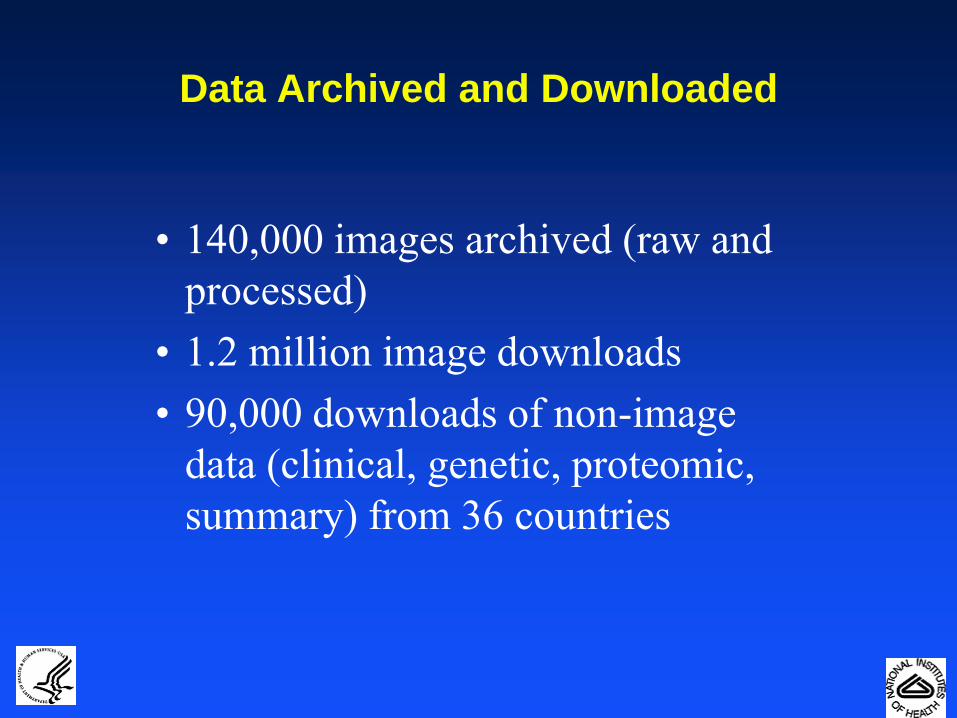
Data Archived and Downloaded
• 140,000 images archived (raw and
processed)
• 1.2 million image downloads
• 90,000 downloads of non-image
data (clinical, genetic, proteomic,
summary) from 36 countries
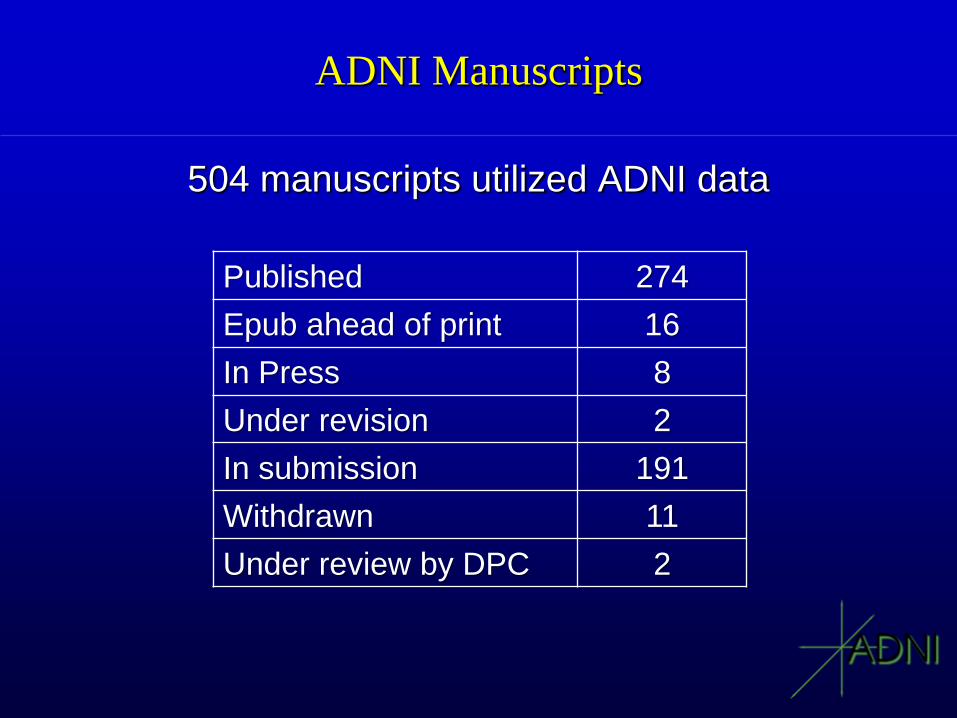
ADNI Manuscripts
504 manuscripts utilized ADNI data
Published 274
Epub ahead of print 16
In Press 8
Under revision 2
In submission 191
Withdrawn 11
Under review by DPC 2
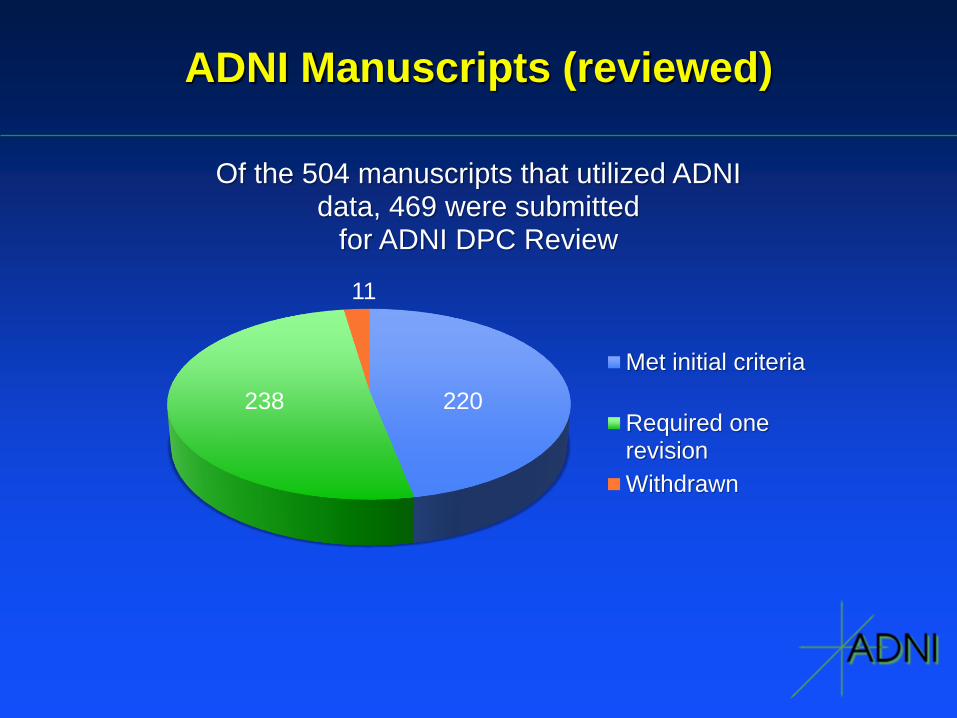
ADNI Manuscripts (reviewed)
Of the 504 manuscripts that utilized ADNI data, 469 were submitted
for ADNI DPC Review
Met initial criteria
Required onerevision
Withdrawn
220 238
11
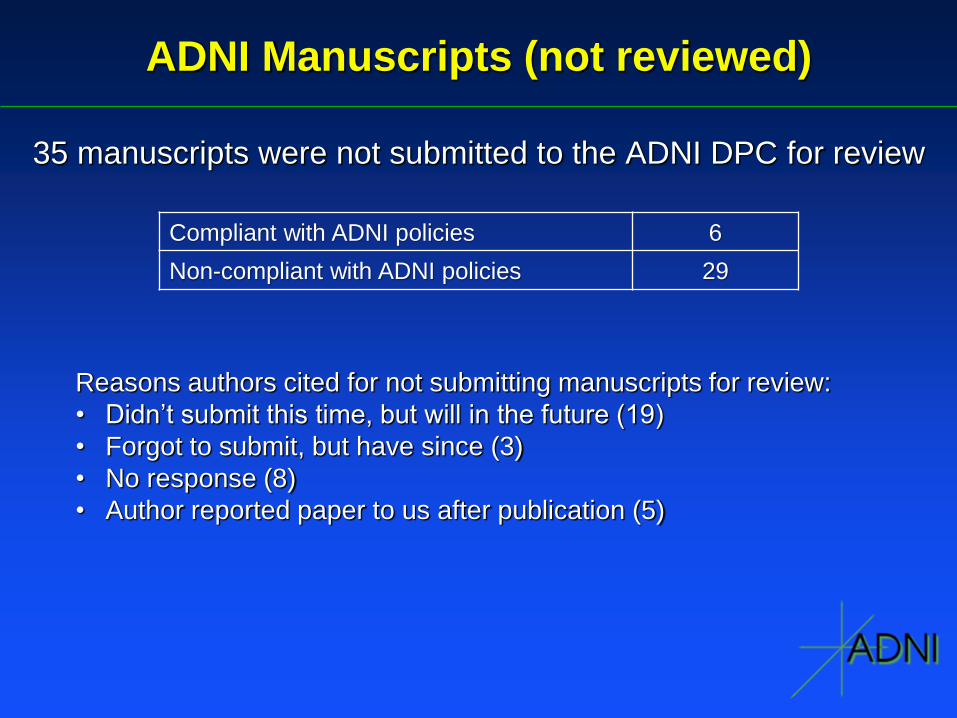
ADNI Manuscripts (not reviewed)
35 manuscripts were not submitted to the ADNI DPC for review
Compliant with ADNI policies 6
Non-compliant with ADNI policies 29
Reasons authors cited for not submitting manuscripts for review:
• Didn’t submit this time, but will in the future (19)
• Forgot to submit, but have since (3)
• No response (8)
• Author reported paper to us after publication (5)


![cs230.stanford.edu · Two public datasets are available for this study, including the Alzheimer's Disease Neuroimaging Initiative-I (ADNI-I) dataset [2] and the ADNI-2 dataset [3].](https://static.fdocuments.net/doc/165x107/5f0569617e708231d412d51d/cs230-two-public-datasets-are-available-for-this-study-including-the-alzheimers.jpg)