Alumni of Tribal Colleges and Universities Better Their ...
29
Alumni of Tribal Colleges and Universities Better Their Communities
Transcript of Alumni of Tribal Colleges and Universities Better Their ...

Alumni of Tribal Colleges and Universities Better Their Communities

COPYRIGHT STANDARDS
This document contains proprietary research, copyrighted materials and literary property of Gallup, Inc. It is for the guidance of your organization only and is not to be copied, quoted, published or divulged to others outside your organization. All of Gallup, Inc.’s content is protected by copyright. Neither the client nor the participants shall copy, modify, resell, reuse or distribute the program materials beyond the scope of what is agreed upon in writing by Gallup, Inc. Any violation of this Agreement shall be considered a breach of contract and misuse of Gallup, Inc.’s intellectual property.
This document is of great value to Gallup, Inc. Accordingly, international and domestic laws and penalties guaranteeing patent, copyright, trademark and trade secret protection safeguard the ideas, concepts and recommendations related within this document.
No changes may be made to this document without the express written permission of Gallup, Inc. Gallup® and Q12® are trademarks of Gallup, Inc. All other trademarks and copyrights are property of their respective owners.
Copyright © 2019 Gallup, Inc. All rights reserved.AICF_Report_DIGITAL_enUS_080119_eas

Alumni of Tribal Colleges and Universities Better Their Communities
AICF_Report_DIGITAL_enUS_080119_eas
Table of Contents
02 Executive Summary
04 Introduction
06 Great Jobs: Workplace Engagement
10 Great Lives: Wellbeing
12 Great Experiences: Student Experiences and Alumni Attachment
16 Further Discussion of the Findings
19 Final Thoughts
20 Appendix
24 Methodology
Copyright © 2019 Gallup, Inc. All rights reserved.1
Alumni of Tribal Colleges and Universities Better Their Communities
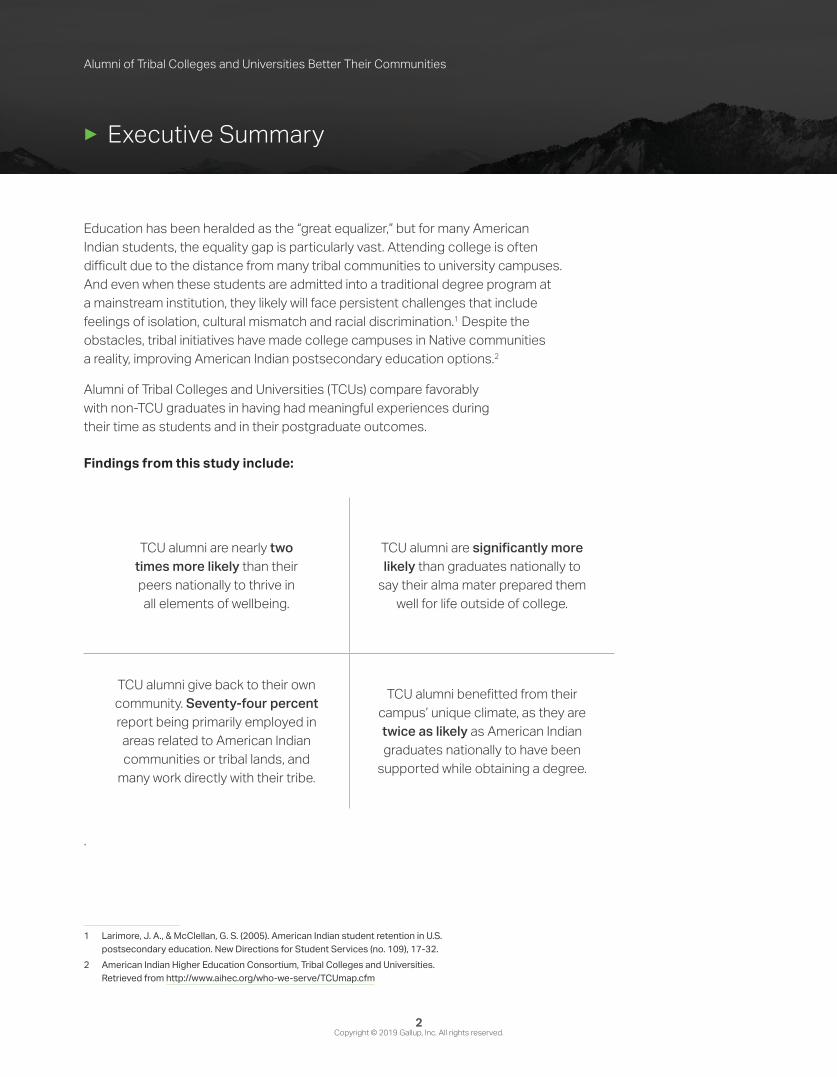
▶ Executive Summary
Education has been heralded as the “great equalizer,” but for many American Indian students, the equality gap is particularly vast. Attending college is often difficult due to the distance from many tribal communities to university campuses. And even when these students are admitted into a traditional degree program at a mainstream institution, they likely will face persistent challenges that include feelings of isolation, cultural mismatch and racial discrimination.1 Despite the obstacles, tribal initiatives have made college campuses in Native communities a reality, improving American Indian postsecondary education options.2
Alumni of Tribal Colleges and Universities (TCUs) compare favorably with non-TCU graduates in having had meaningful experiences during their time as students and in their postgraduate outcomes.
Findings from this study include:
TCU alumni are nearly two times more likely than their peers nationally to thrive in all elements of wellbeing.
TCU alumni are significantly more likely than graduates nationally to
say their alma mater prepared them well for life outside of college.
TCU alumni give back to their own community. Seventy-four percent report being primarily employed in areas related to American Indian communities or tribal lands, and
many work directly with their tribe.
TCU alumni benefitted from their campus’ unique climate, as they are twice as likely as American Indian graduates nationally to have been
supported while obtaining a degree.
.
1 Larimore, J. A., & McClellan, G. S. (2005). American Indian student retention in U.S. postsecondary education. New Directions for Student Services (no. 109), 17-32.
2 American Indian Higher Education Consortium, Tribal Colleges and Universities. Retrieved from http://www.aihec.org/who-we-serve/TCUmap.cfm
Copyright © 2019 Gallup, Inc. All rights reserved.AICF_Report_DIGITAL_enUS_080119_eas
2

Alumni of Tribal Colleges and Universities Better Their Communities
Given the educational inequality found between the American Indian community and the rest of the nation, some higher education institutions are striving to bridge the gap and provide a quality college experience to Native communities. Tribal Colleges and Universities — two- and four-year higher education institutions — are usually tribally controlled. They predominantly serve American Indian students in rural areas, typically on reservations. TCUs are fully accredited and provide postsecondary instruction that is more aligned with Native culture and values than the instruction at mainstream institutions.
This report is based on the largest survey of TCU graduates to date, including respondents from nine such institutions.
Tribal Colleges and Universities provide a meaningful educational experience, and alumni report many positive outcomes. It is particularly noteworthy how well TCU alumni fare, compared with American Indian students attending mainstream colleges and universities, in their attachment to their alma mater.
Terminology: This report uses the terms American Indian, Indigenous, Native American, and Native interchangeably. These terms are also inclusive of Alaska Natives.
Copyright © 2019 Gallup, Inc. All rights reserved.AICF_Report_DIGITAL_enUS_080119_eas
3

Alumni of Tribal Colleges and Universities Better Their Communities
▶ Introduction
The American Indian College Fund was established in 1989 and seeks to invest in “Native students and tribal college education to transform lives and communities.”3 To date, the College Fund has awarded over $201 million to support disadvantaged students and their education with $7.7 million in scholarship funds to 4,353 individuals in 2017-2018 alone.4 In the same time frame, almost $5.7 million was granted to higher education institutions to support American Indian communities through cultural preservation, early childhood education, faculty development and more.
The work of the College Fund is important to the students it serves, as college enrollment among American Indian students has steadily decreased in recent years. College enrollment among traditionally aged American Indians (18-24 years old) fell from 41% in 2010 to 19% in 2016 — the lowest participation rate of any race/ethnicity class measured during that time.5 This decline can be attributed to less academic preparation during high school and lower rates of college education in American Indian families. Only 14% of American Indians aged 25 and older held at least a bachelor’s degree in 2014, compared with 34% of white students.6 The College Fund amplifies the Native voice in national education conversations by first helping tribal colleges and universities obtain and understand data regarding American Indian student success.
Tribal Colleges and Universities are unique institutions in the U.S. higher education system. While culturally and geographically diverse, TCUs share novel characteristics such as building strong connections to the physical and cultural spaces on which they reside, cultural content in curriculum, indigenous pedagogy, and community outreach and education that is rooted in tribal identity and practice. As of the spring of 2019, there are 29 tribally chartered institutions among the 35 accredited institutions that are members of the American Indian Higher Education Consortium (AIHEC), the TCU member association. Tribal sovereign authority and their ability to charter educational institutions has made postsecondary institutions that serve tribal people a reality. Although not tribally chartered, the other six members of AIHEC are also unique in their cultural mission to serve student populations that are predominantly American Indian and Alaska Native. According to enrollment data from the fall of 2017, 11% of all Native students studying at a U.S. two- or four-year public or private not-for-profit postsecondary institution attended a TCU.7
3 American Indian College Fund, About Us. Retrieved from https://collegefund.org/about-us4 American Indian College Fund, Annual Report 2017-2018. Retrieved from
https://collegefund.org/wp-content/uploads/2018/11/View-the-2017-2018-Annual-Report_web.pdf 5 National Center for Education Statistics, The Condition of Education 2018.
Retrieved from https://nces.ed.gov/pubs2018/2018144.pdf 6 National Center for Education Statistics, Status and Trends in the Education of Racial and Ethnic Groups 2017.
Retrieved from https://nces.ed.gov/pubs2017/2017051.pdf 7 U.S. Department of Education, National Center for Education Statistics, Integrated Postsecondary
Education Data System (IPEDS), 2018, Winter & Spring survey components (final data). Retrieved from https://nces.ed.gov/ipeds/use-the-data/survey-components in May 2019
Copyright © 2019 Gallup, Inc. All rights reserved.AICF_Report_DIGITAL_enUS_080119_eas
4

Alumni of Tribal Colleges and Universities Better Their Communities
This report compares TCU alumni with alumni from three national peer groups in terms of their workplace engagement, wellbeing, and institutional experiences both during and after college. This study addresses the primary reasons that students may attend a TCU as they consider which type of higher education experience may provide a supportive, culturally affirming environment and a pathway to a good job.
Comparison Groups*
COLLEGE GR ADUATES NATIONALLY
24,886 college graduateswho received a bachelor’s degree or higher between 2000 and 2018, living in all 50 U.S. states and the District of Columbia
MINORIT Y- SERVING
INSTITUTIONS (MSI) ALUMNI
2,889 graduatesfrom lists provided by the Office of Civil Rights detailing U.S.-accredited postsecondary minorities institutions maintained by the Department of Education
AMERICAN INDIAN AND
AL ASK A NATIVE GR ADUATES
1,051 alumnifrom the Gallup Alumni Survey national study identifying as American Indian or Alaska Native receiving at least a bachelor’s degree between 2000 and 2018
*More information on comparison groups can be found in the Appendix.
Copyright © 2019 Gallup, Inc. All rights reserved.AICF_Report_DIGITAL_enUS_080119_eas
5

Alumni of Tribal Colleges and Universities Better Their Communities
▶ Great Jobs: Workplace Engagement
Workplace engagement is more nuanced than simple job satisfaction. Engaged employees are intellectually and emotionally connected with their organizations and work teams because they can do what they are best at, they like what they do at work and they have someone at work who cares about their development.
Gallup’s expertise on employee engagement is rooted in more than 30 years of research on the workplace conditions that most consistently relate to employee and workgroup performance. Based on employees’ responses to questions about these elements of their working lives, Gallup categorizes workers as engaged, not engaged or actively disengaged.
The following key findings illustrate how well TCUs prepare graduates to succeed in their careers.
Many TCU alumni report being engaged in their work.
Engagement Index (% Among graduates employed full time by an employer)
100%
90%
80%
70%
60%
50%
40%
30%
20%
10%
0%TCU Alumni College Graduates Nationally American Indian/Alaska Native
Graduates NationallyMSI Alumni
■ Engaged ■ Not Engaged ■ Actively Disengaged
9
49
42
14*
49
37*
15*
48
36
14*
47
39
*Indicates that outcome is statistically different than TCU alumni outcome at the 95% confidence levelNote: Due to rounding, percentages may sum to 100% +/-1%.
TCU graduates (42%) have higher rates of workplace engagement than college graduates nationally (37%).
1
Copyright © 2019 Gallup, Inc. All rights reserved.AICF_Report_DIGITAL_enUS_080119_eas
6

Alumni of Tribal Colleges and Universities Better Their Communities
TCU alumni work in a variety of professions — many graduates choose educational disciplines.
Which category best describes the area in which you currently work at your primary job? (% Choosing each category)
Education / Training / Library
Healthcare
Community / Social Services
Law or Public Policy
Finance / Insurance / Real Estate
Arts / Design / Entertainment / Sports / Media
Science / Engineering / Architecture
Computer / Information Systems / Mathematical
Manufacturing or Construction
Retail
Transportation
Other
28
5
12
4
8
3
5
2
2
0% 5% 10% 15% 20% 25% 30% 35%
5
2
24
2
Copyright © 2019 Gallup, Inc. All rights reserved.AICF_Report_DIGITAL_enUS_080119_eas
7

Alumni of Tribal Colleges and Universities Better Their Communities
TCU graduates overwhelmingly report that their institution prepared them well for life outside of college.
[Institution] prepared me well for life outside of college. (% Strongly agree)
24%*27%*40% 27%*
TCU Alumni College Graduates Nationally
American Indian/Alaska Native Graduates Nationally
MSI Alumni
*Indicates that outcome is statistically different than TCU alumni outcome at the 95% confidence level
Four out of 10 TCU alumni strongly agree that their institution prepared them well for life after graduation. TCU graduates outpace graduates in all three comparison groups by at least 13 percentage points.
.
3
Copyright © 2019 Gallup, Inc. All rights reserved.AICF_Report_DIGITAL_enUS_080119_eas
8

Alumni of Tribal Colleges and Universities Better Their Communities
Many TCU alumni strongly agree they are deeply interested in the work that they do, have a job that gives them the opportunity to do work that interests them and have the ideal job for them. In fact, TCU graduates outperform all comparison groups by a significant margin on these three measures.
% Strongly agree
I am deeply interested in the work that I do.
My job gives me the opportunity to do work that interests me.
I have the ideal job for me.
TCU Alumni 53% 50% 37%
College Graduates Nationally 38%* 37%* 22%*
American Indian/Alaska Native Graduates Nationally
40%* 41%* 27%*
MSI Alumni 41%* 39%* 23%*
*Indicates that outcome is statistically different than TCU alumni outcome at the 95% confidence level
4
Copyright © 2019 Gallup, Inc. All rights reserved.AICF_Report_DIGITAL_enUS_080119_eas
9

Alumni of Tribal Colleges and Universities Better Their Communities
▶ Great Lives: Wellbeing
Gallup scientists have been exploring the demands of a life well-lived since the mid-20th century. More recently, in partnership with leading economists, psychologists and other acclaimed scientists, the Gallup National Health and Well-Being Index has explored common elements of wellbeing that transcend countries and cultures. The index, which is based on decades of Gallup global research, employs 10 questions that measure wellbeing in five interrelated elements:
Physical wellbeing: Having good health and enough energy to get things done daily
Community wellbeing: Liking where you live, feeling safe and having pride in your community
Financial wellbeing: Managing your economic life to reduce stress and increase security
Social wellbeing: Having strong and supportive relationships and love in your life
Career wellbeing: Liking what you do each day and being motivated to achieve your goals
Gallup categorizes individuals as “thriving,” “struggling” or “suffering” in each element according to how they respond to that facet of their wellbeing:
Thriving: Wellbeing that is strong and consistent in a particular element
Struggling: Wellbeing that is moderate or inconsistent in a particular element
Suffering: Wellbeing that is low and inconsistent in a particular element
Copyright © 2019 Gallup, Inc. All rights reserved.AICF_Report_DIGITAL_enUS_080119_eas
10

Alumni of Tribal Colleges and Universities Better Their Communities
Nearly all wellbeing outcomes among TCU alumni outpace the outcomes for graduates from every comparison group.
Wellbeing, by Element (% Thriving)
0% 10% 20% 30% 40% 50% 60% 70%
54
36
47
24
11
62
46*
31*
37*
27
6*
43*
44*
32
37*
30*
7*
47*
45*
33
36*
29*
6*
45*
Thriving in all five
Physical
Community
Financial
Social
Career
■ TCU Alumni ■ College Graduates Nationally ■ American Indian/Alaska Native Graduates Nationally ■ MSI Alumni
*Indicates that outcome is statistically different than TCU alumni outcome at the 95% confidence level
Students graduating from a TCU are roughly twice as likely as graduates nationally to be thriving in all five elements of wellbeing (11% vs. 6%, respectively).
TCU alumni report better outcomes than graduates from other comparison groups in their community, social and career wellbeing. These graduates possess a strong sense of engagement in the areas where they live, have strong relationships and love in their lives, and feel fulfilled in how they occupy their time by liking what they do every day.
1
Copyright © 2019 Gallup, Inc. All rights reserved.AICF_Report_DIGITAL_enUS_080119_eas
11

Alumni of Tribal Colleges and Universities Better Their Communities
▶ Great Experiences: Student Experiences and Alumni Attachment
Gallup’s research on U.S. college graduates has consistently revealed that six key undergraduate practices — three linked to emotional support and three related to experiential learning — strongly influence workplace engagement and wellbeing after graduation.
A significantly greater percentage of TCU alumni than their peers were supported during their time as students — meaning that they are more likely to strongly agree that they had professors who cared about them as a person, at least one professor who made them excited about learning, and a mentor who encouraged them to pursue their goals and dreams.
Emotional Support (% Strongly agree)
0% 20% 40% 60% 80% 100%
59
53
43
81
32*
28*
18*
71*
33*
30*
21*
72*
32*
26*
19*
70*
All three emotional support items
While attending [Institution] I had a mentor who encouraged me to
pursue my goals and dreams.
My professors/instructors at [Institution] cared about me as a person.
I had at least one professor/instructor at [Institution] who made me excited
about learning.
■ TCU Alumni ■ College Graduates Nationally ■ American Indian/Alaska Native Graduates Nationally ■ MSI Alumni
*Indicates that outcome is statistically different than TCU alumni outcome at the 95% confidence level
• Student-mentor relationships are plentiful at TCUs. Fifty-three percent of graduates strongly agree they had a mentor who encouraged them to pursue their goals and dreams — compared with 28% of alumni nationally and 26% of MSI graduates.
• TCU graduates (59%) are almost twice as likely as American Indian graduates nationally (33%) to strongly agree that their professors/instructors cared about them as a person.
• Eighty-one percent of TCU alumni strongly agree they had at least one professor/ instructor who made them excited about learning — significantly higher than college graduates nationally (71%).
1
Copyright © 2019 Gallup, Inc. All rights reserved.AICF_Report_DIGITAL_enUS_080119_eas
12

Alumni of Tribal Colleges and Universities Better Their Communities
Only 9% of TCU graduates engaged in all three experiential learning practices, but that is on par with the national average. Gallup classifies graduates as having experiential learning in college if they had a job or internship that allowed them to apply what they were learning in the classroom, worked on a project that took a semester or more to complete, and were extremely active in extracurricular activities and organizations.
Experiential Learning
0% 20% 40% 60% 80%
31
60
9
20
42*
62
9
23
42*
60
6*
20
37*
59
7
17
All three experiential learning items (% Having all)
While attending [Institution] I had an internship or job that allowed me to apply what I was learning in the classroom.
(% Yes)
While attending [Institution] I worked on a project that took a semester or more to complete. (% Strongly agree)
I was extremely active in extracurricular activities and organizations while attending [Institution].
(% Strongly agree)
■ TCU Alumni ■ College Graduates Nationally ■ American Indian/Alaska Native Graduates Nationally ■ MSI Alumni
*Indicates that outcome is statistically different than TCU alumni outcome at the 95% confidence level
TCU alumni outpace American Indian college graduates nationally in participation in all three experiential learning items (9% vs. 6%).
TCU alumni, at 31%, are less likely than all comparison groups — college graduates nationally, 42%; American Indian graduates nationally, 42%; and MSI alumni, 37% — to have worked on a project that took a semester or more to complete.
2
Copyright © 2019 Gallup, Inc. All rights reserved.AICF_Report_DIGITAL_enUS_080119_eas
13

Alumni of Tribal Colleges and Universities Better Their Communities
Alumni Attachment
Gallup examines the emotional connection and lasting sense of commitment alumni have to their alma mater. And because students spend significant resources preparing for life outside of college, it is crucial to gauge whether the experiences they had in college promote a well-lived life — particularly the extent to which they believe their education was worth the cost. Gallup’s study of alumni attachment suggests that how an individual experiences college matters more than where they experience college.
TCU alumni are satisfied with their choice of institution — they are more likely than college graduates nationally, American Indian graduates and MSI alumni to strongly agree they can’t imagine a world without their school and that their school was perfect for people like them.
% Strongly agree I can’t imagine a world without [Institution].
[Institution] was the perfect school for people like me.
TCU Alumni 53% 59%
College Graduates Nationally 25%* 32%*
American Indian/Alaska Native Graduates Nationally
29%* 37%*
MSI Alumni 22%* 31%*
*Indicates that outcome is statistically different than TCU alumni outcome at the 95% confidence level
1
Copyright © 2019 Gallup, Inc. All rights reserved.AICF_Report_DIGITAL_enUS_080119_eas
14

Alumni of Tribal Colleges and Universities Better Their Communities
Gallup measures graduates’ emotional attachment to their alma mater through their level of agreement with the two previously mentioned statements: “I can’t imagine a world without [Institution]” and “[Institution] was the perfect school for people like me.” Graduates who strongly agree with both statements are considered emotionally attached. TCU graduates far outpace graduates from all comparison groups in their attachment to their alma mater.
Alumni Attachment (% Attached)
21%*19%*48% 17%*
TCU Alumni College Graduates Nationally
American Indian/Alaska Native Graduates Nationally
MSI Alumni
*Indicates that outcome is statistically different than TCU alumni outcome at the 95% confidence level
Forty-eight percent of TCU graduates are attached to their alma mater — more than double the percentage of graduates nationally, at 19%.
TCU alumni are also highly likely to recommend TCU to others. More than six in 10 alumni are extremely likely to recommend their institution to friends, family and colleagues, compared with 41% of graduates nationally and 39% of graduates from MSIs.
2
Copyright © 2019 Gallup, Inc. All rights reserved.AICF_Report_DIGITAL_enUS_080119_eas
15

Alumni of Tribal Colleges and Universities Better Their Communities
▶ Further Discussion of the Findings
For the first time, the many positive outcomes of a TCU education have been compared with national benchmarks. Beyond the traditional metrics for measuring the value of a college education — namely, job and graduate school placement rates and alumni salaries — this study addresses how TCUs have enabled alumni to make meaningful, lifelong contributions to society. The following additional data on accessibility, inclusiveness and alumni impact go further to tell the story.
Access to College
TCU alumni, compared with their white peers nationally, are overwhelmingly first-generation college students.8 With this population usually comes greater financial need. While just over half of college graduates nationally (56%) and from MSIs (60%) report receiving some sort of need-based federal financial aid, 81% of TCU alumni were eligible for and garnered this type of monetary support. However, 3% of TCU alumni undertook $20,001 to $40,000 in student loans to obtain an associate or bachelor’s degree, while 19% of college graduates nationally and a quarter of American Indian respondents did so. Perhaps relatedly, TCU alumni are considerably more likely than all comparison groups to strongly agree that their education was worth the cost (67%).
My education from [Institution] was worth the cost. (% Strongly agree)
42%*39%*67% 42%*
TCU Alumni College Graduates Nationally
American Indian/Alaska Native Graduates Nationally
MSI Alumni
8 Gallup, Gallup-USA Funds Minority College Graduates Report. Retrieved from https://www.gallup.com/services/186359/gallup-usa-funds-minority-college-graduates-report-pdf.aspx
Copyright © 2019 Gallup, Inc. All rights reserved.AICF_Report_DIGITAL_enUS_080119_eas
16

Alumni of Tribal Colleges and Universities Better Their Communities
Feelings of Inclusion
American Indian graduates of TCUs and those of non-TCUs have profoundly different experiences, especially concerning perceptions of support during college, that may translate to vastly different lives outside of college. Numerous studies of Native students who attend mainstream colleges and universities suggest that elements such as family support, supportive and involved faculty, institutional commitment, and cultural traditions are key factors that impact a student’s persistence in college.9-15 It can therefore be interpreted that students with more of these types of support may improve their persistence. Feelings of inclusion may come from the unique missions and place-based and indigenous nature of TCUs — something rarely present at the same level in other environments.
9 Barnhardt, C. (1994). Life on the other side: Native student survival in a university world. Peabody Journal of Education, 69, 115-139.
10 Brown, L. L. (1995). Psychosocial factors influencing academic persistence of American Indian college students (Doctoral dissertation, Arizona State University, 1995) Dissertation Abstracts International, 55, 04A.
11 Falk, D. R., & Aitken, L. P. (1984). Promoting retention among American Indian college students. Journal of American Indian Education, 23(2), 24-31.
12 Huffman, T. E., Sill, M. L., & Brokenleg, M. (1986). College achievement among Sioux and White South Dakota students. Journal of American Indian Education, 25(2), 32-38.
13 Lin, R.-L. (1990). Perceptions of family background and personal characteristics among Indian college students. Journal of American Indian Education, 29(3), 19-26.
14 Patton, W., & Edington, E. D. (1973). Factors related to persistence of Indian students at the college level. Journal of American Indian Education, 12(3), 19-23.
15 Reyhner, J., & Dodd, J. (1995, January). Factors affecting the retention of American Indian and Alaska Native Students in higher education. Paper presented at the First Annual Expanding Minority Opportunities National Conference, Arizona State University, Tempe, AZ.
Copyright © 2019 Gallup, Inc. All rights reserved.AICF_Report_DIGITAL_enUS_080119_eas
17

Alumni of Tribal Colleges and Universities Better Their Communities
Alumni Impact
Fifty-nine percent of TCU alumni are currently working full time for an employer — lower than college graduates nationally (71%) and MSI graduates (69%). Although lower in full-time employment, TCU alumni are less likely to be in the workforce altogether, indicating they may be completing graduate work. Of employed TCU graduates, almost four in 10 are working for their tribe as a primary job with almost three-quarters of alumni choosing to work in areas related to American Indian communities or tribal lands. Additionally, 35% of employed alumni currently work for an “Indian-owned” business — an entity in which at least 50% of the property interests are owned by “Indians or Indian tribes” — as defined by the U.S. Code. TCU graduates have resolved to make a difference in their communities through direct participation.
College-educated graduates serve as role models in their communities — often influenced by having had positive role models themselves.16 Previous Gallup research shows professors as the predominant source of undergraduate mentorship on most campuses.17 Nearly two-thirds of recent graduates who agree or strongly agree that they had a mentor during college say that mentor was a professor. In contrast with mainstream institutions, Tribal Colleges and Universities provide Native students with an extra layer of mentorship support. Compared with American Indian college graduates nationally, TCU alumni are more likely to strongly agree that they had a mentor who encouraged them to pursue their goals and dreams (30% vs. 53%).
16 Mosholder, R., & Goslin, C. (2013). Native American College Student Persistence. Journal of College Student Retention: Research, Theory & Practice, 15(3), 305-327.
17 Gallup, 2018 Strada-Gallup Alumni Survey. Retrieved from https://news.gallup.com/reports/244058/2018-strada-gallup-alumni-survey.aspx
Copyright © 2019 Gallup, Inc. All rights reserved.AICF_Report_DIGITAL_enUS_080119_eas
18

Alumni of Tribal Colleges and Universities Better Their Communities
▶ Final Thoughts
This study reveals the extraordinary experiences and outcomes of Tribal College and University alumni and affirms the value of these unique institutions. TCUs boast engaged graduates who feel prepared for life outside of college. Furthermore, TCU alumni thrive in Gallup’s comprehensive measure of wellbeing. They also report high levels of attachment to their alma mater. Before this study, not much was known about the full impact of TCUs on their graduates and the American Indian population. In no small way, these findings support the role of TCUs and the need for more data visibility. Emerging theory and research support the idea that a strong sense of cultural identity relates to achievement and may help maintain academic motivation and engagement.18
This study confirms that access to postsecondary institutions with Native missions supports positive college experiences and outcomes. But chronic underfunding of TCUs may jeopardize this progress and worsen degree attainment gaps between Native and non-Native populations. Unlike with public minority-serving institutions, state and local governments have no obligation to allocate funding to tribally chartered institutions.19 Details from this report should be used to strengthen the ability of advocates like the American Indian College Fund to secure more support for TCUs.
18 Sleeter, C. E. (2011). The academic and social value of ethnic studies.19 Issue Brief, Tribal College and University Funding: Tribal Sovereignty at the Intersection of Federal, State, and Local
Funding. Retrieved from https://www.acenet.edu/news-room/Documents/Tribal-College-and-University-Funding.pdf
Copyright © 2019 Gallup, Inc. All rights reserved.AICF_Report_DIGITAL_enUS_080119_eas
19

Alumni of Tribal Colleges and Universities Better Their Communities
▶ Appendix
Additional Data Table 1: In your primary job, do you do any work in the following areas related to American Indian communities or tribal lands? As a reminder, when we say primary job, we mean the one where you spend the most time working. Please select all that apply. (Reflects data not weighted by graduation year.)
% Choosing Category
Education for American Indian students
Other work related to American Indian communities or tribal lands
Government, policy or advocacy related to American Indian communities
American Indian history, arts or culture
American Indian health or healthcare
Economic development of American Indian communities, businesses or lands
Preservation of tribal lands
Do not currently work in an area related to American Indian communities or tribal lands
38
25
14
17
12
12
0% 10% 20% 40%30% 50%
8
26
Copyright © 2019 Gallup, Inc. All rights reserved.AICF_Report_DIGITAL_enUS_080119_eas
20

Alumni of Tribal Colleges and Universities Better Their Communities
Additional Data Table 2: Have you delayed any of the following because of your student loans? (Reflects data not weighted by graduation year.)
% No or Yes
Moving out of your parent(s)’ home
Buying a home
Buying a car
Starting your own business
Going back to school for more training or another degree
Having children
Getting married
0% 20%10% 30% 40% 50% 90%80%60% 70% 100%
■ No ■ Yes
1486
3862
2971
2575
5248
2080
1486
Additional Data Table 3: What is your highest completed level of education? (Reflects data not weighted by graduation year.)
% Choosing Category
54%30%16%
Postgraduate work or degree
Bachelor’s degree
Associate degree
Copyright © 2019 Gallup, Inc. All rights reserved.AICF_Report_DIGITAL_enUS_080119_eas
21

Alumni of Tribal Colleges and Universities Better Their Communities
Demographics of TCU Alumni Surveyed
GENDER
75% Female
BEFORE 2014
25%
WHITE
14.7%
NATIVE HAWAIIAN OR PACIFIC ISL ANDER
1.7%
ME AN AGE
39
2014-2015
22%
BL ACK OR AFRICAN AMERICAN
0.8%
DON’ T KNOW
1.0%
RESPONDENTS
596
2016-2017
31%
ASIAN
0.7%
FIRST GENER ATION
66%
2018
22%
AMERICAN INDIAN OR AL ASK A NATIVE
89.9%
GR ADUATION YE ARS
R ACE /ETHNICIT Y
Copyright © 2019 Gallup, Inc. All rights reserved.AICF_Report_DIGITAL_enUS_080119_eas
22

Alumni of Tribal Colleges and Universities Better Their Communities
National Comparisons
Results in this report are based on a census of alumni having an email address on file with the following nine institutions: Cankdeska Cikana Community College, Northwest Indian College, College of Menominee Nation, Diné College, Institute of American Indian Arts, Nueta Hidatsa Sahnish College, Sitting Bull College, Turtle Mountain Community College, and United Tribes Technical College. The respondents include 596 alumni (498 received their degree in 2001 through 2018). Results from these undergraduate alumni are compared with each other as well as with data from respondents in the national Gallup Alumni Survey. In this report, TCU alumni are compared with the following groups:
College Graduates Nationally: The results for this group are from the Gallup Alumni Survey. The sample consists of 24,886 college graduates who received a bachelor’s degree or higher between 2001 and 2016, living in all 50 U.S. states and the District of Columbia.
Minority-Serving Institutions Alumni: This comparison group includes 2,889 graduates from lists provided by the Office of Civil Rights detailing U.S.-accredited postsecondary minorities institutions maintained by the Department of Education. This listing includes graduates from Historically Black Colleges and Universities (101 institutions), Hispanic-Serving Institutions (394 institutions), Asian American and Pacific Islander Serving Institutions (37 institutions), and Tribal Colleges and Universities (36 institutions).
Self-Identified American Indian and Alaska Native Graduates: This comparison group includes the 1,051 alumni identifying as American Indian or Alaska Native receiving at least a bachelor’s degree between 2001 and 2016 from the Gallup Alumni Survey.
Due to the large sample size of national graduates, relatively small differences in outcomes between this group and TCU alumni are statistically significant at the 95% confidence level, while similarly sized differences between TCU alumni and the other smaller comparison groups may not be statistically significant.
Copyright © 2019 Gallup, Inc. All rights reserved.AICF_Report_DIGITAL_enUS_080119_eas
23

Alumni of Tribal Colleges and Universities Better Their Communities
▶ Methodology
Results for the American Indian College Fund Alumni Study are based on web surveys conducted Feb. 25 to March 25, 2019, with 596 Tribal Colleges and Universities alumni. Individuals were included in the study if they had obtained a degree from a TCU between 2001 and 2018. The nine TCUs associated with this study provided a total of 4,704 current email addresses; the total response rate was 13%.
Gallup Alumni Survey Methodology
Results for the Gallup Alumni Survey, the study used for comparison purposes, are based on web surveys conducted Feb. 4-March 7, 2014, Dec. 16, 2014-June 29, 2015, and Aug. 22-Oct. 11, 2016, with a random sample of 29,560 respondents, 30,151 respondents and 11,483 respondents, respectively, with a bachelor’s degree or higher, aged 18 and older, with internet access and living in all 50 U.S. states and the District of Columbia.
The 2014 Gallup Alumni Survey sample was compiled from two sources: the Gallup Panel and the Gallup Daily tracking survey. The 2015 and 2016 Gallup Alumni Survey samples were recruited via the Gallup Daily tracking survey. The Gallup Panel is a proprietary, probability-based longitudinal panel of U.S. adults who are selected using random-digit-dial (RDD) and address-based sampling methods. The Gallup Panel is not an opt-in panel. The Gallup Panel includes 60,000 individuals, and Panel members can be surveyed by phone, mail or web. Gallup Panel members with a college degree and access to the internet were invited to take the Gallup Alumni Survey online. The Gallup Daily tracking survey sample includes national adults with a minimum quota of 70% cellphone respondents and 30% landline respondents, with additional minimum quotas by time zone within region. Landline and cellular telephone numbers are selected using RDD methods. Landline respondents are chosen at random within each household based on which member had the most recent birthday. Gallup Daily tracking respondents with a college degree, who agreed to future contact, were invited to take the Gallup Alumni Survey online.
Copyright © 2019 Gallup, Inc. All rights reserved.AICF_Report_DIGITAL_enUS_080119_eas
24

Alumni of Tribal Colleges and Universities Better Their Communities
Gallup Alumni Survey interviews are conducted via the web, in English only. Samples are weighted to correct for unequal selection probability and nonresponse. The data are weighted to match national demographics of gender, age, race, Latino ethnicity, education and region. Demographic weighting targets are based on the most recent Current Population Survey figures for the aged 18 and older U.S. bachelor’s degree or higher population.
All reported margins of sampling error for the Gallup Alumni Survey of all college graduates include the computed design effects for weighting.
For results based on the total sample of 24,886 graduates with a bachelor’s degree, the margin of sampling error is ±1.5 percentage points at the 95% confidence level.
For results based on the total sample of 2,889 graduates with a bachelor’s degree from a minority-serving institution, the margin of sampling error is ±3.5 percentage points at the 95% confidence level.
For results based on the total sample of 1,051 graduates with a bachelor’s degree who self-identify as American Indian or Alaska Native, the margin of sampling error is ±5 percentage points at the 95% confidence level.
In addition to sampling error, question wording and practical difficulties in conducting surveys can introduce error or bias into the findings of public opinion polls.
Copyright © 2019 Gallup, Inc. All rights reserved.AICF_Report_DIGITAL_enUS_080119_eas
25

Alumni of Tribal Colleges and Universities Better Their Communities
AICF_Report_DIGITAL_enUS_080119_eas
TCU alumni give back to their own community.
Seventy-four percent report being primarily
employed in areas related
to American Indian
communities or tribal
lands, and many work
directly with their tribe.
Copyright © 2019 Gallup, Inc. All rights reserved.26