Alumina Limited - asx.com.au · alumina or aluminium prices or currency exchange rates; (e) Alumina...
20
Alumina Limited ASX CEO Connect Presentation June 2019
Transcript of Alumina Limited - asx.com.au · alumina or aluminium prices or currency exchange rates; (e) Alumina...

Alumina Limited
ASX CEO Connect Presentation
June 2019
Disclaimer
Summary Information
This Presentation contains summary information about the current activities of Alumina Limited (ACN 004 820 419) (Alumina) and its subsidiaries as at the date of this Presentation. The
information in this Presentation should not be considered to be comprehensive nor to comprise all the information that a reader may require in order to make an investment decision regarding
Alumina securities. This Presentation should be read in conjunction with Alumina's other periodic and continuous disclosure announcements lodged with the ASX, which are available at
www.asx.com.au.
No Offer, Recommendation or Advice
This Presentation is for information purposes only and is not a prospectus, product disclosure statement or other disclosure or offering document under Australian or any other law. It does not
constitute an offer, invitation or recommendation to acquire Alumina securities in any jurisdiction and neither this Presentation nor anything contained in it will form the basis of any contract or
commitment.
The information contained in this Presentation is not financial product advice, or any other advice, and has been prepared without taking into account any reader's investment objectives,
financial circumstances or particular needs.
Forward-Looking Statements
Neither Alumina nor any other person warrants or guarantees the future performance of Alumina or any return on any investment made in Alumina securities. This Presentation may contain
certain forward-looking statements, including forward-looking statements within the meaning of the US Private Securities Litigation Reform Act of 1995. The words “anticipate”, "aim", "believe",
"expect", "project", “estimate”, "forecast", "intend", "likely", “should”, "could", "will", "may", "target", "plan” and other similar expressions (including indications of "objectives") are intended to
identify forward-looking statements. Indications of, and guidance on, future financial position and performance and distributions, and statements regarding Alumina's future developments and
the market outlook, are also forward-looking statements.
Any forward-looking statements contained in this document are not guarantees of future performance. Such forward-looking statements involve known and unknown risks, uncertainties and
other factors, many of which are beyond the control of Alumina and its directors, officers, employees and agents that may cause actual results to differ materially from those expressed or
implied in such statements. Those risks, uncertainties and other factors include (without limitation): (a) material adverse changes in global economic conditions, alumina or aluminium industry
conditions or the markets served by AWAC; (b) changes in production or development costs, production levels or sales agreements; (c) changes in laws, regulations or policies; (d) changes in
alumina or aluminium prices or currency exchange rates; (e) Alumina Limited does not hold a majority interest in AWAC and decisions made by majority vote may not be in the best interests of
Alumina Limited; and (f) the other risk factors summarised in Alumina's Annual Report 2018. Readers should not place undue reliance on forward-looking statements. Except as required by law,
Alumina disclaims any responsibility to update or revise any forward-looking statements to reflect any new information or any change in the events, conditions or circumstances on which a
statement is based or to which it relates.
Key Risks
Certain key risks that may affect Alumina, its financial and operating performance and the accuracy of any forward-looking statements contained in this Presentation include (without limitation):
(a) material adverse changes in global economic conditions, alumina or aluminium industry conditions or the markets served by AWAC; (b) changes in production or development costs,
production levels or sales agreements; (c) changes in laws, regulations or policies; (d) changes in alumina or aluminium prices or currency exchange rates; (e) Alumina Limited does not hold a
majority interest in AWAC and decisions made by majority vote may not be in the best interests of Alumina Limited; and (f) the other risk factors summarised in Alumina’s Annual Report 2018.
Past Performance
Past performance information contained in this Presentation is given for illustrative purposes only and should not be relied upon as (and is not) an indication of future performance.
No Liability
The information contained in this Presentation has been prepared in good faith and with due care but no representation or warranty, express or implied, is provided as to the currency, accuracy,
reliability or completeness of that information.
To the maximum extent permitted by law, Alumina and its directors, officers, employees and agents, and any other person involved in the preparation of this Presentation, exclude and disclaim
all liability for any expenses, losses or costs incurred by any person arising out of or in connection with the information contained in this Presentation being inaccurate or incomplete in any way
for any reason, whether by negligence or otherwise.
2
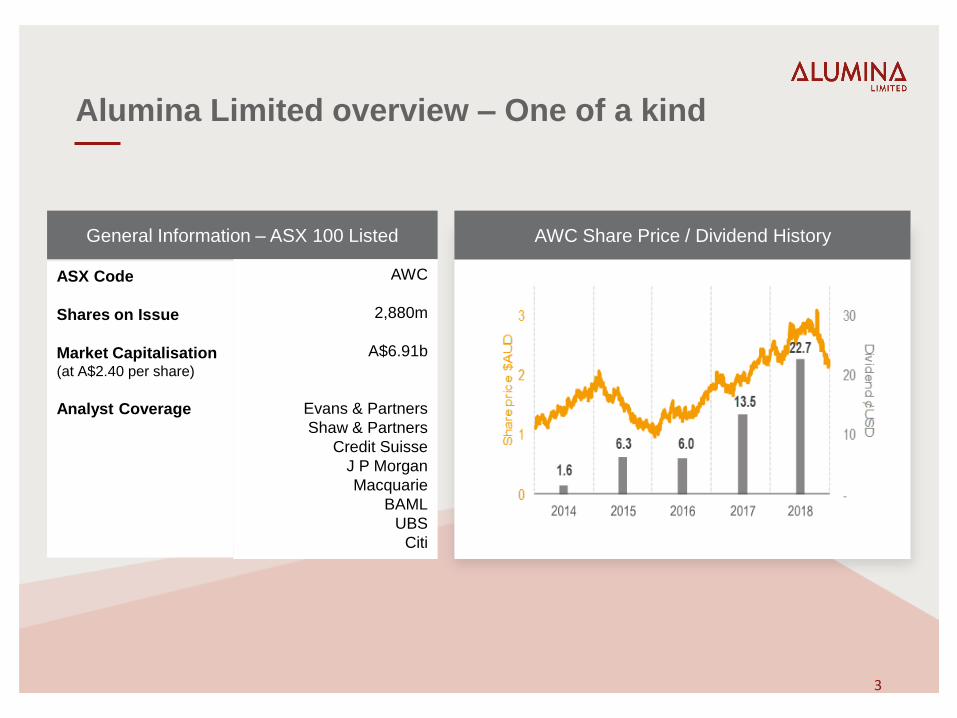
Alumina Limited overview – One of a kind
AWC Share Price / Dividend History
ASX Code
Shares on Issue
Market Capitalisation(at A$2.40 per share)
Analyst Coverage
General Information – ASX 100 Listed
AWC
2,880m
A$6.91b
Evans & Partners
Shaw & Partners
Credit Suisse
J P Morgan
Macquarie
BAML
UBS
Citi
3

Reasons to invest
Average dividend yield(1)
(past three calendar years, exc franking credits)
9.3%
7.0%
5.0%
3.4% 3.1%2.8%
No d
ivid
ends
No d
ivid
ends
Alu
min
a
Rio
Tin
to
So
uth
32
Alb
a
No
rsk H
ydro
Ru
sal
Alc
oa
Co
rp.
Ce
ntu
ry A
lum
inu
m
Notes: (1) Dividend yield calculated as the average dividend declared with
respect to the last three calendar years (CY16 – CY18) divided by the
average share price during that period
40% Owner of AWAC JV
World class long life bauxite and alumina assets
Best performed part of the aluminium chain
Aluminium demand growth forecast to continue
Opportunities to expand existing operations
Largest exposure to alumina price index ex-China
Over the commodity price cycle, AWAC’s low position
on the cost curve means the JV should perform
relatively well even at low prices
FY 2018 Record Profit Performance
Net profit after tax up 87% on the back of higher prices
US 14.1 (A 19.6) cents per share final dividend, fully
franked
Low debt ($121m at 31 March 2019)
Strong, transparent cash flows derived from growing,
balanced markets
4
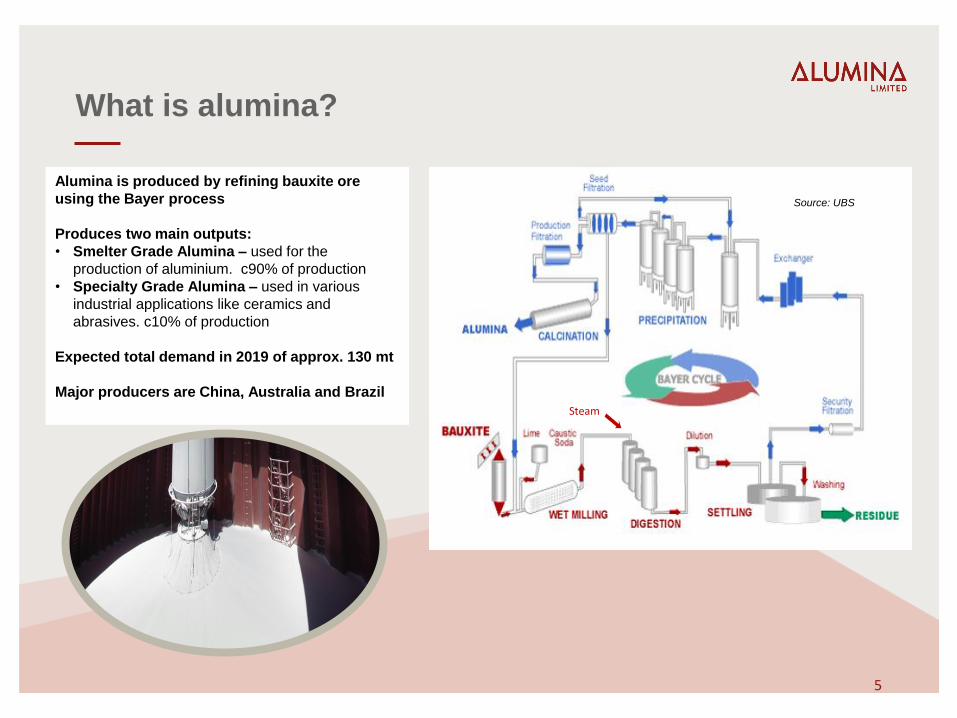
What is alumina?
Alumina is produced by refining bauxite ore
using the Bayer process
Produces two main outputs:
• Smelter Grade Alumina – used for the
production of aluminium. c90% of production
• Specialty Grade Alumina – used in various
industrial applications like ceramics and
abrasives. c10% of production
Expected total demand in 2019 of approx. 130 mt
Major producers are China, Australia and Brazil
Steam
5
Source: UBS

AWAC Joint Venture
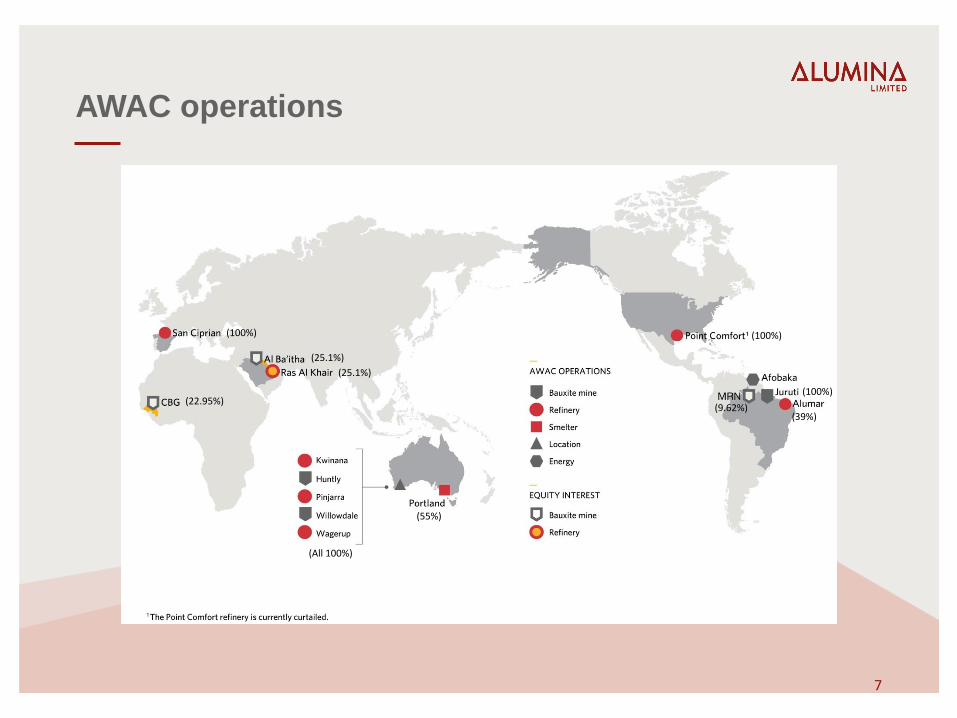
AWAC operations
(All 100%)
(100%) (100%)
(55%)
(9.62%)(39%)
(100%)
(25.1%)
(25.1%)
(22.95%)
7
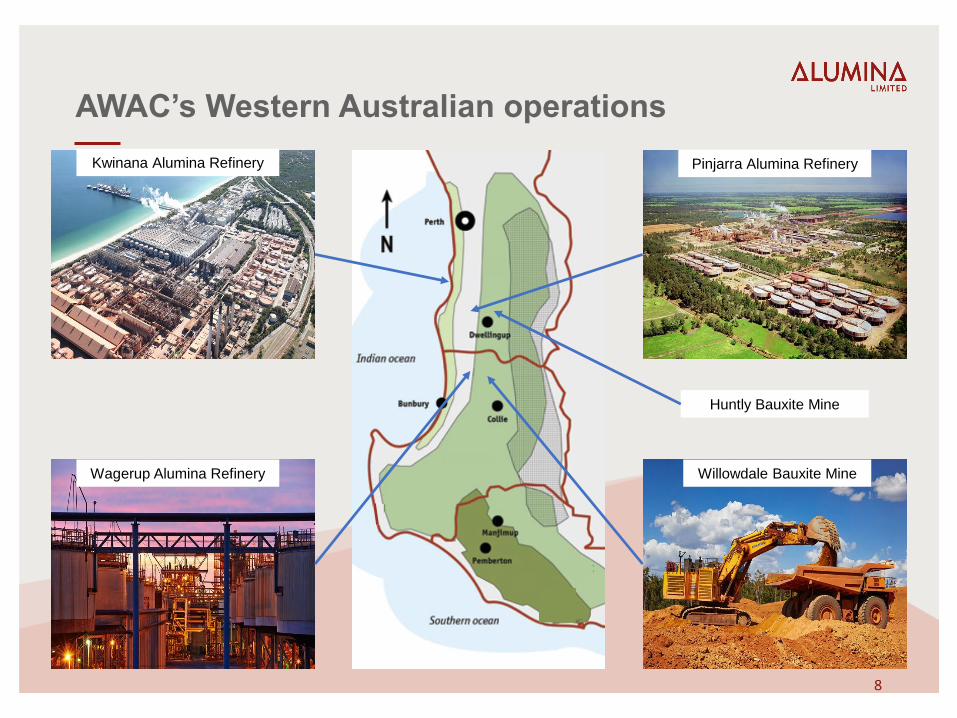
AWAC’s Western Australian operations
Willowdale Bauxite MineWagerup Alumina Refinery
Kwinana Alumina Refinery Pinjarra Alumina Refinery
Huntly Bauxite Mine
8
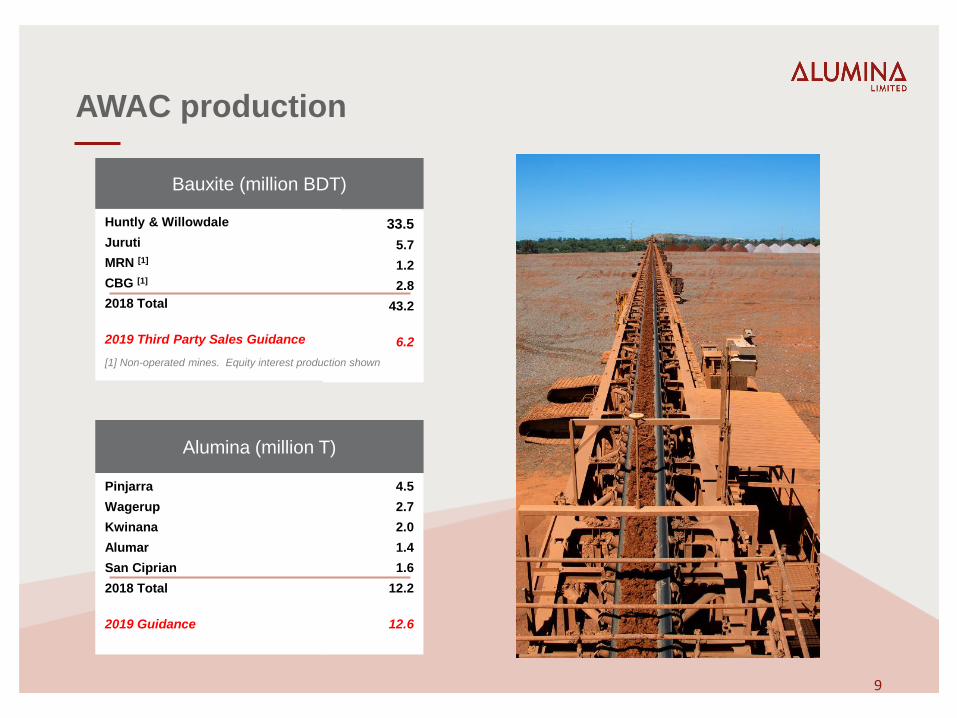
AWAC production
Huntly & Willowdale
Juruti
MRN [1]
CBG [1]
2018 Total
2019 Third Party Sales Guidance
33.5
5.7
1.2
2.8
43.2
6.2
Bauxite (million BDT)
Alumina (million T)
Pinjarra
Wagerup
Kwinana
Alumar
San Ciprian
2018 Total
2019 Guidance
4.5
2.7
2.0
1.4
1.6
12.2
12.6
[1] Non-operated mines. Equity interest production shown
9
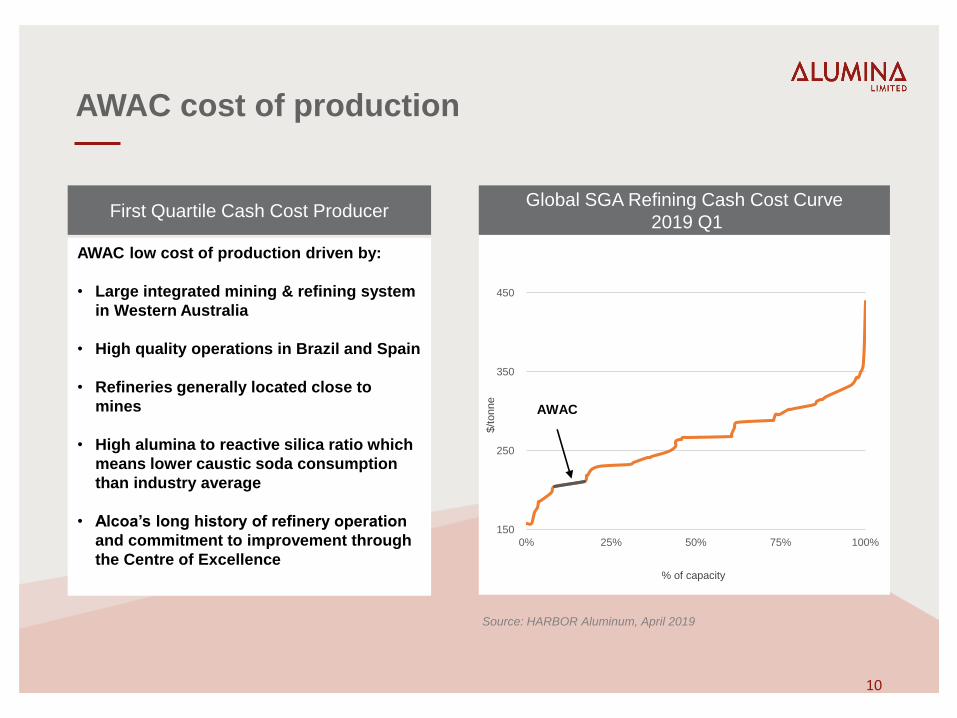
AWAC cost of production
150
250
350
450
0% 25% 50% 75% 100%
AWAC
% of capacity
$/t
onne
Global SGA Refining Cash Cost Curve
2019 Q1
Source: HARBOR Aluminum, April 2019
First Quartile Cash Cost Producer
AWAC low cost of production driven by:
• Large integrated mining & refining system
in Western Australia
• High quality operations in Brazil and Spain
• Refineries generally located close to
mines
• High alumina to reactive silica ratio which
means lower caustic soda consumption
than industry average
• Alcoa’s long history of refinery operation
and commitment to improvement through
the Centre of Excellence
10
Market overview
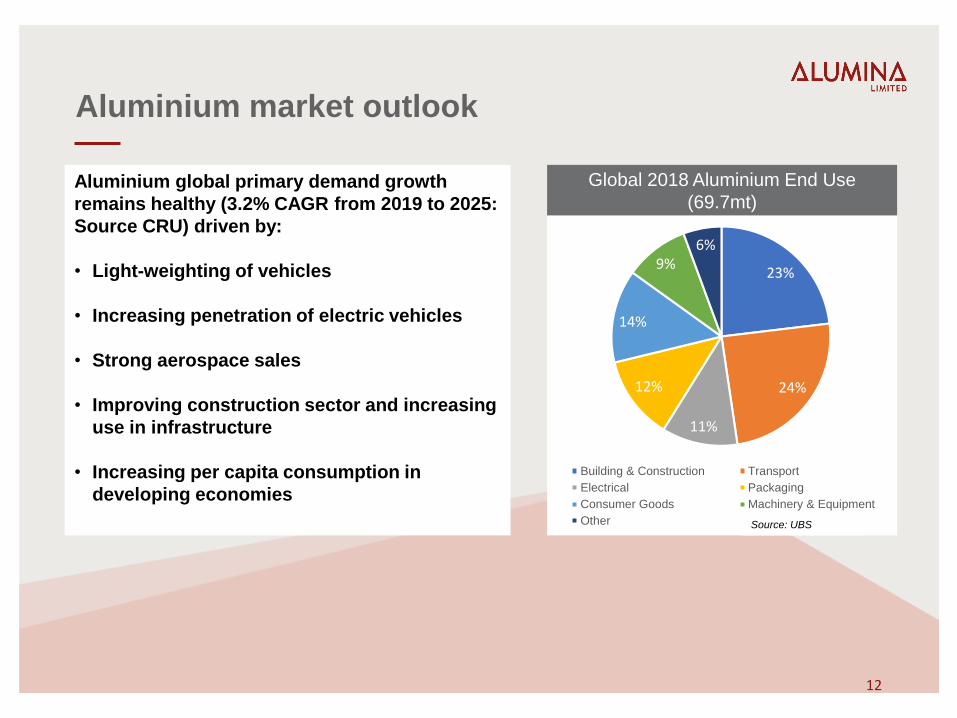
Aluminium market outlook
Aluminium global primary demand growth
remains healthy (3.2% CAGR from 2019 to 2025:
Source CRU) driven by:
• Light-weighting of vehicles
• Increasing penetration of electric vehicles
• Strong aerospace sales
• Improving construction sector and increasing
use in infrastructure
• Increasing per capita consumption in
developing economies
Global 2018 Aluminium End Use
(69.7mt)
23%
24%
11%
12%
14%
9%6%
Building & Construction Transport
Electrical Packaging
Consumer Goods Machinery & Equipment
Other Source: UBS
12
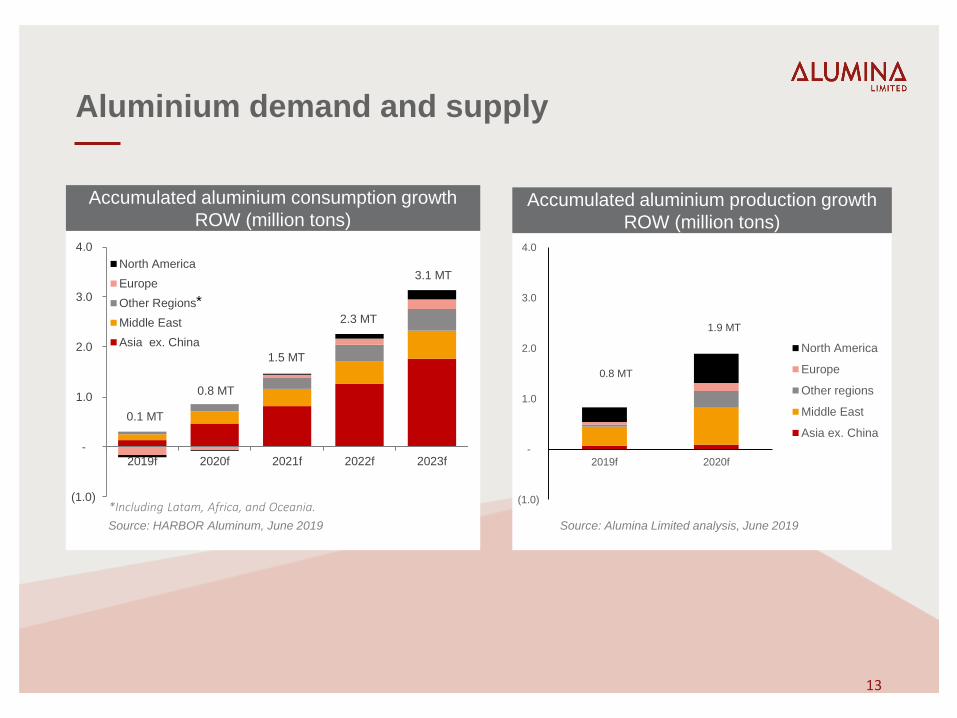
Aluminium demand and supply
Source: HARBOR Aluminum, June 2019
Accumulated aluminium consumption growth
ROW (million tons)
13
(1.0)
-
1.0
2.0
3.0
4.0
2019f 2020f
North America
Europe
Other regions
Middle East
Asia ex. China
Source: Alumina Limited analysis, June 2019
Accumulated aluminium production growth
ROW (million tons)
1.9 MT
0.8 MT
(1.0)
-
1.0
2.0
3.0
4.0
2019f 2020f 2021f 2022f 2023f
North America
Europe
Other Regions
Middle East
Asia ex. China
*Including Latam, Africa, and Oceania.
*
0.1 MT
0.8 MT
1.5 MT
2.3 MT
3.1 MT

Alumina market
14
Alumina price indices continue to reflect alumina supply/demand and cost fundamentals
300
400
500
600
700
800
May-18 Jun-18 Jul-18 Aug-18 Sep-18 Oct-18 Nov-18 Dec-18 Jan-19 Feb-19 Mar-19 Apr-19
(US
$/t
, n
om
inal)
Platts PAX FOB Australia Prices since May 2018
Aug
•Alcoa of Australia
(AWAC) workers strike
•On-going uncertainty
over Alunorte
resolution
Mar
•Restocking and
short-covering
raising market prices
May
•China starts
alumina
exports
Nov - Dec
•Prospect of Alunorte recovery is prime driver
•Arbitrage window closed for Chinese exports
•Aluminium weak, alumina remains costly as % of LME
•Consumers stocked up, few desperate buyers in the immediate term
•Refining and smelting cuts in China (Beijing environmental protection drive)
•Chinese environment audits diluted, as Beijing focuses on driving economy
Apr-May
•Likelihood of Alunorte ramp up to 100% increases
as conciliatory hearings proceed.
•Note: Alunorte was granted approval during May
•China slow to import despite open arbitrage;
steep yuan depreciation a concern
•Chinese refining cuts in Shanxi on environmental
issues (Xinfa 2.8m tpa, Huaqing 0.45m tpa)
Jul
•Alpart refinery
technical issues
•Chinese bauxite,
refining cuts due
to environmental
audits
Jan - Feb
•China slowing for
Lunar New Year
•Collapse of the Vale
Dam
•Official removal of the
Rusal sanctions
Sep
•China restarts
alumina exports
•Rusal sanctions
softened
•Alcoa of Australia
strike ends
Oct
•Indexes rise rapidly due
to the threat of Alunorte
shutting down entirely.
•Prices decline rapidly
when Alunorte threat to
shutdown is reversed
Source: Platts, May 2019
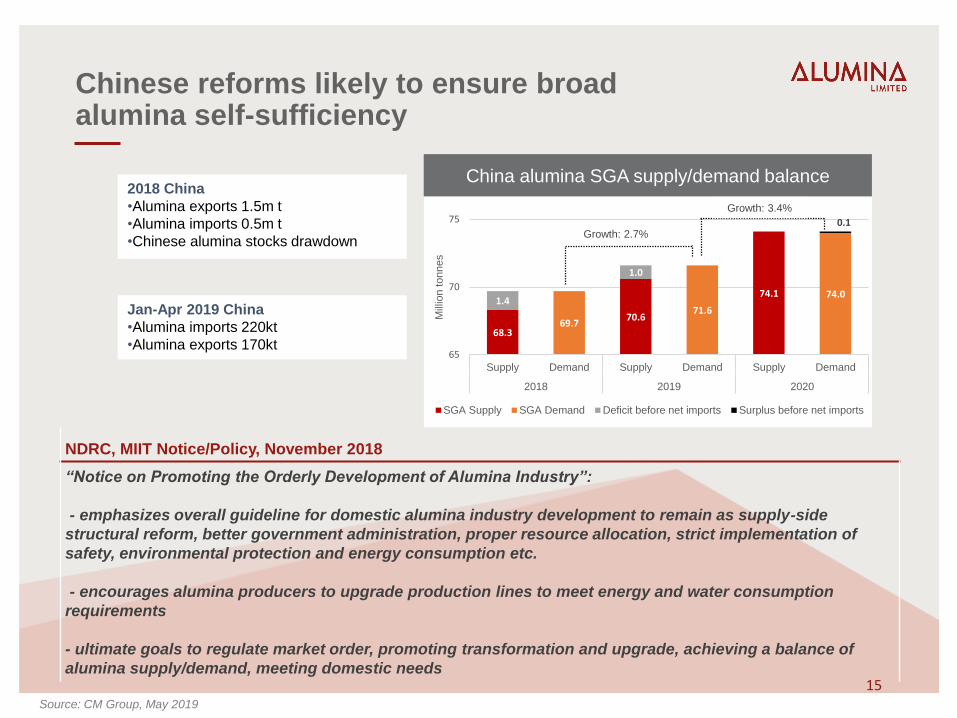
Chinese reforms likely to ensure broad alumina self-sufficiency
15
China alumina SGA supply/demand balance
68.3
70.6
74.1
69.7 71.6
74.0 1.4
1.0
0.1
65
70
75
Supply Demand Supply Demand Supply Demand
2018 2019 2020
Mill
ion tonnes
SGA Supply SGA Demand Deficit before net imports Surplus before net imports
Growth: 2.7%
Growth: 3.4%
2018 China
•Alumina exports 1.5m t
•Alumina imports 0.5m t
•Chinese alumina stocks drawdown
Jan-Apr 2019 China
•Alumina imports 220kt
•Alumina exports 170kt
NDRC, MIIT Notice/Policy, November 2018
“Notice on Promoting the Orderly Development of Alumina Industry”:
- emphasizes overall guideline for domestic alumina industry development to remain as supply-side
structural reform, better government administration, proper resource allocation, strict implementation of
safety, environmental protection and energy consumption etc.
- encourages alumina producers to upgrade production lines to meet energy and water consumption
requirements
- ultimate goals to regulate market order, promoting transformation and upgrade, achieving a balance of
alumina supply/demand, meeting domestic needs
Source: CM Group, May 2019
The future for
Alumina Limited and
AWAC

Sustainability – Aluminium’s impact
17
• Aluminium has low density, is non-toxic, has a high thermal
and electrical conductivity, has excellent corrosion
resistance and can be easily cast, machined and formed.
• Ideal for lightweighting – aluminium by volume weighs less
than half iron or copper.
• Achieves up to 20% reduction in total life cycle energy
consumption
• Infinitely recyclable without loss of material properties
• 75% of all aluminium ever produced is still in productive use
• Recycling aluminium requires up to 95% less energy than to
produce primary metal
• 73% recycling rate – high compared to competing packaging
types
Aluminium is amongst the most environmentally friendly metals on the planet.
An Audi A8 aluminium
body weighs 194 kgs less
than a steel equivalent.
Source: International Aluminium Institute
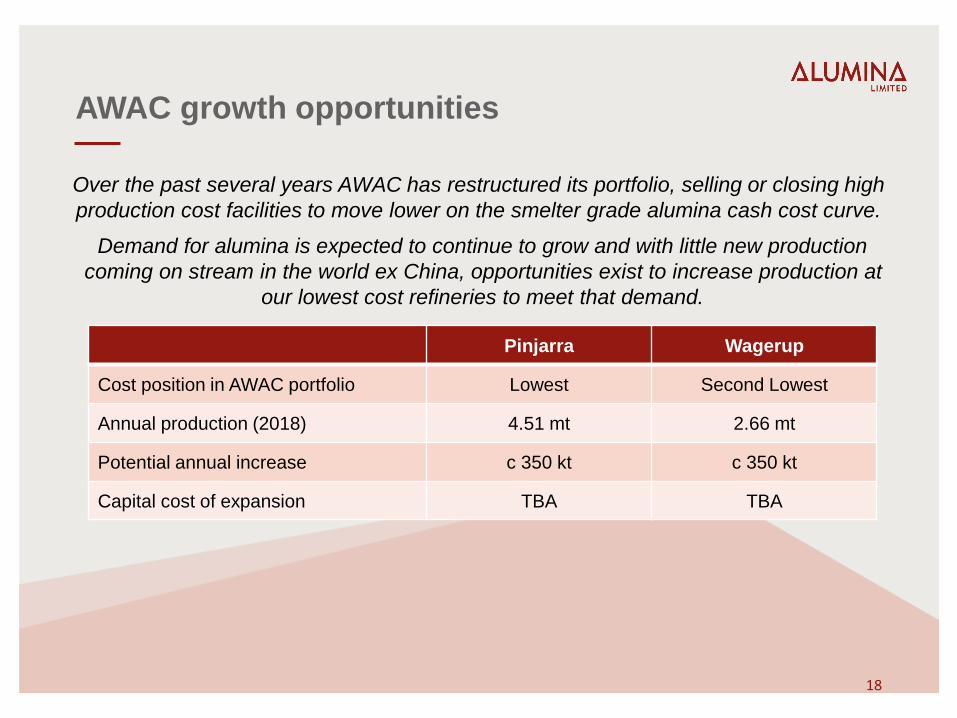
AWAC growth opportunities
Over the past several years AWAC has restructured its portfolio, selling or closing high
production cost facilities to move lower on the smelter grade alumina cash cost curve.
Demand for alumina is expected to continue to grow and with little new production
coming on stream in the world ex China, opportunities exist to increase production at
our lowest cost refineries to meet that demand.
Pinjarra Wagerup
Cost position in AWAC portfolio Lowest Second Lowest
Annual production (2018) 4.51 mt 2.66 mt
Potential annual increase c 350 kt c 350 kt
Capital cost of expansion TBA TBA
18
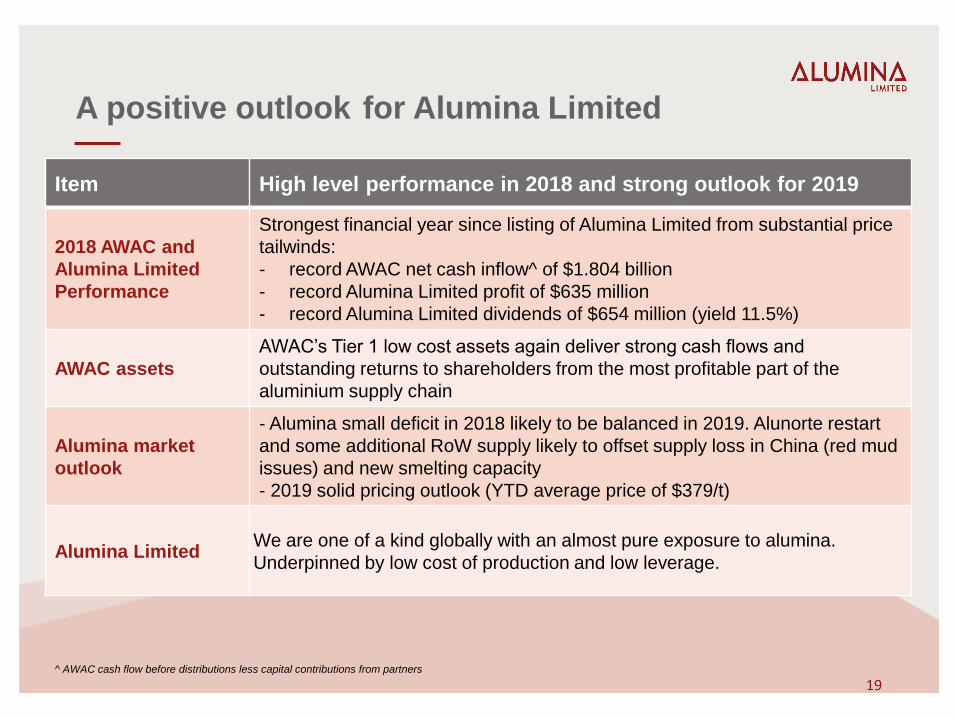
A positive outlook for Alumina Limited
Item High level performance in 2018 and strong outlook for 2019
2018 AWAC and
Alumina Limited
Performance
Strongest financial year since listing of Alumina Limited from substantial price
tailwinds:
- record AWAC net cash inflow^ of $1.804 billion
- record Alumina Limited profit of $635 million
- record Alumina Limited dividends of $654 million (yield 11.5%)
AWAC assets
AWAC’s Tier 1 low cost assets again deliver strong cash flows and
outstanding returns to shareholders from the most profitable part of the
aluminium supply chain
Alumina market
outlook
- Alumina small deficit in 2018 likely to be balanced in 2019. Alunorte restart
and some additional RoW supply likely to offset supply loss in China (red mud
issues) and new smelting capacity
- 2019 solid pricing outlook (YTD average price of $379/t)
Alumina LimitedWe are one of a kind globally with an almost pure exposure to alumina.
Underpinned by low cost of production and low leverage.
^ AWAC cash flow before distributions less capital contributions from partners
19
Alumina LimitedLevel 12, 60 City Road, Southbank VIC 3006
+61 (3) 8699 2600
www.aluminalimited.com
Contact
Charles SmitheramManager – Treasury & Investor Relations
<#>