Alternatives to Hydrofluoric Acid Etching At Wyman · PDF fileAlternatives to Hydrofluoric...
35
Alternatives to Hydrofluoric Acid Etching At Wyman Gordon Company A Major Qualifying Project Report Submitted to the Faculty of the WORCESTER POLYTECHNIC INSTITUTE In partial fulfillment of the requirements for the Degree of Bachelor of Science In Chemical Engineering By: _____________________________ Andrew Labak Date: April 29, 2010 Approved: _____________________________ Associate Professor David DiBiasio, Major Advisor
Transcript of Alternatives to Hydrofluoric Acid Etching At Wyman · PDF fileAlternatives to Hydrofluoric...

Alternatives to Hydrofluoric Acid Etching At Wyman
Gordon Company
A Major Qualifying Project Report
Submitted to the Faculty of the
WORCESTER POLYTECHNIC INSTITUTE
In partial fulfillment of the requirements for the
Degree of Bachelor of Science
In Chemical Engineering
By:
_____________________________
Andrew Labak
Date: April 29, 2010
Approved:
_____________________________
Associate Professor David DiBiasio, Major Advisor

Table of Contents
Table of Contents .......................................................................................................................................... 2
Abstract ......................................................................................................................................................... 4
Chapter 1: Introduction ................................................................................................................................ 5
Chapter 2: Literature Review ........................................................................................................................ 6
2.1 Titanium .............................................................................................................................................. 6
2.2 Alpha Case ........................................................................................................................................... 6
2.3 Acid Etching ......................................................................................................................................... 7
2.4 Etching Solutions ................................................................................................................................. 8
2.5 Wyman – Gordon Production Process ................................................................................................ 8
2.6 Wyman – Gordon Acid Bath Procedure .............................................................................................. 9
Chapter 3: Methodology ............................................................................................................................... 9
3.1 Scope of Project .................................................................................................................................. 9
3.2 Methodology For Etch Process Solutions ......................................................................................... 10
3.2.1 Equipment .................................................................................................................................. 10
3.2.2 Test Pieces .................................................................................................................................. 10
3.2.3 Acid Baths................................................................................................................................... 11
3.2.4 Agitation ..................................................................................................................................... 12
3.2.5 Temperature Control ................................................................................................................. 12
3.2.6 Procedures ................................................................................................................................. 12
3.2.7 Safety ......................................................................................................................................... 14
Chapter 4: Results and Discussion .............................................................................................................. 14
4.1 Hydrofluoric and Nitric Acid Solution ............................................................................................... 14
4.2 Fluoroboric Acid ................................................................................................................................ 16
4.2.1 Fluoroboric Acid, 5% solution .................................................................................................... 17
4.2.2 Fluoroboric Acid, 8% solution .................................................................................................... 19
4.3 Sodium Fluoride and Ammonium Persulfate .................................................................................... 21
4.3.1 Sodium Fluoride and Ammonium Persulfate, 0.5M Solution .................................................... 22
4.3.2 Sodium Fluoride and Ammonium Persulfate, 1M Solution ....................................................... 24
4.4 Analysis of Results ............................................................................................................................. 25

4.4.1 Comparison of Mass Etched ...................................................................................................... 25
4.4.2 Economic Comparison ............................................................................................................... 27
Chapter 5: Conclusions and Recommendations ......................................................................................... 28
Chapter 6: Bibliography .............................................................................................................................. 30
Chapter 7: Appendix ................................................................................................................................... 31
7.1 Hydrofluoric/Nitric Acid Solution ...................................................................................................... 31
7.2 Fluoroboric Acid 5% Solution ............................................................................................................ 31
7.2 Fluoroboric Acid 8% Solution ............................................................................................................ 32
7.4 Sodium Fluoride and Ammonium Persulfate 0.5M Solution ............................................................ 33
7.5 Sodium Fluoride and Ammonium Persulfate 1M Solution ............................................................... 34

Abstract
The goal of this project was to explore alternatives to the use of hydrofluoric acid in the removal
of alpha case from the surface of forged titanium for the Wyman-Gordon Company. Both fluoroboric
acid and a solution of sodium fluoride and ammonium persulfate were experimentally tested. Results
showed that hydrofluoric acid had the highest etch rate over 6 minutes. Recommendations for future
research were made to improve the current process.

Chapter 1: Introduction
Wyman-Gordon Company has been producing quality forgings for a multitude of uses, including
aerospace applications, for over a hundred years [1]. During this time improvement upon the
production process has been a noted goal. One aspect of the production process which has been the
focus of the past improvement efforts, and still has the potential to be better understood and need for
further research, is the formation and removal of alpha case on titanium parts. When the titanium parts
are heated during the forging and heat treatment stages a scale of titanium dioxide and a layer of
titanium with high concentrations of oxygen form on the part, commonly called “alpha case”. In order
for any part to pass inspection, and often by the client’s specifications both the scale and the alpha case
need to be removed from the part. The scale is easily removed mechanically, but due to the hard brittle
nature of the alpha case chemical etching is used by Wyman-Gordon.
The current procedure that Wyman-Gordon uses is based around large chemical etch tanks into
which all the parts are dipped. The parts are first blasted with steel shot to remove the scale and then
the chemical etch is used to remove the alpha case. The chemical composition of these etch tanks are
hydrofluoric acid and nitric acid in water. Due to the hazardous and expensive nature of hydrofluoric
acid alternatives to this procedure or improvements upon it are highly desired.
Previous research has studied a wide range of factors regarding the use of hydrofluoric acid. In
multiple studies the effects of agitation, solution temperature, acid concentrations, and titanium
concentration have been researched and recorded. Research has been done into recycling the acid, as
opposed to dumping the entire solution in the etch tanks, and reducing losses from evaporation. [1994
MQP] Other research had been done to study the effect of protective coatings or lubricants on reducing
the amount scale and alpha case formed has been studied. [1997 MQP] Also in current research, the
comparative etch rates on alpha case and titanium without high concentrations of oxygen is being
studied.
While much research has been done on the use of hydrofluoric acid there have been few
significant research efforts regarding possible alternatives. There are other chemical solutions which
merit research, and direct comparison to hydrofluoric acid, due to their ability to effectively etch
titanium. Previous research has failed to study these possible replacements under a single scientific
study, where their etching rates could be compared and the key differences and advantages of each
could be explained.
The goal of this project was to thoroughly explore these other solutions, experimentally
comparing these different solutions and their ability to etch through alpha case. With the basis of this
experimental data, a basic economic and environmental comparison will be performed. With the
knowledge gained through this project Wyman-Gordon will be able to refocus future research and
restructure future procedures towards the best etching solution taking into account economic,
environmental, and safety concerns.

Chapter 2: Literature Review
2.1 Titanium Titanium is the 22ed element in the periodic table, and happens to be the “fourth most abundant
structural metal.” [2] Due to titanium’s high strength to weight ratio it has been used in many
applications. Most notably 80 percent of titanium today is used in the aerospace industry. [3] Titanium
can general be found in two different phases. The first, the alpha phase, is a hexagonal-closed pack
structure. [4] The second, the beta phase, is a body-centered cubic structure. [5]
Figure 1: Visual Representation of Titanium Alpha and Beta Phase[14]
When alloyed with other metals it is possible to stabilize one or both phases. Pure titanium or
titanium alloyed with aluminum, gallium, or tin stabilize the alpha phase, while the alloys with transition
metals often stabilize the beta phase. [2] Alloys that support both phases are often used because of
their improved physical properties: tensile, fatigue, and fracture toughness compared to alloys which
stabilize only one phase. [5] The most common of these alloys is Ti-6Al-4V.
2.2 Alpha Case Titanium has a high affinity for hydrogen, nitrogen, and oxygen. [6] Therefore when a titanium
alloy piece goes through high temperature, 1500-1800 degree, heat treatment a layer of scale and a
sub-surface layer of high oxygen concentration alloy form. In most industrial procedures both these
layers are removed, as in the Wyman-Gordon production process.
The removal of scale is often accomplished through mechanical means – grinding and grit or
shot blasting. Grinding is done with either a belt sander or a similar mechanical tool. Through the use
of a course material rotating at high speeds, an individual using the tool is able to remove the outer
most layer. Blasting is another method often employed, and uses two different general objects to blast
a piece. The piece to be blasted will be placed in the blasting machine. There are wide range of
different sized machines suited for many different sized pieces. Then the piece it hit at high speeds with
either grit, a granule substance similar to sand, or shot, pellet sized objects made of steel or another
metal. Depending on the particular machine the blasting process is either directly controlled by an
individual or automated, where the machine evenly blasted the piece from all directions.

Oxygen is a strong alpha phase stabilizer so in alloys where a mixture of alpha and beta phases is
desired this layer needs to be removed. [7] This layer, often referred to as “alpha case,” is brittle, hard, a
difficult to remove through any mechanical means. [8] Below, in Figure 1, is a photographic image of
alpha case.
Figure 2: Photographic Image of Alpha Case in Titanium [15]
2.3 Acid Etching Acid etching, or chemical milling as it is occasionally called, can be used as an alternative to
mechanical means of removing the alpha case. The acid etching is a controlled corrosive process that
dissolves the metal at a regular rate across the part, regardless of topography which allows for complete
removal of alpha case. An acid bath will be created and held within determined parameters, and parts
will be exposed in the bath for set times.
The rate metal removal is dependent on three different factors: the concentration of the acid,
the temperature of the reacting components, and the amount of metal dissolved in solution. Both the
concentration and the temperature of the reaction have a direct relationship with the metal removal
rate while the amount of metal dissolved in solution has an inverse relationship.
As mentioned previously, titanium has a high affinity for hydrogen. This becomes a point of
concern during some acid baths as the hydrogen content of the solution can adsorb into the part and
create an outer layer embrittled by the hydrogen. Often time limits are placed on the total time that a
part can spend in a bath in order to prevent this from happening. At higher temperatures the
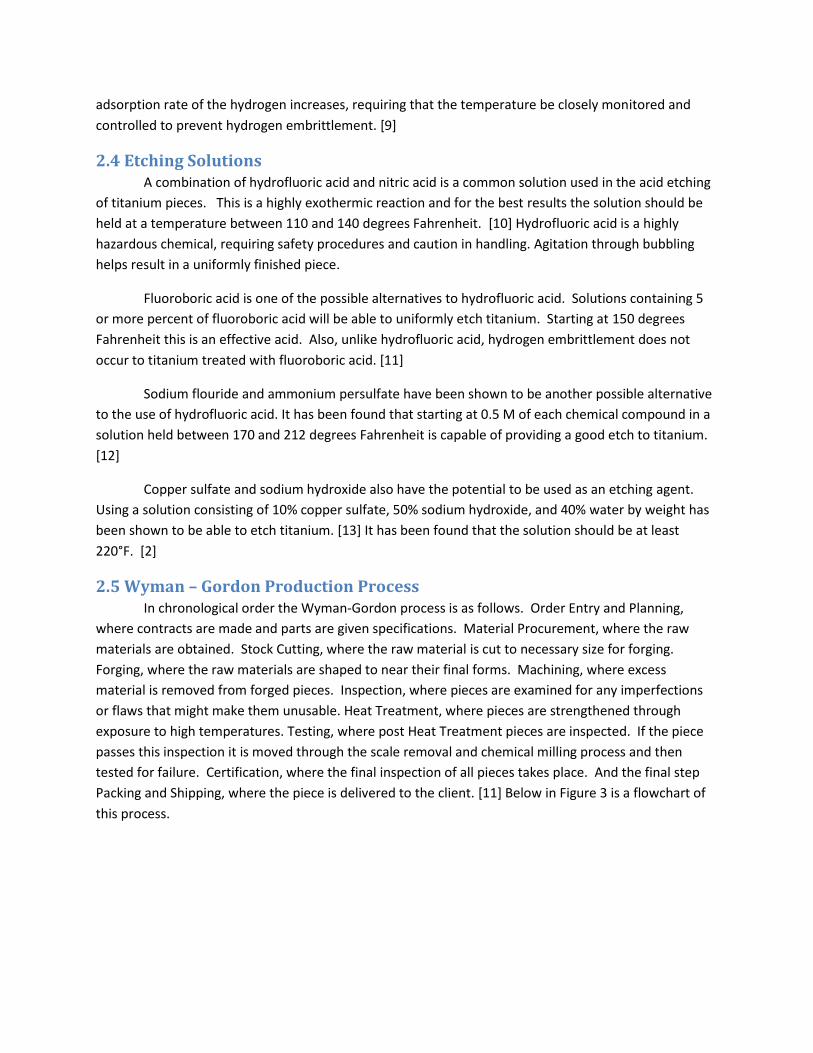
adsorption rate of the hydrogen increases, requiring that the temperature be closely monitored and
controlled to prevent hydrogen embrittlement. [9]
2.4 Etching Solutions A combination of hydrofluoric acid and nitric acid is a common solution used in the acid etching
of titanium pieces. This is a highly exothermic reaction and for the best results the solution should be
held at a temperature between 110 and 140 degrees Fahrenheit. [10] Hydrofluoric acid is a highly
hazardous chemical, requiring safety procedures and caution in handling. Agitation through bubbling
helps result in a uniformly finished piece.
Fluoroboric acid is one of the possible alternatives to hydrofluoric acid. Solutions containing 5
or more percent of fluoroboric acid will be able to uniformly etch titanium. Starting at 150 degrees
Fahrenheit this is an effective acid. Also, unlike hydrofluoric acid, hydrogen embrittlement does not
occur to titanium treated with fluoroboric acid. [11]
Sodium flouride and ammonium persulfate have been shown to be another possible alternative
to the use of hydrofluoric acid. It has been found that starting at 0.5 M of each chemical compound in a
solution held between 170 and 212 degrees Fahrenheit is capable of providing a good etch to titanium.
[12]
Copper sulfate and sodium hydroxide also have the potential to be used as an etching agent.
Using a solution consisting of 10% copper sulfate, 50% sodium hydroxide, and 40% water by weight has
been shown to be able to etch titanium. [13] It has been found that the solution should be at least
220°F. [2]
2.5 Wyman – Gordon Production Process In chronological order the Wyman-Gordon process is as follows. Order Entry and Planning,
where contracts are made and parts are given specifications. Material Procurement, where the raw
materials are obtained. Stock Cutting, where the raw material is cut to necessary size for forging.
Forging, where the raw materials are shaped to near their final forms. Machining, where excess
material is removed from forged pieces. Inspection, where pieces are examined for any imperfections
or flaws that might make them unusable. Heat Treatment, where pieces are strengthened through
exposure to high temperatures. Testing, where post Heat Treatment pieces are inspected. If the piece
passes this inspection it is moved through the scale removal and chemical milling process and then
tested for failure. Certification, where the final inspection of all pieces takes place. And the final step
Packing and Shipping, where the piece is delivered to the client. [11] Below in Figure 3 is a flowchart of
this process.

Figure 3: Flowchart of Wyman-Gordon Production Process
2.6 Wyman – Gordon Acid Bath Procedure In order to fully remove all the alpha case and insure the quality of each piece the following
procedure for the acid bath is used. Every part is placed in the bath for two minutes. If the part is clean
after this then tape is placed on the piece. Then the piece is placed in the acid bath for two to ten
minutes and then rinsed in a water tank. A feeler gage is used to determine if enough material has been
removed. If not enough material has been removed than the piece will be cooled to room temperature
and then re-entered into the acid bath. The characteristics of the acid bath can be found in Table 1
below.
Table 1: Wyman Gordon Acid Bath Characteristics
Chemical Composition Concentration by Component Temperature Range Maintained
HNO3 , HF , H2O HNO3 : 10%, HF : 8%, H2O : 82% 110 – 140 Degrees Fahrenheit
Chapter 3: Methodology
3.1 Scope of Project The goals of this project were to determine if there are alternative methods with which to
remove the alpha case.

3.2 Methodology For Etch Process Solutions The objectives of the experiments that were performed with the different etching solutions was
to determine the etch rate of the solutions under a set of conditions. Prior to testing the etching rates
for the new solutions a control group, the current hydrofluoric/nitric acid solution being used by Wyman
Gordon, was tested.
3.2.1 Equipment
1000 milliliter plastic graduated beaker
2000 milliliter glass graduated beaker
1000 milliliter glass graduated beaker
2 gallon plastic tray
Magnetic stirrer
Plastic tubing
Ti-6-4 test pieces
Hot plate with stirring capabilities
Stop watch
Hydrofluoric acid
Nitric acid
Acetone
Ammonium persulfate
Sodium Flouride
Fluoroboric acid
Thermometer
Vertical stand with clamps
3.2.2 Test Pieces
All test pieces were made of the same Ti-6-4 alloy material. The test pieces ranged in initial
mass from 645.5 grams to 687.0 grams with the average mass being 665.2 grams. The initial dimensions
of the test pieces were 3.8 inches by 1.7 inches by 1.5 inches. The difference in mass is the result of top
section of the test pieces where there was a rough area that had not been machined. The size of the
section varied from piece to piece. All the test pieces had a hole drilled through them on the bottom
half, and it was this section that was submerged in solution. By submerging the bottom half of the test
piece in 500mL in 2000mL beakers the solution was never raised to a level that covered the rough area
on the top section. This maintained consistency in the surface area that was exposed to solution for all
trials. Below in Figure 4 two sample test pieces can be seen. On the right is a test piece after the heat
treatment and on the left is a test piece after the grit blasting.

Figure 4: Two Sample Test Pieces at Different Stages (Sample on Right after Heat Treatment
and Sample on Left after Grit Blasting)
3.2.3 Acid Baths
The acid baths were modeled to simulate the Wyman Gordon K baths. The 2000 milliliter
beakers held the different etching solutions. Figure 1 shows the arrangement used for the HF/HNO3
trials. Figure 2 shows the arrangement used for the trials of the other two solutions.
Figure 5: Experimental Arrangement Used For HF/HNO3 Solution
3.2.4 Agitation
In order to simulate the agitation of the K baths a plastic tube were attached to the air supply
available in a laboratory hood and inserted into the 1000 milliliter beaker. Openings were punctured
into the tubing along the length that that was in solution. The end of the tubing was clamped and
outside of solution so as not to contaminate results. In the case of the ammonium persulfate and
sodium flouride solution no additional agitation was provided if the solution was boiling.
3.2.5 Temperature Control
Temperature control was achieved by placing the beakers into an ice bath as needed. In the
case of the HF/HNO3 solution an ice bath was needed in every trial. In the case of flouroboric acid the
solution was heated on a hot plate up to 65°C and then removed from the hot plate when the test piece
was added to the solution.
3.2.6 Procedures
The following procedure was used to prepare all the test pieces.
1. Six test pieces were placed on each heating rack, two test pieces per section. The side of each
test piece containing the hole was placed towards the center.
2. Test pieces were placed in a furnace heated to 1750 degrees Fahrenheit for an hour and half.
3. After removing the test pieces from the furnace, they were placed into a dunking bucket which
was submerged into water for approximately 20 minutes.
4. Each test piece was thoroughly blasted with a hand operated grit blaster. All visible scale was
removed.
5. Each test piece was rinsed to remove any remaining grit or loose titanium.
The following basic procedure was used for each of the 20 trials run of the HF/HNO3 solution.
1. Prepared a solution consisting of 163 mL of 49% HF and 144 mL of 70% HNO3 in a 1000mL
beaker. Filled beaker to 1000 mL with water.
2. Stirred solution to insure it is well mixed.
3. Prepared ice bath. Filled plastic bin to approximately three inches with ice water. Made sure
that the level of ice water in the bin was higher than the 500mL mark on a 2000mL beaker.
4. Measured and recorded the weight of Ti test piece.
5. Placed 500 mL of the prepared HF/HNO3 solution in a 2000mL beaker. Placed beaker in ice
bath. Attached plastic tube with holes in solution, turned on air to provide agitation, and
immediately placed Ti test piece into the solution. Recorded the time.
6. After three minutes in solution, removed the test piece with tongs. Fully rinsed the test piece in
a 2000mL beaker of water - 10 seconds of dunking the piece in and out of water.
7. Measured and recorded the weight of Ti test piece. Used tongs to return the test piece to the
solution in the 2000mL beaker. Recorded the time.

8. After three minutes in solution, removed the test piece with tongs. Again fully rinsed the piece
and measured and recorded the weight.
The following procedure was used for each of the 40 fluoroboric acid solution trials. Half of these
trials used a 5% solution and the other half used an 8% solution.
1. For the 5% solution, 50mL of 50% fluoroboric acid and 450mL of water placed in a 2000mL
beaker. For the 8% solution, 80mL of 50% fluoroboric acid and 420mL of water
2. Measured and recorded the weight of Ti test piece.
3. Heated solution to 65°C on a hot plate.
4. Removed beaker from hot plate, immediately placed Ti test piece into solution. Recorded time.
5. After three minutes in solution, removed the test piece with tongs. Fully rinsed the test piece in
a 2000mL beaker of water - 10 seconds of dunking the piece in and out of water.
6. Measured and recorded the weight of Ti test piece. Used tongs to return the test piece to the
solution in the 2000mL beaker. Recorded the time.
7. After three minutes in solution, removed the test piece with tongs. Measure and record the
temperature of the solution. Again fully rinsed the piece and measured and recorded the
weight.
The following procedure was used for each of the 34 sodium fluoride and ammonium persulfate
solution trials. Half of these trials used a solution of 0.5M of each compound and the other half used a
solution of 1M of each compound. Due to the limitations of ammonium persulfate available, it is was
only possible to perform 17 trials of each concentration instead of the 20 trials of each concentration
initially planned.
1. For the 0.5M solution, 21.0 grams of sodium fluoride, 114.1 grams of ammonium persulfate, and
1000mL of water placed in a 2000mL beaker. For the 1M solution, 42.0 grams of sodium
fluoride, 228.2 grams of ammonium persulfate, and 1000mL of water were placed in a 2000mL
beaker.
2. Measured and recorded the weight of Ti test piece.
3. Thoroughly mixed the solution, insuring that the both compounds had fully dissolved.
4. With 500mL of solution in a 2000mL beaker, the solution was placed on a hot plate and brought
to a boil, approximately 95°C.
5. Placed Ti test piece into solution. Record time.
6. After three minutes in solution, removed the test piece with tongs. Fully rinsed the test piece in
sink, using running water for about 10 seconds.
7. Measured and recorded the weight of Ti test piece. Used tongs to return the test piece to the
solution in the 2000mL beaker. Recorded the time.
8. After three minutes in solution, removed the test piece with tongs. Again fully rinsed the piece
and measured and recorded the weight.

3.2.7 Safety
At all times safety was a prime concern. Within the Wyman-Gordon facility it was necessary to
follow all safety procedures, including the use of protective headgear, goggles, and earplugs. At any
point where acids are going to be used, extreme caution as well as protective gloves and goggles were
used. Also heat resistant gloves were used as needed.
Chapter 4: Results and Discussion
4.1 Hydrofluoric and Nitric Acid Solution
Below are the results from the experimental control group, the hydrofluoric and nitric acid
solution. The first three trials of this experimental group were discarded because the solutions had not
been thoroughly mixed prior to the insertion of the titanium test piece. Upon noticing the inconsistent
results, the methodology was adjusted. The results seen below represent the data collected using this
adjusted methodology, which was presented previously in this report.
Figure 6: Mass of Titanium Etched in First 3 Minute Period With HF/HNO3 Solution
0
1
2
3
4
5
6
1 2 3 4 5 6 7 8 9 10 11 12 13 14 15 16 17
Mas
s Et
che
d (
gram
s)
Trial Number
Mass of Titanium Etched During First Period

Figure 7: Mass of Titanium Etched in Second 3 Minute Period With HF/HNO3 Solution
During the second three minute period the etch rate was significantly higher. This difference in
etch rate was due to the difference in solution temperature. Despite the fact that the reactions took
place in a beaker sitting in an ice bath, due to the exothermic nature of the reaction between
hydrofluoric acid and titanium over the course of each trial the solution increased in temperature. Also
prior to first period the test piece was at room temperature while prior to the second period the test
piece had increased in temperature.
Figure 8:Total Mass of Titanium Etched With HF/HNO3 Solution
5
10
15
20
25
1 2 3 4 5 6 7 8 9 10 11 12 13 14 15 16 17
Mas
s Et
che
d (
gram
s)
Trial Number
Mass of Titanium Etched During Second Period
0
5
10
15
20
25
1 2 3 4 5 6 7 8 9 10 11 12 13 14 15 16 17
Mas
s Et
che
d (
gram
s)
Trial Number
Mass of Titanium Etched Total
The average mass of titanium etched total was found to be 17.5 grams. In the first period an
average of 3.7 grams was etched and in the second period an average of 14.8 grams was etched. The
error associated with these data points is ±0.2 grams. This measure of error accounts for inaccuracy of
the mass balance and experimental error.
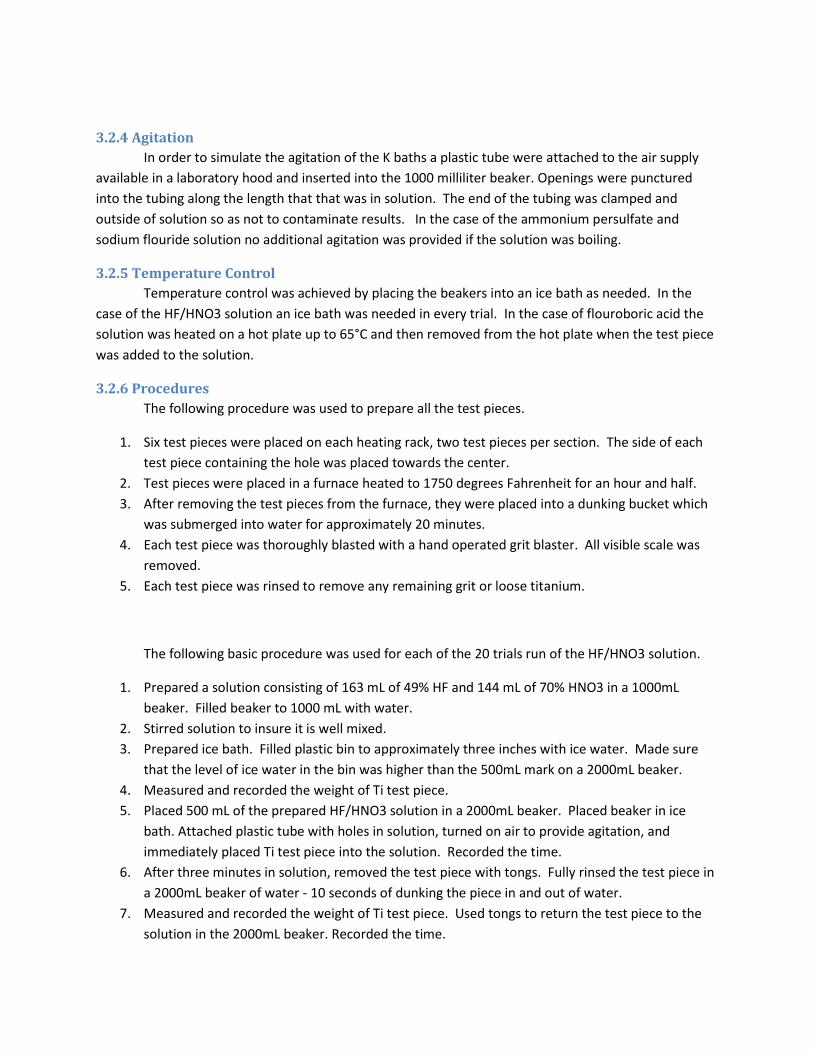
Below in Figure 9 a picture of a sample test piece (trial #4) that was etched using the
hydrofluoric/nitric acid solution can be seen. The etched areas on the test piece had a smooth, regular,
bright finish with no remaining residue visible anywhere.
Figure 9: Test Piece After Hydrofluoric/Nitric Acid Etch
It was observed that following the etching periods the remaining solution was dark green in
color.
4.2 Fluoroboric Acid The following section will display the results for the two different concentrations of fluoroboric
acid that were tested. Below in Figure 10 is a picture of a sample test piece (trial #11 for the 5%
solution) that was etched using the fluoroboric acid. The fluoroboric acid left a rough finish and on the
portion of the test piece that was not submerged in solution a dark residue can be seen.

Figure 10: Test Piece After Fluoroboric Acid Etch
Following the etching periods, for both the 5% and the 8% solutions, the remaining solution was
a light green/blue.
4.2.1 Fluoroboric Acid, 5% solution
Below can be seen the results from the trials of the 5% solution of fluoroboric acid. As in the
trials of the HF/HNO3 solution, over the course of each trial the solution increased in temperature. The
result of this increase in temperature can be seen in the slightly higher etch rates observed in the
second period of etching.
0
0.5
1
1.5
2
1 2 3 4 5 6 7 8 9 10 11 12 13 14 15 16 17 18 19 20
Mas
s Et
che
d (
gram
s)
Trial Number
Mass of Titanium Etched During First Period

Figure 11: Mass of Titanium Etched During First Period With 5% Fluoroboric Acid Solution
Figure 12: Mass of Titanium Etched During Second Period With 5% Fluoroboric Acid Solution
The average total mass of titanium etched was found to be 2.3 grams. In the first period the
average mass etched was 0.9 grams while in the second period 1.4 grams was the average mass etched.
As was used for the control group, the error associated with these data points is ±0.2 grams.
Figure 13: Total Mass of Titanium Etched With 5% Fluoroboric Acid Solution
0
1
2
3
4
1 2 3 4 5 6 7 8 9 10 11 12 13 14 15 16 17 18 19 20
Mas
s Et
che
d (
gram
s)
Trial Number
Mass of Titanium Etched During Second Period
00.5
11.5
22.5
33.5
44.5
5
1 2 3 4 5 6 7 8 9 10 11 12 13 14 15 16 17 18 19 20
Mas
s Et
che
d (
gram
s)
Trial Number
Mass of Titanium Etched Total

Although each trial started with the solution at the same temperature the temperature of the
solution at the end of each trial varied and was recorded. This difference in temperature is the result of
experimental error, slight difference in test pieces, and imprecision of the hot plates used. In Figure 14
it can be seen that as the final solution temperature increased the total mass etched increased.
Figure 14: Ending Solution Temperature versus Total Mass Etched for 5% Fluoroboric Solution
4.2.2 Fluoroboric Acid, 8% solution
Below can be seen the results from the trials of the 8% solution of fluoroboric acid. As in the
trials of the 5% fluoroboric solution, over the course of each trial the solution increased in temperature.
Again this effect of this increase in temperature can be seen in the slightly higher etch rates observed in
the second period of etching.
0
1
2
3
4
5
65 70 75 80 85 90 95 100
Mas
s Et
che
d (
gram
s)
Temperature (°C)
Ending Solution Temperature vs. Total Mass Etched, 5%
0
0.5
1
1.5
2
1 2 3 4 5 6 7 8 9 10 11 12 13 14 15 16 17 18 19 20
Mas
s Et
che
d (
gram
s)
Trial Number
Mass of Titanium Etched During First Period

Figure 15: Mass of Titanium Etched During First Period With 8% Fluoroboric Acid Solution
Figure 16: Mass of Titanium Etched During Second Period With 8% Fluoroboric Acid Solution
The average total mass of titanium etched was found to be 2.8 grams. In the first period the
average mass etched was 1.2 grams while in the second period 1.6 grams was the average mass etched.
As expected the average etch rates for the 8% solution were found to be higher than those for the 5%
solution. As was used for the control group, the error associated with these data points is ±0.2 grams.
0
1
2
3
4
1 2 3 4 5 6 7 8 9 10 11 12 13 14 15 16 17 18 19 20
Mas
s Et
che
d (
gram
s)
Trial Number
Mass of Titanium Etched During Second Period
0
1
2
3
4
5
6
1 2 3 4 5 6 7 8 9 10 11 12 13 14 15 16 17 18 19 20
Mas
s Et
che
d (
gram
s)
Trial Number
Mass of Titanium Etched Total

Figure 17: Total Mass of Titanium Etched With 8% Fluoroboric Acid Solution
The final solution temperatures were again recorded for all of the trials of the 8% fluoroboric
acid solution. When plotted against the total mass etched the trend that an increased temperature
results in an increased amounted etched can be noticed.
Figure 18: Ending Solution Temperature versus Total Mass Etched for 8% Fluoroboric Solution
4.3 Sodium Fluoride and Ammonium Persulfate The following section will display the results for the two different concentrations of sodium
fluoride and ammonium persulfate that were tested. Below in Figure 19 is a picture of a sample test
piece (trial #6 for the 0.5M solution) that was etched using the sodium fluoride and ammonium
persulfate solution. This solution left a rough finish and some areas that had been submerged were
noticeably less etched. Also although no residue is visible, a much more thorough rinsing (use of flowing
water) was required to remove remaining residue.
Figure 19: Test Piece After Sodium Fluoride and Ammonium Persulfate Etch
0123456
65 70 75 80 85 90 95 100Mas
s Et
che
d (
gram
s)
Temperature (°C)
Ending Solution Temperature vs. Total Mass Etched, 8%

Following the etching periods the solution, for both concentrations, was a very faint
green/yellow.
4.3.1 Sodium Fluoride and Ammonium Persulfate, 0.5M Solution
Below can the results from the trials of the 0.5M solution of sodium fluoride and ammonium
persulfate can been seen. Although 17 trials of the 0.5M solution were planned, the first three trials
were spent trying to find an appropriate temperature at which to run the experiment. An initial solution
temperature of 75°C, 80°C, and 85°C were all attempted. Each of these trials resulted in no mass etched
and were removed from the data set seen below. As explained in the methodology, an initial solution
temperature of about 95°C, when the solution started to boil, was used for all of the data seen below.
In the trials where the 0.2 grams or less was etched in the first period, the area of the test piece that had
been in contact with the solution had developed a dark residue on the surface. This residue was not
removed with rinsing, but was not noticed on any of the test pieces after the full etch time.
Figure 20: Mass of Titanium Etched During First Period With 0.5M Solution of Sodium Fluoride
and Ammonium Persulfate
0
0.2
0.4
0.6
0.8
1
1.2
1.4
1 2 3 4 5 6 7 8 9 10 11 12 13 14
Mas
s Et
che
d (
gram
s)
Trial Number
Mass of Titanium Etched During First Period

Figure 21: Mass of Titanium Etched During Second Period With 0.5M Solution of Sodium
Fluoride and Ammonium Persulfate
The average total mass of titanium etched was found to be 0.8 grams. In the first period the
average mass etched was 0.4 grams while in the second period 0.4 grams was the average mass etched.
As was used for the control group, the error associated with these data points is ±0.2 grams.
Figure 22: Total Mass of Titanium Etched With 0.5M Solution of Sodium Fluoride and
Ammonium Persulfate
0
0.2
0.4
0.6
0.8
1
1.2
1 2 3 4 5 6 7 8 9 10 11 12 13 14
Mas
s Et
che
d (
gram
s)
Trial Number
Mass of Titanium Etched During Second Period
0
0.5
1
1.5
2
2.5
1 2 3 4 5 6 7 8 9 10 11 12 13 14
Mas
s Et
che
d (
gram
s)
Trial Number
Mass of Titanium Etched Total
4.3.2 Sodium Fluoride and Ammonium Persulfate, 1M Solution
Below the results from the trials of the 1M solution can be seen. As was the case for some of
the 0.5M solution trials, after the first etching period a dark residue that was not removed with rinsing
developed. This residue was present for every 1M solution trial but after the second etching period it
was no longer visible.
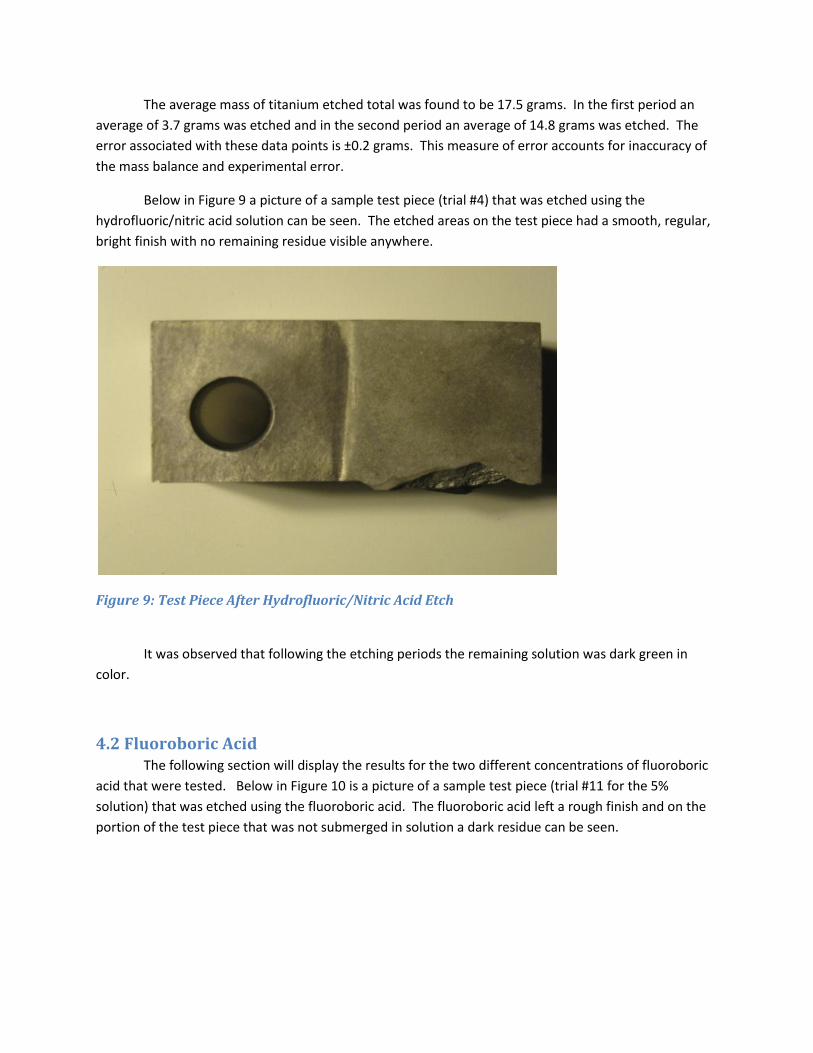
Figure 23: Mass of Titanium Etched During First Period With 1M Solution of Sodium Fluoride
and Ammonium Persulfate
0
0.1
0.2
0.3
0.4
1 2 3 4 5 6 7 8 9 10 11 12 13 14 15 16 17
Mas
s Et
che
d (
gram
s)
Trial Number
Mass of Titanium Etched During First Period
0
0.5
1
1.5
2
2.5
1 2 3 4 5 6 7 8 9 10 11 12 13 14 15 16 17
Mas
s Et
che
d (
gram
s)
Trial Number
Mass of Titanium Etched During Second Period

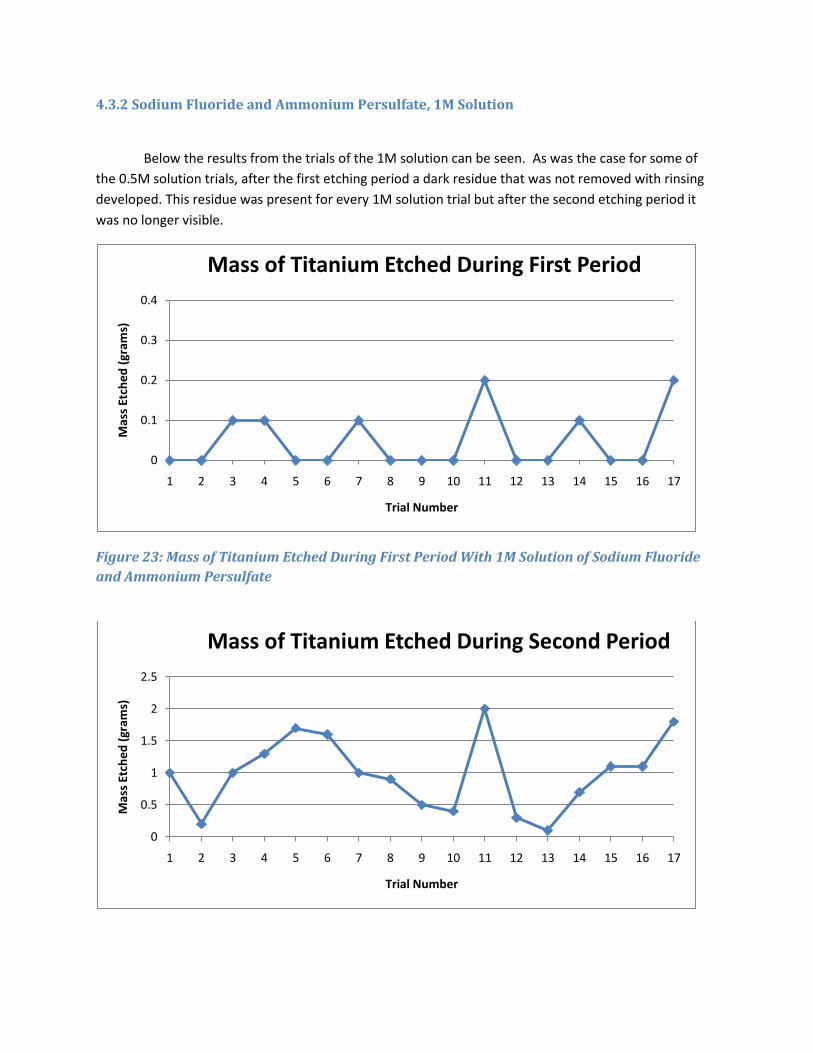
Figure 24: Mass of Titanium Etched During Second Period With 1M Solution of Sodium
Fluoride and Ammonium Persulfate
The average total mass of titanium etched was found to be 1.0 gram. In the first period the
average mass etched was 0.0 grams while in the second period 1.0 gram was the average mass etched.
Although on average less mass was etched in the first period compared to the 0.5M solution, the
average total mass etched was higher for the 1M solution. As was used for the control group, the error
associated with these data points is ±0.2 grams.
Figure 25: Total Mass of Titanium Etched With 1M Solution of Sodium Fluoride and Ammonium
Persulfate
4.4 Analysis of Results As was stated above, there is some error associated with the data collected in this report.
Sources of error include: experimental/human error, inconsistencies generated from hot plates and
mass balances, losses to evaporation, and variations in test pieces.
In comparing the three solutions that were tested experimentally there are a number of factors
to be considered. The following sections will focus on the different factors in relation to the three
solutions tested.
4.4.1 Comparison of Mass Etched
The direct result of the experiments performed was determining the mass etched of the
different solutions over two 3 minute periods. As can be seen below in Figures 26-28 the
hydrofluoric/nitric acid solution was by far the most effective. On average the mass etched of the
0
0.5
1
1.5
2
2.5
3
1 2 3 4 5 6 7 8 9 10 11 12 13 14 15 16 17
Mas
s Et
che
d (
gram
s)
Trial Number
Mass of Titanium Etched Total

hydrofluoric/nitric acid solution was about 6 times more than the fluoroboric acid solutions and about
17 times more than the sodium fluoride and ammonium persulfate solutions.
Figure 26: Comparison of Mass of Titanium Etched in First Period
Figure 27: Comparison of Mass of Titanium Etched in Second Period
0
0.5
1
1.5
2
2.5
3
3.5
4
Mass Etched in First 3 Minutes
Mas
s Et
che
d (
gram
s)
Comparison of Mass Etched in First 3 Minutes
Hydrofluoric/Nitric Acid
Fluoroboric Acid (5%)
Fluoroboric Acid (8%)
Sodium Fluoride/Ammonium Persulfate (.5M)
Sodium Fluoride/Ammonium Persulfate (1M)
0
2
4
6
8
10
12
14
16
Mass Etched in Second 3 Minutes
Mas
s Et
che
d (
gram
s)
Comparison of Mass Etched in Second 3 Minutes
Hydrofluoric/Nitric Acid
Fluoroboric Acid (5%)
Fluoroboric Acid (8%)
Sodium Fluoride/Ammonium Persulfate (.5M)
Sodium Fluoride/Ammonium Persulfate (1M)

Figure 28: Comparison of Total Mass of Titanium Etched
Although the etch rate of the hydrofluoric/nitric acid solution was significantly higher than the
other solutions this is not the only factor to consider. The final color of the different solutions following
the etching periods (hydrofluoric/nitric : dark green, fluoroboric : light green/blue, and sodium
fluoride/ammonium persulfate : faint yellow/green) was different and suggests that the etching capacity
of the fluoroboric acid and sodium fluoride/ammonium persulfate solution was not reached in the time
allowed in this experiment. It is suggested that further research into the etching capacity be done. If
another solution is found to be able to etch a larger mass of titanium before a significant decrease in
etch rate is observed this could be a cause for changing the current Wyman Gordon standard solution.
4.4.2 Economic Comparison
Another factor to consider is the cost of the chemicals involved in the etching process. Costs for
all the chemicals used in experimentation were gathered from Alfa Aesar and Brand Nu Labs. Between
the two companies the lowest cost per unit was used for each chemical. The cost of the chemicals for a
6000 gallon bath was then calculated. The results can be seen in Table 2. It is worth noting that the
purchase of these chemicals in the quantities needed for a large scale bath may alter their relative costs.
0
2
4
6
8
10
12
14
16
18
20
Total Mass Etched
Mas
s Et
che
d (
gram
s)Comparison of Total Mass Etched
Hydrofluoric/Nitric Acid
Fluoroboric Acid (5%)
Fluoroboric Acid (8%)
Sodium Fluoride/Ammonium Persulfate (.5M)
Sodium Fluoride/Ammonium Persulfate (1M)

Table 2: Cost For 6000 Gallon Bath[16] [17]
Solution Price
Hydrofluoric/Nitric Acid $63,500
Fluoroboric Acid (5%) $21,100
Fluoroboric Acid (8%) $33,800
Sodium Fluoride/Ammonium Persulfate (.5M) $133,000
Sodium Fluoride/Ammonium Persulfate (1M) $267,000
As can be seen a 6000 gallon bath of fluoroboric acid is projected to be almost half the cost of a
hydrofluoric/nitric acid bath. The sodium fluoride/ammonium persulfate solution bath was projected to
be significantly more expensive than either of the alternatives. Investigation into large scale costs, in
particular those of fluoroboric acid should be considered.
Chapter 5: Conclusions and Recommendations
From the results of this project a number of conclusions can be drawn. Below is a list
summarizing the findings as presented in the previous chapter.
Hydrofluoric acid was found to be the most effective at etching titanium. On average it etched 14.7
grams more than the 8% fluoroboric acid solution and 16.5 grams more than the 1M sodium
fluoride and ammonium persulfate solution.
For all solutions the temperature of the etching bath had a strong effect on the mass etched.
For nearly all solutions the mass etched in the second period, after a rinse of the test piece, was
more than the mass etched in the first period.
The costs of preparing a 6000 gallon bath were calculated. Fluoroboric acid was found to be the
least expensive and the sodium fluoride and ammonium persulfate solution was found to be the
most expensive.
The following list represents the different areas of research that would be most beneficial for
Wyman Gordon to pursue in future projects. Both previous research and the results of this project were
considered in the formation of this list. It is recommended that future research be conducted in the
following areas:
Determination of an ideal solution temperature for etching. This should be researched for any
considered etching solution, but determination of this temperature for hydrofluoric acid would
immediately benefit the current process.
Investigation into more precise temperature control measures.
The use of fluoroboric acid as an etching solution. The following subcategories should be
researched to determine if fluoroboric acid would be a suitable replacement to hydrofluoric acid.
The effect of fluoroboric acid concentration of etch rate.
The mass of titanium that can be etched per unit volume of fluoroboric acid.
The effect of titanium concentration in solution on fluoroboric acid etch rate.
The economic effect a change to fluoroboric acid would have, including any change in procedure
and equipment that would be necessary.
The effect of the temperature of any titanium piece that is being etched on etch rate.
The effect of agitation on etch rate.
An examination of the significance of different alloys on the amount of alpha case formed and on
the etching process.
Given both the high cost and the comparatively very low etch rate it is not suggested that the
sodium fluoride / ammonium persulfate solution be explored any further as a possible replacement to a
hydrofluoric/nitric acid solution.

Chapter 6: Bibliography
[1] Birks, N., Meier, G.H., Introduction to High Temperature Oxidation of Metals, British Library
Cataloguing in Publication Data 1993
[2] Reidenbach, Faith, Metals Handbook, 9th Edition, Volume 5, A.S. Metals, Metals Park, 1981.
[3] Bloyce, A., Morton, P.H., Bell, T., Surface Engineering of Titanium and Titanium Alloys, ASM
Handbook v.5, ASM International: Materials Park, OH, 1994.
[4] Easterling, K.E., Porter, D.A., Phase Transformations In Metals And Alloys, Van Nostrand Reinhold
(UK) Co. Ltd.: Great Britian, 1981.
[5] Vander Voort, George, Applied Metallography, Van Nostrand Reinhold: New York, NY, 1980.
[6] Davis, Mackenzie L., Cornwell, David A., Introduction to Environmental Engineering, Second Edition,
McGraw-Hill Book Company, New York, 1991.
[7] Green, Don W. Editor., Perry’s Chemical Engineers’ Handbook Sixth Edition, McGraw-Hill Book
Company, New York, 1984.
[8] Harris, William T., Chemical Milling, Clarendon Press, Oxford, 1976.
[9] Kofstad, P., Anderson, P.B., Oxidation of Titanium on the Temperature Range 800° - 1200°C, Journal
of the Less Common Materials, Vol. 3 1961, p.89.
[10] Burnham, Nicolle, Danheim, Florian. Pollution Prevention At The Wyman-Gordon Company.
Worcester MA: Worcester Polytechnic Institute, 1994.
[11] Knox, D., Senft-Grupp, H., Chemical Milling, Increasing Efficiency at Wyman Gordon Company.
Worcester, MA: Worcester Polytechnic Institute, 2009.
[12] Alvin, T.B. 1955. Non-Hazardous Etching Solutions. US Patent 541,858. Filled Oct. 20, 1955.
[13] Harting, P., Lewis, K., Walters, G., An Analysis of Etch Tanks At Wyman Gordon Company.
Worcester, MA: Worcester Polytechnic Institute, 1998.
[14]Bhadeshia, H.K.D.H., Metallurgy of Titanium and it’s Alloy. University of Cambridge Webpage. April
2010 http://www.msm.cam.ac.uk/phasetrans/2003/titanium.movies/titanium.html
[15] Cayer, J., Ledell, J., Russo, J., Shahbazi, R., Alpha Case Formation and Forge Lubricant Analysis.
Worcester, MA: Worcester Polytechnic Institute, 1997.
[16] Alfa Aesar. Price Listing. Website. April 2010. http://www.alfa.com/en/gh100w.pgm
[17] Brand Nu Labs. Price Listing. Website. April 2010 http://www.brandnu.com/

Chapter 7: Appendix
7.1 Hydrofluoric/Nitric Acid Solution
Initial After 3 min
After 6 min
Mass Etched in first 3 min Mass Etched in second 3 min
Total Mass Etched
659.8 656.1 650.4
3.7 5.7 9.4
671.4 658.8 643.1
12.6 15.7 28.3
661.7 660.6 657.4
1.1 3.2 4.3
666.4 663.5 647.8
2.9 15.7 18.6
671.3 668.9 656.7
2.4 12.2 14.6
687 684.4 671.9
2.6 12.5 15.1
670.2 666.8 650.1
3.4 16.7 20.1
660.2 657.8 648.8
2.4 9 11.4
658.2 653.6 636.1
4.6 17.5 22.1
660.9 658.3 642.8
2.6 15.5 18.1
670.3 666.3 654.7
4 11.6 15.6
662.1 659.3 643.3
2.8 16 18.8
666.8 661.8 643.7
5 18.1 23.1
653.2 650.4 638.6
2.8 11.8 14.6
662.8 659.9 646
2.9 13.9 16.8
667.3 663.8 648
3.5 15.8 19.3
648 644.2 625
3.8 19.2 23
662.6 659.5 645.8
3.1 13.7 16.8
664 660.3 642.9
3.7 17.4 21.1
665.4 662 646.2
3.4 15.8 19.2
Average Change 3.665 14.84705882 17.515
7.2 Fluoroboric Acid 5% Solution

Initial After 3 min
After 6 min
Ending Temp (°C)
Mass Etched in first 3 min Mass Etched in second 3 min
Total Mass Etched
668.2 666.9 665.7 77 1.3 1.2 2.5
677 675.2 672.5 85 1.8 2.7 4.5
665.5 665.2 663.7 75 0.3 1.5 1.8
675 674 671.9 80 1 2.1 3.1
670.2 669.5 668.3 71 0.7 1.2 1.9
682.8 681.3 678.8 90 1.5 2.5 4
666.9 666.4 665.2 68 0.5 1.2 1.7
673.8 672.8 671.1 77 1 1.7 2.7
654.7 654.1 653.3 70 0.6 0.8 1.4
670.6 669.9 668.9 71 0.7 1 1.7
680.9 680 678.3 81 0.9 1.7 2.6
676.6 675.5 674.2 79 1.1 1.3 2.4
662 661.2 659.9 73 0.8 1.3 2.1
676.9 676.3 675 76 0.6 1.3 1.9
669.3 668.4 667.4 75 0.9 1 1.9
661.7 661.3 659.9 72 0.4 1.4 1.8
662.4 661.6 660.5 71 0.8 1.1 1.9
656.5 655.4 654.2 76 1.1 1.2 2.3
668.2 667.5 666.4 69 0.7 1.1 1.8
661.7 660.9 659.8 73 0.8 1.1 1.9
Average Change 0.875 1.42 2.295
7.2 Fluoroboric Acid 8% Solution
Initial After 3 min
After 6 min
Ending Temp (°C)
Mass Etched in first 3 min Mass Etched in second 3 min
Total Mass Etched
669.6 667.9 665.7 80 1.7 2.2 3.9
662.5 661.3 659.6 74 1.2 1.7 2.9
661.9 661 659.9 73 0.9 1.1 2

691.2 689.5 686.3 89 1.7 3.2 4.9
676.5 675.2 673.7 74 1.3 1.5 2.8
655.9 654.3 652.9 73 1.6 1.4 3
656.1 655.1 653.9 68 1 1.2 2.2
668.2 667.1 665.5 70 1.1 1.6 2.7
663.8 662.9 661.4 72 0.9 1.5 2.4
670.2 668.8 666.4 79 1.4 2.4 3.8
650.8 649.6 648.2 73 1.2 1.4 2.6
666.8 665.7 664.6 67 1.1 1.1 2.2
676.8 675.7 674.6 67 1.1 1.1 2.2
673.7 672.6 671.4 67 1.1 1.2 2.3
665.4 664.4 663.4 74 1 1 2
666.9 665.4 663.1 83 1.5 2.3 3.8
665.1 664.2 662.9 78 0.9 1.3 2.2
663.4 662.5 660.9 74 0.9 1.6 2.5
658.8 657.6 656 78 1.2 1.6 2.8
662.8 661.5 659.9 77 1.3 1.6 2.9
Average Change 1.205 1.6 2.805
7.4 Sodium Fluoride and Ammonium Persulfate 0.5M Solution
Initial After 3 min
After 6 min
Ending Temp (°C)
Mass Etched in first 3 min Mass Etched in second 3 min
Total Mass Etched
659.7 659.7 659.4
0 0.3 0.3
665.3 664.3 663.6
1 0.7 1.7
670.7 669.8 669.1
0.9 0.7 1.6
676.3 675.5 674.8
0.8 0.7 1.5
673.5 673.4 672.9
0.1 0.5 0.6
658.8 657.8 657.3
1 0.5 1.5

669.9 669.8 669.5
0.1 0.3 0.4
662 661.3 660.8
0.7 0.5 1.2
645.4 644.9 644.6
0.5 0.3 0.8
660.5 659.7 659
0.8 0.7 1.5
665.6 665.6 665.3
0 0.3 0.3
662.8 662.8 662.3
0 0.5 0.5
670.9 670.8 670.8
0.1 0 0.1
668.7 668.7 668.6
0 0.1 0.1
Average Change 0.428571429 0.435714286 0.864285714
7.5 Sodium Fluoride and Ammonium Persulfate 1M Solution
Initial After 3 min
After 6 min
Ending Temp (°C)
Mass Etched in first 3 min Mass Etched in second 3 min
Total Mass Etched
663.6 663.6 662.6
0 1 1
670.5 670.5 670.3
0 0.2 0.2
659.6 659.5 658.5
0.1 1 1.1
657.5 657.4 656.1
0.1 1.3 1.4
656.6 656.6 654.9
0 1.7 1.7
639.9 639.9 638.3
0 1.6 1.6
651.7 651.6 650.6
0.1 1 1.1
655.6 655.6 654.7
0 0.9 0.9
677.8 677.8 677.3
0 0.5 0.5
666.9 666.9 666.5
0 0.4 0.4
665.7 665.5 663.5
0.2 2 2.2
666.5 666.5 666.2
0 0.3 0.3
658.3 658.3 658.2
0 0.1 0.1
668.7 668.6 667.9
0.1 0.7 0.8
674.8 674.8 673.7
0 1.1 1.1

654 654 652.9
0 1.1 1.1
634.9 634.7 632.9
0.2 1.8 2
Average Change 0.047058824 0.982352941 1.029411765