
Alternatives No More W - iiesi.orgiiesi.org/assets/pdfs/ieee-power-energy-mag-2015.pdf · Wind and...
10
78 IEEE power & energy magazine november/december 2015 Digital Object Identifier 10.1109/MPE.2015.2462311 Date of publication: 20 October 2015 W WIND AND SOLAR PHOTOVOLTAIC (PV) GENERA- tion, no longer alternative energy sources, have grown rapidly in the United States and worldwide during the last decade. This rapid growth is due to significantly improved technol- ogy (power electronics, controls, and physical attributes such as tower heights and blades), plummeting costs, and vast advancements in understanding how to plan and operate reli- able regional power systems that have high penetrations of variable renewable resources. Wind and PVs have become mainstays of a clean, reliable, affordable electric grid. The capital costs for installed wind and PV power plants have dropped dramatically in recent years; independent sources report wind energy as a least-cost energy resource and at least one state has selected PVs as a least-cost capac- ity resource. At the same time, this fuel input is cost free, Alternatives No More By Michael Milligan, Bethany Frew, Brendan Kirby, Matt Schuerger, Kara Clark, Debbie Lew, Paul Denholm, Bob Zavadil, Mark O’Malley, and Bruce Tsuchida 1540-7977/15©2015IEEE
Transcript of Alternatives No More W - iiesi.orgiiesi.org/assets/pdfs/ieee-power-energy-mag-2015.pdf · Wind and...

78 ieee power & energy magazine november/december 2015
Digital Object Identifier 10.1109/MPE.2015.2462311
Date of publication: 20 October 2015
WWind and solar photovoltaic (pv) genera-tion, no longer alternative energy sources, have grown rapidly in the United states and worldwide during the last decade. this rapid growth is due to significantly improved technol-ogy (power electronics, controls, and physical attributes such as tower heights and blades), plummeting costs, and vast advancements in understanding how to plan and operate reli-able regional power systems that have high penetrations of variable renewable resources. Wind and pvs have become mainstays of a clean, reliable, affordable electric grid.
the capital costs for installed wind and pv power plants have dropped dramatically in recent years; independent sources report wind energy as a least-cost energy resource and at least one state has selected pvs as a least-cost capac-ity resource. at the same time, this fuel input is cost free,
Alternatives No More
By Michael Milligan, Bethany Frew, Brendan Kirby, Matt Schuerger, Kara Clark, Debbie Lew, Paul Denholm, Bob Zavadil, Mark O’Malley, and Bruce Tsuchida
1540-7977/15©2015IEEE
november/december 2015 ieee power & energy magazine 79
Wind and Solar Power Are Mainstays of a Clean, Reliable, Affordable Grid
and energy from these generation sources has nearly zero marginal cost.
Wind and pv generation, known as variable generation (vg), are primarily energy sources because the “fuel” input to these systems cannot be controlled. vg resources, how-ever, can contribute a fraction of their nameplate capacity toward planning reserves, and their connection to the power system through inverter-based power electronics allows for a fast, accurate control of their output.
the capabilities of wind and pv generation have evolved significantly during the past decade, and these resources can contribute to the economics and reliability of the power system. as the penetration of vg increases relative to the amount of conventional generation and peak demand, there is potential for these operational capabilities to grow in value and provide the types of services traditionally delivered by conventional synchronous machines.
the range of services is divided into two main categories. the first, system balance, concerns the operation of the power system under normal conditions, when constantly changing electric demand, potentially augmented by vg output vari-ability, must be compensated by adjustments in net resource output. relevant topics include balancing net load (load minus vg generation), regulation, and economic dispatch. although maintaining this balance often involves reliabil-ity-related aspects, such as maintaining the interconnection
frequency within prescribed limits, the primary concern is the economic operation of the power system.
the second category includes services that are critical to maintaining the operational security of the bulk power sys-tem during and after major disturbances. in this category, the economics of power system operation take a backseat to reli-ability. relevant issues include frequency response, system inertia, and frequency and voltage ride-through capabilities.
vg was initially thought to increase the power system operator’s challenges in both of these categories. techno-logical advancements are now providing some power system operators with additional tools to maximize the delivery of renewable energy while reducing system operations cost and enhancing system reliability and stability, in some ways even better than conventional generators. (see “Wind generation’s evolving dynamic response capability.”) numerous studies, new advanced analysis tools, and the growing level of experi-ence with vg on the power system are all showing that wind and pvs are no longer constrained by many physical limita-tions. this article addresses frequently cited misperceptions of wind and solar power by focusing on the capabilities that modern wind turbines and pv systems can provide to both the balance and security of the bulk power system. as such, it provides an update to a 2009 article in this magazine, “Wind power Myths debunked,” by describing the recent develop-ment of advanced features of wind and pv power generation
do
or
s—
©is
toc
kp
ho
to.c
om
/dli
bo
rz
ivo
tic
, win
d t
ur
bin
e p
ho
to c
ou
rt
es
y o
f n
re
l

80 ieee power & energy magazine november/december 2015
that can provide many ancillary services that were not envi-sioned several years ago. When properly incentivized, vg can contribute to system balance and control.
VG Can Contribute to System Balancing Needstwo of the primary balancing functions are automatic generation control (agc) or agc (regulation) and economic dispatch.
System Balancethe operational planning cycles in bulk system opera-tions, whether under wholesale energy market structures or in vertically integrated utility settings, have the objec-tive to position the system to meet the net load and to pro-vide the range of services needed to guarantee operational security on multiple timescales. as shown in Figure 1, this involves scheduling generators the day before via a process called unit commitment based on the forecasted net load. in real time, available generating capacity is dis-patched to meet the continually changing net load. load
following capacity is adjusted manually, on a frequent economic dispatch cycle, or through the operation of sub-hourly energy markets to track changes in net load on a timescale between 5 min and 1 h. computer-controlled “regulation” from agc redispatches capacity on a second-to-minute basis to support interconnection frequency con-trol (60 hz in north america).
traditionally, demand for electricity tends to peak in the afternoon or evening and is low in the middle of the night. system operators use intermediate units, such as combined-cycle gas units, to follow the load, whereas less-expensive base-load units run at high output 24 h per day.
large amounts of vg change the way the system is oper-ated. the variations in net load and short-term uncertainty are increased, thereby increasing the amounts of required regulating capability and increasing load following or ramp-ing to meet the increased variability of the net load. in some regions, wind power output can be higher at night when demand is low, which could make system operation more difficult. When the base-load units are generating at their
Wind Generation’s Evolving Dynamic Response CapabilityThe evolving dynamic response capability of wind offers an
example of technical, regulatory, and reliability progress for
both wind turbines and the electric power industry. Lack of
dynamic grid support from any generation technology in the
event of a power system disturbance is problematic both
because the generator is not helping to stabilize the power
system and because it may be displacing generation that
could. Both the power industry’s understanding and wind
turbine capabilities have evolved so that reliability is now
increased with the addition of wind.
These reliability improvements include frequency, volt-
age ride-through requirements, and voltage support, as
previously discussed. More recently, the ability of wind tur-
bines to actively control the energy injected into the power
system has been exploited. With electronics coupling the
generator to the power system, modern wind turbines are
able to control their output much faster and more accurately
than conventional synchronous generators. Wind turbine
control is possible in cycles (milliseconds, which is the iner-
tial time frame) rather than in seconds (the response time
of conventional generator governors). The rotating mass of
the wind turbine blades themselves coupled to the short-
term overload capability of the power electronics provides
an additional source of completely controllable stabilizing
energy. Unlike conventional synchronous generators, which
provide uncontrolled inertia response, the response from
wind turbines is completely controllable. Power system
transient stability response to a major disturbance involves
power oscillations as generators swing against each other.
Studies show that wind turbine “synthetic inertia” provides
benefits similar to those of synchronous inertia to help the
power system ride through a disturbance while also damp-
ening undesirable oscillations. Figure S1 shows the superior
stability response of doubly fed asynchronous wind tur-
bines compared to conventional synchronous generators
following a grid disturbance.
1.21.00.80.60.40.20.0
Ten-Cycle Grid Fault
Voltage Revovery ofWind Farm Is Superior
Synchronous GeneratorSwings Dramatically
250
200
150
Pow
er (
MW
)V
olta
ge (
%)
100
50
0
0 5Time (s)
10
Gas TurbineWind Farm
figure S1. Wind power plants with doubly fed asynchronous generators are more stable than those that have conventional synchronous generators.

november/december 2015 ieee power & energy magazine 81
minimum output level and addi-tional wind energy is available, wind energy must be curtailed or a base-load unit must be decom-mited. the economically rational solution is usually to decommit the base-load unit because it burns fuel and wind energy does not. however, if the base-load unit has a long shutdown/start-up period, it may be impossible to decommit the unit and have it available, if needed, the next day.
Wind down-ramps can also be challenging because the opera-tor needs adequate up-reserves to compensate for the reduced generation. Wind forecasting can often predict down-ramps but there may be a timing error (the down-ramp may occur sometime before or after its prediction). the geographic diversity of wind is very helpful for smoothing out these issues. on the other hand, solar output is easier to predict—we know when the sun will rise and fall every day, although partly cloudy days can make forecast-ing difficult. the geographic di-versity of solar helps with variabil-ity caused by cloud movement, but the sunrise and sunset ramps require power system operation throughout much wider geo-graphic regions for mitigation by diversity. Managing large amounts of pv generation requires being able to manage the sunrise and sunset ramps while reducing other generation midday to accept the pv generation.
VG Can Provide Regulation/AGC ServicesMore sophisticated approaches have emerged and been implemented in recent years to reduce the incremental bur-den that vg may bring to system balancing. For example, wind power plants currently provide regulating reserves in the Xcel/public service of colorado (psco) balanc-ing authority area. in 2014, psco had 19% wind and 1%
solar energy penetration on its system. With a 33% renew-able portfolio standard by 2020, these levels are expected to increase. this system is fairly small; it has a peak load of 7 gW, and more than half of the energy comes from coal. it can be challenging to balance a small system with large amounts of coal generation and high vg penetrations. For example, psco reported that wind served more than 50% of the load during 6% of the hours in october 2014, and it reached a peak of 60% on 24 May 2013, between 1 and 2 a.m. When loads are low at night and wind is high, psco has to decide between deeply cycling their coal-powered plants or curtailing wind power output. in 2011, psco quantified the trade-offs between these options and found that total costs
0 4 8 12 16 20 24
Sys
tem
Loa
d (M
W)
Seconds toMinutes
Tens of Minutesto Hours
Load Following
Day
Scheduling
Days
Unit Commitment
Regulation
Time (Hour of day)
figure 1. The demand for electricity is constantly changing, so operators have pro-cesses that allow generation output to change while maintaining the required balance between generation and load.
There can be times when the system is constrained with too much generation and not enough demand and/or transmission to move the energy.

82 ieee power & energy magazine november/december 2015
were remarkably similar. the company chose the wind cur-tailment protocol, which provides two benefits:
✔ coal cycling costs have high uncertainty, and reduced cycling can avoid potential high-impact, low-probabil-ity events.
✔ curtailed wind can provide an upward regulating reserve.Wind can be curtailed manually through a block curtail-
ment, which is a reduction in wind power plant output by a fixed amount for a period of time with little if any changes in wind output. Figure 2 shows wind power plant potential (pink), actual wind power plant output (blue), and area con-trol error (ace, in yellow) during a windy night. the ace was high (the psco balancing authority area was generat-ing more than its load), so, at 2:45 a.m., the system opera-tor block-curtailed the wind from its output of more than 500 MW down to 300 MW. the ace immediately dropped toward zero but then dropped too low (psco was consum-ing more than it was generating). at 4 a.m., the operator put the wind power plant on agc regulation. the curtailed wind power plant was able to adjust output up and down as appropriate to help keep the ace within specified limits. at 6 a.m., the wind power plant was released from agc. after 6 a.m., the ace dropped low again, but at that point the wind power plant was producing at its potential, and it could
not help the system further; this is similar to a thermal unit running at full power output and therefore unable to provide up-regulation. this demonstrates that putting wind on agc can provide a significant improvement compared to manu-ally curtailing wind. it simultaneously minimizes wind cur-tailment (note that from 3:20 a.m. to 4:10 a.m., the ace was negative and the block curtailment could have ended if the operator had finer control over block curtailment) and allows wind to provide effective ancillary services to help balance the system.
as wind can provide fast up and down responses without the wear and tear that thermal generators incur, it may be in psco’s interest to use wind to provide as much regulation as possible (when it is curtailed) and use the thermal generators for any remaining requirements. Wind has been so effec-tive at providing regulation that 2,172 MW of Xcel’s wind generation are now capable of providing agc when needed.
the industry has much less experience with pvs on agc, but in principle the mechanics would be the same. several markets [such as the southwest power pool, the electric reli-ability council of texas (ercot), the california independent system operator, pJM, the new York independent system operator, and the Bonneville power administration] allow vg to provide downward (and upward, in some cases) regulating
reserves, provided they meet eligi-bility requirements. Many markets [independent system operator new england, Midcontinent inde-pendent system operator (Miso), and independent electricity sys-tem operator of ontario] still do not allow vg to provide regulation, and some (alberta electric system operator) have rules (regulation is procured day ahead, and suppliers must provide it for 60 min) that preclude vg from providing it. For regions anticipating high pen-etrations of vg, it would be wise to consider making adjustments to market rules to allow vg (or any other resource, such as load, as long as it meets eligibility require-ments) to provide regulation.
there is a cost and limit, however, to using this curtailed
This more mature approach to assessing the impacts and benefits of VG recognizes the ongoing challenges to integration at increased penetration levels.
600
500
400
300
200
100
0
–100
–200
ACE
Park Potential
Wind FarmMetered Generation
At 2:45 a.m., RToperator initiatescurtailment to 300 MWdue to high ACE.
At 4 a.m., RT operator initiatesAGC regulation. Note that theACE stays within ±50.
2:25
:00
a.m
.2:
35:0
0 a.
m.
2:45
:00
a.m
.2:
55:0
0 a.
m.
3:05
:00
a.m
.3:
15:0
0 a.
m.
3:25
:00
a.m
.3:
35:0
0 a.
m.
3:45
:00
a.m
.3:
55:0
0 a.
m.
4:05
:00
a.m
.4:
15:0
0 a.
m.
4:25
:00
a.m
.4:
35:0
0 a.
m.
4:45
:00
a.m
.4:
55:0
0 a.
m.
5:05
:00
a.m
.5:
15:0
0 a.
m.
5:25
:00
a.m
.5:
35:0
0 a.
m.
6:05
:00
a.m
.6:
15:0
0 a.
m.
6:25
:00
a.m
.6:
35:0
0 a.
m.
5:45
:00
a.m
.5:
55:0
0 a.
m.
figure 2. A wind power plant in the Xcel/PSCO area is the first to manually block cur-tailed wind and then put it on AGC regulation. The y axis is in megawatts. The resulting ACE is shown in yellow.

november/december 2015 ieee power & energy magazine 83
energy to provide system support. Wind curtailment is achieved by either automated market-based mechanisms, such as the Miso dispatchable intermittent resource (dir) economic dispatch or through manual directives by the sys-tem operator. Usually the most expensive plant is curtailed first to alleviate system congestion or maintain system bal-ance. the economic compensation provided to the wind power plant varies and depends on the specifics of the power contract. output from individual turbines can be reduced in seconds to provide downward reserves and ramping sup-port. output from curtailed wind turbines can be increased quickly, on the order of seconds to tens of seconds, to pro-vide frequency, upward reserve, and ramping services. curtailment from pvs is achieved by controlling inverter output, and therefore it acts on very short timescales of frac-tions of seconds. this turns wind and pvs into dispatchable resources, but it is at the economic cost of reduced energy output. therefore, the economic choice to curtail vg at any given moment reflects the trade-off between the instanta-neous value of the energy produced and the value of upward reserves provided. this economic trade-off is further com-plicated for wind (in the United states) for projects utilizing production-based subsidies. however, some positive feed-back may exist. For example, thermal generators that stay online to provide upward reserves and subsequently force wind to curtail could instead be decommitted if the curtailed wind provides the upward reserves.
VG Can Be Economically Dispatchedthere can be times when the system is constrained with too much generation and not enough demand and/or transmission to move the energy. Managing this type of overgeneration
condition is most effective if the solution is incorporated directly into the economic dispatch process, which (under nor-mal conditions) requires no direct operator intervention and can be done very quickly and cost effectively. Miso manages more than 14 gW of wind generation in its market footprint. the continued growth of wind generation, especially in the western areas of its territory, has created local transmission congestion issues during certain periods that were tradition-ally managed by manual curtailments of specific wind genera-tion facilities. in 2011, Miso implemented the dir protocol, which effectively places wind power plants on agc under control of the Miso real-time market systems. this resulted is an overall reduction of curtailed renewable energy delivery along with a much higher level of operational efficiency and transparency. Figure 3 shows the monthly downward dispatch of energy as a percent of the economic maximum. according to Miso, approximately 95% of wind energy’s potential can be captured through economic dispatch. all new wind gen-eration facilities in Miso must register as dirs, and more than 80% of wind generation in Miso is dispatchable.
VG Can Contribute to Operational Securityas the instantaneous penetration of vg resources increases, there is greater interest in wind’s potential impacts on main-taining the operational stability and security of the bulk power system during and after major disturbances. although this has not been studied as extensively as balancing issues or widely incorporated into system operation, there is increased understanding that vg can provide frequency, inertia, and voltage control capabilities that have been tradi-tionally provided by synchronous generators.
3,500 20
18
16
14
12
10
Dis
patc
h D
own
(%)
8
6
4
2
0
3,000
2,500
2,000
GW
h
1,500
1,000
500
0
June
201
1
July
201
1
Aug
. 201
1
Sep
. 201
1
Oct
. 201
1
Nov
. 201
1
Dec
. 201
1
Jan.
201
2
Feb
. 201
2
Mar
. 201
2
Apr
. 201
2
May
201
2
June
201
2
July
201
2
Aug
. 201
2
Sep
. 201
2
Oct
. 201
2
Nov
. 201
2
Dec
. 201
2
Jan.
201
3
Feb
. 201
3
Mar
. 201
3
Apr
. 201
3
DIR Dispatched Energy (Left Axis)
% of DIR Dispatched Down (Right Axis)DIR Dispatch Below Economic Maximum (Left Axis)
figure 3. Wind power plant dispatch in MISO with DIR protocol.
84 ieee power & energy magazine november/december 2015
Frequency Response and Synthetic Inertial ControlFrequency response is the overall response of a power system to small, routine fluctuations in frequency and also large, sudden mismatches between generation and load that may result from generation or transmission tripping offline. the loss of a large central station generating plant is of most con-cern. When total demand exceeds total generation, system frequency drops. traditionally, the inertia of synchronous machines helps retard the frequency decline, providing an opportunity for generating units with governors to increase power output to stabilize the system before a frequency-based disturbance could otherwise occur.
among power system operators and utilities, there is a con-cern regarding the degradation of frequency response in north america during the past two decades. the decline has resulted from various factors, including the withdrawal of primary or governor response shortly after an event, the lack of in-service governors on conventional generation, and the unknown and changing nature of load frequency characteristics. large pen-etrations of inverter-based (or nonsynchronous) generation tech-nologies further complicate this issue. synchronous machines always contribute to system inertia, and some fraction of the synchronous generation in operation at any time has governor controls enabled. By contrast, wind and pv plants, in differ-ent ways, can provide “synthetic system inertia” through a fast frequency response (FFr) with a power electronic converter to simulate inertial response, and a slower frequency response can be provided through electronic governor action. When wind and pv generation displace conventional synchronous genera-tion, the mix of the remaining synchronous generators changes, and there is the potential to adversely impact overall frequency response if good engineering practice is not followed.
the impact of nonsynchronous generation on frequency stability may appear more quickly in relatively small grids with high penetrations of wind because a relatively low wind capacity level can comprise a larger percentage of demand than in a larger grid. For example, the combined ireland and northern ireland power system has developed a system of nonsynchronous penetration (snsp) ratio to help identify operating limits. eirgrid currently limits snsp to less than 50%. in the future, eirgrid expects to raise that limit to 75%. this is an issue that much larger systems will face in future scenarios of high penetrations of wind and solar.
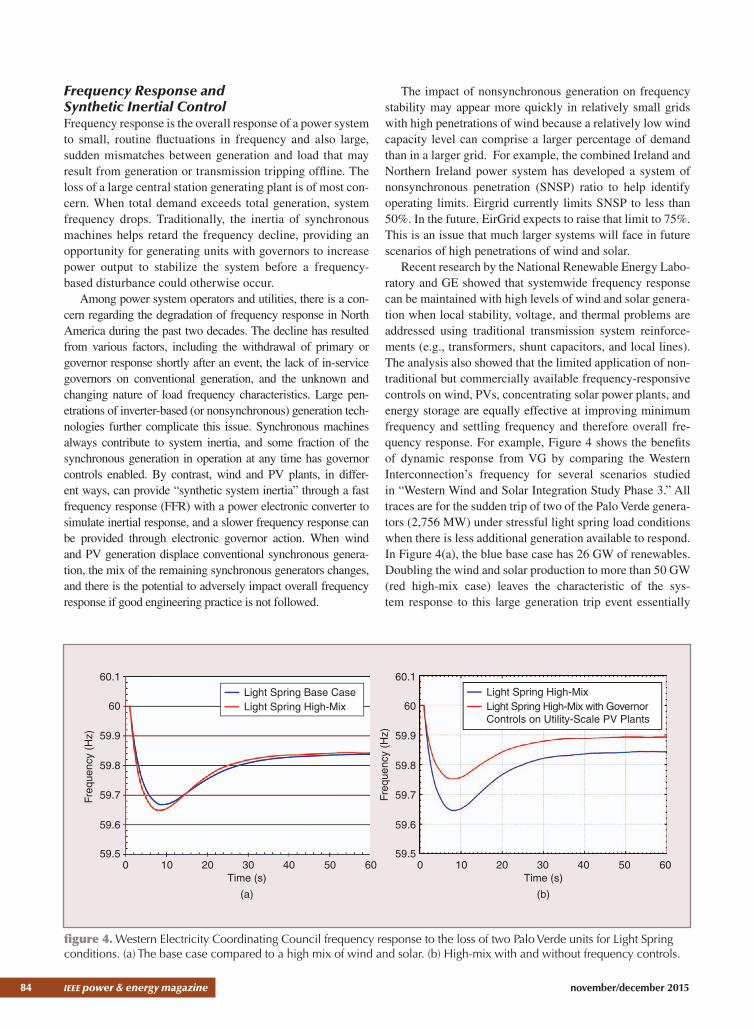
recent research by the national renewable energy labo-ratory and ge showed that systemwide frequency response can be maintained with high levels of wind and solar genera-tion when local stability, voltage, and thermal problems are addressed using traditional transmission system reinforce-ments (e.g., transformers, shunt capacitors, and local lines). the analysis also showed that the limited application of non-traditional but commercially available frequency-responsive controls on wind, pvs, concentrating solar power plants, and energy storage are equally effective at improving minimum frequency and settling frequency and therefore overall fre-quency response. For example, Figure 4 shows the benefits of dynamic response from vg by comparing the Western interconnection’s frequency for several scenarios studied in “Western Wind and solar integration study phase 3.” all traces are for the sudden trip of two of the palo verde genera-tors (2,756 MW) under stressful light spring load conditions when there is less additional generation available to respond. in Figure 4(a), the blue base case has 26 gW of renewables. doubling the wind and solar production to more than 50 gW (red high-mix case) leaves the characteristic of the sys-tem response to this large generation trip event essentially
60.1
59.9
59.8
59.7
59.6
59.50 10 20 30
Time (s)40 50 60 0 10 20 30
Time (s)
(a) (b)
40 50 60
Freq
uenc
y (H
z)
60
60.1
59.9
59.8
59.7
59.6
59.5
Freq
uenc
y (H
z)
60Light Spring Base CaseLight Spring High-Mix
Light Spring High-MixLight Spring High-Mix with GovernorControls on Utility-Scale PV Plants
figure 4. Western Electricity Coordinating Council frequency response to the loss of two Palo Verde units for Light Spring conditions. (a) The base case compared to a high mix of wind and solar. (b) High-mix with and without frequency controls.

november/december 2015 ieee power & energy magazine 85
unchanged. When governor controls are added to utility-scale solar pv plants, the systemwide frequency response is substantially improved [Figure 4(b)].
Frequency and Voltage Ride-Throughto date, wind turbines are the only generators required to ride through disturbances. early wind machines used simple induction generators that provided no dynamic grid support in the event of a power system disturbance. these turbines focused on energy capture rather than grid support. in fact, because they had response characteristics different from conventional synchronous generators, they were required to disconnect if frequency or voltage deviated from nominal to prevent them from making the situation worse. as wind pene-tration increased, the loss of significant amounts of wind gen-eration during a disturbance became a reliability concern, and utilities wanted to impose ride-through requirements on wind turbines. Wind-turbine technology had advanced, and the wind industry supported ride-through requirements, but they wanted them to be standardized to facilitate product design. With considerable input from both the wind industry and the power system industry, the Federal energy regulatory com-mission addressed these concerns in 2005 with order 661a, which requires all new wind turbines to ride through low-voltage events rather than disconnecting. this order also set power factor design criteria and supervisory control and data acquisition requirements for wind generators.
the north american electric reliability corporation considered applying the same requirement to all new gen-erators when it drafted the new standard prc-024-1, Gen-erator Frequency and Voltage Protective Relay Settings. during several balloting processes conducted by the north american electric reliability corporation, the industry repeatedly defeated the inclusion of an actual ride-through performance requirement. instead, the standard requires only that the primary protective relays not be set to trip the generator within the “no trip zone” of voltage and fre-quency curves. conventional generators do not need to ride through an event, but wind turbines must still meet the requirement imposed by the Federal energy regulatory commission to ride through disturbances. Wind turbines are also required to provide voltage support if needed by the power system.
ride-through requirements for distributed pv systems are also evolving. Utilities require distributed pv systems to dis-connect when voltage or frequency is out of bounds. this is
based on safety concerns to prevent the pv system from ener-gizing a portion of the grid that is supposed to be de-energized (anti-islanding). as with wind, the requirement was reason-able when there was not much pv generation on the power system, but it is not viable with thousands of megawatts of generation that might disconnect during a disturbance. Fortu-nately, anti-islanding technologies have improved, and safety concerns can be addressed while having distributed pv ride through disturbances. ieee 1547, Standard for Intercon-necting Distributed Resources with Electric Power Systems, is being modified to allow pv ride-through. california and hawaii are requiring ride-through capabilities from new dis-tributed pv installations.
Power System of the Futureincreasing amounts of wind and pvs, which are largely con-nected to the electricity grid by nonsynchronous power elec-tronic converters, is part of a bigger trend in the evolution of power systems. this trend also includes increased levels of power electronics embedded in loads (e.g., modern electronic loads) and transmission (e.g., high-voltage dc transmission). the more distributed nature of wind, pvs, and other forms of gen-eration (e.g., combined heat and power) along with more active consumer participation are all contributing to a dramatic shift in the nature and characteristics of the future electricity grid. these changes create the need for more physical flexibility that can be sourced from many different assets on the electricity grid. (see “additional sources of Flexibility.”)
the island of ireland is an interesting example in which the increase in nonsynchronous generation is necessitating the development of both innovative wind power plant con-trols and holistic solutions. these solutions include advanced wind turbine controls (i.e., synthetic inertia), fast demand response, and synchronous generators capable of riding through larger frequency swings all within the regulatory and market framework. ercot also found that fast demand response is more effective than the response from conven-tional generator governors in stabilizing the power system after a major disturbance.
as the system continues to evolve toward higher levels of vg, this market framework must provide the appropriate signals to incentivize sufficient flexibility in both the opera-tional and investment time horizons. not only is a sufficient level of capacity required to meet future demand, but the nature of this capacity is fundamentally different than it was in the past because of the need for flexibility. this issue is
With proper incentives and market designs, all flexibility options can be deployed to minimize the overall costs of a clean, reliable power system.

86 ieee power & energy magazine november/december 2015
explored in more detail in the accompanying article in this issue by ahlstrom et al.
it is also important to note the rapid spread of distrib-uted generation. this will have a larger impact on transmis-sion and distribution systems in which the current planning
is still largely centralized. the challenge of the electricity industry is twofold: first, there must be a vision of a market structure that accommodates these changes, and second, a transition is needed that can be done with minimal disrup-tion, both physically and financially.
Additional Sources of FlexibilityAlthough wind and solar generators can provide fast and
accurate control, integrating additional wind and solar
generation is often aided by broadening the power system
operator’s suite of flexible resources. These sources can
allow decommitting conventional generation and increas-
ing the amount of renewable energy that the power sys-
tem is able to reliably and economically integrate. Existing
resources often can be operated in a flexible manner if there
are incentives and if the institutional structure does not pre-
vent it. Two groups of relatively new emerging sources are
demand response and other sources of flexibility.
Demand Response
Demand response can allow conventional generation that
would otherwise be kept online to be decommitted to pro-
vide fast reserves. Historically, a utility would ensure that
adequate unloaded conventional generation was online and
had active governors to ensure that power system frequency
could recover from the worst credible contingency without
triggering any underfrequency load shedding. For example,
it could be challenging for ERCOT to keep the frequency
nadir above 59.4 Hz immediately after a major contingency
if light load and abundant wind generation had displaced
much of the conventional generation. Rather than relying
exclusively on generator response, ERCOT has found that
FFR from load (FFR that responds in fewer than 30 cycles
once system frequency reaches 59.7 Hz) provides at least
the same reliability benefit as conventional generation pro-
viding primary frequency response (PFR). For example, at
low-load, high-wind conditions, as shown in Figure S2, it
was found that 1,400 MW of FFR provides the same reliabil-
ity benefit as 3,300 MW of conventional generation provid-
ing PFR. This shows that FFR from load can be 2.35 times as
effective as the frequency response from conventional gen-
eration. In addition, decommitting conventional generation
operating at low load simply to provide PFR also reduces
wind and solar curtailment, which reduces emissions and
saves money. Carrying the same reserves with wind or solar
would require spilling zero marginal cost energy to create
the response headroom. Although renewables could pro-
vide the reliability response, obtaining the response from
the load allows the renewables to supply more energy, and
ERCOT has found this to be more cost-effective.
Other Sources of Flexibility
Improvements in conventional generation flexibility also
help with effective renewable integration. Fast-start recip-
rocating engines and combustion turbines that have lower
minimum loads and higher efficiencies and can be started
within minutes without incurring start-up costs can help
provide ramping and nonspinning reserves. Shortening the
start-up time (and lowering the start-up cost) lets the sys-
tem operator delay response until wind and solar conditions
are more certain, which improves forecast accuracy and
reduces the requirement for online reserves. Retrofitting
existing conventional generators to reduce start-up times,
minimum loads, and cycling costs provides similar benefits.
Storage provides similar technical benefits and should be
used whenever it is the least-cost resource.
60.10
60.00
59.90
59.80
59.70
59.60
59.50
59.40
Bus
Fre
quen
cy (
Hz)
0.00 5.00 10.00 15.00Time (s)
1 MW FFR ≈ 2.35 MW PFR
20.00 25.00
Load = 25 GW, Wind = 7.2 GWDisconnect Two Nuclear Units (2,750 MW Total)
4,700 MW of PFR fromConventional Synchronous Generators1,400 MW of FFR from Load Replaces3,300 MW of PFR from Generation
figure S2. An example of FFR to the loss of two nuclear units (2,750 MW total) from load (black) com-pared to PFR from conventional generators (blue) in ERCOT. FFR responds in fewer than 30 cycles. Primary frequency response is the governor response, typically within 10 s.

november/december 2015 ieee power & energy magazine 87
Summary and ConclusionsWind and pv generation have emerged as mainstream energy resources that have increasing economic compet-itiveness in many power systems around the world. With increased deployment, there is also a more fundamental understanding of vg’s characteristics, impacts, and benefits. the traditional “old” model of vg, shown in table 1, has been replaced by a “new” model based on detailed opera-tional simulation as well as years of real-world experience in systems throughout north america and europe.
this more mature approach to assessing the impacts and benefits of vg recognizes the ongoing challenges to inte-gration at increased penetration levels. vg increases the net variability and uncertainty on the system, and therefore more creativity and flexibility is required to maintain reli-able operation. in response, system operators and planners have discovered and developed a larger set of flexibility options both in methods to operate existing grid assets and to deploy new technology options. on the generation side, these options range from reexamining historical operating practices for operating traditional thermal generation to exploiting advanced capabilities of vg itself. on the demand side, new markets may tap significant flexibility from dis-patchable loads. developing these flexibility resources in the most cost-effective manner requires ongoing assess-ments of the various options. With proper incentives and market designs, all flexibility options, including provisions of multiple flexibility services from wind and solar, can be deployed to minimize the overall costs of a clean, reliable power system.
For Further Readingeirgrid, delivering a secure sustainable electricity system. [online]. available: http://www.eirgrid.com/operations/ds3/
n. W. Miller, M. shao, s. pajic, and r. d’aquila, “West-ern wind and solar integration study phase 3—Frequency response and transient stability, nrel/sr-5d00-62906. golden, co: national renewable energy lab., 2014.
M. Milligan, K. porter, e. deMeo, p. denholm, h. holttinen, B. Kirby, n. Miller, a. Mills, M. o’Malley, M. schuerger, and l. soder, “Wind power myths debunked,” IEEE Power Energy Mag., vol. 7, no. 6, pp. 89–99. nov./dec. 2009.
n. Miller, c. loutan, M. shao, and K. clark, “emergency response,” IEEE Power Energy Mag., nov./vol. 11, no. 6, pp. 63–71, dec. 2013.
BiographiesMichael Milligan is with nrel, golden, colorado.
Bethany Frew is with nrel, golden, colorado.Brendan Kirby is with consult Kirby, palm city, Florida. Matt Schuerger is with energy systems consulting ser-
vices, Minneapolis, Minnesota.Kara Clark is with nrel, golden, colorado.Debbie Lew is with ge energy consulting, golden, colorado. Paul Denholm is with nrel, golden, colorado.Bob Zavadil is with enernex.Mark O’Malley is with University college dublin,
ireland.Bruce Tsuchida is with the Brattle group, Boston, Massa-
chusetts.
p&e
Integrating additional wind and solar generation is often aided by broadening the power system operator’s suite of flexible resources.
table 1. Evolving characteristics of VG technologies.
Characteristic Old New
Dispatchability Uncontrollable, “must take” Dispatchable through participation in economic dispatch
Forecast/uncertainty Unpredictable Increasingly forecastable
Variability Highly variable over multiple timescales Very short-term variability largely mitigated via spatial diversity
Reserve requirements Requires dramatic increase in operating reserves from thermal units
Relatively small increase in regulation required. Can self-provide multiple reserves across multiple timescales with selective/economic curtailment
Grid support Provides no grid support/decreases grid stability
Can provide multiple grid support services