An Energy Efficient Sleep Scheduling Considering QoS Diversity for IEEE 802.16e Wireless Networks

East Tennessee State UniversityDigital Commons @ East
Tennessee State University
Electronic Theses and Dissertations Student Works
5-2011
Alternative Scheduling in the Middle School:Considering Circadian Rhythms.James Edward CarterEast Tennessee State University
Follow this and additional works at: https://dc.etsu.edu/etd
Part of the Educational Psychology Commons, and the Physiology Commons
This Dissertation - Open Access is brought to you for free and open access by the Student Works at Digital Commons @ East Tennessee StateUniversity. It has been accepted for inclusion in Electronic Theses and Dissertations by an authorized administrator of Digital Commons @ EastTennessee State University. For more information, please contact [email protected].
Recommended CitationCarter, James Edward, "Alternative Scheduling in the Middle School: Considering Circadian Rhythms." (2011). Electronic Theses andDissertations. Paper 1259. https://dc.etsu.edu/etd/1259

Alternative Scheduling in the Middle School with Regards to Circadian Rhythms
_____________________
A dissertation
presented to
the faculty of the Department of Educational Leadership
East Tennessee State University
In partial fulfillment
of the requirements for the degree
Doctor of Education of Educational Leadership
___________________
by
James Edward Carter
May 2011
_________________
Dr Virginia Foley, Chair
Dr. Donald Good
Dr. Ryan Nivens
Dr. Pamela Scott
Keywords: Scheduling, Alternative Scheduling, Circadian Rhythms, Rotating Schedule, Middle
School Scheduling

2
ABSTRACT
Alternative Scheduling in the Middle School: Considering Circadian Rhythms
by
James Edward Carter
The passage of No Child Left Behind has increased the level of accountability for all educators.
There are many factors that affect student achievement. One factor that may be overlooked is
the schedule configuration of schools. Addressing student needs through scheduling options
may assist school systems and students in performing at the level they are being held
accountable.
The population for this study was students from a rural East Tennessee middle school with a
population of approximately 700 students. The low socioeconomic students represent 68% of
the school total enrollment while 18% of the students have an individual education plan (IEP).
The gender of the school is nearly 50% male and female.
Looking at 2 research questions, an independent t test was used to determine if there was a
significant difference in reading-language arts and mathematics Tennessee Comprehensive
Assessment Program (TCAP) scores after implementing a rotating schedule. Subgroups used in
this study were: students with an Individual Education Plan (IEP), low socioeconomic students,
male and female students.
Results of this study were mixed. Students with an IEP showed an increase in both reading-
language arts and mathematics. For all subgroups in reading, there was an increase in
achievement although the results showed that there was not a significant relationship between the
rotating schedule and student achievement. The only group to show gains in mathematics after
implementation of the rotating was those students with an IEP. Each of the 3 remaining

3
subgroups actually showed a loss and there was a significant relationship between the rotating
schedule and student achievement.

4
DEDICATION
This research is dedicated:
To my parents Roy and Peggy Carter, who instilled in me a good work ethic and taught
me to be an honorable man. I appreciate you both for all of your support and love as well as
giving me an opportunity to achieve a college education. You stood by me when I stumbled
through life and picked me up when I fell. The milestones that I have achieved in life, even
today, I credit to both of you. Even though you both are in heaven today, I think of you daily
and still try to live up to your expectations. I love and miss both of you tremendously.
To my wife Melissa, whose love never waivers. You are my rock and have given me a
life that I would never have dreamed possible. I appreciate your patience with me through this
process as I spent many late nights at a computer. You are my best friend as well as my wife and
I truly believe we were meant to be together. I thank you for choosing me to spend your life
with. I cannot fathom living in a world without you.
To my children Carmen, G. W., and Ashley, who have given me so much enjoyment and
laughter. I have been truly blessed to be a part of your lives. You each have your mother‘s
compassion for others and a good sense of right and wrong. I am very proud of the adults you
are today.
To my sons and daughter-in-law Roger, Cheree, and Jason, who make our family
complete. Each of you holds a special place in our hearts.
To my grandchildren Saylor, Dawson, and Cade, who are the absolute light of my life.
You each have brought so much joy to me. I have enjoyed all the games we have played and the
projects we have worked on together. You all keep me young and there is never a dull moment.

5
Remember to always treat others as you would have them treat you. You are a blessing to me
and to everyone whose life you touch.

6
ACKNOWLEDGEMENTS
I would like to give special thank you to my mother-in-law Kathleen Graves for her
support, help, and dedication to my research. Thank you for patiently proofing my work and all
the days and nights you spent editing my dissertation. You are a mentor to me in both my
personal and professional life.
To my coworkers at the Union County Public School‘s central office who have supported
me throughout this journey. Your words of encouragement, advice, and support have meant so
much to me. I appreciate Wayne Goforth, Director of Schools, for his support and
encouragement. I also would like to acknowledge the faculty and staff of Horace Maynard
Middle School who have been especially supportive to me during this project.
To Julia Watts and Caroline Malone who have edited my work. I appreciate the time and
energy you have spent editing my paper. It has been invaluable. Further, I would like to thank
my friends Emily Walker and Anna Arp for their words of encouragement and advice.
To Susan Twaddle, I thank you for the time you spent helping with the statistical data. I
appreciate your prayers and thoughts throughout the process.
I would like to think Jason Fuller who gave me technical support at a moment‘s notice.
Your patience and friendship is greatly appreciated.
To each of my committee members Dr. Virginia Foley, Dr. Don Good, Dr. Ryan Nivens,
and Dr. Pam Scott, who have been especially supportive. I appreciate your time and patience
while I worked through this dissertation. To my chair Dr. Foley who has been especially patient
working with me through the editing process. I also, appreciate Dr. Good who has been quick to
respond and most helpful with advise.

7
CONTENTS
Page
ABSTRACT ............................................................................................................................... 2
DEDICATION ........................................................................................................................... 4
ACKNOWLEDGEMENTS ....................................................................................................... 6
LIST OF TABLES ..................................................................................................................... 9
LIST OF FIGURES .................................................................................................................. 10
Chapter
1. INTRODUCTION ............................................................................................................... 11
Statement of the Problem ............................................................................................... 13
Research Questions ........................................................................................................ 14
Significance of the Study ............................................................................................... 14
Limitations ...................................................................................................................... 15
Delimitations .................................................................................................................. 15
Definition of Terms ........................................................................................................ 15
2 REVIEW OF LITERATURE ............................................................................................... 19
Brain-Based Learning ..................................................................................................... 19
Alternative Scheduling ................................................................................................... 25
Circadian Rhythms ......................................................................................................... 31
Later School Start Times ................................................................................................ 38
Summary ........................................................................................................................ 42
3. RESEARCH METHODOLOGY ........................................................................................ 43
Introduction .................................................................................................................... 43
Research Design ............................................................................................................. 43
Population ....................................................................................................................... 43
Data Collection Procedures ............................................................................................ 44
Data Analysis ................................................................................................................. 44

8
Chapter Page
4. DATA ANALYSIS ............................................................................................................. 47
Descriptive Statistics ...................................................................................................... 47
Analysis of Research Questions ..................................................................................... 52
Research Question 1 ....................................................................................................... 52
Research Question 2 ....................................................................................................... 56
5. SUMMARY, FINDINGS, CONCLUSIONS, AND RECOMMENDATIONS ................. 64
Summary of the Study .................................................................................................... 64
Summary of Findings ..................................................................................................... 65
Research Question 1 .................................................................................................. 65
Research Question 2 .................................................................................................. 66
Conclusion ...................................................................................................................... 67
Recommendations for Practice ....................................................................................... 69
Recommendations for Further Research ........................................................................ 70
REFERENCES ......................................................................................................................... 73
VITA ........................................................................................................................................ 78

9
LIST OF TABLES
Table Page
1. Paired NCE mean sample statistics in mathematics for low socioeconomic students ............ 48
2. Paired NCE mean sample statistics in reading-language arts for low socioeconomic
students ..................................................................................................................................... 48
3. Paired NCE mean sample statistics in mathematics for students with an IEP ......................... 49
4. Paired NCE mean sample statistics in reading-language arts for students with an IEP ......... 49
5. Paired NCE mean sample statistics in mathematics for male students .................................... 50
6. Paired NCE mean sample statistics in reading-language arts for male students .................... 50
7. Paired NCE mean sample statistics in mathematics for female students ................................. 51
8. Paired NCE mean sample statistics in reading-language arts for female students ................. 51
9. Effect sizes for hypotheses....................................................................................................... 61

10
LIST OF FIGURES
Figure Page
Figure 1. Low socioeconomic students‘ math scores .................................................................. 53
Figure 2. Students with an IEP‘s math scores .............................................................................. 54
Figure 3. Male student‘s math scores ........................................................................................... 55
Figure 4. Female student‘s math scores ....................................................................................... 56
Figure 5. Low socioeconomic students‘ reading-language arts scores ........................................ 57
Figure 6. Students with an IEP‘s reading-language arts scores .................................................... 58
Figure 7. Male student‘s reading-language arts scores ................................................................ 59
Figure 8. Female student‘s reading-language arts scores ............................................................. 61

11
CHAPTER 1
INTRODUCTION
The United States Congress reauthorized the Elementary and Secondary Education Act
(ESEA) in 2001 and President Bush signed it into law on January 8, 2002. This act, known as
the No Child Left Behind Act (NCLB), has added an accountability component on the part of
educators. According to the NCLB Act, all students must be proficient in both mathematics and
language arts by the school year 2013-2014 (United States Congress, 2002). Further, the NCLB
Act mandates that schools unable to make adequate yearly progress (AYP) in the same area for
the same subgroup for 2 years are deemed high priority. This act challenges districts to find
means to meet the challenges and with limited resources.
The National Commission on Educational Excellence wrote A Nation at Risk in 1983.
This report, commissioned to study the state of education in America, compared America‘s
public education with that of other developed countries and found America lacking. It also made
recommendations from the study. Among these recommendations, the commission recognized
the need for educators to make better use of time. What followed was research that took a more
in depth look at the student day and the structure within the schedule of schools.
The early 1990s was a time of continued studies in brain-based research as it is related to
education as well as alternative school scheduling options. In a study addressing teacher
perception of block scheduling by Brown (2001), it was noted ―Other solutions were needed to
create a more flexible time arrangement for secondary schools to meet the needs of both teachers
and students. Alternative scheduling strategies became the means for addressing students'
learning needs based on the multitude of cognitive research released at the time‖ (p. 2).
Although research by Caine and Caine (1995), Gardner (1983), and Jacobs (1989) suggested

12
alternatives to the middle school scheduling norm, very few middle schools changed from the
typical six-to-seven period day (Brown, 2001). This lack of change is due to the public‘s belief
in the factory model structure for schools. Further, very little research has been conducted to
verify the extent of the effectiveness of alternative scheduling.
Many scheduling configurations have been considered at all levels of K-12 public
education. Some scheduling options include six to seven period schedules, block, modified
block, departmental, and rotating flexible to name a few. When determining reforms school
administrators may consider researched alternative scheduling options such as rotating flexible
scheduling to improve student achievement. Differentiation in instruction may not only mean
how a student learns best but what time of day a student learns best.
Instructional school leaders may consider those options that are in their control. One
such option would be school scheduling. The school leader, specifically a middle school leader,
may consider looking at brain research to understand how students at different developmental
stages learn and the optimal conditions in which student achievement may occur. One such area
of research is the times of day during which students best learn. Some educators maintain that
the best time for learning occurs during the morning hours. This is in conflict with research that
maintains that ―the school day typically begins at an earlier hour as students get older, potentially
exacerbating any problems created by a mismatch between circadian preferences and the timing
of learning opportunities‖ (Carskadon, Wolfson, Acebo, Tzischinsky, & Seifer, 1998). This
study further found that there is a shift of morningness vs. eveningness around the age of 12, or
the beginning of middle school as measured by the Morningness Eveningness Questionnaire
(MEQ). This being said, students may vary between morning to evening learners within a
subgroup. It is essential that administrators be aware of this type of research when scheduling

13
students for academic success. There is a trend in some school systems to address this by
differing school hours for elementary, middle, and high schools. This concept is not without its
controversies that include funding, extracurricular activities, and older siblings being at home
during times when their younger siblings depart for and arrive from school. Administrators are
placed in a situation where they must be able to schedule within their own schools to address
brain research and matching students‘ circadian preferences with learning opportunities.
The Tennessee Department of Education began applying its new curriculum standards in
school year 2009-2010. It was theorized that these changes would drastically affect the
percentage of students performing at or above the proficient level. According to Alapo (2010),
―Only an estimated 26 percent of Tennessee eighth graders demonstrate mastery in math under
new, more rigorous testing proficiency levels…‖ (p. 1). Due to higher standards leading to fewer
students scoring at a proficient level coupled with public scrutiny and accountability placed on
educators, school administrators may want to consider all options at their disposal.
Statement of the Problem
The purpose of this study was to determine the impact of a rotating schedule on the
school‘s ability to make adequate yearly progress (AYP) as determined by the students‘ TCAP
scores. Brain based research, as it relates to student achievement, received most of its attention
as related to education in the 1990s. There have been very few studies that examine the effect of
circadian rhythms on student achievement. It may be helpful for administrators to be aware of
this type of research when scheduling students for academic success. This study may add to the
body of knowledge about the impact of scheduling on student achievement.

14
Research Questions
This study was designed to address the following questions as measured by individual
students‘ normal curve equivalence (NCE) TCAP scores.
1. Is there a significant difference in TCAP mathematics scores before and after
implementation of a rotating schedule?
2. Is there a significant difference in TCAP reading-language arts scores before and after
implementation of a rotating schedule?
Significance of the Study
No Child Left Behind required that all students be proficient in both language arts and
mathematics by the year 2014. Administrators have struggled with how to accomplish this goal
with limited resources and funding. Very little research has been performed to study middle
school scheduling and the impact rotating schedules have on student achievement, even though a
school‘s schedule should reflect a school‘s vision (Daniel, 2007). Differentiating the students‘
day to day schedule to adjust to learning profiles allows for learning styles above and beyond
what the classroom teacher provides. Strickland (2005) wrote:
Next, we seek to find out if the students for whom we are designing the journey vary in
significant ways in terms of readiness, interests, and/or learning profile. If there are
students who are more or less ready, more or less interested, more or less comfortable
with a particular learning modality, we strive to identify these students‘ needs and then
come up with one or more ways to approach content, process, and product assignments
that respond to these differences and are equally respectful to the students for whom they
are designed in terms of challenge and engagement. (p. 1)
This study examines the rotating schedule concept in a middle school setting and its
impact on student achievement. Findings in this study may benefit middle school administrators
and supervisors when debating different options for attaining the goals set forth by NCLB.

15
Limitations
This study is limited to the 2006-2009 Tennessee state TCAP data for John Doe Middle
School. Adequate Yearly Progress was determined by the state‘s report card, issued each year.
The student data management system was used to determine students enrolled during this period
of time. Only those students present for all 3 years were used in this study. Low socioeconomic
students were determined by free and reduced lunch applicants. Therefore, this study is limited
to those students whose parents apply for this program.
Delimitations
This study is delimited to the state of Tennessee. The results may be generalized to other
school systems with similar demographics and student enrollment. The readers may determine
if this study is applicable to their own situation.
Definition of Terms
The following terms are defined to assist the reader to better understand this dissertation.
Adequate Yearly Progress or AYP- Under No Child Left Behind (NCLB), schools and school
districts are measured on whether the students meet performance benchmarks in math,
reading, and attendance for grades 3 through 8 and math, English, and graduation rate for
high schools. Schools that do not meet the achievement standards for 2 years are deemed
high priority (Tennessee Department of Education, 2010).
Alternate Day Classes- Sometimes referred to as an A/B schedule, this arrangement assigns
classes on an every other day basis during the week. A student can take music on
Mondays, Wednesdays, and Fridays (A schedule) and art on Tuesdays and Thursdays (B
schedule) with the core academic classes meeting all 5 days. A career class and a study
skills class can meet on alternate days, taught by two teachers or the same teacher,
depending on staffing requirements (Daniel, 2007).

16
Brain based Learning- A concept that encourages educators to capitalize on the associations the
brain must make to create synaptic connections and anchor learning through contextual
experiences (Kaufman et al., 2008).
Block Scheduling- Scheduling patterns most often used by interdisciplinary teams, blocks of time
usually consist of two or more combined periods. In its simplest form, blocks are all the
same length of time (e.g., 100 minutes). For example, in the common "4 X 4" (four by
four) scheduling arrangement, students take only four classes in the first half of the year
and four different classes in the second half of the year (Hackman, 2010).
Circadian Rhythm- Roughly 24-hour cycle in the biochemical, physiological, or behavioral
processes of living entities including plants, animals, fungi, and cyan bacteria (see
bacterial circadian rhythms) The term "circadian" comes from the Latin circa, "around",
and diem or dies, "day", meaning literally "approximately one day" (Diaz-Morales &
Sorroche, 2008).
Differentiation- Differentiated instruction is a process to approach teaching and learning for
students of differing abilities in the same class. The intent of differentiating instruction is
to maximize each student‘s growth and individual success by meeting each student where
he or she is and assisting in the learning processes (Hall, Strangman, & Meyer, 2003).
Dropped Schedule- Schedule configuration in which students are scheduled for more classes than
class periods, with one class being dropped on any given day. This schedule provides
allotted times for advisory programs, electives, assemblies, and other curricular offerings
beyond core academic requirements (Hackman, 2010).
Morningness Eveningness- A term that refers to differences in adolescents‘ preference for
carrying out activities at a particular time of day. These differences can be attributed to

17
rhythmic variation of behavioral and biological patterns (Diaz-Morales & Sorroche,
2008).
Multiple Intelligences- A theory that suggests that there are eight basic types of intelligence. The
eight intelligences posited by Gardner are accepted in multiple intelligence theory are:
1. Spatial
2. Linguistic
3. Logical mathematical
4. Kinesthetic
5. Musical
6. Interpersonal
7. Intrapersonal
8. Naturalist (Gardner, 1999).
Neuroscience- A branch (as neurophysiology) of the life sciences that deals with the anatomy,
physiology, biochemistry, or molecular biology of nerves and nervous tissue and
especially with their relation to behavior and learning (Merriam-Webster,2009).
No Child Left Behind (NCLB) - A federal mandate that provides school choice, flexibility, and
accountability in order to lessen the achievement gap so that no child will be left behind
(United States Congress Public Law Print of 107-110, No Child Left Behind Act of
2001).
Response to Intervention- A strategy used by educators to identify students experiencing learning
problems such as learning disabilities while giving support to students not performing
well in the regular education classroom setting (Murawski & Hughes, 2009).

18
Rotating Schedule- Following a master schedule of all classes in sequence, classes are held at
different times each day by rotating the classes one period later each day. This process
enables students to have all subjects at various times of the day and can be implemented
by teams or by an entire school (Daniel, 2007).
Tennessee Comprehensive Assessment Program (TCAP) - The Achievement Test is a timed,
multiple choice assessment that measures skills in Reading, Language Arts,
Mathematics, Science, and Social Studies (Tennessee Department of Education, 2010).
This research is broken in to five chapters. Chapter One contains the statement of
problem and purpose. Chapter 2 is a review of related literature. Chapter 3 outlines the
methodology. Chapter 4 reports the analysis of data. Chapter 5 offers conclusions and
recommendations for practice and for further research.

19
CHAPTER 2
REVIEW OF LITERATURE
The review of literature was focused on student achievement and the role of the school
schedule. Literature on brain based research, scheduling models, circadian rhythms, and later
school start times proved beneficial in the role of scheduling students for success. The literature
pertaining to this study fell into two overlapping categories: (1) research into brain based
education and (2) research findings applying to scheduling students in a middle school setting.
Brain-Based Learning
The last decade of the 1900s has been characterized as the time when educators became
interested in brain-based education; researchers conducted and developed theories about its
application in the classroom (Bruer, 1999). Guild (1997) compared and contrasted established
models, multiple intelligence, and learning styles with brain based education as to the role of
both teacher and student. She reported on her observation of three different schools, each
applying a different model. Teachers planned and worked to implement their assigned theory.
Guild noted the striking similarities in the learning environment in each and stressed the fact that
no particular one has the answers to how every student learns. Each student has unique needs
and abilities that must be given consideration. She concluded each theory is distinctive. Each
recognizes the uniqueness of individuals and the differing ways information is assimilated. She
encouraged researchers to delve into learning theories to better understand the learner and the
learning process.
Public interest in brain-based learning evolved in the last decade of the 1900s due to
efforts of government as well educational and advocacy groups excited about reported advances
in brain research. Bruer (1999) reported on the findings (or lack of findings) of a select few
20
researchers who have delved into brain-based education and he effectively analyzed the
conclusions of each. Caine and Caine (1995) conducted research on the left hemisphere and
right hemisphere of the brain and suggested the relevance of each to learning. Bruer refuted their
findings ―the results of research on split brains and hemispheric specialization are inconclusive.
‗Both spheres are involved in all activities‘ . . . because the two hemispheres are connected in
normal healthy brains; they concluded that the brain processes parts and wholes simultaneously‖
(p. 9). There has been a false assumption that language instruction and social learning skills are
positively impacted by dual brain hemispheric concept; thus, educators should be aware that this
research provides no evidence of its value. Bruer cited the work of David Sousa and his
windows of opportunity. The window of opportunity idea has to do with the rapid acquisition of
new knowledge, abilities, and skills most children acquire between the ages of 2 and 11. That
which is mastered during this period serves as a basis to be built upon. Bruer concluded that
educators and teachers must be aware that none of the above theories of learning have been
established by neuroscience. ―Brain based educators have uncritically embraced neuroscientific
speculation. And where there is no scientific evidence, there is no scientific fact‖ (p.15).
Traditional teaching practices and theories on learning have changed little. The rightness or
wrongness of psychological research has not been evidenced by brain research. Traditional
theories come from ―cognitive and developmental psychology; from the behavioral, not the
biological sciences; from our scientific understanding of the mind, not from our scientific
understanding of the brain‖ (p. 3).
Caine and Caine (1995) provided details of a 3-year experiment in brain-based learning
theory, as teachers adapted and used the concept in a Rio Linda, California, elementary school,
grades K-6. The school, Dry Gap Elementary, had a large population of poor children. Because

21
of the low socioeconomic conditions, it was classified as a Title I school. Teachers and the
curriculum were traditional; materials were basically textbooks, videos, and movies used
occasionally. Teachers tended to teach as they had been taught; memorization and repetition
being the most commonly used instructional techniques. Quantitative data were secured by
testing. Traditional multiple choice and true-false tests were given to determine achievement.
Standardized test scores had not been good. There was a high student turnover rate. Discipline
issues were considered low by the teachers, enabling teachers to teach and students to learn. The
schedule was inflexible, learning time guided by a master schedule. Caine and Caine found
teachers, administrators, and the community bought into the brain-based learning theory as they
began to understand the significance of the undertaking. Teachers began to comprehend that
brain-based teaching and learning value overall student development academically and
socioculturally. Subject matter should be presented logically and meaningfully, patterning
content for enhanced learning. ―Brain based learning also stresses the principle that the brain is a
parallel processor--it performs many functions simultaneously . . . learning is complex and
nonlinear‖ (p. 3). Meaningful instructional resources should be used and students given time to
absorb and master the information.
Caine and Caine (1997) stated that the major objective of their program was to change
the attitudes of teachers and staff, to encourage creativity in planning, and to instill in them the
importance of using brain based teaching and learning for effective instruction. They reflected
that the most important change was found in teacher responses:
There‘s a feeling of excitement here . . . People are working with their colleagues,
sharing kids in their classes through peer tutoring, cross-age work, and study buddies.
We are not as isolated as we used to be. . . The process was often exhausting, but it was a
rich place to be an educator. The biggest change I see is that, yes, this is a community of
learners. It‘s moving from my class to our kids. (p. 6).
22
Once teachers understood the theories behind brain based research, they were more willing to
change the way in which they had previously taught.
Researchers such as physicians and scientists presented findings relative to brain based
learning. Weiss (2000) recounted relevant information. She discussed the intricacies of the brain
compared to the Internet. ―The brain‘s interconnections far exceed the Internet‘s by an
astronomical number. The brain has approximately 100 billion neurons, and each neuron has one
to 10,000 synaptic connections to other neurons‖ (p. 1). Weiss stated that normally the brain is
functional and orderly and each individual brain is unique. Parts of the brain are continually
sending output to other parts, all activity occurring within. Included was a discussion on topics
that must be noted by those interested in brain-based learning; namely, attention, contexts and
patterns, emotion, memory and recall, and motivation. Attention has to do with the process of
selecting and storing information into short-term memory. Irrelevant information is discarded.
The learning process is highly charged with emotion. Self-concept and basic human needs affect
how information is processed and stored. Students tend to have attention spans lasting from 90-
110 minutes followed by a drop in energy as well as attention to task. New facts are organized
into patterns and interpreted by the brain in context with that which is already known. Recall is
the ability to meaningfully activate what has been stored. High stress situations may interfere
with higher order thinking and creativity. Caine (as cited in Weiss, 2000) stated that motivation
is strongly affected by individual needs as well as cultural environment. Weiss also found that
research in the last decade of the 20st century proved to be valuable as educators began to
evaluate teaching and learning in relation to brain function. Some scientists found that
educational research on learning was different than that done on educational theory.

23
Strict state standards, established curricula with set benchmarks, and student progress
judged by adequate yearly progress (AYP) required by the No Child Left Behind Act (2002),
may not effectively or efficiently promote learning. Today‘s teaching methods are not brain
based. Neuroscientific research findings are ignored. Brain based teaching methods include
challenging learning activities with students well nourished, socially adjusted, and subjected to
regular physical exercise (Jenson, 2006).
Kaufman et al. (2008) conducted studies of brain research and revealed that the role of
the brain in the learning process has not been given enough consideration. Increased interest in
how the brain learns prompted more in-depth research studies in the 1990s. The authors cited the
work of various researchers who looked into areas of learning, particularly early neurological
research studies of Roberts (2002) and Sousa (2001) as their findings contributed to development
of learning theories. They noted the works of LeDoux (1994) who found a ―relationship between
emotions, memory and the brain‖ and Eden, van Meter, Rumsey, Woods, and Ziffird (1996) who
concluded that children learn to read by ―using auditory and visual areas of their brain to create
meaning‖ (p. 67). Again, Kaufman et al. are quoted, ―The field of brain based learning
encourages educators to capitalize on the associations the brain must make to create synaptic
connection and anchor learning through contextual experience‖ (p. 2).
Caine and Caine (as cited by Kaufman et al., 2008) were able to see the relevance of
applying brain based learning principles to educational practices. They began to work with
educators developing curriculum and instruction to best accommodate the learner. They stressed
the value of using these models of teaching and learning. Teachers should constantly be alert to
new research findings and introduce as well as share their impressions with colleagues. Kaufman
et al. cited the findings of Caine and Caine and others concluding from their research and

24
experience that ―great teaching involves three fundamental elements: Relaxed alertness:
Creating the optimal emotional climate for learning; Orchestrated immersion in complex
experience: Creating optimal opportunities for learning; and Active processing of experience:
Creating optimal ways to consolidate learning‖ (p. 4).
Willis (2007) was concerned with using brain-based teaching techniques to understand
the nature of learning. She wrote that modern technology enables the investigator to actually
watch the functions of the brain as it works. The electroencephalography (EEG) measures the
brain‘s electrical activity. Specific polyethylene terephthalate (PET) scans measure metabolic
activity and show glucose or oxygen use and blood flow. This technology shows patterns of
information as they move through the ―limbic system, and into memory storage regions‖ (p. 1).
This information is vital to brain-based memory research because it shows methods and
strategies that enhance or inhibit communication and processing. She spoke of dendrites as the
connecting cells between neurons. These cells serve as communicators and increase as more
information and skills are mastered. Learning leads to the growth of dendrites. Neurotrophins
(proteins) stimulate the growth of dendrites. The growth of neurotrophins is greatest during
childhood, and as more learning occurs, activity increases in regions where new learning occurs
and new memory form. Willis stated that children between the ages of 6 and 12 experience the
most growth in neurons and thus over a period of time if uninterrupted the brain becomes more
efficient. She elaborated:
Learning Promotes More Learning:
Engaging in the process of learning actually increases one‘s capacity to learn. Each time
a student participates in any endeavor, a certain number of neurons are activated. When
the action is repeated, such as in a follow-up science lab experiment, rehearsing a song,
or when the information is repeated in subsequent curriculum, these same neurons
respond again. The more time one repeats an action (e.g., practice) or recalls the
information, the more dendrites sprout to connect new memories to old, and the more
efficient the brain becomes in its ability to retrieve that memory or repeat the action. . . .

25
triggering the beginning of a sequence results in the remaining pieces falling into place.
This repetition-based sequencing allows you to do many daily activities almost without
having to think about them, such as touch-typing or driving a car. (p. 2)
Alternative Scheduling
Effective use of school time has been a concern of educators for generations. The
Carnegie Unit, developed in the late 1800s, featured a structured scheduling format. Fifty-minute
class periods were held daily. Subject matter areas were taught by teachers who were specialized
in that field. The Carnegie unit was commonly used until late in the 20th century (Schroth, 2010).
In 1958 J. Lloyd Trump in An Image of the Future proposed flexible unstructured classes
with large groups and independent study time. The format was used in some schools; however,
the plan failed. High school students were not able manage the unstructured environment
effectively. In the 1970s the Open School concept and fluid block scheduling were introduced.
Neither concept was deemed satisfactory (Schroth, 2010).
The zero period schedule was introduced in the late 1980s. An extra class period was
added at the beginning of the regular school day. Thus, students could elect to take more classes
or leave early. This ―flexible scheduling alternative . . . continues in popularity‖ (Scroth, 2010 p.
1).
In 1989 the Carnegie Council on Adolescent Development published Turning Points,
which stressed the importance of planning middle school schedules to accommodate adolescents‘
developmental needs. Interdisciplinary team teaching was a popular approach. In order to
implement these ideas, some middle schools changed to block scheduling and 90-minute class
periods. High schools later adopted the schedule. Four or five teachers worked with ―125 to 150
students, essentially creating a school within a school‖ (Schroth, 2010, p. 1). Schroth

26
commented, ―Throughout the history of school scheduling the need for flexibility and the need for
teachers to work cooperatively for the benefit of students are recurring themes‖ (p.1).
Daniel (2007) recognized the importance of flexibility in school scheduling. He
emphasized the value of planning the school day for effectiveness. As such, the instructional day
is not organized around fixed times for classes or other activities, day after day, yearly. Rather,
the day is planned to meet the needs of teachers and students. Daniel theorized that flexible
scheduling adapts to the creation of an environment that recognizes individuality. Teachers are
free to objectively present subject matter in a way that meets the needs of students. Direct
involvement enables teachers to better determine the amount of time needed for specific
activities. ―Flexible scheduling allows schools to optimize time, space, staff and facilities to add
variety to their curriculum offerings and teaching strategies‖ (Canady & Rettig, 1995, p. 1).
Daniel discussed four models of flexible scheduling that have reportedly been used in schools.
He began with block scheduling, commenting that interdisciplinary teams are better able to use
this model. The schedule is referred to as four-by-four block because the day is divided into four
sections and students take only four subjects during the first half of the year. Four different
subjects are taught in these blocks the second half of the year. Some variation may occur with
academic subjects having longer blocks and electives assigned shorter time blocks. Middle
schools may use a two-block arrangement; however, one block is scheduled in the morning and
one in the afternoon. Of the Alternate Day Schedule, Daniel explained the class model that has
often been referred to as an A B schedule. Classes are arranged on an every other day basis.
Core academic classes meet every day with subjects such as art, music, chorus, etc. able to meet
on alternate days. In some middle schools this schedule refers to students taking two core
academic classes (i.e., mathematics, science) one day and the other two core academic classes

27
(i.e., language arts, social studies) on the alternate day. With the Rotating Schedule model, as
the title implies, classes rotate daily. A daily schedule is set with all classes in sequence. Classes
rotate one period later each day until all have changed once. This process is then repeated. Each
student should have an opportune time for learning, if one time of day is better than another. The
Dropped Schedule model permits students to carry extra subjects, dropping one on any day to
attend assemblies, electives, meetings, etc. More classes are scheduled than time allotted. The
student may elect to alter his or her schedule to attend an activity. Daniel noted that there has
been little research on flexible scheduling in middle schools. However, he cited the findings of
one study comparing scores on standardized achievement tests in science and in language arts
with students enrolled in one of the other three scheduling models. The flexible schedule model
proved beneficial for students. Comparisons showed greater achievement in science and
language arts, with lower achieving students showing impressive gains.
Representatives of The National Middle School Association (1999) conducted research
on the use of flexible scheduling in middle schools in the 1990s. According to the findings,
relatively few schools were using anything other than standard seven instructional periods each
day. Selected exemplary middle schools reported use of some form of flexible scheduling.
Approximately three fourths indicated flexible scheduling was being used; however, it was not
fully developed. Other middle schools reported little or no use of flexible scheduling.
Hackman and Valentine (1998) discussed thought processes involved in developing a
workable middle school schedule. The importance of effective planning was emphasized.
Matters to be considered of relevance were attention to curriculum, materials to support the
curriculum, and a time and place for each scheduled activity. It was noted that utmost
consideration must be given the administration, students, teachers, staff, and parents. The authors

28
view scheduling as a tool to facilitate the school‘s goals and purposes with curriculum,
instruction, student grouping, and staffing given appropriate consideration. Hackman and
Valentine (1998) stressed that schedules be planned with consideration given to core academic
subjects, insuring mastery of basic skills as well as planning time for elective subjects such as
computer, art, music, and band. ―Additionally, the schedule should permit the use of such varied
instructional strategies as interdisciplinary instruction, cooperative learning, infusion of
technology, use of experiments, authentic assessments, active learning, independent study and
small or large group activities‖ (p. 4). The authors noted that flexibility is positive because it
allows teachers time to collaborate with others, express individual creativity, and use their
unique strengths to the advantage of students and staff. Further, teachers should be empowered
to objectively evaluate curriculum priorities and capitalize on learning opportunities that present
themselves. When planning a flexible schedule, systems are advised to look into the programs of
other schools. However, Hackman and Valentine suggested that the schools‘ flexible schedule
will probably be most successful if it is designed by its own teachers and staff with the student
population and their needs in mind.
No Child Left Behind, enacted in 2002, required the nation‘s school systems to adopt
procedures designed to raise achievement levels. According to the law, schools are to be held to
specific standards and accountable for the success or failure to meet those standards. Student
progress is noted by the compilation of data showing progress or lack of it. Adequate Yearly
Progress (AYP) becomes a measuring tool to show how well a student, and consequently a
school, is achieving its goals. Elmore (2000) expressed concern that proposed changes in
education emanate from sources far from the classroom. Suggested improvements come from
―national panels, formed by professional organizations or created by foundations, from the

29
media, and from politicians, who are advised by representatives of business and industry.
Occasionally, teachers are invited to the conversation‖ (p. 3).
Elmore (2010) stressed that earlier recommendations such as those in the Carnegie
Council on Adolescent Development Task Force‘s report Turning Points (1989) had been
misunderstood. Many had felt that teachers interpreted recommendations made by this missive
to mean that social and personal development was to be emphasized more than academic
achievement. He commented that teachers and school officials had not misinterpreted the
recommendations of Turning Points. Rather, he stated that Turning Points did stress academics
but not to the exclusion of social and personal issues. Elmore theorized that the middle school
curriculum should embrace an appropriate academic curriculum, wherein students are challenged
to analyze material critically. Excellent middle schools are structured to foster individual
responsibility and social equality.
Brown (2001) found that most middle schools had not changed from the traditional
schedule of 40 to 45 minute classes. He identified some middle schools that were using a 4x4
flexible schedule. He wanted to assess the value of this type of schedule as to its effect on
teachers‘ instructional behavior and students‘ learning needs and was interested in learning how
teachers perceived its effectiveness. Two middle schools in the middle Atlantic region of the
United States were selected to gather information and data. One of the schools was in a rural
area, with a total population 450 students containing seventh and eighth grades. The other
school was suburban with approximately 1,200 students in the sixth, seventh, and eighth grades.
The researcher asked for teachers to be interviewed and respond to 25 questions to determine
their perception of how the 4x4 block had impacted instructional practices and curricular
decisions and how students‘ learning had been affected. Ten teachers volunteered to be

30
interviewed, six from the suburban school and four from the rural school. The following
summation reflects teacher perceptions of the 4X4 block schedule.
Brown (2001) concluded that most teachers‘ perception of the flexible schedule was
positive. Nine of 10 teachers reported changing planned instructional procedures and techniques.
The extended time period allowed for more creative learning experiences, in depth study of
subject matter, and other topics. A wider variety of instructional strategies could be used. 9 of
the 10 teachers reported positive effects on student learning. Varying instructional strategies
allowed teachers to better address specific learning issues and to serve those with different
learning styles. One half of the teachers reported changes in the way they assessed student
progress. They reportedly used more ―essay and application type questions; different kinds [of
assessment]: visual, experiments, and more realistic evaluation with equipment to test laboratory
skills‖ (p. 9). These responses were considered to be favorable. However, the remaining five
teachers stated that there was no reason for changing the way they had previously conducted
students‘ assessment. Brown (2001) also concluded that flexible schedules were advantageous
for middle school students. Knowledge and understanding of the developmental level of students
was a primary concern.
Hackman (2010) noted content of the article is relevant today in that more schools are
changing from traditional scheduling to flexible styles. Changing the school schedule involves
strategic planning. Hackman presented guidelines to direct the initiation of an alternative
schedule. He emphasized that every stakeholder‘s ideas must be given consideration as well as
the responsibility of each clearly understood. Valid reasons for restructuring must be
incorporated into the process. Guidelines should include collaboration among those who must
understand and implement the transition process. Parents, community leaders, and those who

31
plan the school budget should be invited to attend planning sessions in order to develop an
understanding of scheduling alternatives, and, ultimately, on the evaluation of the schedule‘s
effectiveness. Effectiveness will be reflected in outcomes. ―The common consideration: What is
best for the students‖ (p. 3).
Circadian Rhythms
According to Callan (1998) circadian rhythms refer to the mental and physiological
changes that take place every 24 hours in most all organisms. Individuals differ within a species
in their preferences of which time they perform at their best. The Mayo Clinic (1995) has
identified more than 100 circadian rhythms that recur daily. These rhythms range on a scale
from one extreme to another. Morningness or morning people are those who perform at their
best during the morning hours while eveningness or evening people are those who perform best
in the evening hours (Callan, 1998). A person‘s morningness and eveningness, or ME, may be
measured by his or her temperature. Morning people tend to reach their peak temperature in the
morning hours, while their evening counterparts reach theirs in the evening (Kleitman, 1963).
Parents, teachers, and educational researchers have theorized that sufficient sleep is
needed if students are to do well academically. They recognized that students may not function
well the day after an activity had caused bedtime to be delayed. Researchers have conducted
studies to find the connection between sleep and school performance. In a clinical review on
sleep, Wolfson and Carskdon (2003) cited the work of researchers Terman and Hocking who
posed the question, ―What is the optimal amount of sleep for physical and mental efficiency?‖
(pp. 138-147). Investigators have assumed there are valid ways to study sleep and adequate
human performance. Conclusions drawn may be useful in further research studies; however,
most have been based on student experience rather than on experimentation. Meehl (1954)

32
reported in Clinical Versus Statistical Prediction (1954) ―experiences are inherently unreliable
measures of human behavior . . . clinical observations are hunches and not facts‖ (Wolfson &
Carskadon, p. 1). Meehl stressed the need for repetition of studies before validating data (p.2).
Wolfson and Carskadon (2003) emphasized the difficulty of measuring school
performance in relation to poor sleep habits. The relationship may be subjectively assumed and
data considered relevant based on ―inadequate appraisal of the phenomenon‖ (p. 2). Self-
reporting of sleep habits and grades may affect the reliability of data. Wolfson and Carskadon
reported on studies designed to secure, assess, and compile data.
Wolfson and Carskadon (2003) analyzed an abstract wherein 150 high school students
ages 15 to 18 were surveyed. The study was conducted by Link and Ancoli-Israel (1995).
Procedure involved students reporting their self wake schedules and grade averages. Subsequent
findings revealed students with a higher grade point average (3.5) were more alert during school,
slept better at night and got up later on school days, averaging 7.4 hours of sleep. Students with
lower grades were sleepy during the day, often needed daytime naps, and averaged 7 hours sleep
at night (p. 496).
Wolfson and Carskadon (2003) emphasized the difficulty of assessing data objectively
based on subjective appraisal. Self-reporting of sleep habits and grades may not be totally
reliable. Wolfson and Carskadon reported on studies designed to secure, assess, and compile
data. They analyzed a study conducted by Link and Ancoli-Israel. One hundred fifty high school
students ages 15 to 18 were surveyed. Results were presented in abstract form. Procedure
involved students reporting self wake schedules and grade averages. Further, Wolfson and
Carskadon cited a survey by Kahn and colleagues. Sleep wake patterns were examined in
relation to academic performance. Subjects of the study were ―972 older children and

33
preadolescents in Belgium. To secure data, parents completed questionnaires reporting sleep
patterns, the educational level of parents, ―children‘s daytime patterns and school achievement‖
(p. 496). In a later abstract Blum et al. (1990) summarized the data, concluding ―analysis
showed that the best predictors of school failure were the children‘s fatigue (operationalized as
difficulty to arouse in the morning and need for at least one daytime nap) as well as parents‘
educational level‖ (p. 496).
Wolfson and Carskadon (2003) cited a study by Hofman and Steenhof who questioned
some 600 high school students in Holland to find if there is connection between sleep patterns
and school performance. Students were surveyed to secure data. Analysis of data suggested that
better sleep quality did have an effect on grades and better school performance. Drugs, alcohol,
caffeine, and nicotine adversely affected grades (p. 496). Wolfson and Carskadon further cited
findings of Cortesi, Giannotti, Mezzalira, Bruni, and Ottaviano that have relevance in this
context. Cortesi et al. concluded that socioeconomic status did not affect student‘s sleep patterns;
however, students‘ from broken or not intact families ―had more irregular sleep patterns‖ (p.
707). The Wolfson and Carskadon cited Dornbusch who found ―Students with pure
authoritatively oriented parents reported the best grades and inconsistent parenting styles were
correlated with the lowest grades‖ (p. 501).
Environmental influences were found to be significant predictors of student success.
Those with different ethnic backgrounds and lower socioeconomic status tend to function better
in small community schools. They make better grades and attend more regularly. ―Community
SES predicted grades for both African American and Non-Hispanic white students as well‖
(Wolfson & Carskadon, p. 501). Highly skilled teachers, compensated with higher salaries,
working in well equipped facilities have a positive effect on student achievement.

34
Wolfson and Carskadon (2003) commended researchers who were able to show a
relationship between adolescents sleep-wake patterns and school performance. However, they
recommended that further large scale studies be conducted with clearly defined methods for
validating grades. Student self reporting of grades tended to be fairly accurate except for some
who do not achieve well. They tended to report better grades than they had made. Wolfson and
Carskadon suggested, ―Explicit operational definitions of school performance need to be
provided‖ (p. 504). Studies should ―gather longitudinal data across several weeks, months, as
well as years of school performance, behavioral, and sleep data‖ (p. 503).
Diaz-Morales and Sorroche (2008) investigated morningness eveningness as related to
differences in adolescents‘ preference for activities at a particular time of day. They reported
that these differences could be attributed to circadian rhythmic variations. Circadian rhythms
(i.e., body temperature, cortisol, or melatonin) reach maximum levels 1 to 3 hours earlier for
some people; thus, they may perform more efficiently at these times. Adolescents involved in
this study were ages 12 through 16. The writers cited research findings that suggest there is a
gradual change from morningness to eveningness as individuals mature. This change toward
eveningness was attributed to family and school demands as well as to pubertal development.
Diaz-Morales and Sorroche (2008) clearly stated that this study did not examine
scholastic achievement. They suggested that the findings were relevant to the scheduling of
classes. Students do better when they are performing at their preferred time of day, the time that
is best suited to their individual circadian rhythms. They are better able to concentrate and less
likely to become distracted.
Klein (2004) recognized the connection between biological rhythms, scholastic
performance, and school schedules. Research studies confirm the relation between the time of

35
day tasks are performed and learning achieved. Klein noted that educators have reported a
difference in students‘ reading skills level of achievement when classes were held at different
times of day. He attributed this phenomenon to the circadian cycle, biochemical and
physiological activity resulting in changes in human function. Klein called for additional
research to validate conclusions regarding changes in achievement and the time of day as well as
the subject matter being taught. He reported the findings of a study involving 850 middle school
students. Academic subjects requiring intensive reading such as literature and history were of
primary concern. The research was to identify hours when students felt more capable of
mastering the subject matter. During the study there was no lunch break, but the pupils were
given 5 to 10 minute recesses between lessons, one 20 minute snack, and an activity break at
10:00. Classes began at 08:00 a.m. and ended 14:30 p. m.
The findings of the Klein (2004) study supported the hypothesis that student learning
varies at different times of day. A chart showing scholastic achievement revealed that the first
period of the day (8-9) was characterized by low performance (registered at approximately 78
grade points). The 9 to 10 hour showed a slight increase; however, the 10 to 11 hour showed a
decrease, falling to approximately 73. The 11 to 12 hour registered the greatest increase in
academic achievement (80 points) followed by a decrease of 10 points in the next hour. During
the last hour of the day, student achievement showed an increase to almost that of the 11 to 12
hour.
Klein (2004) suggested that the decline in achievement during the 12 to 13 hour was due
to circadian rhythms not because of eating. Students had not had been served lunch. He remarked
that the specific biological processes responsible for this decline should be identified.
Differentiation in achievement indicated that competent students were able to achieve well
36
during the entire day. Their ability to adapt unique individual attributes allowed them to
overcome difficult situations. Less capable students did not have the personal tools to sustain
interest and concentration an entire day; thus, scholastic achievement declined. Weaker students
performed better earlier in the day. Those responsible for making the school schedule ―must take
in account the subjects in which classes perform best . . . which study hours are most effective
among pupils with different academic potentials . . . to schedule for the hours during which
attention in typically low and, conversely, the times that are conducive to high attention‖ (p. 9).
There is a continuous shift from morningness to eveningness as children move from
childhood to adolescent (Russo, Bruni, Lucidi, Ferri, & Violani, 2007). Russo et al. cited a
study conducted in 2003 by Gau and Soong that found children ages 9 to 11 had significantly
higher morning scores than those in the 11-14 age groups. Very little data have been collected to
determine primary school age students‘ sleep habits and sleep problems as they relate to sleep-
wake and circadian preference. Russo et al. conducted a study designed to investigate sleep
patterns, sleep related problems along with circadian preference. The study focused on children
from ages 8 to 14. The results of the study found that bed time for the majority of children
(59.2%) of this study was determined by the child. This percentage gradually rose as the age of
the child increased. As related to morningness and eveningness, the evening type children
showed sleep patterns that were more irregular than the morning type. According to the results
of the study:
…results indicate that the delay of sleep-wake cycle starts during preadolescence and our
trend analysis shows that bedtimes and rise times delay linearly with age during
weekends when: (a) there is a progressive decrease of parental control over bedtimes; and
(b) rise times are not constrained by the school schedule. (p. 167)
Changes in sleep patterns are generally attributed to greater social opportunities, higher levels of
academic responsibilities, and access to more extracurricular activities.

37
The morningness eveningness questionnaire was used to determine circadian preferences.
This scale ranged from 43 (extreme morning) to10 (extreme evening). The results revealed the
mean score for the sample was 28.2 with 95% confidence intervals. There was no significant
difference reported by gender in circadian preference.
Adolescents‘ circadian preference tends toward eveningness. An Australian study was
conducted to assess adolescent holiday and school term sleep patterns (Warner, Murray, &
Meyer, 2008). A time 1 survey (holiday) and a survey of time 2 (during school term) was
recorded. ―A self report survey adapted from the School Sleep Habits Survey (Wolfson &
Carskadon, 1998) was designed for the . . . study‖ (p. 597). Three hundred eighty senior high
school students from three metropolitan schools participated in Time 1, 310 students in Time 2.
Students were in grades 11 and 12, 15 to 18 years old. Time 1 students were 64% female and
36% male, 63% female and 37% male in Time 2. Students were asked to keep a sleep log to
―retrospectively record their bedtimes (BT) and wake times (WT) over the previous two weeks,
and the time they estimated that it took them to fall asleep‖ (p. 597).
Adolescent sleep times and patterns have been identified with mood swings, poor
performance in school, more accidents, and substance abuse. Others suggested that the quality of
sleep may result in poor daytime functioning. Warner et al. (2008) noted that no comparisons
had to date been examined between holiday and school term sleep patterns in relation to these
factors. This study was designed to do so. It was the:
hypotheses that at school time, students would obtain less sleep . . . accrue significant
sleep debts and exhibit more variability in sleep patterns during the week. . . .
individual circadian preference would impact negatively on the outcome variables of
mood, daytime functioning, and grades through its influence on sleep variables at school
time. (p. 297)

38
Warner et al. (2008) concluded from models compiled there was less variability in
students‘ holiday sleep times on weekdays and the weekend. Sleep time was recorded at 9 hours
and 12 minutes. School time students reported sleep debts because of early school start time an
earlier wake time was required. Structural models suggested there was a ―link between circadian
preference, sleep factors, mood, daytime functioning, and grades distinct from any influence of
sleep factors‖ (p. 605). Circadian preference did have an indirect outcome on sleep variables
during school time. Students reported difficulty in getting to sleep thus accruing sleep debt. Poor
sleep quality often resulted in poor daytime functioning, lower grades, lowered mood, daytime
sleepiness, and difficulty concentrating. Later school start times might prove advantageous for
all students, particularly those whose circadian preference is evening oriented.
This study was limited to a small group; however, a repetition with larger groups is needed to
validate findings.
Later School Start Times
Research conducted in the last 2 decades related to education and school scheduling has
prompted many school districts to reevaluate start times for adolescent age students (Wahlstrom,
2002). Early 1990 brain research coupled with sleep research and circadian rhythm studies
prompted researchers such as Wahlstrom to conduct longitudinal studies. Based on studies
which found teenagers‘ sleep patterns are significantly different from both adults and
preadolescents, the Minneapolis Public School District shifted the start time for schools in 1997.
This was the subject of Wahlstrom‘s longitudinal quantitative study.
Several significant findings came from the Wahlstrom study. The biggest beneficiaries
of this change were students (Wahlstrom, 2002). Attendance rates for students, who were
continuously enrolled rose during the 3-year time of the study. This was especially important for

39
administrators who were concerned about their at-risk students. There was a slight increase in
teacher given grades; however, the increase was not considered significant. Another important
result of the study was the integration of the medical community and education. This gave
credibility to the biological differences of students as well as brought to the forefront previous
studies on circadian cycles conducted in Brazil, Italy, and Israel. ―Good policy decisions are
made with good data. The data from the Minneapolis study, combined with current knowledge
of physiology of adolescent maturation and brain development, give some clear markers to
districts concerned with the overall well being of their teenage students‖ (Wahlstrom, p. 20).
Bronson (2007) reported in New York Magazine that it is believed that lost sleep has an
exponential impact on children. This is because a child‘s brain is a work in progress, and much
of the development of the brain takes place while one is asleep.
Sleep patterns continuously shift throughout one‘s life as one moves from childhood
through adolescence to adulthood (Carskadon, Wolfson, Acebo, Tzischinsky, & Seifer, 1998).
Social responsibilities such as extracurricular activities and enhanced peer pressure coupled with
more rigorous academic challenges force many high school students to bed at later times. In
self-reports adolescents stay up later at night than preteens and do not have an early spontaneous
wakefulness. The change in responsibilities and academics may not be the sole reason for
teenage late sleep patterns. Circadian rhythm of individuals also changes as one evolves from
childhood to adolescence. Therefore, many teenagers‘ biological makeup may determine their
sleep patterns. ―Evidence in support of this second hypothesis comes from correlation of self
reports of pubertal development and circadian phase preference, and –more strongly -from a
correlation of physical measurements of puberty with the offset phase of melatonin secretion
measured in a constant routine‖ (p. 872). This information is in direct opposition to many
40
school systems‘ schedule that starts high schools earlier than elementary and middle schools.
Circadian rhythm is the mechanism that controls the sleep patterns of individuals. This
mechanism is thought to dictate rapid eye movement (REM) sleep as well as the timing of sleep
and alertness.
Carskadon et al. (1998) conducted a study to examine the sleep patterns of adolescents
and early school start times. This study evaluated twenty-five 9th
and 10th
grade students through
both self-reporting as well as saliva samples taken during the evening hours to determine dim
light salivary melatonin onset phase (DLSMO). The self-reporting phase of the study was
conducted at the individual student‘s home under normal conditions during the week. The
DLSMO portion of the study was conducted in a laboratory setting and was based on school
night sleep patterns.
The results of this study indicated that students woke earlier on school days; however,
they did not change the time in which they fell asleep. This results in less time for sleep in
adolescents who require 9 hours of sleep to perform at their optimal alertness (Carskadon et al.
1998). Further, the study showed a delay of the onset of melatonin secretion in early morning
start times. This was not the predicted outcome that presumes that earlier start times extend
early morning lighting. The study concluded that early school start times in adolescents led to
sleep deprivation and limits their ability to adjust to early school start times.
High school and middle school start times are determined by a variety of reasons. These
include but are not limited to economic background of the students, number of bus tiers, and
school size (Wolfson & Carskadon, 2005). The writers investigated the earlier start times on
student performance. The study indicated those students who were required to begin school at
earlier times (7:20) than students with a later school start time (8:25) fell asleep later and showed

41
atypical sleep patterns. ―These findings were attributed to the combination of too little sleep
occurring at a time mismatched to internal circadian rhythms‖ (p. 48). The results indicated in
the 15-year period of the study showed that little change had taken place in middle and high
school start times. The majority of schools reported that administrators had neither changed nor
expressed any interest in changing the schools‘ start times.
Studies have been conducted in the last 15 years concerning the relationship of
adolescent sleep patterns and school start time. Researchers repeatedly find that the sleep
patterns for adolescent children are different from those of both preadolescents and adults
(Hansen, Janssen, Schiff, Zee, & Dubocovich, 2005). In a survey conducted with 12 to 15 year
old students, early school start times coupled with delayed circadian sleep phase has been linked
to rebelliousness, inattentive behaviors, and moodiness. The report also stated there was
considerable sleep debt during the week due to early school start times. Students‘ sleep
schedules were markedly different during the weekday when compared to weekends. This
indicates that students are making up for lost sleep debt experienced throughout the week.
Hansen et al. (2005) also pointed out that there is a strong relationship between a
student‘s circadian clock and light. Their study examined the impact of sleep loss on
neurocognitive performance and mood, examined the relationship between weekday sleep
patterns and weekend sleep patterns, and tested whether early morning light treatments could
improve academic performance as well as mood and health. The study consisted of 60 incoming
high school advanced performing students. The students were to keep sleep diaries beginning in
August through the first 2 weeks of September and the months of November and February. A
white light treatment in early morning classes was administered to 19 of the students. These
treatments were given during the last 2 weeks of November as well as the last 2weeks of
42
February. The students were tested by computer for neuropsychological performance while
pencil paper tests were used to measure mood and vigor.
There were several conclusions reached from the Hansen et al. (2005) study. The study
supported previous studies indicating that adolescents‘ intrinsic sleep cycle needs are not being
met by many school districts‘ early start times. Further, it was determined in this study that
students lost as much as 120 minutes during the week and the weekend sleep cycle was
considerably longer to compensate for this sleep debt. Although the light treatment did not offset
the lack of sleep during the night, as evidenced by the test results. . . ―light administration might
still be the most straightforward intervention to affect adolescent sleep cycles‖ (p. 6). Further
recommendations of this study were a change in school start times as well as educating students,
parents and, teachers in the importance of adolescent sleep cycles.
Summary
Brain-based educational theory is predicated on neuroscience. The brain performs many
functions at the same time. Interconnections send information to other areas continually. Brain
based curriculum and classroom strategies stress the importance of student academic
achievement and social development as well as emotional and physical health. The circadian
rhythm continuum begins with morningness and tends to drastically change to eveningness with
the onset of puberty. Studies show a link between circadian preference and academic
performance. Traditionally, schedules have not recognized circadian preferences.
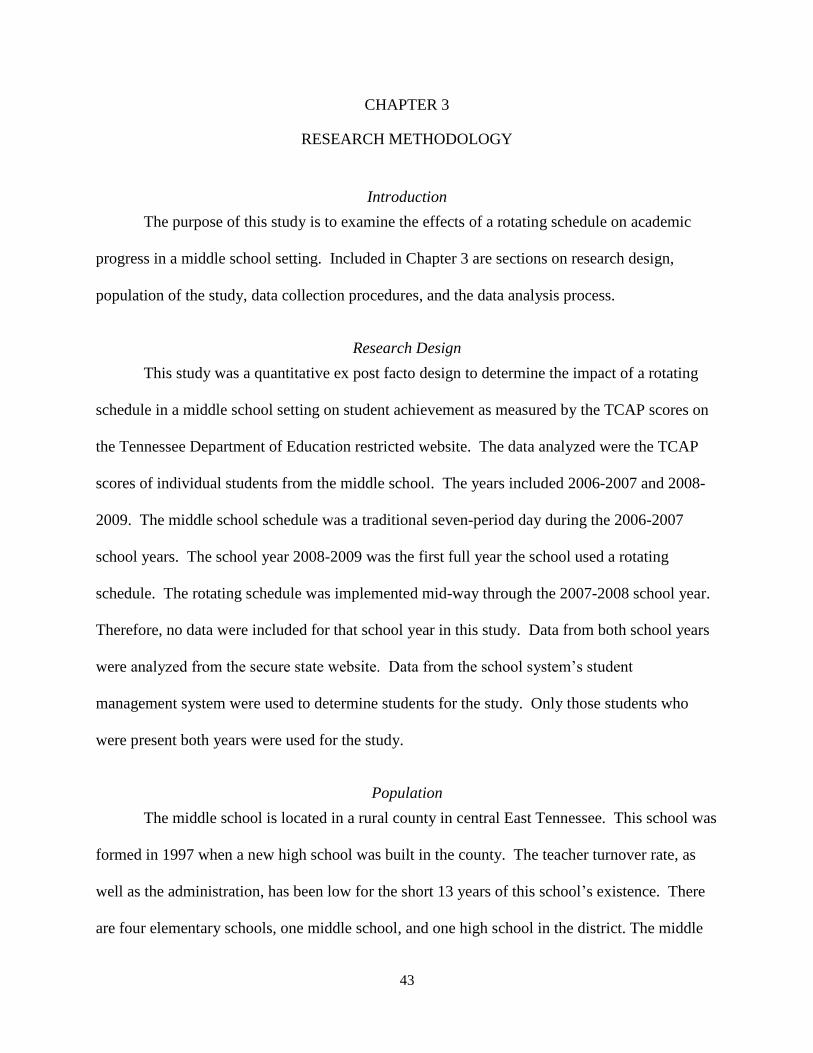
43
CHAPTER 3
RESEARCH METHODOLOGY
Introduction
The purpose of this study is to examine the effects of a rotating schedule on academic
progress in a middle school setting. Included in Chapter 3 are sections on research design,
population of the study, data collection procedures, and the data analysis process.
Research Design
This study was a quantitative ex post facto design to determine the impact of a rotating
schedule in a middle school setting on student achievement as measured by the TCAP scores on
the Tennessee Department of Education restricted website. The data analyzed were the TCAP
scores of individual students from the middle school. The years included 2006-2007 and 2008-
2009. The middle school schedule was a traditional seven-period day during the 2006-2007
school years. The school year 2008-2009 was the first full year the school used a rotating
schedule. The rotating schedule was implemented mid-way through the 2007-2008 school year.
Therefore, no data were included for that school year in this study. Data from both school years
were analyzed from the secure state website. Data from the school system‘s student
management system were used to determine students for the study. Only those students who
were present both years were used for the study.
Population
The middle school is located in a rural county in central East Tennessee. This school was
formed in 1997 when a new high school was built in the county. The teacher turnover rate, as
well as the administration, has been low for the short 13 years of this school‘s existence. There
are four elementary schools, one middle school, and one high school in the district. The middle

44
school served every 6 through 8th
grade student who attends public school in the county. The
school system population for the year of the study was approximately 3,000. The middle school
population was 685 while the cohort population was 235. The free and reduced lunch rate was
65% and the school was 99.9% white. The percentage of students who had an IEP was 18%.
The subgroups that counted towards AYP consisted of gender, socioeconomically disadvantaged,
and special education. This study involves only those students who were in enrolled and tested
in both school years. All students who were in the cohort during the sixth grade and eighth grade
years 2006-2009 will be calculated in the study.
Data Collection Procedures
After receiving permission from East Tennessee State University‘s Institutional Review
Board, all data were collected. After receiving the IRB permission, written consent was secured
from the school system in which the school is located. The data were obtained through the
states‘ TCAP report. The school system‘s technology department compiled all student and
TCAP data in an excel spreadsheet format and presented it to me with only alpha numerical
identifiers representing student names.
Data Analysis
This study was guided by the following two research questions and the null hypothesis
that correlate to those questions.
1. Is there a significant difference in TCAP mathematic scores before and after
implementation of a rotating schedule?
A series of independent t test for independent samples were used to test the following null
hypotheses:

45
Ho11: There is no significant difference in mathematics TCAP scores of low
socioeconomic status students before and after instituting a rotating schedule.
Ho12 There is no significant difference in mathematics TCAP scores of students with an
IEP before and after instituting a rotating schedule.
Ho13: There is no significant difference in mathematics TCAP scores of male students
before and after instituting a rotating schedule.
Ho14: There is no significant difference in mathematics TCAP scores of female students
before and after instituting a rotating schedule.
2. Is there a significant difference in TCAP reading-language art scores before and after
implementation of a rotating schedule?
A series of independent t tests for independent samples were used to test the following null
hypothesis:
Ho21: There is no significant difference in reading-language arts TCAP scores of low
socioeconomic status students before and after instituting a rotating schedule.
Ho22 There is no significant difference in reading-language arts TCAP scores of students
with an IEP before and after instituting a rotating schedule.
Ho23: There is no significant difference in reading-language arts TCAP scores of male
students before and after instituting a rotating schedule.
Ho24: There is no significant difference in reading-language arts TCAP scores of female
students before and after instituting a rotating schedule.
Data were analyzed using the Statistical Package for the Social Sciences (SPSS) software. The
findings were tested at the .05 level of significance. Because of the number of null hypothesis,

46
the Bonferroni adjustment procedure was employed. Therefore, the actual level of significance
was .05 divided by the number of null hypotheses or .00625

47
CHAPTER 4
DATA ANALYSIS
The purpose of this quantitative ex post facto study was to determine if a rotating style
schedule had any impact on student achievement in the areas of mathematics and reading-
language arts. The subgroups examined in this study included the following: low socioeconomic
students, students with disability, male, and female. Archival data from the secured state of
Tennessee TVAAS system as well as the school system‘s student data management system were
used to collect data for this study.
Descriptive Statistics
Data were collected for those students who were enrolled the sixth grade, 2006-2007
school year and for the same students in the eighth grade in 2008-2009. Only the data for those
students who were continuously enrolled and tested both years were included in this study. The
cohort consisted of 158 students meeting these criteria. Data for low socioeconomic students
and students with disabilities were secured from relevant information on record from the 2006-
2007 school terms. Both free and reduced lunch students were included in the count for the low
socioeconomic category. The students‘ normal curve equivalence (NCE) scores were used from
both the sixth and eighth grade years. Differences in the two scores indicate growth or lack of
progress from one year to the next.
The low socioeconomic students accounted for 78.5% of the cohort in this study. This
percent represents 124 students of the 158 in the group. Sixth grade mathematics scores ranged
from 1 to 91 with a mean score of a mean score of 52.60. The eighth grade math scores ranged
from 8 to 86 with a mean score of 49.72. The sixth grade reading-language arts NCE scores
ranged from 1 to 87 with a mean score of 48.62. Eighth grade reading-language arts NCE scores

48
ranged from 1 to 95 with a mean score of 49.85. Table 1 shows the paired NCE mean sample
statistics in mathematics for low socioeconomic students. Table 2 shows the paired NCE mean
sample statistics in reading-language arts for low socioeconomic students.
Table 1
Paired NCE mean sample statistics in mathematics for low socioeconomic students
MEAN N Std.
Deviation
Std. Error
Mean
8th Grade Math 49.72 124 16.76 1.50
6th Grade Math 52.60 124 18.52 1.66
Table 2
Paired NCE mean sample statistics in reading-language arts for low socioeconomic students
MEAN N Std.
Deviation
Std. Error
Mean
8th Grade Reading-
Language Arts 49.85 124 18.20 1.63
6th Grade Reading-
Language Arts 48.62 124 21.25 1.91
Those students with an individual education plan (IEP) accounted for 13.3% of the cohort
in this study. This percent represents 21 of the 158 students from the group. Sixth grade NCE
scores for students with an IEP in mathematics ranged from 1 to 63 and the mean score was
25.76. These students‘ eighth grade NCE scores ranged from 8 to 64 with a mean score of 27.95.
The sixth grade reading-language arts NCE scores ranged from 1 to 67 with a mean score of

49
25.81. The eighth grade NCE scores for reading-language arts ranged from 1 to 76 with a mean
score of 28.57. Table 3 shows the paired NCE mean sample statistics in mathematics for students
with an IEP. Table 4 shows the paired NCE mean sample statistics in reading-language arts for
students with an IEP.
Table 3
Paired NCE mean sample statistics in mathematics for students with an IEP
MEAN N Std.
Deviation
Std. Error
Mean
Math 8th Grade 27.95 21 14.85 3.24
Math 6th Grade 25.76 21 17.36 3.79
Table 4
Paired NCE mean sample statistics in reading-language arts for students with an IEP
MEAN N Std.
Deviation
Std. Error
Mean
8th Grade Reading-
Language Arts 28.57 21 18.25 3.98
6th Grade Reading-
Language Arts 25.81 21 17.87 3.90
The male students made up 38% of this cohort. This percent equates to 60 of the 158
students in this study. The male student‘s sixth grade NCE score for mathematics ranged from 1
to 86 with a mean score of 50.27. Their eighth grade NCE scores ranged from 8 to 86 with a
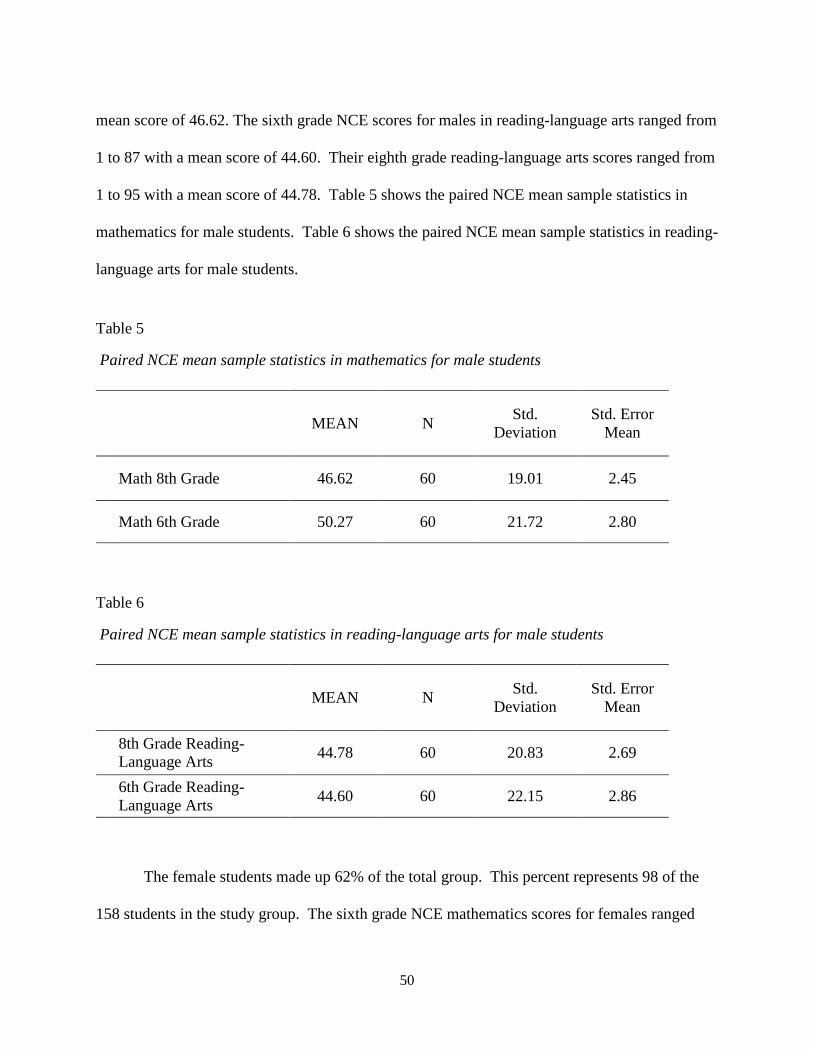
50
mean score of 46.62. The sixth grade NCE scores for males in reading-language arts ranged from
1 to 87 with a mean score of 44.60. Their eighth grade reading-language arts scores ranged from
1 to 95 with a mean score of 44.78. Table 5 shows the paired NCE mean sample statistics in
mathematics for male students. Table 6 shows the paired NCE mean sample statistics in reading-
language arts for male students.
Table 5
Paired NCE mean sample statistics in mathematics for male students
MEAN N Std.
Deviation
Std. Error
Mean
Math 8th Grade 46.62 60 19.01 2.45
Math 6th Grade 50.27 60 21.72 2.80
Table 6
Paired NCE mean sample statistics in reading-language arts for male students
MEAN N Std.
Deviation
Std. Error
Mean
8th Grade Reading-
Language Arts 44.78 60 20.83 2.69
6th Grade Reading-
Language Arts 44.60 60 22.15 2.86
The female students made up 62% of the total group. This percent represents 98 of the
158 students in the study group. The sixth grade NCE mathematics scores for females ranged

51
from 5 to 91 with a mean score of 51.30. Their eighth grade NCE mathematics scores ranged
from 13 to 86 with a mean score of 49.20. The sixth grade reading-language arts NCE scores for
females ranged from 1 to 92 with a mean score of 49.06. The eighth grade reading-language arts
NCE scores ranged from 9 to 95 with a mean score of 51.04. Table 7 shows the paired NCE
mean sample statistics in mathematics for female students. Table 8 shows the paired NCE
sample statistics in reading-language arts for female students.
Table 7
Paired NCE mean sample statistics in mathematics for female students
MEAN N Std.
Deviation
Std. Error
Mean
Math 8th Grade 49.20 98 15.26 1.54
Math 6th Grade 51.30 98 16.85 1.70
Table 8
Paired NCE sample statistics in reading-language arts for female students
MEAN N Std.
Deviation
Std. Error
Mean
8th Grade Reading-
Language Arts 51.04 98 16.55 1.67
6th Grade Reading-
Language Arts 49.06 98 20.30 2.05
52
Analysis of Research Questions
Research Question 1
Is there a significant difference in TCAP mathematics scores before and after
implementation of a rotating schedule?
Ho11: There is no significant difference in mathematics TCAP scores of low
socioeconomic status students before and after instituting a rotating schedule.
For students of low socioeconomic status an independent t test was conducted to evaluate
whether there was a difference in the TCAP mathematics scores before (sixth grade scores) and
after (eighth grade scores) instituting a rotating schedule. The independent t test was significant, t
(123) = 3.604, p < .001. Therefore, the null hypothesis was rejected. The TCAP mathematics
mean after instituting a rotating schedule (M = 49.72, SD = 16.76) was almost three points lower
than the TCAP mathematics mean prior to the implementation of a rotating schedule (M = 52.60,
SD = 18.52), which is a significant difference. The effect size as measured by η2 was medium
(.10). The 95% confidence interval for the difference between the two means was 4.46 to 1.30.
Figure 1 shows the box plots of lower socioeconomic students‘ TCAP mathematics scores before
(sixth grade) and after (eighth grade) the implementation of a rotating schedule.

53
Figure 1. Low socioeconomic students‘ math scores
Ho12: There is no significant difference in mathematics TCAP scores of students with an
IEP before and after instituting a rotating schedule.
For students with an Individual Education Plan an independent t test was conducted to
evaluate whether there was a difference in the TCAP mathematics scores before (sixth grade
scores) and after (eighth grade scores) instituting a rotating schedule. The independent t test was
not significant, t (20) = 1.200, p = .244, ns. Therefore, the null hypothesis was not rejected. The
TCAP mathematics mean after instituting a rotating schedule (M = 27.95, SD = 14.85) was over
two points higher than the TCAP mathematics mean prior to the implementation of a rotating
schedule (M = 25.76, SD = 17.36), which is not a significant difference. The effect size as
measured by η2 was medium (.07). The 95% confidence interval for the difference between the
two means was 1.62 to 6.00. Figure 2 shows the box plots of IEP students‘ TCAP mathematics
scores before (sixth grade) and after (eighth grade) the implementation of a rotating schedule.
124 124 N =
ο = an observation between 1.5 times to 3.0 times the interquartile range
8th Grade Math 6th Grade Math
100
80
60
40
20
0
-20

54
Figure 2. Students with an IEP‘s math scores
Ho13: There is no significant difference in mathematics TCAP scores of male students
before and after instituting a rotating schedule.
For male students an independent t test was conducted to evaluate whether there was a
difference in the TCAP mathematics scores before (sixth grade scores) and after (eighth grade
scores) instituting a rotating schedule. The independent t test was significant, t (59) = 3.216, p =
.002. Therefore, the null hypothesis was rejected. The TCAP mathematics mean after instituting
a rotating schedule (M = 46.62, SD = 19.01) was almost four points lower than the TCAP
mathematics mean prior to the implementation of a rotating schedule (M = 50.27, SD = 21.72),
which is a significant difference. The effect size as measured by η2 was large (.15). The 95%
confidence interval for the difference between the two means was 5.92 to 1.38. Figure 3 shows
the box plots of male students‘ TCAP mathematics scores before (sixth grade) and after (eighth
grade) the implementation of a rotating schedule.
21 21 N =
ο = an observation between 1.5 times to 3.0 times the interquartile range
* = an observation which is more than 3.0 times the interquartile range
8th Grade Math 6th Grade Math
70
60
50
40
30
20
10
0
-10

55
Figure 3. Male student‘s math scores
Ho14: There is no significant difference in mathematics TCAP scores of female students
before and after instituting a rotating schedule.
For female students an independent t test was conducted to evaluate whether there was a
difference in the TCAP mathematics scores before (sixth grade scores) and after (eighth grade
scores) instituting a rotating schedule. The independent t test was not significant, t (97) = 2.138, p
= .035. Therefore, the null hypothesis was not rejected. The TCAP mathematics mean after
instituting a rotating schedule (M = 49.20, SD = 15.26) was almost two points lower than the
TCAP mathematics mean prior to the implementation of a rotating schedule (M = 51.30, SD =
16.85). The effect size as measured by η2 was small (.05). The 95% confidence interval for the
difference between the two means was 4.03 to .15. Figure 4 shows the box plots of female
60 60 N =
8th Grade Math 6th Grade Math
100
80
60
40
20
0
-20

56
students‘ TCAP mathematics scores before (sixth grade) and after (eighth grade) the
implementation of a rotating schedule.
Figure 4. Female student‘s math scores
Research Question 2
Is there a significant difference in TCAP reading-language arts scores before and after
implementation of a rotating schedule?
Ho21: There is no significant difference in reading-language arts TCAP scores of low
socioeconomic status students before and after instituting a rotating schedule.
For students of low socioeconomic status an independent t test was conducted to evaluate
whether there a difference in the TCAP reading-language arts scores before (sixth grade scores)
and after (eighth grade scores) instituting a rotating schedule. The independent t test was not
98 98 N =
ο = an observation between 1.5 times to 3.0 times the
interquartile range
8th Grade Math 6th Grade Math
100
80
60
40
20
0
-20

57
significant, t (123) = 1.110, p = .269. Therefore, the null hypothesis was not rejected. The TCAP
reading-language arts mean after instituting a rotating schedule (M = 49.85, SD = 18.20) was just
over one point higher than the TCAP reading-language arts mean prior to the implementation of
a rotating schedule (M = 48.62, SD = 21.25), which is not a significant difference. The effect
size as measured by η2 was small (.01). The 95% confidence interval for the difference between
the two means was.97 to 3.44. Figure 5 shows the box plots of lower socioeconomic students‘
TCAP reading-language arts scores before (sixth grade) and after (eighth grade) the
implementation of a rotating schedule.
Figure 5. Low socioeconomic students‘ reading-language arts scores
Ho22: There is no significant difference in reading-language arts TCAP scores of
students with an IEP before and after instituting a rotating schedule.
124 124 N =
8th Grade Reading 6th Grade Reading
120
100
80
60
40
20
0
-20

58
For students with an Individual Education Plan an independent t test was conducted to
evaluate whether there was a difference in the TCAP reading-language arts scores before (sixth
grade scores) and after (eighth grade scores) instituting a rotating schedule. The independent t test
was not significant, t (20) = 1.376, p = .184. Therefore, the null hypothesis was not rejected. The
TCAP reading-language arts mean after instituting a rotating schedule (M = 28.57, SD = 18.25)
was just under three points higher than the TCAP reading-language arts mean prior to the
implementation of a rotating schedule (M = 25.81, SD = 17.87) which is not a significant
difference. The effect size as measured by η2 was medium (.09). The 95% confidence interval
for the difference between the two means was 1.42 to 6.95. Figure 6 shows the box plots of
lower socioeconomic students‘ TCAP reading-language arts scores before (sixth grade) and after
(eighth grade) the implementation of a rotating schedule.
Figure 6. Students with an IEP‘s reading-language arts scores
21 21 N =
ο = an observation between 1.5 times to 3.0 times the interquartile range
8th Grade Reading 6th Grade Reading
100
80
60
40
20
0
-20

59
Ho23: There is no significant difference in reading-language arts TCAP scores of male
students before and after instituting a rotating schedule.
For male students an independent t test was conducted to evaluate whether there was a
difference in the TCAP reading-language arts scores before (sixth grade scores) and after (eighth
grade scores) instituting a rotating schedule. The independent t test was not significant, t (59) =
.122, p = .903. Therefore, the null hypothesis was not rejected. The TCAP reading-language arts
mean after instituting a rotating schedule (M = 44.78, SD = 20.83) was just slightly higher than
the TCAP reading-language arts mean prior to the implementation of a rotating schedule (M =
44.60, SD = 22.15), which is not a significant difference. The effect size as measured by η2 was
small (<.01). The 95% confidence interval for the difference between the two means was 2.81 to
3.18. Figure 7 shows the box plots of male students‘ TCAP reading-language arts scores before
(sixth grade) and after (eighth grade) the implementation of a rotating schedule.
Figure 7. Male student‘s reading-language arts scores
60 60 N =
ο = an observation between 1.5 times to 3.0 times the interquartile range
8th Grade Reading 6th Grade Reading
120
100
80
60
40
20
0
-20

60
Ho24: There is no significant difference in reading-language arts TCAP scores of female
students before and after instituting a rotating schedule.
For female students an independent t test was conducted to evaluate whether there was a
difference in the TCAP reading-language arts scores before (sixth grade scores) and after (eighth
grade scores) instituting a rotating schedule. The independent t test was not significant, t (97) =
1.482, p = .142. Therefore, the null hypothesis was not rejected. The TCAP reading-language
arts mean after instituting a rotating schedule (M = 51.04, SD = 16.55) was almost two points
higher than the TCAP reading-language arts mean prior to the implementation of a rotating
schedule (M = 49.06, SD = 20.30), which is not a significant difference. The effect size as
measured by η2 was small (.02). The 95% confidence interval for the difference between the two
means was.67to 4.63. Figure 8 shows the box plots of female students‘ TCAP reading-language
arts scores before (sixth grade) and after (eighth grade) the implementation of a rotating
schedule. Table 9 shows the effect size for the hypothesis in each subgroup and subject.

61
Figure 8. Female student‘s reading-language arts scores
98 98 N =
8th Grade Reading 6th Grade Reading
120
100
80
60
40
20
0
-20

62
Table 9
Effect size for hypotheses
Hypothesis for: Paired t was Higher
mean
Eta2 effect size
(η2)
Interpretation
Low SES Math significant 6th
grade .095 (.10) medium
Low SES Reading-Lang Arts Not
significant
8th
grade .010 (.01) small
Special Education Students Math Not
significant
8th
grade .067 (.07) medium
Special Education Students
Reading-Lang Arts
Not
significant
8th
grade .086 (.09) medium
Males Math Significant 6th
grade .149 (.15) large
Males Reading-Lang Arts Not
significant
8th
grade <.001 (<.01) small
Females Math Significant 6th
grade .045 (.05) small
Females reading-language arts Not
significant
8th
grade .022 (.02) small
The data presented in chapter 4 give a breakdown of the four subgroups which are
represented in a rural East Tennessee middle school. The subgroups in this study are low
socioeconomic students, students with an individual education plan, male students, and female
students. Information in this chapter gives some insight into the effectiveness of this middle
school‘s schedule as it relates to student achievement. The figures present a representation of
how students in the various subgroups progressed from sixth grade to eighth grade while using a
rotating schedule. The tables offer information about the mean, standard deviation, and number

63
tested. The final table offers information from each subgroup and subject concerning the
significance of the test as well as the interpretation of the groups.

64
CHAPTER 5
SUMMARY, FINDINGS, CONCLUSIONS, AND RECOMMENDATIONS
The purpose of this study was to determine if a rotating schedule impacted student
achievement. Subgroups examined in this study included low socioeconomic students, students
with an IEP, as well as male and female students. Student achievement was determined by gains
or loss over a 3-year period in the normal curve equivalence in mathematics and reading-
language arts Tennessee Comprehensive Assessment Program (TCAP) test administered at the
end of each school year. Normal curve equivalence (NCE) scores were gathered from the 2006-
2007 sixth grade students beginning their school year and their eighth grade 2008-2009 school
year. Only those students who were continuously enrolled and tested both years were included
in this study. The student‘s sixth grade year was used as a baseline when considering placement
in the low socioeconomic and students with an IEP categories. Data were analyzed on both the
sixth grade and eighth grade years to determine student growth. Data were collected from both
the student data management system and the Tennessee Department of Education secure TVAAS
website.
Summary of the Study
The impact of a rotating schedule in a middle school setting on student achievement on
subgroups (low socioeconomic students, students with an IEP, male and female students) was
examined in this study. Two research questions for each of the four subgroups were used. A
series of independent t test were conducted to evaluate whether there was a difference in the
TCAP scores before (sixth grade scores) and after (eighth grade scores) instituting a rotating
schedule. Mathematics and reading-language arts scores were used to determine student success.

65
Summary of Findings
The statistical analysis centered on two research questions on each of the four sub-
groups. Those two questions are presented below.
Research Question 1
Is there a significant difference in TCAP mathematics scores before and after
implementation of a rotating schedule?
An independent t test was conducted to evaluate whether there was a difference for
students of low socioeconomic status in the TCAP mathematics scores before (sixth grade
scores) and after (eighth grade scores) instituting a rotating schedule. There was a significant
relationship between a rotating schedule and student achievement. The TCAP mathematics
mean for low socioeconomic students after instituting a rotating schedule was 49.72 compared to
a mean of 52.60 before instituting the rotating schedule. The results were a loss of over two
points.
An independent t test was conducted to evaluate whether there was a difference for
students with an IEP in the TCAP mathematics scores before (sixth grade scores) and after
(eighth grade scores) instituting a rotating schedule. There was not a significant relationship
between a rotating schedule and student achievement. The TCAP mathematics mean for
students with an IEP after instituting a rotating schedule was 27.95 compared to a mean of 25.76
before instituting the rotating schedule. The results were a gain of over two points.
An independent t test was conducted to evaluate whether there was a difference for male
students in the TCAP mathematics scores before (sixth grade scores) and after (eighth grade
scores) instituting a rotating schedule. There was a significant relationship between a rotating
schedule and student achievement. The TCAP mathematics mean for male students after

66
instituting a rotating schedule was 46.62 compared to a mean of 50.27 before instituting the
rotating schedule. The results were a loss of over three points.
An independent t test was conducted to evaluate whether there was a difference for female
students in the TCAP mathematics scores before (sixth grade scores) and after (eighth grade
scores) instituting a rotating schedule. There was a significant relationship between a rotating
schedule and student achievement. The TCAP mathematics mean for female students with an
IEP after instituting a rotating schedule was 49.20 compared to a mean of 51.30 before
instituting the rotating schedule. The results were a loss of over one point.
Research Question 2
Is there a significant difference in TCAP reading-language arts scores before and after
implementation of a rotating schedule?
An independent t test was conducted to evaluate whether there was a difference for
students of low socioeconomic status in the TCAP reading-language arts scores before (sixth
grade scores) and after (eighth grade scores) instituting a rotating schedule. There was not a
significant relationship between a rotating schedule and student achievement. The TCAP
reading-language arts mean for low socioeconomic students after instituting a rotating schedule
was 49.85 compared to a mean of 48.62 before instituting the rotating schedule. The results
were a gain of over one point.
An independent t test was conducted to evaluate whether there was a difference for
students with an IEP in the TCAP reading-language arts scores before (sixth grade scores) and
after (eighth grade scores) instituting a rotating schedule. There was not a significant
relationship between a rotating schedule and student achievement. The TCAP reading-language
67
arts mean for students with an IEP after instituting a rotating schedule was 28.57 compared to a
mean of 25.81 before instituting the rotating schedule. The results were a gain of over two
points.
An independent t test was conducted to evaluate whether there was a difference for male
students in the TCAP reading-language arts scores before (sixth grade scores) and after (eighth
grade scores) instituting a rotating schedule. There was not a significant relationship between a
rotating schedule and student achievement. The TCAP reading-language arts mean for male
students after instituting a rotating schedule was 44.78 compared to a mean of 44.60 before
instituting the rotating schedule. The results were a gain of less than one point.
An independent t test was conducted to evaluate whether there was a difference for female
students in the TCAP reading-language arts scores before (sixth grade scores) and after (eighth
grade scores) instituting a rotating schedule. There was not a significant relationship between a
rotating schedule and student achievement. The TCAP reading-language arts mean for female
students after instituting a rotating schedule was 51.04 compared to a mean of 49.06 before
instituting the rotating schedule. The results were a gain of over one point.
Conclusion
There has been very little current research as to the effect of circadian rhythms and brain
research as it relates to middle school scheduling. Research that has been conducted reveals that
students perform best at different times of the day. Wolfson and Carskadon (2003) found that
there was a relationship between sleep patterns and student performance. Age as well as the
individual student‘s ability plays an important role in determining the optimum time for student
achievement. Bruer (2010) reported the windows of opportunity for a solid foundation of

68
knowledge are acquired between the ages of 2 and 11. This data becomes extremely pertinent
when determining an effective schedule for students and schools.
This study revealed that not all students made progress while using a rotating schedule.
In fact, in some instances the NCE scores dropped for some subgroups. Close evaluation of the
data reveals that only the students with an IEP made gains in mathematics. Conversely, each
subgroup demonstrated limited to substantial growth in reading-language arts. The increase for
reading-language arts ranged from over one point to nearly three points with the most significant
gain being students with an IEP. This information substantiates Klien‘s (2004) research findings
that there was an increase in students‘ level of achievement in reading when classes were offered
at different times of the day in a middle school setting.
The era of accountability has ushered in challenges and opportunities for educators. The
added pressure for teachers and administrators to increase student achievement is a daunting
task. With accountability there are added data. When used effectively, these data may be used
to evaluate curriculum, teaching strategies, and scheduling methods. It is imperative that
educators not only understand the data but also use them to determine the effectiveness of their
programs.
The school in this study made adequate yearly progress (AYP) after the implementation
of a rotating schedule. The initiative was suggested by a concerned parent whose child generally
made high marks in reading. However, during the first semester of his seventh grade year, his
grades dropped significantly in reading, which was his last class of the day. Concerned for her
son‘s progress, she approached the principal and asked that her son be moved to an earlier period
because she felt that he performed at a higher level in the morning hours. The principal honored
the parent request but also began to research different scheduling schemes. The change in

69
scheduling was a difficult one especially for the staff. After implementing a rotating schedule,
both students and teachers agreed that this was singularly one of the most significantly positive
changes for the school. This was evident in the surveys conducted annually recorded in the
school improvement plan. The rotating schedule remains in effect for the school to date.
The most noted positive effect for this middle school was the decrease in discipline for
afternoon inclusionary classes. Not only did the discipline fall, the progress of the students with
an individual education plan rose significantly. This held true for both reading-language arts and
mathematics. Teachers throughout the building commented that they believed this occurred
because the students now had an opportunity to have these subjects at different times of the day
throughout the week.
Recommendations for Practice
This study showed a mixture of success and challenges when using a rotating schedule.
The group with the marked increase in both reading-language arts and mathematics was those
students with an IEP. Although the study revealed that there was not a significant relationship
between the rotating schedule and student achievement, there was an increase in NCE scores for
each of the four subgroups studied in reading-language arts. Administrators should research the
circadian rhythm changes in adolescence. Further, administrators should inform directors and
board members about the effects of school starting times at the various grade levels and its
impact on student achievement as a result in changing circadian rhythms. Often, school
schedules revolve around the needs of the adults in the building and are seen as a part of the
school culture that cannot be changed. Schedules should reflect the need of students and be
evaluated from time to time as the need arises. Each school would benefit from a team of data
experts who serve to evaluate the effectiveness of its schedule as well as other aspects of the

70
school. These teams should be objective and unbiased to ensure that student needs are being
met. Administrators must keep abreast of the current research and practices of highly effective
school scheduling. Rarely are two middle school schedules the same. Administrators should
have the opportunity to visit schools that have shown progress in academic achievement to
evaluate schedules. School schedules should be the responsibility of stakeholders with a shared
vision reflecting student needs. Educators and administrators should keep an open mind to
change when it comes to innovative ideas and practice.
When considering change in any schedule configuration, administrators should first
consider what works well for their school and get input from those who the schedule affects.
The teachers and students in the school from this study were apprehensive when discussing
change to a rotating schedule. After months of planning and organizational meetings, the
administration and teachers decided to make a change. The rotating schedule has been
implemented in this middle school for 5 years and has been extremely successful. The success is
not simply measured by test scores. It is measured by the change in attitude of teachers. They
believe that this schedule configuration, which gives them the opportunity to see each of their
students at different times of the day during the week, accounts for the drop in discipline at the
end of the day. Further, inclusionary classes were more engaged in learning after the change to a
rotating schedule. The most significant obstacle of this type of schedule was adults being able to
adapt to it.
Recommendations for Further Research
No Child Left Behind holds all educators and administrators accountable for the
performance of every child. This requirement forces all school systems to be aware of learning
styles including the time of the day a student performs at his or her peak. Some schools are

71
considering this information and changing school start times for high schools in their district.
Research indicates that this is a move in a positive direction; however, circadian rhythms affect
middle school students as well as high school students. As school systems work toward ensuring
students are given the opportunity to learn at their optimum time of day, they may consider
alternative scheduling and other research in this area. Suggestions for further research include
but are not limited to the following:
1. Continued research should be conducted in the area of circadian rhythms and sleep
patterns of students at various ages.
2. Further research should be conducted in the area of how school schedules affect student
achievement.
3. Research should include school start times at the various grade levels.
4. Each subject area should be further examined to understand the effects of circadian
rhythms on student achievement.
5. Further research should be conducted on circadian rhythms and its effects on student
achievement by subgroups.
6. Longitudinal studies should be conducted to analyze different scheduling configurations.
7. This study was conducted in a rural setting. Further studies should be conducted in other
rural settings as well as urban areas.
8. Qualitative studies should be conducted to secure teacher and parent attitudes in
scheduling options. Further, student surveys should be included in studies to determine
their morningness or eveningness preference.
Research indicates that learning is a complex process and there is a variety of learning styles.
Today‘s educators are being trained in learning styles and differentiated instruction. Circadian

72
rhythm research is a relatively new concept that gained much attention in the 1990s. This
research suggests that children have an optimum time of day in which they learn best. Further,
students process information differently as they progress through the stages of development.
This information may be beneficial to administrators and educators as they prepare a master
schedule. Often, school schedules are dictated by the needs of adults and the configuration of the
school operation. Knowing that students have different learning styles, differentiation of time to
meet student‘s morningness and eveningness needs may be the next step for administrators to
consider when preparing students to meet their full potential. Educators must continue to
investigate the tenets of brain based education and use those shown to be advantageous to
learning.

73
REFERENCES
Alapo, L. (2010, July 30). Tough education standards set. Knoxville News Sentinel, pp. A1, A9.
Bronson, P. (2007, October 7). Snooze or lose. New York Magazine 2. Retrieved from
http://nymag.com/news/features/38951
Brown, D. F. (2001). Middle level teachers‘ perceptions of the impact of block scheduling on
instruction and learning. Research in Middle Level Education Annual 24, 1-9.
Bruer, J. T. (1999). In search of brain education. Phi Delta Kappan Educators 200, 20. 3-15.
Retrieved from http://find.galegroup.com/gtx/retrieve/do? ContentSet=IAC-Document.
Caine, R. M., & Caine, G. (1995). Reinventing schools through brain based learning.
Educational Leadership, 7, 1-6.
Caine, R. M., & Caine, G. (1997). Education on the edge of possibility, Alexandria, VA: ASCD.
Callan, R. (1997, December-1998, January). Giving students the (right) time of day. Educational
Leadership. 84-87, Retrieved from
http://www.ascd.org/publications/educational-leadership/dec97/vol55/num04/Giving-
Students-the-(Right)-Time-of-Day.aspx
Canady, R. L., & Rettig, M. D. (1995). Block scheduling: A catalyst for change in high schools.
Princeton, NJ: Eye on Education.
Carnegie Council on Adolescent Development. (1989). Turning points: Preparing American
youth for the 21st century. The report of the task force on education of young adolescents.
New York. Carnegie Council on Adolescent Development.
Carskadon, M. A., Wolfson A.R., Acebo, C., Tzischinsky, O., & Seifer, R. (1998). Adolescent
sleep patterns, circadian timing, and sleepiness at a transition to early school days. Sleep,
21, 871-614.

74
Cortesi, F., Giannot, F., Mezzalira, E., Bruni, O., & Ottaviano, S. (1997). Circadian type, sleep
patterns, and daytime functioning in adolescence: Preliminary data on an Italian
representative sample. Sleep Research, 26, 707.
Daniel, L. G. (2007). Research summary: Flexible scheduling. National Middle School
Association, 4, 1-3.
Diaz-Morales, J .F., & Sorroche, M. G. (2008). Morningness and eveningness in adolescents.
The Spanish Journal of Psychology, 11, 201-206.
Eden, G., van Meter, J., Rumsey, J., Woods, R., & Ziffird, T. (1996). Abnormal processing of
visual motion insyslexia revealed by functional brain imaging. Nature. 382, 66-69.
Elmore, R. (2010, June 27). Leadership for effective middle school practice: conclusion. Phi
Delta Kappan 82, 2-4. Educators Web.
Gardner, H. (1983). Frames of mind: The theory of multiple intelligences. New York: Basic.
Gardner, H. (1999). Intelligence reframed multiple intelligences for the 21st century. New York:
Basic.
Guild, P. B. (1997, September) where do learning theories overlap? (Teaching for multiple
intelligences). Educational Leadership, 55(1), 2-3. Retrieved from http:/find:
galegroup.com/gtx/printdoc.do?contentSet=IAC-Document
Hackman, D. G. (2010, June 17). Ten guidelines for implementing block scheduling.
Educational Leadership 53(3). Educators Web. Retrieved from
http://find.galegroup.com/gtx/retrieve.do?contentSet=IAC-Document...
Hackman, D. G., & Valentine, J. W. (1998). Designing an effective middle school schedule
Middle School Journal, 29(5), 1-14.

75
Hall, T., Strangman, N., & Meyer, A. (2003). Differentiated instruction and implications for
UDL implementation. Wakefield, MA: National Center on Accessing the General
Curriculum. Retrieved from:
http://www.cast.org/publications/ncac/ncac_diffinstructudl.html
Hansen, M, Janssen I. Schiff, A., Zee, P. C., & Dubocobich, M. L (2005, June). The impact of
school daily schedule on adolescent sleep. Pediatrics, 115, 1555–1561.
Jacobs, H. H. (1989). Interdisciplinary curriculum: Design and implementation. Alexandria, VA:
Association for Supervision and Curriculum Development.
Jensen, E. (2006, July). Enriching the brain: how to maximize every learner‘s potential. Library
Journal, 89, 1, General Reference Center Gold.
Kaufman, E. K., Robinson, J. S., Bellah, K. A., Akers, C., Haase-Wittler, P., & Martindale, L.
(2008). Research report. Engaging students with brain based learning. 6. Techniques,
Association of Career and Technical Education, 83(6), 1- 4.
Klein, J. (2004, September). Planning middle school schedules for improved attention and
learning. 10. Scandinavian Journal of Educational Research, 48, (4), 1-9.
Kleitman, N. (1963). Sleep and wakefulness. Chicago: University of Chicago.
Link S C., & Ancoli- Israel S. (1995) Sleep and the teenager. Sleep Research, 184.
Mayo Clinic. (1995, March), Circadian rhythms: These 24-hour cycles keep you on schedule.
Mayo Clinic Health Letter, 13, 3.
Meehl, P.E. (1954) Clinical versus statistical prediction. Minneapolis, : University of Minnesota
Press.
Merriam-Webster. (2009). Merriam-Webster online. Retrieved from
http://www.merriam-webster.com/

76
Murawski, W., & Hughes, C. (2009) Response to intervention, collaboration, and co-teaching: A
logical combination for successful systemic change. Preventing School Failure, 53, 267-
277.
National Commission on Excellence in Education. (1983). A nation at risk: The imperative for
educational reform. Retrieved from http://www2.ed.gov/pubs/NatAtRisk/index.html
NMSA Research Summary #2. (1999) Flexible scheduling. National Middle School Association
4. 1-2. Used on NCMSA web site with permission of NMSA.
Roberts, J. W. (2002). Beyond learning by doing: The brain compatible approach. Journal of
Experiential Education, 25, 281-285.
Russo, P. M., Bruni, O., Lucidi, F., Ferri, R., & Violani, C. (2007, January 9). Sleep habits and
circadian preference in Italian children and adolescents. European Sleep Research
Society, 16, 166-167.
Schroth, G. (2010). Scheduling—historical background of scheduling, selecting a schedule,
scheduling models, staff development. Retrieved from
http://education.stateuniversity.com/pages/2385/Scheduling.html
Sousa, D. A. (2001). How the brain learns: a classroom teacher’s guide (2nd
ed.). Thousand
Oaks, CA. Corwin.
Strickland, C. A. (2005, April). Differentiation or differentiation? Middle-E Connections. Retrieved
from http://www.nmsa.org/Publications/MiddleEConnections/tabid/701/Default.aspx
Topo, G. (2008, August). Nation at risk: The best thing or the worst thing for education? USA Today.
Retrieved from http://www.usatoday.com/news/education/2008-04-22-nation-at-risk_N.htm
Tennessee Department of Education (2010). Adequate yearly progress results. Retrieved from
http://tennessee.gov/education/nclb/ayp/index.shtml
77
United States Congress (2002). No child left behind act of 2001. Public Law 107-110.
Wahlstrom, K. (2002, December). Changing times: Findings from the first longitudinal study of
later high school start times. NASSP Bulletin, (86), 18-20.
Warner, S., Murray, G., & Meyer, D. (2008). Holiday and school-term sleep patterns of
Australian adolescents. Journal of Adolescence, 31, 595-608.
Weiss, R. P. (2000, July). Brain based learning. 20-24. Training and Development, July 2000.
ASTD Magazines. 20-24.
Willis, J. (2007). Brain based teaching strategies for improving memory, learning and test-
taking success. Childhood Education, Association for Childhood Education
International. Retrieved from http://find .galegroup.com
Wolfson, A. R., & Carskadon, M. A. (2003). Understanding adolescents‘ sleep patterns and
school performance: a critical appraisal. Elsevier Science Company. Sleep Medicine
Reviews, 7, 491-506.
Wolfson, A. R., & Carskadon, M. A. (2005, March). A survey of factors influencing high school
start times. NASSP Bulletin, 89, 47. 48.

78
VITA
JAMES EDWARD CARTER
Personal Data: Date of Birth: March 1, 1962
Place of Birth: Knoxville, Tennessee
Marital Status: Married
Education: Tennessee Technological University, Cookeville, Tennessee;
Secondary Education, Social Studies, B.S., 1985
Lincoln Memorial University, Harrogate, Tennessee;
Supervision and Administration, M.Ed., 1992
Lincoln Memorial University, Harrogate, Tennessee;
Educational Administration and Supervision, Ed.S. 2004
East Tennessee State University, Johnson City, Tennessee;
Educational Leadership and Policy Analysis, Ed. D, 2011
Professional
Experience: Teacher, Luttrell Elementary School; Luttrell, Tennessee
1986-1989
Teacher, Horace Maynard Middle School, Maynardville, Tennessee
1989-1993
Principal, Sharps Chapel Elementary School, Sharps Chapel,
Tennessee 1993-1994
Principal, Big Ridge Elementary School, Maynardville, Tennessee
1994-1997
Principal, Horace Maynard Middle School, Maynardville,
Tennessee 1997-2003
Supervisor of Instruction, Union County Public Schools, Union
County, Tennessee 2003-Present