COMBINED ADHESIVE-STEEL PIN APPLICATIONS FOR CFS FRAME SHEAR WALLS

Journal of Adhesion Science and Technology 22 (2008) 15–29www.brill.nl/jast
Alternative Methods to Measure the Adhesive ShearDisplacement in the Thick Adherend Shear Test
Lucas F. M. da Silva a,∗, R. A. M. da Silva a, J. A. G. Chousal a and A. M. G. Pinto b
a Departamento de Engenharia Mecânica e Gestão Industrial, Faculdade de Engenharia,Universidade do Porto, Rua Dr. Roberto Frias, 4200-465 Porto, Portugal
b Departamento de Engenharia Mecânica, Instituto Superior de Engenharia do Porto,Rua Dr. António Bernardino de Almeida 431, 4200-072 Porto, Portugal
Received in final form 25 October 2007
AbstractThere are standard tests to determine the adhesive properties, one of the most used being the Thick Ad-herend Shear Test (TAST). This test assumes that the adhesive deforms only in shear. The standard methodrecommends the use of a special extensometer attached to the specimen. The use of this extensometer needsa very experienced technician, in addition to requiring high costs of production. In this work, the adhesiveshear deformation is measured with a conventional clip gauge used for tensile tests. The steel deformationcorrection is made using a non-contact method (optical) that gives only the adhesive deformation and anumerical analysis. The objective of this study was to evaluate the applicability of a simpler method ofmeasuring the adhesive deformation and to evaluate methods without contact for the measurement of thedeformation of thin adhesive layers. The results show that a simple clip gauge can be used to measure theadhesive deformation, provided a correction factor is applied. Koninklijke Brill NV, Leiden, 2008
KeywordsEpoxy, acrylic, steel, lap-shear, mechanical properties, adhesives, finite element stress analysis, thick ad-herend shear test
1. Introduction
The use of structural adhesives is increasing. One of the main advantages of thistechnique is that it allows to bond different materials and reduces the weight ofthe structures. However, its use is still limited due to a lack of general design cri-teria and material models that correctly represent the mechanical behavior of theadhesive. The adhesive yield is dependent on the hydrostatic stress and it is impor-
* To whom correspondence should be addressed. Tel.: (351-22) 508-1706; Fax: (351-22) 508-1445; e-mail:[email protected]
Koninklijke Brill NV, Leiden, 2008 DOI:10.1163/156856108X292241

16 L. F. M. da Silva et al. / Journal of Adhesion Science and Technology 22 (2008) 15–29
tant to measure the mechanical properties under different modes of loading. Tensileand shear testing is usually used. There are two possibilities for testing in shear:torsional shear and tensile shear. Torsional shear tests include tests on bulk speci-mens, butt joints and the napkin ring test (ASTM E 229). In the napkin ring test,the adhesive fillets both inside and outside should be removed because they makethe calculation of the shear strength and modulus less exact. The outer fillet is easyto remove. However, the inner fillet is impossible to clean away. The butt joint hasadvantages when an adhesive of low viscosity is used because it is difficult to filla napkin ring joint properly. Adams and Coppendale [1] designed a jig to producefully filled joints with low viscosity adhesives. The torsion test needs a means tocause twisting and measuring the resulting rotational motion. In other words, it re-quires specialized equipment.
It is possible to generate shear using the linear movement of a standard ten-sile testing machine. There are two principal tensile shear tests: the Thick Ad-herend Shear Test (TAST) and the Butterfly Test. The latter includes notched beam(Iosipescu) and notched plate (Arcan) test methods. The TAST is more popular be-cause it is easier to make and test the specimens. This test has been widely used andstudied in the literature [2–11]. The conventional single-lap shear joint (ASTM D1002), which is used for comparison and quality control of adhesives, subjects theadhesive to a complicated state of stress. Therefore, it is not suitable for the deter-mination of the true adhesive properties. Using stiff and thick metallic adherends,the adhesive is in a state of essentially uniform shear over most of the overlap andpeel stresses are reduced. Two forms of the TAST are used, as developed by Krieger[2] in the USA and Althof [3] in Europe. The main difference between the two testsis the size of the specimen: the Althof specimen is half the size of Krieger’s. Theyboth developed extensometers for measuring the very small displacements acrossthe bondline. The extensometer measures not only the displacement of the adhe-sive, but also the displacement of the adherend. Therefore, it is necessary to applya correction to the measured displacements. According to ISO 11003-2, the cor-rection should be deduced from the measurement of the shear strain on a ‘dummy’specimen consisting of the adherend material alone. Vaughn [4] suggests that theadherend correction can be derived from simple elasticity assuming that the ad-herends experience pure shear only. However, finite element analysis (FEA) showsthat direct axial stress is also present in the adherend [4–6]. Thus, an accurate cor-rection cannot be properly calculated assuming that the adherends experience onlypure shear. To take this into account, it is better to use a FEA correction. Neverthe-less, a simple elasticity correction is shown to be acceptable as long as the adhesivelayer is not too thin. Chiu and Jones [7] studied the influence of both adhesive andadherend thicknesses. The thicker the adhesive layer or the adherend, the more uni-form is the shear stress profile. As regards the specimen fabrication, ISO 11003-2recommends machining the specimens from two plates bonded together. However,this technique has disadvantages such as the effect of cutting on the highly stressedregion at the end of the adhesive layer where initial failure is likely to occur. Vaughn
L. F. M. da Silva et al. / Journal of Adhesion Science and Technology 22 (2008) 15–29 17
[4] proposes that a better solution is to machine the adherends to the correct dimen-sions before bonding.
The extensometer recommended by the TAST standard has the inconvenienceof needing a correction, besides being difficult to apply on the specimen. One wayto solve the correction problem would be to use another method of measurementthat measures only the deformation of the adhesive and that is easy to implement.An optical method is a possible solution. In this work, the adhesive shear displace-ment was measured using a specially designed non-contact technique developed byChousal and Gomes [12]. The adhesive displacement was also measured using aconventional clip gauge of 25 mm used for tensile tests. In this case, a correctionis necessary but it is extremely easy to use and is available in any material testinglaboratory. A FEA was carried out to evaluate the correction to apply in the case ofthe clip gauge and to evaluate the stress distribution in the adhesive.
2. Experimental
2.1. Materials
Three adhesives were selected: a very flexible acrylic adhesive (DP-8005 from 3M),a very stiff epoxy adhesive (Araldite AV138/HV998 from Huntsman) and an inter-mediate stiffness epoxy adhesive (Araldite 2015 from Huntsman). Tensile tests (BS2782) on dogbone specimens were carried out to confirm the stiffness of the adhe-sives. The tensile mechanical properties of the adhesives used are shown in Table 1.
2.2. Specimen Fabrication
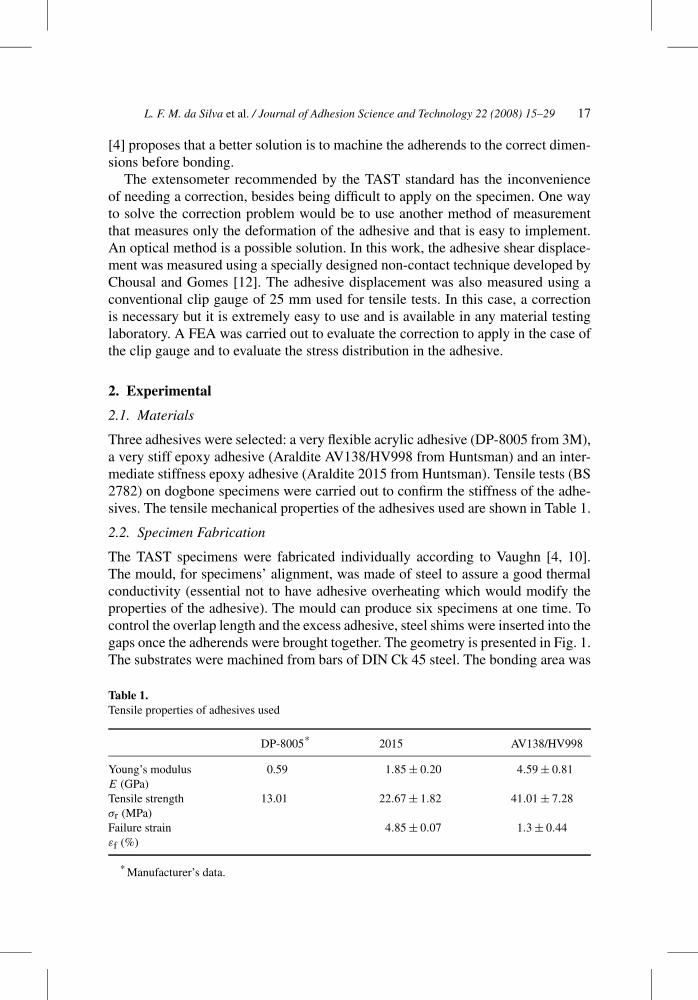
The TAST specimens were fabricated individually according to Vaughn [4, 10].The mould, for specimens’ alignment, was made of steel to assure a good thermalconductivity (essential not to have adhesive overheating which would modify theproperties of the adhesive). The mould can produce six specimens at one time. Tocontrol the overlap length and the excess adhesive, steel shims were inserted into thegaps once the adherends were brought together. The geometry is presented in Fig. 1.The substrates were machined from bars of DIN Ck 45 steel. The bonding area was
Table 1.Tensile properties of adhesives used
DP-8005* 2015 AV138/HV998
Young’s modulus 0.59 1.85 ± 0.20 4.59 ± 0.81E (GPa)Tensile strength 13.01 22.67 ± 1.82 41.01 ± 7.28σr (MPa)Failure strain 4.85 ± 0.07 1.3 ± 0.44εf (%)
* Manufacturer’s data.
18 L. F. M. da Silva et al. / Journal of Adhesion Science and Technology 22 (2008) 15–29
Figure 1. TAST specimen (dimensions in mm).
initially degreased with acetone, shot blasted with corundum and again cleanedwith acetone before the application of the adhesive. This is a common approach toprepare the surface of carbon steel [13].
The cure of the adhesives was carried out in a hot press. The temperature wasmeasured by a thermocouple placed next to the adhesive. Adhesive DP-8005 wascured at room temperature and adhesives AV138/HV998 and 2015 were cured at100◦C for 10 min.
2.3. Test Procedure
The specimens were tested on a MTS servo-hydraulic machine 312.31 with a loadcell of 250 kN. The specimen was attached to the machine by a specially designedfixture to avoid any bending moment. The test speed was 0.1 mm/min and 10% ofthe maximum load cell capacity was used for test recording. Three specimens weretested for each adhesive.
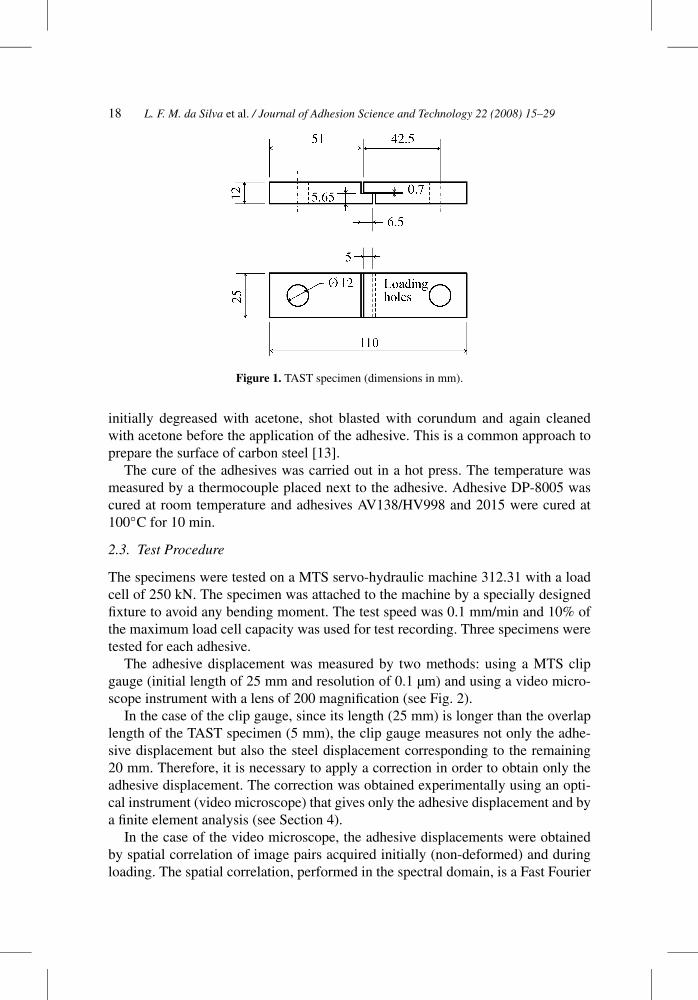
The adhesive displacement was measured by two methods: using a MTS clipgauge (initial length of 25 mm and resolution of 0.1 µm) and using a video micro-scope instrument with a lens of 200 magnification (see Fig. 2).
In the case of the clip gauge, since its length (25 mm) is longer than the overlaplength of the TAST specimen (5 mm), the clip gauge measures not only the adhe-sive displacement but also the steel displacement corresponding to the remaining20 mm. Therefore, it is necessary to apply a correction in order to obtain only theadhesive displacement. The correction was obtained experimentally using an opti-cal instrument (video microscope) that gives only the adhesive displacement and bya finite element analysis (see Section 4).
In the case of the video microscope, the adhesive displacements were obtainedby spatial correlation of image pairs acquired initially (non-deformed) and duringloading. The spatial correlation, performed in the spectral domain, is a Fast Fourier
L. F. M. da Silva et al. / Journal of Adhesion Science and Technology 22 (2008) 15–29 19
Figure 2. Clip gauge attached to the TAST specimen and video microscope lens.
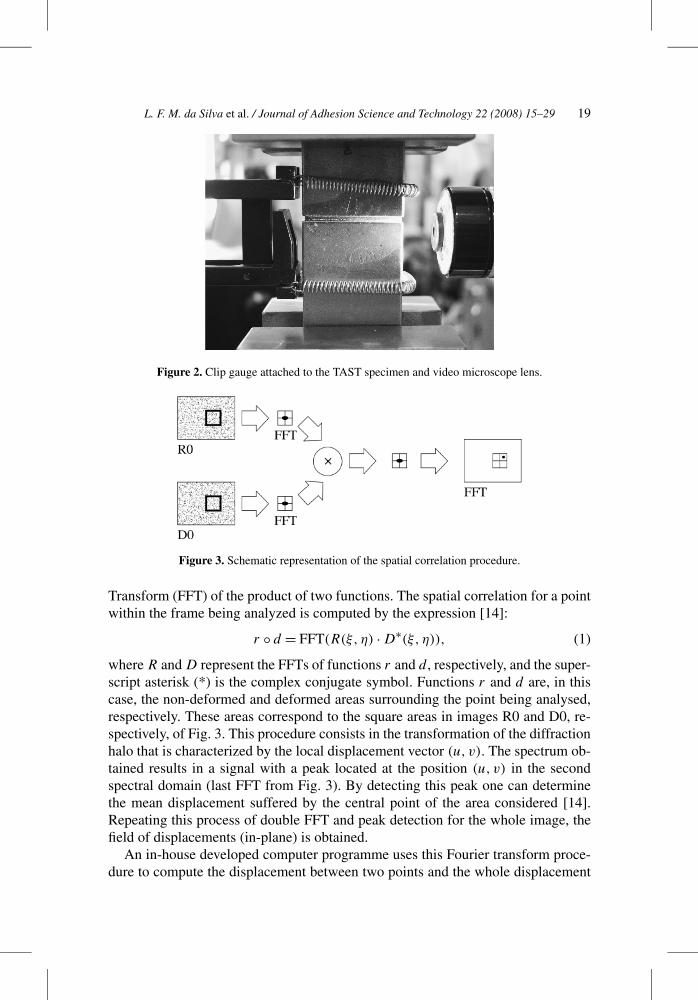
Figure 3. Schematic representation of the spatial correlation procedure.
Transform (FFT) of the product of two functions. The spatial correlation for a pointwithin the frame being analyzed is computed by the expression [14]:
r ◦ d = FFT(R(ξ, η) · D∗(ξ, η)), (1)
where R and D represent the FFTs of functions r and d , respectively, and the super-script asterisk (*) is the complex conjugate symbol. Functions r and d are, in thiscase, the non-deformed and deformed areas surrounding the point being analysed,respectively. These areas correspond to the square areas in images R0 and D0, re-spectively, of Fig. 3. This procedure consists in the transformation of the diffractionhalo that is characterized by the local displacement vector (u, v). The spectrum ob-tained results in a signal with a peak located at the position (u, v) in the secondspectral domain (last FFT from Fig. 3). By detecting this peak one can determinethe mean displacement suffered by the central point of the area considered [14].Repeating this process of double FFT and peak detection for the whole image, thefield of displacements (in-plane) is obtained.
An in-house developed computer programme uses this Fourier transform proce-dure to compute the displacement between two points and the whole displacement
20 L. F. M. da Silva et al. / Journal of Adhesion Science and Technology 22 (2008) 15–29
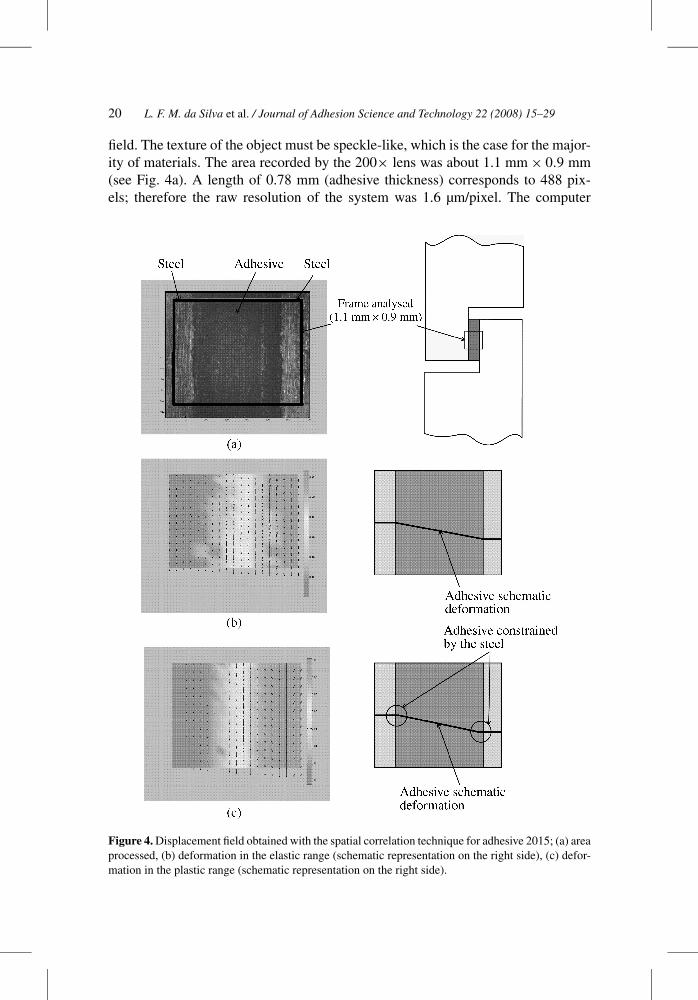
field. The texture of the object must be speckle-like, which is the case for the major-ity of materials. The area recorded by the 200× lens was about 1.1 mm × 0.9 mm(see Fig. 4a). A length of 0.78 mm (adhesive thickness) corresponds to 488 pix-els; therefore the raw resolution of the system was 1.6 µm/pixel. The computer
Figure 4. Displacement field obtained with the spatial correlation technique for adhesive 2015; (a) areaprocessed, (b) deformation in the elastic range (schematic representation on the right side), (c) defor-mation in the plastic range (schematic representation on the right side).
L. F. M. da Silva et al. / Journal of Adhesion Science and Technology 22 (2008) 15–29 21
programme is also able to perform a sub-pixel analysis which increases the mea-surement precision up to 10 times.
3. Experimental Results
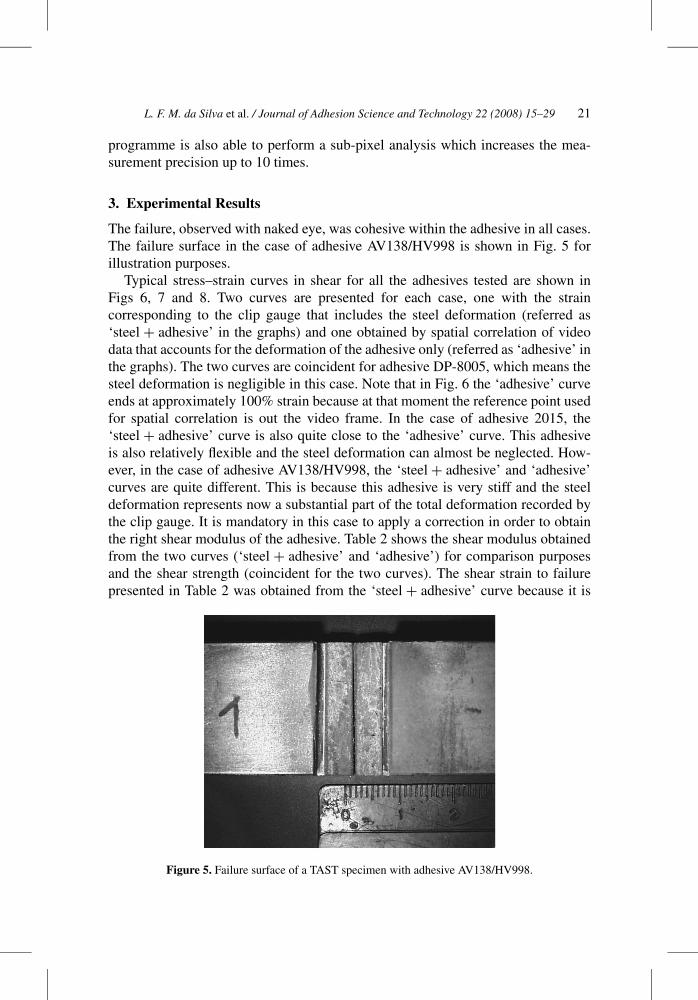
The failure, observed with naked eye, was cohesive within the adhesive in all cases.The failure surface in the case of adhesive AV138/HV998 is shown in Fig. 5 forillustration purposes.
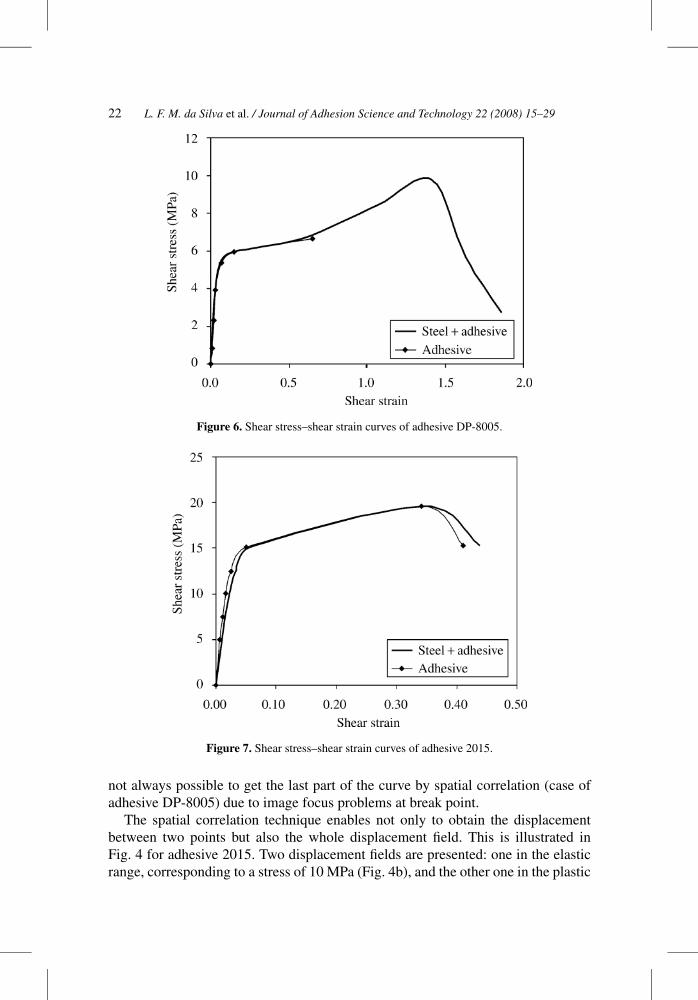
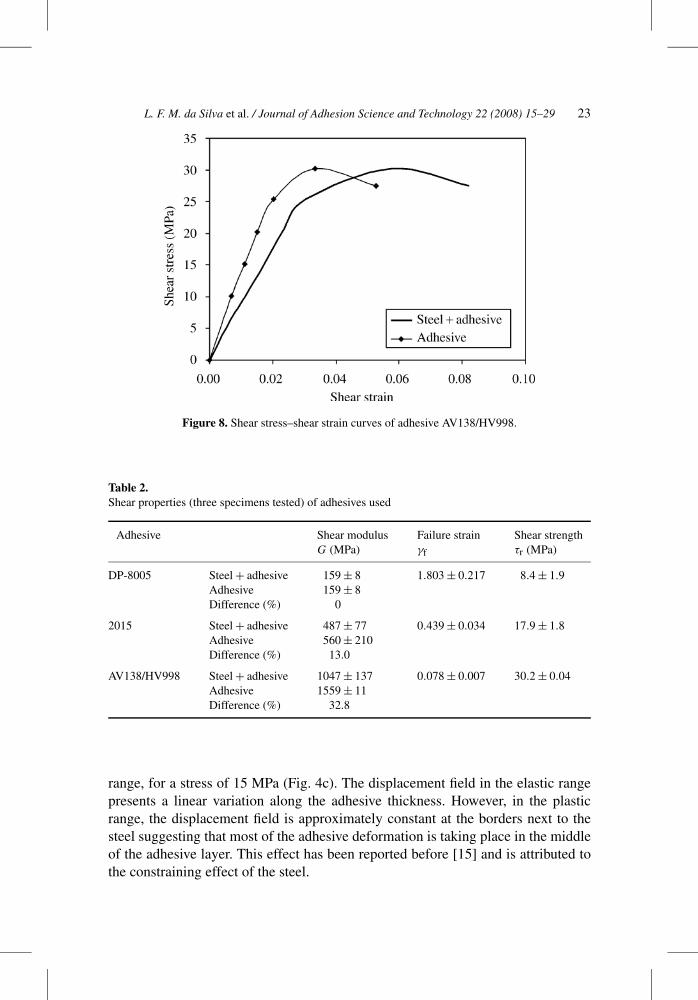
Typical stress–strain curves in shear for all the adhesives tested are shown inFigs 6, 7 and 8. Two curves are presented for each case, one with the straincorresponding to the clip gauge that includes the steel deformation (referred as‘steel + adhesive’ in the graphs) and one obtained by spatial correlation of videodata that accounts for the deformation of the adhesive only (referred as ‘adhesive’ inthe graphs). The two curves are coincident for adhesive DP-8005, which means thesteel deformation is negligible in this case. Note that in Fig. 6 the ‘adhesive’ curveends at approximately 100% strain because at that moment the reference point usedfor spatial correlation is out the video frame. In the case of adhesive 2015, the‘steel + adhesive’ curve is also quite close to the ‘adhesive’ curve. This adhesiveis also relatively flexible and the steel deformation can almost be neglected. How-ever, in the case of adhesive AV138/HV998, the ‘steel + adhesive’ and ‘adhesive’curves are quite different. This is because this adhesive is very stiff and the steeldeformation represents now a substantial part of the total deformation recorded bythe clip gauge. It is mandatory in this case to apply a correction in order to obtainthe right shear modulus of the adhesive. Table 2 shows the shear modulus obtainedfrom the two curves (‘steel + adhesive’ and ‘adhesive’) for comparison purposesand the shear strength (coincident for the two curves). The shear strain to failurepresented in Table 2 was obtained from the ‘steel + adhesive’ curve because it is
Figure 5. Failure surface of a TAST specimen with adhesive AV138/HV998.
22 L. F. M. da Silva et al. / Journal of Adhesion Science and Technology 22 (2008) 15–29
Figure 6. Shear stress–shear strain curves of adhesive DP-8005.
Figure 7. Shear stress–shear strain curves of adhesive 2015.
not always possible to get the last part of the curve by spatial correlation (case ofadhesive DP-8005) due to image focus problems at break point.
The spatial correlation technique enables not only to obtain the displacementbetween two points but also the whole displacement field. This is illustrated inFig. 4 for adhesive 2015. Two displacement fields are presented: one in the elasticrange, corresponding to a stress of 10 MPa (Fig. 4b), and the other one in the plastic
L. F. M. da Silva et al. / Journal of Adhesion Science and Technology 22 (2008) 15–29 23
Figure 8. Shear stress–shear strain curves of adhesive AV138/HV998.
Table 2.Shear properties (three specimens tested) of adhesives used
Adhesive Shear modulus Failure strain Shear strengthG (MPa) γf τr (MPa)
DP-8005 Steel + adhesive 159 ± 8 1.803 ± 0.217 8.4 ± 1.9Adhesive 159 ± 8Difference (%) 0
2015 Steel + adhesive 487 ± 77 0.439 ± 0.034 17.9 ± 1.8Adhesive 560 ± 210Difference (%) 13.0
AV138/HV998 Steel + adhesive 1047 ± 137 0.078 ± 0.007 30.2 ± 0.04Adhesive 1559 ± 11Difference (%) 32.8
range, for a stress of 15 MPa (Fig. 4c). The displacement field in the elastic rangepresents a linear variation along the adhesive thickness. However, in the plasticrange, the displacement field is approximately constant at the borders next to thesteel suggesting that most of the adhesive deformation is taking place in the middleof the adhesive layer. This effect has been reported before [15] and is attributed tothe constraining effect of the steel.
24 L. F. M. da Silva et al. / Journal of Adhesion Science and Technology 22 (2008) 15–29
4. Clip Gauge Correction Factor
The results presented in Section 3 show that the spatial correlation technique is agood method for determining the adhesive displacement in the TAST. However,the type of equipment required and the laborious image treatment does not makethis equipment suitable for everyday use. On the other hand, the conventional clipgauge, available in any materials testing laboratory, is a very practical method. Theproblem is that it needs a correction, especially in the case of stiff adhesives. For rel-atively flexible adhesives, such as polyurethanes, acrylics and soft modified epoxies,the correction may be negligible. The correction can be calculated for each point bysubtracting the steel displacement. Another way of obtaining the adhesive displace-ment is by applying a correction factor (CF) according to equation (2):
CF = usteel+adhesive
uadhesive, (2)
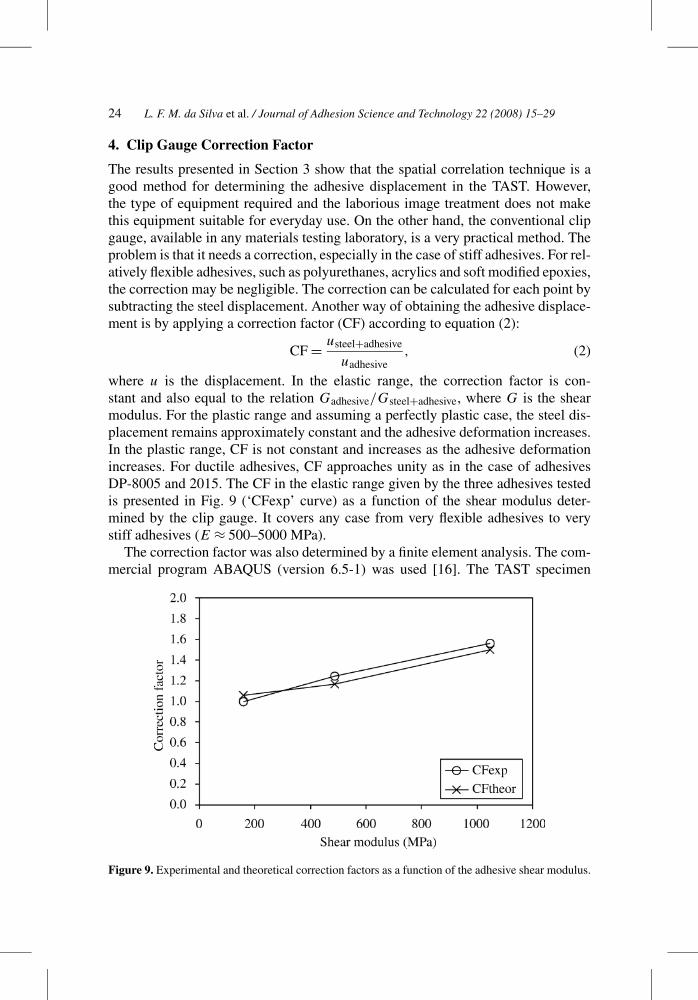
where u is the displacement. In the elastic range, the correction factor is con-stant and also equal to the relation Gadhesive/Gsteel+adhesive, where G is the shearmodulus. For the plastic range and assuming a perfectly plastic case, the steel dis-placement remains approximately constant and the adhesive deformation increases.In the plastic range, CF is not constant and increases as the adhesive deformationincreases. For ductile adhesives, CF approaches unity as in the case of adhesivesDP-8005 and 2015. The CF in the elastic range given by the three adhesives testedis presented in Fig. 9 (‘CFexp’ curve) as a function of the shear modulus deter-mined by the clip gauge. It covers any case from very flexible adhesives to verystiff adhesives (E ≈ 500–5000 MPa).
The correction factor was also determined by a finite element analysis. The com-mercial program ABAQUS (version 6.5-1) was used [16]. The TAST specimen
Figure 9. Experimental and theoretical correction factors as a function of the adhesive shear modulus.

L. F. M. da Silva et al. / Journal of Adhesion Science and Technology 22 (2008) 15–29 25
Figure 10. Boundary conditions (top) and mesh (bottom) used in the finite element analysis.
Figure 11. Shear and peel stress distributions in adhesive 2015 for a load of 1000 N.
was modelled with 2D 8-node continuum isoparametric elements with four Gausspoints (reduced integration). A plain strain analysis was done since the width ofthe specimen is larger than the thickness. An elastic simulation was done witha load of 1000 N. The boundary conditions and the mesh used are presented inFig. 10. The shear and peel stress distributions obtained are presented in Fig. 11 foradhesive 2015. The shear stress is practically uniform and the peel stress is negli-gible which reinforces the suitability of the TAST for determining adhesive shearproperties [10]. The correction factor was then determined by plotting the longitu-dinal displacement along path L, which corresponds to the clip gauge reading, asshown Fig. 12. The results are presented in Fig. 13. The displacement along path L
includes both the steel and adhesive displacements. To obtain only the adhesive

26 L. F. M. da Silva et al. / Journal of Adhesion Science and Technology 22 (2008) 15–29
Figure 12. Paths (L and T ) used for the displacement plots in the finite element analysis.
Figure 13. Longitudinal displacement along path L for adhesive 2015.
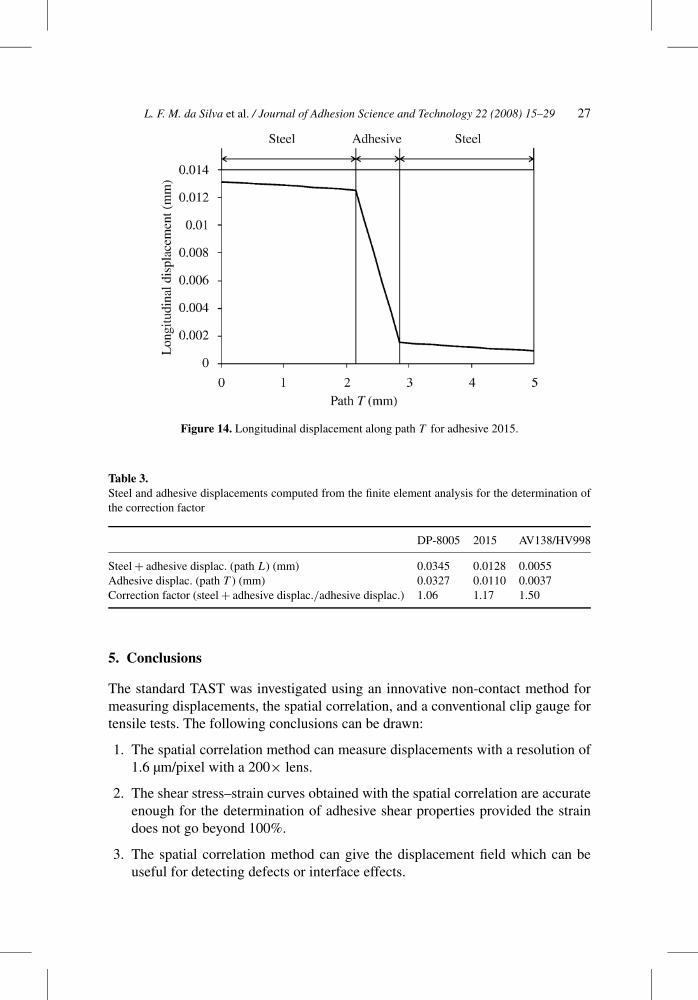
displacement, the longitudinal displacement was plotted along path T (see Fig. 12)and the results are presented in Fig. 14. The same was done for adhesives AV138and DP-8005, and the results are summarized in Table 3. The CF compares verywell with that obtained experimentally (see curve ‘CFtheor’ in Fig. 9).
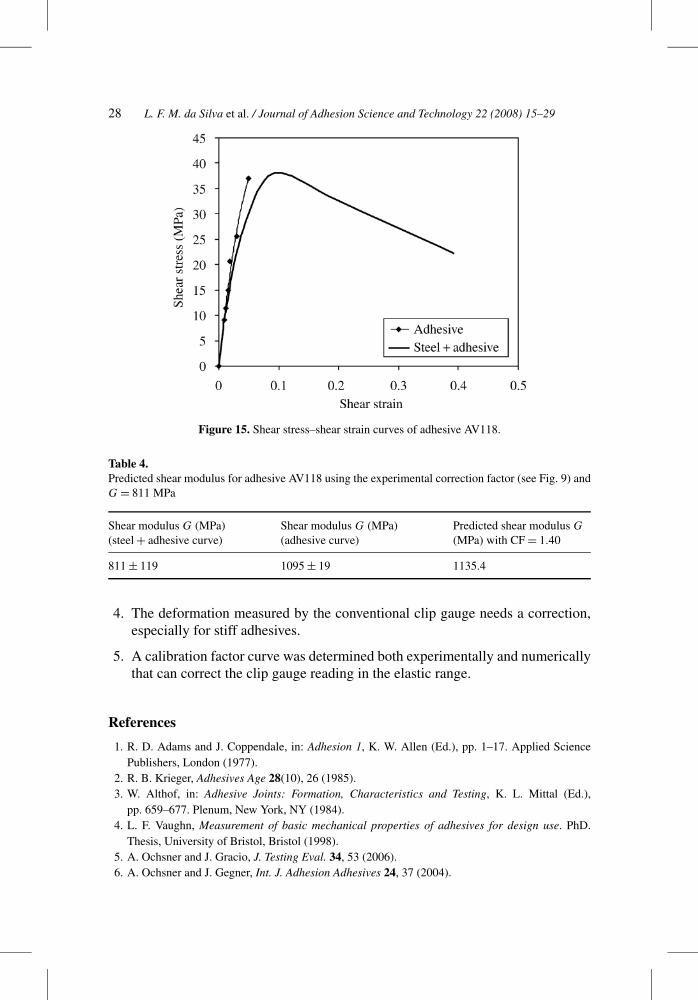
In order to validate CF, additional tests were carried out with another adhesive.The epoxy adhesive Araldite AV118 from Huntsman was used. The shear stress–shear strain curves are shown in Fig. 15. The ‘adhesive’ curve is not shown beyondthe maximum stress because problems in focusing image were encountered. Theshear modulus obtained with the clip gauge (‘steel + adhesive’ curve) and the trueshear modulus obtained with the spatial correlation technique (‘adhesive’ curve) areindicated in Table 4 along with the prediction of the shear modulus using the cor-rection factor determined above. The predicted shear modulus (using the clip gaugeshear modulus and the correction factor) compares very well with the true shearmodulus determined with the correlation technique, which validates the correctionfactor.
L. F. M. da Silva et al. / Journal of Adhesion Science and Technology 22 (2008) 15–29 27
Figure 14. Longitudinal displacement along path T for adhesive 2015.
Table 3.Steel and adhesive displacements computed from the finite element analysis for the determination ofthe correction factor
DP-8005 2015 AV138/HV998
Steel + adhesive displac. (path L) (mm) 0.0345 0.0128 0.0055Adhesive displac. (path T ) (mm) 0.0327 0.0110 0.0037Correction factor (steel + adhesive displac./adhesive displac.) 1.06 1.17 1.50
5. Conclusions
The standard TAST was investigated using an innovative non-contact method formeasuring displacements, the spatial correlation, and a conventional clip gauge fortensile tests. The following conclusions can be drawn:
1. The spatial correlation method can measure displacements with a resolution of1.6 µm/pixel with a 200× lens.
2. The shear stress–strain curves obtained with the spatial correlation are accurateenough for the determination of adhesive shear properties provided the straindoes not go beyond 100%.
3. The spatial correlation method can give the displacement field which can beuseful for detecting defects or interface effects.
28 L. F. M. da Silva et al. / Journal of Adhesion Science and Technology 22 (2008) 15–29
Figure 15. Shear stress–shear strain curves of adhesive AV118.
Table 4.Predicted shear modulus for adhesive AV118 using the experimental correction factor (see Fig. 9) andG = 811 MPa
Shear modulus G (MPa) Shear modulus G (MPa) Predicted shear modulus G
(steel + adhesive curve) (adhesive curve) (MPa) with CF = 1.40
811 ± 119 1095 ± 19 1135.4
4. The deformation measured by the conventional clip gauge needs a correction,especially for stiff adhesives.
5. A calibration factor curve was determined both experimentally and numericallythat can correct the clip gauge reading in the elastic range.
References
1. R. D. Adams and J. Coppendale, in: Adhesion 1, K. W. Allen (Ed.), pp. 1–17. Applied SciencePublishers, London (1977).
2. R. B. Krieger, Adhesives Age 28(10), 26 (1985).3. W. Althof, in: Adhesive Joints: Formation, Characteristics and Testing, K. L. Mittal (Ed.),
pp. 659–677. Plenum, New York, NY (1984).4. L. F. Vaughn, Measurement of basic mechanical properties of adhesives for design use. PhD.
Thesis, University of Bristol, Bristol (1998).5. A. Ochsner and J. Gracio, J. Testing Eval. 34, 53 (2006).6. A. Ochsner and J. Gegner, Int. J. Adhesion Adhesives 24, 37 (2004).
L. F. M. da Silva et al. / Journal of Adhesion Science and Technology 22 (2008) 15–29 29
7. W. K. Chiu and R. Jones, Int. J. Adhesion Adhesives 12, 219 (1992).8. M. R. Maheri and R. D. Adams, Int. J. Adhesion Adhesives 22, 119 (2002).9. M. Y. Tsai, J. Morton, R. B. Krieger and D. W. Oplinger, J. Adv. Mater. 27, 28 (1996).
10. F. Kadioglu, L. F. Vaughn, F. J. Guild and R. D. Adams, J. Adhesion 78, 355 (2002).11. L. F. M. da Silva and R. D. Adams, J. Adhesion Sci. Technol. 19, 109 (2005).12. J. A. Chousal and J. F. Gomes, in: Proc. M2D, 3rd International Conference on Mechanics &
Materials in Design, Orlando, FL (2000).13. R. D. Adams, J. Comyn and W. C. Wake, Structural Adhesive Joints in Engineering, 2nd edn.
Chapman & Hall, London (1997).14. D. J. Chen, F. P. Chiang, Y. S. Tan and H. S. Don, Appl. Opt. 32, 1839 (1993).15. H. Botter, Deformation of the adhesive layer inside TAST-specimens. Report No. 2011-02a-
BOE. Eindhoven University of Technology, TNO Building and Construction Research, Eindhoven(2001).
16. ABAQUS version 6.5. Hibbitt, Karlsson and Sorensen, Pawtucket, RI (2004).