
THESIS;Production of Urea,Formaldehyde & Urea Formaldehyde Resin

1 | P a g e
ALTERNATIVE FORMALDEHYDE-FREE PARTICLEBOARD COMPOSITIONS BASED ON EPOXIDIZED VEGETABLE OILS
Shivshankar Sivasubramanian Department of Plastics Engineering University of Massachusetts Lowell
Asst. Prof. Emmanuelle Reynaud and Asst. Prof. Daniel Schmidt
Department of Mechanical Engineering Department of Plastics Engineering University of Massachusetts Lowell
Project Manager: Pam Eliason Toxics Use Reduction Institute
University Research in Sustainable Technologies Program 2009

2 | P a g e
Table of Contents
1- Introduction..... 3 1.a- Implications for sustainability 3 1.b- Project background 3 2- Materials and Methods 4 2.a- Materials 4 2.b- Methods 8 3- Results & Discussion 13 3.a- Optimisation of the curing conditions 13
3.a.1- Epoxidized Linseed Oil (ELO) and Epoxidized Soybean Oil (ESO) with PolyethyleneImine (PEI)
3.a.2- Epoxidized Linseed Oil (ELO) and Epoxidized Soybean Oil (ESO) with Triethylene Tetra Amine (TETA)
3.a.3- Epoxidized Linseed Oil (ELO) and Epoxidized Soybean Oil (ESO) with amino acids (L-Tryptophan and L-Lysine)
3.a.4- Epoxidized Castor Oil (ECO) with PolyethyleneImine (PEI) 3.a.5- Formaldehyde based resins
3.b- Mechanical testing of the bioepoxy systems 35 3.b.1- Sample preparation 3.b.2- First series of experiments 3.c- Investigation of the curing conditions 39 4- Conclusions 40 References 42 Appendix 44

3 | P a g e
1- INTRODUCTION 1.a- IMPLICATIONS FOR SUSTAINABILITY Wood flour is the main ingredient of particleboard, since it represents 70 to 95% of it. This project does not affect its role, but aims at limiting the toxicity of the resin used as a binder for wood flour. The use of formaldehyde in conventional petroleum-based particleboard binders has been indentified as a hazardous element. The California Air Resources Board has set new emissions standard for particleboards. From the first of January 2009, particleboards sold in California had to produce levels of formaldehyde no higher than 0.18 ppm1. This study aims at replacing the conventional resins by formaldehyde–free alternatives from renewable resources. The chosen alternative resins are epoxidized vegetable oils, as they are characterized as practically non-toxic2. Most of the study is devoted to optimizing the curing of the chosen epoxidized vegetable oils with different crosslinkers, bearing in mind to limit the overall toxicity of the final products. 1.b– PROJECT BACKGROUND Particle board is an engineered wood product manufactured from wood particles (i.e. wood chips, sawmill shavings, saw dust) and a binder (to glue the wood particles together). These are extruded to form sheets3. Its main applications are furniture, cabinetry, floor underlay, stair treads. Figure 14 shows an example of a commercially available particleboard coupon. The conventional binders used in particleboards are the following5:
(1) Urea Formaldehyde (UF) – Urea formaldehyde was conventionally used for the manufacture of particleboards. But the curing of UF continues even after manufacturing. The degassing of formaldehyde continues over time and it is also prone to acid hydrolysis.
(2) Melamine Formaldehyde (MF) – Melamine formaldehyde has a lower emission rate as compared to UF, but it does not eliminate the problem of emission completely. It is more expensive than UF.
(3) Phenol formaldehyde – Phenol formaldehyde has better water resistance than UF and it is more expensive. It has 90% less formaldehyde emission. But it has occupational exposure concerns. Also the raw material used in the making of aromatic hydrocarbon, i.e. phenol, is a chemical of concern.
(4) Methylene diphenyl diisocyanate (MDI) – One of the raw material used in the making of MDI is MDA (4,4-methylenedianiline), which is classified as a human carcinogen. Conversion to MDI involves phosgene. MDI is primarily a respiratory tract irritant
Figure 1: Particleboard coupon

4 | P a g e
(effect: asthma), a skin, eye, mucous membrane irritant (effect: contact dermatitis) and a sensitizer.
Formaldehyde is characterized by various toxicity attributes, leading to the following health issues6,7:
• Acute (short-term) health effects : Irritation of the eyes, nose, throat and skin; Skin contact results in severe irritation and burns and some formaldehyde may pass through the skin; When inhaled, formaldehyde causes narrowing of the bronchi resulting in coughing, wheezing, chest pains, and bronchitis.
• Chronic (long-term) health effects: Formaldehyde is a known human carcinogen; Prolonged exposure may cause dermatitis and asthma attacks; Formaldehyde exposure is a potential reproductive hazard.
There are different possible strategies to reduce the formaldehyde exposure from particleboards8, among which the following can be found:
Modified urea formaldehyde resins with scavenger additives (i.e. melamine), to reduce the rate of emissions of formaldehyde
Use of other formaldehyde resins (i.e. phenol formaldehyde), with higher cross-linking density hence lower formaldehyde emissions in use
Use of alternate fossil fuel-based binders containing no added formaldehyde, such as methylene diphenyl diisocyanate (MDI)
Use of alternate binders based on renewable resource materials, such as vegetable oil.
We choose to investigate this last idea. Hence the objective of our research project is to replace the hazardous conventional formaldehyde based binders by resins from renewable sources, giving similar properties than the former, keeping in mind the cost-effectiveness. 2- MATERIALS AND METHODS 2.a- MATERIALS
RESINS:
The alternative for the conventional formaldehyde based binders are chosen in such a way that the resins are derived from renewable resources and are as eco-friendly as possible. The chosen binders are based on three epoxidized vegetable oils, namely Epoxidized Linseed Oil (ELO) (Figure 2), Epoxidized Soybean Oil (ESO) (Figure 3) and Epoxidized Castor Oil (ECO) (Figure 4).
The ELO9 was donated by Chemtura Corporation under the tradename Drapex 10.4, its oxirane content is equal to 9 %, according to the producer. ELO is FDA approved for incidental food contact10.

5 | P a g e
Figure 2: Chemical structure of Epoxidized Linseed Oil (ELO)
The ESO11 was donated by the Chemtura Corporation, under the tradename Drapex 6.8,
Chemtura. Its Oxirane Oxygen is reported as 7 % according to the producer. ESO is FDA approved for direct addition to food for human consumption12.
Figure 3: Chemical structure of Epoxidized Soybean Oil (ESO)
The ECO was donated by Hexion, under the tradename Heloxy 50513. Its weight per
epoxide is 601 g/eq according to the producer.
Figure 4: Chemical structure of Epoxidized Castor Oil (ECO)
For the sake of comparison with the actual binders used in particleboards, two formaldehyde based resins were purchased: a urea formaldehyde resin (Cymel U-65) and a melamine formaldehyde resin (Cymel 303) resin. The catalyst used in the curing of the formaldehyde based resins is dodecylbenzenesulfonic acid, purchased from Sigma-Aldrich.
CROSSLINKERS:
The crosslinkers (Table 1; Figures 5-8) for the curing of these bioepoxies are also chosen
in such a way that their level of toxicity is as minimal as possible. Most of the following study is

6 | P a g e
devoted to optimizing the curing conditions of the various resin – crosslinker couples in order to achieve a high degree of cross-link density in the binder and a low percentage of extractables.
Table 1: Used crosslinkers
Crosslinker Name Chemical Family
L-Tryptophan14/L-Lysine15 Amino Acid
TETA (Triethylenetetramine)16 Polyimine
PEI (PolyethyleneImine) 17 (Mn ~ 600) Polyimine
Figure 5: Chemical structure of L-Tryptophan [Sigma-Aldrich, T0254]
Chemical name: (S)-2-Amino-3-(3-indolyl)propionic acid, L-α-Amino-3-indolepropionic acid
Figure 6: Chemical structure of L-Lysine [Sigma-Aldrich, L5501] Chemical name: (S)-2,6-Diaminocaproic acid
Figure 7: Chemical structure of Triethylenetetramine [Sigma-Aldrich, 90462]

7 | P a g e
Figure 8: PolyethyleneImine [Polysciences Inc.]
TETA and PEI are highly alkaline and may act as sensitizers. However, PEI is commonly used by biochemists in presence of mammalian cells18,19.
BASIC REACTIONS:
The basic epoxy chemistry lies in the ring opening reaction of the oxirane ring (epoxide group) with either an amine or an acid. The crosslinking agents chosen are all amine based and they undergo the basic two-step reaction presented on Figures 9 & 10 20.
Figure 9: 1st step: Reaction of the epoxy group with a primary amine
Figure 10: 2nd step: Reaction with a secondary amine
For each of the resin – crosslinker couple, the stoichiometric ratios needed for the
crosslinking reaction have been calculated (see Appendix A-1 to A-10). Those stoichiometric ratios are used as a starting point for the curing reaction of the resins; they are further optimized as explained in section 2-b.

8 | P a g e
INCORPORATION OF NANOCLAY:
An extension to the preparation of the bioepoxy based binders consists in adding nanoparticles in the form of nanoclay. As these clays are commonly found and naturally occurring, they are generally recognized as safe and represent a hazard only as a nuisance dust at very high airborne concentrations. Likewise, the alkylammonium modifiers used to compatibilize the nanoclay are found in fabric softeners and detergents with a long safety history, and are known to be biodegradable in the environment. The nanoclay will help to ensure that the chosen bioepoxies display levels of stiffness and creep resistance similar to conventional binders. They also represent a promising avenue to enhance the fire21, barrier22 and moisture resistance of the polymer, with only a few weight percent loading of nanoparticles.
This concept will be applied to the binder families that are the most promising. The
nanoclay chosen is Cloisite 30B23 (Southern Clay Products), a natural montmorillonite modified with bis(2-hydroxyethyl)methyltallowammonium cations (see Figure 11).
Three different loading levels of the clay in the bioepoxies, namely 1 wt%, 2 wt% and 4
wt%, are investigated. These nanoclays were introduced in the optimized ELO - PEI system.
2.b- METHODS
SAMPLE PREPARATION For each chosen couple of resin – crosslinking agent, the resin is mixed with the crosslinking agent in a speed mixer (FlackTek DAC-150FV SpeedMixer) (Figure 12)24 at 3540 rpm for 2 minutes; this device ensures the degassing of the liquid mixture as well as a homogeneous mixing.
Figure 11: Chemical structure of Cloisite 30B

9 | P a g e
The mixture is poured onto an aluminum pan and cured in a convection oven. All the tested curing times and curing temperatures for the optimization are gathered in Table 2. In all cases, the oven heating rate is set to 3.3°C/min. Once cured, the sample is left in the shut-off oven for 2 ½ hrs (in order to ensure no thermal stress build-up in the sample). Table 2: Set of tested conditions
SOLVENT UPTAKE ANALYSIS25 The optimization of the bioepoxies curing is carried out through a solvent uptake
analysis. The idea behind this test is to swell the cured sample in a good solvent; this enables to extract all of the unreacted monomers from the sample, and also to evaluate the level of crosslink density in the produced network.
The first step of the solvent uptake analysis consists in finding a right solvent for the sample. A good solvent is a solvent in which the sample swells reasonably well (so that the unreacted monomers can actually escape), but not so much that the chemical pressure makes it burst. For each of the resin – crosslinking agent couple, one or two good solvents are found out of the various solvents that are tested. An illustration is given on Figure 13. For each resin – crosslinking agent couple and each selected solvent, the crosslink density is quantified through the parameter Vr, given by the following equation:
Curing temperatures (°C) 120°C 160°C
Curing time (hrs) 3 6 12 18
Figure 12: Speed Mixer

10 | P a g e
where, mswollen – Weight of the sample in the swollen state after a particular given time mdry – Weight of the equilibrated swollen sample after it as been vacuum dried
Figure 13: ELO - PEI sample in acetone during the solvent uptake analysis
The lower the value of Vr, the higher the degree of swelling the system undergoes in the particular solvent which implies the lower its crosslinks density. The solvent uptake parameter value Vr is directly proportional to the crosslink density. For each resin – crosslinking agent couple and each selected solvent, the amount of extractables in the system is determined by the following equation:
100% ×⎟⎟⎠
⎞⎜⎜⎝
⎛ −=
i
fi
WWW
esExtractabl
where, Wi – Initial weight of the cured sample before it is immersed in solvent
Wf – Final weight of the vacuum dried sample after the swelling analysis % Extractables – Amount of unreacted monomers in the cured sample

11 | P a g e
OPTIMIZATION OF THE CURING PARAMETERS
The curing reaction of the bioepoxies with the various curing agents has to be optimized in terms of:
(1) The curing time (2) The curing temperature (3) The resin to hardener ratio In order to carry out the optimization of the curing parameters, a stoichiometric mixture of
the bioepoxy and the curing agent is prepared and it is cured at different temperatures and for different times. The crosslink density and the extent of the cure are then evaluated through an equilibrium solvent uptake analysis (see the previous section for details). Depending upon the results, the resin to hardener ratio, along with the curing time and the curing temperature are modified. A set of conditions is said to be optimized if the cured bioepoxy has the highest level of crosslink density and the lowest amount of extractables.
DENSITY MEASUREMENTS The density of the cured sample is determined by calculating first the mass of the specimen in air and then the mass of the specimen immersed in a liquid (water is used as a reference). Its apparent mass upon immersion is determined and its specific gravity (relative density) is then calculated. This test is carried out at room temperature. Such a procedure is in accordance to the ASTM Standard D792 – 08.
SAMPLE PREPARATION FOR MECHANICAL TESTING A silicone mold is designed and created (see Figure 14) in order to produce the flexure bars for the mechanical testing; the silicone was purchased from Freeman Manufacturing and supply company. The flexure bars of the optimized ELO - PEI and the ESO - PEI systems are prepared by pouring the chosen mixture of resin and crosslinking agent into the slots of the mold; the mold is then first transferred to a vacuum oven and undergoes a cycle of purging at primary vacuum (to remove any gas from the poured mixture). Right after the mold is placed in a convection oven (already heated) for the desired amount of curing time. The oven is shut off after that period, and the mold is allowed to go back to room temperature. Once the resin samples are removed, the mold is cleaned with ethanol (so that it does not swell the silicone) to remove any traces of unreacted monomers left on it.

12 | P a g e
Figure 14: Home-made silicone mold for flexure bar processing
Figure 15: Flexure bar prepared thanks to the silicone mold
(ELO - PEI [1:1.4] cured at 160°C for 18 hrs) An example of a cured flexure bar is presented on Figure 15.
13 | P a g e
MECHANICAL TESTING The mechanical tests are performed on a Dynamic Mechanical Analyser (DMA) TA Q800 DMA. This device enables to measure the storage modulus, the loss modulus and therefore the damping capacity of the resin. The tests are performed in a three-point bend configuration, and most of them are carried out at room temperature. 3- RESULTS & DISCUSSIONS: 3.a- OPTIMISATION OF THE CURING CONDITIONS
3.a.1- Epoxidized Linseed Oil (ELO) and Epoxidized Soybean Oil (ESO) with PolyethyleneImine (PEI)
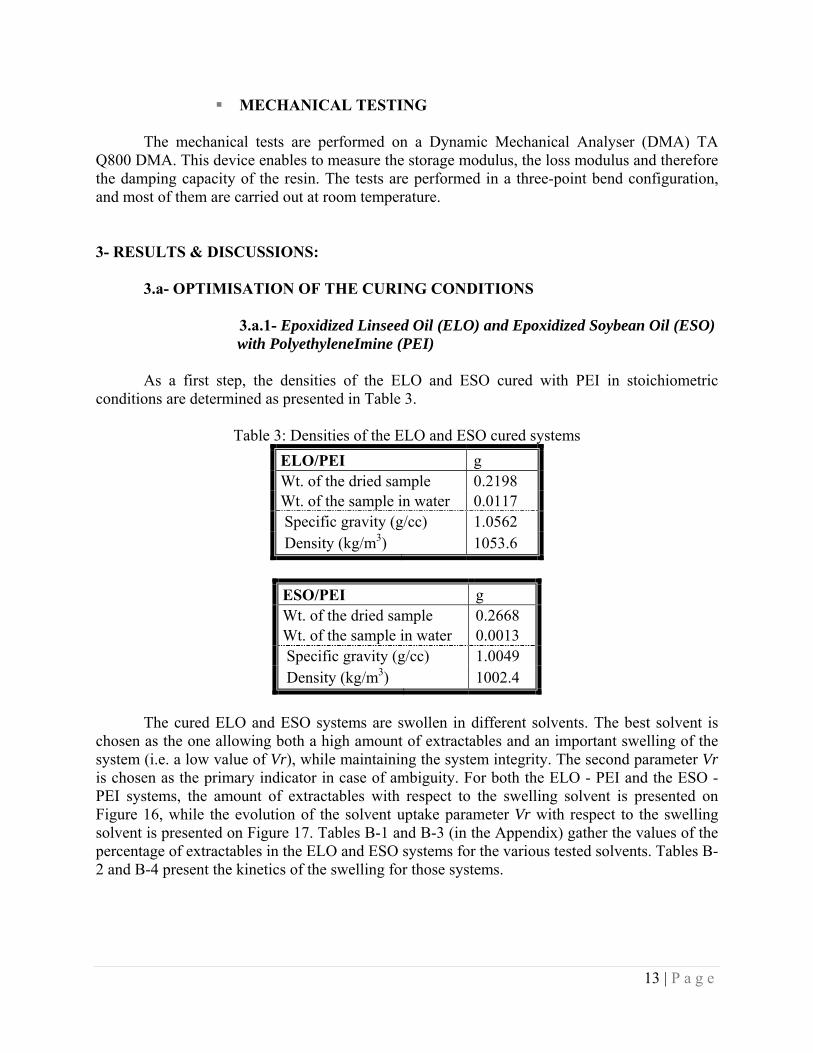
As a first step, the densities of the ELO and ESO cured with PEI in stoichiometric conditions are determined as presented in Table 3.
Table 3: Densities of the ELO and ESO cured systems ELO/PEI g Wt. of the dried sample 0.2198 Wt. of the sample in water 0.0117 Specific gravity (g/cc) 1.0562 Density (kg/m3) 1053.6
ESO/PEI g Wt. of the dried sample 0.2668 Wt. of the sample in water 0.0013 Specific gravity (g/cc) 1.0049 Density (kg/m3) 1002.4
The cured ELO and ESO systems are swollen in different solvents. The best solvent is
chosen as the one allowing both a high amount of extractables and an important swelling of the system (i.e. a low value of Vr), while maintaining the system integrity. The second parameter Vr is chosen as the primary indicator in case of ambiguity. For both the ELO - PEI and the ESO - PEI systems, the amount of extractables with respect to the swelling solvent is presented on Figure 16, while the evolution of the solvent uptake parameter Vr with respect to the swelling solvent is presented on Figure 17. Tables B-1 and B-3 (in the Appendix) gather the values of the percentage of extractables in the ELO and ESO systems for the various tested solvents. Tables B-2 and B-4 present the kinetics of the swelling for those systems.

14 | P a g e
Figure 16: Amount of extractables in various solvents for the ELO and the ESO systems
Figure 17: Values of Vr in various solvents for the ELO and the ESO systems

15 | P a g e
From the swelling analysis, it is concluded that dichloromethane is the best solvent for the ELO cured samples (later on acetone will be chosen as the back-up solvent) and acetone and xylenes for the ESO cured samples. The selected solvents give the maximum swelling i.e. the minimum value of Vr, indicating that the cured systems swell the most without any disintegration in these solvents, thus removing all the possible unreacted monomers from the cured resin.
It is to be noted here that the mentioned solvents are used to characterize the level of crosslinking occuring during the resin curing. In no case do they intervene in the curing of the bioepoxies. Once the optimization of the curing is achieved, the solvents will no longer be used in the materials processing steps.
Once the best solvent is selected for the respective bioepoxies, the optimization of the
curing time is performed. First, the curing time is optimized by curing the bioepoxies at different curing times (3 hrs, 6 hrs, 12 hrs and 18 hrs) keeping the curing temperature constant and mixing stoichiometric amounts of the resin and the crosslinking agent. One of the cured samples is presented on Figure 18.
Ultimately, the network should have the highest crosslink density (this will ensure that
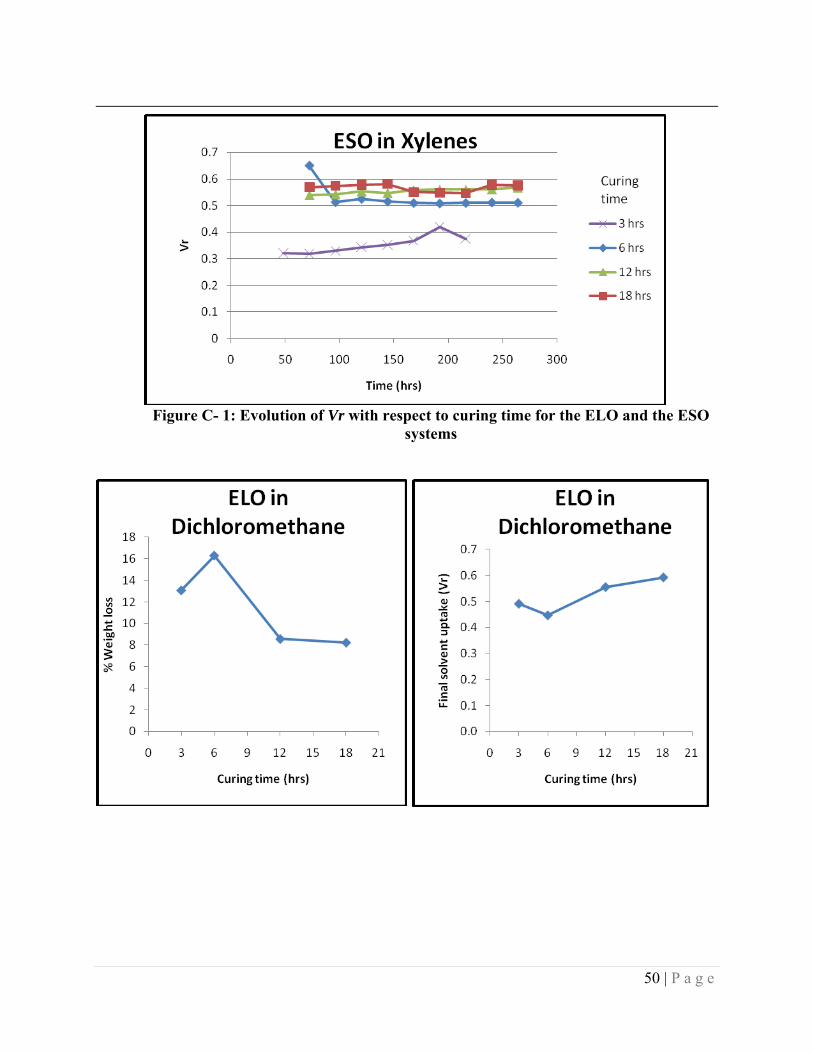
the number of unreacted monomers is minimal). Crosslinks do not swell: If a material has many crosslinks, the degree of swelling will be minimal and the parameter Vr (as defined in section 2-b) will be as high as possible (approaching one). Also, the percentage of extractables should be as low as possible (close to zero). Table 4 gathers the data for the weight loss and the parameter Vr at the various tested curing times. The data are also presented on Figures C-1 and C-2 in the Appendix. One can notice that the parameter Vr is the highest at the longest curing time. This means that a curing time of 18 hours for both the ELO - PEI and the ESO - PEI systems will ensure as high a crosslink density as possible. This is confirmed by the values of the percentage of extractables: they are the lowest at 18 hours of curing, meaning that a minimum amount of monomer is left unreacted after that amount of curing time. As a result, the optimized curing time was set to 18 hours.
Figure 18: ELO - PEI cured at 160°C for 18 hrs

16 | P a g e
Table 4: Solvent uptake values for the samples cured for different curing times
% Weight loss Solvent uptake (final) (Vr) Curing time (hrs) Dichloromethane Acetone Xylenes Dichloromethane Acetone Xylenes
3 13.09 33.62 33.99 0.4915 0.5569 0.3757
6 16.31 17.53 13.41 0.4469 0.6081 0.5110
12 8.59 10.54 7.72 0.5556 0.6542 0.5673
18 8.25 7.25 6.49 0.5926 0.6555 0.5756 ELO ESO ESO ELO ESO ESO
As a next step, the optimization of the curing temperature is performed for both
bioepoxies. The ELO and ESO are cured with the PEI at two different temperatures: 160°C (as previously performed) and 120°C; the samples are then compared through a solvent uptake analysis. This experiment is also performed to check if the dark top layer (see Figure 18) on the bioepoxies could be prevented. The dark layer on the bioepoxies is indeed thought to be linked to an oxidation reaction triggered by the high curing temperatures. Assuming that the reaction rate doubles every increase by one degree in the temperature, it is estimated that the curing at 120°C would take 48 hours to lead to a similar crosslink density as the one carried out at 160°C for 18 hours.
Table 5: Solvent uptake values of the samples cured at different curing temperatures
% Weight loss Solvent uptake (final) (Vr) Curing temperature
Curing time (hrs) DCM Acetone Xylenes DCM Acetone Xylenes
3 13.09 33.62 33.99 0.4915 0.5569 0.3757
6 16.31 17.53 13.41 0.4469 0.6081 0.5110
12 8.59 10.54 7.72 0.5556 0.6542 0.5673 160°C
18 8.25 7.25 6.49 0.5926 0.6555 0.5756
24 - 21.92 15.24 - 0.5658 0.4964 48 12.18 15.2 13.09 0.5146 0.6161 0.5339 120°C
60 15.32 - - 0.4706 - -
ELO ESO ESO ELO ESO ESO
On Table 5, one can observe that the ELO and ESO systems need to be heated up to a temperature of 160°C, as the samples cured at 120°C give a higher amount of unreacted monomers as compared to the samples cured at 160°C, despite the longer curing time. Also,

17 | P a g e
prolonging the curing did not help in leading to a better network as the values of extractables at 60 hours of curing at 120°C are worse than the ones at 160°C: a compromise need to be established between crosslinking the network further and minimizing the degradation by oxidation.
Once the curing time and the curing temperature are optimized, the resin to hardener
ratio needs to be fine-tuned. An excess of 10% to 90% (i.e. a 1:1.1 to 1:1.9 ratio) for the ELO - PEI system and ratios of 1:0.8 to 1:1.4 for the ESO - PEI system are investigated. A solvent uptake analysis is carried out to characterize the percentage of extractables (% extractables) in the cured products and the solvent uptake parameter Vr. The optimized systems are the ones exhibiting the lowest amount of extractables (with a % extractables close to zero) and the highest amount of crosslinks (i.e. a Vr parameter close to one).
As presented on Figure 19 to Figure 21 (data can be found in Appendix D-1), in the ELO system the addition of an excess of the curing agent improves the network (i.e. gives a lower value of % extractables). As a matter of fact, the excess of crosslinking agent induces more reaction of the ELO oxirane rings with the PEI amine groups, thereby decreasing the amount of unreacted monomers left in the final product.
Figure 19: Amount of extractables vs. resin-to-hardener ratio for the ELO - PEI swollen in
dichloromethane (The samples disintegrated for ratios above 1:1.3, as dichloromethane was the strongest solvent)

18 | P a g e
Figure 20: Amount of extractables vs. resin-to-hardener ratio for the ELO - PEI swollen in
acetone
Figure 21: Solvent uptake parameter Vr vs. resin-to-hardener ratio for the ELO - PEI swollen in
acetone
19 | P a g e
The optimized composition corresponds to the lowest point on the % extractables curve,
or the highest point in the Vr curve. In this case, the ratios 1:1.3 and 1:1.4 lead to very similar results. As the Vr parameter is more reliable than the % extractables (because of the experimental error associated with the solvent) the solvent uptake parameter Vr value is chosen to define the optimized ratio. As its Vr value is the highest, the ratio 1:1.3 is considered as the optimized one for the ELO - PEI system.
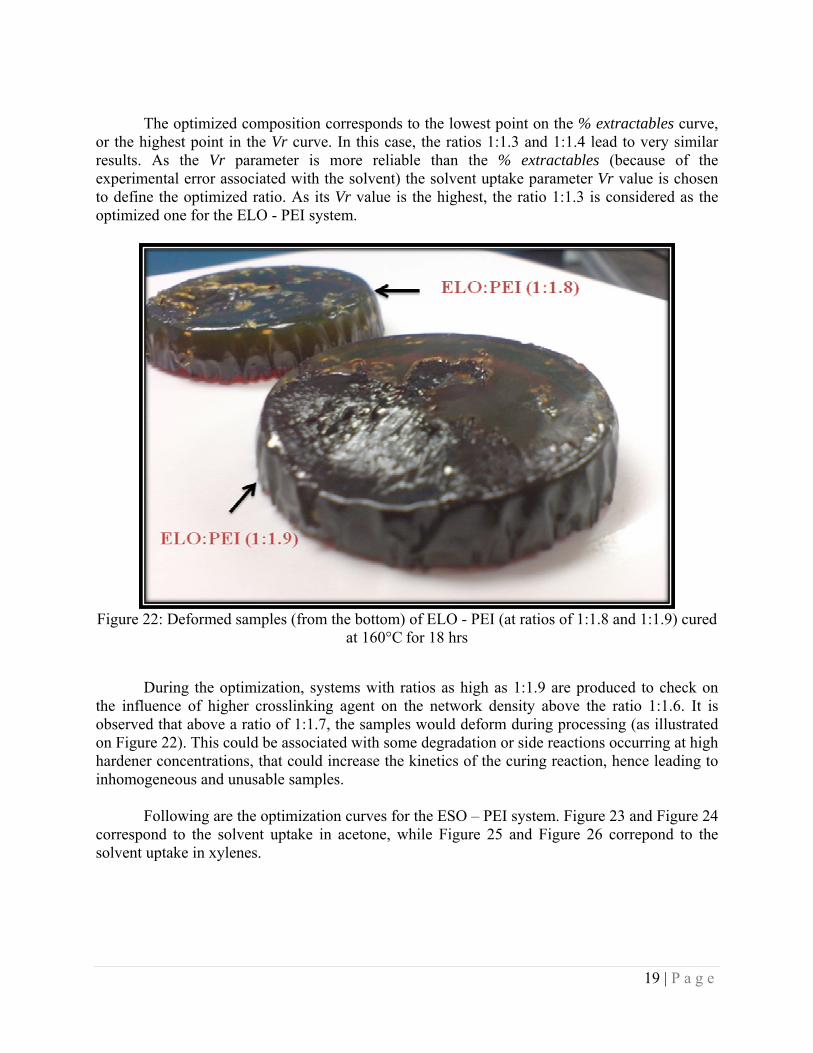
Figure 22: Deformed samples (from the bottom) of ELO - PEI (at ratios of 1:1.8 and 1:1.9) cured
at 160°C for 18 hrs
During the optimization, systems with ratios as high as 1:1.9 are produced to check on
the influence of higher crosslinking agent on the network density above the ratio 1:1.6. It is observed that above a ratio of 1:1.7, the samples would deform during processing (as illustrated on Figure 22). This could be associated with some degradation or side reactions occurring at high hardener concentrations, that could increase the kinetics of the curing reaction, hence leading to inhomogeneous and unusable samples.
Following are the optimization curves for the ESO – PEI system. Figure 23 and Figure 24
correspond to the solvent uptake in acetone, while Figure 25 and Figure 26 correpond to the solvent uptake in xylenes.

20 | P a g e
Figure 23: %weight loss vs. resin-to-hardener ratio for the ESO - PEI samples swollen in acetone
Figure 24: Solvent uptake parameter Vr vs. resin-to-hardener ratio for the ESO - PEI samples
swollen in acetone

21 | P a g e
Figure 25: %weight loss vs. resin-to-hardener ratio for the ESO - PEI samples swollen in
xylenes.
Figure 26: Solvent uptake parameter Vr vs. resin-to-hardener ratio for the ESO - PEI samples
swollen in xylenes

22 | P a g e
The highest value of Vr are reached at ratios between 1:1.2 and 1:1.4; the differences
between the parameters are then so limited that they are attributed to experimental error. As a result, the average of a ratio of 1:1.3 was chosen as the optimized ratio for the ESO - PEI system.
3.a.2- Epoxidized Linseed Oil (ELO) and Epoxidized Soybean Oil (ESO) with Triethylene Tetra Amine (TETA):
The second chosen curing agent, Triethylene Tetra Amine (TETA), has been also studied in the same way as the PEI, by optimizing the curing conditions and the resin-to-hardener ratio.
Figure 27: Comparison of % weight loss vs. curing time for the ELO cured with PEI or TETA
. As compared on Figure 27, the optimized curing time for the ELO - PEI system is 18 hrs, whereas for the ELO - TETA system the optimized curing time is 12 hrs. Under this set of conditions, the % extractables reaches a minimal value (i.e. fewer amounts of unreacted monomers) than could be reached in the ELO - PEI system.

23 | P a g e
Figure 28: Comparison of % weight loss vs. curing time for the ESO cured with PEI or TETA.
Likewise for the ESO - TETA system, it is observed on Figure 28 that the optimized
curing time is 12 hrs.
The next optimization step consists in adjusting the resin-to-hardener ratio. Samples with an excess of 10% to 60% (i.e. 1:1.1 to 1:1.6) of the curing agent (TETA) are produced for the ELO system and samples with ratios of 1:0.9 to 1:1.4 are produced for the ESO system. A solvent uptake analysis is carried out to characterize the % extractables in the cured product and the solvent uptake parameter Vr.

24 | P a g e
Figure 29: Comparison of the % weight loss vs. different ratios of PEI or TETA for the ELO
based resins.
Figure 30: Comparison of Vr vs. different ratios of PEI or TETA for the ELO based resins

25 | P a g e
As for the ELO - TETA system, resin-to-hardener ratios of 1:1 to 1:1.2 cured for 12 hours lead to very limited amount of extractables (Figure 29). As already noted, when the % extractables are very similar, the solvent uptake parameter Vr is taken as the choice parameter. As compared on Figure 30; the highest values of Vr are reached for a ratio of 1:1.2; and for ratios higher than 1:1.5. The higher ratios lead to deformed samples (in a similar way as what was observed for the ELO – PEI system). As a result, the resin-to-hardener ratio 1:1.2 is considered the optimized ratio for the PEI – TETA system.
Figure 31: Comparison of the % weight loss vs. different ratios of PEI or TETA for the ESO
based resins
26 | P a g e
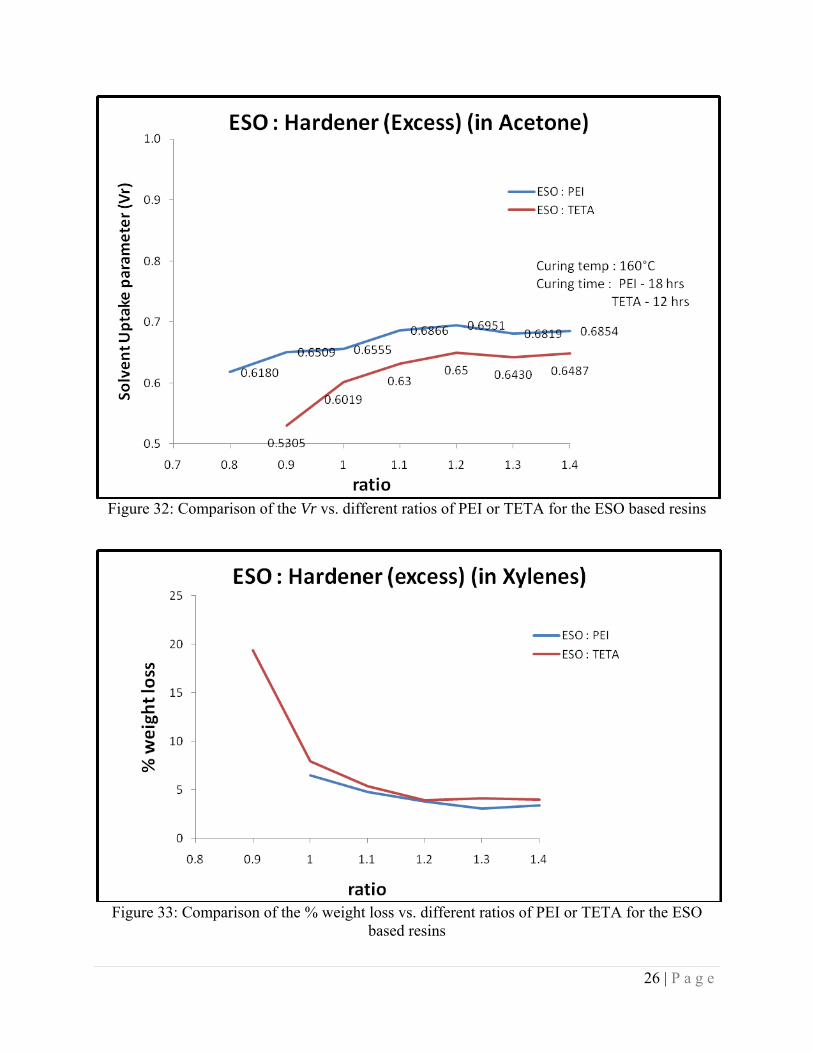
Figure 32: Comparison of the Vr vs. different ratios of PEI or TETA for the ESO based resins
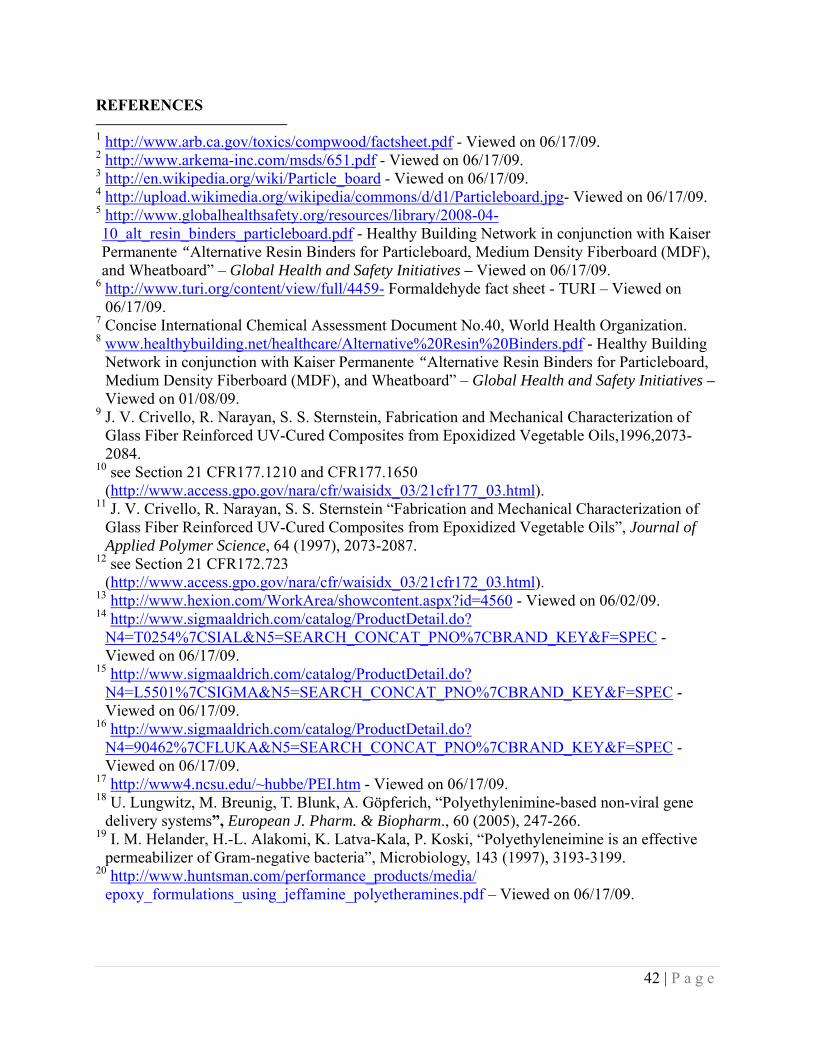
Figure 33: Comparison of the % weight loss vs. different ratios of PEI or TETA for the ESO
based resins

27 | P a g e
Figure 34: Comparison of the % weight loss vs. different ratios of PEI or TETA for the ESO
based resins
As for the ESO - TETA cured at 12 hrs at 160°C, both solvents (acetone and xylenes) show the same trend. (Figure 31 and Figure 33) with respect to the % extractables. The curve levels off at a ratio of 1:1.2. Here again, the Vr values are taken as the choice parameter, since the % extractables are very similar. 1:1.2 appears as the optimum ratio for the ESO - TETA, as Vr reaches a maximum at this concentration on Figure 32 and Figure 34. Figures E-1 and E-2 in the Appendix section compare the ELO and ESO systems for the two curing agents already studied; it clearly shows that the ELO system is better than the ESO system in terms of the % extractables and the crosslink density. The optimized ELO system has lower (no) unreacted monomer left in the final product and also has a higher solvent uptake parameter Vr (crosslink density) as compared to the ESO system. It is also observed that the rigidity (stiffness) of the ELO based samples is better than the ones of the ESO based samples. When the curing agents are compared, the PEI gives a better network as compared to the TETA. This is because the PEI is highly branched (functional) as compared to the TETA and can react with the oxirane rings of the ELO easily, although it is true that the TETA would be more mobile (because of the structure) as compared to the PEI (which is bulky).

28 | P a g e
3.a.3- Epoxidized Linseed Oil (ELO) and Epoxidized Soybean Oil (ESO) with amino acids (L-Tryptophan and L-Lysine)
Initially the L-Tryptophan is chosen as one of the curing agents for the bioepoxies. The
bioepoxies are liquids in nature while the L-Tryptophan is solid (i.e. a coarse powder). So as to achieve a homogenous mixing of the amino acid with the bioepoxies, it is attempted to reduce the L-Tryptophan into a fine powder through freeze-drying: the principle consists in freezing the material (thanks to liquid nitrogen), then in reducing the pressure surrounding the powder and adding enough heat to allow the frozen solvent in the sample to sublime. A solution of L-Tryptophan and distilled water is created, a small amount of NH4OH is added to it. This solution is frozen in liquid nitrogen and then freeze-dried.
Both the as-received L-tryptophan and the freeze-dried L-tryptophan are mixed in stoichiometric ratios with the bioepoxy and cured at 160°C for various times (namely 3 hrs, 6 hrs, 12 hrs and 18 hrs). All samples dissolved during the solvent uptake test, meaning that the L-tryptophan, both in the as-received form and in the fine powder form, did not lead to any network; they are therefore useless as crosslinking agents.
L-Lysine (which belongs to the same family of amino acids; it is basically an aliphatic form of the aromatic L-Tryptophan) is thought as an alternative. The L-Lysine (like the L-Tryptophan) had to be freeze-dried to be reduced in fine powder. Despite its water solubility, the L-lysine did not get reduced in powder form through the freeze-drying process, as illustrated on Figure 35 (left). Trials are made on a range of different concentrations (from 3 wt% to 70 wt%) of the L-Lysine in water, but no attempt is successfull. As in the case of the L-Tryptophan, the as-received L-Lysine is mixed with ELO in stoichiometric ratios, but the reaction does not lead to any network; the final product is a thick viscous liquid with small chunks on the surface (Figure 35, right).
Figure 35: Chunks of L-lysine (left) and cured sample of L-lysine and ELO (right)

29 | P a g e
3.a.4- Curing of Epoxidized Castor Oil(ECO) with PolyethyleneImine (PEI) (Mw-600&10,000)
The curing of the Epoxidized Castor Oil (ECO) is investigated because it is expected that
the ECO will be more efficient than the other investigated epoxidized vegetable oils in that: (1) ECO should cure at room temperature (2) The curing time shouldld be less as compared to the ESO or the ELO (3) Less amount of hardener should be needed for curing
Figure 36: Curing of the Epoxidized Castor Oil (ECO) with PEI (Mw-600 on the left and Mw-
10,000 on the right)

30 | P a g e
Figure 36 gives a visual comparison between the ECO cured with a PEI of small molecular weight (Mw-600) and one of higher molecular weight (Mw-10,000). It is observed that the molecular weight of the PolyethyeleneImine (PEI) used for the curing of the ECO does not make any difference in the stiffness of the final sample. This is linked to the effective amine hydrogen equivalent weight which is almost the same in the two tested cases. Heating the resin at a higher temperature does not affect the stiffness of the sample much, but it increases the curing kinetics.
Figure 37: Comparison of the % weight loss vs. solvent for the ECO - PEI system

31 | P a g e
Figure 38: Comparison of the Vr vs. solvent for the ECO - PEI system
From the swelling analysis (see Figure 37 and Figure 38), one can conclude that Ethyl
acetate and Acetone are the best solvents for the ECO cured samples. The solvents selected give the maximum swelling i.e. the minimum value of Vr, indicating that the cured systems swelled the most without any disintegration in these solvents, thus removing all the possible unreacted monomers from the cured resin. The solvents also give the highest value of % extractables. The chloroform is not chosen as it would disintegrate the low cross-linked products (during optimization) and acetone is chosen although it is not the best solvent, because it would be easier to compare all the bioepoxies with one common solvent.
Nevertheless, the ECO systems in general are not as rigid as the ELO and ESO systems (this was evaluated by bending the samples). As a result, the study of the ECO – PEI systems is not carried any further.
3.a.5 - Optimization of the formaldehyde based resins A urea formaldehyde (UF) based resin and a melamine formaldehyde (MF) based resin are prepared so as to compare the bioepoxies with the conventionally used formaldehyde based binders in particleboards. The MF resin is cured with a dodecylbenzenesulfonic acid as a catalyst for various set of conditions (Table 6 and Table 7).

32 | P a g e
Table 6: Curing conditions and results of the UF resin
Curing temperature
(°C)
Curing time (hrs)
Catalyst loading level Results
125 48 1% Dissolved in all solvents, except xylenes 175 3 1% Foamed 150 12 1% Foamed 150 12 0.25% Foamed 150 12 0.10% Foamed 137 96 0.10% Brittle, dissolved in most of the solvents
137 96 0.25% Rigid, shattered in most solvents and dissolved in chlorine based solvents
Table 7: Curing conditions and results of the MF resin
Curing temperature
(°C)
Curing time
Catalyst loading level Comments
125 3 hrs 1% Foamed
125 24 hrs 0.10% Fragmented (escaping byproducts forming bubbles in the resin)
125 24 hrs 0.25% Flexible, rigid product, but dissolved in some solvents
125 48 hrs 0.25% Still dissolves in some solvents 150 3 hrs 0.25% Foamed 150 96 hrs 0.10% 137 96 hrs 0.10%
Rigid, shattered in the chosen solvent (i.e. 2-butanone/toluene)
137 96 hrs 0.25% Brittle, does not shatter in solvents except chlorine based solvents
137 96 hrs 0.50% Foamed, shattered in dichloromethane 137 24 hrs 0.25% 137 36 hrs 0.25% 137 48 hrs 0.25% 137 60 hrs 0.25% 137 72 hrs 0.25%
To reduce the curing time of the optimized sample (Bubbling of the byproducts)
As noted in the observations, the curing of the formaldehyde based resins is impaired by various problems: either the system is undercured (i.e. does not form a network) and simply dissolves in a solvent; or the system leads to a material so heavily crosslinked that it shatters

33 | P a g e
under the chemical pressure of a solvent; or the system starts curing so fast it generates gas that is trapped in it and leads to a foam (see illustration on Figure 39) . Formaldehyde based resins are known to cure fast; as a result, they are generally compression-molded or hot-pressed in industrial settings to extract any by-products; this leads to samples without bubbles. Unfortunately we do not have access to something else but a convection oven to prepare our samples. One decent set of conditions is isolated (see the yellow-highlight in Table 7) where a correct sample is produced from the MF based resin. A solvent selection is then performed on this sample, as presented on Figure 40 and Figure 41. It is concluded that 2-butanone and Toluene are the best solvents for the MF system, as they give the highest percentage of extractables and the least solvent uptake parameter Vr. Given the difficulty in preparing bulk samples, the study on the formaldehyde based resin has been deliberately interrupted at this point, to focus on the core of the research project, the binder from renewable resources.
Figure 39: Foamed MF sample with a catalyst loading level of 0.28 wt% at 140°C

34 | P a g e
Figure 40: Solvent selection for the MF resin (comparing % extractables).
Figure 41: Solvent selection for the MF resin (comparing final Vr).

35 | P a g e
3.b- MECHANICAL TESTING OF THE BIOEPOXY SYSTEMS 3.b.1- Sample preparation Degassing of bubbles is always an issue with thermosets (see Figure 42). To overcome this problem, the best solution is adding a degassing step to the preparation route. The resin and hardener solution is poured into the mold and then kept under vacuum (with the pump is running) overnight. It then undergoes three cycles of vacuum and purge, which removes the bubbles completely. The mold is then transferred to a preheated convection oven for curing at the required curing temperature.
Figure 42: Flexure bars with bubbles made of ELO - PEI (1:1.4) cured at 160°C for 18 hrs
without and with Cloisite 30 B (nanoclay) loading level of 2 %wt.
The samples with nanoclay in them show poor surface finish at the bottom of the flexure bars (Figure 43). It turns out to be linked to the use of a silicone mold and is not related to the clay presence. This problem is solved with the degassing technique.

36 | P a g e
Figure 43: Bottom of the flexure bar made of ELO - PEI (1:1.4) cured at 160°C for 18 hrs with
Cloisite 30 B (nanoclay) loading level of 2 %wt
3.b.2– First series of experiments As a first set of mechanical experiments, a selection of samples having undergone different preparation routes was tested (see Table 8). A three-point bend test was performed on each sample at room temperature. The results are presented on Figure 44. The ELO - PEI optimized flexure bars that are tested for mechanical properties (by DMA) are cured at 160°C for 18 hrs and their ratio of the ELO to PEI is 1:1.3.
Table 8: First set of samples tested by DMA
Sr. No. Parameters 1 w/o degassing w/o conditioning 2 w/o degassing with conditioning 3 with degassing w/o conditioning (Dark) 4 with degassing w/o conditioning (Clear) 5 with degassing w/o conditioning (2 wt% Clay)

37 | P a g e
Figure 44: Storage modulus of the samples cured under different conditions.
First it should be noted that the results do not indicate a clear trend on the role of degassing: the bubbles in the samples are expected to play a role on the strength of the materials, but not on the modulus. Most remarkably, the resin with the optimized composition shows a lot of variability in its storage modulus, as can be observed with the clear and dark degassed but not conditioned samples. This is linked to the thermal gradient experience by the various samples of the same mold while curing, and is further investigated in the following section. Finally, the addition of the Cloisite 30B (nanoclay) at a loading level of 2 wt% leads to a potential increase in the modulus value. This will need to be confirmed on several samples, when the resin values would have less variability.

38 | P a g e
Figure 45: Storage modulus vs. temperature of the flexure bar which was degassed and not
conditioned, from -60°C to 170°C at 30°C/min
A degassed (but non-conditioned) sample of the pure resin is submitted to a DMA test from -60°C to 170°C at 3°C/min as presented on Figure 45. While the modulus reaches values as high as 1.4 GPa at low temperatures, it can be noted that the main relaxation temperature of the resin is around 50°C; which is relatively close to room temperature. This could be of concern in industrial applications, as a change in a few degrees around room temperature could lead to tremendous change in the mechanical behavior. Again, further investigations on the repeatability of those results would help to better characterize the behavior of the bioepoxy.

39 | P a g e
Figure 46: Effect of the clay presence on the sample modulus evolution with time
Isothermal DMA tests are used to compare the stiffness of the samples with respect to different clay concentrations (Figure 46). The samples are made of ELO - PEI (1:1.3)cured at 160°C for 18 hrs , with the different loading levels of clay (1wt%, 2wt% and 4 wt%). The samples are tested at 30°C with a three-point bend test. It is seen that as the loading of the clay increases, the modulus value of the flexure bars increases. All the clay samples are prepared under the same conditions in the same batch. But the neat polymer has been prepared in a different batch. The heating profile of the neat bioepoxy could have been different, which could explain the relative position of the non-filled samples compared to the filled ones.
3.c– INVESTIGATION OF THE CURING CONDITIONS
One of the major problems that arose during the investigation is the reproducibility of the flexure bars made with the silicone mold. The samples prepared for the optimization of the curing conditions in the aluminum pans appear stiffer as compared to the flexure bars prepared in the silicone mold. It is possible that the heating profile of the silicone mold is different than the one of the aluminum pans. In order to achieve reproducible stiff flexure bars with the silicone mold, InfraRed (IR) images (thanks to a FLIR system) are captured on the aluminum pan and on the silicone mold to find the surface temperatures (Figure 47). This gives us useful information regarding the difference in the heating profile and also the heating gradient within the silicone mold. It is seen that the set oven temperature (320°F) is different from the surface temperature of the silicone mold (~308°F) and the aluminum pan (180°F).

40 | P a g e
Figure 47: IR imaging of the aluminum pan and silicone mold at the set curing temperature
(160°C – 320°F) for the bioepoxies
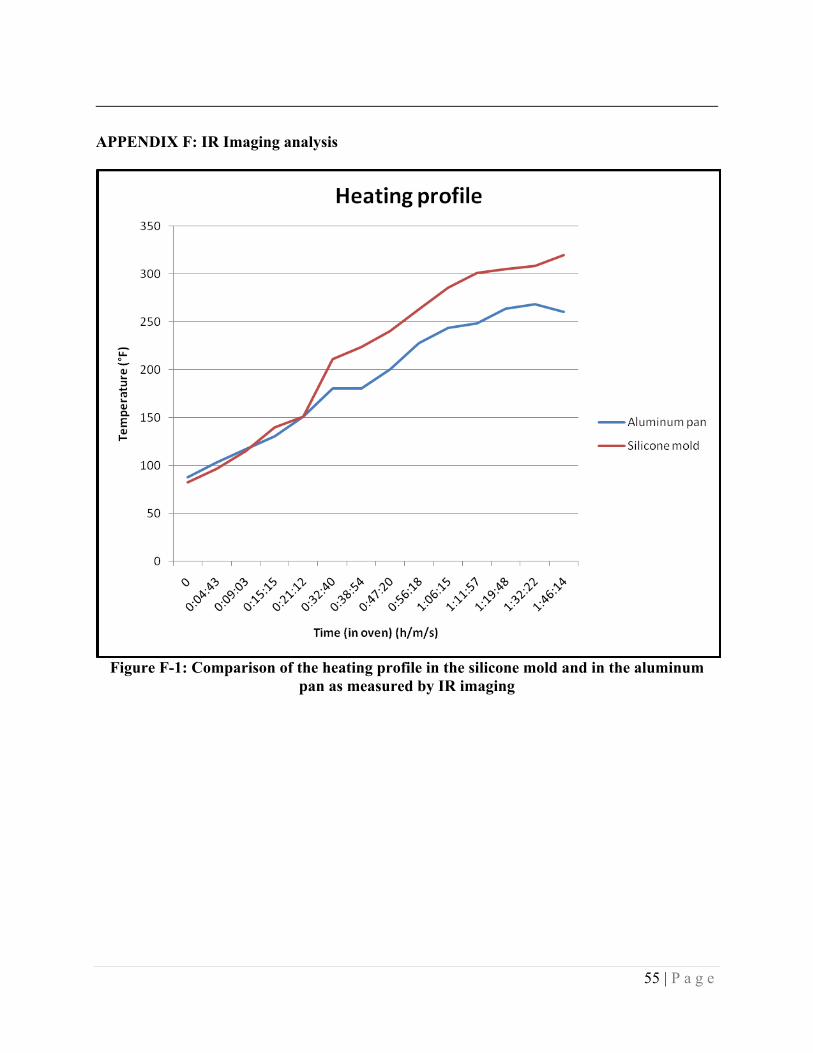
A complete IR imaging analysis is carried out to determine the heating profile of both molds and it is seen that at the set curing temperature (160°C) of the oven, the silicone mold is at a higher temperature as compared to the aluminum pan (Figure F-1). The bioepoxies undergo degradation at high temperatures and lose their stiffness. Therefore, the oven should be set at a lower temperature to get stiff samples, cured using the silicone mold.
The temperature gradient in the silicone mold was also checked with the IR imaging. The temperatures at the different locations were mostly uniform (Table F-1, Figure F-2). Thus, it is recommended to use the convection oven for reproducibility of the flexure bars. The vacuum oven gives a temperature gradient due to non-uniform heating of the mold at the different locations.
4- CONCLUSIONS AND RECOMMENDATIONS Throughout this project, the curing of the bioepoxies (ELO and ESO) has been optimized with two curing agents, TETA (Triethylenetetramine) and PEI (PolyethyleneImine). The optimization has been performed by varying the curing time, the curing temperature and the ratio of the resin to crosslinking agent, and by checking the effect of those parameters on the network formation through a solvent uptake analysis. The optimized conditions are gathered in Table 9:

41 | P a g e
Table 9: Optimized curing conditions for the achieved bio-derived binders
Resin Hardener Curing temperature (°C)
Curing time (hrs) Ratio
ELO PEI 160°C 18 hrs 1 : 1.3 ESO PEI 160°C 18 hrs 1 : 1.3 ELO TETA 160°C 12 hrs 1 : 1.2 ESO TETA 160°C 12 hrs 1 : 1.2
Among the bioepoxies, the ELO systems seem to form a better network as compared to the ESO system. This is because the ELO has a higher oxirane oxygen content (9 %) as compared to the ESO resin (7 %). With respect to the curing agents, the PEI seems to be a better hardener, as it is highly functional (branched) as compared to the TETA. The amount of TETA (1.2) required for curing the biopeoxy is less compared to the PEI (1.3) though, as the TETA is more mobile than the PEI (which is bulky). The curing of the bioepoxy with the amino acids has not been successful at the moment because none of the amino-acids could be reduced in a fine enough powder to mix with the resin. An alternative to this issue is the use of Calcium Lysinate & Magnesium Lysinate (commercialized by Scandinavian Formulas), which would provide the needed amino-acids in the form of a fine powder. Flexure bars for the mechanical testing have been prepared and a dynamic mechanical analysis has been carried out on the optimized ELO - PEI system. The problem of bubbles has been solved by the degassing technique. The problem of the temperature homogeneity in the oven has led to flexure bars with inconsistent properties and needs to be further addressed. IR imaging gives useful information regarding the heating profile and it is expected that the silicone mold will give stiffer flexure bars, when cured at a lower temperature. Storage moduli ranging from 200 to 800 MPa in the cured bioepoxy samples have been achieved (current industrial binders have a modulus in the 1,000 to 2,000 MPa range). The incorporation of nanoclay could lead to some modulus enhancement, but the inconsistent resin properties do not allow for any conclusion on the role of the nanoclay as of now. A reproducibility study is the next needed step in this study so as to evaluate the range of variability for the modulus of the given bioepoxies. Following that study, the influence of the clay loading and the wood flour loading on the bioepoxies will have to be characterized. In particular, it is recommended to perform the following tests on coupons of the obtained materials: dynamic mechanical analysis for the storage modulus evaluation; Impact strength using an instrumented drop impact tester (ASTM D3763); Fracture face analysis via field emission scanning electron microscopy (FE-SEM); Immersion testing (ASTM 1037-06a); Fire properties testing (Heat release and mass loss rates, heat of combustion)
The optimized biopeoxies (with/without nanoclay) will be compared with the conventional formaldehyde based binders (MF/UF) used for particleboards, in order to assess the viability of the proposed approach.
42 | P a g e
REFERENCES 1 http://www.arb.ca.gov/toxics/compwood/factsheet.pdf - Viewed on 06/17/09. 2 http://www.arkema-inc.com/msds/651.pdf - Viewed on 06/17/09. 3 http://en.wikipedia.org/wiki/Particle_board - Viewed on 06/17/09. 4 http://upload.wikimedia.org/wikipedia/commons/d/d1/Particleboard.jpg- Viewed on 06/17/09. 5 http://www.globalhealthsafety.org/resources/library/2008-04-10_alt_resin_binders_particleboard.pdf - Healthy Building Network in conjunction with Kaiser Permanente “Alternative Resin Binders for Particleboard, Medium Density Fiberboard (MDF), and Wheatboard” – Global Health and Safety Initiatives – Viewed on 06/17/09.
6 http://www.turi.org/content/view/full/4459- Formaldehyde fact sheet - TURI – Viewed on 06/17/09.
7 Concise International Chemical Assessment Document No.40, World Health Organization. 8 www.healthybuilding.net/healthcare/Alternative%20Resin%20Binders.pdf - Healthy Building
Network in conjunction with Kaiser Permanente “Alternative Resin Binders for Particleboard, Medium Density Fiberboard (MDF), and Wheatboard” – Global Health and Safety Initiatives – Viewed on 01/08/09.
9 J. V. Crivello, R. Narayan, S. S. Sternstein, Fabrication and Mechanical Characterization of Glass Fiber Reinforced UV-Cured Composites from Epoxidized Vegetable Oils,1996,2073-2084.
10 see Section 21 CFR177.1210 and CFR177.1650 (http://www.access.gpo.gov/nara/cfr/waisidx_03/21cfr177_03.html).
11 J. V. Crivello, R. Narayan, S. S. Sternstein “Fabrication and Mechanical Characterization of Glass Fiber Reinforced UV-Cured Composites from Epoxidized Vegetable Oils”, Journal of Applied Polymer Science, 64 (1997), 2073-2087.
12 see Section 21 CFR172.723 (http://www.access.gpo.gov/nara/cfr/waisidx_03/21cfr172_03.html).
13 http://www.hexion.com/WorkArea/showcontent.aspx?id=4560 - Viewed on 06/02/09. 14 http://www.sigmaaldrich.com/catalog/ProductDetail.do?
N4=T0254%7CSIAL&N5=SEARCH_CONCAT_PNO%7CBRAND_KEY&F=SPEC - Viewed on 06/17/09.
15 http://www.sigmaaldrich.com/catalog/ProductDetail.do? N4=L5501%7CSIGMA&N5=SEARCH_CONCAT_PNO%7CBRAND_KEY&F=SPEC - Viewed on 06/17/09.
16 http://www.sigmaaldrich.com/catalog/ProductDetail.do? N4=90462%7CFLUKA&N5=SEARCH_CONCAT_PNO%7CBRAND_KEY&F=SPEC - Viewed on 06/17/09.
17 http://www4.ncsu.edu/~hubbe/PEI.htm - Viewed on 06/17/09. 18 U. Lungwitz, M. Breunig, T. Blunk, A. Göpferich, “Polyethylenimine-based non-viral gene
delivery systems”, European J. Pharm. & Biopharm., 60 (2005), 247-266. 19 I. M. Helander, H.-L. Alakomi, K. Latva-Kala, P. Koski, “Polyethyleneimine is an effective
permeabilizer of Gram-negative bacteria”, Microbiology, 143 (1997), 3193-3199. 20 http://www.huntsman.com/performance_products/media/
epoxy_formulations_using_jeffamine_polyetheramines.pdf – Viewed on 06/17/09.

43 | P a g e
21 B. Schartel, M. Bartholmai, U. Knoll, “Some comments on the main fire retardancy
mechanisms in polymer nanocomposites”, Polymers for Advanced technologies, 17 (2006) 772-777.
22 H. Uyama, M. Kuwabara, T. Tsujimoto, M. Nakano, A. Usuki, S. Kobayashi, “Organic-Inorganic Hybrids from Renewable Plant Oils and Clay”, Macromolecular Bioscience, 4 (2004) 354-360.
23 http://www.turi.org/library/turi_publications/university_research_in_sustainable_technologies/ improved_lead_free_wire_and_cable_insulation_performance_using_nanocomposites_2006 - Viewed on 06/15/09.
24 http://www.speedmixer.com/dac150series.php - Viewed on 05/05/09. 25 D. Schmidt, Polysiloxane/layered silicate nanocomposites: synthesis, characterization, and
properties. (2003), 321 pp. From: Diss. Abstr. Int., B 2003, 64(4), 1867.

44 | P a g e
APPENDIX
APPENDIX A: Calculations of the stoichiometric ratios of resin to crosslinking agent: Appendix A gives the calculations of the stochiometric ratios of each of the used chemical reactions. Those stoichiometric ratios are used as a basis for the curing of the resins, and have been further optimized. A-1: Calculation of Epoxide Equivalent Weight and Amine Hydrogen Equivalent Weight and ratio of PEI - ELO
(1) Epoxide Equivalent Weight (EEW) :
Given: Oxirane Oxygen (%) = 9 % EEW = Mass of polymer to give one mole of oxirane oxygen. 0.09/16 =5.625 mmol of oxirane per g of polymer EEW = 1000/5.625 = 177.77 g of polymer for one mole of oxirane oxygen. Amine Hydrogen Equivalent Weight (AHEW) :
Given: Amine Value : 20 mmol/g.solid
Amine Rate (%) : Primary : 35% Secondary : 35% Tertiary : 30%
AHEW = 1000/([2*20*0.35]+[20*0.35*1] ) = 1000/21 = 47.62
(2) Amount of curing agent required
A = Resin (ELO), B = Curing agent (PEI), A-B = Cured Product
47.62 g of PEI 177.77 g of Drapex 10.4
Ratio of Curing agent - Resin (PEI - ELO) = 1 : 3.75 (Theoretical value)

45 | P a g e
A-2: Calculation of Epoxide Equivalent Weight and Amine Hydrogen Equivalent Weight and ratio of PEI - ESO
Oxirane Oxygen (%) = 7 % Epoxide Equivalent Weight (EEW) = 228.57 g Amine Value = 20 mmol/g.solid Amine Hydrogen Equivalent Weight (AHEW) = 47.62 g Therefore, ratio of the PEI - ESO = 1:4.79 (Theoretical value)
A-3: Calculation of Epoxide Equivalent Weight and Amine Hydrogen Equivalent Weight and ratio of TETA - ELO
Oxirane Oxygen (%) = 9 % Epoxide Equivalent Weight (EEW) = 177.77 g Amine Value of TETA = 1443 mg of KOH / g Amine Hydrogen Equivalent Weight (AHEW) = 38.87 g of TETA per one mole Therefore, ratio of the PEI - ESO = 1 : 4.57 (Theoretical value)
A-4: Calculation of Epoxide Equivalent Weight and Amine Hydrogen Equivalent Weight and ratio of TETA - ESO
Oxirane Oxygen (%) = 7 % Epoxide Equivalent Weight (EEW) = 228.57 g Amine Value of TETA = 1443 mg of KOH / g Amine Hydrogen Equivalent Weight (AHEW) = 38.87 g of TETA per one mole Ratio of Curing agent - Resin (TETA - ESO) = 1 : 5.88 (Theoretical value)
A-5: Calculation of Epoxide Equivalent Weight and Amine Hydrogen Equivalent Weight and ratio of L-Tryptophan - ELO
Oxirane Oxygen (%) = 9 % Epoxide Equivalent Weight (EEW) = 177.77 g Amine Hydrogen Equivalent Weight (AHEW) = 68.07g Therefore, ratio of the L-Tryptophan - ESO = 1 : 2.61 (Theoretical value)
A-6: Calculation of Epoxide Equivalent Weight and Amine Hydrogen Equivalent Weight and ratio of L-Tryptophan - ESO
Oxirane Oxygen (%) = 7 % Epoxide Equivalent Weight (EEW) = 228.57 g Amine Hydrogen Equivalent Weight (AHEW) = 68.07g

46 | P a g e
Therefore, ratio of the L-Tryptophan - ESO = 1 : 3.357 (Theoretical value)
A-7: Calculation of Epoxide Equivalent Weight and Amine Hydrogen Equivalent Weight and ratio of L-Lysine - ELO
Oxirane Oxygen (%) = 9 % Epoxide Equivalent Weight (EEW) = 177.77 g Amine Hydrogen Equivalent Weight (AHEW) = 36.55g Therefore, ratio of the L-Tryptophan - ESO = 1 : 4.864 (Theoretical value)
A-8: Calculation of Epoxide Equivalent Weight and Amine Hydrogen Equivalent Weight and ratio of L-Lysine - ESO
Oxirane Oxygen (%) = 7 % Epoxide Equivalent Weight (EEW) = 228.57 g Amine Hydrogen Equivalent Weight (AHEW) = 36.55g Therefore, ratio of the L-Tryptophan - ESO = 1 : 6.254 (Theoretical value)
A-9: Calculation of Epoxide Equivalent Weight and Amine Hydrogen Equivalent Weight and ratio of PEI - ECO
Weight per Epoxide = 601 g/eq Amine Value = 20 mmol/g.solid Amine Hydrogen Equivalent Weight (AHEW) = 47.62 g Therefore, ratio of the PEI - ECO = 1 : 12.62 (Theoretical value)
A-10: Calculation of Epoxide Equivalent Weight and Amine Hydrogen Equivalent Weight and ratio of PEI-10,000 - ECO
Weight per Epoxide = 601 g/eq Amine Value = 20 mmol/g.solid Amine Hydrogen Equivalent Weight (AHEW) = 52.91g Therefore, ratio of the PEI - ECO = 1 : 11.36 (Theoretical value)

47 | P a g e
APPENDIX B: Solvent selection for the ESO - PEI and ELO - PEI systems Appendix B indicates the best solvent to be used for the ELO- PEI and ESO - PEI cured samples
Table B-1: Calculation of the amount of extractables for the ELO - PEI cured samples
Sr. No. Solvent
Initial weight (W1)(g)
Final weight (Wf)
% Weight
loss
Density of the solvent
(ρs)(g/cc)
Density of the matrix
(ρm)(g/cc) 1 Chloroform 0.1025 0.072 29.76 1.48 1.056223 2 Dichloromethane 0.1367 0.1188 13.09 1.326 1.056223 3 Tetrahydrofuran 0.0885 0.073 17.51 0.889 1.056223 4 1,4-Dioxane 0.0756 0.0733 3.04 1.034 1.056223 5 Acetone 0.0899 0.0842 6.34 0.791 1.056223 6 2-butanone(MEK) 0.103 0.0982 4.66 0.806 1.056223 7 Ethyl acetate 0.0936 0.0911 2.67 0.893 1.056223 8 Butyl acetate 0.1144 0.1144 0.00 0.881 1.056223 9 Toluene 0.0866 0.0856 1.15 0.865 1.056223
10 Xylenes 0.1062 0.1042 1.88 0.88 1.056223
Table B-2: Evolution of Vr vs. time for the ELO cured samples
Sr. No. Solvent
Solvent Uptake (48 hrs)
Solvent Uptake (72 hrs)
Solvent Uptake (96 hrs)
Solvent Uptake
(120 hrs)
Solvent Uptake
(144 hrs)
Solvent Uptake
(168 hrs)
Solvent Uptake
(192 hrs)
Solvent Uptake
(216 hrs)
1 Chloroform * * * * * * * * 2 Dichloromethane 0.4284 0.4424 0.4679 0.4685 0.4692 0.4686 0.4912 0.49153 Tetrahydrofuran 0.3822 0.3938 * * * * * * 4 1,4-Dioxane 0.5138 0.5160 0.5255 0.5309 0.5534 0.5617 0.5661 0.56615 Acetone 0.6179 0.6620 0.6676 0.6940 0.6979 0.6933 0.6986 0.69946 2-butanone(MEK) 0.5382 0.6196 0.6290 0.6349 0.6497 0.6386 0.6492 0.63867 Ethyl acetate 0.6477 0.6685 0.6803 0.6906 0.7183 0.7137 0.7163 0.73628 Butyl acetate 0.6490 0.6919 0.8133 0.7878 0.7373 0.7255 0.8809 0.73679 Toluene 0.6355 0.6198 0.7481 0.6443 0.6601 0.6632 0.6601 0.657610 Xylenes 0.5865 0.6459 0.8120 0.6449 0.6406 0.6488 0.6556 0.6688
* Could not be measured as the polymer disintegrated during the tests

48 | P a g e
Table B-3: Calculation of the amount of extractables for the ESO cured samples
Sr. No. Solvent Initial weight (W1)(g)
Final weight (Wf)
% Weight
loss
Density of the solvent
(ρs)(g/cc)
Density of the matrix
(ρm)(g/cc)1 Chloroform 0.1144 0.0586 48.78 1.48 1.0048962 Dichloromethane 0.1203 0.0587 51.21 1.326 1.0048963 Tetrahydrofuran 0.2317 0.1221 47.30 0.889 1.0048964 1,4-Dioxane 0.1728 0.1321 23.55 1.034 1.0048965 Acetone 0.1621 0.1076 33.62 0.791 1.0048966 2-butanone(MEK) 0.2293 0.1737 24.25 0.806 1.0048967 Ethyl acetate 0.1591 0.1255 21.12 0.893 1.0048968 Butyl acetate 0.1729 0.1062 38.58 0.881 1.0048969 Toluene 0.152 0.1041 31.51 0.865 1.004896
10 Xylenes 0.1627 0.1074 33.99 0.88 1.004896
Table B-4: Evolution of Vr vs. time for the ESO cured sample
Sr. No. Solvent
Solvent Uptake (48 hrs)
Solvent Uptake (72 hrs)
Solvent Uptake (96 hrs)
Solvent Uptake
(120 hrs)
Solvent Uptake
(144 hrs)
Solvent Uptake
(168 hrs)
Solvent Uptake
(192 hrs)
Solvent Uptake
(216 hrs)
1 Chloroform * * * * * * * * 2 Dichloromethane 0.2675 * * * * * * * 3 Tetrahydrofuran 0.2174 0.2707 0.2848 0.2713 0.2684 0.2875 * 0.28614 1,4-Dioxane 0.3617 0.3358 0.3417 0.3478 0.3633 0.3742 0.4708 0.37455 Acetone 0.5009 0.4326 0.4621 0.4818 0.5206 0.4899 0.8521 0.55696 2-butanone(MEK) 0.3896 0.4487 0.4498 * * * * 0.44387 Ethyl acetate 0.5466 0.5333 0.5509 * * * * 0.54088 Butyl acetate 0.4140 0.3539 * * * * * 0.43479 Toluene 0.3622 0.3727 0.3781 0.3787 0.3805 0.3918 0.4429 0.4451
10 Xylenes 0.3216 0.3190 0.3304 0.3442 0.3531 0.3685 0.4205 0.3757* Could not be measured as the polymer disintegrated during the test

49 | P a g e
APPENDIX C: Optimization of the curing time
50 | P a g e
Figure C- 1: Evolution of Vr with respect to curing time for the ELO and the ESO
systems

51 | P a g e
Figure C-2: Evolution of the amount of extractables and Vr with respect to curing time for
the ELO - PEI and the ESO - PEI systems

52 | P a g e
APPENDIX D: Optimization of the resin to hardener ratio
Table D-1: Comparison of the solvent uptake values of the optimized bioepoxies cured at 160°C and the samples cured with an excess of PEI
% Weight loss Solvent Uptake (Vr) Curing agent
Resin : Hardener
Curing time (hrs) DCM Acetone Acetone Xylenes DCM Acetone Acetone Xylenes
Equilibrium
1: 1 3 13.09 - 33.62 33.99 0.4915 - 0.5569 0.3757 After 216 hrs 1: 1 6 16.31 9.68 17.53 13.41 0.4469 0.6365 0.6081 0.5110 After 264 hrs 1: 1 12 8.59 1.83 10.54 7.72 0.5556 0.7545 0.6542 0.5673 After 264 hrs 1: 1 18 8.25 0.81 7.25 6.49 0.5926 0.7799 0.6555 0.5756 After 264 hrs
1: 1.1 6 - - 16.85 12.50 - - 0.5912 0.5271 After 216 hrs 1: 1.1 12 - - 6.46 3.37 - - 0.6621 0.6285 After 216 hrs 1: 1.1 18 5.18 0.42 6.18 4.76 0.6045 0.7921 0.6866 0.6212 After 216 hrs 1: 1.2 6 - - 13.02 12.80 - - 0.6309 0.4908 After 216 hrs 1: 1.2 12 - - 5.63 5.04 - - 0.6495 0.6174 After 216 hrs 1: 1.2 18 0.94 -3.02 4.49 3.79 0.6022 0.8717 0.6951 0.6276 After 216 hrs 1: 1.3 12 - - 4.68 2.56 0.6659 0.6404 After 216 hrs 1: 1.3 18 - -4.55 3.66 3.06 - 0.9201 0.6819 0.6427 After 192 hrs 1: 1.4 12 - - 3.71 3.04 - - 0.6833 0.6358 After 216 hrs 1: 1.4 18 -1.76 -4.65 5.30 3.36 0.6278 0.9022 0.6854 0.6357 After 192 hrs 1: 1.5 18 - -0.37 - - - 0.8057 - - After 240 hrs 1: 1.6 18 -1.86 -3.70 - - 0.6295 0.8656 - - After 240 hrs 1: 0.8 6 - - 20.13 19.47 - - 0.5801 0.4697 After 192 hrs 1: 0.8 18 - - 13.73 - - - 0.6180 - After 192 hrs 1: 0.9 6 - - 14.76 17.22 - - 0.6072 0.4982 After 192 hrs
PEI
1: 0.9 18 - - 10.48 - - 0.6509 - After 192 hrs * Optimized curing time, Optimized ratio of resin to hardener
Table D-2 Comparison of the Solvent Uptake Values of the Optimized Samples (ELO/ESO) Cured at 1600C and the Sample Cured by taking Excess of Curing Agent (TETA)
Curing Resin : Curing % Weight loss Solvent Uptake (Final) (Vr) Equilibrium

53 | P a g e
DCM Acetone Acetone Xylenes DCM Acetone Acetone Xylenes
1: 0.9 6 - - 28.41 22.49 - - 0.4630 After 240 hrs 1: 0.9 12 - - 20.79 19.35 - - 0.5305 0.4509 After 240 hrs 1: 1 6 4.35 19.49 13.01 * 0.6940 0.5412 0.4263 After 240 hrs 1: 1 12 9.27 -0.37 11.98 7.95 0.4805 0.7302 0.6019 0.5170 After 240 hrs 1: 1 18 - 3.55 14.48 14.14 * 0.7057 0.6061 0.4923 After 240 hrs
1: 1.1 6 - 3.05 - - * 0.7092 - - After 240 hrs 1: 1.1 12 - 0.24 8.51 5.35 - 0.7322 0.63 0.55 After 240 hrs 1: 1.1 18 - 2.15 - 11.50 * 0.7365 * 0.5312 After 240 hrs 1: 1.2 6 2.99 1.66 - - 0.5538 0.7472 - - After 240 hrs 1: 1.2 12 0.07 7.23 3.93 0.7429 0.65 0.58 After 240 hrs 1: 1.2 18 3.05 0.55 12.20 11.13 0.5818 0.7660 0.6180 0.5410 After 240 hrs 1: 1.3 6 - - 12.87 7.23 - - 0.5913 0.5241 After 240 hrs 1: 1.3 12 - 1.22 7.61 4.14 - 0.7283 0.6430 0.5678 After 240 hrs 1: 1.3 18 - 1.95 - - - 0.7589 After 240 hrs 1: 1.4 6 - - 11.31 4.94 - - 0.6049 0.5386 After 240 hrs 1: 1.4 12 - 1.31 6.74 3.97 - 0.7349 0.6487 0.5750 After 240 hrs 1: 1.4 18 - -0.29 - - - 0.7641 - - After 240 hrs 1: 1.5 12 - -0.04 - - - 0.7444 - - After 240 hrs 1: 1.5 18 - 1.24 - - - 0.7468 - - After 240 hrs 1: 1.6 12 - 7.75 - - - - - After 240 hrs
TETA
1: 1.6 18 - -1.47 - - - 0.7805 - - After 240 hrs ELO ESO ELO ESO
* Optimized curing time, Optimized ratio of resin to hardener

54 | P a g e
APPENDIX E: Comparison of the bioepoxies
Figure E-1: Comparison of the weight loss in the ELO and ESO systems with respect to
different ratios of hardener (PEI or TETA)
Figure E-2: Comparison of Vr. for the ELO and the ESO systems with respect to different
ratios of hardener (PEI & TETA)
55 | P a g e
APPENDIX F: IR Imaging analysis
Figure F-1: Comparison of the heating profile in the silicone mold and in the aluminum
pan as measured by IR imaging

56 | P a g e
Table F-1: Temperature at different locations of the molds in the convection oven
Heating Oven temp (°F)
Label Mold Min (°F)
Max (°F)
Max-Min
Avg (°F)
Std. Dev
AR01 Aluminum 176 212.5 36.5 190.2 7.7 AR02 Silicone(B) 274.2 293.2 19 290.3 3.7 AR03 Silicone (1) 289.7 310.1 20.4 298.9 4 AR04 Silicone (2) 291.6 309.2 17.6 300.6 3.6 AR05 Silicone (3) 292.4 308.8 16.4 299.9 3.5 AR06 Silicone (4) 289.9 307.8 17.9 298.9 4 AR07 Silicone (5) 289.1 308.3 19.2 298.4 3.7 AR08 Silicone (6) 290.8 307 16.2 298.4 3.5 AR09 Silicone (7) 292.3 306.9 14.6 298.9 3.2 AR10 Silicone (8) 290.8 305.6 14.8 298.1 3.3 AR11 Silicone (9) 292.6 304.7 12.1 298.3 2.5
1 hr 49 mins 320
AR12 Silicone (10) 289.2 303.7 14.5 296.8 3.4
Figure F-2: Uniformity of the heating at different locations in the silicone mold in the convection oven