
Alternate Pricing Model for Transportation Contracts
53
1 Alternate Pricing Model for Transportation Contracts by Atmaja Sinha Post Graduate Diploma in Management, S.P Jain Institute of Management & Research, Mumbai, India and Rakesh Thykandi Post Graduate Diploma in Management, Indian Institute of Management, Indore, India SUBMITTED TO THE PROGRAM IN SUPPLY CHAIN MANAGEMENT IN PARTIAL FULFILLMENT OF THE REQUIREMENTS FOR THE DEGREE OF MASTER OF APPLIED SCIENCE IN SUPPLY CHAIN MANAGEMENT AT THE MASSACHUSETTS INSTITUTE OF TECHNOLOGY JUNE 2019 © 2019 Atmaja Sinha & Rakesh Thykandi. All rights reserved. The authors hereby grant to MIT permission to reproduce and to distribute publicly paper and electronic copies of this capstone document in whole or in part in any medium now known or hereafter created. Signature of Author: ____________________________________________________________________ Department of Supply Chain Management May 10, 2019 Signature of Author: ____________________________________________________________________ Department of Supply Chain Management May 10, 2019 Certified by: __________________________________________________________________________ Dr. Chris Caplice Executive Director, Center for Transportation & Logistics, MIT Capstone Advisor Accepted by: __________________________________________________________________________ Dr. Yossi Sheffi Director, Center for Transportation and Logistics Elisha Gray II Professor of Engineering Systems Professor, Civil and Environmental Engineering
Transcript of Alternate Pricing Model for Transportation Contracts

1
Alternate Pricing Model for Transportation Contracts by
Atmaja Sinha Post Graduate Diploma in Management, S.P Jain Institute of Management & Research, Mumbai, India
and
Rakesh Thykandi Post Graduate Diploma in Management, Indian Institute of Management, Indore, India
SUBMITTED TO THE PROGRAM IN SUPPLY CHAIN MANAGEMENT
IN PARTIAL FULFILLMENT OF THE REQUIREMENTS FOR THE DEGREE OF
MASTER OF APPLIED SCIENCE IN SUPPLY CHAIN MANAGEMENT AT THE
MASSACHUSETTS INSTITUTE OF TECHNOLOGY
JUNE 2019
© 2019 Atmaja Sinha & Rakesh Thykandi. All rights reserved. The authors hereby grant to MIT permission to reproduce and to distribute publicly paper and electronic
copies of this capstone document in whole or in part in any medium now known or hereafter created.
Signature of Author: ____________________________________________________________________ Department of Supply Chain Management
May 10, 2019
Signature of Author: ____________________________________________________________________ Department of Supply Chain Management
May 10, 2019
Certified by: __________________________________________________________________________ Dr. Chris Caplice
Executive Director, Center for Transportation & Logistics, MIT Capstone Advisor
Accepted by: __________________________________________________________________________ Dr. Yossi Sheffi
Director, Center for Transportation and Logistics Elisha Gray II Professor of Engineering Systems Professor, Civil and Environmental Engineering
2
Alternate Pricing Model for Transportation Contracts
by
Atmaja Sinha
and
Rakesh Thykandi
Submitted to the Program in Supply Chain Management on May 10, 2019 in Partial Fulfillment of the
Requirements for the Degree of Master of Applied Science in Supply Chain Management
ABSTRACT
Transportation spend is an increasingly relevant topic of concern for all manufacturing companies. Along with the money spent on transporting goods, service betterment has become an everyday expectation. In a tight market, when contract carriers are unable to fulfill the shipper’s demands, the shipments are tendered to the spot market, where the costs are higher and service levels are lower. Through our study, we developed a dynamic index-based pricing which updates the contract rates on a monthly basis. This not only reduces the auction ratio (percentage of shipments going to the spot market), but also quantifies the incremental line haul savings/costs. We developed an optimization model based on national average line haul rates for contract carriers and spot market published by DAT to maximize the number of shipments moved from spot market to contract carriers, while satisfying various constraints such as cost and monthly variation. Our model shows that 8% of the shipments that had gone to auction would stay with contract carriers for a few, but not all, locations without any additional spend. Shippers can use our model to gather insights and reduce the auction ratio to drive better service levels and reduced costs even in tight markets.
Capstone Advisor: Dr. Chris Caplice Title: Executive Director, Center for Transportation & Logistics, MIT

3
ACKNOWLEDGMENTS
We would like to sincerely thank Chris Caplice, our advisor, for sharing his expertise and for his academic rigor that helped us explore various paths and decide the course of our Capstone. Also, this research would not have been possible without the insights and resources from our sponsor. Their close involvement throughout the Capstone ensured the easy completion. We are grateful to Pamela Siska and Toby Gooley for the generous dedication of their time to editing and helping to structure this thesis. A big shout out to Justin Snow for being the best academic administrator. We would also like to thank our family and friends for supporting us during the last ten months. Finally, we would like to thank each other for sharing the work and motivating, not just for this project but for the entire duration of our Master’s program.

4
Contents Acknowledgements ................................................................................................................................. 3
Contents .................................................................................................................................................. 4
List of Figures .......................................................................................................................................... 5
List of Tables............................................................................................................................................ 6
1. Introduction ..................................................................................................................................... 7
1.1 Motivation ..................................................................................................................................... 8
1.2 Problem statement .................................................................................................................. 9
1.3 Sponsor company ................................................................................................................... 10
1.3.1 Lane categorization ............................................................................................................... 10
1.3.2 Contracting process ............................................................................................................... 12
1.3.3 Tendering process ................................................................................................................. 12
1.4 Chapter summary ................................................................................................................... 13
2. Literature Review............................................................................................................................... 15
2.1 Transportation procurement: Contract vs spot market ................................................................. 15
2.2 Shipper-Carrier Relationship ........................................................................................................ 16
2.3 Rejection by Carriers .................................................................................................................... 17
2.4 Discussions with the carriers of our sponsor company ................................................................. 18
2.5 Existing index-based pricing models in transportation industry .................................................... 19
2.6 Chapter Summary ........................................................................................................................ 21
3. Methodology ..................................................................................................................................... 22
3.1 Data Mining ................................................................................................................................. 23
3.2 Optimization Model ..................................................................................................................... 28
3.3 Chapter Summary ........................................................................................................................ 33
4. Results and Analysis ........................................................................................................................... 35
4.1 Model results for Pennsylvania .................................................................................................... 38
4.2 Model results for Wisconsin ......................................................................................................... 40
4.3 Model results for California .......................................................................................................... 42
4.4 Model results for Missouri ........................................................................................................... 44
5. Discussion and Conclusion ................................................................................................................. 47
5.1 Summary of Main Findings ........................................................................................................... 47
5.2 Areas of Future Research ............................................................................................................. 49
References: ........................................................................................................................................... 52

5
List of Figures Figure 1. Acceptance ratio from May 2016 to September 2018. .................................................. 9Figure 2. Illustrative example of fuel surcharge calculation. Copyright 2013 by C.H. Robinson. . 20Figure 3.Summary of methodology used. .................................................................................. 23Figure 4. Evolution of DAT and sponsor company’s spot and contract rates. ............................. 25Figure 5. Spot Premium trends for our sponsor company and DAT from September 2017 to September 2019. ...................................................................................................................... 27Figure 6. Impact of α on the indexed contract price. ................................................................. 33Figure 7. Relationship between sponsor company spot premium and auction ratio. ................. 35Figure 8. Relationship between DAT spot premium and spot premium for each warehouse. .... 36Figure 9. Relationship between sponsor company auction ratio and DAT spot premium........... 37Figure 10. Change in acceptance ratio with varying line haul cost increase for Pennsylvania..... 39Figure 11. Monthly behavior of incremental line haul costs for Pennsylvania. ........................... 40Figure 12. Change in acceptance ratio with varying line haul cost increase for Wisconsin. ........ 41Figure 13. Monthly behavior of incremental line haul costs for Wisconsin. ............................... 42Figure 14. Change in acceptance ratio with varying line haul cost increase for California. ......... 43Figure 15. Monthly behavior of incremental line haul costs for California. ................................ 44Figure 16. Change in acceptance ratio with varying line haul cost increase for Missouri. .......... 45Figure 17. Monthly behavior of incremental line haul costs for Missouri. .................................. 46

6
List of Tables Table 1 Lane categorization based on volume and lane count………………………………………..……11
Table 2 Monthly snapshot of line haul rates and auction ratio…………………………………………….30
Table 3 Calculated fields in the optimization model…………………………………………….….………….31
Table 4 Financial impact of index-pricing for the selected warehouses…………………….…………47

7
1. Introduction
The U.S. trucking market is estimated to be around $700 Billion, with full truckload
accounting for almost 30% of it (AT Kearney, 2018). The US trucking industry volume was
projected to grow by 4.2% in 2018 (Baertlein, 2018). Truckload shipments involve a carrier picking
up goods from a single location and delivering to the destination with no intermediate stops. In
today’s environment of constrained transportation capacity, the importance of shipper-carrier
relationships is of utmost importance, making these carriers an important part of logistics
strategy (Zsidisin & Schlosser, 2007).
The North American Full Truck Load industry tends to operate on fixed lane-by-lane price
contracts that are set either once per year or once every two years (CSCMP, 2018). However,
demand outpaced supply in 2017 through early 2018 in every sector in the trucking industry,
leading to carriers rejecting the shippers’ loads and forcing shippers to move to the spot market
at a higher rate than normal (Ashe, 2018; Cassidy, 2018). Spot market refers to the auction
mechanism where shippers issue loads and carriers offer bids to fulfill the loads on a near real-
time basis. The DAT national average index reported that spot rates increased by 42% in 2017 in
response to tightened capacity. As the spot market rate increased, the shippers incurred higher
transportation costs. Along with the costs, there was a negative impact in terms of service levels
(State of Logistics CSCMP,2018).
Our sponsor, like most other shippers, experienced a high level of rejected loads by
primary carriers. These shipments ended up being fulfilled by carriers in the spot market. This led
8
to higher costs and reduced service performance as defined by internal metrics tracked by the
sponsor company such as Customer Service On Time (CSOT).
Our sponsor company wanted to reduce the number of shipments which go to the spot
market by improving the acceptance of loads by contract carriers. One potential approach to
increase the acceptance ratio is to incorporate alternate pricing models to make these tenders
more attractive to the contract carriers. To evaluate the impact of such pricing models, we
developed a contract rate index which is linked to the market conditions using a monthly line
haul cost index. The underlying concept behind the index is that line haul rates offered to contract
carriers would increase or decrease based on whether an independent index increased or
decreased.
After discussions with our sponsor company and contract carriers, we decided on using a
monthly index which is linked to the DAT line haul index. We optimized the index to maximize
the acceptance by the carriers over a 12-month period and evaluated the performance of the
index over an additional 12-month period. Additionally, we conducted interviews with carriers to
understand the technological, process, and financial impacts and risks of using such an index.
1.1 Motivation
Shippers typically observe that in a trucking market where supply is insufficient to meet
demand, carriers often reject the loads issued by the shipper. Figure 1 shows the acceptance
ratio (% of shipments accepted by contract carriers) for our sponsor company over a two-year
period which covered both tight and soft market conditions. The acceptance ratio of carriers
went down from around 75% in a soft market to around 55% in a tight market.

9
This forces the shipper to access the spot market to fulfill these loads. A spot market is a
mechanism where the loads issued by a shipper are matched with any carrier who has trucking
capacity available to fulfill the demand. The price for fulfilling the shipment is determined
dynamically. Our sponsor company has observed that shipments which are fulfilled through the
spot market often have higher costs and a lower service level associated with them. An
understanding of why the contract carriers reject the shipments issued to them will give insights
that can improve the acceptance ratio. This will in turn drive cost savings and service level
improvements.
Figure 1. Acceptance ratio from May 2016 to September 2018.
1.2 Problem statement
The sponsor company was facing increased rejections by carriers during tight market
conditions. Our Capstone intends to address the research question of whether a dynamically
updated line haul rate for contract carriers results in lower rejections by the carriers. We
10
evaluated whether an independent index can be used to update the line haul rates which are
indicative of the prevailing market conditions.
1.3 Sponsor company
We partnered with a leading consumer packaged goods company that manufactures and
delivers finished goods to more than 6000 customer locations in North America. It primarily
utilizes contract carriers, but also uses the spot market to fulfill shipments to its customers if
required.
1.3.1 Lane categorization
There are three types of shipments managed by our sponsor company:
● Outbound(Customer) - Finished goods shipments from plants and distribution centers
that they own to customer locations that they don’t
● Inbound(Raw Material) - Shipments of raw materials from third-party suppliers to plants
of sponsor company
● Interplant(Transfer) - Shipments of finished goods from plants to distribution centers
Outbound shipments can be fulfilled either through customer pick-up or for hire
shipments. The sponsor company has segmented the outbound lanes into four categories: Tail,
Pay for Performance, High Volume Interplant, Base/Others. Table 1 provides a percentage
summary of the lane counts and shipment volumes by these categories.
11
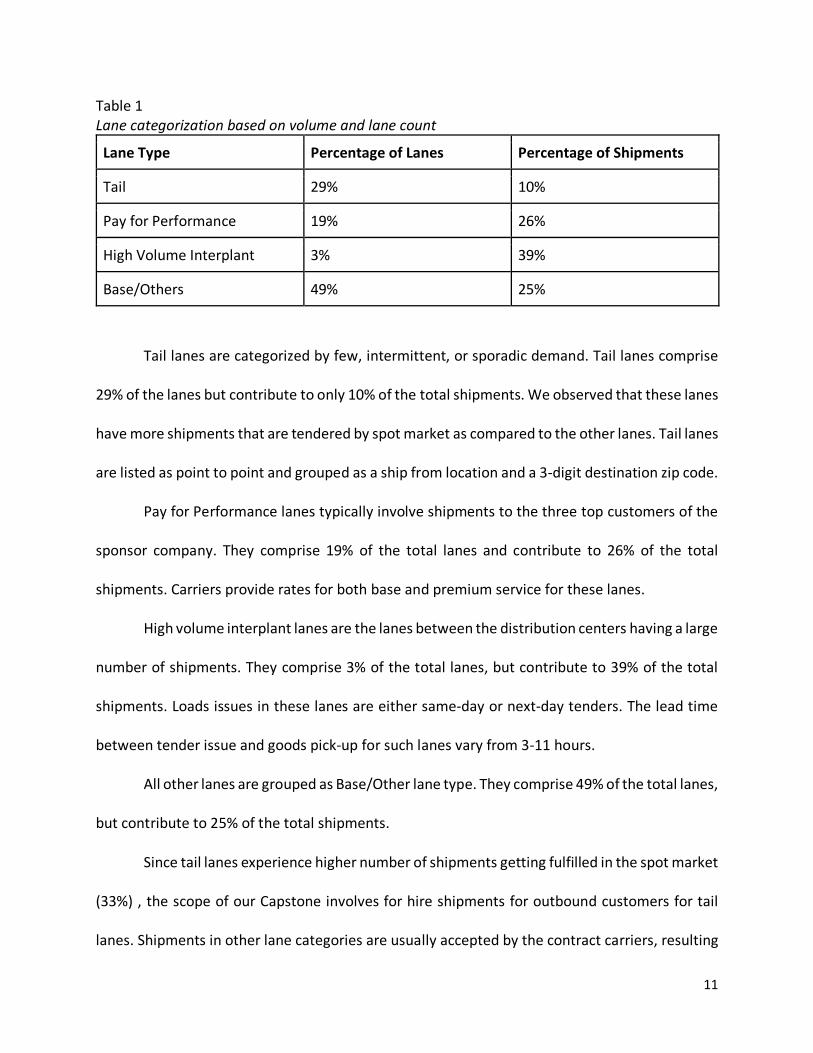
Table 1 Lane categorization based on volume and lane count
Lane Type Percentage of Lanes Percentage of Shipments
Tail 29% 10%
Pay for Performance 19% 26%
High Volume Interplant 3% 39%
Base/Others 49% 25%
Tail lanes are categorized by few, intermittent, or sporadic demand. Tail lanes comprise
29% of the lanes but contribute to only 10% of the total shipments. We observed that these lanes
have more shipments that are tendered by spot market as compared to the other lanes. Tail lanes
are listed as point to point and grouped as a ship from location and a 3-digit destination zip code.
Pay for Performance lanes typically involve shipments to the three top customers of the
sponsor company. They comprise 19% of the total lanes and contribute to 26% of the total
shipments. Carriers provide rates for both base and premium service for these lanes.
High volume interplant lanes are the lanes between the distribution centers having a large
number of shipments. They comprise 3% of the total lanes, but contribute to 39% of the total
shipments. Loads issues in these lanes are either same-day or next-day tenders. The lead time
between tender issue and goods pick-up for such lanes vary from 3-11 hours.
All other lanes are grouped as Base/Other lane type. They comprise 49% of the total lanes,
but contribute to 25% of the total shipments.
Since tail lanes experience higher number of shipments getting fulfilled in the spot market
(33%) , the scope of our Capstone involves for hire shipments for outbound customers for tail
lanes. Shipments in other lane categories are usually accepted by the contract carriers, resulting
12
in an auction ratio of 12% for High Volume interplant, 23% for Pay for Performance, and 24% for
Base/Others.
1.3.2 Contracting process
The contracting process begins every year with the sponsor company sending a bid letter
for all the lanes to a group of selected carriers. With the forecasted annual volumes available,
the carriers decide the price they want to bid on a particular lane. Along with the forecasted
volumes, the sponsor company also provides details about accessorial charges like driver
detention, empty miles etc. The sponsor company selects one or more primary carriers for each
lane depending upon price, performance, and available capacity.
1.3.3 Tendering process
After selecting the carriers, the sponsor company populates the routing guide with the
carrier, contracted rate, and weekly volume for each lane in the Transportation Management
System (TMS). Once the delivery date and quantity has been generated for a particular
destination location, our sponsor company issues load tenders to the contract carriers of that
particular lane via their transportation management system. contract carriers are expected to
accept or reject load tenders within 2 hours of receiving them. If a carrier accepts a load, then
delivery appointments are set up at the origin and destination. Carriers who cannot accept a load
are expected to provide an appropriate rejection reasons such as more than 20% volatility in the
forecasted volume, insufficient lead time between tendering and goods issue etc.
If the primary and all the contracted back-up carriers reject the tendered load, then the
shipment goes to a freight auction, which is accessible to a larger group of carriers.

13
Carriers who wish to participate in these auctions log in to a portal where they can view
the list of loads that they are eligible to bid on. The carriers can submit bids for these shipments
through the auction portal. Carriers are expected to separate freight charges into line haul and
accessorial charges. Based on various bids submitted by all the carriers, the sponsor company
selects the carrier with the winning bid within twenty-four hours, and the load is tendered to the
carrier at the agreed upon rate.
1.4 Chapter summary
Shippers have contracts with carriers to service their lanes. However, when demand
outpaces supply, carriers often tend to reject the loads issued to them. This results in shippers
resorting to spot market to fulfill such loads, driving up costs and reducing service levels. Our
sponsor company also faces these issues in the USA market, especially for shipments in the tail
lanes. Our proposed approach to increase the acceptance ratio is to develop an alternate pricing
model to offer market relevant line haul rates to the contract carriers.
The remainder of this report is organized as follows. Chapter 2 discusses the truckload
industry, shipper-carrier relationships in USA, dynamics of procurement of full truckloads, and
existing index-based pricing mechanism for accessorial in trucking industry. This chapter also
provides a summary of our discussions with multiple carriers of our sponsor company. Chapter 3
describes our approach in developing a relationship between national level index and rejections
by carriers, which is used to develop an optimization model to reduce carrier rejections by
adjusting the contract price with a market relevant index. Chapter 4 analyzes the results showing

14
the impact of index-based pricing at a warehouse level. Chapter 5 summarizes our conclusion
and explores areas of future research.

15
2. Literature Review
The literature review is grouped into four thematic sections: transportation procurement
process, shipper-carrier relationship, tender acceptance/rejection by carriers, existing index-
based pricing models in trucking industry, and discussions with the carriers of our sponsor
company. The study helped us to analyze the feasibility of implementing an alternate pricing
model in long-term contracts between carriers and shippers.
2.1 Transportation procurement: Contract vs spot market
Shippers procure transportation predominantly using contracts developed through
reverse auctions (Caplice, 2009). The objective of this process is to allocate carriers optimally to
individual lanes. This typically involves three stages (Caplice & Sheffi, 2003):
● Bid preparation - This involves classification of lanes and generating expected demand for
each of the lanes by the shippers. Lanes are classified on the basis of source and
destination location. This is followed by shortlisting of carriers by various criteria like
financial health, past performance and technical capabilities. This stage enables shippers
to develop stronger strategic partnerships with a fewer number of carriers (Vos, 1999).
● Bid execution - The shipper conveys the information and the carriers respond with their
quotes. The bids are typically provided as a rate per mile with a minimum charge, if
applicable or flat rates (Vos, 1999). A carrier can offer bids on a lane by lane basis or
provide a conditional bid. A conditional bid involves a rate which is applicable only if
certain conditions such as minimum volume, number of lanes awarded etc. are met
(Caplice & Sheffi, 2003).

16
● Bid analysis and assignment - Allocation of a specific lane to a carrier involves deciding on
cost factors, performance metrics and other qualitative factors. Certain shippers select
carriers with the lowest bids who meet their minimum service levels. Another approach
involves selecting carriers who provide the highest benefit as calculated by a weighted
sum of individual metrics such as cost, on-time delivery (Vos, 1999). This utilizes a carrier
assignment model with an objective the total cost of expected shipments during a period
of time. The model ensures that individual lanes are allocated sufficient trucking capacity
to meet the expected demand.
Although this results in a contract between the shipper and the carrier, the carrier has an
opportunity to reject a tendered load. When the primary rejects a load, it gets offered to any
backup carriers for that lane. If the back-up carriers also reject the load, a shipper can access spot
markets to post these loads (Nandiraju & Regan, 2008). Spot rates are defined as the price quoted
for immediate settlement on a commodity or a service.
2.2 Shipper-Carrier Relationship
A critical factor in the efficient management of transportation is the relationship between
carriers and shippers. One logistics executive quoted in an article in Inbound Logistics stated,
"Shippers now have to think about helping their carriers, rather than just dictating to them. The
big potential for change rests on collaboration [with carriers]" (Douglas 2006, 162).
Supplier partnerships can provide a purchasing organization with many of the benefits of
vertical integration, such as greater coordination, better asset utilization, and faster response to
market changes. A study on Hershey’s, the U.S.-based candy company, and its carriers

17
established trust as an important precursor to effective relationships. It also clearly exhibits that
carriers who had a partnership with the firm rejected loads the least (Zsidisin & Schlosser, 2007).
2.3 Rejection by Carriers
Carriers who are contracted with our sponsor company are expected to accept 100% of
their committed volume plus an additional 20% surge volume every week. However, sometimes
the carriers are unable to pick up the loads even if they had committed to them earlier. Even if
carriers have a contract with a shipper, these acceptance commitments are not strictly enforced.
Similarly, a shipper is not penalized financially if the forecasted volume does not materialize. The
key incentive for a carrier to accept a load is potential future business from the shipper due to
high service levels in metrics like On-Time Delivery (Scott,2017).
Kafarski & Caruso (2012) found that the main factors contributing to the rejection are as
follows :
● Not enough lead-time to secure a truck ● Surge in volumes on specific lanes ● New lanes ● Long load times at origin or unload times at destination ● Service in an area of weather impact ● Inconsistent lane activity, and ● Low rate offered previously on the same lane
The above factors were verified through our conversations with several of the carriers of
our sponsor company. Additionally, during our conversations with the carriers, we discovered
that they have a strong motive to allocate their capacity to spot market rather than their
contracted freight in tighter market conditions in order to maximize their revenue.

18
2.4 Discussions with the carriers of our sponsor company
In addition to the data analysis, we also conducted in-depth discussions with several
carriers. These included both asset owners and non-asset firms. Based on the feedback from
carriers and existing literature, we concluded that the shipper-carrier relationship is a crucial
element for carriers to decide whether to accept or reject loads. Often, carriers that have a long-
term partnership with the shipper will accept more loads than the committed volume. We also
observed that smaller carriers, in order to establish a stronger relationship with the shipper will
accept loads that are not profitable. Other carriers, though, were not willing to accept loads
beyond their commitment because it was more profitable for them to accept loads in the spot
market than fulfilling shipments at their contracted rate.
Most carriers opined that an index-based contract price would increase their acceptance
rate. However, we sensed some reservation from the carriers about the adequacy of indices, like
DAT, or Cass Truckload line haul Index, to portray the current market dynamics. Updating the
index once a quarter was mostly favored by the carriers. However, a few carriers were keen on
having the contract price updated every month to mirror the market reality more closely.
Transportation brokers preferred an index that is updated less frequently as they procure their
capacity in the beginning of every tear. In contrast, asset owners preferred the rate to be updated
as frequently as once a week so as to get a contracted rate which reflects the existing market
scenario.
While a few of the carriers were open to the idea of fluctuating prices, even if they are
below their contract rates, most revealed that they would be interested only if the contract prices
increase in response to the market. Certain asset owners were not willing to accept loads, even

19
with surplus capacity, if the new indexed rate offered is below a threshold value. To summarize,
carriers carriers were generally not in favor of a symmetric index, which can result in indexed
contract rates going below the original rates they had bid for.
2.5 Existing index-based pricing models in transportation industry
In our literature review, we found that index-based pricing models are not used for line
haul rates in the US trucking industry. However, fuel surcharges are commonly used to account
for the volatility of fuel costs, which form a major component of the transportation cost. Fuel
surcharge accounts for variations of fuel prices in comparison to historical levels and adjust the
amount paid to carriers for fuel expenses (Straight, 2017) . It is a form of risk sharing between
shipper and carriers. Fuel surcharge details are usually provided in the bidding document shared
by the shipper with all the carriers.
Fuel surcharges typically have three components: index, peg and escalator. The fuel
surcharge,paid to the carrier in addition to the line haul rate, is calculated as shown below (C.H.
Robinson , 2013):
Fuel Surcharge($/mile) = !"#$%($/*+,,-")/0$*($/*+,,-")123+,+4-5(67,$2/*+,,-")
where Index is an independently determined average price of fuel, typically from the Department
Of Energy.
The Peg is the fuel cost level at which the fuel surcharge program gives a zero value for
the surcharge, typically set at $1.2 per gallon for historical reasons.
20
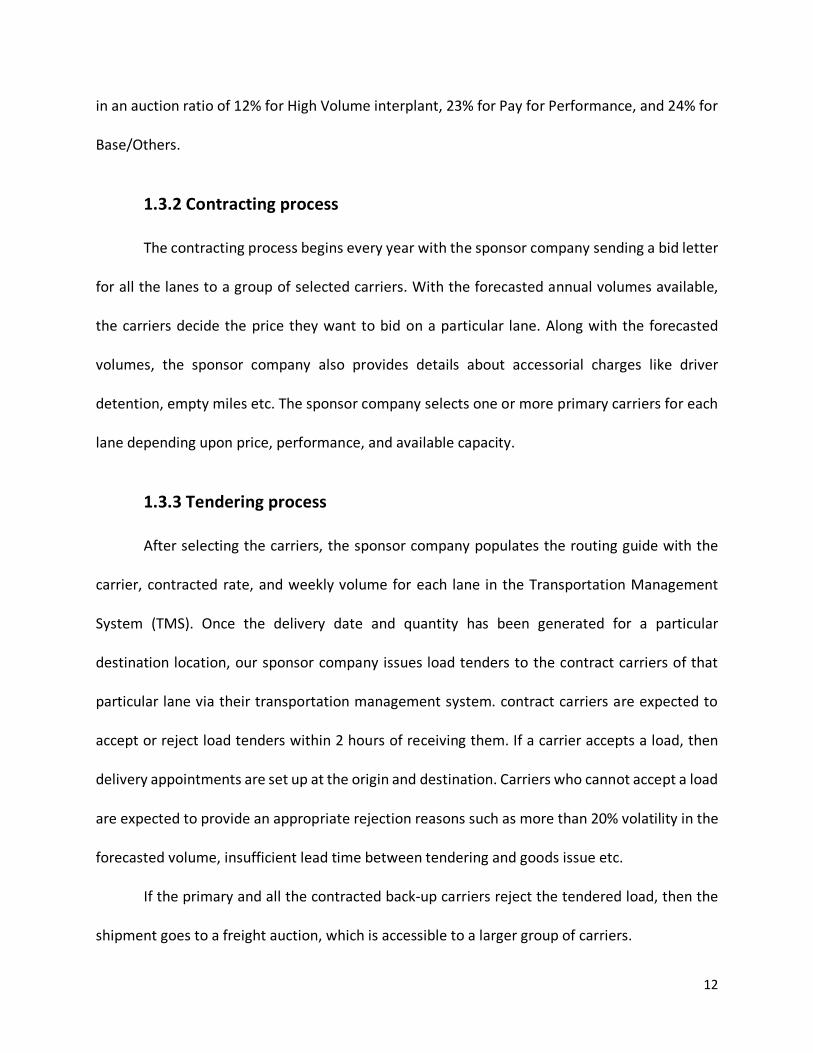
The Escalator is a factor which accounts for the amount of fuel used by a truck. It is
essentially a proxy for fuel efficiency.
The Department of Transportation average fuel price is published weekly. Most fuel
surcharge programs only move in five cent increments of fuel price in order to minimize short-
term fluctuations.
The impact of varying levels of index in comparison to a peg is shown in figure 2.
Figure 2. Illustrative example of fuel surcharge calculation. Copyright 2013 by C.H. Robinson.
Another commonly used in the transportation industry is the baltic dry index (BDI), which
is a daily indicator of the dry bulk shipping rates. The Baltic Exchange calculates the index by
assessing multiple shipping rates across more than 20 routes for the BDI components viz a viz

21
Baltic Capesize, Panamax, Supramax and Handysize indices. The BDI value can be used to
estimate daily charter price of a ship using a conversion factor. A higher BDI is indicative of future
economic growth (German & Smith, 2012).
2.6 Chapter Summary
We reviewed various factors such as shipper-carrier relationship, market dynamics, etc.
and their impact on the transportation procurement process. From the literature review and
discussions with the carriers, we discovered that a market relevant contract price can be used as
a lever to meet the objective of increasing the acceptance of loads by contract carriers.

22
3. Methodology
The general methodology involved identifying and quantifying the relationship between
a trucking industry standard index and the load rejections by carriers for tail lanes. After we
modelled this relationship at a warehouse level, we created a contract price model which was
dependent on the change in DAT index and a constant𝛼to calculate a dynamic contracted rate,
which is updated monthly. The 𝛼 value for a warehouse can be thought of as a multiplier which
translates the change in national market trends (as reflected in the DAT national average rates)
to a regional index. If 𝛼 > 1, the changes in the national average rates are amplified in the index
for that particular warehouse. Correspondingly, if 𝛼 < 1, the changes in the national average rates
are damped. We optimized 𝛼for each warehouse to maximize the number of tail lane shipments
that move from spot market to contract carriers subject to constraints such as the allowable
percentage increase in line haul costs and limits on month to month index variations. Figure 3
provides an illustrative sequence of our methodology.

23
Figure 3.Summary of methodology used.
3.1 Data Mining
In order to evaluate the effectiveness of index-based pricing, we analyzed the
transactional shipment data to understand the monthly trends of Line Haul cost Per-Mile (LHPM)
on shipments that were fulfilled by contract carriers and shipments that were rejected by the
contract carriers. We elected a monthly aggregation because our sponsor company has access to
monthly DAT rates. Additionally, we observed that a weekly aggregation results in a much more
volatile trend whereas a quarterly aggregation results in too much smoothening of price trends.
We realized that this choice of monthly update, although arbitrary, is the most practical time
horizon to update the index.
We utilized the following datasets provided by our sponsor company:

24
● Cost files containing shipment details (origin, destination, costs, distance, whether a
shipment went to contract carrier or spot market, etc.) from April 2016 to September
2018.
● Bid files containing the lane details (origin, destination, lane type, the amount bid by
carriers for contract shipments, etc.) as per the latest bidding round in 2018.
The first step involved in the analysis was aggregation of the cost files. The cost file was
structured in a way that resulted in multiple rows for each unique shipment. As part of the
aggregation, we summed up the costs incurred by each business unit for a shipment and created
a table where each row corresponded to a unique shipment and its associated costs. After this,
we calculated the line haul costs for each shipment by subtracting the fuel and accessorial costs
from the total shipment costs. The LHPM was calculated by dividing this line haul cost by the
distance of the shipment as provided in the data set.
After this aggregation, we filtered the data set to remove all shipments with missing /
“Not a number” value for LHPM. We also removed all intermodal shipments, as the scope of the
project involved full truckload shipments only. This was followed by joining the filtered cost data
with the bid files to obtain the lane details for each shipment. We observed that there were no
variable or pairs of variables which could uniquely match a shipment with a lane. To join the
datasets, we cleaned the Bid file by removing:
● Any origin-destination pairs having multiple lane types
● All lanes with a lane type other than Tail, and
● Duplicate tail lanes having the same origin-destination pair

25
After removing these lanes, we utilized the combination of origin ID and destination
postal code of shipments to match the lane types.
To evaluate the feasibility of using a national index rate, we obtained the DAT national
spot and contract rates over the same time period of analysis. These rates are monthly average
line haul rates of shipments in USA based on actual shipments. Figure 4 depicts the change in
market dynamics after mid-2017 when the average DAT spot rates started increasing significantly
compared to the DAT contract rates. The sponsor company exhibited a similar directional trend
for spot rates, but at a higher magnitude compared to the DAT spot rates. The rates for our
sponsor company depicted in the figure is an average value across all regions thus hiding the
regional volatilities.
Figure 4. Evolution of DAT and sponsor company’s spot and contract rates.

26
Since the DAT rates are monthly and our sponsor company preferred a monthly horizon
for analysis, we aggregated shipments from each warehouse at a monthly level. For each month
we calculated the following variables:
Spot
Premium= 9:$5+*$;<0=>-5+,,2?7@6$"42>5-64?$A+5$?-B2$A?73?A$"44-2@-46+5C$49:$5+*$;<0=>-5+,,2?7@6$"42>5-64?$A+5$?-B2$A?73?A$5$>B,>7,,$#DE3-"45+343+557$52
Auction Ratio =FB6D$5->2?7@6$"42>5-64?$A+5$?-B2$A?73?A$"44-2@-46+5C$4G-4+,"B6D$5->2?7@6$"42>5-64?$A+5$?-B2$->+"+,E272
The spot premium is an indicator which shows how expensive shipments sent to spot
market are compared to those fulfilled by contract carriers. When the average LHPM are the
same for shipments which went to spot market and contract carriers, spot premium will be 1. As
the LHPM for auctioned shipments increases in comparison to those of contract carriers, spot
premium will increase beyond 1.
Auction Ratio is a variable which varies from 0 to 1. When all the shipments in a month
are fulfilled by contract carriers, the auction ratio will be 0. Correspondingly, when all the
shipments in a month are fulfilled using the spot market, the auction ratio will be 1.
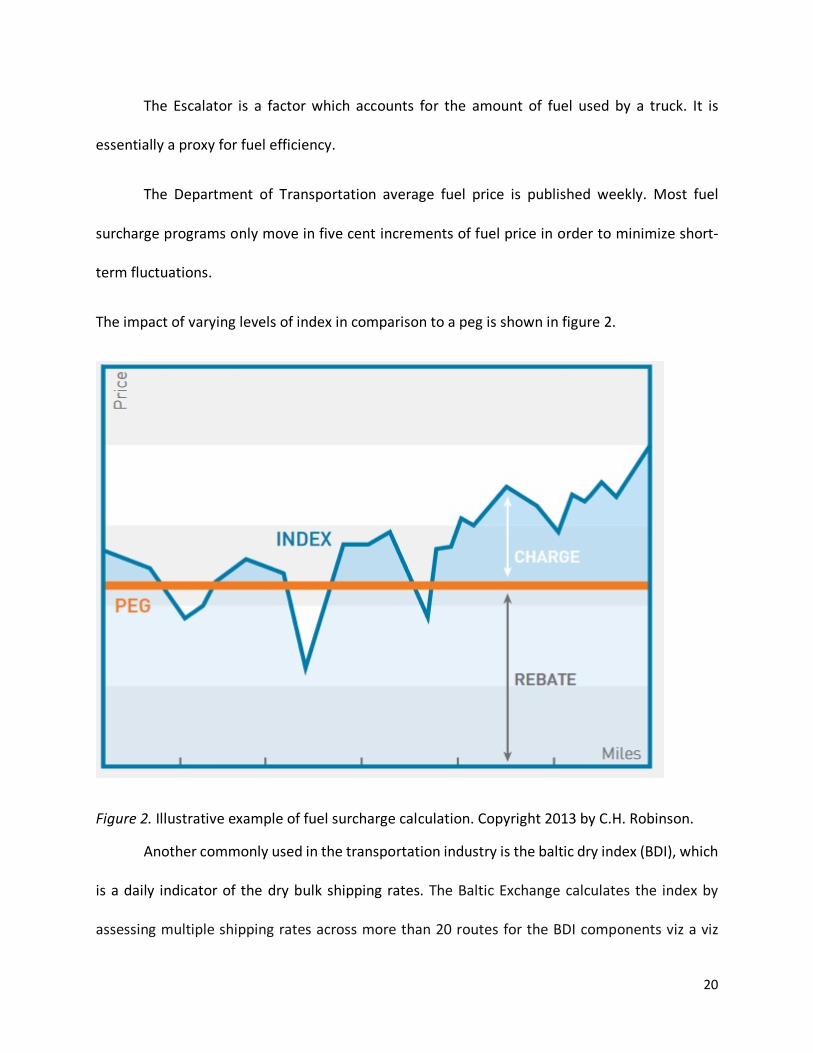
The monthly behavior of spot premium paid by our sponsor company in tail lanes is shown
in Figure 5. The figure indicates a clear increase in the spot premium after mid-2017, indicating
that our sponsor company has been paying a higher rate for shipments which went to spot
market, compared to those which were fulfilled by contract carriers.
27
Figure 5. Spot Premium trends for our sponsor company and DAT from September 2017 to September 2019.
We observed that even in a soft market with spot rates lower than the contracted rates,
our sponsor company has an approximate auction ratio of 20%. Note that the Auction Ratio = (1
- Primary carrier Acceptance Rate) * (1 - Backup carrier Acceptance Rate). The auction ratio of
20% was attributed to the carriers having insufficient capacity, high volatility in shipment
volumes, or a low lead-time between tender and shipment date.
After deriving the monthly spot premium and auction ratios, we analyzed whether there
is a correlation between the monthly auction ratio and the spot premium for the sponsor
company. We explored the relationship by fitting linear and quadratic models between monthly
spot premium and auction ratio for each warehouse. Additionally, we also evaluated the
relationship between DAT national spot premium for each month and the corresponding spot
premium for each warehouse of the sponsor company.

28
Since the spot premium and auction ratio dynamics vary widely depending on the
geography, we disaggregated the shipments for each of the twelve origin warehouses. We
observed that only shipments Wisconsin, Pennsylvania, Missouri, and California warehouses
exhibited any significant relationship between these variables, with an R-squared value greater
than 0.3. After discussions with our sponsor company, we decided to focus our analysis only on
shipments from these four warehouses.
3.2 Optimization Model
The transaction data shared by our sponsor company covered twenty four months of
shipments. We aggregated this data for each month and warehouse. Aggregated data was split
into two parts. First twelve months of data was used to optimize our decision variable and the
next twelve months of data was used to evaluate the performance of optimal model for each
warehouse.
We developed a non-linear optimization model for each of the shortlisted four
warehouses. We utilized Generalized Reduced Gradient (GRG) engine to solve the optimization
model.
The Objective function maximizes the number of shipments that move from spot market
to contract carriers. The decision Variable α was found for each warehouse obtained as a
multiplier of the monthly change in the DAT index. As α gets larger, the impact of DAT trend on
the index increases linearly.
The equation for the index is Indext = (1 + α) * DAT spot premium t-1 / DAT spot premium t-2

29
where DAT Spot Premiumt is the ratio of national DAT line haul rates for spot market and DAT
line haul rates for contract carriers in time period t
In order to ensure that the optimization model provides a solution that is viable for the
sponsor company, we established several parameterized constraints to the model. The first
constraint was that α >= 0 to ensure that the index follows the trend of DAT spot premium over
the last two months. For example - if the DAT spot premium in February is higher than the DAT
spot premium in January, the index in March will be greater than 1. We set an upper bound of 2
for the index after discussing with our sponsor company to ensure that the indexed contract rates
will not be excessively high. We set a lower bound of 0.9 for the index to ensure that the indexed
contract rate will be not too low and result in increased rejections by the contract carriers. We
varied the allowable line haul cost increase after implementing the index from 0% to 20% to
evaluate the impact on acceptance ratio. Based on the results of optimization model and inputs
from our sponsor company, we set up a constraint for a 10% allowable cost increase.
30
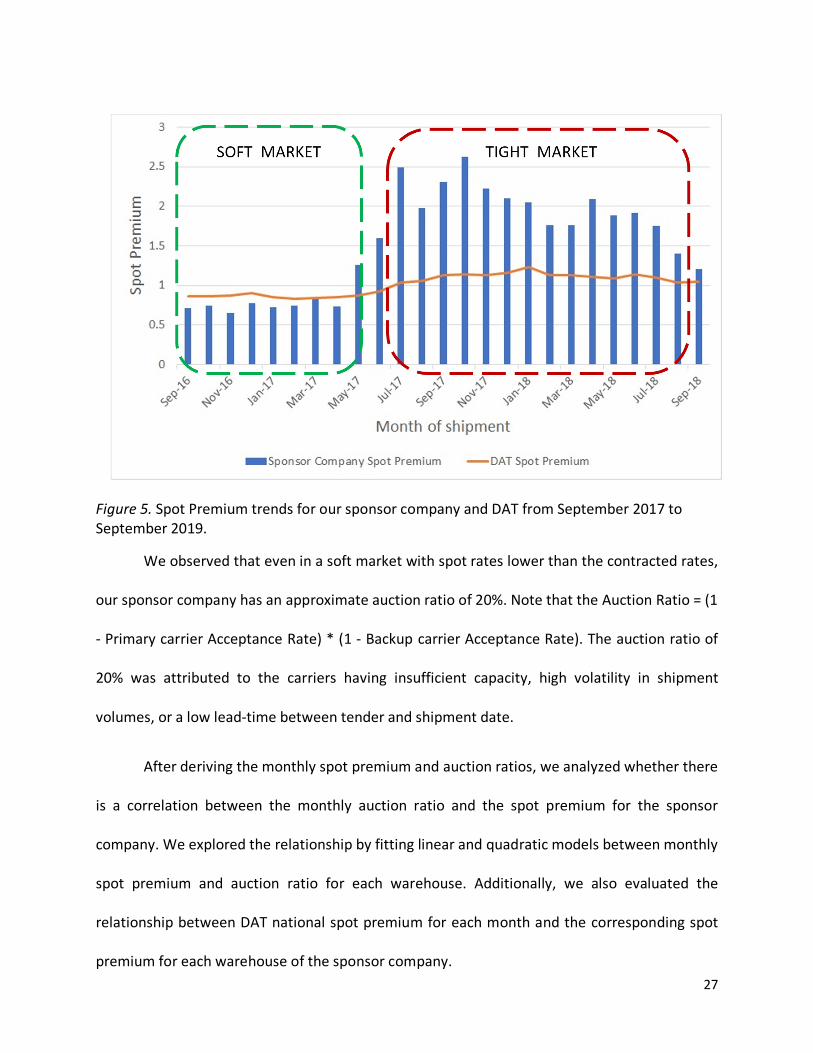
Table 2
Monthly snapshot of line haul rates and auction ratios of the sponsor company
Table 2 shows the actual data of a warehouse located in Wisconsin with the following columns
for each month:
Average of LHPM (Contract) was calculated by dividing the sum of line haul cost for
shipments fulfilled by contract carriers by the sum of the distance of shipments fulfilled by
contract carriers. Average of LHPM (Spot) was calculated by dividing the sum of line haul cost for
shipments fulfilled through spot market by the sum of distance of shipments fulfilled through
spot market. Sponsor Spot Premium was obtained by dividing average of LHPM for spot market
by average of LHPM for contract carriers. Sponsor Auction Ratio was calculated by dividing the
total number of shipments fulfilled through spot premium by total number of shipments.
DAT Contract LHPM is the average national line haul cost per mile for contract carriers as
per DAT. DAT Spot LHPM represents average national line haul cost per mile for spot market as
per DAT. DAT Spot Premium was calculated as a ratio of DAT Spot LHPM and DAT Contract LHPM.
DAT change for period t is calculated by dividing the DAT Spot Premium for period t-1 by the DAT
Spot premium for period t-2.
31
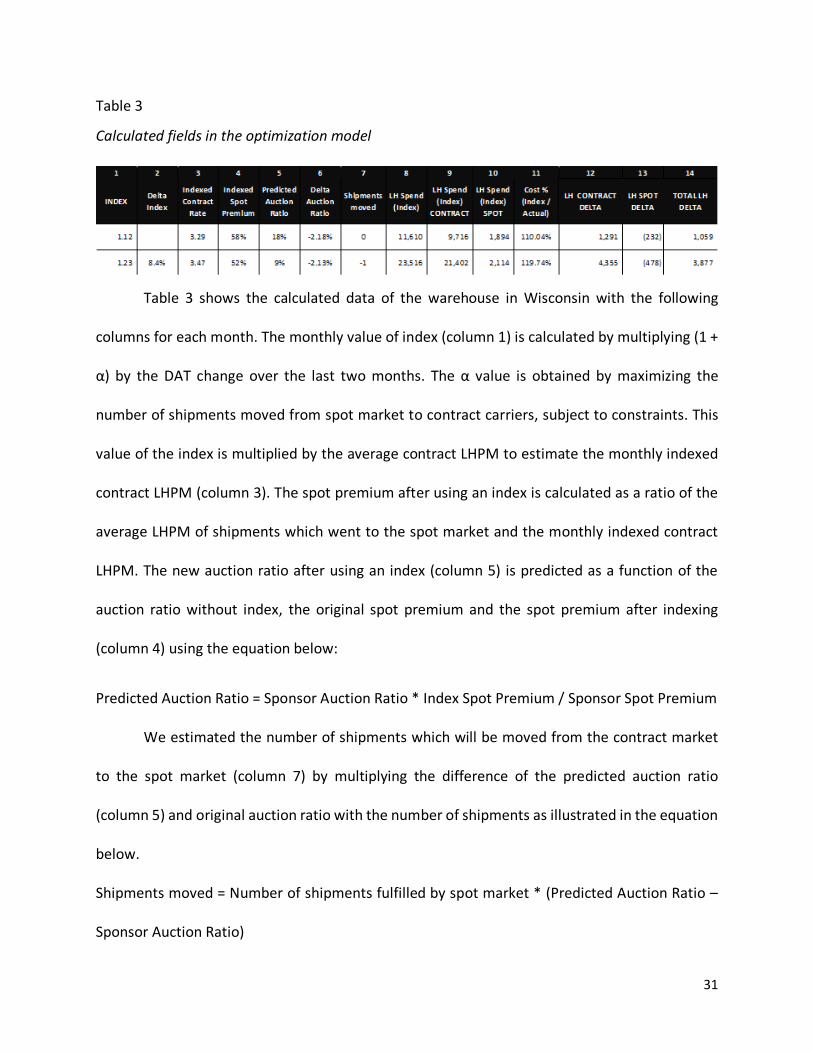
Table 3
Calculated fields in the optimization model
Table 3 shows the calculated data of the warehouse in Wisconsin with the following
columns for each month. The monthly value of index (column 1) is calculated by multiplying (1 +
α) by the DAT change over the last two months. The α value is obtained by maximizing the
number of shipments moved from spot market to contract carriers, subject to constraints. This
value of the index is multiplied by the average contract LHPM to estimate the monthly indexed
contract LHPM (column 3). The spot premium after using an index is calculated as a ratio of the
average LHPM of shipments which went to the spot market and the monthly indexed contract
LHPM. The new auction ratio after using an index (column 5) is predicted as a function of the
auction ratio without index, the original spot premium and the spot premium after indexing
(column 4) using the equation below:
Predicted Auction Ratio = Sponsor Auction Ratio * Index Spot Premium / Sponsor Spot Premium
We estimated the number of shipments which will be moved from the contract market
to the spot market (column 7) by multiplying the difference of the predicted auction ratio
(column 5) and original auction ratio with the number of shipments as illustrated in the equation
below.
Shipments moved = Number of shipments fulfilled by spot market * (Predicted Auction Ratio –
Sponsor Auction Ratio)

32
We estimated the monthly line haul costs of shipments going to spot market (column 10)
and contract carriers (column 9) by multiplying the indexed line haul rates (column 3) and the
number of shipments which were predicted to go to the spot market and contract carriers after
indexing using the following equations.
LH Spend (Index) Contract = of contracted shipments * Indexed Contract Rate
LH Spend (Index) Spot = Predicted number of spot shipments * Average of LHPM (Spot)
LH Spend (Index) = LH Spend (Index) Contract + LH Spend (Index) Spot
The change in line haul costs for contracted shipments (column 12) was calculated as a
difference between line haul spend when shipments move under contracted rates with the index-
based model and actual line haul spend for shipments fulfilled by the contract carriers. The
change in line haul costs for spot shipments (column 13) was calculated as a difference between
line haul spend when shipments go to the spot market with the index-based model and actual
line haul spend for shipments going to the spot market. The incremental line haul costs (column
14) was calculated as a difference between the predicted line haul spend with an index and the
actual line haul spend.

33
Figure 6. Impact of α on the indexed contract price.
Figure 6 depicts the impact of α on the monthly indexed contract rate. We observed that
in September 2016, October 2016 and June 2017, the indexed contract rate is higher than the
actual contract and spot rates paid by the sponsor company. This can be attributed to the
increasing trend of DAT rates which was amplified by α. For the remaining months, the index
contract rate lies between the sponsor company’s contract rate and spot rate.
We trained the model on first 12 months of data and tested over the next 12 months of
data. This approach has the advantage of being generalizable i.e. we can evaluate the model
performance more realistically over a period of time irrespective of the market conditions.
3.3 Chapter Summary
We formulated an empirical relationship between the auction ratio and spot premium for
each warehouse of our sponsor company. We developed a non-linear optimization model that

34
focused on increasing the acceptance ratio by the carriers, through adjusting contract rates in
line with an index for each warehouse. We incorporated various constraints to ensure that the
monthly line haul spends after implementing the index are viable for our sponsor company. The
model provided an output which evaluated the feasibility of index-pricing at each warehouse,
which would be discussed in the subsequent section.

35
4. Results and Analysis
This chapter discusses the results of the model we elaborated in Chapter 3. First, we show
the estimated relationship between an index and the auction ratio. Second, we discuss the results
of the optimization model.
An increase in acceptance ratio by carriers results in many tangible and intangible benefits
for the shippers. There are various drivers available for a shipper to influence the acceptance
ratio by carriers, such as offering a contract rate that is aligned with the prevailing spot market
rate and developing long-term strategic partnerships with carriers.
Our model evaluated the feasibility of having a contract rate that was aligned to the
prevailing market conditions by pegging it to national DAT index. We optimized the value of α,
which will be used to multiply change in DAT spot premium to obtain the monthly index.
Figure 7. Relationship between sponsor company spot premium and auction ratio.

36
Figure 7 shows the relationship between the auction ratio and spot premium for
shipments from each warehouse. We modelled the auction ratio as a quadratic function of spot
premium and observed that eight out of the twelve warehouses do not exhibit a statistically
significant correlation between auction ratio and spot premium. This could be because we used
national DAT line haul rates which may not reflect the market dynamics of the regions served by
these warehouses. Another reason could be that we aggregated shipments on a monthly basis
to derive average line haul rates for the sponsor company and also used monthly DAT line haul
rates. We also observed that the tail lane shipments from California exhibit a trend where higher
spot premiums correspond to lower auction ratios. We shortlisted the warehouses in Wisconsin,
Pennsylvania, Missouri and California as relevant candidates for index based pricing because they
had a correlation greater than 0.35 between the spot premium and the auction ratio.
Figure 8. Relationship between DAT spot premium and spot premium for each warehouse.
37
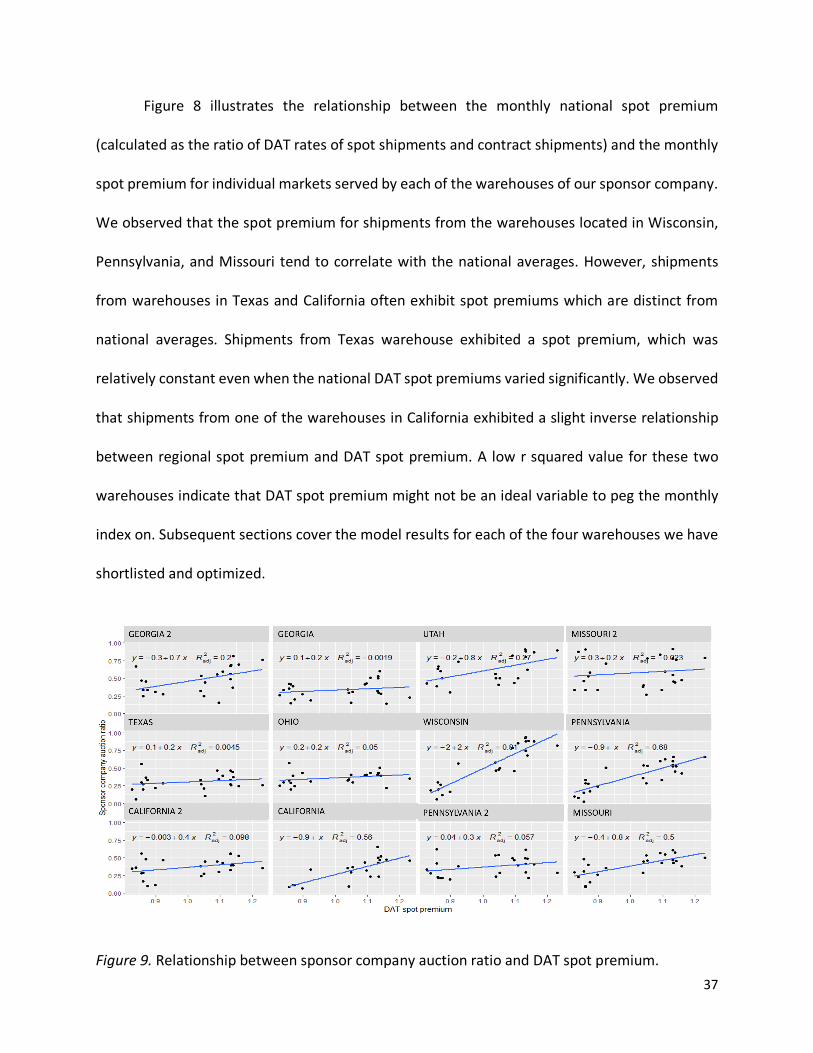
Figure 8 illustrates the relationship between the monthly national spot premium
(calculated as the ratio of DAT rates of spot shipments and contract shipments) and the monthly
spot premium for individual markets served by each of the warehouses of our sponsor company.
We observed that the spot premium for shipments from the warehouses located in Wisconsin,
Pennsylvania, and Missouri tend to correlate with the national averages. However, shipments
from warehouses in Texas and California often exhibit spot premiums which are distinct from
national averages. Shipments from Texas warehouse exhibited a spot premium, which was
relatively constant even when the national DAT spot premiums varied significantly. We observed
that shipments from one of the warehouses in California exhibited a slight inverse relationship
between regional spot premium and DAT spot premium. A low r squared value for these two
warehouses indicate that DAT spot premium might not be an ideal variable to peg the monthly
index on. Subsequent sections cover the model results for each of the four warehouses we have
shortlisted and optimized.
Figure 9. Relationship between sponsor company auction ratio and DAT spot premium.

38
Figure 9 depicts the relationship between sponsor company auction ratio and DAT spot
premium. We explored this relationship to ensure that the sponsor company’s auction ratio is
correlated with the national transportation market market dynamics as indicated by DAT spot
premium. The short-listed warehouses in Pennsylvania, Missouri, California and Wisconsin
exhibit an r squared value greater than 0.5. This justifies the use of DAT spot premium to derive
the monthly index for these warehouses.
4.1 Model results for Pennsylvania
Pennsylvania has one of the biggest manufacturing sites and distribution centers for our
sponsor company. Our sponsor company spent around $ 3 Million in line haul costs for
approximately 3700 shipments in tail lanes originating from Pennsylvania during our analysis
horizon. We observed that the average line haul cost per mile for shipments from Pennsylvania
are relatively higher compared to the other warehouses. The carrier acceptance ratio was 64%,
which was close to the average for tail lane shipments.
From our optimization model, we obtained an α value of 6 as a multiplier to maximize
shipments moving from spot market to contract carriers.
39
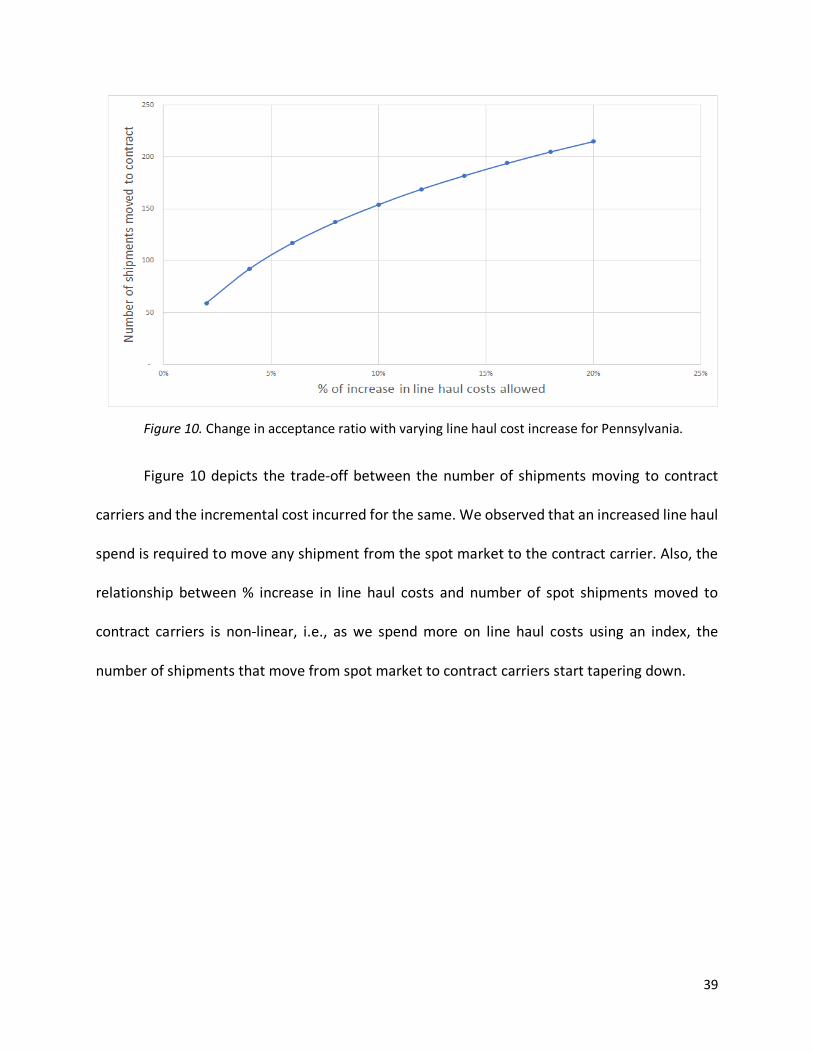
Figure 10. Change in acceptance ratio with varying line haul cost increase for Pennsylvania.
Figure 10 depicts the trade-off between the number of shipments moving to contract
carriers and the incremental cost incurred for the same. We observed that an increased line haul
spend is required to move any shipment from the spot market to the contract carrier. Also, the
relationship between % increase in line haul costs and number of spot shipments moved to
contract carriers is non-linear, i.e., as we spend more on line haul costs using an index, the
number of shipments that move from spot market to contract carriers start tapering down.

40
Figure 11. Monthly behavior of incremental line haul costs for Pennsylvania.
Figure 11 illustrates the monthly behavior of increment line haul costs for Pennsylvania.
Contract Delta depicts the monthly incremental line haul costs for shipments fulfilled by contract
carriers after deploying indexed contract rate. Spot Delta depicts the monthly incremental line
haul costs for shipments fulfilled through spot market after deploying indexed contract rate.
Total Delta depicts the net incremental line haul costs after deploying indexed contract rate. This
comprises of the incremental line haul cost for spot shipments and the incremental line haul cost
for contract carriers. With the use of an index-based price, we observed that the net line haul
costs went up for shipments from Pennsylvania. This was primarily attributed to increased spend
for contract carriers due to the index being greater than 1 during the period when the overall
market was soft.
4.2 Model results for Wisconsin
Our sponsor company spent around $ 920,000 in line haul costs for approximately 800
shipments from the distribution center located in Wisconsin. We observed that the average line
41
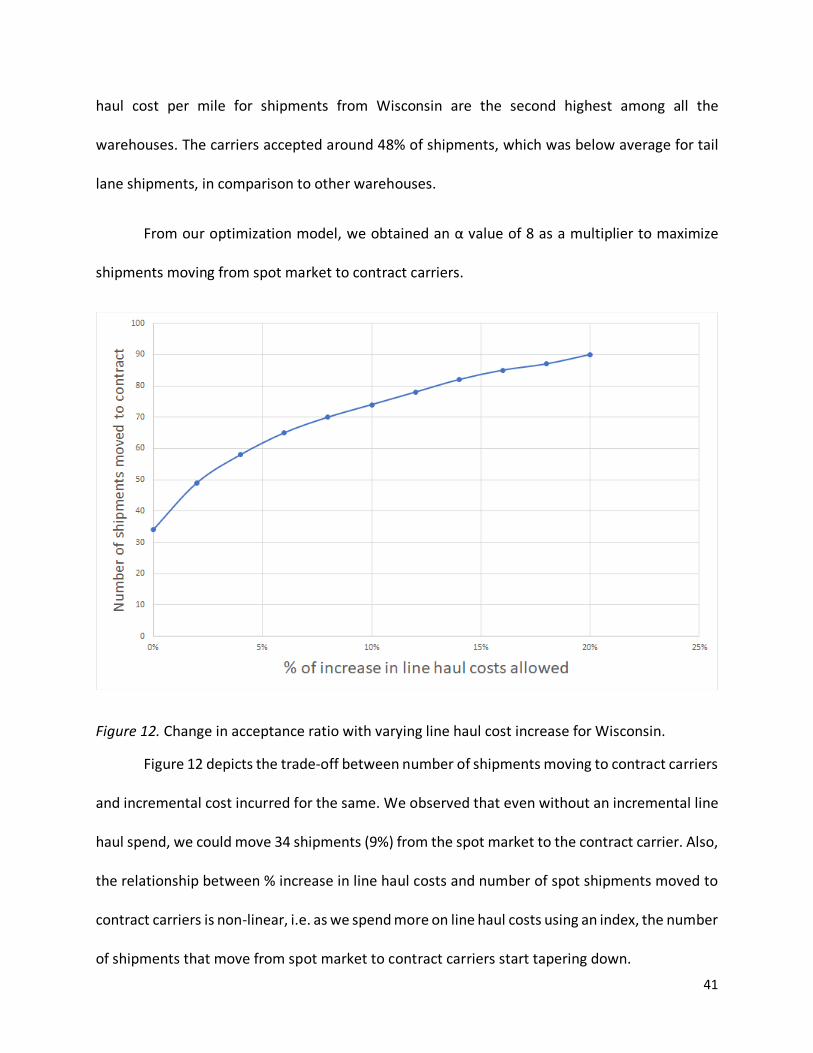
haul cost per mile for shipments from Wisconsin are the second highest among all the
warehouses. The carriers accepted around 48% of shipments, which was below average for tail
lane shipments, in comparison to other warehouses.
From our optimization model, we obtained an α value of 8 as a multiplier to maximize
shipments moving from spot market to contract carriers.
Figure 12. Change in acceptance ratio with varying line haul cost increase for Wisconsin.
Figure 12 depicts the trade-off between number of shipments moving to contract carriers
and incremental cost incurred for the same. We observed that even without an incremental line
haul spend, we could move 34 shipments (9%) from the spot market to the contract carrier. Also,
the relationship between % increase in line haul costs and number of spot shipments moved to
contract carriers is non-linear, i.e. as we spend more on line haul costs using an index, the number
of shipments that move from spot market to contract carriers start tapering down.

42
Figure 13. Monthly behavior of incremental line haul costs for Wisconsin.
Figure 13 depicts the trade-off between number of shipments moving to contract carriers
and incremental cost incurred for the same. With the use of an index-based price, we observed
that the net line haul costs went up for shipments from Wisconsin during the period when the
market was soft. As the market tightened, our model predicts that index-based pricing will result
in a net reduction of line haul costs.
4.3 Model results for California
Our sponsor company spent around $ 726,000 in line haul costs for approximately 1,062
shipments from the distribution center located in California. We observed that the average line
haul cost per mile for shipments from California is the highest among all the warehouses ($ 4.62
per mile). The carriers accepted around 70% of shipments, which is the second highest in
comparison to other warehouses.
43
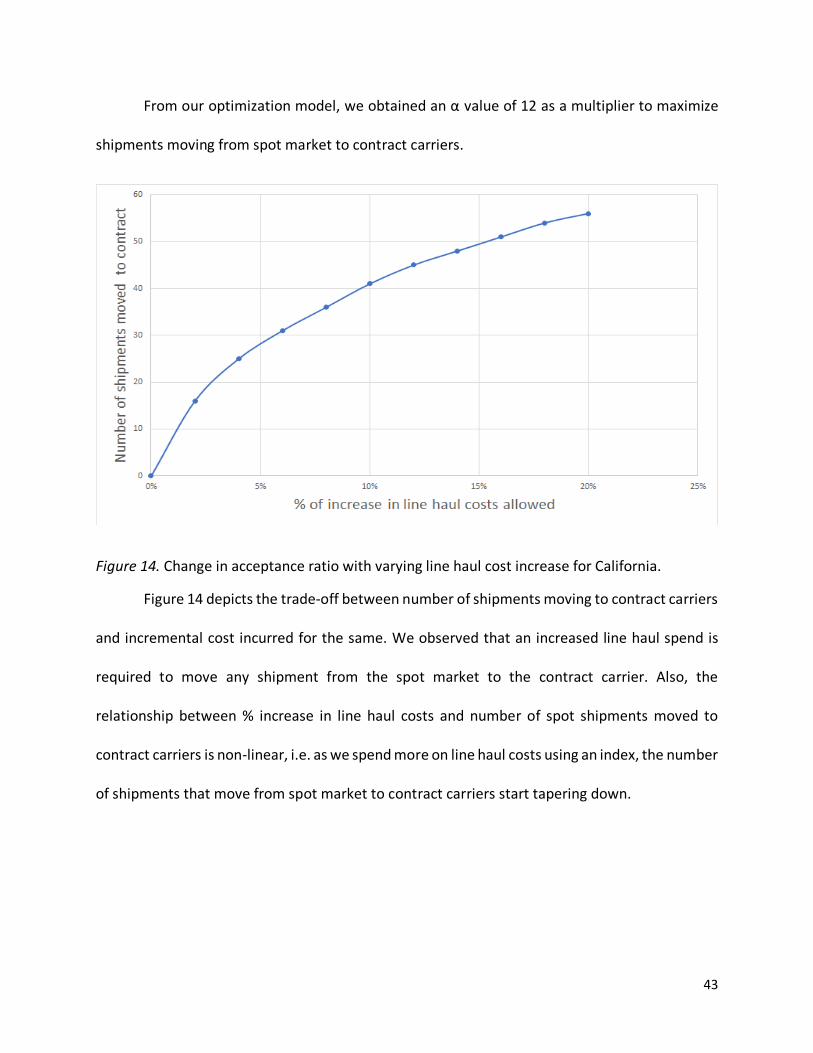
From our optimization model, we obtained an α value of 12 as a multiplier to maximize
shipments moving from spot market to contract carriers.
Figure 14. Change in acceptance ratio with varying line haul cost increase for California.
Figure 14 depicts the trade-off between number of shipments moving to contract carriers
and incremental cost incurred for the same. We observed that an increased line haul spend is
required to move any shipment from the spot market to the contract carrier. Also, the
relationship between % increase in line haul costs and number of spot shipments moved to
contract carriers is non-linear, i.e. as we spend more on line haul costs using an index, the number
of shipments that move from spot market to contract carriers start tapering down.
44
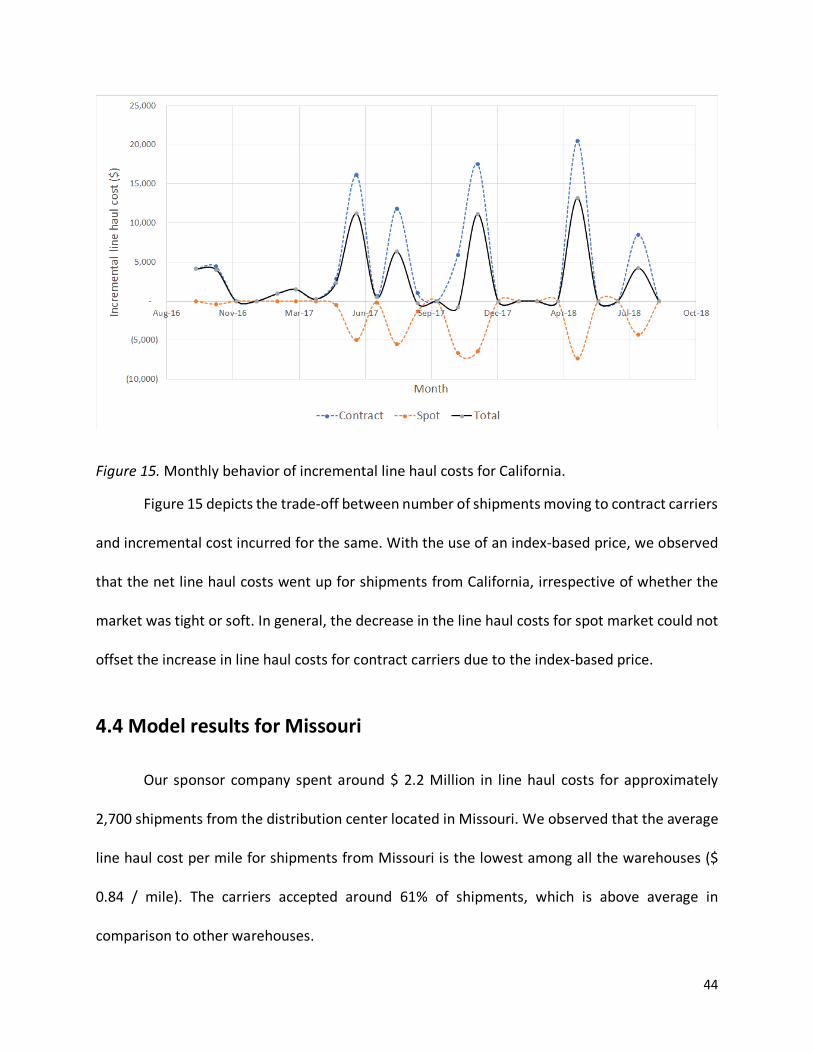
Figure 15. Monthly behavior of incremental line haul costs for California.
Figure 15 depicts the trade-off between number of shipments moving to contract carriers
and incremental cost incurred for the same. With the use of an index-based price, we observed
that the net line haul costs went up for shipments from California, irrespective of whether the
market was tight or soft. In general, the decrease in the line haul costs for spot market could not
offset the increase in line haul costs for contract carriers due to the index-based price.
4.4 Model results for Missouri
Our sponsor company spent around $ 2.2 Million in line haul costs for approximately
2,700 shipments from the distribution center located in Missouri. We observed that the average
line haul cost per mile for shipments from Missouri is the lowest among all the warehouses ($
0.84 / mile). The carriers accepted around 61% of shipments, which is above average in
comparison to other warehouses.
45
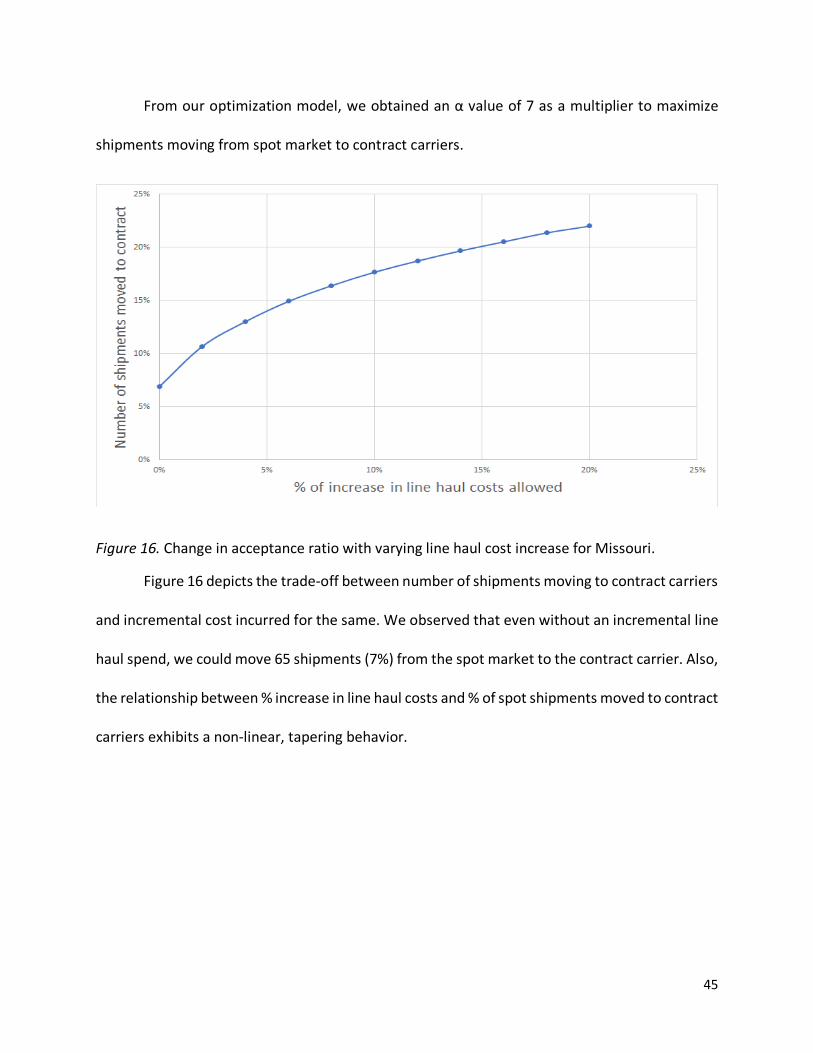
From our optimization model, we obtained an α value of 7 as a multiplier to maximize
shipments moving from spot market to contract carriers.
Figure 16. Change in acceptance ratio with varying line haul cost increase for Missouri.
Figure 16 depicts the trade-off between number of shipments moving to contract carriers
and incremental cost incurred for the same. We observed that even without an incremental line
haul spend, we could move 65 shipments (7%) from the spot market to the contract carrier. Also,
the relationship between % increase in line haul costs and % of spot shipments moved to contract
carriers exhibits a non-linear, tapering behavior.

46
Figure 17. Monthly behavior of incremental line haul costs for Missouri.
Figure 17 depicts the trade-off between number of shipments moving to contract carriers
and incremental cost incurred for the same. With the use of an index-based price, we observed
that the net line haul costs went up for shipments from Missouri, irrespective of whether the
market was tight or soft. In general, the decrease in the line haul costs for spot market could not
offset the increase in line haul costs for contract carriers due to the index-based price.
47
5. Discussion and Conclusion
Our objective was to evaluate the effectiveness and value of index-based contracts for
truck load in North America. We deployed an optimization model to analyze the month to month
impact of an index-based price on tail lane shipments from 12 distribution centers. This section
summarizes our findings and areas of further refinement to our model.
5.1 Summary of Main Findings
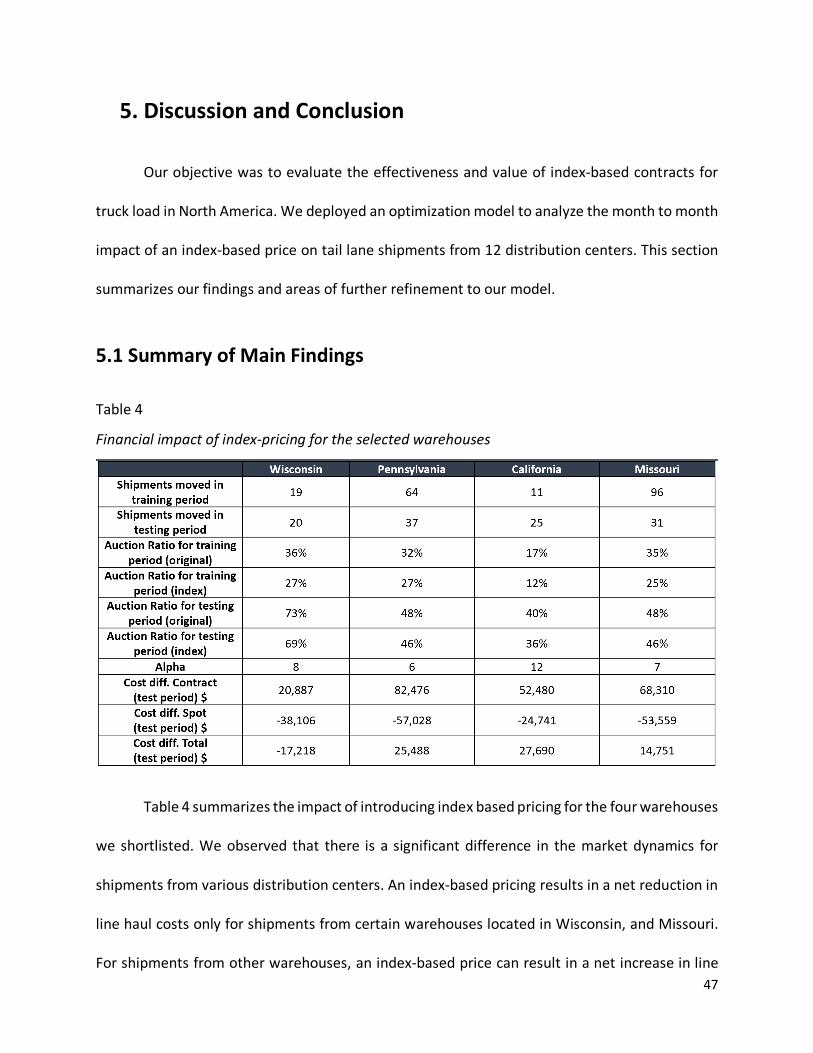
Table 4
Financial impact of index-pricing for the selected warehouses
Table 4 summarizes the impact of introducing index based pricing for the four warehouses
we shortlisted. We observed that there is a significant difference in the market dynamics for
shipments from various distribution centers. An index-based pricing results in a net reduction in
line haul costs only for shipments from certain warehouses located in Wisconsin, and Missouri.
For shipments from other warehouses, an index-based price can result in a net increase in line
48
haul spend. However, this may be partially offset by the cost savings associated with reduced
penalties associated with customer non-compliance of shipments fulfilled through the spot
market. Our sponsor company had observed that shipments fulfilled through spot market often
tend to be not delivered to the customer on-time. This results in penalties by the customers for
those shipments. By deploying an index-based pricing, the number of shipments that are fulfilled
through the spot market would be reduced, resulting in lesser penalties and hence, higher cost
savings.
In the discussions with transportation partners of our sponsor company, we found out
that even in cases of surplus capacity, certain asset owners were not willing to accept loads if the
new indexed rate offered is below a threshold value. This is because asset owners, after
conducting their internal cost benefit analysis, prefer to keep their assets available for spot
market shipments than commit to our sponsor company at a reduced line haul rate.
We also observed some apprehensions about the index with some transportation brokers
who were worried about any potential impacts to their profitability. The reason provided by
brokers was that they procure their capacity from asset-owners at a fixed annual rate. Whenever
an index results in rates lower than the agreed upon line haul rate, it would result in losses for
the brokers.
We noticed some differences among carriers in terms of their preferred update frequency
of the index. In the scenario where the contract price between the shipper and carrier changes
on a monthly basis, the brokers were anxious that they might not be as profitable as planned.
They were unsure whether they could implement a similar alternate pricing model with the asset

49
owners. In contrast, the asset owners preferred the rate to be updated as frequently as once a
week so that their returns are a representation of the current market scenario.
5.2 Areas of Future Research
Our analysis utilized national DAT index, and price and acceptance ratio variations
between contract and spot shipments to develop a monthly index for contract line haul rates at
a warehouse level. While changes in spot premiums explain a portion of changes in acceptance
ratios, we believe that this model can be refined by incorporating the following features:
The scope of our Capstone was limited to shipments in tail lanes. These lanes are
characterized by low, intermittent shipments. The relationship between auction ratio and spot
premium may be different for lanes with different market dynamics. Applicability of the
developed model needs to be explored for shipments of all the lane types.
A national index was used to derive the index in our optimization model. We observed
that shipments from certain warehouses tend to have distinct patterns in comparison with the
national trends. A regional index can be utilized to capture market dynamics at a more granular
level.
Our sponsor company provides forecasted volumes to the carriers a year in advance while
setting the contract rates. However, these forecasts may not capture the shipment volume
volatility. This results in under utilization of assets of carriers or increased load rejections. Further
research can be conducted on the benefits of having a granular forecast of shipment volumes
and more frequent data sharing between shippers and carriers.

50
Our model utilizes trailing market indicators (DAT index of the previous two months) to
calculate an indexed contract rate. However, anticipated events like weather anomalies, changes
in regulations, seasonality of products being shipped etc. can significantly alter the demand-
supply characteristics of the transportation market. Using leading indicators of the trucking
market to develop the index is an avenue for future research.
Our study assumed that an index will be applicable to the line haul rates of all contract
carriers. A further refinement to this model can have an index contract rate applied only to
selected carriers for each lane. This necessitates further research on how to identify carriers who
can be offered an indexed price. Our methodology involved monthly aggregation of the data,
which was appropriate for our sponsor company. Depending on the market situations, the
frequency of updating the index can be as high as weekly or as low as quarterly. The impact of
this time horizon on carrier behavior and line haul costs need to be further explored.
Our optimization model incorporated several parameterized constraints to ensure results
are in line with the business requirements of our sponsor company. Currently, we have set upper
and lower bounds of the index at 2 and 0.9 respectively. Further discussions with a larger group
of shippers and carriers are required to validate or refine these constraints. Another areas of
future research would be to have flexible limits for the index that can change with the market
dynamics.
We aggregated shipments at a monthly and warehouse level to understand the impact of
spot premiums on carrier rejections. The probability of an individual shipment being rejected
based on various shipment attributes such as lane distance, day or time of shipment, lead time,
carrier characteristics etc. requires further exploration.

51
We established a linear relationship between auction ratio and spot premium for each
region. However, if the index falls below 1, the indexed contract rate will fall below the original
agreed-upon line haul rate between the shipper and carriers. This might result in rejections
beyond what was predicted by the linear relationship. More sophisticated analytic techniques
might be required to model the behavior when index falls below 1.
We believe that our study can be leveraged by our sponsor company and other shippers
to reduce the percentage of shipments going to the spot market. While this requires an upfront
investment to incorporate process, technology and contract changes, the accrued benefits make
it a prudent investment.

52
References:
Alex Scott, C. P. (2017). Service Refusals in Supply Chains: Drivers and Deterrents of Freight Rejection. Transportation Science, 1086-1101.
Amiryan, N., & Bhattacharjee, S. (2015). Relationship between price and performance: an analysis of the US trucking market (Thesis). Massachusetts Institute of Technology. Retrieved from http://dspace.mit.edu/handle/1721.1/99800
Ashe, A. (2018, 02 28). US truckload shippers grapple with surcharges, rejected freight. Retrieved from JOC: https://www.joc.com/trucking-logistics/ltl-shipping/us-truckload-shippers-grapple-surcharges-rejected-freight_20180228.html
AT Kearney. (2018). CSCMP’s Annual State Of Logistics Report . Retrieved from https://www.atkearney.com/transportation-travel/state-of-logistics-report
Baertlein, L. (2018, 09 06). U.S. trucking industry volumes to grow 4.2 percent in 2018: forecast. Retrieved from Reuters: https://www.reuters.com/article/us-usa-trucking-forecast/u-s-trucking-industry-volumes-to-grow-4-2-percent-in-2018-forecast-idUSKCN1LM1TR
Bleggi, C. C., & Zhou, F. (2017). A study of freight performance and carrier strategy (Thesis). Massachusetts Institute of Technology. Retrieved from http://dspace.mit.edu/handle/1721.1/112876
C.H.Robinson. (2013) Truckload Fuel SurchargesHow They Work and What They Cost. Retrieved from https://www.supplychainbrain.com/ext/resources/secure_download/KellysFiles/WhitePapersAndBenchMarkReports/CHRobinson/CHR_TruckloadFuelSurchargeWhitepaper.pdf
Caplice, C. (2009). Electronic Markets for Truckload Transportation. Production and Operations Management, 16(4), 423–436. https://doi.org/10.1111/j.1937-5956.2007.tb00270.x
Caplice, C., & Sheffi, Y. (2003). Optimization-based procurement for transportation services. Journal of Business Logistics, 24(2), 109–128. https://doi.org/10.1002/j.2158-1592.2003.tb00048.x
Cassidy, W. B. (2018, 11 05). Bullish’ US truck market to last well into 2019. Retrieved from JOC: https://www.joc.com/trucking-logistics/%E2%80%98bullish%E2%80%99-us-truck-market-last-well-2019_20180911.html
Douglas, M. (2006), "Carrier Partnerships: A Matter of Trust," Inbound Logistics, 26(1), pp. 161-167

53
Geman, H., & Smith, W. O. (2012). Shipping markets and freight rates: an analysis of the Baltic Dry Index. Journal of Alternative Investments, 15(1), 98-109
Harding, M. J. (2005). Can shippers and carriers benefit from more robust transportation planning methodologies? (Thesis). Massachusetts Institute of Technology. Retrieved from http://dspace.mit.edu/handle/1721.1/33322
Kafarski, L., & Caruso, D. A. (2012). Effects of truckload freight assignment methods on carrier capacity and pricing (Thesis). Massachusetts Institute of Technology. Retrieved from http://dspace.mit.edu/handle/1721.1/77464
Kim, Y. J. (2013). Analysis of truckload prices and rejection rates (Thesis). Massachusetts Institute of Technology. Retrieved from http://dspace.mit.edu/handle/1721.1/81098
Nandiraju, S., & Regan, A. (2008). Freight Transportation Electronic Marketplaces: A Survey of the Industry and Exploration of Important Research Issues. Paper presented at the 84th Annual Meeting of the Transportation Research Board.
Straight, B. (2017, July 29) How to control your fuel costs. Retrieved from https://www.freightwaves.com/news/2017/11/29/how-to-control-your-fuel-costs
Vos, D. K. (1999). Procurement of motor carrier services and the impact of surges in demand (Doctoral dissertation, Massachusetts Institute of Technology).
Zsidisin, G. A., Voss, M. D., & Schlosser, M. (2007). Shipper-Carrier Relationships and their Effect on Carrier Performance. Transportation Journal, 15.