Also available in the - Investment Bank | Barclays · Barclays | The cost o f evolving bank...
22
PLEASE SEE ANALYST CERTIFICATION(S) AND IMPORTANT DISCLOSURES ON THE LAST PAGE. Also available in the PLEASE SEE ANALYST CERTIFICATION(S) AND IMPORTANT DISCLOSURES ON THE LAST PAGE.
-
Upload
dinhkhuong -
Category
Documents
-
view
217 -
download
0
Transcript of Also available in the - Investment Bank | Barclays · Barclays | The cost o f evolving bank...
PLEASE SEE ANALYST CERTIFICATION(S) AND IMPORTANT DISCLOSURES ON THE LAST PAGE.
Also available in the
PLEASE SEE ANALYST CERTIFICATION(S) AND IMPORTANT DISCLOSURES ON THE LAST PAGE.
Barclays | The cost of evolving bank regulation
The cost of evolving bank regulation • Since the financial crisis, academics, politicians, and regulators have proposed
reforms aimed at making the banking sector more stable. Often, these rules have sought to boost industry safety by mandating capital structure changes. While acknowledging the benefits to industry stability, many in the business world have argued that these reforms are costly, as they raise the average cost of funding and thereby damage credit creation and liquidity provision. Regulators and some academics have responded that, through the lens of Miller-Modigliani (MM), these concerns are unjustified and that banks should be indifferent to changes in capital structure.
• Our analysis suggests a middle ground: some reforms are costly. We believe that raising capital requirements – whether through minimum equity or minimum wholesale debt as a percentage of the balance sheet – would constrict the ability of most large banks to interact with clients in their respective business lines, impairing revenue. Banks would miss out on profitable lending opportunities and related service revenue, while businesses and consumers would face incrementally impaired access to credit at an incrementally higher price. On the other hand, we do not see reform as costly where regulations aim merely to shift the mix between sources of wholesale funding, such as equity and debt.
• We conclude that capital structure changes are likely to be more costly in the US, where wholesale funding represents a relatively small share of bank funding. Proposals such as the minimum debt requirement may effectively cap customer-centric liabilities below natural levels and introduce related costs. Alternatively, the new capital requirements may be less costly in Europe, where banks have typically funded themselves with a higher percentage of wholesale funding by choice. In this region, banks may be able to limit the costs of higher equity requirements by shifting debt balances lower and leaving customer-centric liabilities unchanged.
Our review of the validity of applying MM to banks to assess the costs of capital reform leads us to identify a key link between deposits and revenue. Specific liabilities, such as deposits and certain broker liability balances, generate positive externalities via related fee income or better loan performance. Forcing a reduction in these special liabilities would restrict the profitability of the underlying asset base, creating a cost that would be passed on to various stakeholders.
Therefore, our assertion is not that increased capital requirements are bad, but rather that new capital requirements which limit customer-centric liabilities are costly, and that rules must balance these costs against the benefits of financial stability. Costs and benefits must be viewed in context.
Furthermore, we identify additional negative side-effects that could result from the quick succession of changes to capital structure regulation. Most notably, an increase in required wholesale funding might not only limit positive externalities in fee income; it could also encourage banks to subtly add industry risk in ways that regulators have historically found difficult to protect against.
The capital debate continues to develop Bank capital has been a focus for politicians, regulators, bankers, and investors since the housing bubble burst in 2007. This debate continues today, despite equity ratios that are significantly higher than they were pre-crisis across most large international banks. In fact, it has broadened into a discussion about the entire capital structure. Some of the initial Basel III elements are currently beginning to be phased in – encouraging higher common equity capitalization globally, preferred issuance in the US, and CoCo issuance in Europe – while other elements face continued debate, and new
Jeffrey Meli
Brian Monteleone Conor Pigott
13 February 2014 1

Barclays | The cost of evolving bank regulation
proposals continue to surface. For example, in the US, regulators have said they plan to increase minimum bank capital ratios further via a leverage ratio, establish a required minimum amount of long-term wholesale financing for the largest banks, and review ways to limit short-term, secured wholesale financing activity. Likewise, outside the US, regulators continue to pursue super-equivalent Basel III requirements and intra-group ring-fencing strategies to limit systemic risk.
FIGURE 1 Some recent regulatory proposals have sought to adjust bank capital structures
Item Status Description
Basel III Tier 1 Common Capital Minimums
Rules Finalized, In Phase-in
Process
Subset of Basel III. Largely implemented via CRD IV in Europe and Federal Reserve rulemaking in the US. Raises capital requirements to 7.0-9.5% common equity as a percentage of risk-weighted assets. Also makes numerous adjustments to risk-weighted asset calculation
New Tier 1 Capital Definitions
Rules Finalized, In Phase-in
Process
Subset of Basel III. Trust preferreds no longer eligible for Tier 1 capital credit, leading to issuance of non-cumulative perpetual DRD preferreds in the US and CoCo issuance in Europe and elsewhere
Quantitative Liquidity Regulations
Rules Proposed
Subset of Basel III. Requires liabilities prone to outflows to be matched with high quality liquid assets over shorter-term (Liquidity Coverage Ratio, LCR) and longer-term windows (Net Stable Funding Ratio, NSFR)
Supplementary Leverage Ratio
Rules Proposed
Subset of Basel III. Requires a much higher, standard percentage of on-balance-sheet assets and off-balance- sheet exposures to be funded with equity (regardless of the riskiness of the asset/exposure)
Minimum Debt Requirement
Under Consideration
(in US)
Would require minimum bank holding company-level debt plus equity as a percentage of risk-weighted assets to facilitate a potential orderly liquidation of a systemically important financial institution.
Short-term Financing Reform
Under Consideration
(in US)
Would effectively minimize ability to use short-term, wholesale funding to achieve leverage via regulations to require higher capital charges for heavy users or minimum collateral haircuts
Source: Barclays Research
The basic arguments to date for and against higher equity Underpinning the discussion of all the proposals for bank capital structures is a debate on the broad macro-economic consequences – or lack thereof – of making banks safer.
Bankers typically argue that reducing bank leverage is bad for the economy – ie, banks will reduce the supply of credit and increase the cost of borrowing if forced to raise “expensive” equity. The basic argument is that for most large banks, the cost of equity is 10-15%, many times the cost of raising debt in the wholesale market. Therefore, raising additional equity must result in a higher average cost of funds, which will feed through to the rates banks charge on loans.
This argument is dismissed by many regulators and academics. Their counterargument relies on the Miller-Modigliani (MM) theorem, a cornerstone of corporate finance. To paraphrase, MM states that in the absence of taxes and bankruptcy costs, the choice of capital structure is irrelevant. The basic argument is that the costs of equity and debt adjust to reflect their respective levels of risk. So a firm with more debt will provide more upside to equity, but at the cost of higher debt spreads. Ultimately, the assets of a firm define its riskiness, and the distribution of that risk across liabilities does not affect the enterprise value of the firm. Of course, in the real world, interest is tax deductible, giving corporations an incentive to increase leverage. This is countered by the value destruction associated with bankruptcy (the “cost of financial distress”). Actual firms seek to balance these two issues when choosing a capital structure.
13 February 2014 2

Barclays | The cost of evolving bank regulation
Seems theoretical…but it is the framework used by regulators Applying a theoretical result to the very real problem of bank regulation may be brushed off by market participants, but this line of reasoning has two things going for it. First, it is compelling. The insights in MM explain a lot about the capital structure decisions of non-financial firms, and many of the implications seem to hold for banks. For example, banks with less equity tend to have wider credit spreads. The equity of less-leveraged banks is less volatile, and less costly, than that of more-leveraged banks.1 In other words, the prices of bank securities seem to adjust as one might expect, given MM.
Second, proponents of MM among regulators and policymakers argue that forcing banks to change their capital structures would have few implications for the economy. MM is the intellectual framework supporting this view and has been cited, explicitly and implicitly, by senior officials at the Federal Reserve and the Bank of England.2 It also underpins a rising number of editorials and op-eds demanding a safer banking system and supporting such proposals as raising equity ratios to 20-30% or markedly increasing wholesale debt financing.3
That said, we question the wisdom of applying the principles of MM uniformly across all types of bank funding.
MM misapplied: Depositors are customers, not just creditors We think the proponents of dramatic changes to bank capital structures are misapplying MM to the banking sector and thereby underestimating the implications of higher capital requirements for credit creation and the broader economy. The breakdown of MM in the context of banking comes from one of the economic theory’s basic, underlying assumptions – namely, that a firm’s cash flows do not depend on its financial policy. In other words, MM presupposes that our choice as investors to hold a company’s stocks or bonds does not affect the way we interact with that company as consumers. This is usually a reasonable assumption. For example, an investor in Ford equity or debt is no more likely to buy a car from Ford than from any other car manufacturer. In fact, precisely because this assumption holds for most companies, it does not typically receive much attention when discussing MM.
However, this assumption does not hold for banks. Most banks’ capital structures comprise investors who look much more like customers. For example, a bank’s depositors are technically liability holders, but depositors feel much more like customers when entering a branch, and the banks themselves openly regard them as such. This is because a depositor at a given bank, for instance, JPMorgan, is much more likely to purchase other financial services from JPMorgan, and much less likely to purchase them from a competitor, such as Bank of America. Yes, the bank-depositor relationship generates liabilities, but the ability to accept these specific types of liabilities (in this case, deposits) directly supports the bank’s ability to generate higher revenue per unit of assets.
This logic applies also applies to a number of other parts of a bank’s capital structure, where liabilities are similarly linked to specific customers, businesses, and revenue opportunities. For example, broker-dealers connect repo borrowers with repo lenders, match short-sellers with securities lenders, and fund brokerage customers’ margin borrowing with other customers’ net assets. Banks offer to take on these liabilities as part of a sales and trading relationship with institutional clients, just as they take on deposits as part of a consumer finance/wealth management relationship with
1 Kashyap, Rajan, and Stein (2008). 2 Mervyn King “Banking – from Bagehot to Basel, and back again” (October 25, 2010, http://www.bis.org/review/r101028a.pdf), Daniel Tarullo “Industry Structure and Systemic Risk Regulation” (December 4, 2012, http://www.federalreserve.gov/newsevents/speech/tarullo20121204a.htm). 3 Tarullo (2012), Tim Harford “More Equity, Less Risk” (July 2, 2011, http://www.ft.com/intl/cms/s/2/5038a3de-a1f3-11e0-b485-00144feabdc0.html#axzz2NGQa3FM1), Simon Johnson “A Very Strange Way to Assess the Safety of Banks” (September 30, 2012, http://www.bloomberg.com/news/2012-09-30/a-very-strange-way-to-assess-the-safety-of-banks.html) ; Jeremy Stein (2010, http://www.economics.harvard.edu/faculty/stein/files/brookings-2010-greenspan-comment-jcs.pdf).
13 February 2014 3

Barclays | The cost of evolving bank regulation
individuals. Each of these activities creates a matching (in a sense, “self-funding”) set of assets and liabilities, which may or may not create a positive revenue spread for a bank. More important, the overall profitability of the “asset-side” of the business is augmented by (and often centered on) the ability of banks to leverage their position as intermediaries and generate fees from related services.
This is noteworthy because, as mentioned above, it differs so markedly from the traditional division between investors and customers across most corporate sectors. In the technology industry, for example, Dell does not sell computers primarily to its bondholders, and, in autos, Ford does not sell cars primarily to its equity holders. But, in the banking sector, Wells Fargo does primarily sell credit cards, debit cards, mortgage origination, and other financial services to its depositors.
This exposes something fundamental about the business of banking. The typical schematic of a bank has depositors and other liability holders on one side and borrowers on the other (Figure 2). In this framework, a bank’s main product is credit, and liabilities of all types are relevant only as a means to fund credit provisions. Yet, in reality, banks are not just lending institutions, providing credit to arm’s-length borrowers. They sell a broad array of financial services, of which access to credit is only one – others include debit and credit cards, trust and fiduciary services, and wire services. And the people they sell these services to are their depositors. A deposit is the lead product that brings in a profitable customer relationship – in fact, the deposit base forms a bank’s primary pool of customers. As noted above, this logic applies to various broker-dealer liabilities, allowing banks to develop relationships with institutional clients that will lead to provision of (and payment for) other services. These insights suggest a different schematic for a bank, in which the list of products is longer and the feedback loop with depositors is made explicit (Figure 3).
How do deposits drive revenue in practice? Deposits are the most obvious MM-confounding liability in banking sector capital structures. Below, we detail how these liabilities relate to revenue in practice.
We identify two channels. The first is the fees earned selling non-credit financial services. Many of the services that banks sell result in fee income that is unrelated to balance sheet lending. ATM fees, debit card fees, wire services, currency conversion, and overdraft protection are just some examples. Other activities look like credit extension but are actually fee income. For example, a bank may originate a mortgage for a customer and then sell the loan to a GSE. This can be quite profitable, but does not involve any meaningful extension of bank credit. Selling non-credit financial services is critical for banks. In the next section, we analyze bank income statements and estimate that fees driven by cross-selling to depositors constitute ~35% of post-provision revenue.
FIGURE 2 The typical – but wrong – schematic for a bank
FIGURE 3 The reality – customers and depositors are the same
Source: Barclays Research Source: Barclays Research
Stock & Bond
Holders
TheBank BorrowersCreditFunding
Depositors
Financial Services
Stock & Bond
Holders
TheBank
Depositors
Funding
Funding
13 February 2014 4

Barclays | The cost of evolving bank regulation
The second channel is what we call “relationship lending.” Through its provision of financial services, a bank develops a relationship with a business or individual that facilitates better lending decisions. For example, a bank can learn about a small business from offering transaction services or payment processing. The benefits of relationship lending are harder to demonstrate empirically, but there is evidence that deposit relationships lead to better access to credit.
1) Deposits are related to a series of material fee streams Banks have ample opportunity to cross-sell other financial services to their depositors. This benefit of deposits goes beyond their being slightly cheaper than other forms of debt; it facilitates a customer relationship through which banks sell financial services. We focus on these areas. The caveat is that we are surely not capturing all synergies related to deposits – convenience yield, maturity transformation, etc. – which we believe form the essence of the business of banking. Yet the sheer magnitude of the associated revenue that we can identify and the focus that banks put on cross-selling financial products in our view demonstrate the centrality of the synergies between deposits and revenue.
A deposit account is an entry-level banking product that leads to opportunities for a bank to provide fee-generating services. 4 For example, customers who open a checking account may eventually seek a credit card, mortgage, or investment advice as they progress through various life stages. Similarly, a company’s banking needs often expand from simple operating accounts to more complex cash management, lending, and advisory services over the corporate lifecycle. As these needs arise, a customer is more likely to go to its current bank for the desired products and services. In other words, by collecting deposits, banks are positioning themselves to generate fee revenue.
This strategy is reflected in management commentary and statistics disclosed by a number of large US banks. For example, during a 4Q12 earnings call, Wells Fargo CFO Tim Sloan described the intimate connection between deposits and fee income as follows:
“[T]he way that we think about deposit growth is not just to fund our loan growth or fund investments; it's broadening the relationships and bringing new relationships into the company. And so that gives us an opportunity not only to invest and increase spread income over time, but to be able to broaden those relationships so that we can grow fee income.” – 4Q12 Earnings Call (January 11, 2013)
Similarly, US Bancorp CEO Richard Davis has highlighted fee-related streams as essential to monetizing the deposit relationship:
“We've established a relationship on a package basis where we can add attributes and/or up-sell into something more reasonable for which they know they're buying and for which they have value for.” – 4Q12 Earnings Call (January 16, 2013)
Outside the US, European banks, such as Santander UK, have highlighted the importance and profitability of monetizing core deposit customer relationships:
“1|2|3 Current Account customers have 3x higher average account balances, nearly double the number of products, significantly lower attrition and a much better risk profile than non-1|2|3 customers.” – 2013 Half Yearly Financial Report
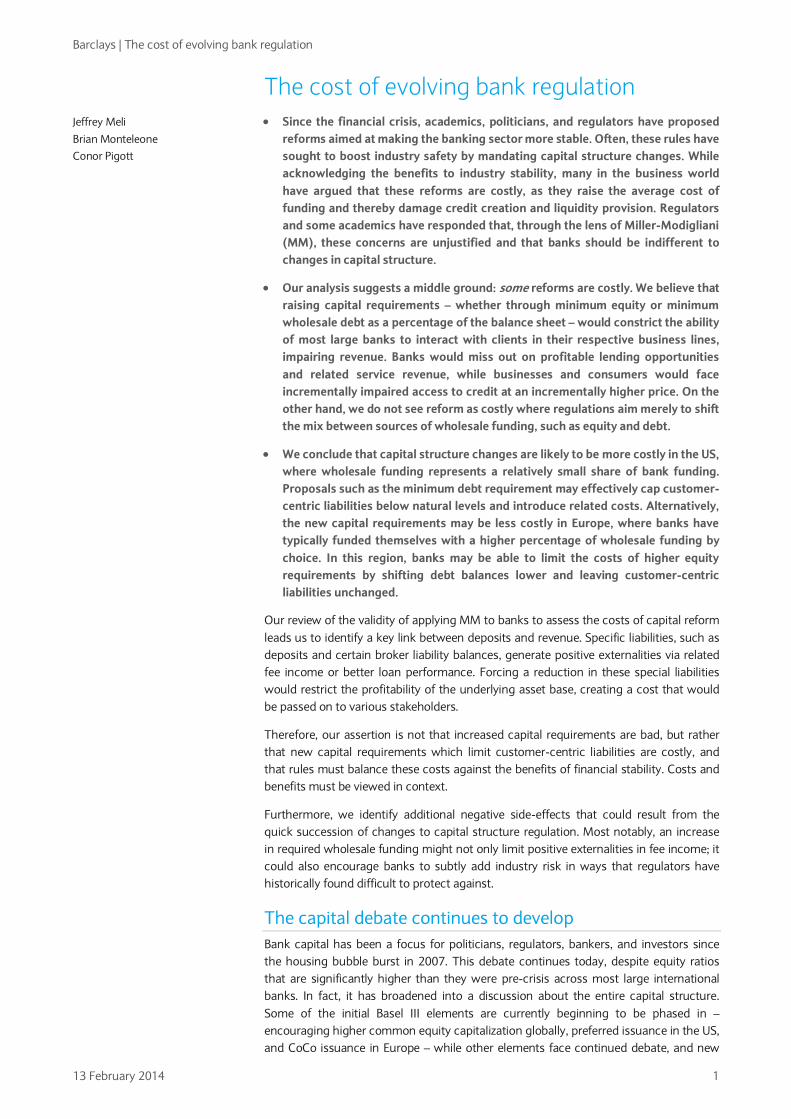
This commentary is backed by the (limited) available bank-by-bank disclosure. In 4Q12, Wells Fargo highlighted that its retail deposit product leads to the cross-sale of additional banking products (Figure 4). For example, 33% of retail households open a credit card and 21% of home-owning households obtain a mortgage from the bank.
4 Li, Sun, and Wilcox (2005).
13 February 2014 5
Barclays | The cost of evolving bank regulation FIGURE 4 Wells Fargo retail deposit households with each additional product (%)
FIGURE 5 JPMorgan product originations from branches and business clients (%)
Note: *Mortgage penetration as percentage of home-owning households. Source: Company reports, Barclays Research
Source: Company reports, Barclays Research
Likewise, in its February 2013 investor day, JPMorgan noted that cross-sell to depositors represents a significant share of overall product sales. For example, 50% of retail mortgage, 50% of Chase-branded cards, and 20% of US retail AUM are originated in the branches. This cross-sell strategy is also evident in business banking, where 65% of Chase Paymentech new sales (its merchant payment processing service) are sourced from branches.
Not only are fee streams linked to the deposit network, they are also a material portion of US banks’ overall profitability. Fees take many forms, ranging from those most directly linked to depositors (account service fees, ATM fees, overdraft protection, interchange fees, safety deposit boxes, wire transfers, corporate cash management, currency conversion, etc) to those indirectly linked to depositors (trust and fiduciary services, insurance products, credit card fees, and mortgage banking), to those arguably unconnected to depositors (trading revenue, investment banking, merchant banking, etc).
Together, the types of fee income logically linked (directly and indirectly) to the deposit base constitute a major portion of a bank’s post-provision revenue. Based on FDIC data, roughly half (47%) of US commercial banks’ total post-provision revenue over the past decade has consisted of non-interest/fee income (Figure 6). Depending on bank size, 70-80% of this fee income – or c.20-40% of total post-provision revenue – can be linked to deposit relationships to some degree.5 Note that this related revenue is before any benefit from interest expense savings or superior loan performance due to deposit funding.
Banks generally limit disclosure of the dollar value of cross-selling revenues, but data from JPMorgan confirm the trends in industry-wide data (Figure 8). Slides from its recent investor day highlighted $14bn in 2012 cross-selling revenue. We link at least $9bn of this cross-sell revenue to deposit relationships. Customers for these services are sourced from the pool of retail or corporate banking clients. Thus, the deposit base generates the profit opportunity, even though the fees are reported in the treasury services, mortgage banking, investment banking, investment management, and credit card business lines.
5 This is largely supported by the 2004 Federal Reserve Bank of Chicago paper “How do banks make money? The fallacies of fee income,” although the authors do not dive as deeply into the unidentified non-interest fees and attribute substantial value to the “forgone interest expense” that banks do not have to pay because depositors are willing to accept below-market yields on deposit balances.
33.1%
21.1%
6.0%
2.4%0.6%
0%
5%
10%
15%
20%
25%
30%
35%
Credit Card Mortgage* Personal Loans
Student Lending
Direct Auto
65%
50% 50%
20%
0%
10%
20%
30%
40%
50%
60%
70%
Chase Paymentech
New Sales from Business
Banking Clients
Retail Mortgages
Originated in Branches
Chase Credit Cards
Originated in Branches
U.S. Retail Asset Mgmt
AUM Originated in
Branches
13 February 2014 6

Barclays | The cost of evolving bank regulation
FIGURE 6 Average annual revenue breakdown, all US commercial banks, 2003-12 (%)
Source: FDIC, Barclays Research
FIGURE 7 Average annual revenue breakdown by asset size, all US commercial banks, 2003-12 (% of post-provision net revenue)
Assets # of Banks
in 2011 Credit
Income Fee
Income
Deposit Related Fees
Total Deposit Charges
Fiduciary Fees
Loan Sales* Other**
> $350bn 4 49% 51% 35% 9% 4% 1% 20% $10-350bn 85 49% 51% 41% 7% 8% 6% 21%
$1-10bn 446 63% 37% 29% 8% 4% 1% 15% < $1bn 5,561 74% 26% 21% 8% 4% 1% 9% Total 6,096 53% 47% 35% 8% 6% 3% 19%
Note: *Includes securitization revenue. **Left unidentified in call reports, but a number of large banks have further disclosed that this reflects sizeable contributions from mortgage banking, cash management, and merchant servicing fees (which we link to deposits). That said, some proportion is likely unconnected to deposit relationships. Source: FDIC, Barclays Research
FIGURE 8 Select JPMorgan cross-sell revenue items from banking relationships, 2012 ($bn)
Note: Some items may overlap. Source: Company reports, Barclays Research
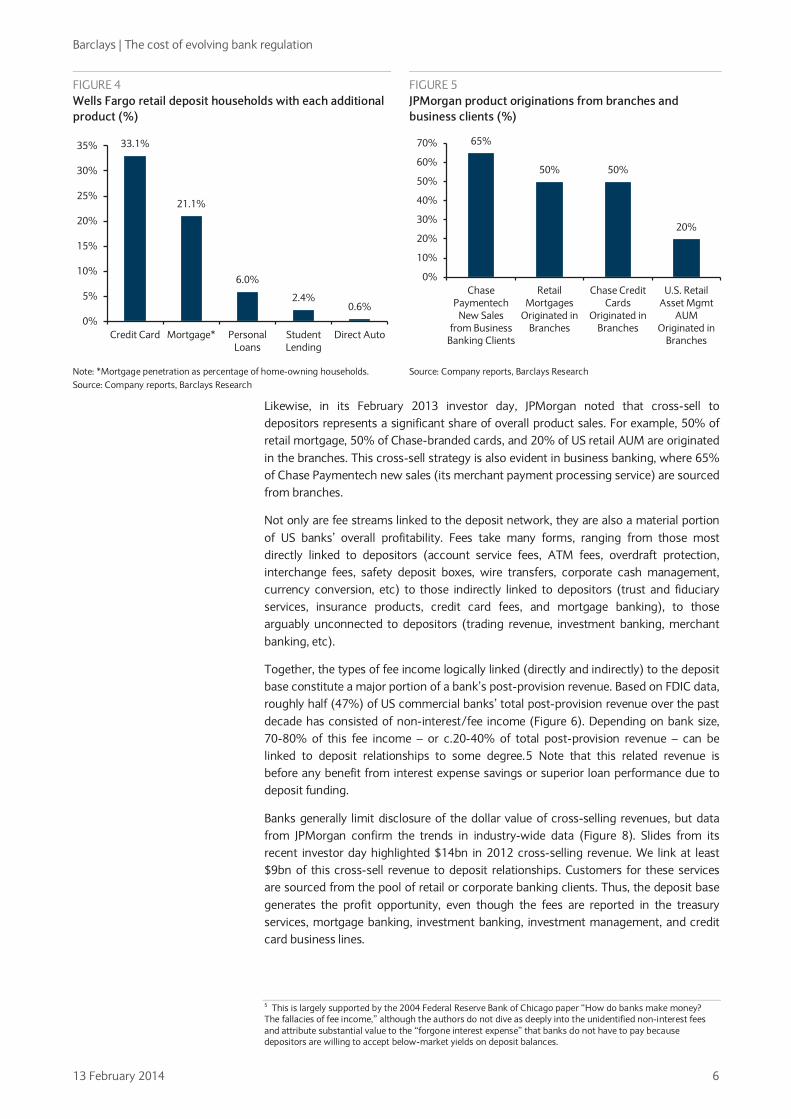
The most complete and accessible data available are for the US banking sector; however, we believe the general principles apply to developed banking sectors globally. For example, in Europe, post-provision revenue has been split roughly evenly between credit and fee income since 2007 – similar to US figures. We are unable to break down fee income by source to the same degree as in the US data, but we can determine that roughly 2/3 of European fee income is generated outside the investment bank. This creates a pool of non-investment banking fee income (as a % of total revenue) that is as least as big as that of US peers, suggesting that relationship-driven fee income may
Credit Income (Net Interest Income
less Provisions) 53%
Other Non - Interest Income 18.0%
Fiduciary Services 5.7%
Deposit Charges 7.9%
Trading 3.3%
Investment Banking 2.4%
Loan Servicing 3.4%
Securitization 3.0%
Insurance O.8% Loan Sales
1.6%
Non - Interest Income
47%
$0.2bn
$0.2bn
$0.5bn
$1.6bn
$2.4bn
$0.6bn
$1.5bn
$2.2bn
0.0 0.5 1.0 1.5 2.0 2.5 3.0
Paymentech revenue from corporate banking clients
Commercial card revenue from corporate banking clients
Investment mgmt revenue from corporate banking clients
Investment mgmt revenue from branches
Credit card revenue from originations through branches
Investment banking revenue from corporate banking clients
Mortgage originations revenue from branches
Treasury services revenue from corporate banking clients
Corporate Banking Customers Retail (Branch) Customers
13 February 2014 7
Barclays | The cost of evolving bank regulation
be similarly material. The limitations of the aggregate European data constrain our ability to draw firm conclusions here, but we do think the available data support broad similarities across geographies in terms of the importance of relationship-related fees.
2) Deposit relationships also promote the availability of credit We identify another, harder to quantify benefit of a deposit base: the opportunity to use these relationships to make more effective underwriting decisions and improve loan performance. Whereas fees derived from non-credit financial products have a clear effect on the price of credit, the evidence on relationship lending suggests it has as much to do with the availability of credit.
A borrower’s deposit accounts (ie, balances, transaction patterns, overdraft history, etc) provide useful information about credit quality. A lender can leverage this information to decide whether to lend to that customer6 and at what price. After origination, an ongoing branch/deposit relationship can allow a bank to better track performance, address issues, and drive profitability.
Unlike fees, these benefits are not visible on an income statement, so we rely on studies confirming a connection between relationships and loan performance. The literature is particularly plentiful on the corporate side, where banks’ long-term relationships with small and medium enterprises most clearly inform credit extension and structure.
• Banks source a large portion of originations from depositors: Studies have indicated that most small businesses borrow from a lender from which they obtain other financial services. For example, various analyses have found that anywhere from 64% to 72% of small business borrowers also have a deposit account with the lender.7 This is matched on the retail side by a study from Purdue University (1999) that found that 77% of retail borrowers in the sample had checking accounts with the lender.8
• Information from these relationships allows banks to extend loans that would otherwise be rejected because of a lack of information: The Purdue study referenced above also found that in a sample of individuals seeking a retail loan, having a checking account with the lender reduced the likelihood of being rejected
6 The value of relationship can be linked to less frequent credit-rationing, since the added information a bank derives from a pre-existing and ongoing monitoring relationship allows it to take advantage of profitable lending opportunities that it may otherwise have to forsake because of a lack of information (see Stiglitz and Weiss, 1981). 7 Cole (1998), Petersen and Rajan (1994). 8 Chakravaty and Scott (1999).
FIGURE 9 Data are limited outside the US, but the revenue breakdowns look similar % of Total Post-Provision Revenue
FIGURE 10 Likewise, the breakdown within fee income suggests at least as large a pool of revenue may be related to relationships % of Non-Interest Income
Note: US data reflect 2003-2012 average of all commercial bank results. European data reflect 2007-2012 average of total group results. Source: FDIC, ECB, Barclays Research
Note: European data reflect 2007-2012 average of total group results. Source: FDIC, ECB, Barclays Research
52% 53%
48% 47%
0%
10%
20%
30%
40%
50%
60%
70%
80%
90%
100%
Europe U.S.
Credit income Non-Interest Income
63%
21%
16%
0%
10%
20%
30%
40%
50%
60%
70%
80%
90%
100%
Europe
Net Fees Trading & FV of Financial Assets Other
13 February 2014 8

Barclays | The cost of evolving bank regulation
by more than half. On average, approved borrowers had 70% longer relationships with their lender than rejected borrowers and 80% more product relationships. Similarly, a 1998 study found that in a sample of small businesses seeking credit, 47.5% of those without a bank relationship were rejected, compared with only a 14.5% rejection rate across the sample.9 The importance of relationship variables remained significant in both studies after accounting for age and credit quality.
These results demonstrate that pre-existing accounts generate sufficient information to meaningfully change loan acceptance rates between otherwise identical applicants. Deposit relationships – and the information they generate – help unblock the frictions created by a lender’s limited knowledge of a borrower’s creditworthiness. This allows borrowers greater access to credit and provides banks with a greater number of presumably profitable lending opportunities.
• Banks extend lending more quickly to customers with whom they have relationships, especially longer and broader relationships. A wide range of studies has found evidence that banks extend credit more easily to firms with which they have a relationship.10 For example, studies from the University of Chicago (1994) and Northwestern University (1999) show that a small firm’s credit constraints diminish twice as fast when it is building stronger bank relationships (measured by duration or breadth of products)11 – a finding reflected in studies on small business lines of credit12 and consumer lending access.13
As above, these results support the conclusion that relationship information reduces frictions in the lending process, allowing profitable lending that might otherwise have been inhibited by information asymmetry.
• Relationship lending can increase loan profitability: Data on the profitability effects of relationship lending are limited but favorable. For example, a 2009 study on US credit card lending found that the relationship-based credit card accounts in the sample had a 10% lower default probability, 12% lower attrition probability, and a 700bp higher utilization rate.14 Some studies have found evidence that banks do not reduce interest rates even as they expand credit, potentially benefiting from exclusive insight into a borrower’s creditworthiness. 15 More broadly, the benefits of relationship-based information (fewer bad loans, more line utilization) are likely passed on to qualified borrowers (improved credit availability, lower rates).
Broker-dealer liabilities often serve a similar purpose Deposits are not the only liabilities that can provide positive revenue feedback. Nearly 50% of the typical broker-dealer balance sheet is made up of matching liabilities and assets that arise in parallel as part of a specific business or type of customer activity. Similar to deposits, these liabilities are linked to a particular set of assets and augment the revenue-generating activity of the firm. They have four major sources:
• Matched-book repo and securities lending. A broker-dealer lends to one counterparty against generally high-quality collateral, then uses this collateral to secure a similar amount and duration of lending from another counterparty. Repurchase agreements (repo) are the liabilities associated with this business, paired with reverse repos on the asset side. Brokers make a (very) small spread on their matched repo business (measured in basis points), which can add up to meaningful profitability, depending on the size of the book. In addition,
9 Cole (1998). 10 Cole (1998), Petersen (1999), Chakravaty and Scott (1999), Petersen and Rajan (1994), Berger and Udell (1994). 11 Petersen and Rajan (1994), Petersen (1999). 12 Berger and Udell (1994). 13 Chakravaty and Scott (1999). 14 Agarwal, Chomsisengphet, Liu, and Souleles (2009). 15 Petersen and Rajan (1994), although Berger and Udell (1994) and Chakravaty and Scott (1999) offer an alternative interpretation.
13 February 2014 9

Barclays | The cost of evolving bank regulation
providing repo financing can be a key component of a broader relationship with an institutional customer, similar to offering revolving lines of credit to corporate borrowers.
• Short-selling. Brokers execute short sales as part of their market-making business. A short sale itself generates a liability: the obligation to buy the security (“Securities Sold, Not Yet Purchased”). The asset is typically a reverse repo or “Securities Borrowed” asset via which the broker sources the collateral sold short.16 In other words, selling a security short is self-financing. It generates a liability (to return the security) and cash, but the cash is used in the reverse repo to obtain the collateral to short.
• Customer accounts. These arise mainly via prime brokerage businesses. The liabilities, customer payables, are individual net cash balances in client margin accounts. The broker’s liability balance can reflect the proceeds from short sales executed for the client, in which case the matching assets are Securities Borrowed. Alternatively, the cash is effectively money on deposit with the prime brokerage business. Regulations generally prohibit banks from using this as a source of own-asset funding; instead, it is used to fund margin loans to other clients or remains as cash segregated in restricted accounts. By allowing customers to leave net cash balances in accounts, banks are able to more successfully offer wealth and brokerage services.
• Re-hypothecation. Brokers engage in securities for securities repo, typically to satisfy short-term needs for specific collateral. This is driven by the trading or securities financing businesses (ie, to cover a short). In certain cases, the obligation to return the collateral shows up on the balance sheet as a liability, with the security itself as the corresponding asset. This typically happens when the securities are re-pledged.
Figure 11 lists the estimated sizes of these matching assets and liabilities on the YE2012 Merrill Lynch balance sheet. We use Merrill Lynch to represent the investment banking portion of a moneycenter bank because – uniquely for the space – it continued to file separate 10-Ks and 10-Qs despite being part of a larger banking conglomerate until late 2013. In aggregate, we believe the scale of its matching assets and liabilities are similar to those of other large brokers, such as Morgan Stanley and Goldman Sachs, though the size of individual lines can vary considerably by business.
FIGURE 11 Matching assets and liabilities comprise a large portion of the broker balance sheet: Broker-dealer activities and estimated portion of Merrill Lynch balance sheet (2012, %)
Liabilities Assets Est. % of Merrill Lynch
2012 Balance Sheet
Matched-Book Securities Financing
Repo Reverse Repo ~20%
Securities Loaned Securities Borrowed
Short-Selling and Covering
Securities Sold, Not Yet Purchased
Reverse Repo ~15%
Securities Borrowed
Customer Accounts
Customer Payables
Customer Receivables
~8% Securities Borrowed
Restricted Cash
Collateral Brought on Balance Sheet through Re-hypothecation
Obligation to Return Securities Received as Collateral
Securities Received as Collateral ~3%
Source: Company reports, Barclays Research
16 These can also be driven by proprietary trading groups within a broker, although that activity has been largely curtailed by the Volker Rule provision in Dodd-Frank.
13 February 2014 10

Barclays | The cost of evolving bank regulation
In some cases, these liabilities cannot, by definition, be replaced with wholesale debt or equity. For example, customer payables arise naturally in a prime brokerage business whenever customers have a net positive cash balance in certain accounts. The offsetting assets also arise naturally as other customers buy on margin. Payables cannot be “replaced” with any other form of liability. Similarly, the liabilities associated with selling short (Securities Sold, Not Yet Purchased) are incurred as a matter of course – there is no straightforward way to avoid or restructure this liability.
In other cases, such as matched repo, the form of the liability is necessary to maintain the viability of the associated business. Reverse repo – effectively collateralized lending – would not be viable if financed by issuing wholesale debt. Most collateralized lending is overnight and done at the GC rate (or less if the collateral is special). At any credit spread, financing reverse repo with wholesale debt would generate a drag far in excess of the margin banks charge. The only way the business makes sense is if the collateral in “collateralized lending” is financed via repo. In other words, matched repo needs to be just that – matched. The asset and liability sides are viable only when done jointly.
Whatever the reason, the common feature of each of these liabilities is that the liability structure is an inherent component of the associated business. They cannot be replaced with wholesale debt or equity without disrupting that business. Although the specifics are quite different than for deposits, the basic implications are the same: these liabilities need to exist in specific forms or the underlying businesses cannot operate.
Summing up how MM fits – and doesn’t fit – banks Given the linkages we have identified between liabilities and revenue streams, we can revisit the usefulness of applying the MM theory of capital structure equivalence to the banking sector.
Clearly, if choosing to fund via one set of liabilities over another begets additional fee income, then the two sets of liabilities are not equally attractive. This is the case for deposits and the other special, customer-centric liabilities outlined above. By accepting these types of liabilities, banks can earn revenue to which they would otherwise not have the same access. This in itself indicates that one must be cautious about using MM to justify mandating changes to the capital structure; mandated capital reform can be costly.
More specifically, regulations will introduce costs if they mandate banks to shift more of their funding out of liabilities with positive externalities (additional fee income, better loan performance, etc), such as deposits and certain broker-liabilities, and into liabilities without these positive externalities, such as wholesale debt and equity.
Through this lens, certain proposals, such as the minimum holding company debt requirement, would necessarily generate a cost. To the extent that such rules have impact and require banks to use more wholesale funding and less customer-centric funding than they would naturally, then the rules would also reduce the additional revenue associated with customer-centric funding.
That said, as with all capital requirements, the cost of mandating minimum levels of debt and equity must be weighed against the positive of greater financial sector stability. Therefore, our assertion is not that increased capital requirements are bad, but rather that new capital requirements which limit customer-centric liabilities are costly, and that rules must balance these costs against the safety and soundness benefits.
Also, just as important as what does not fit is what does fit under MM. We do not believe that wholesale debt and equity generate any special, positive revenue externalities. Therefore, MM appears to work very well in explaining their relative equivalence. Banks should, in theory, be indifferent to shifts in the mix between these sources of funding. For example, increasing equity at the expense of reducing wholesale debt should not introduce costs. The cost of debt should fall to reflect its lower risk. While equity returns would fall, so too will the required return on equity given that it would represent a less leveraged exposure to underlying cash flows.
13 February 2014 11

Barclays | The cost of evolving bank regulation
A framework for assessing the costs of capital reform Now that we have a lens through which to examine changing capital structures, we can use that framework to assess the potential costs associated with some of the specific proposals that have been made or implemented. Most of the proposals to strengthen the stability of the financial system rely on increasing either equity ratios or long-term debt. Higher equity ratios would reduce the likelihood of bank failures and increased wholesale debt may decrease their systemic impact, but we identify a series of negative consequences that may also result from the proposed reforms. In summary, we believe replacing customer-sourced liabilities with wholesale ones impairs credit creation for both retail and institutional clients, while also potentially introducing system-wide risks.
Retail and business clients: Increased cost and impaired access to credit A key implication of our analysis is that higher equity requirements would mean a reduction in deposits (as a percentage of assets), and thereby both increase the cost of credit and reduce its availability. In a competitive banking landscape, banks must adjust the pricing of their products – both credit and non-credit financial services – to attract customers. The economic value generated by selling non-credit financial services subsidizes lending. Banks need to invest their customer deposits, and the expected returns they require of that lending are lower in the presence of substantial fee income.
At the extreme, an all-equity bank would not have the same defined customer base that a deposit-funded bank uses to issue debit cards, originate mortgages, and market other financial services. Without those fees, the bank would need to earn more interest income – meaning a higher cost of credit – to generate a commensurate return on assets. Relationship lending strengthens the point. An all-equity bank would have no depositors about which it can learn and, thus, make informed credit decisions. There is clear evidence that arm’s-length borrowers have a harder time getting credit.
In sum, banks would miss out on profitable lending opportunities and related service revenue, while businesses and consumers would face incrementally impaired access to credit at an incrementally higher price. More broadly, banks forced to become more selective deposit-takers would likely choose to reduce/refuse those deposits least likely to produce additional sources of revenue and potentially push a portion of lower-income account holders out of the traditional banking system.
Capital markets clients: Attack on repo Deposits are not the only customer-centric liability on a bank’s balance sheet, and broker-dealer activities also appear vulnerable to capital structure reform. As a result, we would expect broker-dealer clients to face reduced liquidity and potentially higher cost capital markets services. As outlined above, client execution and service can generate assets and liabilities on bank balance sheets. As balance sheet capacity becomes increasingly constrained, even for very low-risk activities, banks are likely to charge for this newly scarce resource and, in turn, services that show up on balance sheet would become more expensive. For example, maintaining net credit balances, short-selling, and collateral transformation – relatively low-risk activities for banks that will likely face increasing return thresholds – would become incrementally more expensive for clients.
This is perhaps most evident in matched book repo. The net spread from matched repo borrowing from money market funds and lending to capital markets borrowers generates a small return on assets (ROA), commensurate with high-quality >100% secured and daily margined borrowing. Banks will likely face pressure to downsize these matched books as equity requirements rise to meet sticky equity return targets. Repo borrowers will face impaired access to secured credit, repo lenders (ie, money market investors) will receive reduced remuneration on invested capital, and both will likely increasingly turn non-regulated intermediaries. More broadly, this friction would likely decrease banks’ willingness to intermediate in fixed income markets, decreasing liquidity and incrementally increasing rates.
13 February 2014 12

Barclays | The cost of evolving bank regulation
Potentially increased banking sector risk: Incremental funding would be directed not to lending, but to other, high-risk, asset classes We believe that requirements to increase wholesale financing (debt or equity) as a percent of total liabilities would likely generate a matching increase in assets typically funded by wholesale financing, namely trading securities. More specifically, banks would likely seek to increase holdings of lower quality trading assets in their broker dealer, such as corporate securities, that are not generally funded with repo.
Importantly, we would not expect banks to use the proceeds from increased wholesale debt or equity to make loans in the current environment; that is not how those funds are used now across a wide range of banking entities, and we see no reason why that would change. From an empirical perspective, unsecured debt issuance simply cannot be traced to loan growth. With current loan-to-deposit ratios in the US well below 100%, we do not see how additional wholesale debt or equity would be deployed as loans, as opposed to more natural use in the securities business.
FIGURE 12 US banking sector loan-to-deposit ratio
Source: FDIC, Barclays Research
When banks source a greater portion of their liabilities from non-deposit sources, their asset concentration in loans declines (Figure 13). In other words, banks with more non-deposit funding do not direct this funding toward loans, but rather to other asset classes. As Figure 14 shows, the largest banks with a greater portion of debt funding also have a greater asset concentration in trading securities. In practice, debt is linked to the trading book, not the loan book.
FIGURE 13 Loans % assets increases as deposits % liabilities rise, 25 US bank aggregate (plus GS & MS), 2Q13
FIGURE 14 Trading securities % assets increase as debt % liabilities rise, 8 US SIFIs, 1Q13
Source: SNL, Barclays Research Includes BAC, BK, C, GS, JPM, MS, STT, and WFC. Source: SNL, Barclays Research
0%
20%
40%
60%
80%
100%
120%
1935 1945 1955 1965 1975 1985 1995 2005
0%10%20%30%40%50%60%70%80%90%
10% 30% 50% 70% 90%
Loans % Assets
Deposits % Liabilities
0%5%
10%15%20%25%30%35%40%45%
0% 5% 10% 15% 20% 25% 30%
Trading Sec. % Assets
Debt % Liabilities
13 February 2014 13
Barclays | The cost of evolving bank regulation
If we are correct, these asset changes from higher equity or wholesale debt requirements would raise the stakes of regulatory supervision. If banks respond to higher debt and/or equity requirements by increasing their ownership of lower quality securities, the asset portfolio would become riskier. In turn, the importance of regulatory supervision and accurate risk-weightings would rise. The incentive for banks to own securities that are “efficient” in an RWA context (ie, a combination of high yield and low RWAs) rises as banks are forced to raise more wholesale financing. We think a shift of this magnitude could affect regulators’ ability to monitor and assess evolving risks on the balance sheet.
Does more equity and/or wholesale debt really mean fewer deposits and other customer-sourced liabilities? Our analysis outlines the linkage between depositors and revenue, and the potential costs of breaking this linkage. Would capital regulations truly break this relationship? Would a mandate to hold incremental higher wholesale debt and equity necessarily imply lower deposits and other customer-sourced liabilities?
For the vast majority of banks in the US, we believe the answer is simple: yes. After considering capital requirements and liquidity needs, deposits represent essentially all remaining liabilities at all but the very largest US banks. This indicates that higher equity or wholesale debt requirements would force a reduction in the proportion of deposits, thereby generating the costs we outline above, for most of the sector.
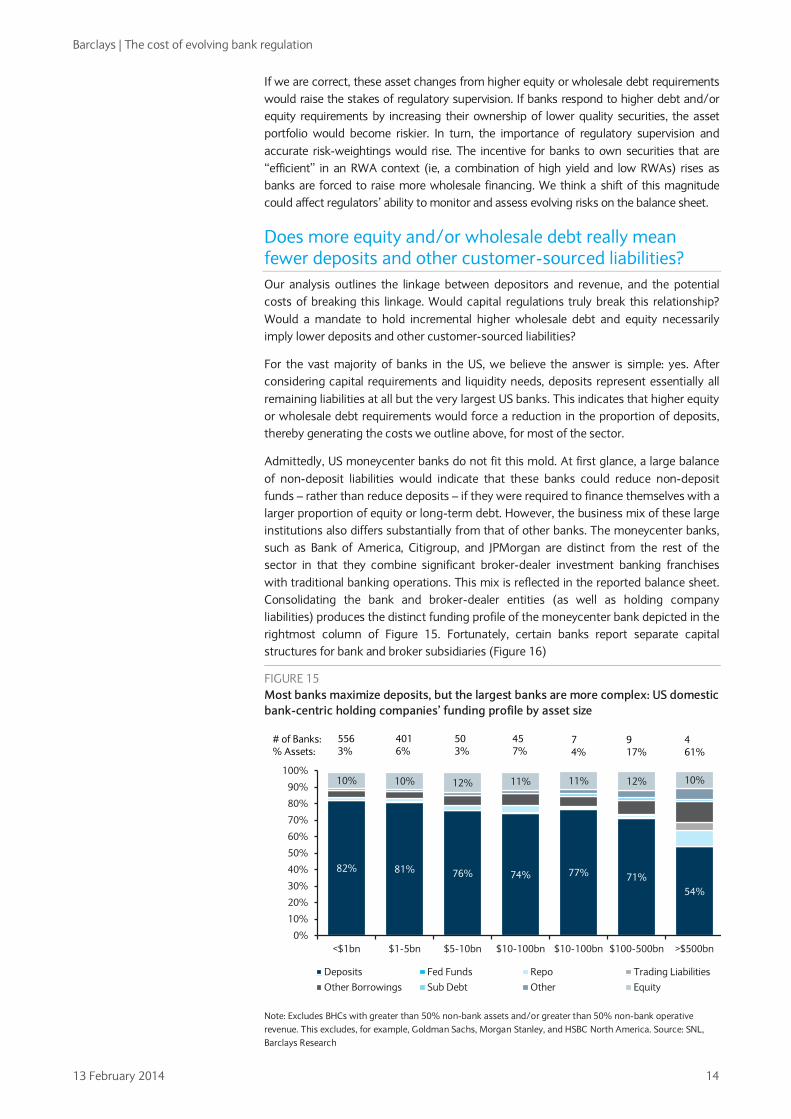
Admittedly, US moneycenter banks do not fit this mold. At first glance, a large balance of non-deposit liabilities would indicate that these banks could reduce non-deposit funds – rather than reduce deposits – if they were required to finance themselves with a larger proportion of equity or long-term debt. However, the business mix of these large institutions also differs substantially from that of other banks. The moneycenter banks, such as Bank of America, Citigroup, and JPMorgan are distinct from the rest of the sector in that they combine significant broker-dealer investment banking franchises with traditional banking operations. This mix is reflected in the reported balance sheet. Consolidating the bank and broker-dealer entities (as well as holding company liabilities) produces the distinct funding profile of the moneycenter bank depicted in the rightmost column of Figure 15. Fortunately, certain banks report separate capital structures for bank and broker subsidiaries (Figure 16)
FIGURE 15 Most banks maximize deposits, but the largest banks are more complex: US domestic bank-centric holding companies’ funding profile by asset size
Note: Excludes BHCs with greater than 50% non-bank assets and/or greater than 50% non-bank operative revenue. This excludes, for example, Goldman Sachs, Morgan Stanley, and HSBC North America. Source: SNL, Barclays Research
82% 81% 76% 74% 77% 71%54%
10% 10% 12% 11% 11% 12% 10%
0%
10%
20%
30%
40%
50%
60%
70%
80%
90%
100%
<$1bn $1-5bn $5-10bn $10-100bn $10-100bn $100-500bn >$500bn
Deposits Fed Funds Repo Trading LiabilitiesOther Borrowings Sub Debt Other Equity
# of Banks:% Assets:
5563%
4016%
503%
457%
74%
917%
461%
13 February 2014 14
Barclays | The cost of evolving bank regulation
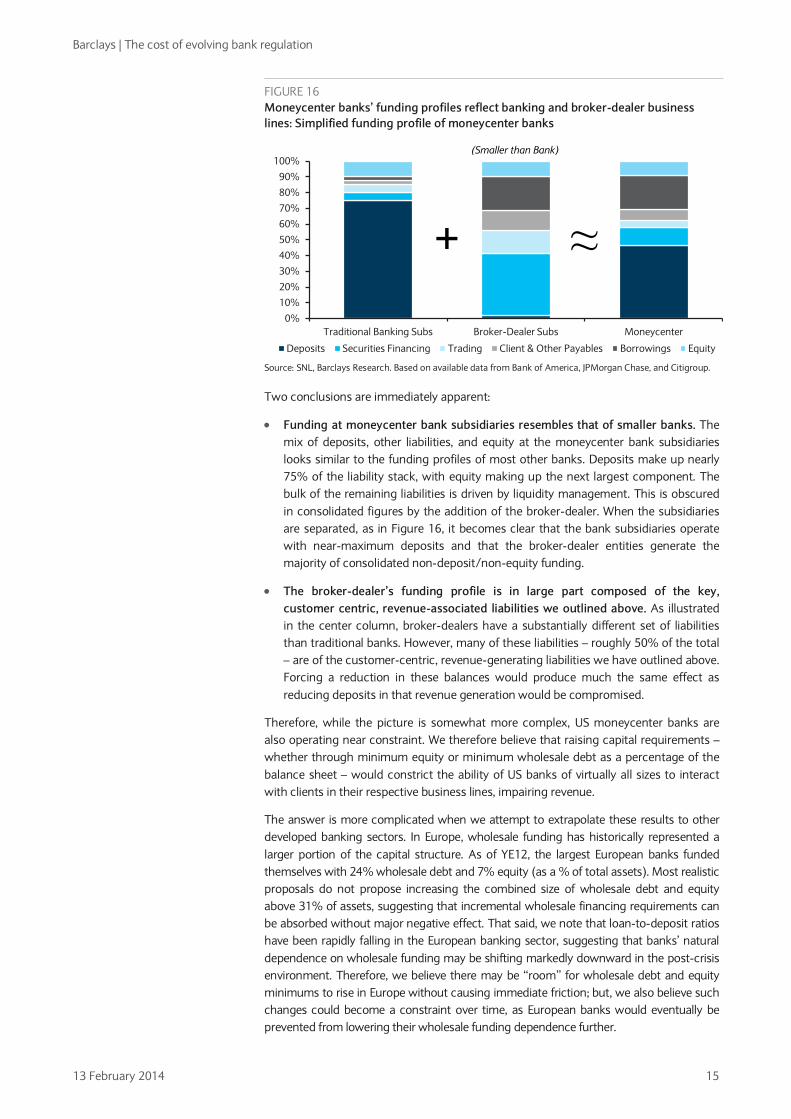
FIGURE 16 Moneycenter banks’ funding profiles reflect banking and broker-dealer business lines: Simplified funding profile of moneycenter banks
Source: SNL, Barclays Research. Based on available data from Bank of America, JPMorgan Chase, and Citigroup.
Two conclusions are immediately apparent:
• Funding at moneycenter bank subsidiaries resembles that of smaller banks. The mix of deposits, other liabilities, and equity at the moneycenter bank subsidiaries looks similar to the funding profiles of most other banks. Deposits make up nearly 75% of the liability stack, with equity making up the next largest component. The bulk of the remaining liabilities is driven by liquidity management. This is obscured in consolidated figures by the addition of the broker-dealer. When the subsidiaries are separated, as in Figure 16, it becomes clear that the bank subsidiaries operate with near-maximum deposits and that the broker-dealer entities generate the majority of consolidated non-deposit/non-equity funding.
• The broker-dealer’s funding profile is in large part composed of the key, customer centric, revenue-associated liabilities we outlined above. As illustrated in the center column, broker-dealers have a substantially different set of liabilities than traditional banks. However, many of these liabilities – roughly 50% of the total – are of the customer-centric, revenue-generating liabilities we have outlined above. Forcing a reduction in these balances would produce much the same effect as reducing deposits in that revenue generation would be compromised.
Therefore, while the picture is somewhat more complex, US moneycenter banks are also operating near constraint. We therefore believe that raising capital requirements – whether through minimum equity or minimum wholesale debt as a percentage of the balance sheet – would constrict the ability of US banks of virtually all sizes to interact with clients in their respective business lines, impairing revenue.
The answer is more complicated when we attempt to extrapolate these results to other developed banking sectors. In Europe, wholesale funding has historically represented a larger portion of the capital structure. As of YE12, the largest European banks funded themselves with 24% wholesale debt and 7% equity (as a % of total assets). Most realistic proposals do not propose increasing the combined size of wholesale debt and equity above 31% of assets, suggesting that incremental wholesale financing requirements can be absorbed without major negative effect. That said, we note that loan-to-deposit ratios have been rapidly falling in the European banking sector, suggesting that banks’ natural dependence on wholesale funding may be shifting markedly downward in the post-crisis environment. Therefore, we believe there may be “room” for wholesale debt and equity minimums to rise in Europe without causing immediate friction; but, we also believe such changes could become a constraint over time, as European banks would eventually be prevented from lowering their wholesale funding dependence further.
0%
10%
20%
30%
40%
50%
60%
70%
80%
90%
100%
Traditional Banking Subs Broker-Dealer Subs Moneycenter
Deposits Securities Financing Trading Client & Other Payables Borrowings Equity
+ ≈
(Smaller than Bank)
13 February 2014 15

Barclays | The cost of evolving bank regulation
Banks link specific assets to specific liabilities Our analysis identifies a natural correspondence between certain assets and certain liabilities. For example, deposits functionally support lending. It turns out that many types of broker-dealer liabilities also arise in a specific relationship with corresponding assets. Customer payables provide funding for customer receivables; repo borrowing matches repo lending; short-positioning is linked to securities borrowed, etc.
This intuition can be expanded to banks and brokers more generally: a bank’s asset and liability structures match. A certain set of assets is generally funded by a certain set of liabilities. Just as this asset-liability relationship was evident in the broker-dealer analysis above, it is also visible in the consolidated asset and liability profiles of the largest US banks. In Figures 16 and 17, we include three of the six largest US banks: Wells Fargo, (traditional banking); Citigroup (a traditional retail and commercial bank combined with a large investment bank); and Goldman Sachs (investment banking).
FIGURE 19 Asset profile comparison (2012, % of total assets)
Source: Company reports, Barclays Research
0%
10%
20%
30%
40%
50%
60%
70%
80%
90%
100%
Wells Fargo Citigroup Inc. Goldman Sachs
Cash Securities (AFS & HTM) Net Loans Reverse Repo Trading Assets Other
7%
75%
31%
51%
8%
75%
FIGURE 17 Wholesale funding has historically represented a larger portion of European capital structures… Wholesale Debt & Equity % Total Assets, YE12
FIGURE 18 …but rapidly decreasing loan-to-deposit ratios suggest that natural dependence on wholesale funding is declining Loan-to-Deposit Ratio, European Banking Sector
Source: Company reports, SNL, ECB, Barclays Research Source: Company reports, SNL, EBF, Barclays Research
26%
14%
7%
10%
0%
5%
10%
15%
20%
25%
30%
35%
Large European Banks Large U.S. Banks
Wholesale Debt Equity105%
110%
115%
120%
125%
130%
135%
140%
2002 2004 2006 2008 2010 2012
13 February 2014 16
Barclays | The cost of evolving bank regulation
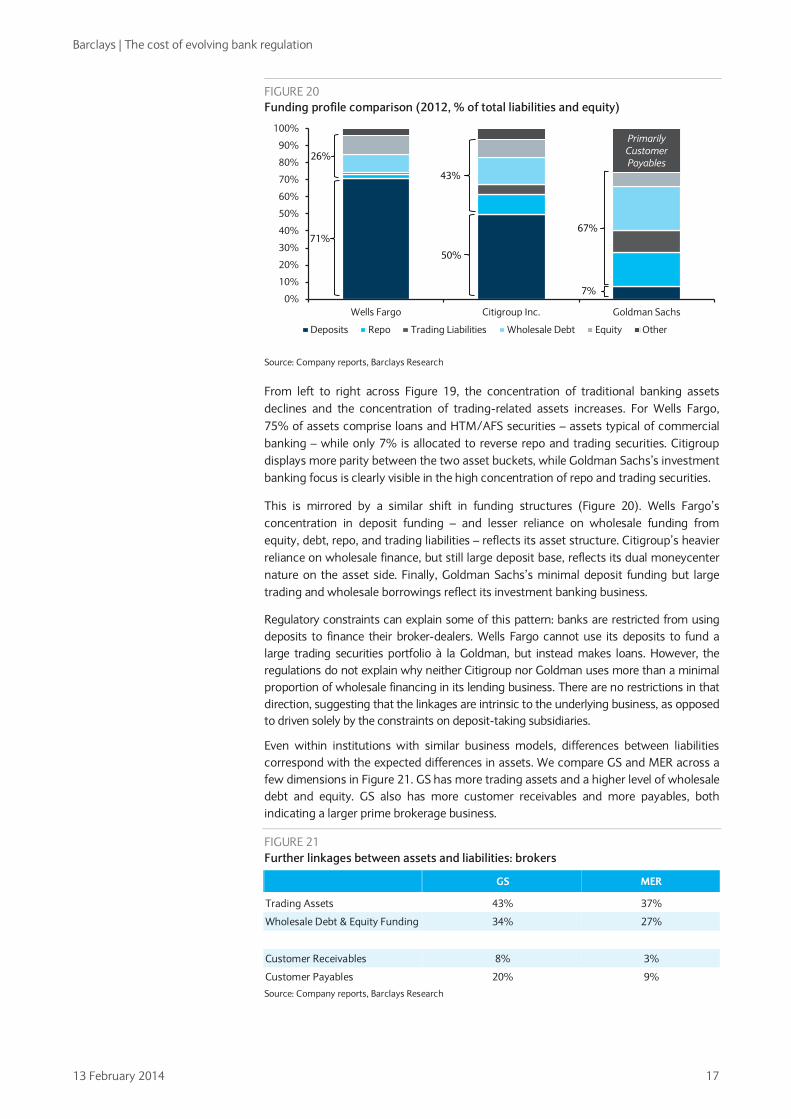
FIGURE 20 Funding profile comparison (2012, % of total liabilities and equity)
Source: Company reports, Barclays Research
From left to right across Figure 19, the concentration of traditional banking assets declines and the concentration of trading-related assets increases. For Wells Fargo, 75% of assets comprise loans and HTM/AFS securities – assets typical of commercial banking – while only 7% is allocated to reverse repo and trading securities. Citigroup displays more parity between the two asset buckets, while Goldman Sachs’s investment banking focus is clearly visible in the high concentration of repo and trading securities.
This is mirrored by a similar shift in funding structures (Figure 20). Wells Fargo’s concentration in deposit funding – and lesser reliance on wholesale funding from equity, debt, repo, and trading liabilities – reflects its asset structure. Citigroup’s heavier reliance on wholesale finance, but still large deposit base, reflects its dual moneycenter nature on the asset side. Finally, Goldman Sachs’s minimal deposit funding but large trading and wholesale borrowings reflect its investment banking business.
Regulatory constraints can explain some of this pattern: banks are restricted from using deposits to finance their broker-dealers. Wells Fargo cannot use its deposits to fund a large trading securities portfolio à la Goldman, but instead makes loans. However, the regulations do not explain why neither Citigroup nor Goldman uses more than a minimal proportion of wholesale financing in its lending business. There are no restrictions in that direction, suggesting that the linkages are intrinsic to the underlying business, as opposed to driven solely by the constraints on deposit-taking subsidiaries.
Even within institutions with similar business models, differences between liabilities correspond with the expected differences in assets. We compare GS and MER across a few dimensions in Figure 21. GS has more trading assets and a higher level of wholesale debt and equity. GS also has more customer receivables and more payables, both indicating a larger prime brokerage business.
FIGURE 21 Further linkages between assets and liabilities: brokers
GS MER
Trading Assets 43% 37%
Wholesale Debt & Equity Funding 34% 27%
Customer Receivables 8% 3%
Customer Payables 20% 9%
Source: Company reports, Barclays Research
Primarily Customer Payables
0%
10%
20%
30%
40%
50%
60%
70%
80%
90%
100%
Wells Fargo Citigroup Inc. Goldman Sachs
Deposits Repo Trading Liabilities Wholesale Debt Equity Other
26%
71%
43%
50%
7%
67%
13 February 2014 17

Barclays | The cost of evolving bank regulation
In this view of banking, each type of liability has an associated asset and business line (Figure 22). An important implication is that the flaws in applying Miller-Modigliani to banks extend beyond deposits. In our view, the entire return profile of the business of banking hinges on the ability to exploit the natural linkages between specific assets and liabilities. An understanding of these linkages and the reaction function of banks to changes in their capital structures is the key to understanding the costs or implications of the many proposals to strengthen the stability of the financial system.
FIGURE 22 Natural equivalence between bank assets and liabilities
Liabilities Assets
Traditional Banking
Deposits Loans
Very Liquid Securities
Matched-Book Securities Financing
Repo Reverse Repo
Securities Loaned Securities Borrowed
Prime Brokerage
Customer Payables
Customer Receivables
Securities Borrowed
Restricted Cash
Market Making
Trading Assets
Repo
Wholesale Debt
Equity
Source: Company reports, Barclays Research
Conclusions There are two competing viewpoints on the likely effect of proposed capital structure changes aimed at making the global banking sector more stable. Some argue that such reforms (ie, higher equity) are costly; others, applying MM, argue that these concerns are unjustified. Having reviewed the validity of applying MM to banks to determine the potential costs of capital reform, we conclude that some, but not all, types of capital reform may be costly.
Certain classes of liabilities appear to fit well in the MM system. For example, wholesale equity and debt are issued to third-party investors who make standard risk-reward assessments when choosing what to invest in. We can find no obvious positive revenue externalities associated with these liabilities; thus, banks should be relatively indifferent to shifting funding balances between these sources. However, where specific liabilities, such as deposits and certain broker liabilities, generate positive externalities (such as related fee income or better loan performance) they then violate the assumptions behind MM. Clearly, if choosing to fund via one set of liabilities over another begets additional fee income, then the two sets of liabilities are not equally attractive. Forcing a reduction in these special liabilities would restrict the profitability of the underlying asset base, creating a cost that would be passed on to various stakeholders.
Therefore, we conclude that capital reform can be costly if and when it forces banks to decrease customer-centric liabilities with positive externalities, such as deposits and certain broker-dealer liabilities. The costs of reform would be visible in impaired access to credit for borrowers, a higher cost of credit, and reduced market liquidity, as banks deploy customer-centric liabilities in these businesses. Alternatively, we do not see reform as costly where regulations merely shift the mix between sources of wholesale funding without these externalities, such as equity and debt.
13 February 2014 18

Barclays | The cost of evolving bank regulation
Our analysis suggests that capital requirements are mostly likely to be costly in the US, where wholesale funding represents a relatively small share of bank funding. In the US, proposals such as the minimum debt requirement may effectively cap customer-centric liabilities below natural levels and introduce related costs. Alternatively, the capital requirements may be less costly in Europe, where banks have typically funded themselves with a higher percentage of wholesale funding by choice. In this region, banks may be able to limit the costs of higher equity requirements by shifting debt balances lower and leaving customer-centric liabilities unchanged.
Furthermore, we have identified additional negative side-effects that may result from the quick succession of changes to capital structure regulation. Most notably, an increase in required wholesale funding may not only limit positive externalities in fee income; it may also encourage banks to subtly add industry risk in ways that regulators have historically found difficult to protect against. Nevertheless, our assertion is not that all capital requirements are bad, but rather that mandated capital structure reform can have costs and that these costs must be balanced against the benefits of financial stability.
Looking ahead, regulatory issues will remain center stage for banks, as well as their investors and clients. We believe the process of continuous, material regulatory change is set to continue for the foreseeable future.
13 February 2014 19

Analyst Certification We, Jeffrey Meli, Brian Monteleone and Conor Pigott, hereby certify (1) that the views expressed in this research report accurately reflect our personal views about any or all of the subject securities or issuers referred to in this research report and (2) no part of our compensation was, is or will be directly or indirectly related to the specific recommendations or views expressed in this research report. Each research report excerpted herein was certified under Reg AC by the analyst primarily responsible for such report as follows: I hereby certify that: 1) the views expressed in this research report accurately reflect my personal views about any or all of the subject securities referred to in this report and; 2) no part of my compensation was, is or will be directly or indirectly related to the specific recommendations or views expressed in this report. Important Disclosures: Barclays Research is a part of the Corporate and Investment Banking division of Barclays Bank PLC and its affiliates (collectively and each individually, "Barclays"). For current important disclosures regarding companies that are the subject of this research report, please send a written request to: Barclays Research Compliance, 745 Seventh Avenue, 14th Floor, New York, NY 10019 or refer to http://publicresearch.barclays.com or call 212-526-1072. Barclays Capital Inc. and/or one of its affiliates does and seeks to do business with companies covered in its research reports. As a result, investors should be aware that Barclays may have a conflict of interest that could affect the objectivity of this report. Barclays Capital Inc. and/or one of its affiliates regularly trades, generally deals as principal and generally provides liquidity (as market maker or otherwise) in the debt securities that are the subject of this research report (and related derivatives thereof). Barclays trading desks may have either a long and / or short position in such securities, other financial instruments and / or derivatives, which may pose a conflict with the interests of investing customers. Where permitted and subject to appropriate information barrier restrictions, Barclays fixed income research analysts regularly interact with its trading desk personnel regarding current market conditions and prices. Barclays fixed income research analysts receive compensation based on various factors including, but not limited to, the quality of their work, the overall performance of the firm (including the profitability of the investment banking department), the profitability and revenues of the Fixed Income, Currencies and Commodities Division and the potential interest of the firm’s investing clients in research with respect to the asset class covered by the analyst. To the extent that any historical pricing information was obtained from Barclays trading desks, the firm makes no representation that it is accurate or complete. All levels, prices and spreads are historical and do not represent current market levels, prices or spreads, some or all of which may have changed since the publication of this document. Barclays produces various types of research including, but not limited to, fundamental analysis, equity-linked analysis, quantitative analysis, and trade ideas. Recommendations contained in one type of research may differ from recommendations contained in other types of research, whether as a result of differing time horizons, methodologies, or otherwise. Unless otherwise indicated, Barclays trade ideas are provided as of the date of this report and are subject to change without notice due to changes in prices. In order to access Barclays Statement regarding Research Dissemination Policies and Procedures, please refer to https://live.barcap.com/publiccp/RSR/nyfipubs/disclaimer/disclaimer-research-dissemination.html. In order to access Barclays Research Conflict Management Policy Statement, please refer to: http://group.barclays.com/corporates-and-institutions/research/research-policy. The MSCI sourced information is the exclusive property of MSCI Inc. (MSCI). Without prior written permission of MSCI, this information and any other MSCI intellectual property may not be reproduced, redisseminated or used to create any financial products, including any indices. This information is provided on an “as is” basis. The user assumes the entire risk of any use made of this information. MSCI, its affiliates and any third party involved in, or related to, computing or compiling the information hereby expressly disclaim all warranties of originality, accuracy, completeness, merchantability or fitness for a particular purpose with respect to any of this information. Without limiting any of the foregoing, in no event shall MSCI, any of its affiliates or any third party involved in, or related to, computing or compiling the information have any liability for any damages of any kind. MSCI and the MSCI indexes are services marks of MSCI and its affiliates.
Disclaimer: This publication has been prepared by the Corporate and Investment Banking division of Barclays Bank PLC and/or one or more of its affiliates (collectively and each individually, "Barclays"). It has been issued by one or more Barclays legal entities within its Corporate and Investment Banking division as provided below. It is provided to our clients for information purposes only, and Barclays makes no express or implied warranties, and expressly disclaims all warranties of merchantability or fitness for a particular purpose or use with respect to any data included in this publication. Barclays will not treat unauthorized recipients of this report as its clients. Prices shown are indicative and Barclays is not offering to buy or sell or soliciting offers to buy or sell any financial instrument. Without limiting any of the foregoing and to the extent permitted by law, in no event shall Barclays, nor any affiliate, nor any of their respective officers, directors, partners, or employees have any liability for (a) any special, punitive, indirect, or consequential damages; or (b) any lost profits, lost revenue, loss of anticipated savings or loss of opportunity or other financial loss, even if notified of the possibility of such damages, arising from any use of this publication or its contents. Other than disclosures relating to Barclays, the information contained in this publication has been obtained from sources that Barclays Research believes to be reliable, but Barclays does not represent or warrant that it is accurate or complete. Barclays is not responsible for, and makes no warranties whatsoever as to, the content of any third-party web site accessed via a hyperlink in this publication and such information is not incorporated by reference. The views in this publication are those of the author(s) and are subject to change, and Barclays has no obligation to update its opinions or the information in this publication. The analyst recommendations in this publication reflect solely and exclusively those of the author(s), and such opinions were prepared independently of any other interests, including those of Barclays and/or its affiliates. This publication does not constitute personal investment advice or take into account the individual financial circumstances or objectives of the clients who receive it. The securities discussed herein may not be suitable for all investors. Barclays recommends that investors independently evaluate each issuer, security or instrument discussed herein and consult any independent advisors they believe necessary. The value of and income from any investment may fluctuate from day to day as a result of changes in relevant economic markets (including changes in market liquidity). The information herein is not intended to predict actual results, which may differ substantially from those reflected. Past performance is not necessarily indicative of future results. This communication is being made available in the UK and Europe primarily to persons who are investment professionals as that term is defined in Article 19 of the Financial Services and Markets Act 2000 (Financial Promotion) Order 2005. It is directed at, and therefore should only be relied upon by, persons who have professional experience in matters relating to investments. The investments to which it relates are available only to such persons and will be entered into only with such persons. Barclays Bank PLC is authorised by the Prudential Regulation Authority and regulated by the Financial Conduct Authority and the Prudential Regulation Authority and is a member of the London Stock Exchange. The Corporate and Investment Banking division of Barclays undertakes U.S. securities business in the name of its wholly owned subsidiary Barclays Capital Inc., a FINRA and SIPC member. Barclays Capital Inc., a U.S. registered broker/dealer, is distributing this material in the United States and, in connection therewith accepts responsibility for its contents. Any U.S. person wishing to effect a transaction in any security discussed herein should do so only by contacting a representative of Barclays Capital Inc. in the U.S. at 745 Seventh Avenue, New York, New York 10019.
13 February 2014 LAST PAGE

Non-U.S. persons should contact and execute transactions through a Barclays Bank PLC branch or affiliate in their home jurisdiction unless local regulations permit otherwise. Barclays Bank PLC, Paris Branch (registered in France under Paris RCS number 381 066 281) is regulated by the Autorité des marchés financiers and the Autorité de contrôle prudentiel. Registered office 34/36 Avenue de Friedland 75008 Paris. This material is distributed in Canada by Barclays Capital Canada Inc., a registered investment dealer and member of IIROC (www.iiroc.ca). Subject to the conditions of this publication as set out above, the Corporate & Investment Banking Division of Absa Bank Limited, an authorised financial services provider (Registration No.: 1986/004794/06. Registered Credit Provider Reg No NCRCP7), is distributing this material in South Africa. Absa Bank Limited is regulated by the South African Reserve Bank. This publication is not, nor is it intended to be, advice as defined and/or contemplated in the (South African) Financial Advisory and Intermediary Services Act, 37 of 2002, or any other financial, investment, trading, tax, legal, accounting, retirement, actuarial or other professional advice or service whatsoever. Any South African person or entity wishing to effect a transaction in any security discussed herein should do so only by contacting a representative of the Corporate & Investment Banking Division of Absa Bank Limited in South Africa, 15 Alice Lane, Sandton, Johannesburg, Gauteng 2196. Absa Bank Limited is a member of the Barclays group. In Japan, foreign exchange research reports are prepared and distributed by Barclays Bank PLC Tokyo Branch. Other research reports are distributed to institutional investors in Japan by Barclays Securities Japan Limited. Barclays Securities Japan Limited is a joint-stock company incorporated in Japan with registered office of 6-10-1 Roppongi, Minato-ku, Tokyo 106-6131, Japan. It is a subsidiary of Barclays Bank PLC and a registered financial instruments firm regulated by the Financial Services Agency of Japan. Registered Number: Kanto Zaimukyokucho (kinsho) No. 143. Barclays Bank PLC, Hong Kong Branch is distributing this material in Hong Kong as an authorised institution regulated by the Hong Kong Monetary Authority. Registered Office: 41/F, Cheung Kong Center, 2 Queen's Road Central, Hong Kong. Information on securities/instruments that trade in Taiwan or written by a Taiwan-based research analyst is distributed by Barclays Capital Securities Taiwan Limited to its clients. The material on securities/instruments not traded in Taiwan is not to be construed as 'recommendation' in Taiwan. Barclays Capital Securities Taiwan Limited does not accept orders from clients to trade in such securities. This material may not be distributed to the public media or used by the public media without prior written consent of Barclays. This material is distributed in South Korea by Barclays Capital Securities Limited, Seoul Branch. All equity research material is distributed in India by Barclays Securities (India) Private Limited (SEBI Registration No: INB/INF 231292732 (NSE), INB/INF 011292738 (BSE), Registered Office: 208 | Ceejay House | Dr. Annie Besant Road | Shivsagar Estate | Worli | Mumbai - 400 018 | India, Phone: + 91 22 67196363). Other research reports are distributed in India by Barclays Bank PLC, India Branch. Barclays Bank PLC Frankfurt Branch distributes this material in Germany under the supervision of Bundesanstalt für Finanzdienstleistungsaufsicht (BaFin). This material is distributed in Malaysia by Barclays Capital Markets Malaysia Sdn Bhd. This material is distributed in Brazil by Banco Barclays S.A. This material is distributed in Mexico by Barclays Bank Mexico, S.A. Barclays Bank PLC in the Dubai International Financial Centre (Registered No. 0060) is regulated by the Dubai Financial Services Authority (DFSA). Principal place of business in the Dubai International Financial Centre: The Gate Village, Building 4, Level 4, PO Box 506504, Dubai, United Arab Emirates. Barclays Bank PLC-DIFC Branch, may only undertake the financial services activities that fall within the scope of its existing DFSA licence. Related financial products or services are only available to Professional Clients, as defined by the Dubai Financial Services Authority. Barclays Bank PLC in the UAE is regulated by the Central Bank of the UAE and is licensed to conduct business activities as a branch of a commercial bank incorporated outside the UAE in Dubai (Licence No.: 13/1844/2008, Registered Office: Building No. 6, Burj Dubai Business Hub, Sheikh Zayed Road, Dubai City) and Abu Dhabi (Licence No.: 13/952/2008, Registered Office: Al Jazira Towers, Hamdan Street, PO Box 2734, Abu Dhabi). Barclays Bank PLC in the Qatar Financial Centre (Registered No. 00018) is authorised by the Qatar Financial Centre Regulatory Authority (QFCRA). Barclays Bank PLC-QFC Branch may only undertake the regulated activities that fall within the scope of its existing QFCRA licence. Principal place of business in Qatar: Qatar Financial Centre, Office 1002, 10th Floor, QFC Tower, Diplomatic Area, West Bay, PO Box 15891, Doha, Qatar. Related financial products or services are only available to Business Customers as defined by the Qatar Financial Centre Regulatory Authority. This material is distributed in the UAE (including the Dubai International Financial Centre) and Qatar by Barclays Bank PLC. This material is distributed in Saudi Arabia by Barclays Saudi Arabia ('BSA'). It is not the intention of the publication to be used or deemed as recommendation, option or advice for any action (s) that may take place in future. Barclays Saudi Arabia is a Closed Joint Stock Company, (CMA License No. 09141-37). Registered office Al Faisaliah Tower, Level 18, Riyadh 11311, Kingdom of Saudi Arabia. Authorised and regulated by the Capital Market Authority, Commercial Registration Number: 1010283024. This material is distributed in Russia by OOO Barclays Capital, affiliated company of Barclays Bank PLC, registered and regulated in Russia by the FSFM. Broker License #177-11850-100000; Dealer License #177-11855-010000. Registered address in Russia: 125047 Moscow, 1st Tverskaya-Yamskaya str. 21. This material is distributed in Singapore by the Singapore branch of Barclays Bank PLC, a bank licensed in Singapore by the Monetary Authority of Singapore. For matters in connection with this report, recipients in Singapore may contact the Singapore branch of Barclays Bank PLC, whose registered address is One Raffles Quay Level 28, South Tower, Singapore 048583. Barclays Bank PLC, Australia Branch (ARBN 062 449 585, AFSL 246617) is distributing this material in Australia. It is directed at 'wholesale clients' as defined by Australian Corporations Act 2001. IRS Circular 230 Prepared Materials Disclaimer: Barclays does not provide tax advice and nothing contained herein should be construed to be tax advice. Please be advised that any discussion of U.S. tax matters contained herein (including any attachments) (i) is not intended or written to be used, and cannot be used, by you for the purpose of avoiding U.S. tax-related penalties; and (ii) was written to support the promotion or marketing of the transactions or other matters addressed herein. Accordingly, you should seek advice based on your particular circumstances from an independent tax advisor. © Copyright Barclays Bank PLC (2014). All rights reserved. No part of this publication may be reproduced in any manner without the prior written permission of Barclays. Barclays Bank PLC is registered in England No. 1026167. Registered office 1 Churchill Place, London, E14 5HP. Additional information regarding this publication will be furnished upon request.
13 February 2014 LAST PAGE