Aloha Instructor
149
ALOHA 1999 U.S. ENVIRONMENTAL PROTECTION AGENCY NATIONAL OCEANIC AND ATMOSPHERIC ADMINSTRATION Chemical Emergency Preparedness and Prevention Office Washington, D.C. 20460 Hazardous Materials Response and Assessment Division Seattle, Washington 98115 AREAL LOCATIONS OF HAZARDOUS ATMOSPHERES Instructor Manual R R
-
Upload
paolo-mocellin -
Category
Documents
-
view
94 -
download
5
description
Aloha Instructor guide
Transcript of Aloha Instructor
ALOHA
1 9 9 9
U.S. ENVIRONMENTALPROTECTION AGENCY
NATIONAL OCEANICAND ATMOSPHERICADMINSTRATION
Chemical Emergency Preparednessand Prevention Office
Washington, D.C. 20460
Hazardous Materials Responseand Assessment Division
Seattle, Washington 98115
A R E A L L O C A T I O N S O F
H A Z A R D O U S A T M O S P H E R E S
Instructor Manual
R
R
About the ALOHA Training Course
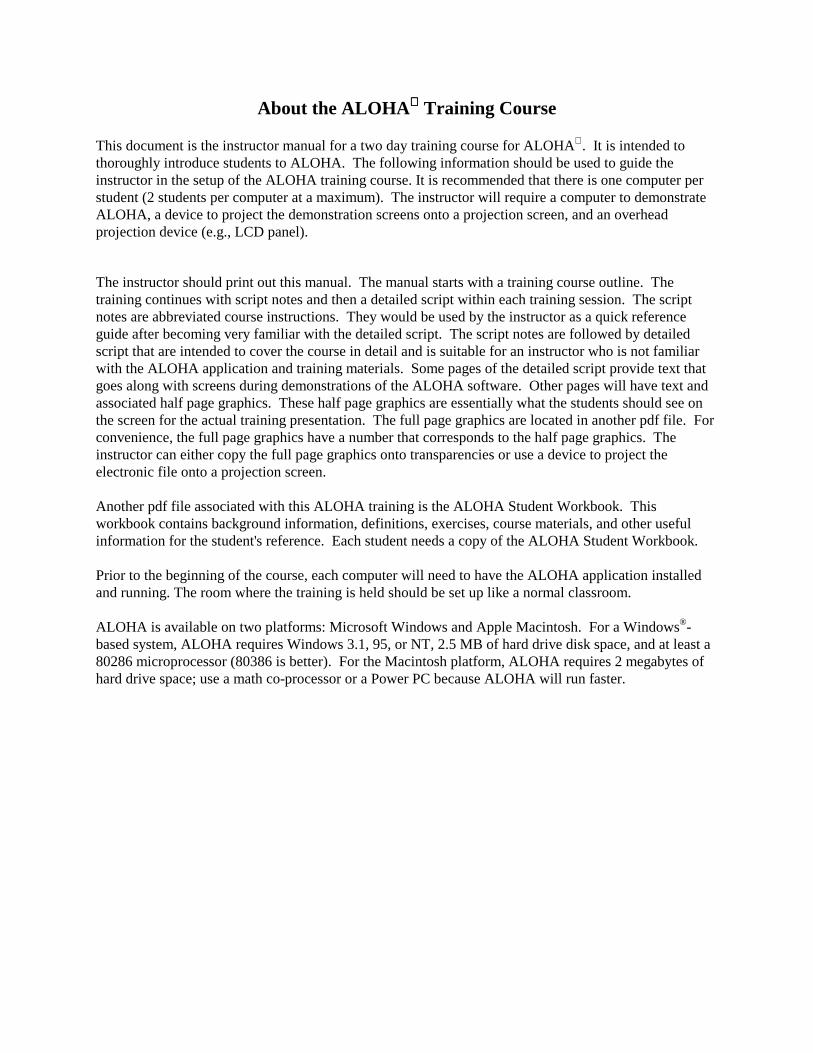
This document is the instructor manual for a two day training course for ALOHA . It is intended tothoroughly introduce students to ALOHA. The following information should be used to guide theinstructor in the setup of the ALOHA training course. It is recommended that there is one computer perstudent (2 students per computer at a maximum). The instructor will require a computer to demonstrateALOHA, a device to project the demonstration screens onto a projection screen, and an overheadprojection device (e.g., LCD panel).
The instructor should print out this manual. The manual starts with a training course outline. Thetraining continues with script notes and then a detailed script within each training session. The scriptnotes are abbreviated course instructions. They would be used by the instructor as a quick referenceguide after becoming very familiar with the detailed script. The script notes are followed by detailedscript that are intended to cover the course in detail and is suitable for an instructor who is not familiarwith the ALOHA application and training materials. Some pages of the detailed script provide text thatgoes along with screens during demonstrations of the ALOHA software. Other pages will have text andassociated half page graphics. These half page graphics are essentially what the students should see onthe screen for the actual training presentation. The full page graphics are located in another pdf file. Forconvenience, the full page graphics have a number that corresponds to the half page graphics. Theinstructor can either copy the full page graphics onto transparencies or use a device to project theelectronic file onto a projection screen.
Another pdf file associated with this ALOHA training is the ALOHA Student Workbook. Thisworkbook contains background information, definitions, exercises, course materials, and other usefulinformation for the student's reference. Each student needs a copy of the ALOHA Student Workbook.
Prior to the beginning of the course, each computer will need to have the ALOHA application installedand running. The room where the training is held should be set up like a normal classroom.
ALOHA is available on two platforms: Microsoft Windows and Apple Macintosh. For a Windows®-based system, ALOHA requires Windows 3.1, 95, or NT, 2.5 MB of hard drive disk space, and at least a80286 microprocessor (80386 is better). For the Macintosh platform, ALOHA requires 2 megabytes ofhard drive space; use a math co-processor or a Power PC because ALOHA will run faster.

ALOHA® Two Day Training CourseOutline of Instructor Manual
Day 1
I. Introductions (8:30 - 8:40 a.m.)II. Introduction to ALOHA (8:40-9:25 a.m.)III. ALOHA - Demonstrating a Scenario (9:25-10:00 a.m.)
BREAK (10:00-10:10 a.m.)IV. Basics of Air Dispersion Modeling (10:10-11:40 a.m.)V. File, Edit, and Site Data Selection Menu (11:40-12:10 p.m.)
LUNCH BREAK (12:10-1:00 p.m.)VI. Setup Menu: Chemical and Atmospheric Submenus (1:00-2:00 p.m)
BREAK (2:00 - 2:15 p.m.)VII. Setup Menu: Source Strength Submenu (2:15 - 3:30 p.m.)VIII. Display Menu: Level of Concern and Display Results Submenus (3:30 -
4:30 p.m.)IX. Hands On Running of ALOHA (4:30-4:45 p.m.)X. Questions and Answers (4:45-5:00 p.m.)

Day 2I. Short Reintroduction to ALOHA Model (8:30-8:35 a.m.)II. Hands On Running of ALOHA (8:35-9:20 a.m.)
III Effects of Inputs on Outputs (9:20-9:40 a.m.)IV. When and When Not to Use ALOHA (9:40-10:10 a.m.)
BREAK (10:10-10:25 a.m.)V. Case Histories: Problem and Success Stories (10:25-11:10 a.m.)VI. Tools and More Tips for Running ALOHA (11:10-11:55 a.m.)
LUNCH BREAK (11:55-1:10 p.m.)VII. ALOHA Use for Mapping and Meeting Federal Requirements (1:10-
2:10 p.m.)
BREAK (2:10-2:25 p.m.)VIII. Examples: Class Exercises and Scavenger Hunt (2:25-3:25 p.m)IX. Conclusion: MINI-Test and Wrap-up (3:25-4:10 p.m.)
Script Notes for Sessions I and II
Day 1
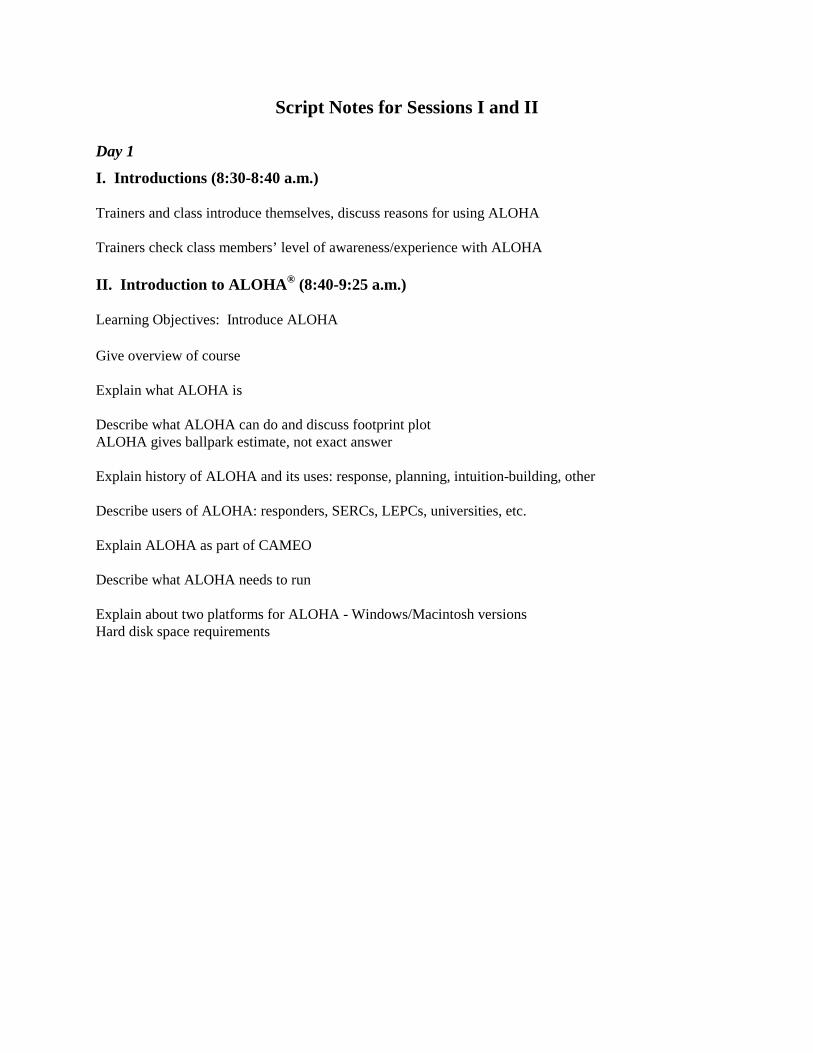
I. Introductions (8:30-8:40 a.m.)
Trainers and class introduce themselves, discuss reasons for using ALOHA
Trainers check class members’ level of awareness/experience with ALOHA
II. Introduction to ALOHA® (8:40-9:25 a.m.)
Learning Objectives: Introduce ALOHA
Give overview of course
Explain what ALOHA is
Describe what ALOHA can do and discuss footprint plotALOHA gives ballpark estimate, not exact answer
Explain history of ALOHA and its uses: response, planning, intuition-building, other
Describe users of ALOHA: responders, SERCs, LEPCs, universities, etc.
Explain ALOHA as part of CAMEO
Describe what ALOHA needs to run
Explain about two platforms for ALOHA - Windows/Macintosh versionsHard disk space requirements
Detailed Script for Sessions I and II
Day 1
I - II. Introduction to ALOHA (8:30 - 9:25 a.m.)
PowerPoint Slide #1Welcome to the two-day training course on ALOHA. If there are goals to achieve in this course, it wouldbe to become skilled in using ALOHA and to know when and when not to use ALOHA. The courseshould provide you with enough background so you can answer questions for local and state governmentsand others about the use of ALOHA.
How many of you have run the ALOHA model before or have some experience with ALOHA? For whatpurpose?
How many of you have taken some sort of previous course that discussed ALOHA such as at a CAMEOconference, or ALOHA course?
Well, this class covers the basics of ALOHA use. The course includes several parts. This morning, wewill cover what is ALOHA, then demonstrate a release scenario, and finally provide you with a mini airdispersion modeling course. This afternoon will be a step by step instruction and hands on session. Iftime permits today, you will model an entire scenario on your own. Tomorrow will be mostly hands-onwork. The course assumes you have familiarity with Windows or Macintosh operating systems.Please feel free to ask any questions you have throughout the course. Do you have any questions so far?
1
I. ALOHAI. ALOHA®® Two-Day TrainingTwo-Day TrainingCourse - Instructor ManualCourse - Instructor Manual
■■ Overview of courseOverview of course•• What is ALOHAWhat is ALOHA
•• When to use and not to useWhen to use and not to use
•• Learn about dispersion modelingLearn about dispersion modeling
•• Demonstration and hands-on experience inDemonstration and hands-on experience inrunning ALOHArunning ALOHA
•• Examples and exercisesExamples and exercises
PowerPoint Slide #2Now that I have mentioned it several times already, what is ALOHA? ALOHA stands for the ArealLocations of Hazardous Atmospheres. It is a computer modeling tool for estimating the movement anddispersion of hazardous chemical gases. ALOHA can predict the rates at which gases may escape intothe atmosphere from broken gas pipes, leaking tanks, and evaporating puddles. Then, it can predict howa hazardous gas cloud might disperse in the atmosphere after an accidental chemical release. A greatadvantage in using ALOHA is that it is easy to use and distributed widely.
2
II. What is ALOHA?II. What is ALOHA?
■■ ALOHAALOHA stands for stands for Areal Areal Locations of Locations ofHazardous AtmospheresHazardous Atmospheres
■■ ALOHALOHAA is an air dispersion model to is an air dispersion model toevaluate hazardous chemical releaseevaluate hazardous chemical releasescenarios and predict dispersionscenarios and predict dispersion

PowerPoint Slide #3What can ALOHA do? ALOHA can predict the area within which a person might experience animmediate serious health impact from contact with more than a certain concentration of a toxic gas. Thisconcentration is called the level of concern, or LOC. ALOHA can also be used to predict the area wherea flammable gas may explode. ALOHA uses the physical characteristics of the released chemical and thereal-time circumstances of the release scenario to predict the dispersion of a hazardous gas cloud.
Using an extensive chemical library and release equations, ALOHA then solves the release problemrapidly and provides results in a graphic, easy-to-use.
It’s important to note that ALOHA provides estimates, not precise answers.
3
What Can ALOHAWhat Can ALOHA Do?Do?
■■ EEstimates impact distances from releases ofstimates impact distances from releases ofhazardous substanceshazardous substances•• Using toxicological and physical properties ofUsing toxicological and physical properties of
released chemicalreleased chemical
•• Using real-time conditionsUsing real-time conditions
■■ Plots the predicted affected area, as well asPlots the predicted affected area, as well asconcentrations at important locationsconcentrations at important locations
■■ Provides estimates, not precise answersProvides estimates, not precise answers
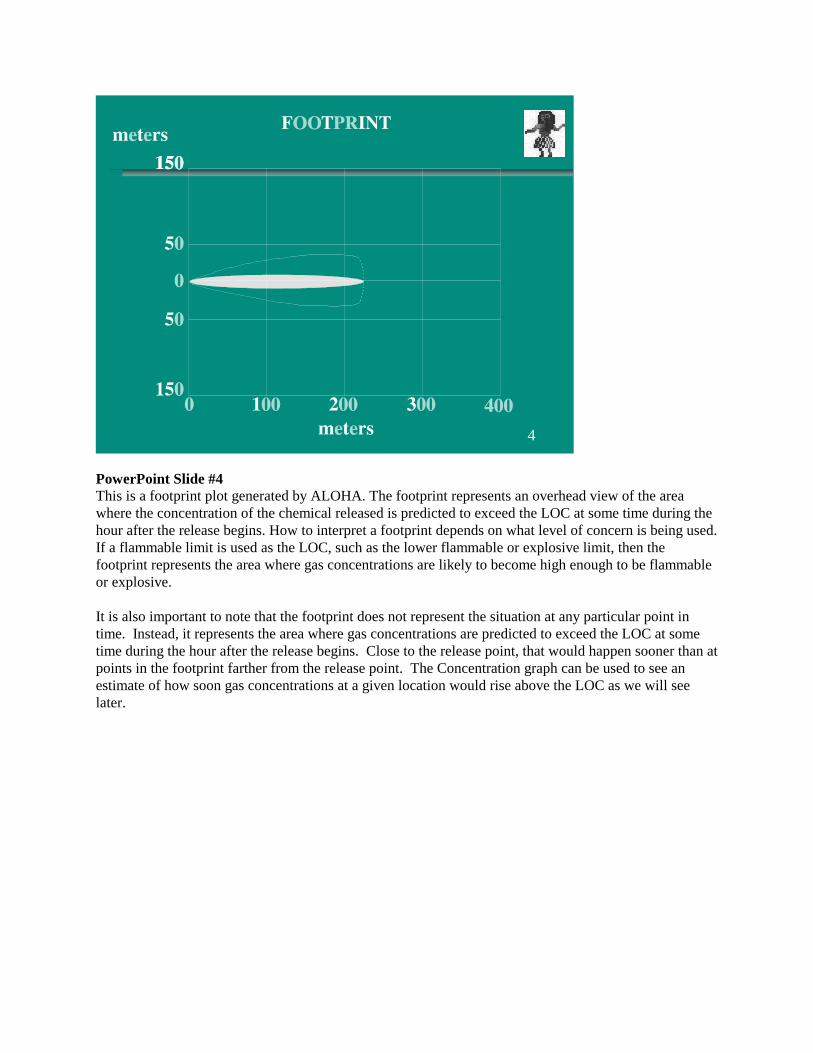
PowerPoint Slide #4This is a footprint plot generated by ALOHA. The footprint represents an overhead view of the areawhere the concentration of the chemical released is predicted to exceed the LOC at some time during thehour after the release begins. How to interpret a footprint depends on what level of concern is being used.If a flammable limit is used as the LOC, such as the lower flammable or explosive limit, then thefootprint represents the area where gas concentrations are likely to become high enough to be flammableor explosive.
It is also important to note that the footprint does not represent the situation at any particular point intime. Instead, it represents the area where gas concentrations are predicted to exceed the LOC at sometime during the hour after the release begins. Close to the release point, that would happen sooner than atpoints in the footprint farther from the release point. The Concentration graph can be used to see anestimate of how soon gas concentrations at a given location would rise above the LOC as we will seelater.
4
PowerPoint Slide #5ALOHA can answer important questions in a short time. For example, ALOHA could answer, What isthe release rate forming the cloud? What is the danger from the release of the chemical?, What areasdownwind may be affected? However, it is important to note that ALOHA does not providerecommendations of action such as evacuation, but provides information that might help in making suchdecisions.
5
ALOHAALOHA Answers QuestionsAnswers Questions
■■ What is the release rate forming the cloud?What is the release rate forming the cloud?
■■ What is the danger from release of theWhat is the danger from release of thechemical?chemical?
■■ What areas downwind may be affected?What areas downwind may be affected?
PowerPoint Slide #6Now, how did ALOHA come about? The National Oceanic and Atmospheric Administration or NOAAnoticed that fire departments and other response agencies did not have critical information abouthazardous chemicals or a toxic air dispersion model to predict threat areas. ALOHA was developed as aresponse tool in 1982. Over the years, several academic institutions and response organizations helped inits development and refinement. Its use by emergency responders increased as the benefits of its ease ofuse and speed of calculations were demonstrated. ALOHA first shipped with CAMEO in September1986 to the Seattle Fire Department, and since late 1987 has been co-developed with EPA’s ChemicalEmergency Preparedness and Prevention Office. In January 1991, a completely rewritten ALOHA wasdistributed. It included new calculations to estimate source strength release rate and to predict thedispersion of heavier-than-air gases. ALOHA continues to be refined.
ALOHA is an important tool to build intuition about the nature of chemical accidents. In other words, byusing ALOHA, the user can begin to get an intuitive idea of the relative atmospheric hazards ofchemicals by picking up facts about the chemical’s toxicity, properties, and ability to disperse downwind.The user can bring this experience to addressing a release in an actual incident. Intuition building is alsoan important component of developing a trained staff for emergency response.
6
History of ALOHA and Its UsesHistory of ALOHA and Its Uses
■■ Developed by:Developed by:•• NOAA’s NOAA’s Hazardous Materials Response and Hazardous Materials Response and
Assessment Division andAssessment Division and
•• EPA’s Chemical Emergency Preparedness andEPA’s Chemical Emergency Preparedness andPrevention OfficePrevention Office
■■ Developed for:Developed for:•• Chemical emergency responseChemical emergency response
•• Chemical emergency planningChemical emergency planning
•• Intuition buildingIntuition building
PowerPoint Slide #7ALOHA has value for many different types of users. As we described earlier, fire departments and otheremergency responders assess a hazardous chemical situation and take actions including evacuation andsheltering-in-place. For example, HAZMAT vehicles used by some fire departments contain portablecomputers loaded with ALOHA. But what about emergency planning? State Emergency ResponseCommissions (SERCs) and Local Emergency Planning Committees (LEPCs) use ALOHA results indeveloping emergency planning documents under the Emergency Planning and Community Right-to-Know Act and in conducting a dialogue with facilities. Chemical companies may want to run ALOHA toevaluate possible scenarios, determine the priority of certain release prevention and mitigation strategies,and to even comply with certain regulatory requirements such as the EPA’s Risk Management ProgramRule, which will be addressed in more detail later in this course. Finally, health care facilities anduniversities would be interested in ALOHA results. Universities and other training institutions useALOHA as an instructional aid in teaching some of the basics of air dispersion modeling.
7
Users of ALOHAUsers of ALOHA
■■ Fire departmentsFire departments
■■ Emergency plannersEmergency planners
■■ SERCsSERCs and and LEPCs LEPCs
■■ Chemical facilitiesChemical facilities
■■ Health care facilitiesHealth care facilities
■■ UniversitiesUniversities
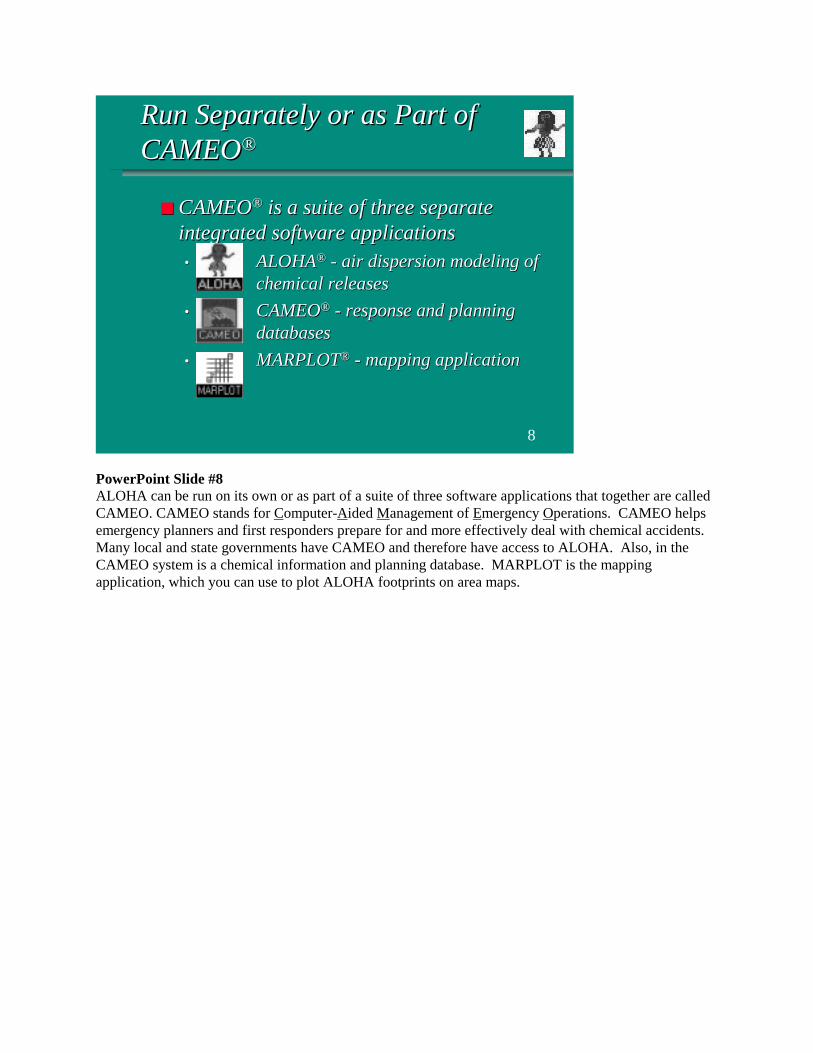
PowerPoint Slide #8ALOHA can be run on its own or as part of a suite of three software applications that together are calledCAMEO. CAMEO stands for Computer-Aided Management of Emergency Operations. CAMEO helpsemergency planners and first responders prepare for and more effectively deal with chemical accidents.Many local and state governments have CAMEO and therefore have access to ALOHA. Also, in theCAMEO system is a chemical information and planning database. MARPLOT is the mappingapplication, which you can use to plot ALOHA footprints on area maps.
8
Run Separately or as Part ofRun Separately or as Part ofCAMEOCAMEO®®
■■ CAMEOCAMEO®® is a suite of three separate is a suite of three separateintegrated software applicationsintegrated software applications•• ALOHAALOHA®® - air dispersion modeling of - air dispersion modeling of
chemical releaseschemical releases
•• CAMEOCAMEO®® - response and planning - response and planning databasesdatabases
•• MARPLOTMARPLOT®® - mapping application - mapping application
PowerPoint Slide #9To use ALOHA, you will typically perform several basic steps. These include:1) indicate the city where an accidental chemical release has occurred and the time and date of the
accident.2) specify a chemical of concern from ALOHA’s library of chemical information3) enter information about weather conditions/meteorological information
9
What do you need to do to RunWhat do you need to do to RunALOHA?ALOHA?
■■ Specify site dataSpecify site data•• Incident locationIncident location
•• Release time/dateRelease time/date
■■ Specify hazardous chemical from over 900Specify hazardous chemical from over 900•• Various chemical property dataVarious chemical property data
■■ Enter weather conditionsEnter weather conditions
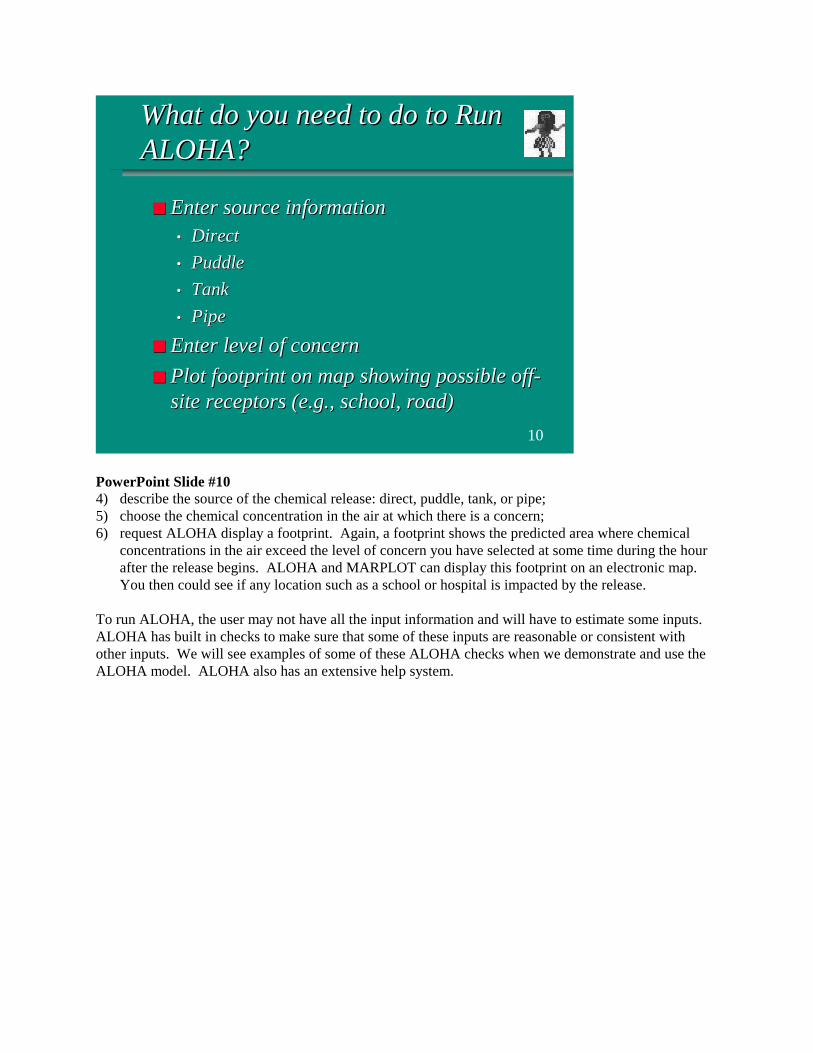
PowerPoint Slide #104) describe the source of the chemical release: direct, puddle, tank, or pipe;5) choose the chemical concentration in the air at which there is a concern;6) request ALOHA display a footprint. Again, a footprint shows the predicted area where chemical
concentrations in the air exceed the level of concern you have selected at some time during the hourafter the release begins. ALOHA and MARPLOT can display this footprint on an electronic map.You then could see if any location such as a school or hospital is impacted by the release.
To run ALOHA, the user may not have all the input information and will have to estimate some inputs.ALOHA has built in checks to make sure that some of these inputs are reasonable or consistent withother inputs. We will see examples of some of these ALOHA checks when we demonstrate and use theALOHA model. ALOHA also has an extensive help system.
10
What do you need to do to RunWhat do you need to do to RunALOHA?ALOHA?
■■ Enter source informationEnter source information•• DirectDirect
•• PuddlePuddle
•• TankTank
•• PipePipe
■■ Enter level of concernEnter level of concern
■■ Plot footprint on map showing possible off-Plot footprint on map showing possible off-site receptors (e.g., school, road)site receptors (e.g., school, road)

PowerPoint Slide #11ALOHA is available on two platforms; Microsoft Windows and Apple Macintosh. ALOHA forMicrosoft Windows requires Windows version 3.1, 95, or NT. Two and one half megabytes of spaceavailable on the hard drive is required. The Macintosh platform requires 2 megabytes of hard drivespace; use a math co-processor or a Power PC because ALOHA will run faster.
Now, we are going to demonstrate ALOHA to briefly introduce you to running a scenario. You may notunderstand all the options presented and the choices made, but you will get a flavor of what ALOHA cando and recognize how ALOHA can be used. Don’t worry, later on you will get plenty of hands onexperience with the ALOHA model.
11
Two Platforms for RunningTwo Platforms for RunningALOHAALOHA
■■ WindowsWindows•• Version 3.1, 95, or NTVersion 3.1, 95, or NT
•• 2.5 Mb on hard drive2.5 Mb on hard drive
•• At least 80286 microprocessor (80386 better)At least 80286 microprocessor (80386 better)
■■ MacintoshMacintosh•• 2 Mb on hard drive2 Mb on hard drive
•• Prefer math co-processor chip or Power PCPrefer math co-processor chip or Power PC
Script Notes for Session III
Day 1
III. ALOHA - Demonstrating a Scenario (9:25-10:00 a.m.)
Learning Objectives: Instructor quickly demonstrates ALOHA to initially introduce the students torunning a scenario. After the demonstration, instructor points out that ALOHA is easy to run. Theimportant thing is for students to learn what ALOHA does so it can be used properly.
• Explain reasons for demonstration− To show how easy it is to run and then to show graphics
• Read scenario of chlorine release at paper mill− Ask what is the downwind distance to the IDLH
• Run ALOHA using scenario inputs− Click on the ALOHA icon and mention first window (about limitations)− Read each point in the window and state they will be discussed in detail later− Click OK and mention that the text summary window has key information about the release site
• As screens appear, explain briefly− ALOHA menu bar: File, Edit, SiteData, SetUp, Display, Sharing− Choosing a location. Go to SiteData and select Location. Type the letters of the city Columbia.− Choosing a building. Go to SiteData and select Building Type. Go over possible selections;
select Enclosed Buildings for this example.− Choosing a date and time. For this example, select Constant time as January 15, 1996, 1:00 pm
(enter 13 for military time).− Choosing a chemical. From SetUp, select chemical. Type CH and select Chlorine.− Entering weather information. From SetUp, select Atmospheric then User Input. Then enter
Wind speed of 12 knots, 360 for Wind is from, Measurement height of 10 meters, Open countryfor ground roughness. Complete cover for Cloud cover, and then press OK. Then enter 70oF, Dfor stability class, no inversion, and humidity of 70%.
− Choosing a Source. From SetUp, select Source. For this example, select Tank. Then selectVertical Cylinder with a diameter of 3 feet and length of 4 feet. In the next window, select Tankcontains liquid and Chemical stored at ambient condition. Then, enter 1 ton as the mass of thetank. Next, enter 10 by 3 inch opening through a rectangular Hole. Finally, enter the leak as 6inches above the bottom of the tank.
− Computational Preferences will not be discussed.− Choosing a Level of Concern and plotting a footprint. From Display, select Options to open the
Display Options window; use default values for Level of Concern. Select Footprint to displaythe dispersion cloud. Plot the footprint on a map in MARPLOT.
• Final points on ALOHA.− ALOHA gives ballpark estimates: there is a random component to dispersion, ALOHA has
simplifying assumptions, and the user may guess at some inputs.− ALOHA is easy to use, but also easy to misuse or misinterpret.
BREAK (10:00-10:10 a.m.)
Detailed Script for Session III
Day 1
III. ALOHA - Demonstrating a Scenario (9:25 - 10:00 a.m.)
1) Explain reasons for demonstration
a) Show how easy to runb) Show graphics
2) Read following scenario of chlorine release at paper mill (two slides show inputs)
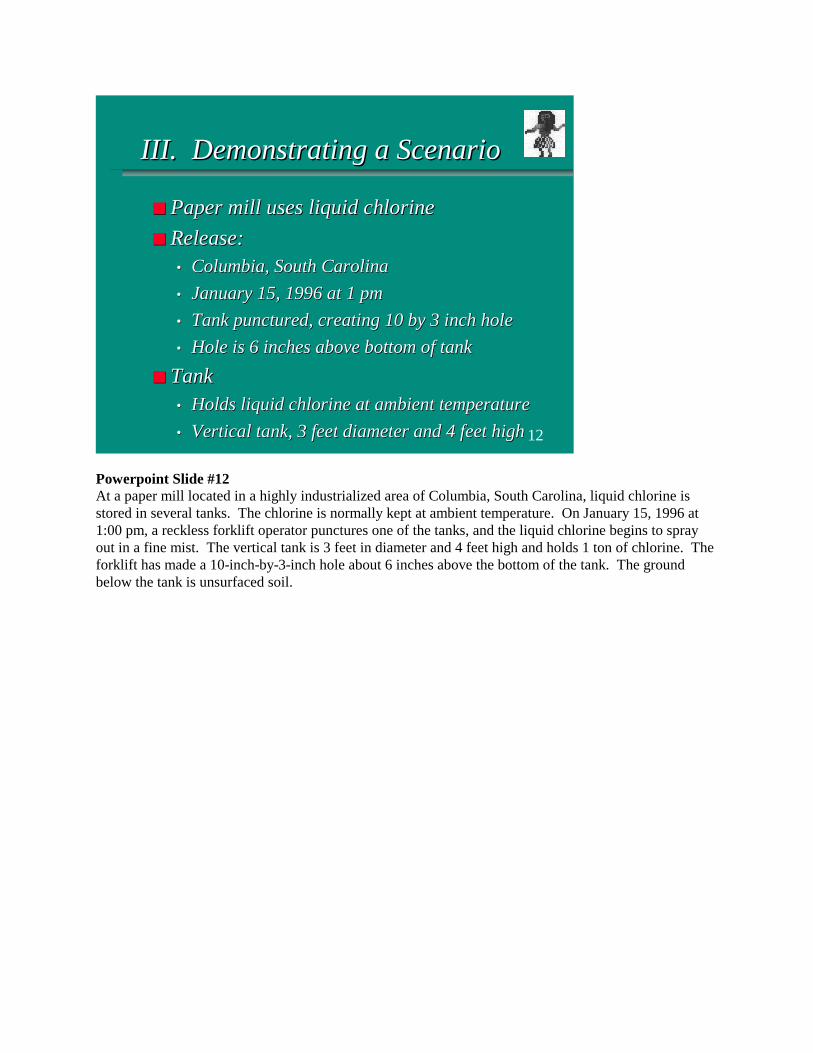
Powerpoint Slide #12At a paper mill located in a highly industrialized area of Columbia, South Carolina, liquid chlorine isstored in several tanks. The chlorine is normally kept at ambient temperature. On January 15, 1996 at1:00 pm, a reckless forklift operator punctures one of the tanks, and the liquid chlorine begins to sprayout in a fine mist. The vertical tank is 3 feet in diameter and 4 feet high and holds 1 ton of chlorine. Theforklift has made a 10-inch-by-3-inch hole about 6 inches above the bottom of the tank. The groundbelow the tank is unsurfaced soil.
12
III. Demonstrating a ScenarioIII. Demonstrating a Scenario
■■ Paper mill uses liquid chlorinePaper mill uses liquid chlorine
■■ Release:Release:•• Columbia, South CarolinaColumbia, South Carolina
•• January 15, 1996 at 1January 15, 1996 at 1 pm pm
•• Tank punctured, creating 10 by 3 inch holeTank punctured, creating 10 by 3 inch hole
•• Hole is 6 inches above bottom of tankHole is 6 inches above bottom of tank
■■ TankTank•• Holds liquid chlorine at ambient temperatureHolds liquid chlorine at ambient temperature
•• Vertical tank, 3 feet diameter and 4 feet highVertical tank, 3 feet diameter and 4 feet high

Powerpoint Slide #13At the time of the spill, the sky was completely overcast, the air temperature was 70oF, and the wind wasblowing from 360 degrees at 12 knots, measured at a height of 10 meters. Earlier in the day, there hadbeen some rain but it had stopped before noon.
What is the downwind distance to the IDLH?
13
III. Demonstrating a ScenarioIII. Demonstrating a Scenario(Continued)(Continued)
■■ Weather conditionsWeather conditions•• Sky overcastSky overcast
•• Air temperature 70Air temperature 70ooFF
•• Wind 360 degrees at 12 knotsWind 360 degrees at 12 knots
•• Rain earlier in dayRain earlier in day
■■ What is downwind distance of the IDLH?What is downwind distance of the IDLH?
(2a) Run ALOHA using scenario inputs (use computer screens as overheads)a) Click on the ALOHA icon. Mention the first window that appears - Air Model Limitations.
(For example, ALOHA does not deal with fire explosion hazard, terrain accounting,chemical solutions or mixtures, particulates).
b) Read each point in the window. Mention will discuss in more detail later.c) After pressing OK, mention that the text summary window displays key information about
your scenario.
3) ALOHA menu bar - just briefly go over what is in the menu
a) File - allows user to open, save, and print files.b) Edit - allows editing of items in the Text window.c) SiteData - has Location, Building Type, and Date & Time selections. These are used to enter
site data.d) SetUp - has Chemical, Atmosphere, Source, and Computational selections. Again, used for
scenario data.e) Display - window organizing and ALOHA output.f) Sharing - deals with interfacing ALOHA with CAMEO or MARPLOT.
(3a) Choosing a Location - A first selection for the release conditionsa) First, go to SiteData on the menu bar.b) Select location. A list will appear. Simply type the letters of the city you are interested in.c) In this case, type CO, and then scroll down to and select Columbia, South Carolina.d) Mention the Help selection here and throughout ALOHA data entry screens.
(3b) Choosing a Buildinga) Again, within the SiteData menu, select Building Type. This is for buildings within the path
of the cloud.b) Go over the possible selections. Enclosed buildings can be selected for this case.
(3c) Choosing a Date & Timea) Indicate that the Date & Time is related to weather and other conditions that affect
dispersion.b) Use the internal clock only when you are modeling a release occurring at or about the same
date & time of the incident. The internal clock is the time clock kept by the computer.c) For this case, select the Constant time as January 15, 1996, 1:00 pm.d) Mention the hours go from 0-23. There is no am or pm. Hence, for pm hours, add 12; 1 pm
becomes 13.
(3d) Choosing a Chemicala) First, go to SetUp on the menu bar. Select Chemical. A list of chemicals will appear.b) Simply type the letters of the chemical you are interested in.c) In this case, type CH, and select Chlorine.
(3e) Entering Weather informationWeather conditions affect dispersion. ALOHA asks for weather information that is provided in thescenario.
a) Again, go to SetUp on the menu bar. Select Atmospheric then User Input, which allows userto provide information.
b) After selecting User Input, a window will appear.c) Under Wind speed, enter 12 and select knots as the units and 360 for Wind is from.d) Emphasize the importance of selecting proper units.e) In this case, Measurement height above ground is 10 meters.f) The ground area downwind of the tank is low cut grass, so select Open country for ground
roughness.g) The sky was completely overcast, so select Complete cover for Cloud cover.h) Press OK and another window will appear.i) Enter 70oF, stability class, which we will discuss later is designated as D by ALOHA, select
no inversion, and a humidity guesstimate of 70 percent given the rain earlier in the day.
(3f) Choosing a Sourcea) Select Source from the SetUp menu. Mention there are options for Direct, Puddle, Tank, and
Pipe release.b) In this case, select Tank. A window will appear.c) Select the Vertical Cylinder, then enter dimensions: 3 feet diameter, 4 feet length. The
volume will then be automatically displayed.d) Another window will appear. Select Tank contains liquid and Chemical stored at ambient
temperature.e) Another window appears. Enter the mass of the tank as 1 ton. As can be seen, liquid level is
then displayed.f) Another window appears. In this scenario, a rectangular opening is appropriate. Enter 10
by 3 inch opening through a Hole.g) The final window then appears. The leak is about 6 inches above the bottom of the tank.
(3g) Choosing Computation PreferencesFor now, we are going to skip over computational preferences.
(3h) Choosing a Level of Concern and plotting a footprinta) Under the Display menu, go over the Options, Text Summary, and Footprint selections.
Point out that the Text Summary window has appeared throughout the session.b) Select Options to open the Display Options window. The Level of Concern is a concentration
of a toxic gas that is predicted to cause particular, defined health impacts. In this case, thedefault values will be used.
c) Select Footprint to display the area where ALOHA predicts the concentration will rise aboveyour level of concern at some time during the hour after the release starts.
d) The shaded area shows where chlorine concentration is at or above the level of concern.The furthest impact distance is 1.8 miles.
(3i) Plotting on Mapa) Finally, indicate that the footprint can be plotted in MARPLOT.b) Click on Sharing Menuc) Click on MARPLOT and go to Mapd) Click OKe) Click Sharing and ALOHA and Set Source Point
4) Remember, ALOHA gives ballpark estimates, not exact values
Point out the following:a) There is a random component to dispersion.b) ALOHA makes simplifying assumptions.c) The user may guess at some inputs like hole size.
(4a) Final important pointsa) ALOHA is easy to useb) Don’t misuse or misinterpret
Now you see how easy it is to run the model. You will be able to run the model easily. The importantthing is to learn what the ALOHA model is doing, to know what is behind the model so you can use itproperly. ALOHA should not be used for scenarios for which it was not designed. Also, ALOHA resultsshould not be misinterpreted or misused. In some cases, lives could be a stake. ALOHA does have abuilt in warning system to guard against misuse but the user has the ultimate control. A large part of theremainder of this course is to teach you the skills and give you the knowledge to make decisions in usingALOHA.
Script Notes for Session IV
Day 1
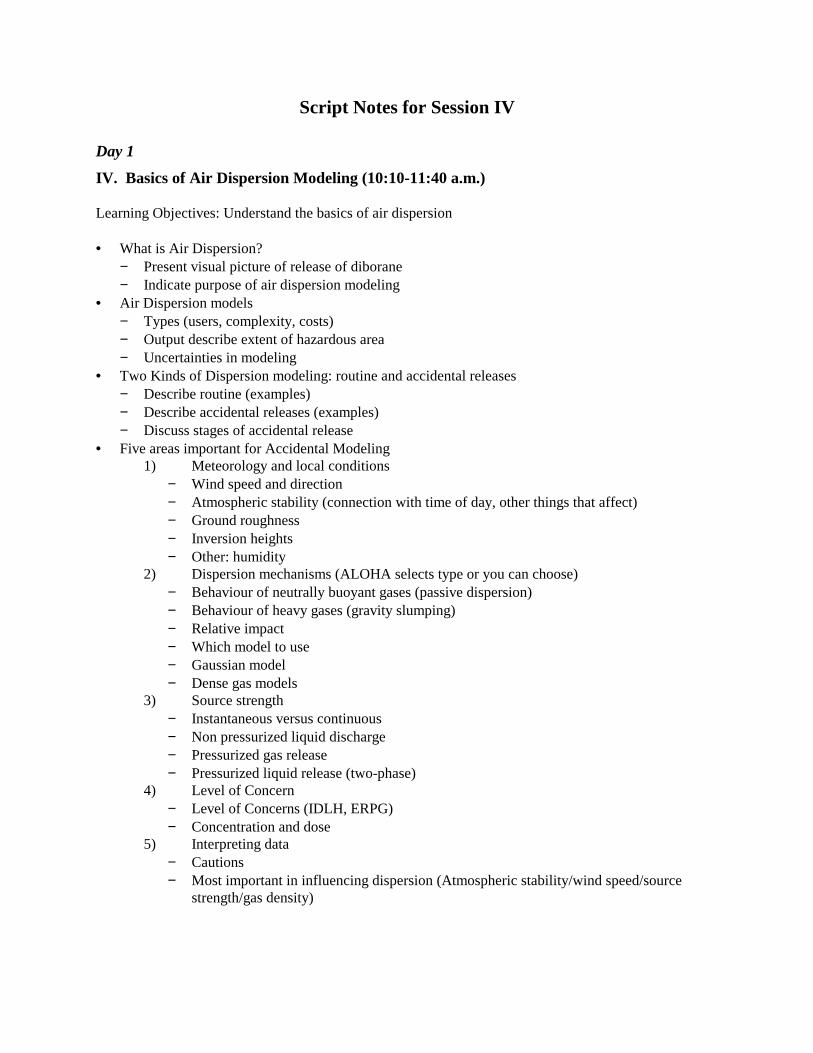
IV. Basics of Air Dispersion Modeling (10:10-11:40 a.m.)
Learning Objectives: Understand the basics of air dispersion
• What is Air Dispersion?− Present visual picture of release of diborane− Indicate purpose of air dispersion modeling
• Air Dispersion models− Types (users, complexity, costs)− Output describe extent of hazardous area− Uncertainties in modeling
• Two Kinds of Dispersion modeling: routine and accidental releases− Describe routine (examples)− Describe accidental releases (examples)− Discuss stages of accidental release
• Five areas important for Accidental Modeling1) Meteorology and local conditions
− Wind speed and direction− Atmospheric stability (connection with time of day, other things that affect)− Ground roughness− Inversion heights− Other: humidity
2) Dispersion mechanisms (ALOHA selects type or you can choose)− Behaviour of neutrally buoyant gases (passive dispersion)− Behaviour of heavy gases (gravity slumping)− Relative impact− Which model to use− Gaussian model− Dense gas models
3) Source strength− Instantaneous versus continuous− Non pressurized liquid discharge− Pressurized gas release− Pressurized liquid release (two-phase)
4) Level of Concern− Level of Concerns (IDLH, ERPG)− Concentration and dose
5) Interpreting data− Cautions− Most important in influencing dispersion (Atmospheric stability/wind speed/source
strength/gas density)
Detailed Script for Session IV
Day 1
IV. Session IV Basics of Air Dispersion Modeling(10:00 - 11:40 a.m.)
PowerPoint Slide #14The first thing we need to do to correctly operate ALOHA is to learn about air dispersion and airdispersion modeling. So get ready for a short 60 minute course on air dispersion modeling.
14
IV. Basics of Air DispersionIV. Basics of Air DispersionModelingModeling
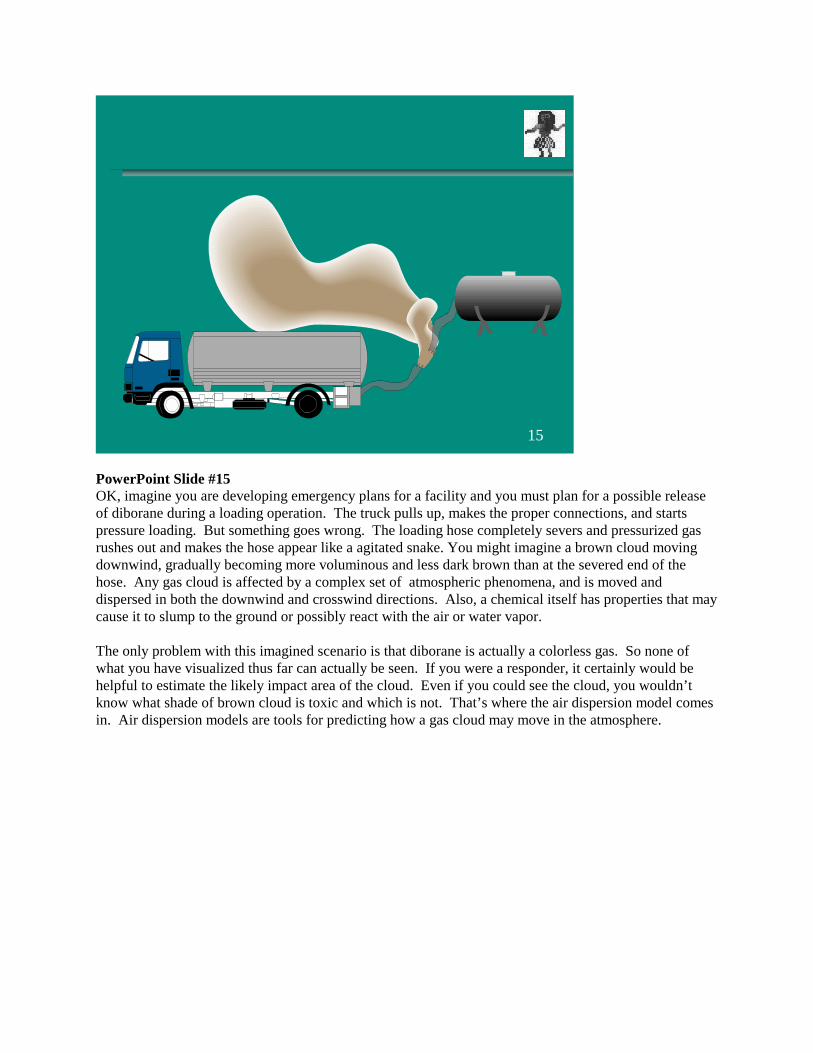
PowerPoint Slide #15OK, imagine you are developing emergency plans for a facility and you must plan for a possible releaseof diborane during a loading operation. The truck pulls up, makes the proper connections, and startspressure loading. But something goes wrong. The loading hose completely severs and pressurized gasrushes out and makes the hose appear like a agitated snake. You might imagine a brown cloud movingdownwind, gradually becoming more voluminous and less dark brown than at the severed end of thehose. Any gas cloud is affected by a complex set of atmospheric phenomena, and is moved anddispersed in both the downwind and crosswind directions. Also, a chemical itself has properties that maycause it to slump to the ground or possibly react with the air or water vapor.
The only problem with this imagined scenario is that diborane is actually a colorless gas. So none ofwhat you have visualized thus far can actually be seen. If you were a responder, it certainly would behelpful to estimate the likely impact area of the cloud. Even if you could see the cloud, you wouldn’tknow what shade of brown cloud is toxic and which is not. That’s where the air dispersion model comesin. Air dispersion models are tools for predicting how a gas cloud may move in the atmosphere.
15
PowerPoint Slide #16Many types of air dispersion models exist - some are for research while others are for emergencyresponse or for planning. They range from simple equations that can be solved by hand, to complexmodels that require massive amounts of input data and powerful computers. Computer models have theadvantage of being able to perform calculations quickly and store property information on hundreds ifnot 1000’s of chemicals. As you might guess, costs for these air dispersion models vary widely. Thetype of model appropriate for a particular use depends on the scenario, the inputs available and outputsrequired, and the time and budget to operate the model and obtain results.
16
Air Dispersion ModelsAir Dispersion Models
■■ UsesUses•• Emergency planning and responseEmergency planning and response
•• ResearchResearch
■■ Complexity, costs vary greatlyComplexity, costs vary greatly
■■ Appropriate to needsAppropriate to needs

PowerPoint Slide #17ALOHA produces a plot of a cloud's predicted "footprint," which is a sort of map of the cloud, viewedfrom above. The x-axis is the length of the cloud and the y-axis is the width of the cloud. The footprintis the area within which the ground-level concentration of a pollutant gas is predicted to exceed aspecified level of concern concentration at some time during the hour after the release begins. If this werea footprint of a diborane release, the shaded area within the footprint might be greater than or equal to 40parts per million, which is one of several possible levels of concern for diborane.
Underlying this simple figure is a series of equations and assumptions that attempt to predict the complexchemical and physical interactions that are characteristic of a release and its subsequent dispersion.There are many uncertainties in air dispersion modeling Some researchers have suggested that a goodmodel is one that can predict concentrations at various distances within a factor of two of concentrationsmeasured in an actual spill test.
17
PowerPoint Slide #18Two of the most common kinds of dispersion modeling are those used for routine emissions and thoseused for accidental releases. Early research in the air dispersion field focused on routine emissions. Anexample of routine emissions is the continuous release of sulfur dioxide from a plant smokestack. Forthis long term type of emission, you might be worried about effects such as global warming or thepossibility of people living downwind of the plant getting cancer after years of exposure. Typically, forthis situation, the source strength is continuous and well defined. A simple dispersion model called aGaussian model is most often used to describe the release behavior.
In contrast, most accidental releases involve a limited duration release. Examples include a leaking valveon a chlorine cylinder, break on a tank car hose, and rupture of a relief valve due to tank overpressure.These releases may cause immediate health effects. For modeling accidental releases, the user mustoften guesstimate important inputs such as the source term. Also, many accident scenarios that involvepressurized releases are not well understood and therefore may not be addressed well in many models.Traditional Gaussian models may be too simplistic for many emergency releases.
ALOHA is used to carry out accidental, non-routine release air dispersion modeling. More specifically,ALOHA is for short-term accidental releases involving hazardous materials but not radiologicalmaterials. The focus of this air dispersion modeling course is on accidental releases.
18
Two Kinds of DispersionTwo Kinds of DispersionModelingModeling
■■ Modeling routine emissionsModeling routine emissions•• e.g., SOe.g., SO22 gas from plant stack gas from plant stack
•• Source strength well-defined, continuous and not time-Source strength well-defined, continuous and not time-varyingvarying
•• SimpleSimple Gaussian Gaussian model model
■■ Modeling accident releasesModeling accident releases•• e.g., Leaking valve on a chlorine cylindere.g., Leaking valve on a chlorine cylinder
•• More difficult to model than routine modelingMore difficult to model than routine modeling
–– users often guess important inputs such as source termusers often guess important inputs such as source term
–– pressurized releases not well understoodpressurized releases not well understood
•• GaussianGaussian model too simple model too simple
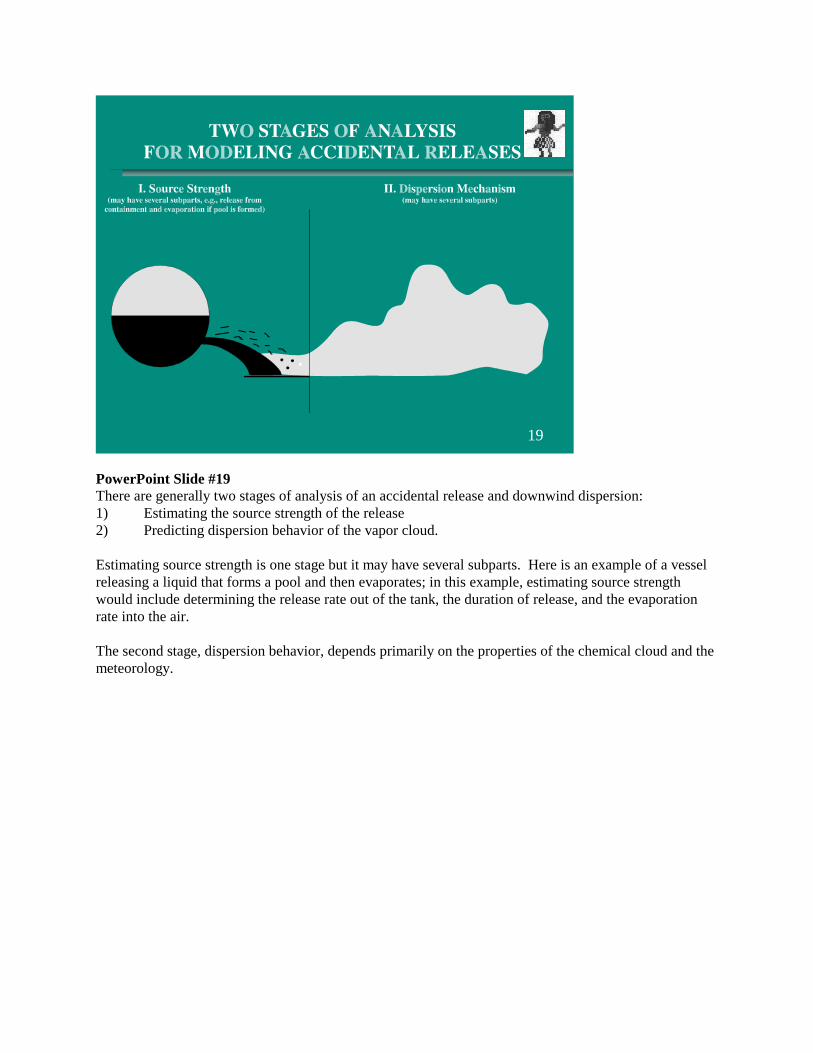
PowerPoint Slide #19There are generally two stages of analysis of an accidental release and downwind dispersion:1) Estimating the source strength of the release2) Predicting dispersion behavior of the vapor cloud.
Estimating source strength is one stage but it may have several subparts. Here is an example of a vesselreleasing a liquid that forms a pool and then evaporates; in this example, estimating source strengthwould include determining the release rate out of the tank, the duration of release, and the evaporationrate into the air.
The second stage, dispersion behavior, depends primarily on the properties of the chemical cloud and themeteorology.
19
PowerPoint Slide #20To effectively use any air dispersion model, you need to understand and examine the following 5 areasthat influence the model use:1) Meteorology and local conditions2) Dispersion mechanism.3) Source strength4) Level of concern5) Interpreting results
During the rest of this mini-course, I will briefly discuss these areas so as to introduce you to themovement and dispersion of gases.
20
Five Important Areas forFive Important Areas forAccident Release ModelingAccident Release Modeling
■■ Meteorology and local conditionsMeteorology and local conditions
■■ Dispersion mechanismDispersion mechanism
■■ Source strengthSource strength
■■ Level of concernLevel of concern
■■ Interpreting resultsInterpreting results

PowerPoint Slide #21Meteorology greatly influences dispersion. Most of what will be covered in this session on meteorologyoccurs in the lowest region of the atmosphere between the ground and 1000 meters. Air movements canmove, disperse, or trap a pollutant cloud. Let’s examine a few of the meteorological and local conditionsthat influence dispersion or direction of the cloud. These include: wind speed, wind direction,atmospheric stability, ground roughness, and temperature inversions. Wind speed and atmosphericstability are the primary factors that influence dispersion. Atmospheric stability is a measure of themixing or turbulence in the atmosphere, which in large part depends on the amount of solar radiationheating the air near the ground. I must caution beforehand, that many of the conditions in this slide arerelated to one another in complex relationships, but we will try to understand each one separately. Thenext seven or so slides are on wind and also prepare you for a further understanding of atmosphericstability.
21
Meteorology and LocalMeteorology and LocalConditionsConditions
■■ Wind speedWind speed
■■ Wind directionWind direction
■■ Atmospheric stability (A through F)Atmospheric stability (A through F)
■■ Ground roughnessGround roughness
■■ InversionsInversions
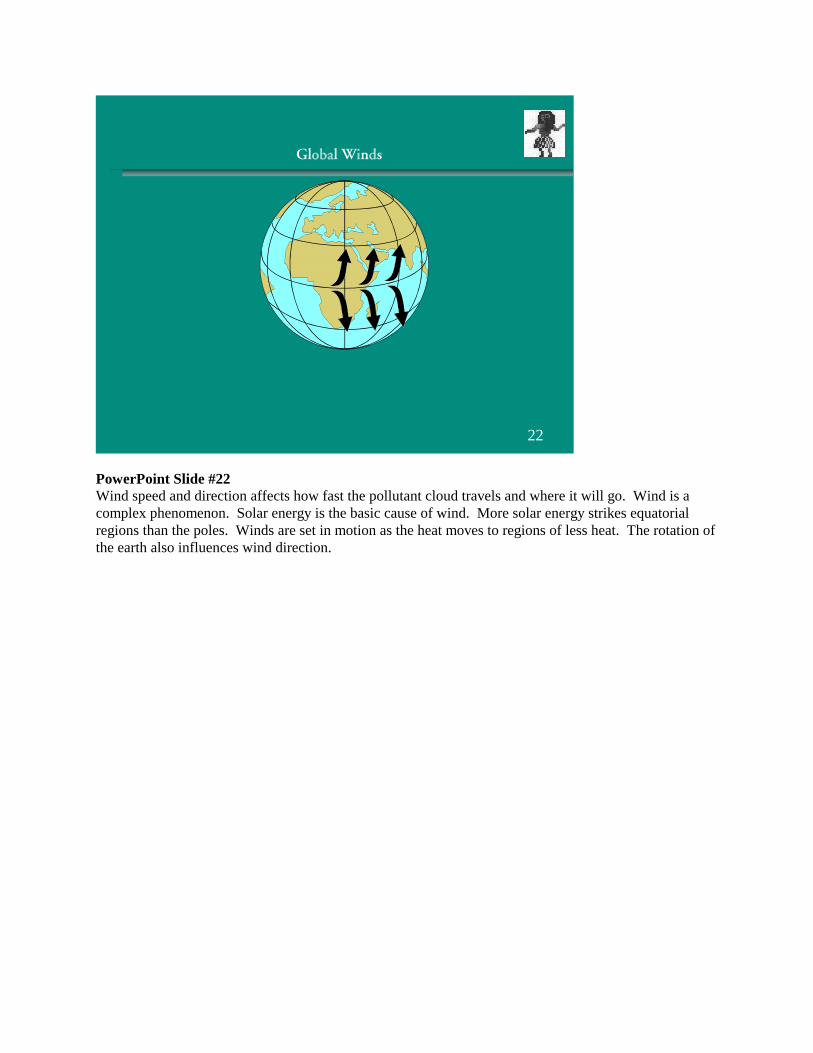
PowerPoint Slide #22Wind speed and direction affects how fast the pollutant cloud travels and where it will go. Wind is acomplex phenomenon. Solar energy is the basic cause of wind. More solar energy strikes equatorialregions than the poles. Winds are set in motion as the heat moves to regions of less heat. The rotation ofthe earth also influences wind direction.
22
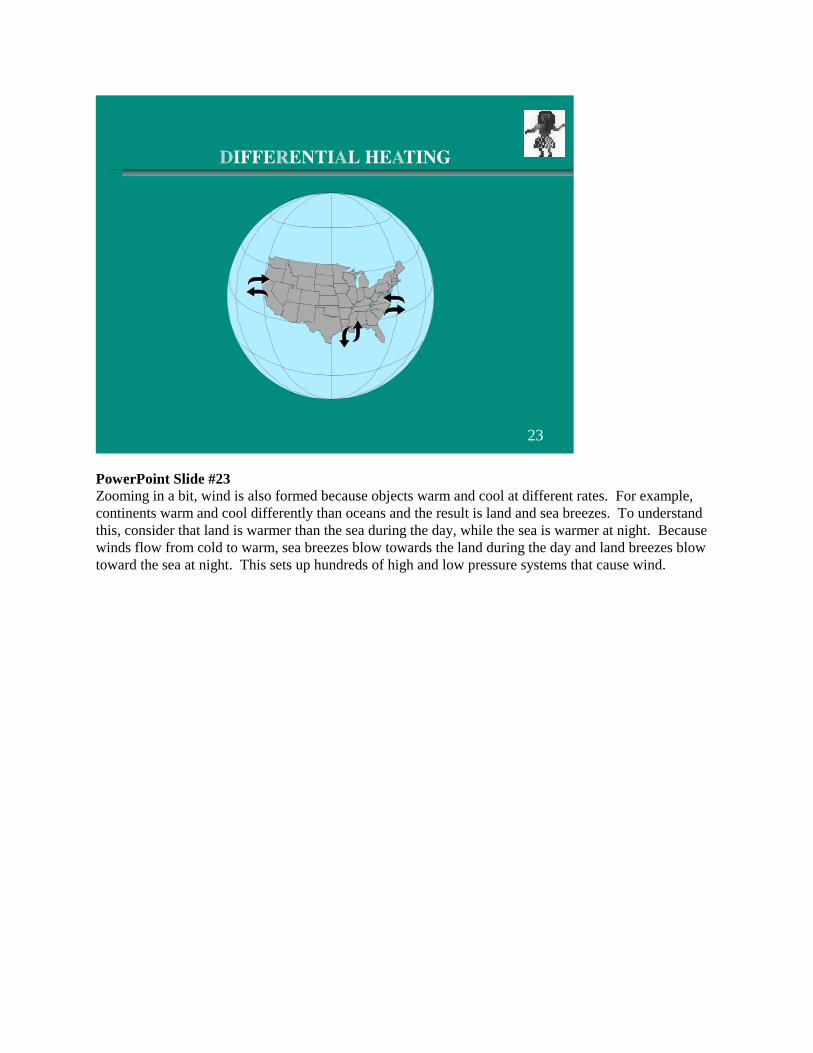
PowerPoint Slide #23Zooming in a bit, wind is also formed because objects warm and cool at different rates. For example,continents warm and cool differently than oceans and the result is land and sea breezes. To understandthis, consider that land is warmer than the sea during the day, while the sea is warmer at night. Becausewinds flow from cold to warm, sea breezes blow towards the land during the day and land breezes blowtoward the sea at night. This sets up hundreds of high and low pressure systems that cause wind.
23
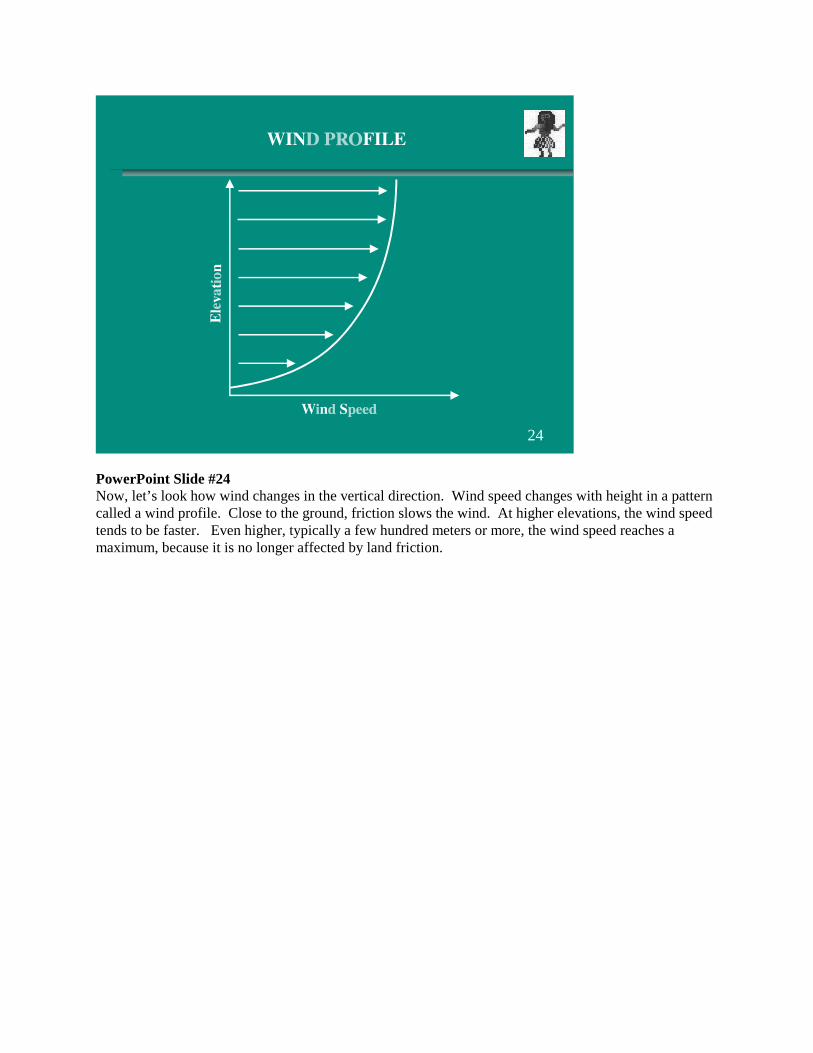
PowerPoint Slide #24Now, let’s look how wind changes in the vertical direction. Wind speed changes with height in a patterncalled a wind profile. Close to the ground, friction slows the wind. At higher elevations, the wind speedtends to be faster. Even higher, typically a few hundred meters or more, the wind speed reaches amaximum, because it is no longer affected by land friction.
24
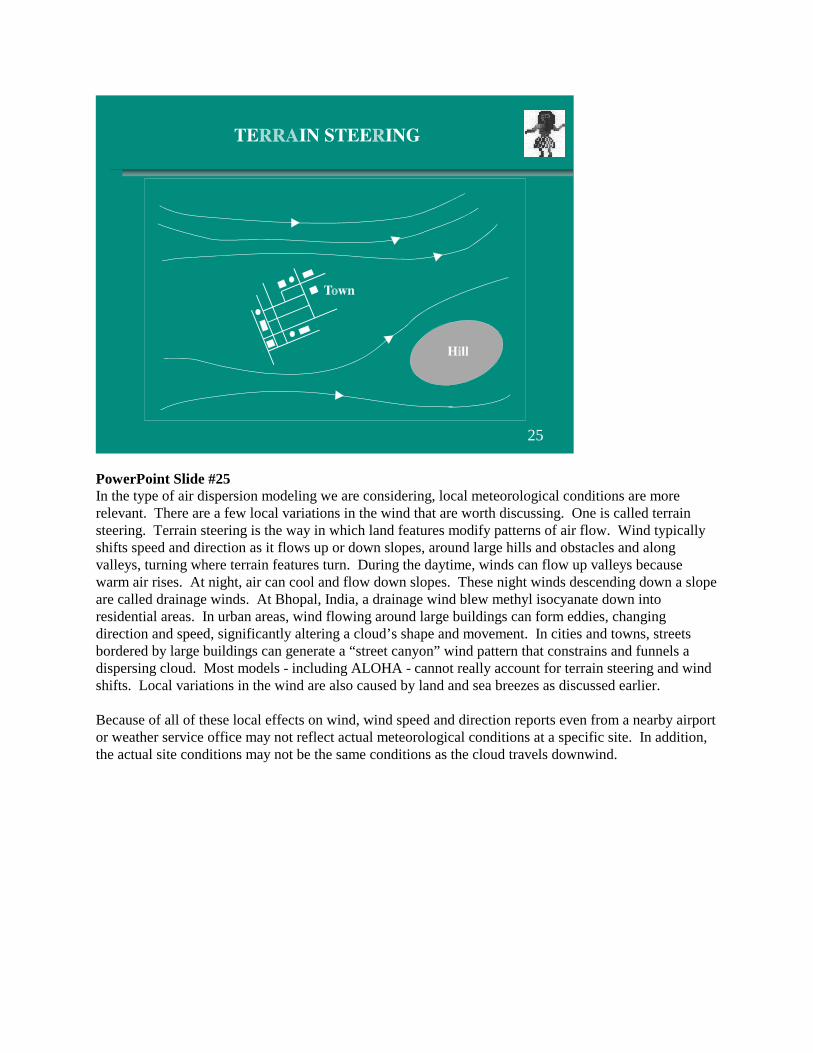
PowerPoint Slide #25In the type of air dispersion modeling we are considering, local meteorological conditions are morerelevant. There are a few local variations in the wind that are worth discussing. One is called terrainsteering. Terrain steering is the way in which land features modify patterns of air flow. Wind typicallyshifts speed and direction as it flows up or down slopes, around large hills and obstacles and alongvalleys, turning where terrain features turn. During the daytime, winds can flow up valleys becausewarm air rises. At night, air can cool and flow down slopes. These night winds descending down a slopeare called drainage winds. At Bhopal, India, a drainage wind blew methyl isocyanate down intoresidential areas. In urban areas, wind flowing around large buildings can form eddies, changingdirection and speed, significantly altering a cloud’s shape and movement. In cities and towns, streetsbordered by large buildings can generate a “street canyon” wind pattern that constrains and funnels adispersing cloud. Most models - including ALOHA - cannot really account for terrain steering and windshifts. Local variations in the wind are also caused by land and sea breezes as discussed earlier.
Because of all of these local effects on wind, wind speed and direction reports even from a nearby airportor weather service office may not reflect actual meteorological conditions at a specific site. In addition,the actual site conditions may not be the same conditions as the cloud travels downwind.
25
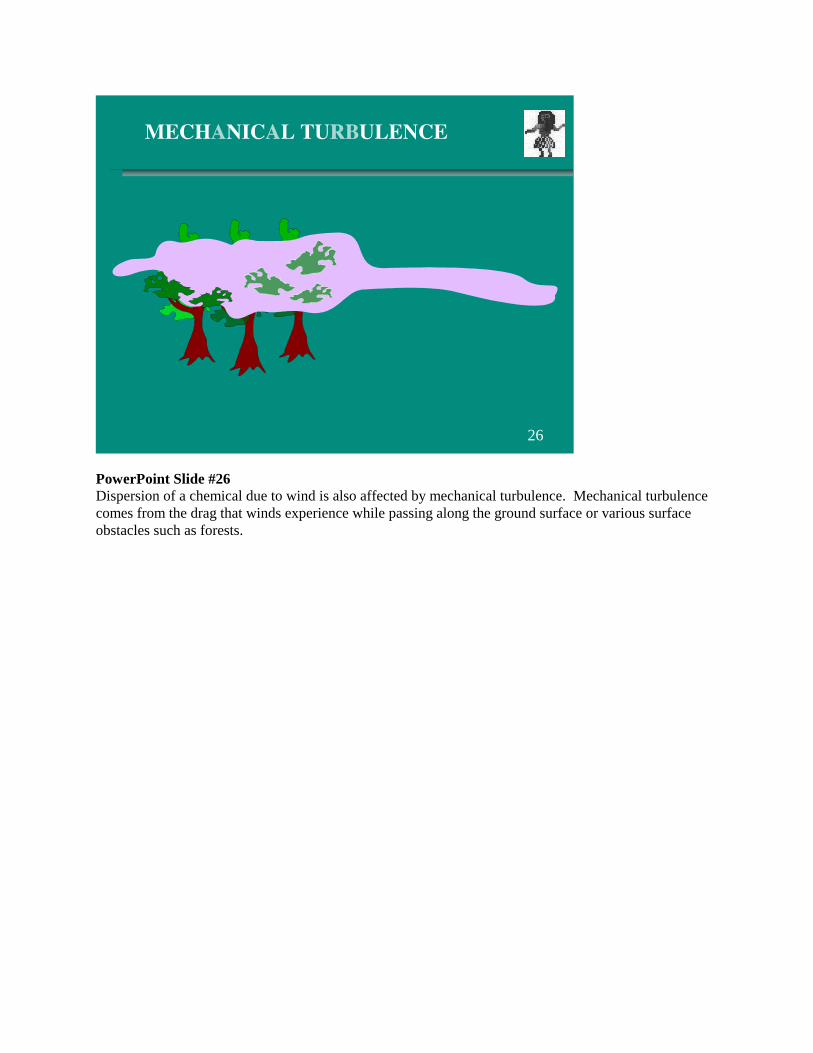
PowerPoint Slide #26Dispersion of a chemical due to wind is also affected by mechanical turbulence. Mechanical turbulencecomes from the drag that winds experience while passing along the ground surface or various surfaceobstacles such as forests.
26
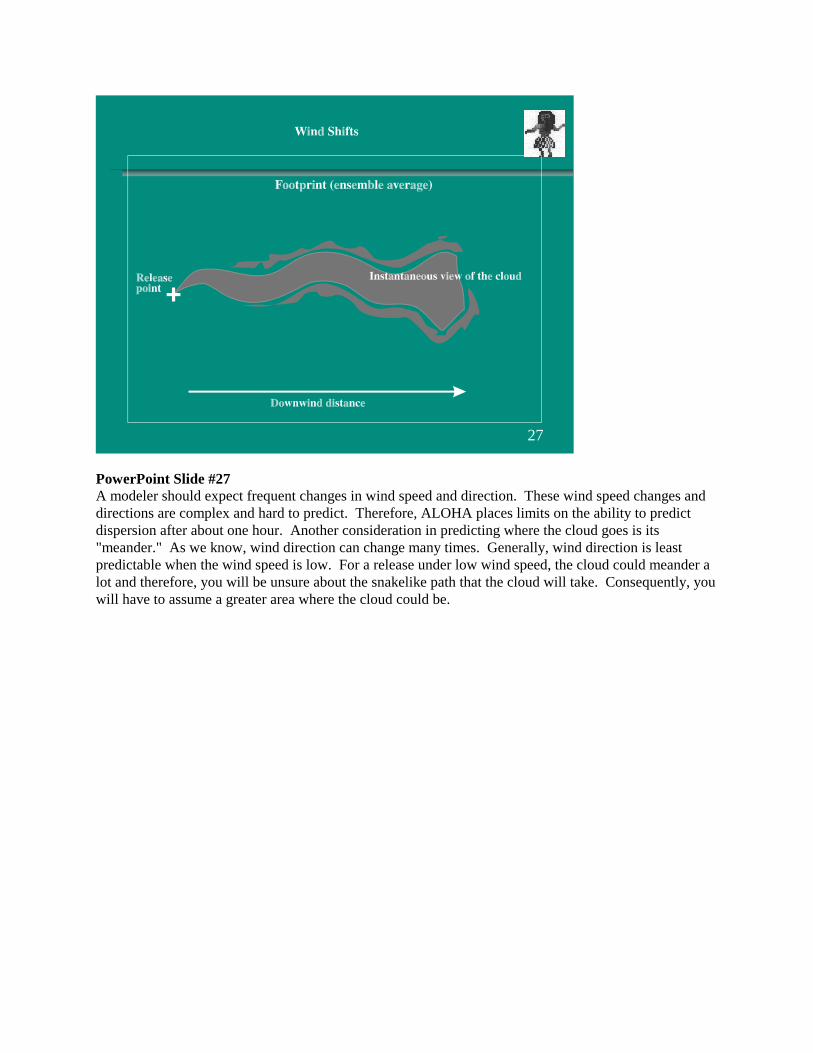
PowerPoint Slide #27A modeler should expect frequent changes in wind speed and direction. These wind speed changes anddirections are complex and hard to predict. Therefore, ALOHA places limits on the ability to predictdispersion after about one hour. Another consideration in predicting where the cloud goes is its"meander." As we know, wind direction can change many times. Generally, wind direction is leastpredictable when the wind speed is low. For a release under low wind speed, the cloud could meander alot and therefore, you will be unsure about the snakelike path that the cloud will take. Consequently, youwill have to assume a greater area where the cloud could be.
27
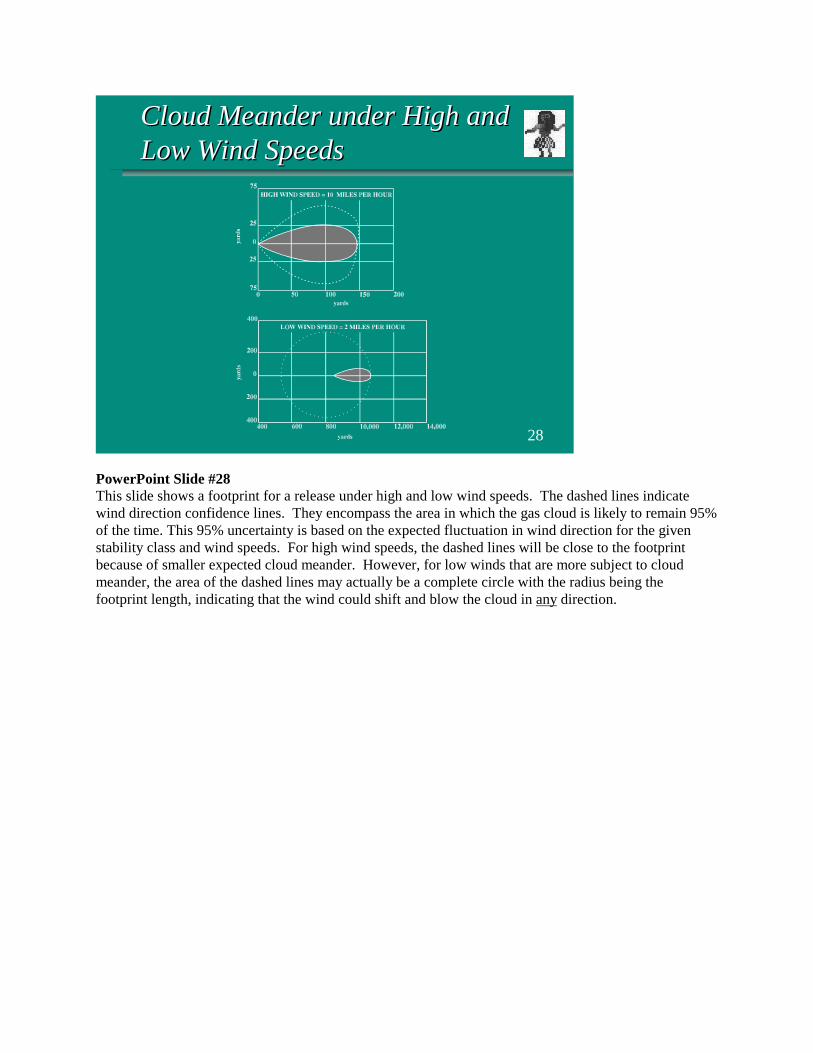
PowerPoint Slide #28This slide shows a footprint for a release under high and low wind speeds. The dashed lines indicatewind direction confidence lines. They encompass the area in which the gas cloud is likely to remain 95%of the time. This 95% uncertainty is based on the expected fluctuation in wind direction for the givenstability class and wind speeds. For high wind speeds, the dashed lines will be close to the footprintbecause of smaller expected cloud meander. However, for low winds that are more subject to cloudmeander, the area of the dashed lines may actually be a complete circle with the radius being thefootprint length, indicating that the wind could shift and blow the cloud in any direction.
28
Cloud Meander under High andCloud Meander under High andLow Wind SpeedsLow Wind Speeds
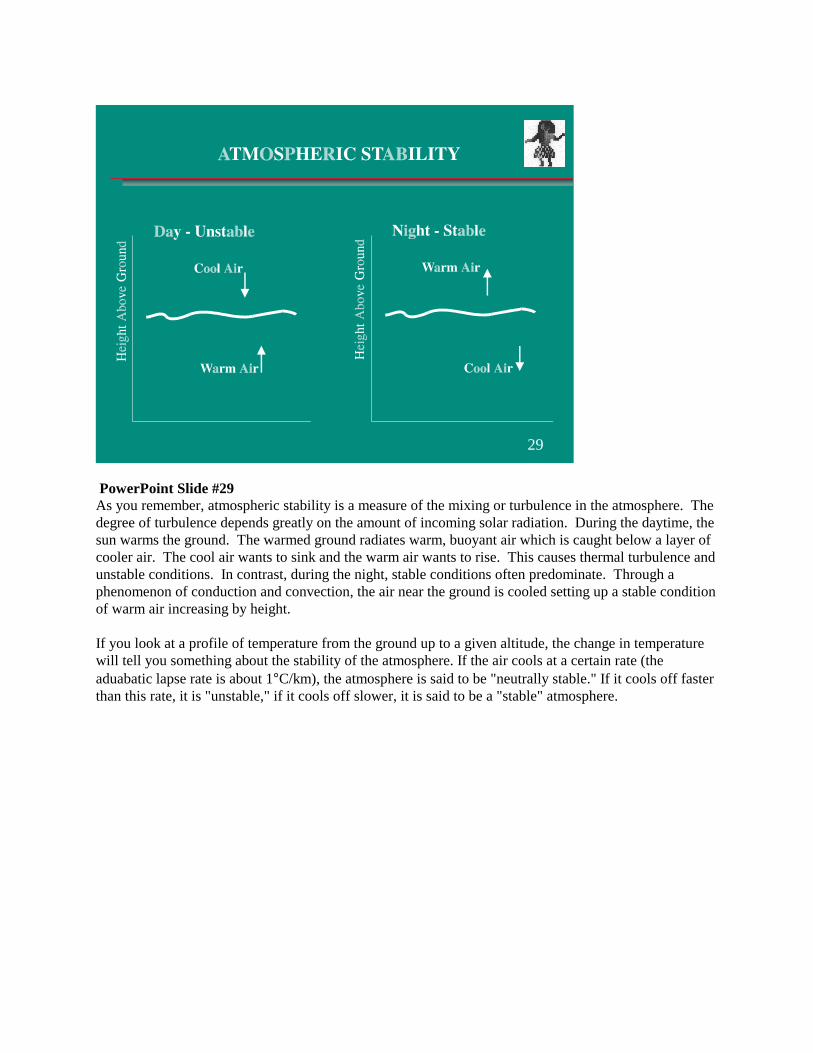
PowerPoint Slide #29As you remember, atmospheric stability is a measure of the mixing or turbulence in the atmosphere. Thedegree of turbulence depends greatly on the amount of incoming solar radiation. During the daytime, thesun warms the ground. The warmed ground radiates warm, buoyant air which is caught below a layer ofcooler air. The cool air wants to sink and the warm air wants to rise. This causes thermal turbulence andunstable conditions. In contrast, during the night, stable conditions often predominate. Through aphenomenon of conduction and convection, the air near the ground is cooled setting up a stable conditionof warm air increasing by height.
If you look at a profile of temperature from the ground up to a given altitude, the change in temperaturewill tell you something about the stability of the atmosphere. If the air cools at a certain rate (theaduabatic lapse rate is about 1°C/km), the atmosphere is said to be "neutrally stable." If it cools off fasterthan this rate, it is "unstable," if it cools off slower, it is said to be a "stable" atmosphere.
29
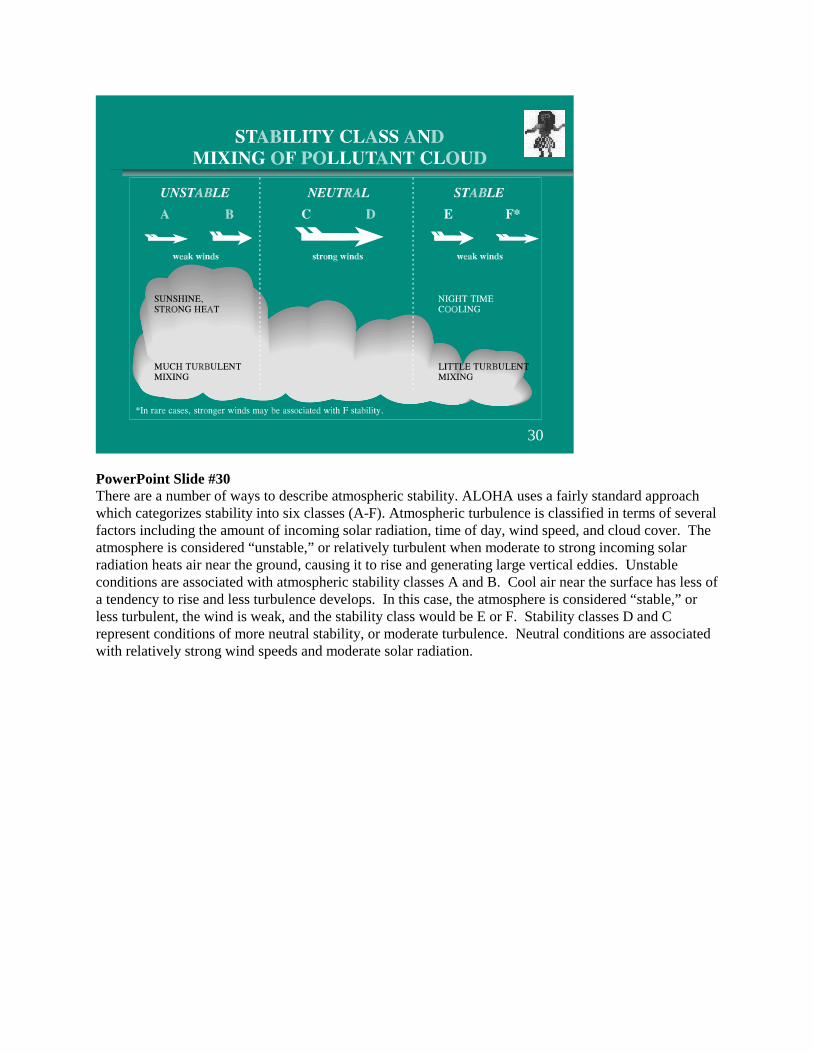
PowerPoint Slide #30There are a number of ways to describe atmospheric stability. ALOHA uses a fairly standard approachwhich categorizes stability into six classes (A-F). Atmospheric turbulence is classified in terms of severalfactors including the amount of incoming solar radiation, time of day, wind speed, and cloud cover. Theatmosphere is considered “unstable,” or relatively turbulent when moderate to strong incoming solarradiation heats air near the ground, causing it to rise and generating large vertical eddies. Unstableconditions are associated with atmospheric stability classes A and B. Cool air near the surface has less ofa tendency to rise and less turbulence develops. In this case, the atmosphere is considered “stable,” orless turbulent, the wind is weak, and the stability class would be E or F. Stability classes D and Crepresent conditions of more neutral stability, or moderate turbulence. Neutral conditions are associatedwith relatively strong wind speeds and moderate solar radiation.
30
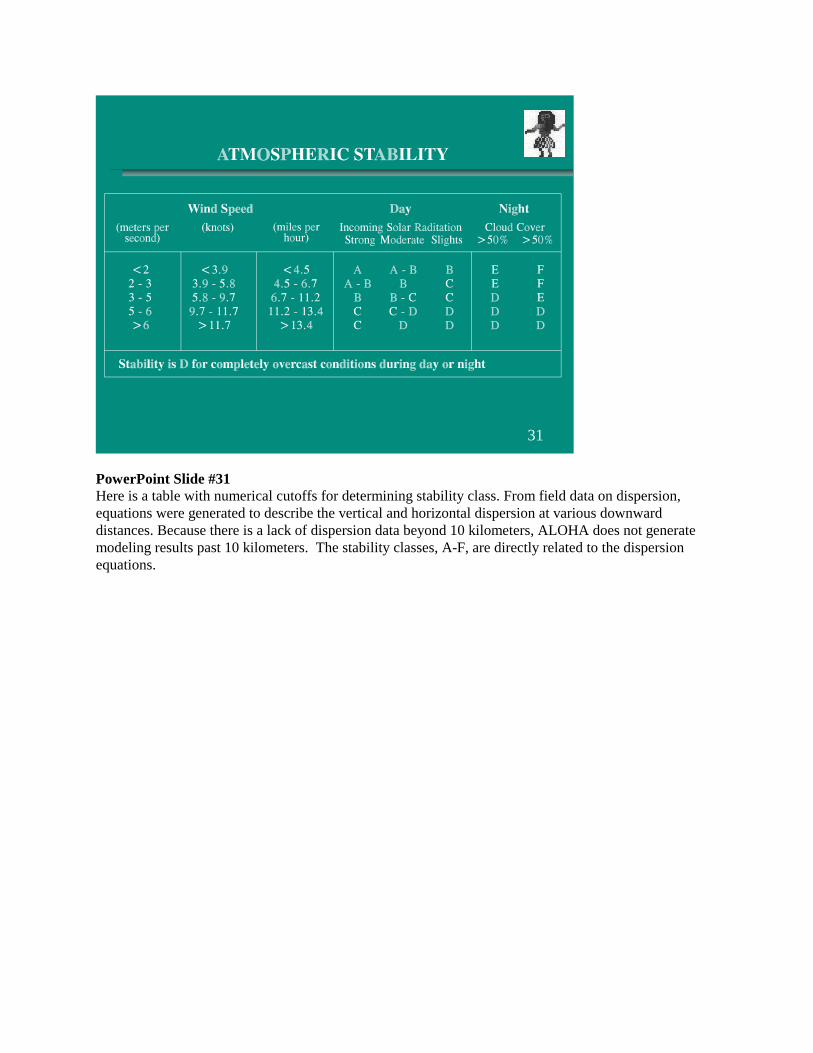
PowerPoint Slide #31Here is a table with numerical cutoffs for determining stability class. From field data on dispersion,equations were generated to describe the vertical and horizontal dispersion at various downwarddistances. Because there is a lack of dispersion data beyond 10 kilometers, ALOHA does not generatemodeling results past 10 kilometers. The stability classes, A-F, are directly related to the dispersionequations.
31
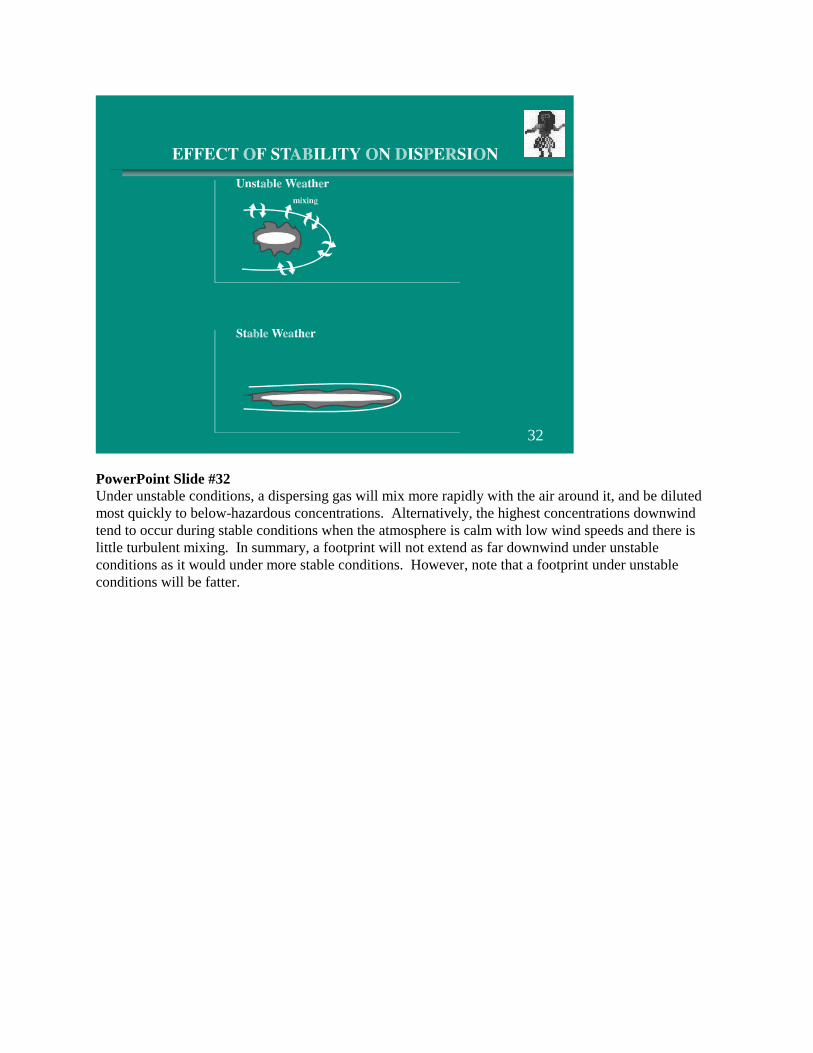
PowerPoint Slide #32Under unstable conditions, a dispersing gas will mix more rapidly with the air around it, and be dilutedmost quickly to below-hazardous concentrations. Alternatively, the highest concentrations downwindtend to occur during stable conditions when the atmosphere is calm with low wind speeds and there islittle turbulent mixing. In summary, a footprint will not extend as far downwind under unstableconditions as it would under more stable conditions. However, note that a footprint under unstableconditions will be fatter.
32
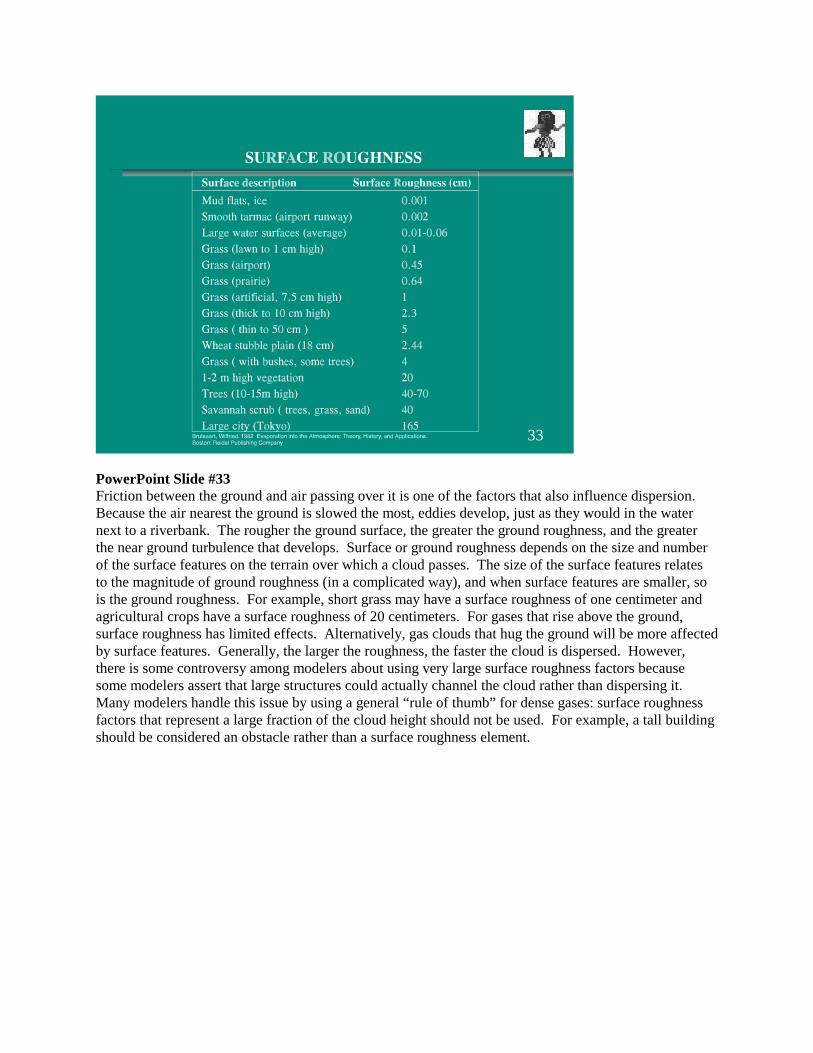
PowerPoint Slide #33Friction between the ground and air passing over it is one of the factors that also influence dispersion.Because the air nearest the ground is slowed the most, eddies develop, just as they would in the waternext to a riverbank. The rougher the ground surface, the greater the ground roughness, and the greaterthe near ground turbulence that develops. Surface or ground roughness depends on the size and numberof the surface features on the terrain over which a cloud passes. The size of the surface features relatesto the magnitude of ground roughness (in a complicated way), and when surface features are smaller, sois the ground roughness. For example, short grass may have a surface roughness of one centimeter andagricultural crops have a surface roughness of 20 centimeters. For gases that rise above the ground,surface roughness has limited effects. Alternatively, gas clouds that hug the ground will be more affectedby surface features. Generally, the larger the roughness, the faster the cloud is dispersed. However,there is some controversy among modelers about using very large surface roughness factors becausesome modelers assert that large structures could actually channel the cloud rather than dispersing it.Many modelers handle this issue by using a general “rule of thumb” for dense gases: surface roughnessfactors that represent a large fraction of the cloud height should not be used. For example, a tall buildingshould be considered an obstacle rather than a surface roughness element.
33
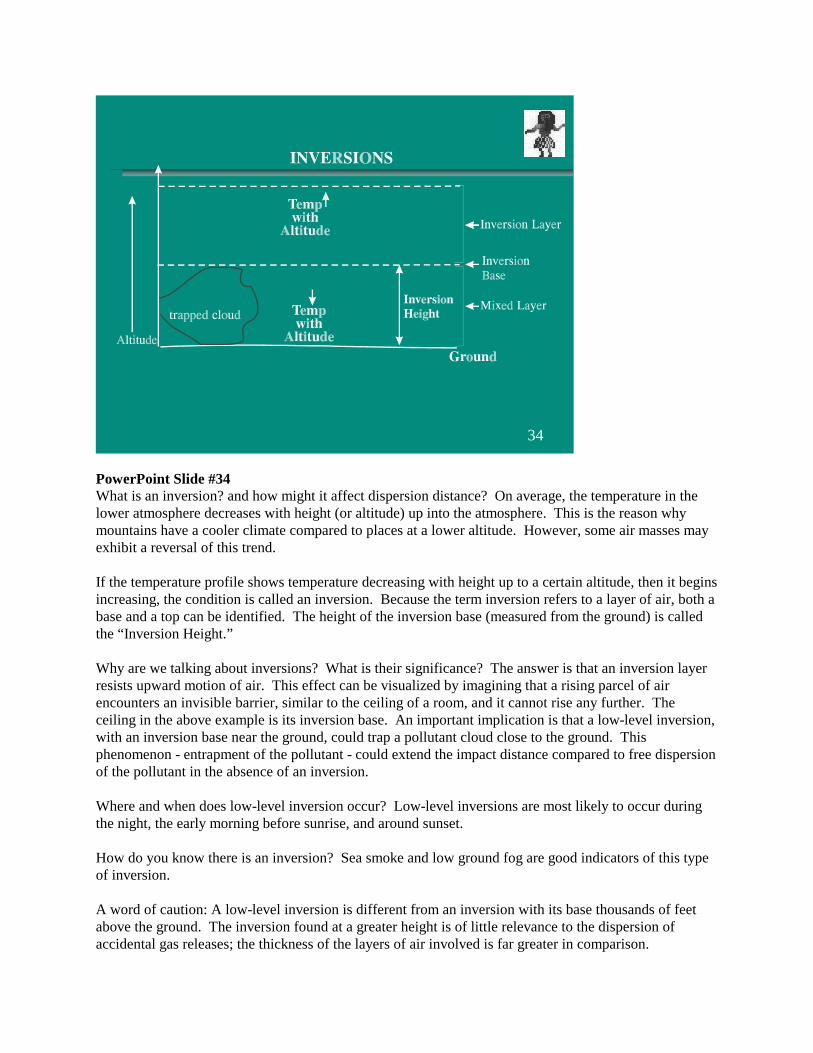
PowerPoint Slide #34What is an inversion? and how might it affect dispersion distance? On average, the temperature in thelower atmosphere decreases with height (or altitude) up into the atmosphere. This is the reason whymountains have a cooler climate compared to places at a lower altitude. However, some air masses mayexhibit a reversal of this trend.
If the temperature profile shows temperature decreasing with height up to a certain altitude, then it beginsincreasing, the condition is called an inversion. Because the term inversion refers to a layer of air, both abase and a top can be identified. The height of the inversion base (measured from the ground) is calledthe “Inversion Height.”
Why are we talking about inversions? What is their significance? The answer is that an inversion layerresists upward motion of air. This effect can be visualized by imagining that a rising parcel of airencounters an invisible barrier, similar to the ceiling of a room, and it cannot rise any further. Theceiling in the above example is its inversion base. An important implication is that a low-level inversion,with an inversion base near the ground, could trap a pollutant cloud close to the ground. Thisphenomenon - entrapment of the pollutant - could extend the impact distance compared to free dispersionof the pollutant in the absence of an inversion.
Where and when does low-level inversion occur? Low-level inversions are most likely to occur duringthe night, the early morning before sunrise, and around sunset.
How do you know there is an inversion? Sea smoke and low ground fog are good indicators of this typeof inversion.
A word of caution: A low-level inversion is different from an inversion with its base thousands of feetabove the ground. The inversion found at a greater height is of little relevance to the dispersion ofaccidental gas releases; the thickness of the layers of air involved is far greater in comparison.
34
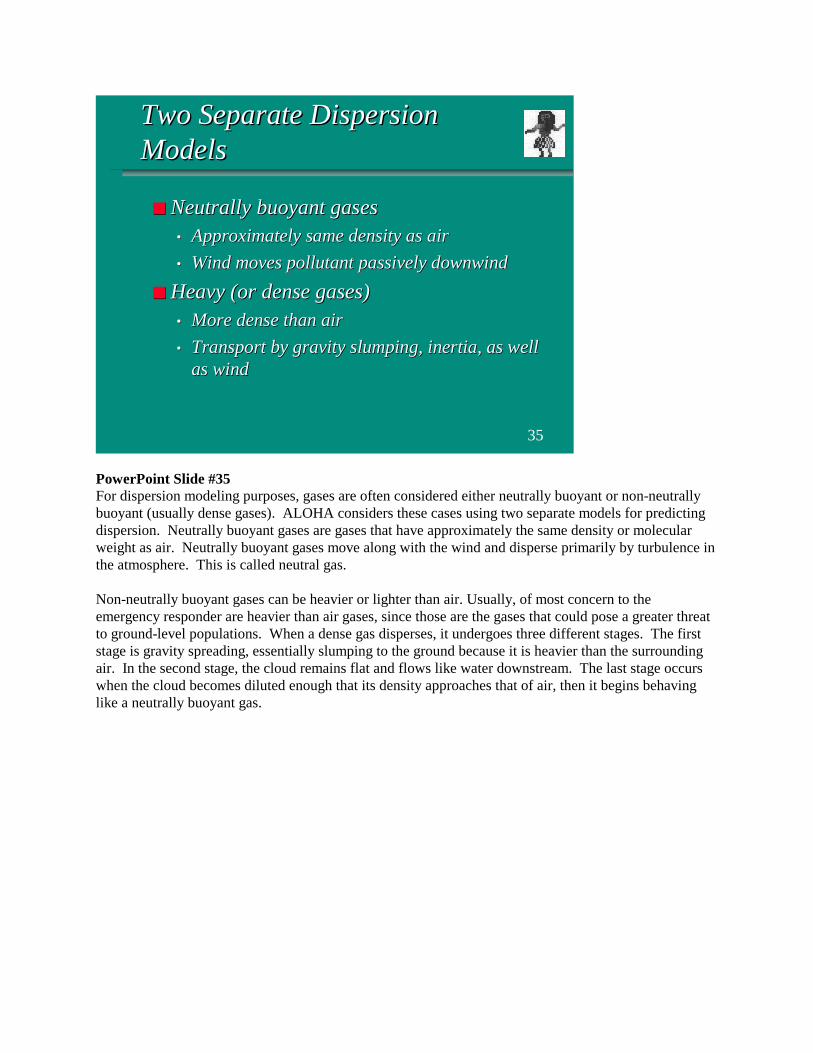
PowerPoint Slide #35For dispersion modeling purposes, gases are often considered either neutrally buoyant or non-neutrallybuoyant (usually dense gases). ALOHA considers these cases using two separate models for predictingdispersion. Neutrally buoyant gases are gases that have approximately the same density or molecularweight as air. Neutrally buoyant gases move along with the wind and disperse primarily by turbulence inthe atmosphere. This is called neutral gas.
Non-neutrally buoyant gases can be heavier or lighter than air. Usually, of most concern to theemergency responder are heavier than air gases, since those are the gases that could pose a greater threatto ground-level populations. When a dense gas disperses, it undergoes three different stages. The firststage is gravity spreading, essentially slumping to the ground because it is heavier than the surroundingair. In the second stage, the cloud remains flat and flows like water downstream. The last stage occurswhen the cloud becomes diluted enough that its density approaches that of air, then it begins behavinglike a neutrally buoyant gas.
35
Two Separate DispersionTwo Separate DispersionModelsModels
■■ Neutrally buoyant gasesNeutrally buoyant gases•• Approximately same density as airApproximately same density as air
•• Wind moves pollutant passively downwindWind moves pollutant passively downwind
■■ Heavy (or dense gases)Heavy (or dense gases)•• More dense than airMore dense than air
•• Transport by gravity slumping, inertia, as wellTransport by gravity slumping, inertia, as wellas windas wind
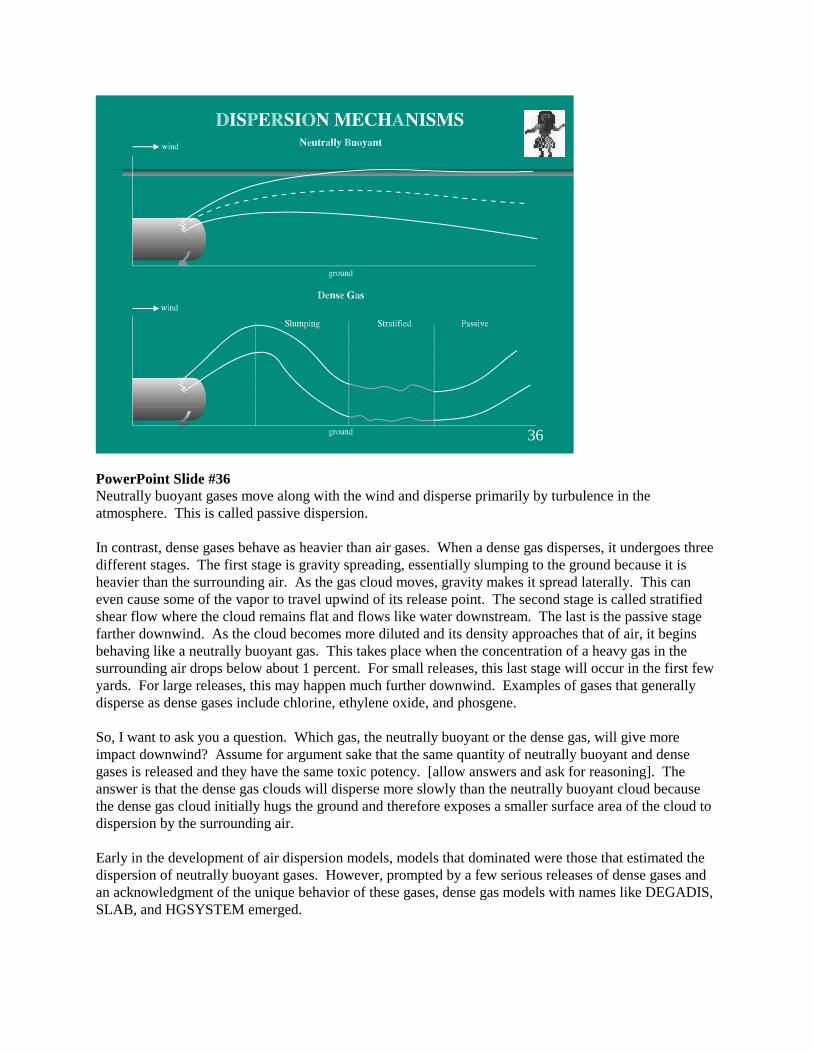
PowerPoint Slide #36Neutrally buoyant gases move along with the wind and disperse primarily by turbulence in theatmosphere. This is called passive dispersion.
In contrast, dense gases behave as heavier than air gases. When a dense gas disperses, it undergoes threedifferent stages. The first stage is gravity spreading, essentially slumping to the ground because it isheavier than the surrounding air. As the gas cloud moves, gravity makes it spread laterally. This caneven cause some of the vapor to travel upwind of its release point. The second stage is called stratifiedshear flow where the cloud remains flat and flows like water downstream. The last is the passive stagefarther downwind. As the cloud becomes more diluted and its density approaches that of air, it beginsbehaving like a neutrally buoyant gas. This takes place when the concentration of a heavy gas in thesurrounding air drops below about 1 percent. For small releases, this last stage will occur in the first fewyards. For large releases, this may happen much further downwind. Examples of gases that generallydisperse as dense gases include chlorine, ethylene oxide, and phosgene.
So, I want to ask you a question. Which gas, the neutrally buoyant or the dense gas, will give moreimpact downwind? Assume for argument sake that the same quantity of neutrally buoyant and densegases is released and they have the same toxic potency. [allow answers and ask for reasoning]. Theanswer is that the dense gas clouds will disperse more slowly than the neutrally buoyant cloud becausethe dense gas cloud initially hugs the ground and therefore exposes a smaller surface area of the cloud todispersion by the surrounding air.
Early in the development of air dispersion models, models that dominated were those that estimated thedispersion of neutrally buoyant gases. However, prompted by a few serious releases of dense gases andan acknowledgment of the unique behavior of these gases, dense gas models with names like DEGADIS,SLAB, and HGSYSTEM emerged.
36
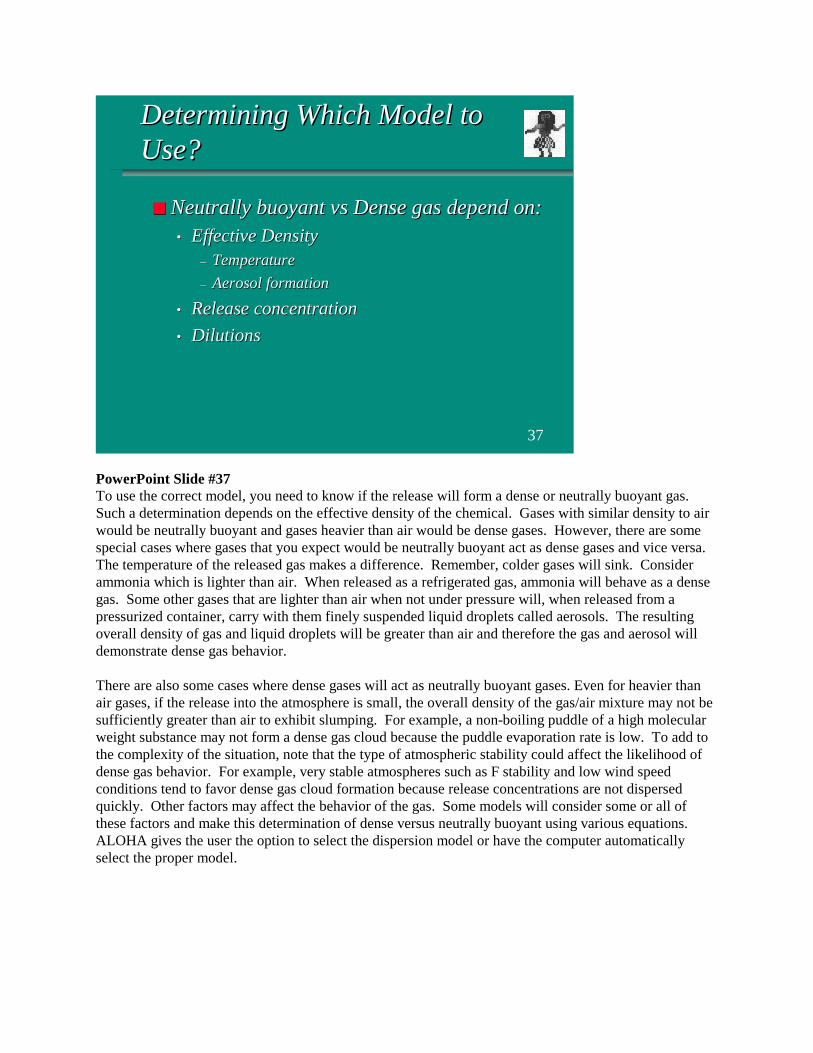
PowerPoint Slide #37To use the correct model, you need to know if the release will form a dense or neutrally buoyant gas.Such a determination depends on the effective density of the chemical. Gases with similar density to airwould be neutrally buoyant and gases heavier than air would be dense gases. However, there are somespecial cases where gases that you expect would be neutrally buoyant act as dense gases and vice versa.The temperature of the released gas makes a difference. Remember, colder gases will sink. Considerammonia which is lighter than air. When released as a refrigerated gas, ammonia will behave as a densegas. Some other gases that are lighter than air when not under pressure will, when released from apressurized container, carry with them finely suspended liquid droplets called aerosols. The resultingoverall density of gas and liquid droplets will be greater than air and therefore the gas and aerosol willdemonstrate dense gas behavior.
There are also some cases where dense gases will act as neutrally buoyant gases. Even for heavier thanair gases, if the release into the atmosphere is small, the overall density of the gas/air mixture may not besufficiently greater than air to exhibit slumping. For example, a non-boiling puddle of a high molecularweight substance may not form a dense gas cloud because the puddle evaporation rate is low. To add tothe complexity of the situation, note that the type of atmospheric stability could affect the likelihood ofdense gas behavior. For example, very stable atmospheres such as F stability and low wind speedconditions tend to favor dense gas cloud formation because release concentrations are not dispersedquickly. Other factors may affect the behavior of the gas. Some models will consider some or all ofthese factors and make this determination of dense versus neutrally buoyant using various equations.ALOHA gives the user the option to select the dispersion model or have the computer automaticallyselect the proper model.
37
Determining Which Model toDetermining Which Model toUse?Use?
■■ Neutrally buoyantNeutrally buoyant vs vs Dense gas depend on: Dense gas depend on:•• Effective DensityEffective Density
–– TemperatureTemperature
–– Aerosol formationAerosol formation
•• Release concentrationRelease concentration
•• DilutionsDilutions
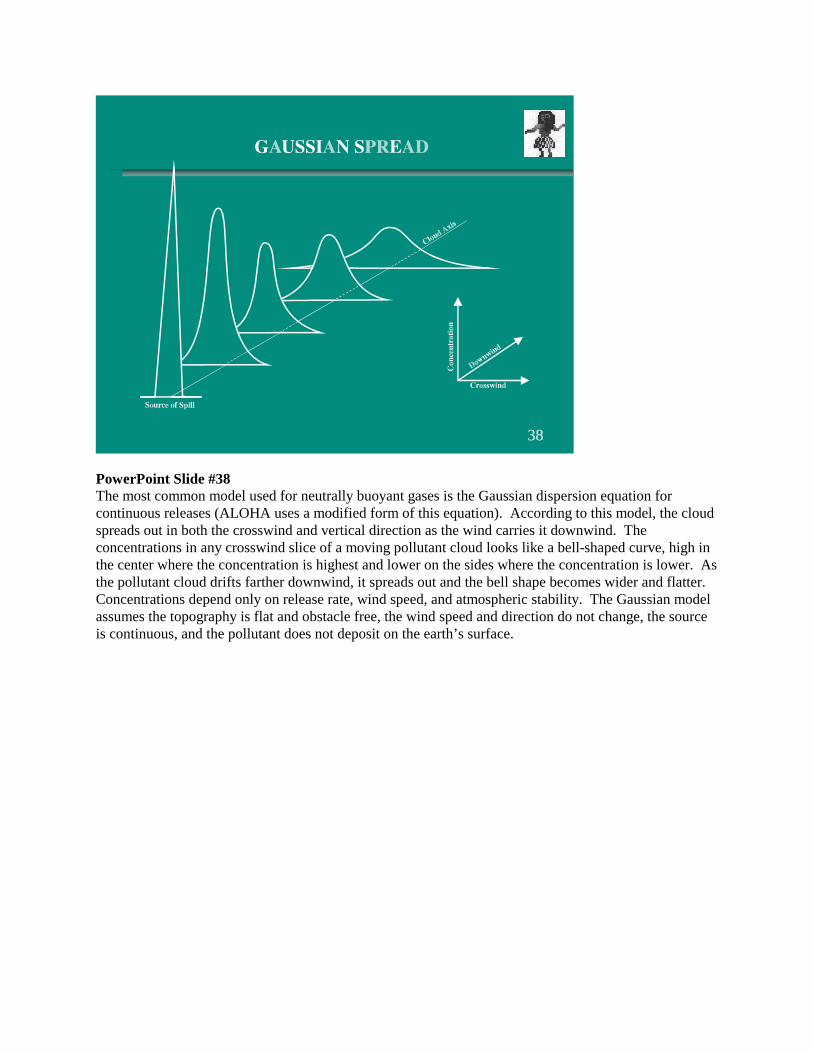
PowerPoint Slide #38The most common model used for neutrally buoyant gases is the Gaussian dispersion equation forcontinuous releases (ALOHA uses a modified form of this equation). According to this model, the cloudspreads out in both the crosswind and vertical direction as the wind carries it downwind. Theconcentrations in any crosswind slice of a moving pollutant cloud looks like a bell-shaped curve, high inthe center where the concentration is highest and lower on the sides where the concentration is lower. Asthe pollutant cloud drifts farther downwind, it spreads out and the bell shape becomes wider and flatter.Concentrations depend only on release rate, wind speed, and atmospheric stability. The Gaussian modelassumes the topography is flat and obstacle free, the wind speed and direction do not change, the sourceis continuous, and the pollutant does not deposit on the earth’s surface.
38

PowerPoint Slide #39There are many types of dense gas models available. Here is a listing of just a few. The ALOHA densegas model is based on the DEGADIS model. Remember that models have many uncertainties both in theequations and the inputs. For dense gas models, some uncertainties include the effects of large groundroughness, chemical reactivity, and deposition on the ground. In any case, dense gas models have gainedincreasing importance because dense gases tend to have higher concentrations downwind near groundlevel than neutrally buoyant clouds and therefore may pose a greater risk to human health.
39
Several Dense Gas ModelsSeveral Dense Gas Models
■■ DEGADISDEGADIS
■■ SLABSLAB
■■ HGSYSTEMHGSYSTEM
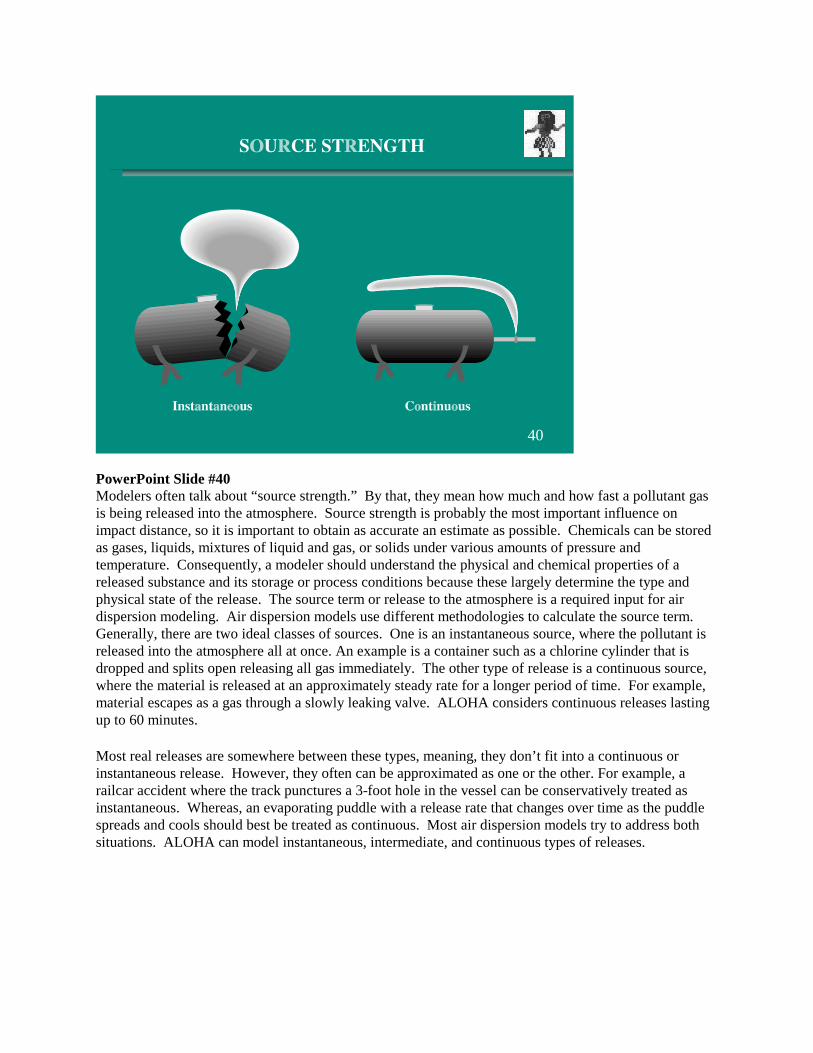
PowerPoint Slide #40Modelers often talk about “source strength.” By that, they mean how much and how fast a pollutant gasis being released into the atmosphere. Source strength is probably the most important influence onimpact distance, so it is important to obtain as accurate an estimate as possible. Chemicals can be storedas gases, liquids, mixtures of liquid and gas, or solids under various amounts of pressure andtemperature. Consequently, a modeler should understand the physical and chemical properties of areleased substance and its storage or process conditions because these largely determine the type andphysical state of the release. The source term or release to the atmosphere is a required input for airdispersion modeling. Air dispersion models use different methodologies to calculate the source term.Generally, there are two ideal classes of sources. One is an instantaneous source, where the pollutant isreleased into the atmosphere all at once. An example is a container such as a chlorine cylinder that isdropped and splits open releasing all gas immediately. The other type of release is a continuous source,where the material is released at an approximately steady rate for a longer period of time. For example,material escapes as a gas through a slowly leaking valve. ALOHA considers continuous releases lastingup to 60 minutes.
Most real releases are somewhere between these types, meaning, they don’t fit into a continuous orinstantaneous release. However, they often can be approximated as one or the other. For example, arailcar accident where the track punctures a 3-foot hole in the vessel can be conservatively treated asinstantaneous. Whereas, an evaporating puddle with a release rate that changes over time as the puddlespreads and cools should best be treated as continuous. Most air dispersion models try to address bothsituations. ALOHA can model instantaneous, intermediate, and continuous types of releases.
40

PowerPoint Slide #41A chemical can escape into the atmosphere in many ways. Most accidental releases begin as a rupture,puncture, or valve leak on a tank or pipe. A chemical may escape into the environment as a gas, liquid,or pressurized mixture of gas and liquid which will be discussed later. In what form it will escapedepends in large part on its boiling point and storage temperature. A gas will enter the atmosphereimmediately; a liquid will form a pool and will then enter the atmosphere by evaporation.
41
Source Strength (Continued)Source Strength (Continued)
■■ LiquidLiquid
■■ GasGas
■■ Gas/liquid mixture (two-phase)Gas/liquid mixture (two-phase)
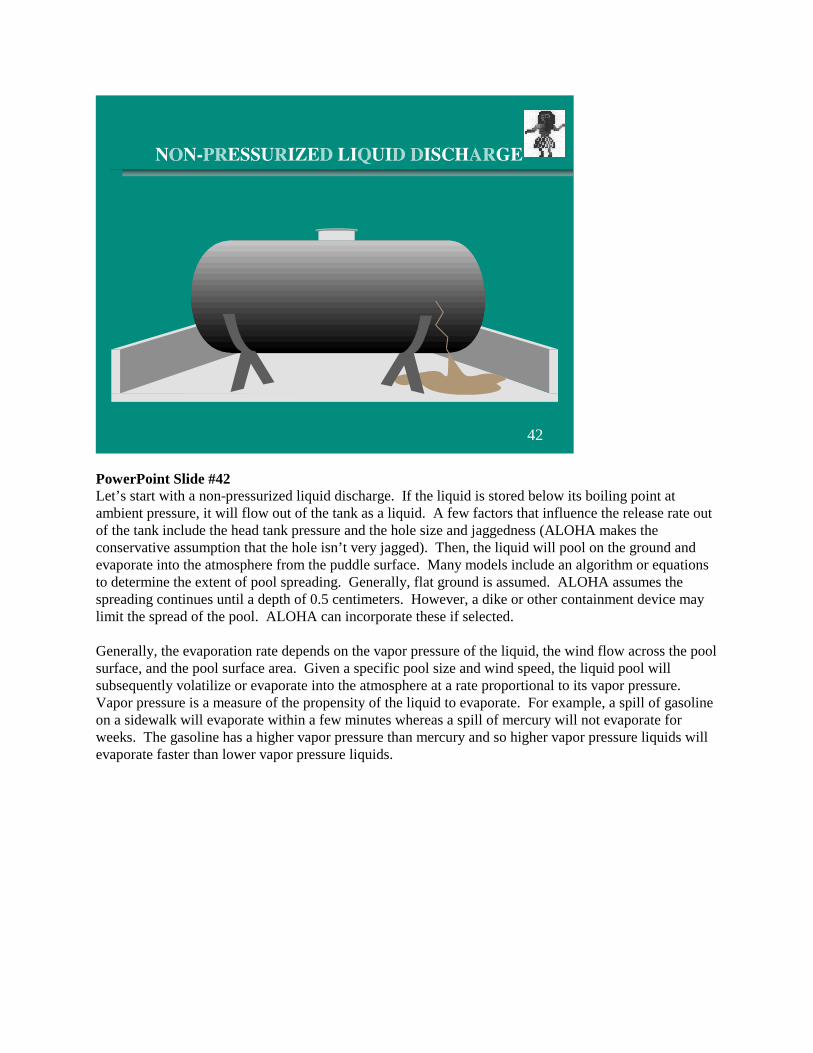
PowerPoint Slide #42Let’s start with a non-pressurized liquid discharge. If the liquid is stored below its boiling point atambient pressure, it will flow out of the tank as a liquid. A few factors that influence the release rate outof the tank include the head tank pressure and the hole size and jaggedness (ALOHA makes theconservative assumption that the hole isn’t very jagged). Then, the liquid will pool on the ground andevaporate into the atmosphere from the puddle surface. Many models include an algorithm or equationsto determine the extent of pool spreading. Generally, flat ground is assumed. ALOHA assumes thespreading continues until a depth of 0.5 centimeters. However, a dike or other containment device maylimit the spread of the pool. ALOHA can incorporate these if selected.
Generally, the evaporation rate depends on the vapor pressure of the liquid, the wind flow across the poolsurface, and the pool surface area. Given a specific pool size and wind speed, the liquid pool willsubsequently volatilize or evaporate into the atmosphere at a rate proportional to its vapor pressure.Vapor pressure is a measure of the propensity of the liquid to evaporate. For example, a spill of gasolineon a sidewalk will evaporate within a few minutes whereas a spill of mercury will not evaporate forweeks. The gasoline has a higher vapor pressure than mercury and so higher vapor pressure liquids willevaporate faster than lower vapor pressure liquids.
42
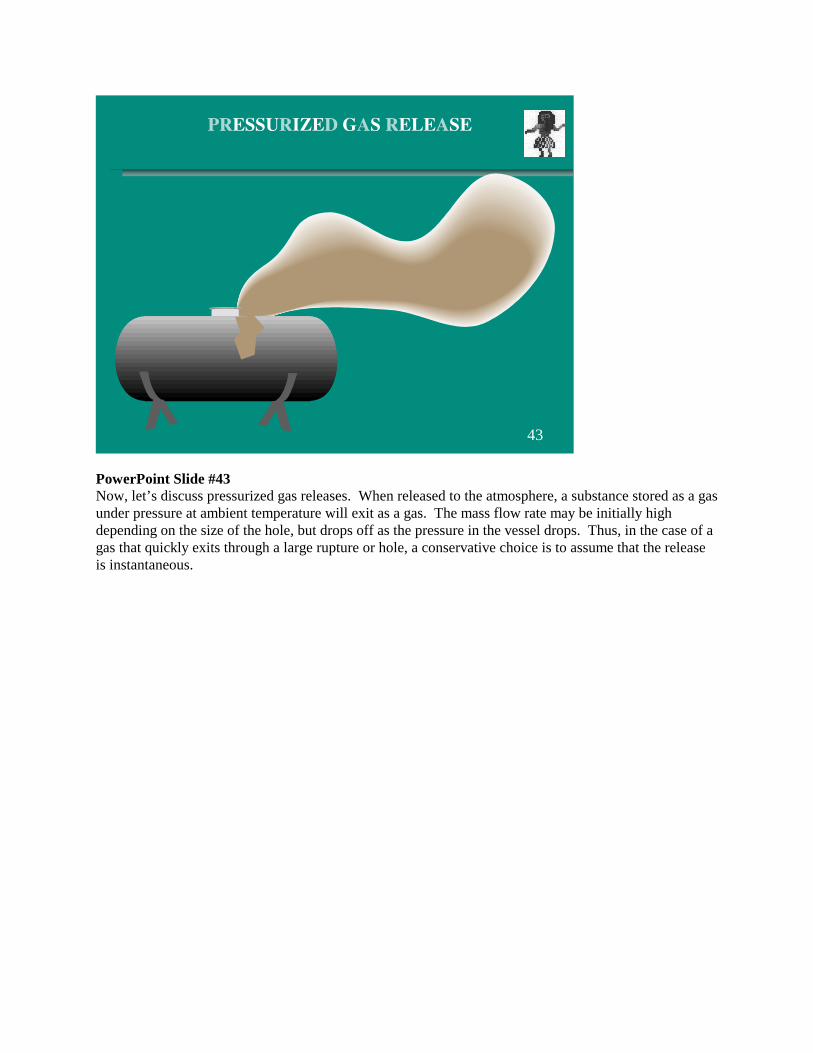
PowerPoint Slide #43Now, let’s discuss pressurized gas releases. When released to the atmosphere, a substance stored as a gasunder pressure at ambient temperature will exit as a gas. The mass flow rate may be initially highdepending on the size of the hole, but drops off as the pressure in the vessel drops. Thus, in the case of agas that quickly exits through a large rupture or hole, a conservative choice is to assume that the releaseis instantaneous.
43
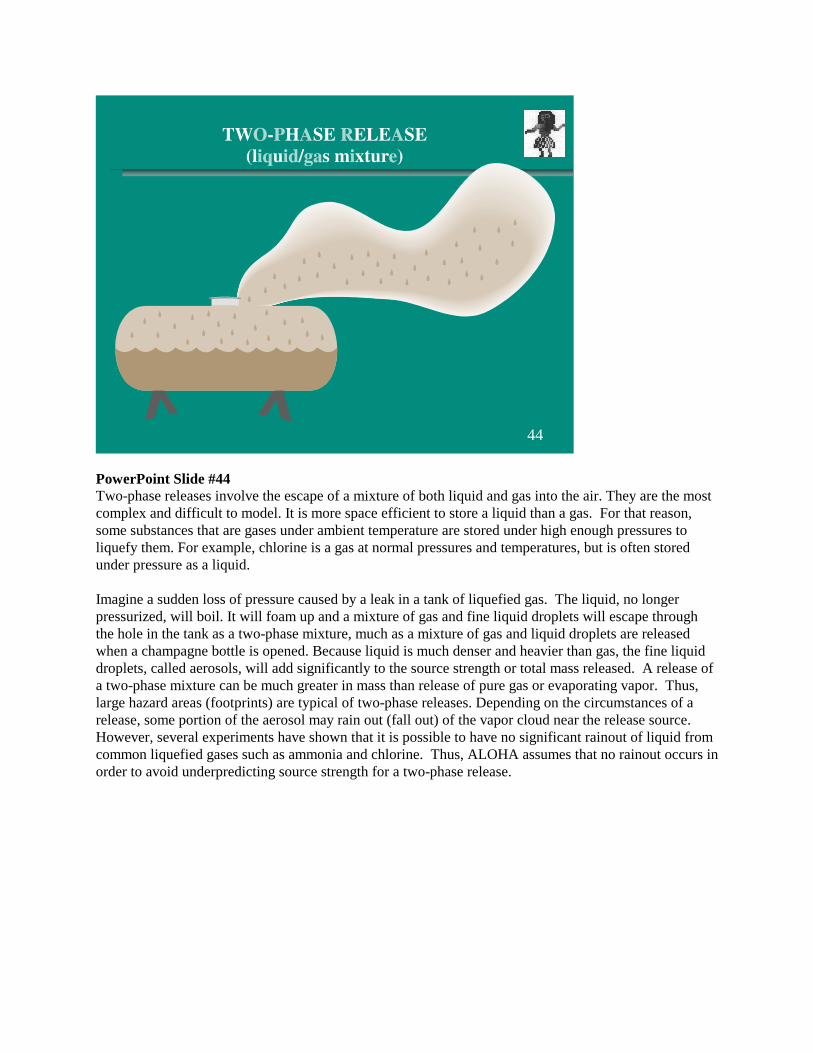
PowerPoint Slide #44Two-phase releases involve the escape of a mixture of both liquid and gas into the air. They are the mostcomplex and difficult to model. It is more space efficient to store a liquid than a gas. For that reason,some substances that are gases under ambient temperature are stored under high enough pressures toliquefy them. For example, chlorine is a gas at normal pressures and temperatures, but is often storedunder pressure as a liquid.
Imagine a sudden loss of pressure caused by a leak in a tank of liquefied gas. The liquid, no longerpressurized, will boil. It will foam up and a mixture of gas and fine liquid droplets will escape throughthe hole in the tank as a two-phase mixture, much as a mixture of gas and liquid droplets are releasedwhen a champagne bottle is opened. Because liquid is much denser and heavier than gas, the fine liquiddroplets, called aerosols, will add significantly to the source strength or total mass released. A release ofa two-phase mixture can be much greater in mass than release of pure gas or evaporating vapor. Thus,large hazard areas (footprints) are typical of two-phase releases. Depending on the circumstances of arelease, some portion of the aerosol may rain out (fall out) of the vapor cloud near the release source.However, several experiments have shown that it is possible to have no significant rainout of liquid fromcommon liquefied gases such as ammonia and chlorine. Thus, ALOHA assumes that no rainout occurs inorder to avoid underpredicting source strength for a two-phase release.
44

PowerPoint Slide #45The primary hazard to people from accidental releases of many toxic substances comes from inhalingtoxic gas. To predict the severity of potential health effects associated with inhalation of a gas, you needto know the concentration of the chemical in the air and, usually, the amount of time an individual isexposed. A level of concern (LOC) is the concentration and usually contact duration predicted to resultin a particular health impact. LOC values are chemical-specific. To perform air dispersion modeling, alevel of concern is needed as model input to generate areas where people may be at risk. There are manylevels of concern. Here are a few. The IDLH is immediately dangerous to life and health; at one time,the IDLH contact duration was defined as 30 minutes, but contact duration is no longer part of thedefinition of this LOC. ERPG is Emergency Response Planning Guideline and a one-hour contactduration.
45
Level of ConcernLevel of Concern
■■ Many Levels of Concern Many Levels of Concern ChemicalChemical IDLH*IDLH* ERPG-3* ERPG-3* PhosgenePhosgene 22 ppm ppm 11 ppm ppm ChlorineChlorine 1010 ppm ppm 5050 ppm ppm AmmoniaAmmonia 300300 ppm ppm 10001000 ppm ppm * IDLH has no contact duration, ERPG-3 has a 60-minute* IDLH has no contact duration, ERPG-3 has a 60-minutedurationduration
■■ DoseDose•• Incorporates concentration and exposure timeIncorporates concentration and exposure time

PowerPoint Slide #46The inputs that most influence footprint size are: source strength, wind speed, atmospheric stability, levelof concern, and whether the released chemical is a dense or neutrally buoyant gas. Thus, these should bewell defined to improve the accuracy of the results. Also, when interpreting modeling results, becautious. First, make sure that you are appropriately using the model for the type of release. Becomefamiliar with the limitations in using the model. Check and recheck your input values. Recognize thesemany uncertainties in the models and the inputs and the LOC that you choose. Before focusing on oneresult from one set of assumptions, try varying the inputs to see how sensitive the results are touncertainties in your inputs. Also, make use of your increased knowledge and intuition about modelingto evaluate the reasonableness of your results.
46
Interpreting ResultsInterpreting Results
■■ Greatest InfluenceGreatest Influence•• Source strengthSource strength
•• Atmosphere stabilityAtmosphere stability
•• Level of concernLevel of concern
•• Type of chemicalType of chemical
■■ Recognize limitationsRecognize limitations
■■ Evaluate uncertainties in inputs and outputsEvaluate uncertainties in inputs and outputs
■■ Check reasonability of resultsCheck reasonability of results
Script Notes for Session V
Day 1
V. ALOHA File, Edit, and Site Data Selection Menu (11:40-12:10 p.m.)
Learning Objectives: Instructor demonstrates and students follow to learn about program icon, startupscreen, help, file, and edit menu. Students will also gain a perspective on the relevant modeling issuesregarding location, building type, and release date/time selections.• Have students turn on machine and open ALOHA folder• Discuss program icon• Double Click on ALOHA icon• Mention start-up screen and limitations, which will be explained more tomorrow
- Low wind- Stable atmosphere- Wind shifts- Concentration patchiness- Fires- Particulates- Topography
• Discuss briefly file and edit menu• Click on file and edit• Discuss existence of text summary and built in ALOHA warnings and cautions• Site Data menu - Click on Site Data menu and note submenus• Location Submenu
- Location and why important (show affect of different locations)- Selecting a location- Click on site data menu and choose location- Search and click on Seattle- Adding a U.S. city- Click add and enter Gotham City- Add lattitude 40 26.4’N, longitude 74 7.2’W, 0 feet elevation, and state of New York- Adding a location outside the U.S.- Click on non-U.S. city
- Enter Dublin, Ireland, 0 feet elevation, 53 20’N, 6 15’W, difference from GreenwichMean Time of 0, and no daylight savings time- Click OK and then Select to add this location- Mention about permanently adding/modifying
• Building Type Submenu - Click on Site Data then select Building Type - Select single storied and discuss unsheltered vs. sheltered surroundings - Select unsheltered surroundings• Date & Time Submenu - Select Data & Time from Site Data menu
- Explain internal clock and constant time - Enter March 17, 1995 at 10:45 am - Enter 2500 hours and see what ALOHA does

• Student Hands on Work - Read and enter scenarioLUNCH BREAK (12:10-1:00 p.m.)
Detailed Script for Session V
Day 1
V. Program Icon (1), Startup (2), File and Edit (3), & Site Data Menu (4) (11:40-12:10p.m.)
During this session, instructor covers startup, file, edit, and site-selection menu.
Have students turn on machine and stop after opening ALOHA folder; make sure everyone isthere.
1) Program icons
You will notice several program icons including ALOHA and CHEMMANAGER. We will eventuallydiscuss briefly all of them, but for now
together please double click on the ALOHA icon.
2) Start-up screen/Limitations
Now you will see the start-up screen. ALOHA cannot be more accurate than the information you give itto work with. But even when you provide the best input values possible, ALOHA, like other models, canbe unreliable in certain situations, and it cannot model some types of releases at all.
ALOHA's results can be unreliable when the following conditions exist:
• very low wind speeds• very stable atmospheric conditions• wind shifts and terrain steering effects• concentration patchiness, particularly near the spill source
ALOHA also doesn’t account for the effects of:
• fires or chemical reactions• particulates• topography
We will discuss each of these in more detail tomorrow.
Help. Before we click OK note the Help button. Extensive help is provided via help buttons on many ofALOHA’s screens. Please make use of them when using ALOHA. The help screens will remind youabout the points mentioned in this training.
Important Instructions for Afternoon. For the remainder of this afternoon, I will first demonstrate andexplain the features of ALOHA by going through the menus. After each main menu item, you will havea chance to work with the ALOHA program to build a scenario. But for right now, follow along with myALOHA demonstration so you won’t miss anything.
3) File and Edit
The first menu is File and the second menu is Edit.click on file
ALOHA output can be saved as a file and printed.
click on edit
The only command you can choose from the Edit menu is Copy. To copy text or pictures from anALOHA screen, select the items, then choose Copy. You can then paste the copied material into adocument in another application (such as a word-processing or graphics application).
Now, let us go to the data entry screens. to build a scenario, work left-to-right through the remainingmenus in ALOHA's menu bar. As you work, all of the data inputs and outputs for running an ALOHAscenario will be displayed in a text summary screen. Also, note that ALOHA will provide variouscaution, warning and stop messages to help you choose inputs and avoid errors. ALOHA providesdifferent levels of warning. Some are information whereas others stop the process until other inputs arepicked. For example, ALOHA has built in limits on some input parameters such as wind speed.
4) Site Data menu
click on the site data menu
Note that site data menu has three submenus, location, building type, and time and date.
(4a) Location Submenu Now, we choose a location or city and state for the release. Why choose alocation? ALOHA uses the latitude, longitude, elevation, and time zone of the location of a chemicalrelease to estimate the sun angle and atmospheric pressure. ALOHA uses the sun angle to estimate solarenergy coming into a puddle. The more energy coming in, the higher the evaporation rate. Theatmospheric pressure, which is determined by the elevation, will also influence the evaporation rate of apuddle and the dispersion of a gas cloud. The location information, for many cities where ALOHA usersreside, is already included in ALOHA's location library, CityLib.
(instructor demonstrate)1) To select a location, choose Location... from the Site Data menu.2) Scroll through the list of cities. To speed your search, type the first one to several letters of
the city name. For example, if I want Seattle, Washington, I begin to type SEAT quickly untilSeattle Washington appears.
3) Then, click on the city name to highlight it, then click Select.
You can easily add descriptions of other locations that are not in ALOHA’s location library. You canadd both U.S. and non-U.S. locations. Later we will add a U.S. location.
(4b) Building type Submenu. The second menu item under Site Data is building type. Why doesbuilding type matter in a dispersion analysis? Maybe for emergency response purposes, you would liketo know if the released chemical will infiltrate buildings that are in the release path and, if so, what theconcentrations could be inside those buildings. Indoor infiltration is a function of leakiness of thebuilding, the difference between outdoor and indoor temperatures, wind speed, and whether the building
is sheltered or unsheltered. ALOHA uses this information to predict indoor infiltration rate and toestimate indoor concentrations at any building locations that you specify (it can also predict dose, if youcan provide some toxicological information about the chemical of concern). ALOHA assumes buildingsare as leaky as typical North American buildings and also that ALL DOORS AND WINDOWS ARECLOSED. This will not be a conservative assumption on hot summer days. If building doors andwindows are open, ALOHA will likely underpredict indoor concentrations.
You can specify either the type of building that is (1) most common or (2) of most concern to you in thearea downwind of a chemical release.
(instructor demonstrate and students follow)1) For this example, assume the building of interest is a single-story school. Click on single
storied. If you select a single storied or double storied building, you'll also need to indicatewhether these buildings are in generally sheltered or unsheltered surroundings.
2) If buildings are surrounded by tall obstacles to wind flow, such as other buildings or trees,select Sheltered Surroundings. If there are no large obstacles, so that the wind blows directlyonto buildings, select Unsheltered Surroundings.
3) Select unsheltered and click ok.
As an alternative to choosing a building type, you could type in an air exchange rate that is typical ofbuildings in that area. An air exchange rate is expressed as the number of air changes per hour.
(4c) Date and time Submenu - Use this third menu option under Site Data to specify the date and timefor ALOHA to use as the starting time of your scenario. What is so important about the time? Thestarting time of a scenario affects ALOHA calculations in two ways: (1) ALOHA uses the scenario starttime to determine whether it is night or day when choosing a stability class; (2) ALOHA uses the positionof the sun at the scenario start time to compute incoming solar radiation. Solar radiation can be animportant influence on puddle evaporation.
You may choose either to enter a specific time, or to have ALOHA take the time from your computer'sinternal clock. Use a computer clock (as long as it is set right for the area) if you are modeling a realtime release but be sure to set the incident TO THE LOCAL TIME where a release has occurred. Forexample, if you are running ALOHA for a real time incident in Miami but you are in Seattle, you shouldset the time to the current Miami time. Use a constant time option if you are comparing various scenariosfor planning purposes or when reviewing a past incident.
Instructor demonstrate and students follow -1) From the Site Data menu, select Date & Time, click either:(a) Use Internal Clock - to use
your computer's internal clock (this is ALOHA's default option) or...(b) Set Constant Time -to set a specific time.
2) For constant time, type in the month, day, year, hour, and minute. ALOHA uses the 24-hourtime system, in which time of day is indicated by four digits, the first two indicating the hour(00 to 23) and the last two indicating the number of minutes past that hour (00 to 59). Underthis system, 6:00 a.m. is 0600, and 2:30 p.m. is 1430. Enter March 17, 1995 at 10:45 am.
3) What happens if you enter 2500 hours? Enter 2500 and note that ALOHA says to stopbecause inappropriate entry.
Student Hands on Work

Instructor should now show slide entitled ‘Hands on Exercise (Site Data menu) and tell students to enterdata, following along with the instructor.
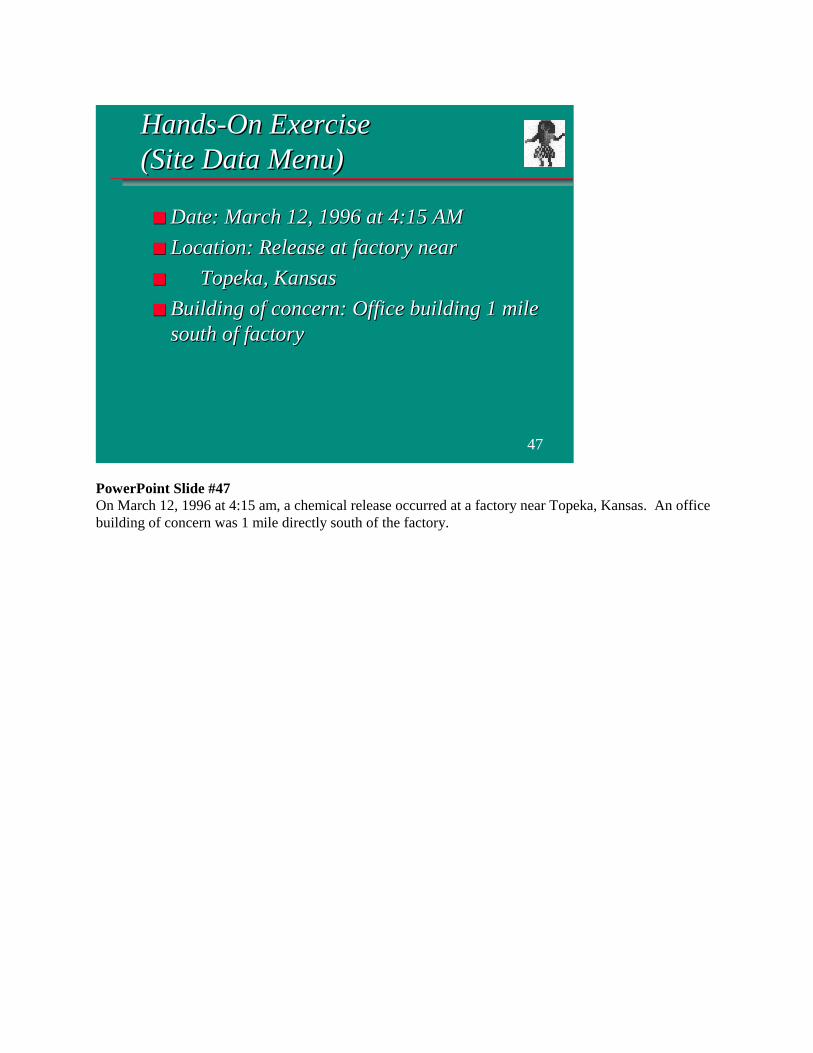
PowerPoint Slide #47On March 12, 1996 at 4:15 am, a chemical release occurred at a factory near Topeka, Kansas. An officebuilding of concern was 1 mile directly south of the factory.
47
Hands-On ExerciseHands-On Exercise(Site Data Menu)(Site Data Menu)
■■ Date: March 12, 1996 at 4:15 AMDate: March 12, 1996 at 4:15 AM
■■ Location: Release at factory nearLocation: Release at factory near
■■ Topeka, KansasTopeka, Kansas
■■ Building of concern: Office building 1 mileBuilding of concern: Office building 1 milesouth of factorysouth of factory
Let’s enter this information together. First, click on the ALOHA icon. Review the limitations screen,then click OK. (Wait until everyone is there) Now let’s enter these data at the site data menu. (Walkthrough data entry).
After exercise, add U.S. location with students following.
Add U.S. Location (instructor demonstrate)1) To add a U.S. City, choose location from the Site Data menu.2) Click on Add to add a location.3) Then, enter the location name, latitude and longitude, and elevation. Location name can
contain up to 26 characters. ALOHA accepts a range of elevations from Mt. Everest to theDead Sea. Latitudes must be between 0 degrees and 90 degrees; longitudes must be between0 degrees and 180 degrees.
(Instructor demonstrate only)1) As an example, I am entering Gotham City. Be as accurate as you can when entering
elevation, latitude, and longitude. In this case, enter latitude of 40 26.4’N, longitude 747.2’W, and 0 feet elevation.
2) Then, click on the name of its state or territory in the scrolling list. To quicken the search,you can click anywhere within the list, and then type the first letter of the state. In this case,select New York.
3) Click OK. For states in multiple time zones, such as Indiana, you will be prompted to choosethe appropriate time zone. You may also be asked to indicate whether to use standard timeor daylight savings time for the location.Add non-U.S. location only if time permits, as follows:
Add a non-U.S. location to the library (Instructor demonstrate only)1) To add a non-U.S. location, select non-U.S. city. Enter the country name as well as the
altitude and longitude/latitude. For example, I will enter Dublin, an altitude of 100 feet, 5320’N, 6 15’W.
2) You also need to enter the country and the number of hours that local standard time at thelocation differs from Greenwich Mean Time. This time offset value should be positive if thelocation is in the western hemisphere like North and South America, and negative if it's inthe eastern hemisphere, like Europe, Africa, and Asia. For Ireland, the difference fromGreenwich Mean Time is zero.
3) You will also need to click the appropriate button to indicate whether standard or daylightsavings time is currently in effect at this location. Ireland does not observe daylight savingstime so click standard.
4) Once you have entered all necessary information about your new location, click OK.5) Click Select to add the location to the library.6) Click Cancel ONLY if you decide not to add the location to the library.
Script Notes for Session VI
Day 1
VI. ALOHA Setup Menu: Chemical and Atmospheric Submenus (1:00-2:00 p.m.)
Learning Objectives: Students will learn the relevant modeling issues regarding chemical and weatherselection so they can use and run the model properly.• Show both submenus from the SetUp menu and click on chemical to show list of chemicals• Chemical Selection
- Chemical and why important (show effect of different chemicals)- Selecting a Chemical- While still in chemical list, type AMM to select ammonia- Chemical properties- Go back to chemical and select hydrogen fluoride- Click on modify to display its boiling point to indicate it would be a liquid- Adding a chemical- Select chemical from the SetUp menu and click on add- Enter name of nasty stuff and molecular weight of 100- Click on OK and show nasty stuff is in the chemical listHow to permanently add or modify a chemical to the library
• Atmospheric Selection - Click on atmospheric menu from the SetUp menu to show User Input/SAM option
- User Input- Click on user input- Wind speed, direction, and measurement height
- Type in 3 m/sec for wind speed and wind direction of NNE- Click on help to see that NNE is 22.5 degrees- Enter 3 meter measurement height
- Ground roughness- Discuss and click on any type
- Cloud cover- Click on 6 for a cloud cover of 6 tenths
- Air temperature- Enter 50oF
- Stability class- Discuss and click on A or B
- Inversion height- Click no inversion height
- Humidity- Enter medium humidity and review inputs
- SAM input, explain but don’t work through• Student Hands on Work
- Read and enter scenario
BREAK (2:00 - 2:15 p.m.)

Detailed Script for Session VI
Day 1
Session VI. SetUp Menu: Chemical (1) And Atmospheric (2) Submenus (1:00 - 2:00 p.m.)
During this session, instructor covers the chemical and atmospheric submenus.
Instructor1) show 1st and 2nd submenus in SetUp menu2) click on chemical and stop; you should see list of chemicals3) tell students they will get chance to enter information towards end of session
1) Chemical
Physical property and toxicological information for about 1000 pure chemicals are included inthe ALOHA chemical library, ChemLib. The chemicals in ALOHA are those that represent potential airhazard or not enough physical property data exist to estimate the air hazard. There may be more inCAMEO but they have been judged not to be a potential air hazard. ALOHA uses the information in thelibrary to predict how a particular chemical may escape from a container and disperse in the atmosphere.Again, we need to remember that the chemical library does not include chemical mixtures or solutions; italso does not contain chemicals that have very low toxicity and are not very volatile. As you can see,you also have the capability to add or delete chemicals from the library or to modify information aboutthe physical properties of any chemical. You can make either temporary or permanent changes to thelibrary.
1a) Choose chemical -
Instructor1) To choose a chemical from the SetUp menu, locate its name in the scrolling alphabetical
index of ALOHA chemicals. To navigate quickly through the index, type in the first one toseveral letters of the name, then scroll up or down until you see the name of the chemicalthat you wish to select.
2) For example, if I am looking for ammonia, I will first type AMM to get down to ammonia.3) Then, I can double-click on the name to select it. Alternatively, to select it, I could click once
on the name, then click Select.
1b) Physical Properties - Now let’s take a look at physical property data for the chemicals.
Instructor Demonstrate:1) Go back to chemical2) Click on modify to get to the property data. Many properties are listed. You can click on the
name of the property and have the value displayed with units.
The values were obtained from two sources: one is called DIPPR (Design Institute of Physical properties)database and the other is the chemical database in the CAMEO system. The properties determinewhether the released substance will be a gas, liquid, or combination. For example, let’s say the outsidetemperature is 50oF or approximately 283 Kelvin. The boiling point of ammonia is far below thistemperature so ammonia would be a gas. If we picked hydrogen fluoride, move to hydrogen fluoride and
click on modif y its boiling point is 292 Kelvin, which is above 283 Kelvin so hydrogen fluoride wouldbe a liquid under these conditions.
Another important property that we will talk about later is IDLH (Immediately Dangerous to Life orHealth). This is a level of concern representing an exposure to airborne contaminants that is likely tocause death or immediate or delayed permanent adverse health effects or prevent escape from such anenvironment. For hydrogen fluoride, the IDLH is 30 parts per million. ALOHA’s footprint representsthe zone where the ground-level pollutant concentration may exceed a specified level of concern; youmight choose to use the IDLH for a chemical as your level of concern.
Now lets add a chemical temporarily to the ALOHA chemical database.
1c) Add -
Instructor demonstrates only:1) To temporarily add a chemical to the library, click Add2) Enter the chemical's name and molecular weight. I add nasty stuff with a molecular weight of
100
As shown in your ALOHA manual, depending on the type of scenario that you wish to run, you may alsoneed to enter particular physical properties. How do you know which data are needed to run thescenario? The manual has a chart that tells you and selecting help in ALOHA also provides the datarequirements. For instance, chemical name and molecular weight are sufficient to run a release whereyou know the release rate to air and you can use the Gaussian model. You will need additional values forother chemical properties to calculate release rates from Tank, Puddle, or Pipe or to run a dense gasdispersion. If you try to run a scenario, like a pipe scenario without the needed property information,ALOHA will display a note indicating that not enough chemical information is available.
click ok and nasty stuff is in the chemical list
1d) Permanent Change - Note that the changes discussed thus far will not be saved permanently inALOHA’s library. In other words, once you quit from ALOHA, the changes will be gone. Topermanently add, modify or delete chemicals in the ALOHA chemical library, ChemLib, you need to useanother program called ChemManager, which is outside of the ALOHA program. To use ChemManager,you must quit from ALOHA and double-click the ChemManager program icon. Because the changes youmake with ChemManager are permanent, be sure to use care. You also may wish to back up your copy ofChemLib before you begin.
I will not demonstrate how to make permanent changes, but the way to modify or add a chemical issimilar to the way we did it a couple of minutes ago. The minimum information that you'll need topermanently add a chemical to the library is its chemical name and molecular weight.
2) Atmospheric
The next SetUp menu is atmospheric conditions.
Instructor demonstrates:1) Click on atmospheric menu, to show User Input/SAM option
In selecting atmospheric, you can enter information about current weather conditions into ALOHA eithermanually by typing in values for wind speed, air temperature, and other weather factors, or by connectingyour computer to a portable meteorological station, called a Station for Atmospheric Measurement orSAM.
ALOHA uses the information that you enter to account for the main processes that move and disperse apollutant cloud with the atmosphere. Let’s start with the user inputs and come back to SAM option.
2a) User Input.
click on user input
The first of two user input screens asks for an assortment of information including wind speed, winddirection, ground roughness, and cloud cover.
Wind Speed and Direction - ALOHA needs to know the wind speed and direction as well as the heightat which the wind speed and direction are measured. The wind direction determines what way apollutant cloud will drift. The wind speed is important because it strongly affects both how fast the cloudwill travel downwind as well as the shape of the cloud. ALOHA assumes that both wind speed anddirection are CONSTANT throughout the area downwind of a chemical release. For this reason, usevalues that BEST REPRESENT CONDITIONS throughout this area.
Instructor:1) Type in 3 meters/second for wind speed. Be sure to select appropriate units.
In the ALOHA manual or from the Help menu, you can check the "Estimating Wind Speed" section tosee a table showing how to estimate wind speed from visual cues. For example, rustling leaves canindicate windspeeds of 1 to 2 meters per second.
2) Next, type in the wind direction.
This is the direction FROM which the wind is blowing. You can enter this information in either units ofdegrees true, or in one- to three-letter directional terms. For example, you can indicate that the wind isblowing from the north-northeast by entering NNE. This is equivalent to 22.5 degrees. If you were notsure what degree pertains to what direction, you could click on help to get your answer.
click on help. See NNE is 22.5 degrees.
Wind Speed Height - ALOHA also needs to know the approximate height at which the wind speed anddirection are being measured, because it accounts for the way in which wind speed changes with height.Remember close to the ground, friction slows the wind. At higher elevations, the wind speed is faster.You have three options to indicate height:
Instructor:1) Enter one of the three options for wind height. (i) The leftmost height choice is 3 meters,
which is typical of a portable meteorological station. This is also ALOHA's defaultmeasurement height. (ii) The middle option is 10 meters, which represents the typical windspeed height used by many fixed weather stations. (iii) The rightmost option is provided ifyou know the height that your wind speed value is being measured at.
2) Enter a 3 meter wind speed height. In ALOHA, wind speed must be greater than 1 meter persecond at a reference height of 10 meters. Remember the limitation that ALOHA cannotmodel dispersion in very low wind speeds.
Ground Roughness - Before ALOHA can make footprint computations, you must indicate the roughnessof the ground downwind of a release. Ground roughness can have an influence on footprint size. Whenall else is equal, rougher ground leads to more mixing and more dispersion. A footprint will beLARGER when you choose a SMALLER ground roughness value.
Choose either of two roughness classes to characterize the area downwind of a release, -- Open Country;or Urban or Forest. Alternatively, you can enter your own value for "roughness length" used bymeteorologists to describe ground roughness.
Examples of locations that would be classified as Urban or Forest include areas having many friction-generating "roughness elements", such as trees or small buildings. Open Country locations wouldinclude small obstacles, or few roughness elements in the area such as open fields or parking lots.
Choose the dominant category of ground roughness in the area where the pollutant cloud may travel. Forexample, if 70% of the area is urban or forest and 30% is open country, click Urban or Forest. If youcan't easily determine the dominant category, run ALOHA once with each category selected to get anidea of the possible range in footprint size. If a roughness element (e.g., a tall building) is very largerelative to the pollutant cloud, it may be an obstacle that diverts a pollutant cloud rather than a roughnesselement that generates turbulence. For example, in a downtown area on a Sunday morning with no carson the streets, the best choice for a small release may be Open Country. In this case, the buildings areobstacles and the street is the "roughness" the pollutant cloud will experience.
If you prefer to type in a value for roughness length, you may wish to refer to the roughness length tablein the ALOHA manual, which was also discussed in the air dispersion mini course. The standard unit forroughness is in centimeters, but you can enter it also in inches.
Cloud Cover - ALOHA needs a value for cloud cover, the proportion of the sky that is covered byclouds, in order to estimate the amount of incoming solar radiation at the time of an accidental release.Solar radiation is an important influence on puddle evaporation rate because heat from the sun can warma puddle and speed up evaporation. Also, cloud cover affects atmospheric stability. In the U. S., cloudcover is usually measured in tenths: when the sky is completely covered by clouds, cloud cover is 10tenths; when half the sky is covered by clouds, it is 5 tenths; when the sky is completely clear, it is 0tenths.
Instructor demonstrate:1) Enter cloud cover in either of two ways: (i) click one of the buttons corresponding to 0, 3, 5,
7, or 10 tenths; or (ii) type a whole number between 0 and 10 into the data field for cloudcover in tenths For example, type 6 if cloud cover is 6 tenths
2) Click OK
Air Temperature - On the second entry page, ALOHA asks for the air temperature in the vicinity of theaccidental release. Air temperature does not influence dispersion, but influences ALOHA's estimate ofthe evaporation rate from a puddle surface. The higher the air temperature, the more the puddle iswarmed by the air above it, the higher the liquid's vapor pressure, and the faster the substance evaporates.
Air temperature is most significant in determining evaporation rate; to a much lesser extent it may be afactor in determining indoor infiltration rates. It is important to enter as accurate a temperature value aspossible.
Instructor demonstrates:1) Enter 50 in the air temperature data field, then select degrees Fahrenheit
Stability Class - Stability class has a big effect on ALOHA's prediction of footprint size. Once you haveentered values for time of day, wind speed, and cloud cover, ALOHA automatically identifies which ofsix possible atmospheric stability classes - A, B, C, D, E, or F - are appropriate for the time and weatherconditions that you indicate. Here the stability is C (assuming daytime, which hasn’t been specified).The labels and buttons for inappropriate stability classes appear grayed-out indicating that they areunavailable for selection. If more than one stability class is appropriate for the conditions that youindicate, ALOHA generally selects the most stable of these classes. For example, if either A or B areappropriate, ALOHA selects B. However, you can click A if you prefer to use this class.
You also can click Override to override ALOHA's stability class choices and choose any of the sixstability classes. You should do this, however, ONLY if you are sure that a special circumstance causesthe best choice for stability class to be different from the choice(s) made by ALOHA. For example, theatmosphere over a large body of water or a snow-covered landscape sometimes may be more stable thanwould be expected for a given combination of wind speed, cloud cover, and time of day. If you aremodeling a release over water, then, you sometimes might wish to choose a more stable class thanALOHA chooses for you. Also, E and F stability conditions normally exist only at night, but under someconditions may be appropriate choices for daytime stability class.
Inversion Height - Remember that an inversion is a phenomenon that could trap a pollutant cloud nearthe ground. Again, it is low-level inversions that are of concern in air modeling, not inversions that aremany hundreds, or thousands, of feet up. ALOHA's Gaussian dispersion model accounts for inversionsbecause the upward movement of the gas can be trapped in an inversion. ALOHA does not account forthe effects of an inversion when it models a dense gas release.
Instructor show inversion buttons on screen. click no inversion.
If an inversion is present, type in the height of the inversion layer and select appropriate units. If there isno inversion, be sure that No Inversion is selected. The height of the inversion layer must be greater than10 feet and no greater than 5,000 feet.
Humidity - ALOHA takes relative humidity into account when it estimates the rate of evaporation froma puddle and when it makes heavy gas dispersion computations. Considering the other meteorologicalinputs such as wind speed, humidity is not a critical input affecting the impact of the release. Relativehumidity is defined as the ratio of the amount of water vapor that the air contains to the maximumamount of water vapor that it could hold at the ambient temperature and pressure. Relative humidity isexpressed as a percentage. When relative humidity is 50%, the air contains one-half as much water vaporas it could potentially hold. The warmer the air, the greater its capacity to contain water vapor.Humidity affects the density of the air and therefore affects pool evaporation and the dispersion of densegases.
Instructor:
1) Enter a relative humidity value in either of two ways: (i) click the button that best representsyour relative humidity value; or (ii) enter the relative humidity (expressed as a percentage)in the humidity data field.
2) enter medium humidity3) Review inputs thus far in text summary screen
2b) SAM
click back to atmosphere and select SAM station
Now that we have completed both the user input weather screens, let’s look at the SAM weather dataoption. ALOHA can accept data from an external portable meteorological monitoring station, called aStation for Atmospheric Measurements (SAM). SAM data can be transmitted to ALOHA by either radiofrequency or a cable. ALOHA can use SAM measurements of wind speed and direction, standarddeviation of the wind direction (to derive stability class), and air temperature. A few companiesmanufacture SAMs specifically for use with ALOHA. A current vendor list is included in the studentpacket. You should check to make sure that any SAM you purchase transmits data in a format thatALOHA can accept. Check the section of the ALOHA manual on SAM stations to learn aboutALOHA’s requirements.
Instructor demonstrate:1) ALOHA will prompt you to check that your SAM is set up and connected to the computer
appropriately. Note ALOHA beeps with concern about release time (explain why happen)2) Screen prompt for more information but I am going to cancel and leave details to ALOHA
manual

Student Hands on WorkInstructor should now show slide entitled ‘Hands on Exercise (SetUp menu) and tell students to enter thedata as the instructor enters the data.
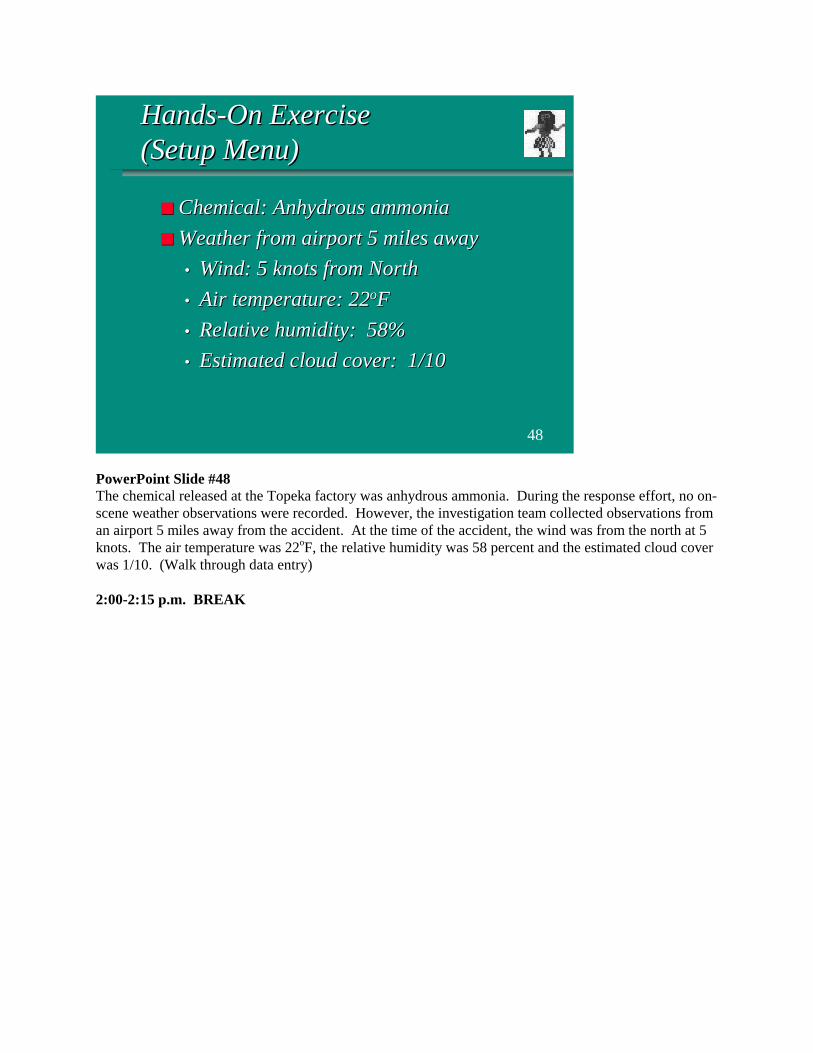
PowerPoint Slide #48The chemical released at the Topeka factory was anhydrous ammonia. During the response effort, no on-scene weather observations were recorded. However, the investigation team collected observations froman airport 5 miles away from the accident. At the time of the accident, the wind was from the north at 5knots. The air temperature was 22oF, the relative humidity was 58 percent and the estimated cloud coverwas 1/10. (Walk through data entry)
2:00-2:15 p.m. BREAK
48
Hands-On ExerciseHands-On Exercise(Setup Menu)(Setup Menu)
■■ Chemical: Anhydrous ammoniaChemical: Anhydrous ammonia
■■ Weather from airport 5 miles awayWeather from airport 5 miles away
•• Wind: 5 knots from NorthWind: 5 knots from North
•• Air temperature: 22Air temperature: 22ooFF
•• Relative humidity: 58%Relative humidity: 58%
•• Estimated cloud cover: 1/10Estimated cloud cover: 1/10
Script Notes for Session VII
Day 1
VII. ALOHA Setup Menu: Source Strength Submenu (2:15-3:30 p.m.)
Learning Objectives: Instructor demonstrates and students follow to learn about choosing a source.
Direct Source
• Describing a direct release- Select Source from the SetUp menu- Select Direct and click on Continuous Source- Enter 400 pounds/minute
• ALOHA’s duration limits- Select 30 minute duration
• Source height- Enter 2 meter source height
• Interpret an ALOHA footprint- From the Display menu, click on options to examine level of concern- From the Display menu, click on footprint to calculate distance
• Calculate Now• Student hands on work (slide)
Puddle
• Entering information about a puddle- From the SetUp menu, select chemical and choose hydrogen fluoride- From the SetUp menu, select source and then puddle- Enter puddle area of 1,000 square feet and an average depth of 0.5 centimenters- Enter default for soil type
• Weather impacts and watch for changing weather conditions- Enter ground temperature of 50oF- For puddle temperature, select equals ambient air temperature- Select options from the Display menu and note IDLH, then click on footprint
• Discuss footprint and note distance- Run concentration graph for 1 mile from release- Comment on graph
• Methyl chloride puddle- Click methyl chloride and puddle- Explain ALOHA warning
• Student hands on work (slide)
Script Notes for Session VII (Continued)
Tank
• Pressurized liquids and gases• Tank size and shape
- From the SetUp menu, choose source and then select tank- Choose tank type and enter dimensions
• Chemical state- Discuss the choices for this and the other selections that follow
• Tank storage temperature• Liquid in a tank• Gas in a tank• Hole in tank• Leak height on tank• Puddle formation• Student hands on work (slide)
Pipe
• Types- Choose infinite reservoir- Enter sample reservoir pressure- Select unknown temperature- For hole size, model assumes pipe sheared off so there is no need to enter value
Detailed Script for Session VII - 1st Day
Day 1
VII. SetUp Menu: Source Strength Submenu (2:15 - 3:30 p.m.)
Click on source
In an ALOHA scenario, the source is the vessel or pool releasing a hazardous chemical into theatmosphere, and the source strength is the rate of release of the chemical into the air. A chemical mayescape into the atmosphere very quickly, as when a pressurized container is ruptured, or more slowlyover a longer period of time, as when a puddle evaporates. ALOHA can model four types of sources.You need to choose direct, puddle, tank, or pipe sources. Choose direct when you know the rate at whicha pollutant gas is entering directly into the atmosphere as well as the duration of the release. Choosepuddle when the chemical has formed a liquid pool and is evaporating into the atmosphere. Choose tankwhen the chemical is escaping from a storage tank, either as a gas or as a pressurized or unpressurizedliquid. Choose pipe when the chemical is pressurized gas escaping from a ruptured gas pipeline. Duringthe session tommorrow, ALOHA’s Decision Keys will be shown to illustrate the selection process.
After choosing one of the options, you will be asked to enter information on a series of screens. Whatsort of information do you think you would need for the pipe release, a tank release, a puddle, direct?(Instructor: Get students to identify) Once you click OK on the last screen, ALOHA will make its sourcestrength calculations, and you’ll be returned to the Text Summary Screen. You will see the results of thesource calculations - predicted release duration, release rates, total amount released, and otherinformation - in the text summary.
ALOHA places minimum and maximum limits on the duration of any release. ALOHA expects a releaseto continue for at least 1 minute, and it estimates source strength (release rate) for no more than 1 hourafter a release begins. The reason for the 1-hour duration limit is that the wind is likely to change speedand switch directions during the release event. If you are responding to an incident, check whetherrelease conditions change substantially before an hour has passed and perhaps update the footprint withnew atmospheric and source information.
1) DirectThe direct source can be used if you know the amount of pollutant gas released directly into theatmosphere or if you have too little information about a release to use another source option but feel youcan make a ballpark estimate of the source strength. (slide on direct). The amount that enters theatmosphere directly as a gas may not equal the amount spilled; for example, if a hazardous liquid hasspilled, you will need to estimate its evaporation rate. When you use the Direct source option, you mustfirst select the units for the amount of pollutant gas entering the atmosphere. You can choose either mass(i.e., pounds or kilograms) or volume (i.e., gallons or cubic meters) units. For our scenario, let’s choosepounds.
1a) Continuous/Instantaneous Direct Release - When you choose the Direct source option, you mustspecify whether a chemical release is "continuous" or "instantaneous". A release is continuous when thechemical continues to escape for more than a minute or so (e.g., by evaporating from a puddle), andinstantaneous when the chemical escapes into the atmosphere within a minute (as it would, for example,if a pressurized gas cylinder were to split open). ALOHA assumes that all instantaneous releases last for1 minute.
Instructor demonstrates, while talking1) Click Continuous Source to indicate the release type.2) Enter 400 pounds/minute for the rate of pollutant entering the atmosphere. This must be
either a rate, such as pounds per minute, for a continuous source, or a mass or volumequantity, such as pounds or gallons, for an instantaneous release.
3) Choose the duration for your release as 30 minutes. If the release is continuous but lasts forless than an hour, enter its duration in minutes. If the release lasts for at least an hour, don'tchange ALOHA's default value of 60 minutes. ALOHA cannot accept a value for releaseduration of greater than 1 hour, because weather conditions or other circumstances of arelease are likely to change within an hour.
1b) Direct Source Height - The source height is the height of the location of a chemical release abovethe ground. Source height is zero if the chemical is released at ground level. In ALOHA, you can enter asource height greater than zero to model a release from an elevated source under two conditions:(a) The first is that you are using the Direct source option. Other source options such as releases from
puddles, tanks, and pipes are treated as ground-level releases, and(b) The second condition is that the release is modeled as a Gaussian release. In other words, ALOHA
considers elevated releases if the chemical disperses passively away from the release point. ALOHAwill NOT model an elevated release if there is any substantial upward or downward movement of agas cloud in the atmosphere. Upward movement could be a result of a heated or burning source anddownward slumping may be characteristic of a dense gas.
Enter 2 meters for the source height. Note that ALOHA reminds you about height issue.Because ammonia is neutrally buoyant, we are fine, but if ALOHA were modeling ammonia as adense gas, the height would be considered zero although the text summary would still say 2meters.
2) Display Options-Level of Concern - Now we want to calculate a footprint. We first need to:a) chooose display menu.b) choose options submenu to examine level of concern. Note that the IDLH is just 1 possible
level of concern and not necessarily the best; there is significant uncertainty associated withany toxic endpoint. Click to accept IDLH.
c) choose footprint to calculate distance.
Distance is 1200 yards.
Student Hands on Work[Instructor should now show slide entitled ‘Hands on Exercise (SetUp menu)’ and tell students to enterthe direct release data as the instructor enters the data. Then, briefly instructor and students look atoptions submenu under display menu to confirm level of concern. Then, run footprint and note distance.Select Concentration from the Display menu to determine the concentration directly downwind 1 milefrom release at an office building. Input 1 mile for “Input X, the crosswind distance” and 0 for “Input Y,the crosswind distance.” The red line is the predicted outdoor concentration, while the purple dotted lineis the predicted indoor concentration. Comment on graph and note where the concentration is belowLOC.]
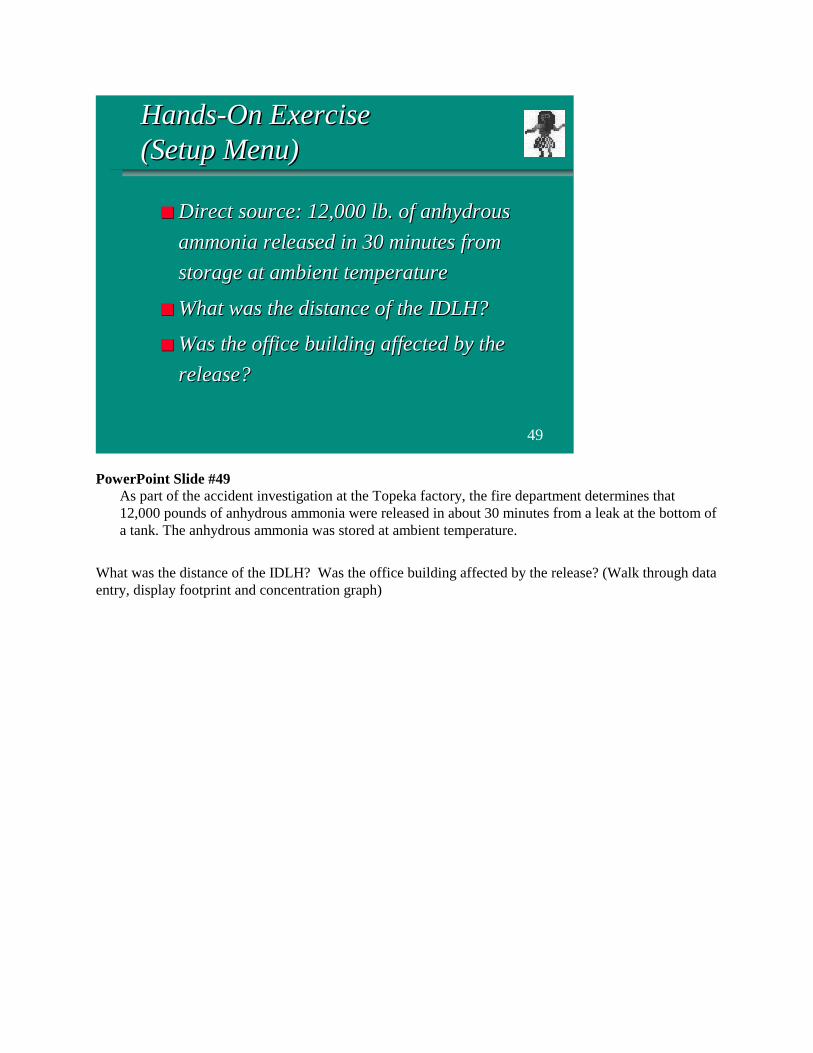
PowerPoint Slide #49As part of the accident investigation at the Topeka factory, the fire department determines that12,000 pounds of anhydrous ammonia were released in about 30 minutes from a leak at the bottom ofa tank. The anhydrous ammonia was stored at ambient temperature.
What was the distance of the IDLH? Was the office building affected by the release? (Walk through dataentry, display footprint and concentration graph)
49
Hands-On ExerciseHands-On Exercise(Setup Menu)(Setup Menu)
■■ Direct source: 12,000Direct source: 12,000 lb lb. of anhydrous. of anhydrous
ammonia released in 30 minutes fromammonia released in 30 minutes from
storage at ambient temperaturestorage at ambient temperature
■■ What was the distance of the IDLH?What was the distance of the IDLH?
■■ Was the office building affected by theWas the office building affected by the
release?release?
2) Puddle1) click on chemical to select hydrogen fluoride because, as we remember, it is liquid at 50oF2) click on puddle under source menu
The second release option under the SetUp menu and Source submenu is the puddle. Remember theevaporation rate is dependent on the puddle’s temperature (which is affected by solar radiation), thesurface area of the puddle, the wind speed and the physical properties of the chemical. Some of thisinformation is already entered under different parts of the ALOHA program. Also, to predict the timerequired to completely evaporate the puddle's contents, ALOHA must know the amount of liquid itcontains.
2a) Area In the first puddle screen, you specify the area of the puddle. If the puddle is roughly square orrectangular in shape, its area is equal to its length multiplied by its width. If it is roughly circular and youknow its diameter, but not its area, divide the diameter in half to obtain the radius. Square the radius,then multiply this value by pi, 3.14, to obtain the area. If the diameter or the length and width are in unitsof feet, then the area will be in units of square feet.
c) Instructor demonstrate:1) Enter a puddle area of 1000 square feet
2b) Quantity. You can specify the amount of liquid in the puddle by entering either: (a) volume, (b)average depth, or (c) mass (weight) of the liquid contained in the puddle. You will notice that the unitschange for each choice.
Instructor demonstrate:1) Enter an average depth (0.5 centimeters). Note that this is lowest allowable value.
There are allowable inputs in ALOHA for all choices. ALOHA will indicate if you are not withinacceptable values.
The next puddle input screen is soil type, and air and ground temperature.
2c) Soil Type For Puddle - Ground or soil type influences the amount of heat energy transferred fromthe ground to an evaporating puddle. Ground type is most important when the spilled liquid is"cryogenic." Cryogenic liquids are those such as liquefied natural gas (LNG), which are stored at lowtemperatures because they boil at temperatures well below ambient. As it computes heat transfer fromground to puddle, ALOHA assumes that the ground does not absorb any of the spilled chemical.
ALOHA offers you four choices for ground type:(a) Default: unwetted soil not covered by rock or concrete(b) Concrete: concrete, cement, asphalt, or otherwise paved surfaces(c) Sandy: sandy, dry soil, and(d) Moist: sandy, moist soil
ALOHA expects heat to be transferred most readily from default or concrete ground into a puddle,and least readily from sandy ground.
Instructor demonstrate:1) Enter default for soil type.
2d) Ground Temperature For Puddle - ALOHA uses ground temperature to predict the amount of heattransferred from the ground to an evaporating puddle. The warmer the ground, the warmer the puddle,and the higher the evaporation rate. If you do not know the ground temperature, you can choose to guessthat it is about equal to the air temperature. However, be aware that air and ground temperatures can bevery different in some situations, such as in a parking lot on a hot day in the afternoon or on a streetduring the early morning after a very cold night.
Instructor demonstrates while talking1) Type in for ground temperature 50 degrees Fahrenheit. Click Use Air Temperature if ground
temperature is unknown.
2e) Initial Temperature For Puddle - Lastly, ALOHA must know the initial temperature of the puddleto predict the rate of evaporation from a puddle of spilled liquid. It assumes the initial temperature to bethe same throughout the depth and width of the puddle.
You have the choice of either (a) use the ground temperature, or (b) use air temperature, or (c) enter avalue for the initial puddle temperature. For simplicity, let’s click the button that represents equal to airtemperature.
Instructor demonstrate:1) Select Use Air Temperature.
If your value for initial puddle temperature is above the liquid's normal boiling point, ALOHA will alertyou and then set the initial puddle temperature to the boiling point. ALOHA assumes that a boilingpuddle will quickly cool to its boiling point.
1) click on options and note hydrogen fluoride IDLH is 30 ppm2) click on footprint
Note footprint. Distance is about 900 yards/850 meters and the footprint is narrow. The narrow footprintis a result of the wind speed and stability class chosen.
Student Hands on Work[Instructor should now show slide entitled ‘Hands on Exercise (SetUp menu) and tell students to enterthe puddle release data as the instructor enters the data. Then, briefly instructor and students look atoptions submenu under display menu to confirm level of concern. Then, run footprint and note distance.Further run concentration graph for location 1 mile from release (office building). Comment on graph.]
PowerPoint Slide #50For the puddle example, lets use hydrogen fluoride because it is a liquid at this temperature. Assume thatthe release occurred at a refinery in Topeka with the same location and atmospheric conditions as before.The hydrogen fluoride forms a puddle with the surface area of 1,000 square feet and a depth of 0.25inches.
What is the distance of the IDLH? Was the office building affected by the release?
Ask What would happen if we tried a puddle of methyl chloride?
click methyl chlorideclick puddle with same assumptions
Note ALOHA is beeping with an information concern that the temperature is higher than methylchloride’s boiling point. ALOHA will not model a chemical at something higher than its boiling pointunder normal atmospheric pressure.
50
Hands-On ExerciseHands-On Exercise(Setup Menu)(Setup Menu)
■■ Puddle source: Pool of hydrogen fluoridePuddle source: Pool of hydrogen fluoride
formedformed
■■ Location: SameLocation: Same
■■ Atmospheric conditions: SameAtmospheric conditions: Same
■■ Puddle: 1,000 ftPuddle: 1,000 ft22 and is 0.5 cm deep and is 0.5 cm deep
■■ What is the distance of the IDLH?What is the distance of the IDLH?
■■ Was the office building affected by puddle?Was the office building affected by puddle?
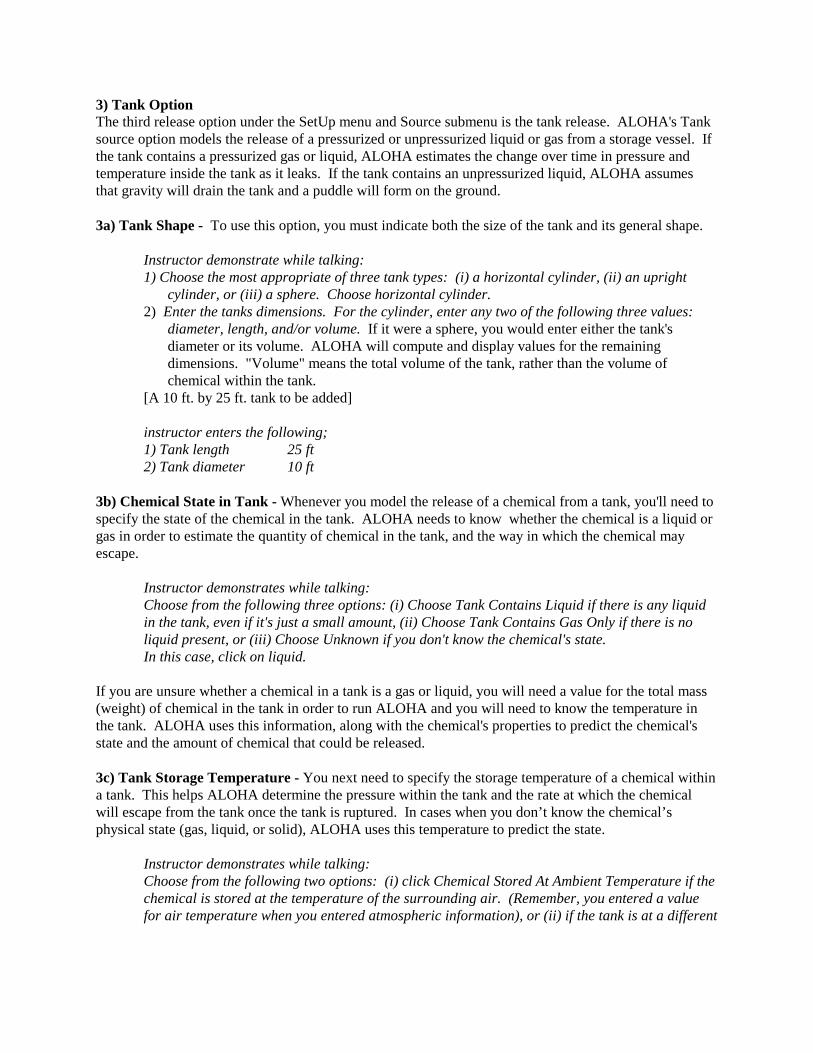
3) Tank OptionThe third release option under the SetUp menu and Source submenu is the tank release. ALOHA's Tanksource option models the release of a pressurized or unpressurized liquid or gas from a storage vessel. Ifthe tank contains a pressurized gas or liquid, ALOHA estimates the change over time in pressure andtemperature inside the tank as it leaks. If the tank contains an unpressurized liquid, ALOHA assumesthat gravity will drain the tank and a puddle will form on the ground.
3a) Tank Shape - To use this option, you must indicate both the size of the tank and its general shape.
Instructor demonstrate while talking:1) Choose the most appropriate of three tank types: (i) a horizontal cylinder, (ii) an upright
cylinder, or (iii) a sphere. Choose horizontal cylinder.2) Enter the tanks dimensions. For the cylinder, enter any two of the following three values:
diameter, length, and/or volume. If it were a sphere, you would enter either the tank'sdiameter or its volume. ALOHA will compute and display values for the remainingdimensions. "Volume" means the total volume of the tank, rather than the volume ofchemical within the tank.
[A 10 ft. by 25 ft. tank to be added]
instructor enters the following;1) Tank length 25 ft2) Tank diameter 10 ft
3b) Chemical State in Tank - Whenever you model the release of a chemical from a tank, you'll need tospecify the state of the chemical in the tank. ALOHA needs to know whether the chemical is a liquid orgas in order to estimate the quantity of chemical in the tank, and the way in which the chemical mayescape.
Instructor demonstrates while talking:Choose from the following three options: (i) Choose Tank Contains Liquid if there is any liquidin the tank, even if it's just a small amount, (ii) Choose Tank Contains Gas Only if there is noliquid present, or (iii) Choose Unknown if you don't know the chemical's state.In this case, click on liquid.
If you are unsure whether a chemical in a tank is a gas or liquid, you will need a value for the total mass(weight) of chemical in the tank in order to run ALOHA and you will need to know the temperature inthe tank. ALOHA uses this information, along with the chemical's properties to predict the chemical'sstate and the amount of chemical that could be released.
3c) Tank Storage Temperature - You next need to specify the storage temperature of a chemical withina tank. This helps ALOHA determine the pressure within the tank and the rate at which the chemicalwill escape from the tank once the tank is ruptured. In cases when you don’t know the chemical’sphysical state (gas, liquid, or solid), ALOHA uses this temperature to predict the state.
Instructor demonstrates while talking:Choose from the following two options: (i) click Chemical Stored At Ambient Temperature if thechemical is stored at the temperature of the surrounding air. (Remember, you entered a valuefor air temperature when you entered atmospheric information), or (ii) if the tank is at a different
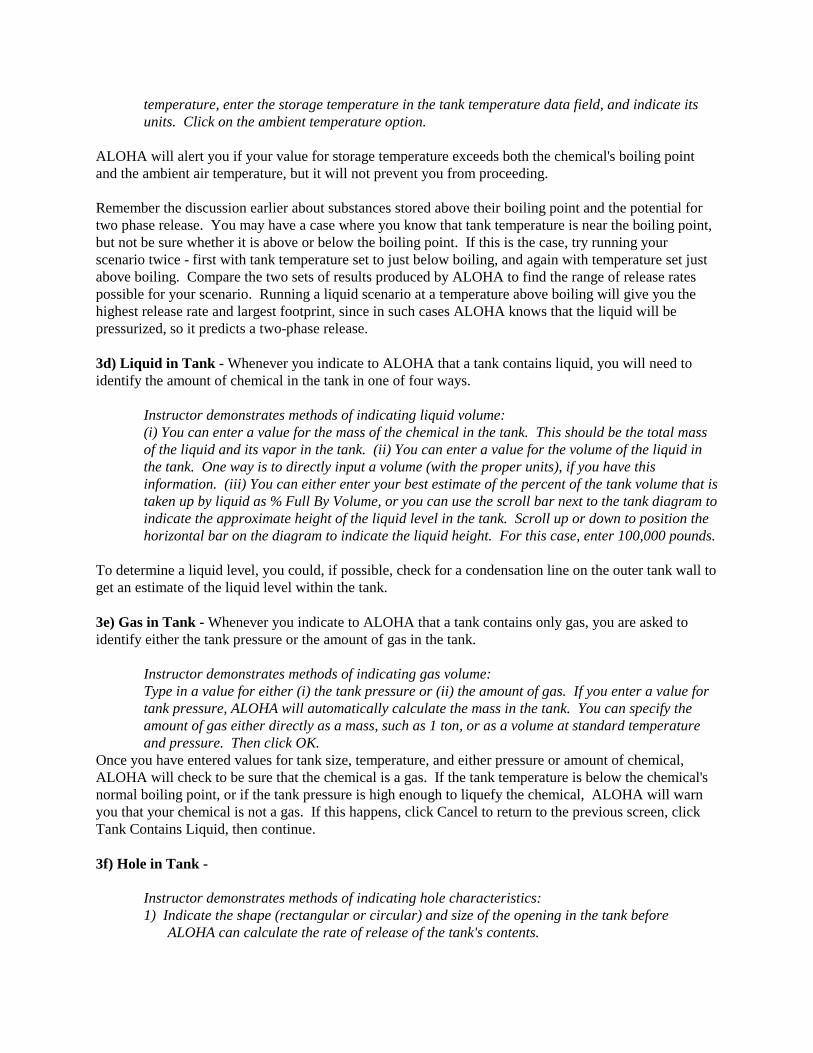
temperature, enter the storage temperature in the tank temperature data field, and indicate itsunits. Click on the ambient temperature option.
ALOHA will alert you if your value for storage temperature exceeds both the chemical's boiling pointand the ambient air temperature, but it will not prevent you from proceeding.
Remember the discussion earlier about substances stored above their boiling point and the potential fortwo phase release. You may have a case where you know that tank temperature is near the boiling point,but not be sure whether it is above or below the boiling point. If this is the case, try running yourscenario twice - first with tank temperature set to just below boiling, and again with temperature set justabove boiling. Compare the two sets of results produced by ALOHA to find the range of release ratespossible for your scenario. Running a liquid scenario at a temperature above boiling will give you thehighest release rate and largest footprint, since in such cases ALOHA knows that the liquid will bepressurized, so it predicts a two-phase release.
3d) Liquid in Tank - Whenever you indicate to ALOHA that a tank contains liquid, you will need toidentify the amount of chemical in the tank in one of four ways.
Instructor demonstrates methods of indicating liquid volume:(i) You can enter a value for the mass of the chemical in the tank. This should be the total massof the liquid and its vapor in the tank. (ii) You can enter a value for the volume of the liquid inthe tank. One way is to directly input a volume (with the proper units), if you have thisinformation. (iii) You can either enter your best estimate of the percent of the tank volume that istaken up by liquid as % Full By Volume, or you can use the scroll bar next to the tank diagram toindicate the approximate height of the liquid level in the tank. Scroll up or down to position thehorizontal bar on the diagram to indicate the liquid height. For this case, enter 100,000 pounds.
To determine a liquid level, you could, if possible, check for a condensation line on the outer tank wall toget an estimate of the liquid level within the tank.
3e) Gas in Tank - Whenever you indicate to ALOHA that a tank contains only gas, you are asked toidentify either the tank pressure or the amount of gas in the tank.
Instructor demonstrates methods of indicating gas volume:Type in a value for either (i) the tank pressure or (ii) the amount of gas. If you enter a value fortank pressure, ALOHA will automatically calculate the mass in the tank. You can specify theamount of gas either directly as a mass, such as 1 ton, or as a volume at standard temperatureand pressure. Then click OK.
Once you have entered values for tank size, temperature, and either pressure or amount of chemical,ALOHA will check to be sure that the chemical is a gas. If the tank temperature is below the chemical'snormal boiling point, or if the tank pressure is high enough to liquefy the chemical, ALOHA will warnyou that your chemical is not a gas. If this happens, click Cancel to return to the previous screen, clickTank Contains Liquid, then continue.
3f) Hole in Tank -
Instructor demonstrates methods of indicating hole characteristics:1) Indicate the shape (rectangular or circular) and size of the opening in the tank before
ALOHA can calculate the rate of release of the tank's contents.
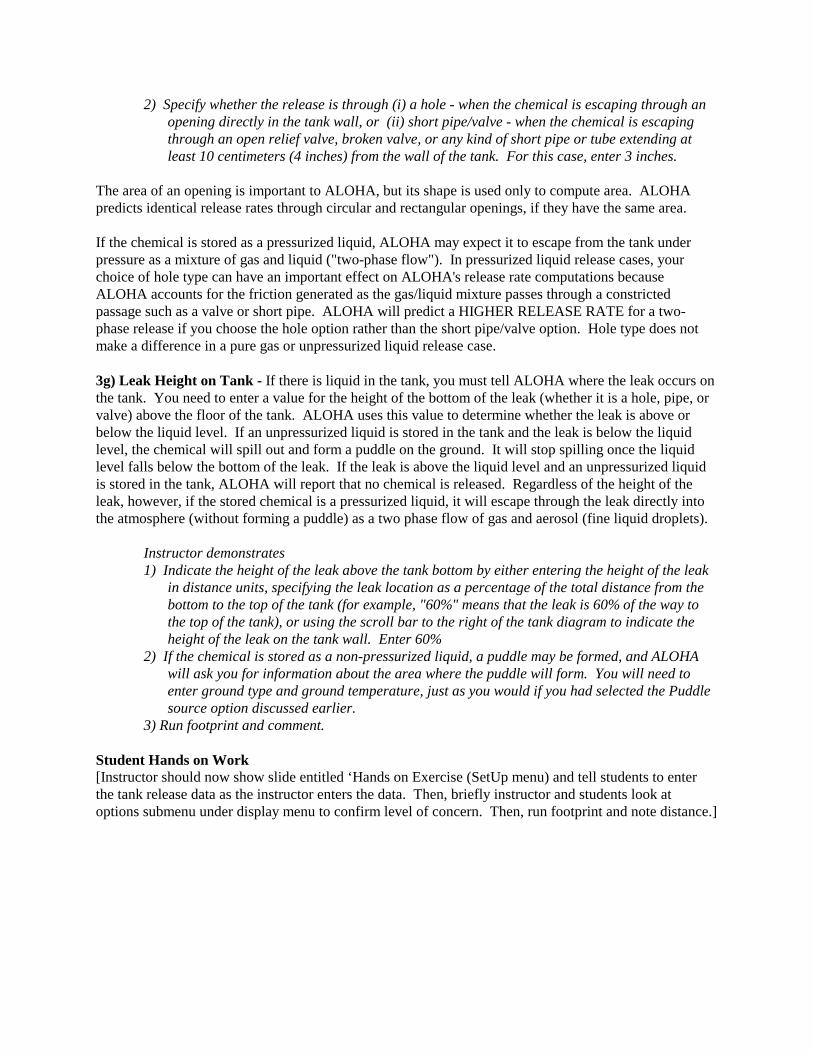
2) Specify whether the release is through (i) a hole - when the chemical is escaping through anopening directly in the tank wall, or (ii) short pipe/valve - when the chemical is escapingthrough an open relief valve, broken valve, or any kind of short pipe or tube extending atleast 10 centimeters (4 inches) from the wall of the tank. For this case, enter 3 inches.
The area of an opening is important to ALOHA, but its shape is used only to compute area. ALOHApredicts identical release rates through circular and rectangular openings, if they have the same area.
If the chemical is stored as a pressurized liquid, ALOHA may expect it to escape from the tank underpressure as a mixture of gas and liquid ("two-phase flow"). In pressurized liquid release cases, yourchoice of hole type can have an important effect on ALOHA's release rate computations becauseALOHA accounts for the friction generated as the gas/liquid mixture passes through a constrictedpassage such as a valve or short pipe. ALOHA will predict a HIGHER RELEASE RATE for a two-phase release if you choose the hole option rather than the short pipe/valve option. Hole type does notmake a difference in a pure gas or unpressurized liquid release case.
3g) Leak Height on Tank - If there is liquid in the tank, you must tell ALOHA where the leak occurs onthe tank. You need to enter a value for the height of the bottom of the leak (whether it is a hole, pipe, orvalve) above the floor of the tank. ALOHA uses this value to determine whether the leak is above orbelow the liquid level. If an unpressurized liquid is stored in the tank and the leak is below the liquidlevel, the chemical will spill out and form a puddle on the ground. It will stop spilling once the liquidlevel falls below the bottom of the leak. If the leak is above the liquid level and an unpressurized liquidis stored in the tank, ALOHA will report that no chemical is released. Regardless of the height of theleak, however, if the stored chemical is a pressurized liquid, it will escape through the leak directly intothe atmosphere (without forming a puddle) as a two phase flow of gas and aerosol (fine liquid droplets).
Instructor demonstrates1) Indicate the height of the leak above the tank bottom by either entering the height of the leak
in distance units, specifying the leak location as a percentage of the total distance from thebottom to the top of the tank (for example, "60%" means that the leak is 60% of the way tothe top of the tank), or using the scroll bar to the right of the tank diagram to indicate theheight of the leak on the tank wall. Enter 60%
2) If the chemical is stored as a non-pressurized liquid, a puddle may be formed, and ALOHAwill ask you for information about the area where the puddle will form. You will need toenter ground type and ground temperature, just as you would if you had selected the Puddlesource option discussed earlier.
3) Run footprint and comment.
Student Hands on Work[Instructor should now show slide entitled ‘Hands on Exercise (SetUp menu) and tell students to enterthe tank release data as the instructor enters the data. Then, briefly instructor and students look atoptions submenu under display menu to confirm level of concern. Then, run footprint and note distance.]
PowerPoint Slide #51Now consider liquid hydrogen fluoride leak from a tank at the same refinery. A tank with a 10 footdiameter and a 25 foot length stores 100,000 pounds of hydrogen fluoride. The tank has a 3 inch hole60% up from the bottom.
What is the distance of IDLH? Was the office building affected by the release?(Walk through data entry, display footprint and concentration graph)
51
Hands-On ExerciseHands-On Exercise(Setup Menu)(Setup Menu)
■■ Tank Source: Leak from a 10 ft. diameter byTank Source: Leak from a 10 ft. diameter by25 ft. long tank storing 100,00025 ft. long tank storing 100,000 lb lb. of. ofhydrogen fluoridehydrogen fluoride
■■ Tank has a 3 in. hole 60% up from theTank has a 3 in. hole 60% up from thebottombottom
■■ What is the distance of IDLH?What is the distance of IDLH?
■■ Was the office building affected by release?Was the office building affected by release?
4) PipeNow that we completed the tank option, let’s look at the pipe option. This option models the release ofgas from a leaking pipe.
4a) Types You can model two types of pipe leak scenarios:• a pipe connected to a very large or infinite reservoir so that gas escapes from the broken end of the
pipe at a constant rate for an indefinite period of time.• a limited length or section of pipe that is closed off at the unbroken end by something like a shut-off
valve. Because pressure within this section of pipe declines as gas is released, release rate drops overtime and the release continues only until the section of pipe is emptied.
• ALOHA cannot model gas releases from a pipe that has broken in the middle and is leaking fromboth broken ends.
Instructor choose infinite reservoir.
What will happen if we select the pipe option with benzene? The pipe must contain only gas; ALOHAcannot model the release of liquid from a pipe. To describe a pipe release to ALOHA, you must enter thepipe diameter and length, and indicate whether the pipe is connected to a reservoir. You must alsodetermine whether the inner surface of the pipe is rough or smooth. A "rough" pipe would be, forexample, a metal pipe with a rusted inner surface or a pipe that has been corroded on the inside by thechemicals it carries. A "smooth" pipe would be, for example, a new metal pipe, glass pipe or plasticpipe.
On the next input screen, pipe pressure, temperature, and hole size are requested. Each of these affect therate of release.
4b) Pipe pressure - If the pipe is connected to a very large ("infinite") reservoir, you should use thepressure within the reservoir as your value for pipe pressure. If gas is escaping from a finite, closed-offsection of pipe, you should enter the initial pressure within that pipe section.
Instructor enter sample reservoir pressure.
4c) Pipe Temperature - Then you need to enter the temperature of the pipe by either clicking onUnknown, or typing in a specific temperature. If unknown is selected, ALOHA will assume the pipetemperature is the ambient air temperature.
Instructor select unknown temperature.
4d) Hole Size - If only a finite length of the pipe is leaking, you can choose to (a) enter a value for thearea of the hole, or (b) allow ALOHA to use the pipe diameter as its value for the hole diameter. If youknow the diameter of the pipe hole but not its area, divide the diameter in half to obtain the radius, squarethe radius, then multiply it by pi, 3.14, to obtain the area. If the diameter is in units of feet, then the areawill be in units of square feet.
Model assumes pipe sheared off; no need to enter value.
Script Notes for Session VIII
Day 1
VIII. ALOHA Display Menu: Level of Concern and Display Results Submenus (3:30-4:30p.m.)
Learning Objectives: Through an instructor demonstration and some student hands on work, the studentswill gain a perspective on the relevant modeling issues in choosing a Level of Concern (LOC) to use andrun the model properly. At the end of this session, the class will be able to:
Options Submenu
• Choose an appropriate LOC (discuss issues with LOCs)Discuss LOC and use of concentration- From the Display menu, select Options and then enter value to change the LOC
• Contact duration- Select concentration from the Display menu
Footprint, Concentration, Submenus
• Display footprint of an ALOHA calculation - Select footprint from the Display menu
Interpreting a footprint• Display concentration graph - Select concentration from the Display menu
Choosing coordinatesUsing fixed (east-west and north-south) coordinatesInterpret a concentration graphDesignating a location for concentration measurement
• Building type and indoor infiltration
Detailed Script for Session VIII
Day 1
VIII. Display Menu: Level of Concern (1) and Display Results (2) Submenus (3:30 - 4:30p.m.)
1) Choose an appropriate Level of Concern (LOC)As was discussed in the air dispersion section, the LOC selected in ALOHA affects the footprint,sometimes dramatically. While the default LOC in ALOHA is the IDLH, the user may select anotherLOC corresponding to a different type and/or less severe hazard. A lower LOC will increase the size ofthe footprint.
Always keep in mind that the footprint is a ballpark estimate. There is a great deal of uncertainty in anyselected LOC. The footprint is therefore never an exact map of the hazard zone for a particular incident.
1a) Level of ConcernAn IDLH value is included in ALOHA's chemical library for each chemical for which an IDLH has beendefined. However, you may want to add an LOC to the library if ther is one you would prefer to use.
1b) Account for contact durationIn selecting a LOC, the user in most cases needs to consider the contact duration. How badly a person isaffected by a chemical depends for the most part on how long the contact lasted and how high theconcentration was during that time. For this reason, most LOCs have a contact duration associated withthem. The contact duration associated with a LOC is part of the definition of that LOC. For example,the contact duration for TLV-STEL is 15 minutes. IDLH is an exception; it does not have a contactduration associated with it.
The contact duration is important when reviewing ALOHA output. After a chemical release, at any pointwhere the chemical cloud passes, the concentration will rise and fall over time. This change inconcentration over time can be viewed in ALOHA by looking at the Concentration vs. Time graph for alocation. This graph can be used to account for the LOC’s contact duration. Within the footprint, selecta point and display the graph. Then check the graph to determine how long the LOC is exceeded at thispoint and other locations. If the LOC is exceeded for longer than the LOC’s contact duration at alocation, this location is considered to be in the predicted hazard zone. There may be cases whereALOHA predicts the LOC is greatly exceeded at a particular location, but for a time period shorter thanthe LOC’s contact duration.
Ask students: Does this mean that the chemical poses no hazard? The answer is: Notnecessarily. For situations, try to find an expert to help you interpret your ALOHA results.
2) Display footprint of an ALOHA calculation
Select footprint from the Display menu
Interpret the footprint. To show how much the cloud's position could change if the wind were to shiftdirection, under the particular weather conditions that you enter, ALOHA draws two dashed lines, onealong each side of the footprint. ALOHA predicts that about 95 percent of the time, the wind will notshift direction enough to blow the pollutant cloud outside of either line. The wider the zone between the
lines, the less predictable is the wind direction and the more likely it is to change substantially. At thelowest wind speeds acceptable to ALOHA (about 2 knots, or 1 meter per second, at a height of 3 meters),these lines form a circle to indicate that the wind could blow from any direction.
ALOHA predicts that concentrations will be highest near the release point and along the centerline of anypollutant cloud, and will drop off smoothly and gradually in the downwind and crosswind directions.
3) Interpret an ALOHA concentration graphIn addition to examining the contact duration, the concentration graph is an important ALOHA output foranalysis of a release. A concentration graph is useful whenever you’re concerned not only about theextent of the whole area that might be at risk (i.e., the footprint) during a release, but also the hazard tospecific locations such as schools or hospitals. The graph shows predicted chemical concentrations inindoor and outdoor air at ground level at a particular location you've selected during the hour after achemical release begins.
3a) Designating a location for concentration measurement
We will discuss two ways to select a location for a concentration measurement.
The first way is to double-click on any point in the Footprint window. This method is easy to performbut it can be difficult to select an exact location.
Click within a Footprint window
The second method is to choose Concentration from the Display menu and then enter the coordinates.Coordinates can be fixed (east-west and north-south) or relative (downwind, crosswind). Again, payattention to the units for distance.
Choose Concentration from the Display menu
In either case, ALOHA will display a Concentration window and graph on the graph. On the graph, thegreen line is labeled as the LOC. The red line is the predicted outdoor concentration, while the bluedotted line is the predicted indoor concentration. Also note, ALOHA predicts the concentrationsdownwind of a release to be highest along the centerline of a dispersing pollutant cloud (where thecrosswind distance is zero), so the centerline concentration will always be the most conservativeconcentration estimate for a location (meaning that by obtaining the centerline concentration, you are lesslikely to underestimate the potential concentration at a location).
3b) Building type and indoor infiltrationAs can be seen in the Concentration window, ALOHA predicts the concentration outside a building tobuild up more rapidly than the indoor concentration. This is due to ALOHA accounting for a relativelyslow rate of infiltration into buildings and its assumption that doors and windows are closed. ALOHAexpects pollutant gas concentrations to build up faster within single-storied than double-storied buildingsand within unsheltered than sheltered buildings. For single-and double-storied buildings, ALOHAaccounts for the effects of wind speed and temperature to compute air exchange rates. ALOHA expects abuilding’s air exchange rate to increase if the wind speed increases, because a faster wind exerts moreforce to push air through the small openings in a building’s walls. Also, the greater the temperature

difference between indoor and outdoor air, the higher the air exchange rate, regardless of whether the airwithin the building is warmer or cooler than the outside air (this is due to pressure: air masses of differenttemperatures have different pressures, and pressure difference stimulates air movement). The higher abuilding’s air exchange rate, the faster the concentration of a toxic gas is predicted to rise within abuilding.

Script Notes for Sessions IX and X
Day 1
IX. Hands On Running of ALOHA (4:30-4:45 p.m.)
Learning Objectives: Students will run the ALOHA model with one predefined scenario. At the end ofthis session, the class will know how to run ALOHA. Scenario:• Release occurs at a Publicly Owned Treatment Works (POTW) at 7 am on May 23, 1996 in Houston,
Texas• A building of concern, a one story schoolhouse a kilometer away with unsheltered surroundings
(meaning no trees or shrubs)• Chemical released is chlorine.
Atmospheric data: wind is from the east at 2 meters/sec (measured 3 meters above ground), clearskies, 50% humidity, 65oF, and flat topography (open country).• Release scenario data: 1-inch diameter hole from bottom of a 10 foot diameter by 20 foot long
horizontal tank pressured at 14 atm. The tank contains 65 tons of liquid chlorine.• What is the potential footprint distance in kilometers?• Will air in the schoolhouse exceed the IDLH?
Work Through Solution
X. Questions and Answers (4:45-5:00 p.m.)
Although the trainer should allow the class to ask questions as they arise during the day, a short periodwill be set aside for questions at the end of the day. At the end of the Q&A session, the trainer shouldgive a brief summary of the topics to be covered in the next day, and remind the students when class willbegin the following day.
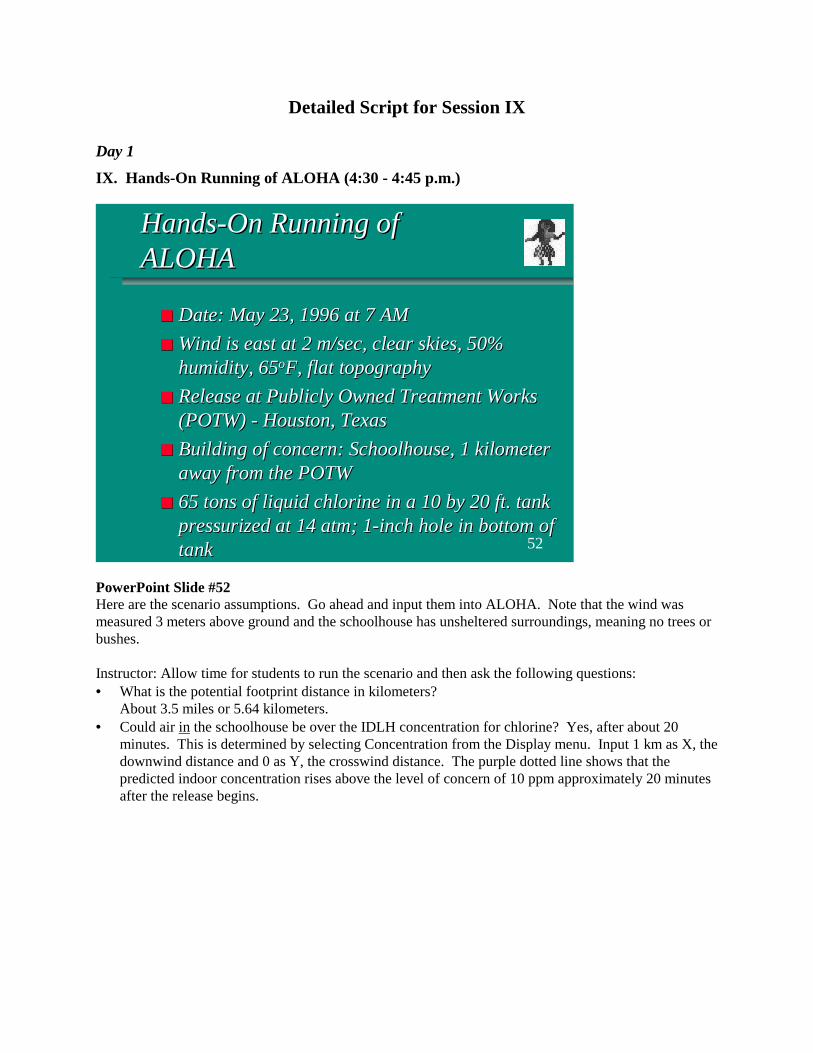
Detailed Script for Session IX
Day 1
IX. Hands-On Running of ALOHA (4:30 - 4:45 p.m.)
PowerPoint Slide #52Here are the scenario assumptions. Go ahead and input them into ALOHA. Note that the wind wasmeasured 3 meters above ground and the schoolhouse has unsheltered surroundings, meaning no trees orbushes.
Instructor: Allow time for students to run the scenario and then ask the following questions:• What is the potential footprint distance in kilometers?
About 3.5 miles or 5.64 kilometers.• Could air in the schoolhouse be over the IDLH concentration for chlorine? Yes, after about 20
minutes. This is determined by selecting Concentration from the Display menu. Input 1 km as X, thedownwind distance and 0 as Y, the crosswind distance. The purple dotted line shows that thepredicted indoor concentration rises above the level of concern of 10 ppm approximately 20 minutesafter the release begins.
52
Hands-On Running ofHands-On Running ofALOHAALOHA
■■ Date: May 23, 1996 at 7 AMDate: May 23, 1996 at 7 AM
■■ Wind is east at 2 m/sec, clear skies, 50%Wind is east at 2 m/sec, clear skies, 50%humidity, 65humidity, 65ooF, flat topographyF, flat topography
■■ Release at Publicly Owned Treatment WorksRelease at Publicly Owned Treatment Works(POTW) - Houston, Texas(POTW) - Houston, Texas
■■ Building of concern: Schoolhouse, 1 kilometerBuilding of concern: Schoolhouse, 1 kilometeraway from the POTWaway from the POTW
■■ 65 tons of liquid chlorine in a 10 by 20 ft. tank65 tons of liquid chlorine in a 10 by 20 ft. tankpressurized at 14pressurized at 14 atm atm; 1-inch hole in bottom of; 1-inch hole in bottom oftanktank
Script Notes for Sessions I and II
Day 2
I. Short Reintroduction to ALOHA Model (8:30-8:35 a.m.)
• Summarize what was covered• Summarize what will be coveredII. Hands On Running of ALOHA (8:35-9:20 a.m.)
Learning Objectives: Students will run the ALOHA model to identify major issues, problems andprovide caveats, and recommendations for the two given scenarios. The scenarios are in the studentworkbook.
Detailed Script for Sessions I and II
Day 2
I and II. Re-introduction and Hands-On Running of ALOHA (8:30 - 9:20 a.m.)
PowerPoint Slide #53Welcome and get ready for the 2nd day of ALOHA training. Yesterday we covered an introduction toALOHA, a scenario demonstration, air dispersion, ALOHA menus, and then conducted a hands onrunning of ALOHA.
53
I. ALOHAI. ALOHA Training CourseTraining Course
2nd Day2nd Day
■■ YesterdayYesterday•• Introduction to ALOHAIntroduction to ALOHA
•• Demonstrated scenarioDemonstrated scenario
•• Air dispersion mini-courseAir dispersion mini-course
•• Work through all ALOHA screens and someWork through all ALOHA screens and somehands onhands on
•• Questions/AnswersQuestions/Answers

PowerPoint Slide #54Today, we have a full schedule. In the morning we will conduct a hands on running of ALOHA, look atthe effect of inputs on outputs, discuss proper use of ALOHA and look at example cases, and thendiscuss tools and tips for running ALOHA. In the afternoon, we will look at using ALOHA for mappingand meeting Federal Requirements, go over exercises and a scavenger hunt, and we will finish the coursewith a MINI-Test and a course wrap-up.
54
ALOHAALOHA Training CourseTraining Course
2nd Day2nd Day
■■ TodayToday•• MorningMorning
–– Hands on running of scenariosHands on running of scenarios
–– Effects of inputs on outputsEffects of inputs on outputs
–– When and when not to use ALOHAWhen and when not to use ALOHA
–– Problems and success storiesProblems and success stories
–– More tips and tools for running ALOHAMore tips and tools for running ALOHA
•• AfternoonAfternoon–– Use for mapping & meeting federal requirementsUse for mapping & meeting federal requirements
–– Class examplesClass examples
–– Mini-test and wrap-upMini-test and wrap-up

PowerPoint Slide #55On October 9, 1996 at 2:30 PM, a work crew finds a 2” hole in the side of a 12,000-gallon vertical butanetank. The tank is located in a remote facility outside of Provo, Utah, where large amounts of liquidbutane are stored. The crew reports that the hole is about 2" from the bottom of the tank. The tankdiameter is about 10’ and at the time of the leak, the tank was 70 percent full. The tank itself issurrounded by a cement platform and, further away, the terrain is mostly barren.
The following on-scene weather observations were taken by the work crew at 2:30 PM: the cloud cover isabout 1/10 with winds from the ENE at 12 knots. The air temperature is 56oF with a relative humidty of34 percent.
Assuming that the LOC is 800 ppm, what is the downwind distance?
• What happens if you change ground roughness to urban?• What if you change the LOC to 80 ppm?• What happens if the source strength doubles?• What happens to footprint with you change stability to F?
Show results of changes in table and briefly discuss them.
55
II. Hands on Running of ALOHAII. Hands on Running of ALOHA
■■ Run butane release in student workbookRun butane release in student workbook•• What is distance to the level of concern (LOC)?What is distance to the level of concern (LOC)?
–– Change from rural to urban? Change from rural to urban?
–– Change LOC from 800 to 80 Change LOC from 800 to 80 ppm ppm??
–– Double source strength (hint: rate double, hole Double source strength (hint: rate double, holearea doubles)?area doubles)?
–– Change stability to F (hint: change release time Change stability to F (hint: change release timeand wind speed)and wind speed)
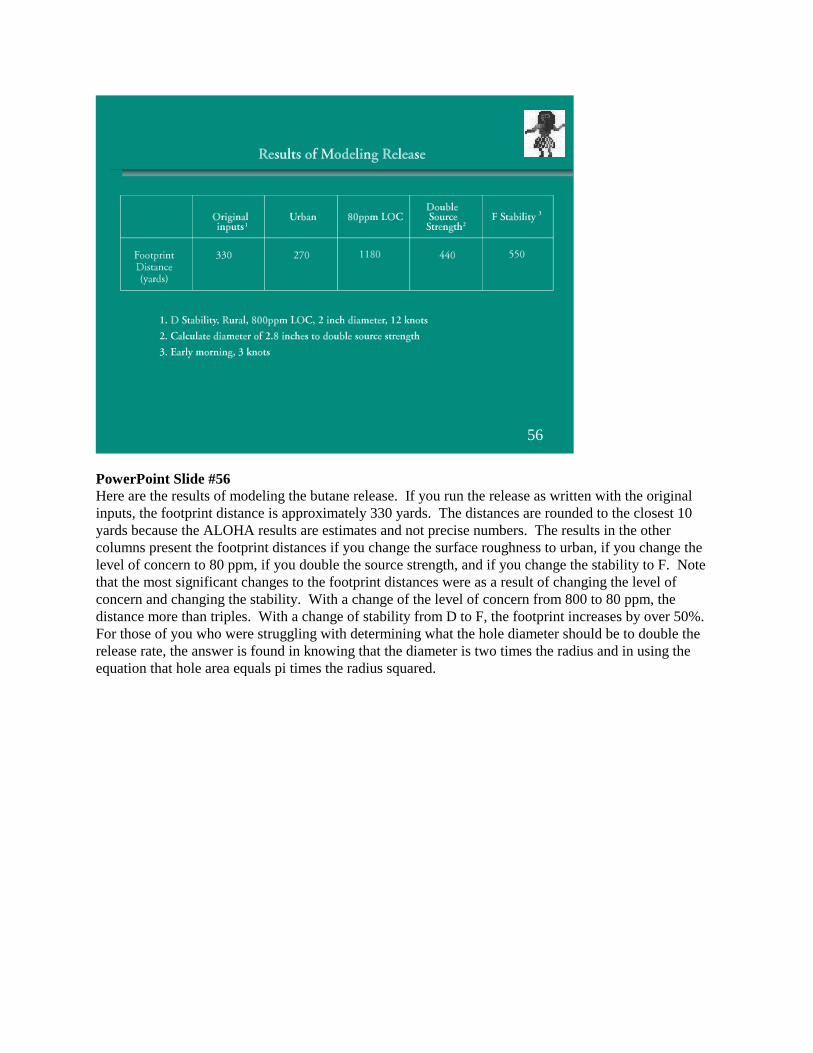
PowerPoint Slide #56Here are the results of modeling the butane release. If you run the release as written with the originalinputs, the footprint distance is approximately 330 yards. The distances are rounded to the closest 10yards because the ALOHA results are estimates and not precise numbers. The results in the othercolumns present the footprint distances if you change the surface roughness to urban, if you change thelevel of concern to 80 ppm, if you double the source strength, and if you change the stability to F. Notethat the most significant changes to the footprint distances were as a result of changing the level ofconcern and changing the stability. With a change of the level of concern from 800 to 80 ppm, thedistance more than triples. With a change of stability from D to F, the footprint increases by over 50%.For those of you who were struggling with determining what the hole diameter should be to double therelease rate, the answer is found in knowing that the diameter is two times the radius and in using theequation that hole area equals pi times the radius squared.
56
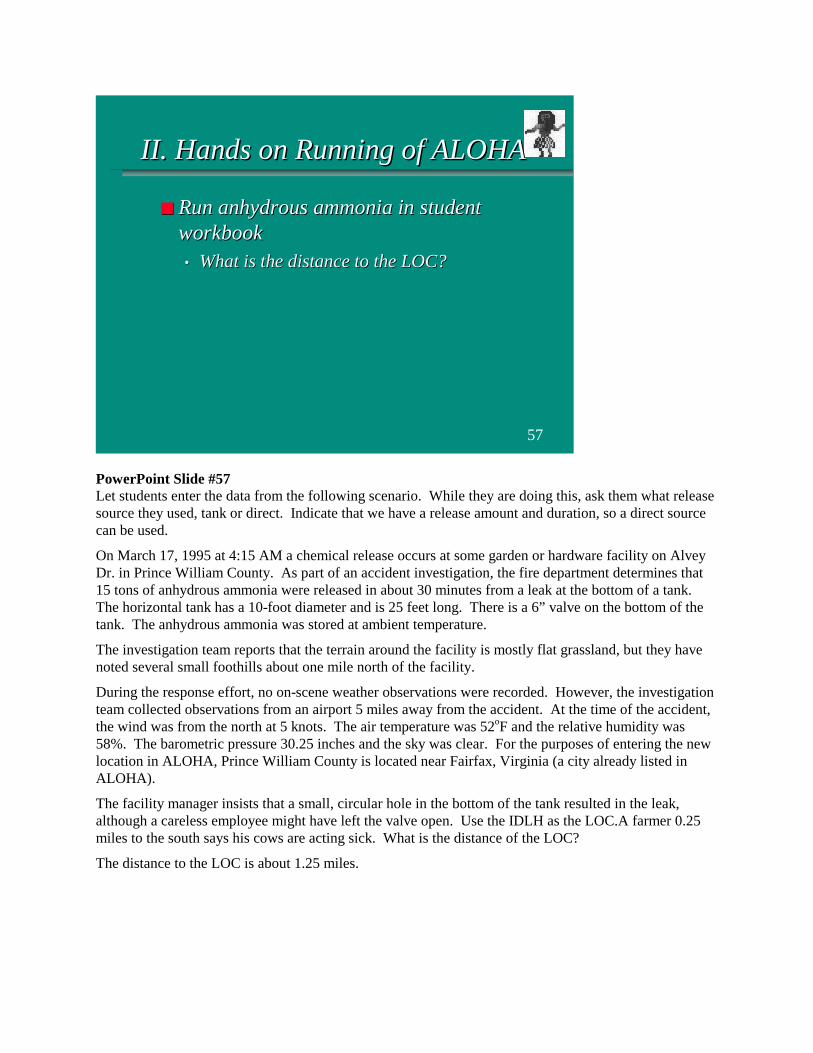
PowerPoint Slide #57Let students enter the data from the following scenario. While they are doing this, ask them what releasesource they used, tank or direct. Indicate that we have a release amount and duration, so a direct sourcecan be used.
On March 17, 1995 at 4:15 AM a chemical release occurs at some garden or hardware facility on AlveyDr. in Prince William County. As part of an accident investigation, the fire department determines that15 tons of anhydrous ammonia were released in about 30 minutes from a leak at the bottom of a tank.The horizontal tank has a 10-foot diameter and is 25 feet long. There is a 6” valve on the bottom of thetank. The anhydrous ammonia was stored at ambient temperature.
The investigation team reports that the terrain around the facility is mostly flat grassland, but they havenoted several small foothills about one mile north of the facility.
During the response effort, no on-scene weather observations were recorded. However, the investigationteam collected observations from an airport 5 miles away from the accident. At the time of the accident,the wind was from the north at 5 knots. The air temperature was 52oF and the relative humidity was58%. The barometric pressure 30.25 inches and the sky was clear. For the purposes of entering the newlocation in ALOHA, Prince William County is located near Fairfax, Virginia (a city already listed inALOHA).
The facility manager insists that a small, circular hole in the bottom of the tank resulted in the leak,although a careless employee might have left the valve open. Use the IDLH as the LOC.A farmer 0.25miles to the south says his cows are acting sick. What is the distance of the LOC?
The distance to the LOC is about 1.25 miles.
57
II. Hands on Running of ALOHAII. Hands on Running of ALOHA
■■ Run anhydrous ammonia Run anhydrous ammonia in studentin studentworkbookworkbook•• What is the distance to the LOC?What is the distance to the LOC?

Script Notes for Session III
Day 2
III. Effects of Inputs on Outputs (9:20-9:40 a.m.)
• Play game where you give input that is increasing and the students must answer if footprint is longeror shorter and why.
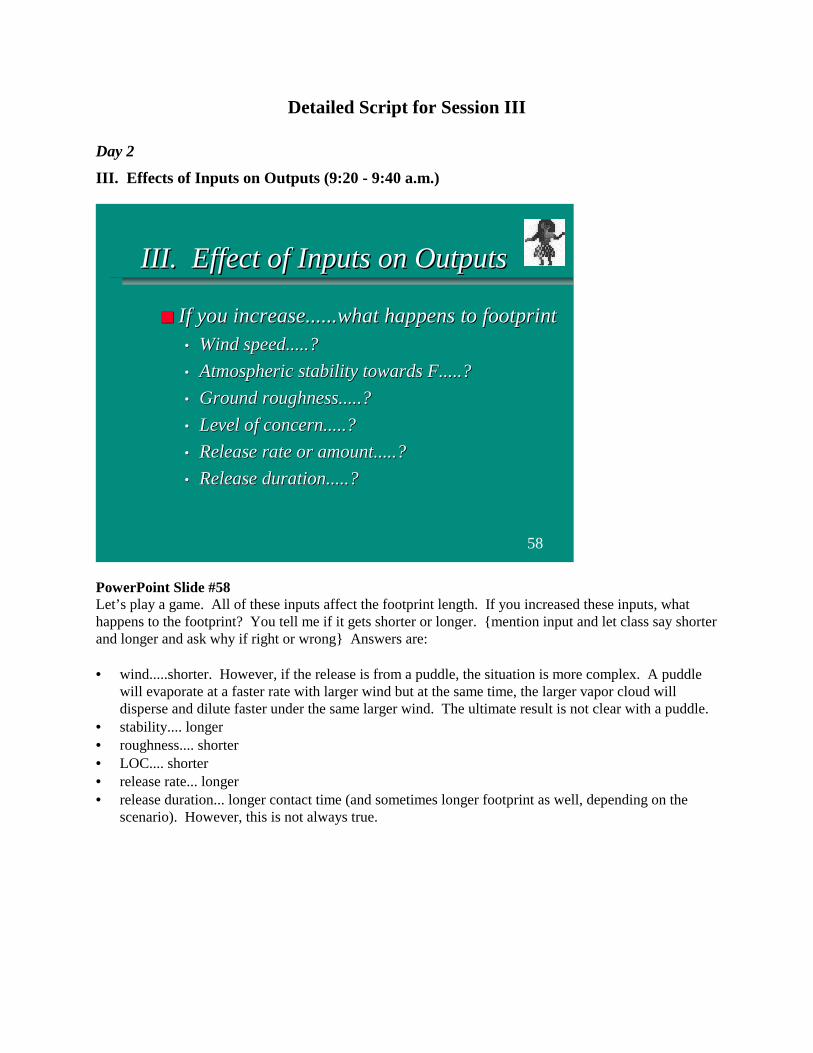
Detailed Script for Session III
Day 2
III. Effects of Inputs on Outputs (9:20 - 9:40 a.m.)
PowerPoint Slide #58Let’s play a game. All of these inputs affect the footprint length. If you increased these inputs, whathappens to the footprint? You tell me if it gets shorter or longer. {mention input and let class say shorterand longer and ask why if right or wrong} Answers are:
• wind.....shorter. However, if the release is from a puddle, the situation is more complex. A puddlewill evaporate at a faster rate with larger wind but at the same time, the larger vapor cloud willdisperse and dilute faster under the same larger wind. The ultimate result is not clear with a puddle.
• stability.... longer• roughness.... shorter• LOC.... shorter• release rate... longer• release duration... longer contact time (and sometimes longer footprint as well, depending on the
scenario). However, this is not always true.
58
III. Effect of Inputs on OutputsIII. Effect of Inputs on Outputs
■■ If you increase......what happens to footprintIf you increase......what happens to footprint•• Wind speed.....?Wind speed.....?
•• Atmospheric stability towards F.....?Atmospheric stability towards F.....?
•• Ground roughness.....?Ground roughness.....?
•• Level of concern.....?Level of concern.....?
•• Release rate or amount.....?Release rate or amount.....?
•• Release duration.....?Release duration.....?
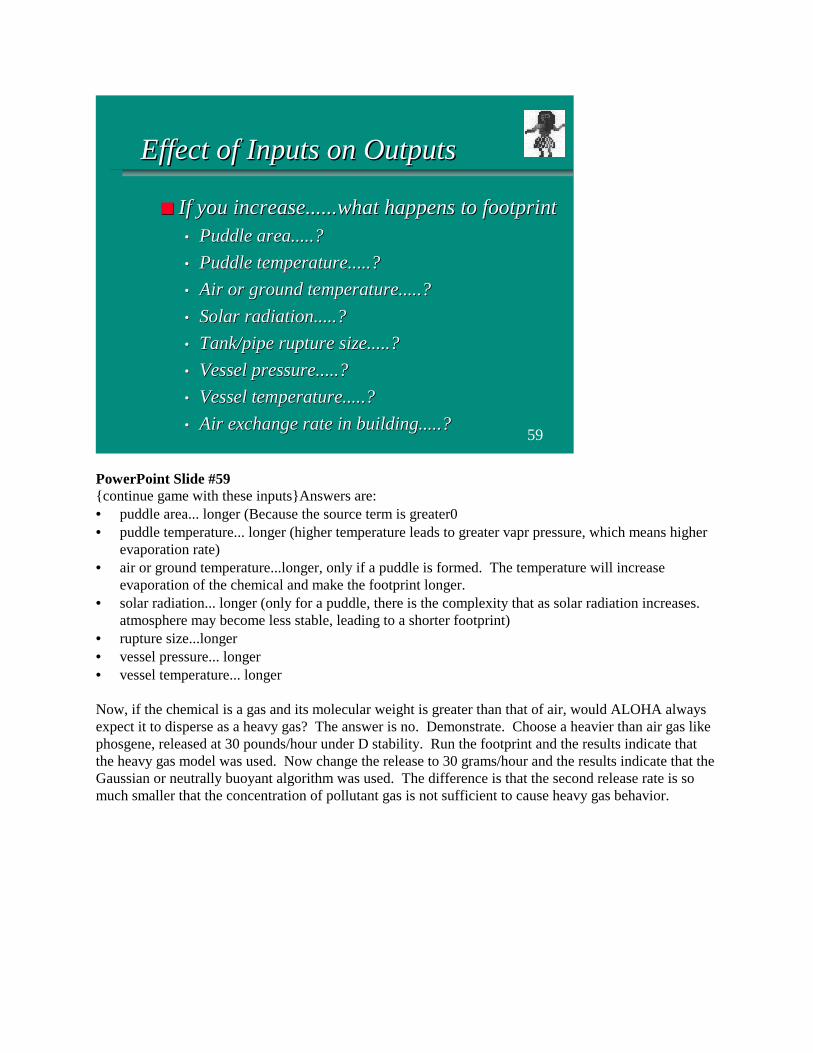
PowerPoint Slide #59{continue game with these inputs}Answers are:• puddle area... longer (Because the source term is greater0• puddle temperature... longer (higher temperature leads to greater vapr pressure, which means higher
evaporation rate)• air or ground temperature...longer, only if a puddle is formed. The temperature will increase
evaporation of the chemical and make the footprint longer.• solar radiation... longer (only for a puddle, there is the complexity that as solar radiation increases.
atmosphere may become less stable, leading to a shorter footprint)• rupture size...longer• vessel pressure... longer• vessel temperature... longer
Now, if the chemical is a gas and its molecular weight is greater than that of air, would ALOHA alwaysexpect it to disperse as a heavy gas? The answer is no. Demonstrate. Choose a heavier than air gas likephosgene, released at 30 pounds/hour under D stability. Run the footprint and the results indicate thatthe heavy gas model was used. Now change the release to 30 grams/hour and the results indicate that theGaussian or neutrally buoyant algorithm was used. The difference is that the second release rate is somuch smaller that the concentration of pollutant gas is not sufficient to cause heavy gas behavior.
59
Effect of Inputs on OutputsEffect of Inputs on Outputs
■■ If you increase......what happens to footprintIf you increase......what happens to footprint•• Puddle area.....?Puddle area.....?
•• Puddle temperature.....?Puddle temperature.....?
•• Air or ground temperature.....?Air or ground temperature.....?
•• Solar radiation.....?Solar radiation.....?
•• Tank/pipe rupture size.....?Tank/pipe rupture size.....?
•• Vessel pressure.....?Vessel pressure.....?
•• Vessel temperature.....?Vessel temperature.....?
•• Air exchange rate in building.....?Air exchange rate in building.....?
Script Notes for Session IV
Day 2
IV. When and When Not to Use ALOHA (9:40-10:10 a.m.)
Discuss times to use caution when running ALOHA
• Very low wind speeds• Very stable atmospheric conditions• Wind shifts and terrain steering effects• Concentration patchiness
Discuss effects that ALOHA does not account for:
• Fires or chemical reactions• Particulates• Solutions and mixtures• Terrain
BREAK (10:10-10:25 a.m.)
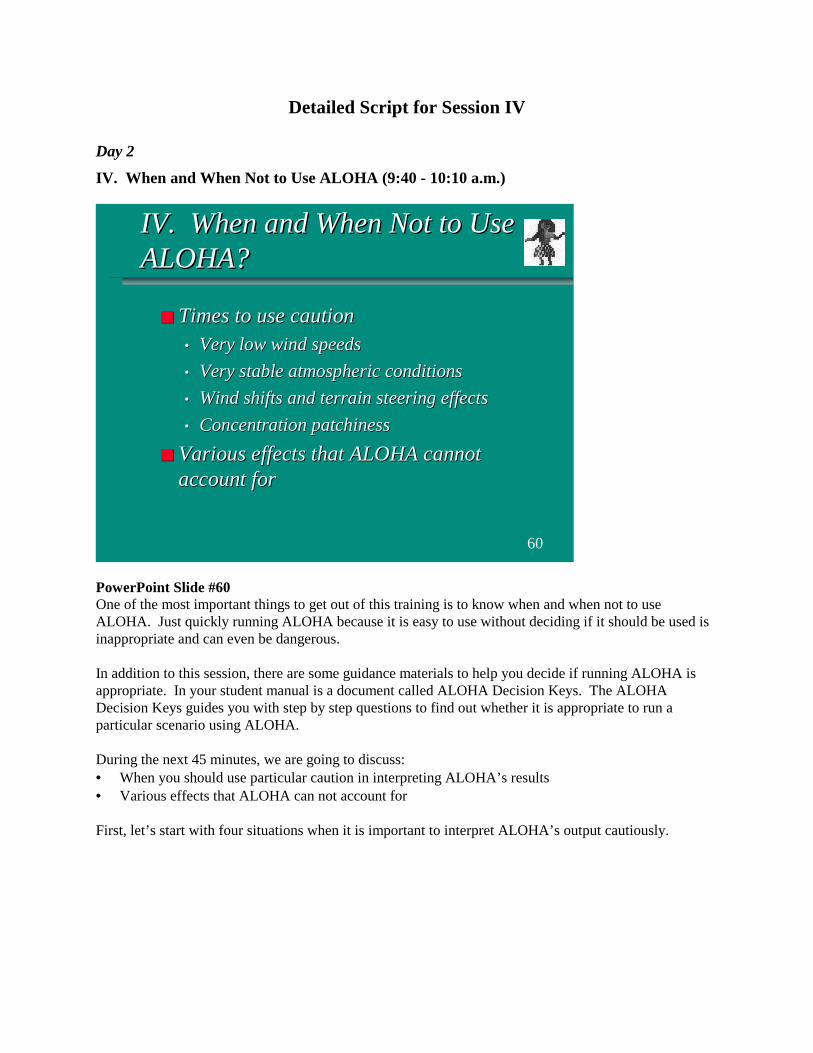
Detailed Script for Session IV
Day 2
IV. When and When Not to Use ALOHA (9:40 - 10:10 a.m.)
PowerPoint Slide #60One of the most important things to get out of this training is to know when and when not to useALOHA. Just quickly running ALOHA because it is easy to use without deciding if it should be used isinappropriate and can even be dangerous.
In addition to this session, there are some guidance materials to help you decide if running ALOHA isappropriate. In your student manual is a document called ALOHA Decision Keys. The ALOHADecision Keys guides you with step by step questions to find out whether it is appropriate to run aparticular scenario using ALOHA.
During the next 45 minutes, we are going to discuss:• When you should use particular caution in interpreting ALOHA’s results• Various effects that ALOHA can not account for
First, let’s start with four situations when it is important to interpret ALOHA’s output cautiously.
60
IV. When and When Not to UseIV. When and When Not to UseALOHA?ALOHA?
■■ Times to use cautionTimes to use caution•• Very low wind speedsVery low wind speeds
•• Very stable atmospheric conditionsVery stable atmospheric conditions
•• Wind shifts and terrain steering effectsWind shifts and terrain steering effects
•• ConcentrationConcentration patchiness patchiness
■■ Various effects that ALOHA cannotVarious effects that ALOHA cannotaccount foraccount for

PowerPoint Slide #61As long as wind direction does not change, ALOHA's footprint represents a pollutant cloud's location.However, wind direction is least predictable when wind speed is low. ALOHA tries to address this bydrawing two dashed lines, one along each side of the footprint. These lines represent the ALOHAprediction that about 95 percent of the time, the wind will not shift direction enough to steadily blow thepollutant cloud outside of either line. The wider the zone between the lines, the less predictable is thewind direction and the more likely it is to change substantially. At the lowest wind speeds acceptable toALOHA, these lines form a circle to indicate that the wind could blow from any direction.
A note to the instructor: ALOHA does not accept wind speeds lower than 1 meter per second (about 2knots) at 10 meters height. However, because ALOHA accounts for the effects of the wind profile, itoften accepts wind speeds of less than 1 meter per second at heights below 10 meters (what it does isestimate from your entered value what the wind speed would be at 10 meters; it accepts your value if the10-meter speed is at least 1 meter per second).
61
Caution: Very Low Wind SpeedsCaution: Very Low Wind Speeds
■■ Wind direction is least predictable whenWind direction is least predictable whenwind speed is lowwind speed is low
■■ (maybe footprint here) ALOHA predicts(maybe footprint here) ALOHA predicts“enlarged” footprint due to wind direction“enlarged” footprint due to wind directionchangeschanges
■■ ALOHAALOHA does not accept very low winddoes not accept very low windspeeds -- below 1 m/s or 2 knots at 10speeds -- below 1 m/s or 2 knots at 10metersmeters
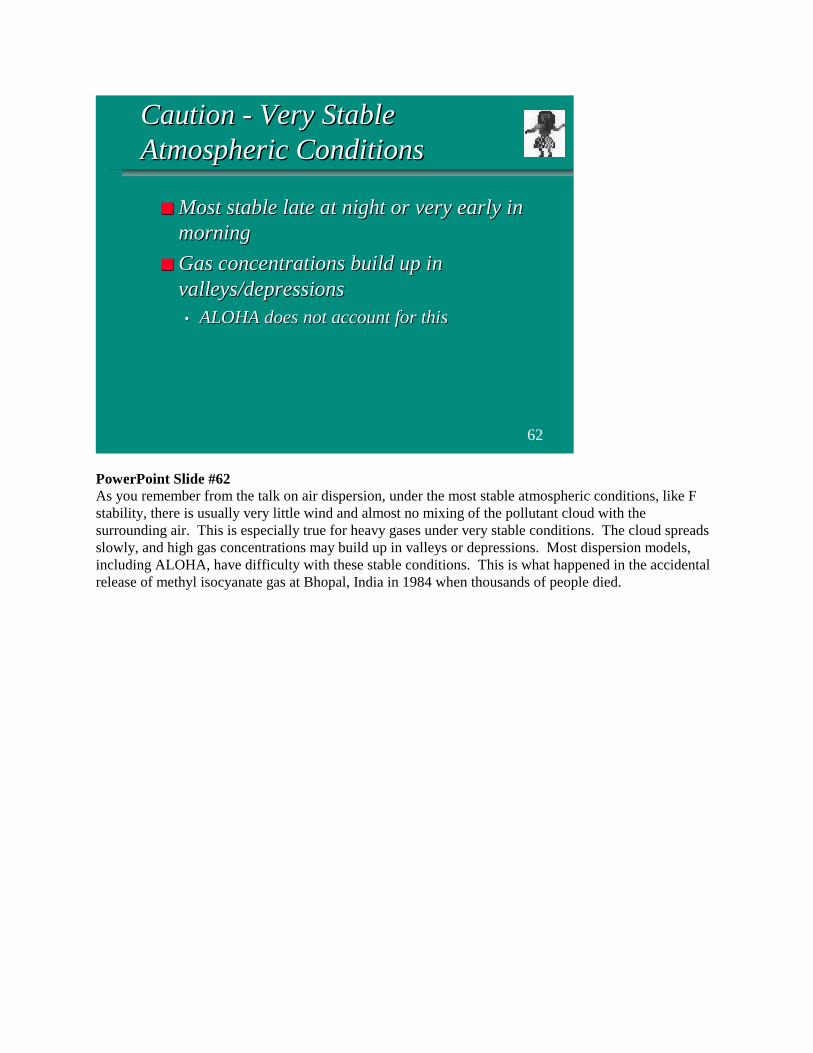
PowerPoint Slide #62As you remember from the talk on air dispersion, under the most stable atmospheric conditions, like Fstability, there is usually very little wind and almost no mixing of the pollutant cloud with thesurrounding air. This is especially true for heavy gases under very stable conditions. The cloud spreadsslowly, and high gas concentrations may build up in valleys or depressions. Most dispersion models,including ALOHA, have difficulty with these stable conditions. This is what happened in the accidentalrelease of methyl isocyanate gas at Bhopal, India in 1984 when thousands of people died.
62
Caution - Very StableCaution - Very StableAtmospheric ConditionsAtmospheric Conditions
■■ Most stable late at night or very early inMost stable late at night or very early inmorningmorning
■■ Gas concentrations build up inGas concentrations build up invalleys/depressionsvalleys/depressions•• ALOHA does not account for thisALOHA does not account for this
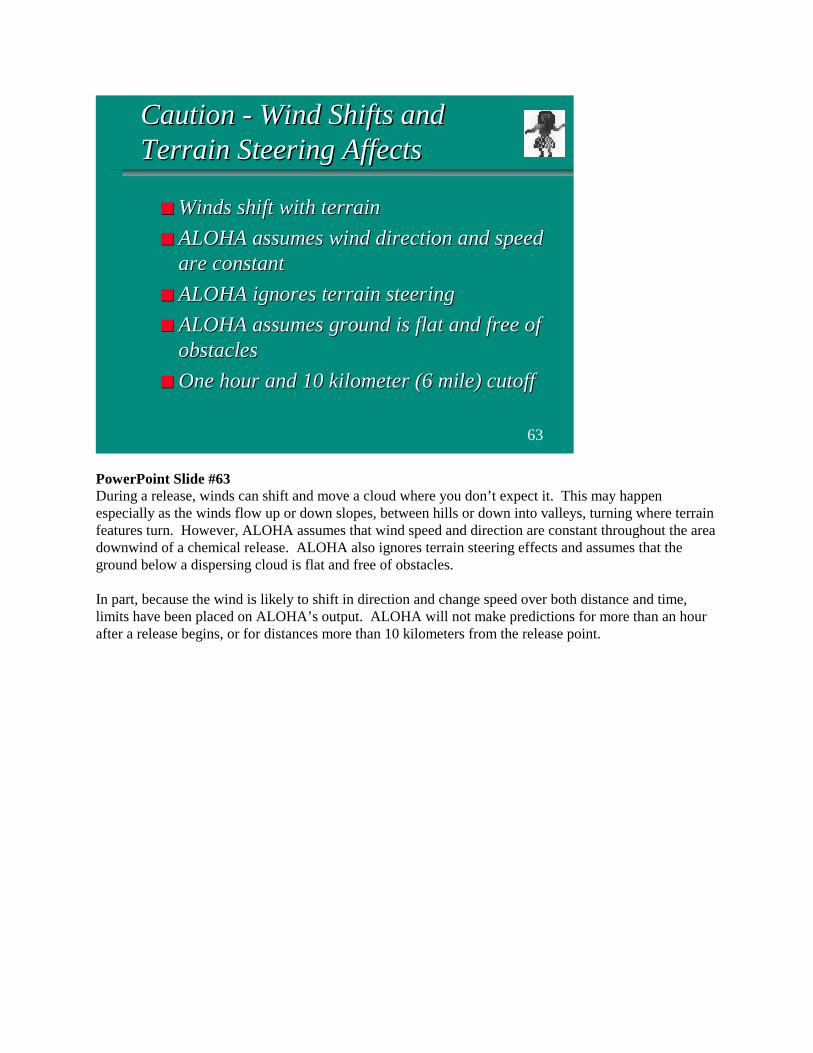
PowerPoint Slide #63During a release, winds can shift and move a cloud where you don’t expect it. This may happenespecially as the winds flow up or down slopes, between hills or down into valleys, turning where terrainfeatures turn. However, ALOHA assumes that wind speed and direction are constant throughout the areadownwind of a chemical release. ALOHA also ignores terrain steering effects and assumes that theground below a dispersing cloud is flat and free of obstacles.
In part, because the wind is likely to shift in direction and change speed over both distance and time,limits have been placed on ALOHA’s output. ALOHA will not make predictions for more than an hourafter a release begins, or for distances more than 10 kilometers from the release point.
63
Caution - Wind Shifts andCaution - Wind Shifts andTerrain Steering AffectsTerrain Steering Affects
■■ Winds shift with terrainWinds shift with terrain
■■ ALOHA assumes wind direction and speedALOHA assumes wind direction and speedare constantare constant
■■ ALOHA ignores terrain steeringALOHA ignores terrain steering
■■ ALOHA assumes ground is flat and free ofALOHA assumes ground is flat and free ofobstaclesobstacles
■■ One hour and 10 kilometer (6 mile) cutoffOne hour and 10 kilometer (6 mile) cutoff

PowerPoint Slide #64No one can predict gas concentrations at any particular instant downwind of a release with certainty,because they result partly from random chance. Particularly near the release source, gas concentrationsat any moment can be high in one location and low in another because wind eddies push a cloudunpredictably about.
To address this concentration patchiness near the source, ALOHA predicts concentrations that representaverages for time periods of several minutes ALOHA will not provide a number for distances less than100 yards.
64
Caution - ConcentrationCaution - ConcentrationPatchinessPatchiness
■■ PatchinessPatchiness difficult in modeling difficult in modeling
■■ ALOHA calculates averagesALOHA calculates averages
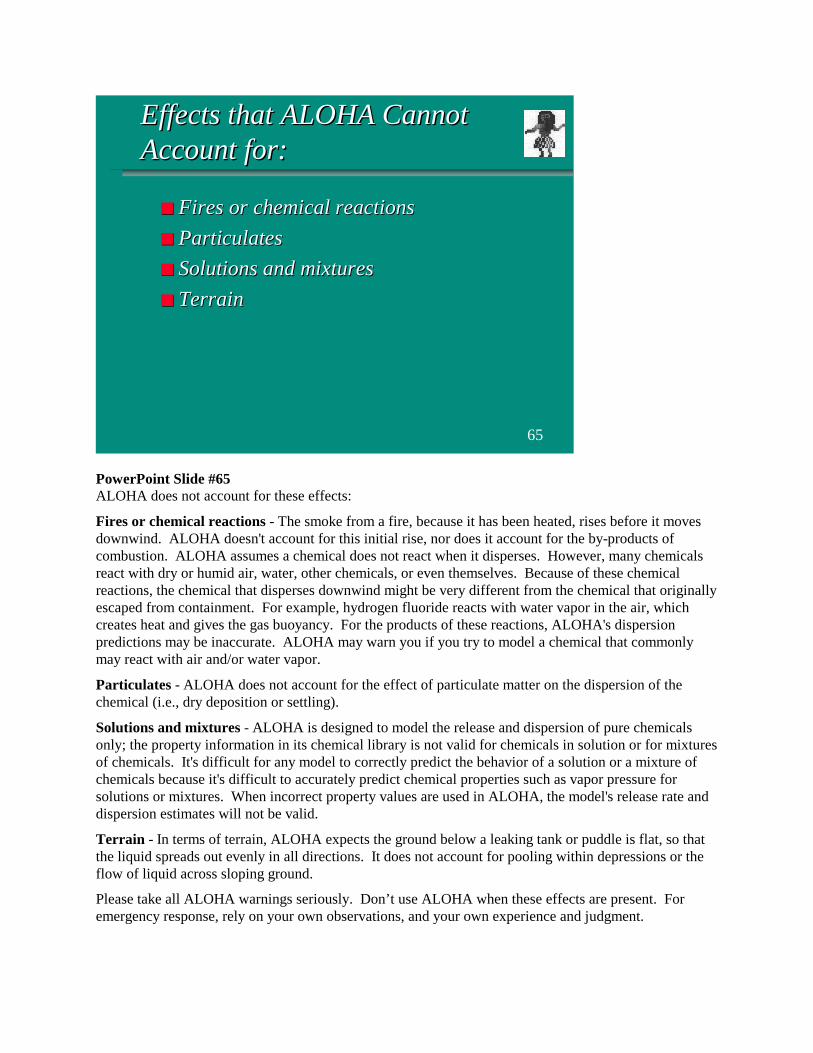
PowerPoint Slide #65ALOHA does not account for these effects:
Fires or chemical reactions - The smoke from a fire, because it has been heated, rises before it movesdownwind. ALOHA doesn't account for this initial rise, nor does it account for the by-products ofcombustion. ALOHA assumes a chemical does not react when it disperses. However, many chemicalsreact with dry or humid air, water, other chemicals, or even themselves. Because of these chemicalreactions, the chemical that disperses downwind might be very different from the chemical that originallyescaped from containment. For example, hydrogen fluoride reacts with water vapor in the air, whichcreates heat and gives the gas buoyancy. For the products of these reactions, ALOHA's dispersionpredictions may be inaccurate. ALOHA may warn you if you try to model a chemical that commonlymay react with air and/or water vapor.
Particulates - ALOHA does not account for the effect of particulate matter on the dispersion of thechemical (i.e., dry deposition or settling).
Solutions and mixtures - ALOHA is designed to model the release and dispersion of pure chemicalsonly; the property information in its chemical library is not valid for chemicals in solution or for mixturesof chemicals. It's difficult for any model to correctly predict the behavior of a solution or a mixture ofchemicals because it's difficult to accurately predict chemical properties such as vapor pressure forsolutions or mixtures. When incorrect property values are used in ALOHA, the model's release rate anddispersion estimates will not be valid.
Terrain - In terms of terrain, ALOHA expects the ground below a leaking tank or puddle is flat, so thatthe liquid spreads out evenly in all directions. It does not account for pooling within depressions or theflow of liquid across sloping ground.
Please take all ALOHA warnings seriously. Don’t use ALOHA when these effects are present. Foremergency response, rely on your own observations, and your own experience and judgment.
65
Effects that ALOHA CannotEffects that ALOHA CannotAccount for:Account for:
■■ Fires or chemical reactionsFires or chemical reactions
■■ ParticulatesParticulates
■■ Solutions and mixturesSolutions and mixtures
■■ TerrainTerrain
Script Notes for Session V
Day 2
V. Case Histories: Problems and Success Stories (10:25-11:10 a.m.)
Successes
• Hydrogen fluoride• Chemical Reaction
Problems
• Indoor release• Refrigerated Chemical• Release of Mixture
Take Home Points
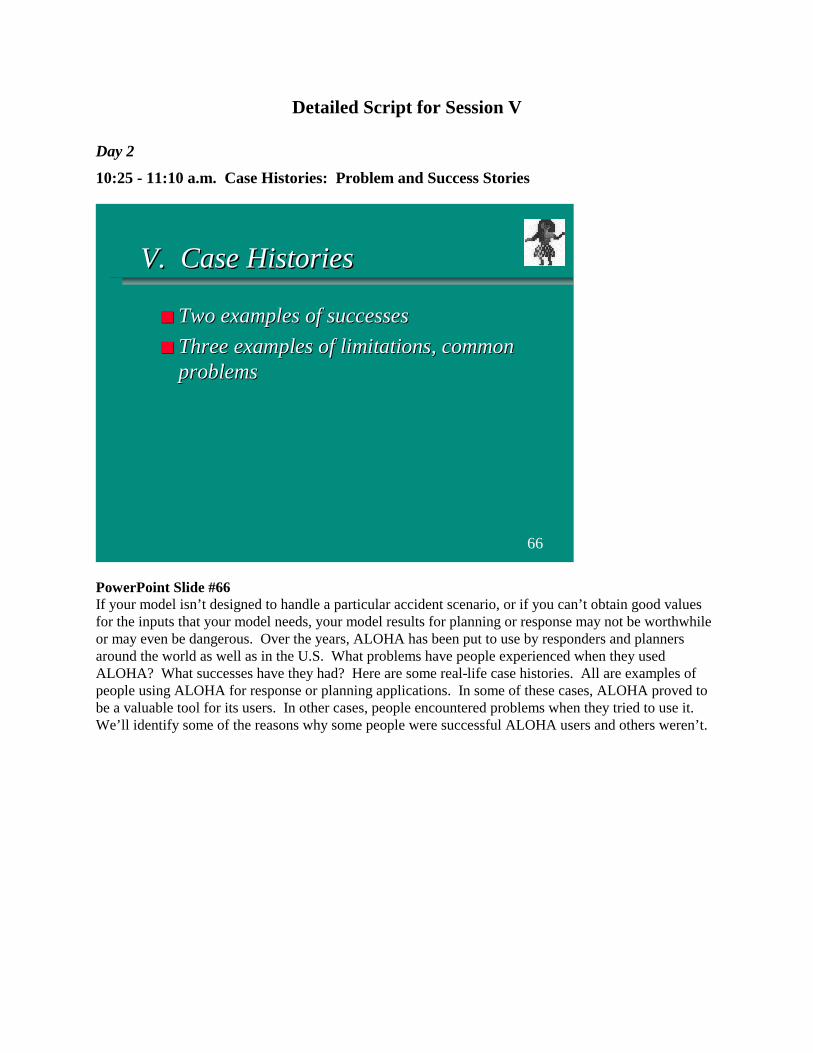
Detailed Script for Session V
Day 2
10:25 - 11:10 a.m. Case Histories: Problem and Success Stories
PowerPoint Slide #66If your model isn’t designed to handle a particular accident scenario, or if you can’t obtain good valuesfor the inputs that your model needs, your model results for planning or response may not be worthwhileor may even be dangerous. Over the years, ALOHA has been put to use by responders and plannersaround the world as well as in the U.S. What problems have people experienced when they usedALOHA? What successes have they had? Here are some real-life case histories. All are examples ofpeople using ALOHA for response or planning applications. In some of these cases, ALOHA proved tobe a valuable tool for its users. In other cases, people encountered problems when they tried to use it.We’ll identify some of the reasons why some people were successful ALOHA users and others weren’t.
66
V. Case HistoriesV. Case Histories
■■ Two examples of successesTwo examples of successes
■■ Three examples of limitations, commonThree examples of limitations, commonproblemsproblems
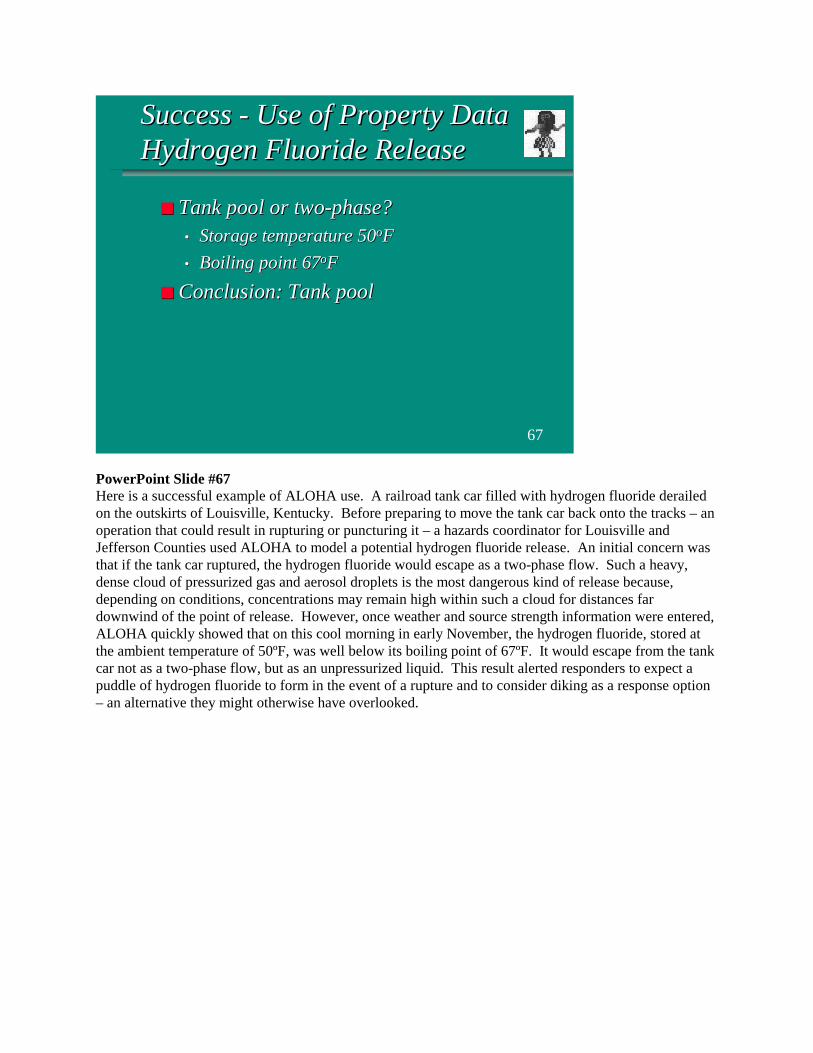
PowerPoint Slide #67Here is a successful example of ALOHA use. A railroad tank car filled with hydrogen fluoride derailedon the outskirts of Louisville, Kentucky. Before preparing to move the tank car back onto the tracks – anoperation that could result in rupturing or puncturing it – a hazards coordinator for Louisville andJefferson Counties used ALOHA to model a potential hydrogen fluoride release. An initial concern wasthat if the tank car ruptured, the hydrogen fluoride would escape as a two-phase flow. Such a heavy,dense cloud of pressurized gas and aerosol droplets is the most dangerous kind of release because,depending on conditions, concentrations may remain high within such a cloud for distances fardownwind of the point of release. However, once weather and source strength information were entered,ALOHA quickly showed that on this cool morning in early November, the hydrogen fluoride, stored atthe ambient temperature of 50ºF, was well below its boiling point of 67ºF. It would escape from the tankcar not as a two-phase flow, but as an unpressurized liquid. This result alerted responders to expect apuddle of hydrogen fluoride to form in the event of a rupture and to consider diking as a response option– an alternative they might otherwise have overlooked.
67
Success - Use of Property DataSuccess - Use of Property DataHydrogen Fluoride ReleaseHydrogen Fluoride Release
■■ Tank pool or two-phase?Tank pool or two-phase?•• Storage temperature 50Storage temperature 50ooFF
•• Boiling point 67Boiling point 67ooFF
■■ Conclusion: Tank poolConclusion: Tank pool
PowerPoint Slide #68Both sodium hypochlorite solution, a water purifier, and sulfuric acid, which is used to adjust pH, arestored at a sewage treatment plant. These two chemicals, if mixed, will react violently to producechlorine gas.
An environmental consultant used ALOHA to estimate how much sodium hypochlorite could be stored atthe plant without creating a significant chlorine exposure hazard to residents living beyond the plant’sfenceline. To do this, he made the conservative assumption that all the sodium hypochlorite would reactwith the sulfuric acid to produce the maximum possible amount of chlorine. He used basic stoichiometry(a method that allows you to estimate the quantities of constituents involved in a chemical reaction) toestimate how much chlorine would be evolved from the reaction of a given amount of sodiumhypochlorite with an unlimited amount of sulfuric acid. He assumed that the reaction, because it isviolent, would last for just a few minutes. He then modeled the resulting chlorine release in ALOHA byentering worst-case weather conditions, then choosing the Direct source option, entering the amount ofchlorine evolved from the reaction, and indicating that the release would be instantaneous. For his levelof concern, he chose chlorine’s Emergency Response Planning Guideline-2 (ERPG-2), an exposure limitthat is more applicable for general populations (in contrast, the immediately dangerous to life and health,or IDLH, values in ALOHA’s chemical library are more applicable for healthy adult workers). Heobtained footprints for a range of amounts of sodium hypochlorite that could react with sulfuric acidwithout producing a chlorine footprint longer than the distance to the fenceline.
68
Success - Address ChemicalSuccess - Address ChemicalReactionsReactions
■■ SodiumSodium hypochlorite hypochlorite and sulfuric acid are and sulfuric acid areused & stored at a sewage treatment plant.used & stored at a sewage treatment plant.
■■ If the two chemicals mix, they will reactIf the two chemicals mix, they will reactviolently and produce chlorine gas.violently and produce chlorine gas.
■■ ALOHA used to estimate how much sodiumALOHA used to estimate how much sodiumhypochloritehypochlorite could be stored without could be stored withoutcreating a significant chlorine explosioncreating a significant chlorine explosionhazard to residents outside the plant.hazard to residents outside the plant.
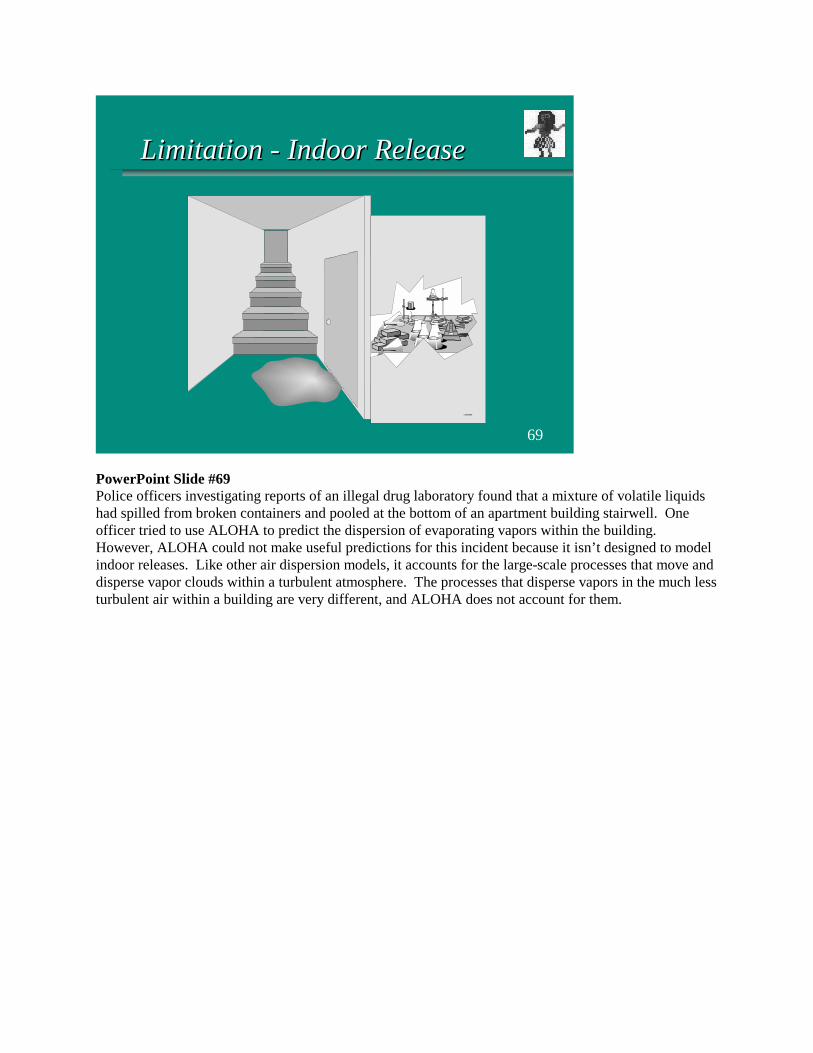
PowerPoint Slide #69Police officers investigating reports of an illegal drug laboratory found that a mixture of volatile liquidshad spilled from broken containers and pooled at the bottom of an apartment building stairwell. Oneofficer tried to use ALOHA to predict the dispersion of evaporating vapors within the building.However, ALOHA could not make useful predictions for this incident because it isn’t designed to modelindoor releases. Like other air dispersion models, it accounts for the large-scale processes that move anddisperse vapor clouds within a turbulent atmosphere. The processes that disperse vapors in the much lessturbulent air within a building are very different, and ALOHA does not account for them.
69
Limitation - Indoor ReleaseLimitation - Indoor Release
PowerPoint Slide #70During a practice drill, an emergency responder tried to model the release of refrigerated ammonia from abroken pipe connected to a storage tank. The user selected ALOHA’s “Pipe” source option, which isdesigned to model releases of pressurized gases from pipelines. However, refrigerated ammonia isliquid, not gas. This user needed to choose a different source option – ALOHA’s “Tank” option – forthis release.
70
Limitation - Release ofLimitation - Release ofRefrigerated ChemicalRefrigerated Chemical
■■ Ammonia tankAmmonia tank•• Refrigerated ammonia released from a brokenRefrigerated ammonia released from a broken
pipe connected to a storage tankpipe connected to a storage tank
•• User selected “Pipe” as sourceUser selected “Pipe” as source
•• “Pipe” source in ALOHA is for releases of“Pipe” source in ALOHA is for releases ofpressurized pressurized gasesgases from pipelines from pipelines
•• Refrigerated ammonia is a Refrigerated ammonia is a liquidliquid
•• User should select “Tank” as the sourceUser should select “Tank” as the source

PowerPoint Slide #71A tank car filled with oleum was being heated so that it could be off-loaded. When a safety valve blewout, a cloud of hazardous vapor escaped. Emergency responders tried to use ALOHA to model thisaccident, but quickly discovered that oleum is not included in ALOHA’s chemical property library. Thiscommon substance was left out of the library because it is a mixture of two chemicals, sulfuric acid andsulfur trioxide. ALOHA can model the dispersion of pure chemicals only, so its chemical library doesnot include any mixtures or solutions. Not recognizing that a substance is a mixture or solution ratherthan a pure chemical or not recognizing that ALOHA can model pure chemicals only are common errorsmade by ALOHA users.
Instructor Note: Sulfur trioxide could be used to address this problem (see student workbook).
71
Limitation - Release ofLimitation - Release of Oleum Oleum
■■ PicturePicture oleum oleum release release•• Tank car filled withTank car filled with oleum oleum
•• Tank was being heated in order to off-loadTank was being heated in order to off-load
•• Safety valve blew out and vapor was releasedSafety valve blew out and vapor was released
•• Responders tried to use ALOHA but found outResponders tried to use ALOHA but found outthatthat oleum oleum was not in library was not in library
•• BecauseBecause oleum oleum is a mixture of two chemicals, it is a mixture of two chemicals, itwas not inwas not in ALOHA’s ALOHA’s chemical library. ALOHA chemical library. ALOHAdoes does notnot model chemical mixtures model chemical mixtures
PowerPoint Slide #72An air dispersion model like ALOHA can be a great help to you when you need to respond to anaccidental hazardous chemical release or to plan for a potential accident. But these case histories showthat whether or not ALOHA is a useful tool can depend on the skill of its user. People are mostsuccessful when they:• recognize ALOHA’s main limitations. Not recognizing ALOHA’s limitations is one of the most
common mistakes made by users. In some of these examples, people did not recognize that ALOHAcan’t model indoor releases or mixtures.
• have some understanding of the chemical being modeled. ALOHA’s most successful userstypically have had at least some chemistry training and know that it’s important to find out as muchas you can about the chemical you’re trying to model.
• have practiced with ALOHA and understand basic air modeling concepts. Although ALOHA isrelatively easy to use, the concepts behind it can be complex. For that reason, as the people in someof these case histories discovered, it’s not hard to make errors when you use ALOHA. The best wayto ensure that you use the model safely and effectively is to practice with it as often as you can and tobecome familiar with the basics of air modeling.
72
Take Home PointsTake Home Points
■■ RecognizeRecognize ALOHA’s ALOHA’s main limitations main limitations
■■ Have some understanding of the chemicalsHave some understanding of the chemicalsbeing modeledbeing modeled
■■ Practice with ALOHA and understand basicPractice with ALOHA and understand basicair modeling conceptsair modeling concepts
Detailed Script for Session VI
Day 2
VI. Tools and More Tips for Running ALOHA (11:10 - 11:55 a.m.)
PowerPoint Slide #73 Aside from this course, there are other information sources available to help you decide if you arerunning ALOHA appropriately. These include the student workbook accompanying this course, theALOHA manual that you should have, short articles called “Ask Dr. ALOHA” that provide pointedadvice on common challenges and problems, and ALOHA Decision Keys. The ALOHA Decision Keysguides you with step by step questions to find out whether you can run a particular scenario in ALOHA,and if you can, what source option you should choose.
73
VI. Tools for Using ALOHAVI. Tools for Using ALOHA
■■ Student workbookStudent workbook
■■ ALOHA ManualALOHA Manual
■■ “Ask Dr. ALOHA”“Ask Dr. ALOHA”
■■ User groupsUser groups
■■ ALOHA Decision KeysALOHA Decision Keys
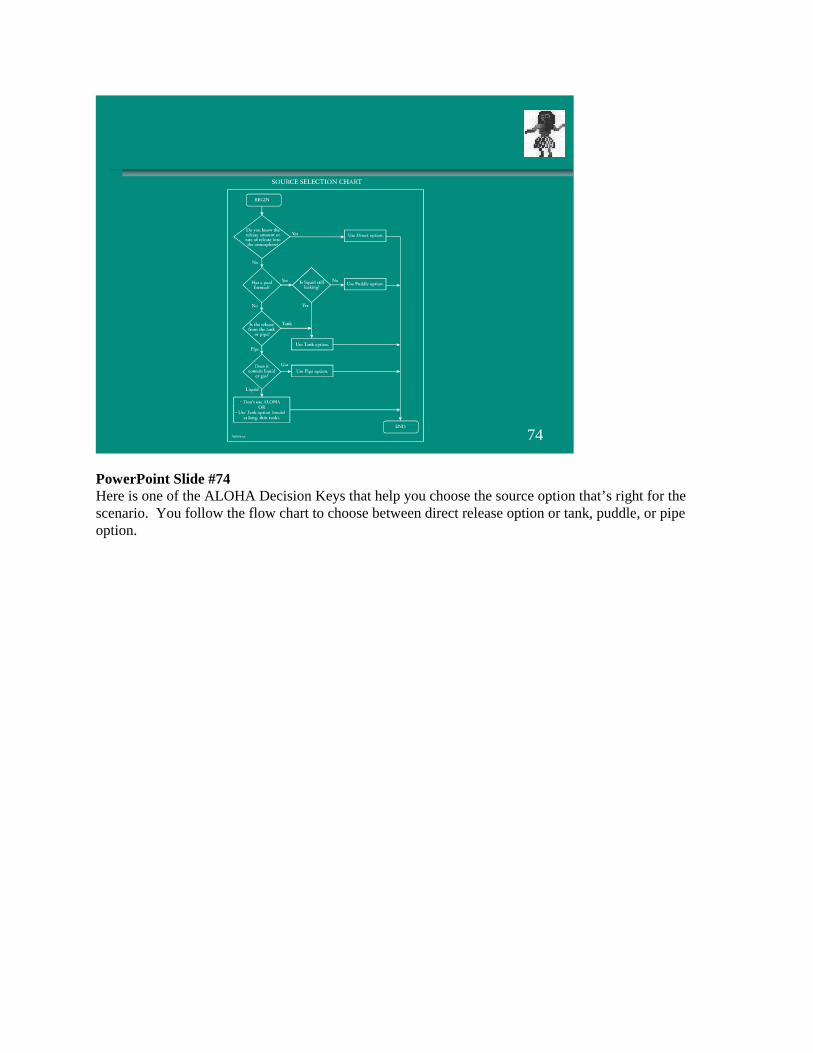
PowerPoint Slide #74 Here is one of the ALOHA Decision Keys that help you choose the source option that’s right for thescenario. You follow the flow chart to choose between direct release option or tank, puddle, or pipeoption.
74
PowerPoint Slide #75 Each of these is a lesson in itself. I will cover these in a brief level of detail over the next 30 minutes.
75
More Tips on Running ALOHAMore Tips on Running ALOHA
■■ InterpretingInterpreting ALOHA’s ALOHA’s lady bug lines lady bug lines
■■ Handling two-phase releasesHandling two-phase releases

PowerPoint Slide #76 Most emergency planners and responders are concerned with the furthest footprint distance, but plannersand responders should also be concerned that the cloud could blow outside the darkened footprint zone ifthe wind changes direction. Consequently, ALOHA’s footprint also displays lines outside of thefootprint that, together with the oval footprint, make the footprint plot look like a ladybug, hence thelines are called ladybug lines. What do you make of these ladybug lines? There is a Dr. ALOHA providing a detailed explanation ofthe ladybug lines but here is a short version. Wind direction is less predictable under unstableatmospheric conditions and when wind speed is slower. To see the effect of stability, look at the top andbottom figures. The ladybug lines are much wider for the bottom figure. This figure represents unstableatmospheres under A stability when wind direction is less predictable. In fact, the footprint shows thatthe wind could shift so substantially that the footprint could rotate almost completely around in eitherdirection. In contrast, the figure above represents stable atmospheres under F stability when winddirection is more predictable. The same sort of effects of narrow and wide ladybug lines occurs for lowand high wind speeds. Under low wind speeds, the ladybug lines are similar to the bottom figure andmay even be a circle.
76
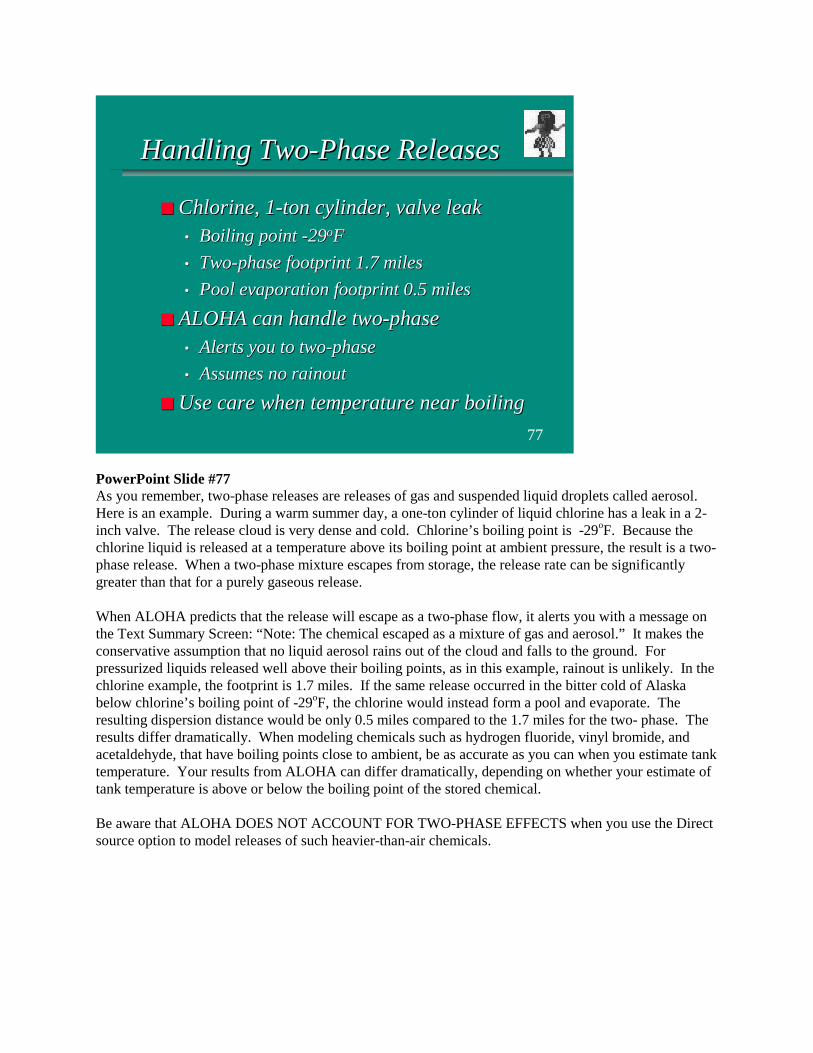
PowerPoint Slide #77 As you remember, two-phase releases are releases of gas and suspended liquid droplets called aerosol.Here is an example. During a warm summer day, a one-ton cylinder of liquid chlorine has a leak in a 2-inch valve. The release cloud is very dense and cold. Chlorine’s boiling point is -29oF. Because thechlorine liquid is released at a temperature above its boiling point at ambient pressure, the result is a two-phase release. When a two-phase mixture escapes from storage, the release rate can be significantlygreater than that for a purely gaseous release. When ALOHA predicts that the release will escape as a two-phase flow, it alerts you with a message onthe Text Summary Screen: “Note: The chemical escaped as a mixture of gas and aerosol.” It makes theconservative assumption that no liquid aerosol rains out of the cloud and falls to the ground. Forpressurized liquids released well above their boiling points, as in this example, rainout is unlikely. In thechlorine example, the footprint is 1.7 miles. If the same release occurred in the bitter cold of Alaskabelow chlorine’s boiling point of -29oF, the chlorine would instead form a pool and evaporate. Theresulting dispersion distance would be only 0.5 miles compared to the 1.7 miles for the two- phase. Theresults differ dramatically. When modeling chemicals such as hydrogen fluoride, vinyl bromide, andacetaldehyde, that have boiling points close to ambient, be as accurate as you can when you estimate tanktemperature. Your results from ALOHA can differ dramatically, depending on whether your estimate oftank temperature is above or below the boiling point of the stored chemical. Be aware that ALOHA DOES NOT ACCOUNT FOR TWO-PHASE EFFECTS when you use the Directsource option to model releases of such heavier-than-air chemicals.
77
Handling Two-Phase ReleasesHandling Two-Phase Releases
■■ Chlorine, 1-ton cylinder, valve leakChlorine, 1-ton cylinder, valve leak•• Boiling point -29Boiling point -29ooFF
•• Two-phase footprint 1.7 milesTwo-phase footprint 1.7 miles
•• Pool evaporation footprint 0.5 milesPool evaporation footprint 0.5 miles
■■ ALOHA can handle two-phaseALOHA can handle two-phase•• Alerts you to two-phaseAlerts you to two-phase
•• Assumes no rainoutAssumes no rainout
■■ Use care when temperature near boilingUse care when temperature near boiling

Script Notes for Session VII
Day 2
VII. ALOHA Use for Mapping and Meeting Federal Requirements (1:10-2:10 p.m.) ? Learning Objectives: Instructor discusses mapping footprint through use of ALOHA with CAMEO
and MARPLOT. Also, instructor describes how and when ALOHA can be used as a tool to supportrequirements of EPA’s Risk Management Program Rule.
Mapping
? Introduce MARPLOT and CAMEO Sharing Menu? Give general step-by-step instructions for displaying footprint on map Run a release scenario in ALOHA Open the map in MARPLOT Set the source point and plot the footprint? Give general step-by-step instructions for determining concentrations for location on map Choose a Concentration point? Show use of Search option to search for “objects that are inside of or touching the currently selected
object.” This can be used to select symbols for vulerable locations (such as schools and hospitals)within ALOHA’s footprint or confidence lines. Get information, then bring up the CAMEO recordsfor those locations.
? Compare use of ALOHA verses CAMEO’s Screenings & Scenarios (e.g. sulfuric acid examplewhere Screening may not be appropriate)
? Hands On Example Using ALOHA with CAMEO and MARPLOT
Meeting EPCRA Requirements
? Describe EPCRA? Discuss how ALOHA can meet requirement and how it compares with Green Book
Meeting Risk Managment Program Requirements under the Clean Air Act
? Describe Risk Management Program? Discuss how ALOHA can meet requirements and how it compares with Off-Site Consequence
Analysis Guidance
BREAK (2:10-2:25 p.m.)
Detailed Script for Session VII
Day 2
VII. ALOHA Use for Mapping and Meeting Federal Requirements (1:10 - 2:10 p.m.)
PowerPoint Slide #78 This session discusses how ALOHA footprints can be plotted on maps and how ALOHA can be used tomeet Federal program requirements.
78
VII. Use for Mapping andVII. Use for Mapping andMeeting Federal RequirementsMeeting Federal Requirements

PowerPoint Slide #79 It’s possible to plot an ALOHA footprint on a map. Maps are useful in assessing the relative riskspresented by various chemical release scenarios and in planning response actions that may be necessaryduring actual emergencies. ALOHA works in coordination with a mapping application calledMARPLOT. Both MARPLOT and ALOHA are components in CAMEO. Some of you may be familiarwith CAMEO and MARPLOT. Basically, MARPLOT enables the user to create or use an existing map.Meanwhile, the footprint is created in ALOHA. To overlay the footprint on a map, you can switchbetween the ALOHA and MARPLOT applications through their “Sharing” menus. [show how this isdone]
79
Mapping ALOHA FootprintsMapping ALOHA Footprints
■■ Footprint on map useful for consequenceFootprint on map useful for consequenceanalysisanalysis
■■ Plot ALOHAPlot ALOHA®® footprint using MARPLOT footprint using MARPLOT®®
mapping application in CAMEOmapping application in CAMEO®®
■■ “Sharing” menu links ALOHA and“Sharing” menu links ALOHA andMARPLOTMARPLOT
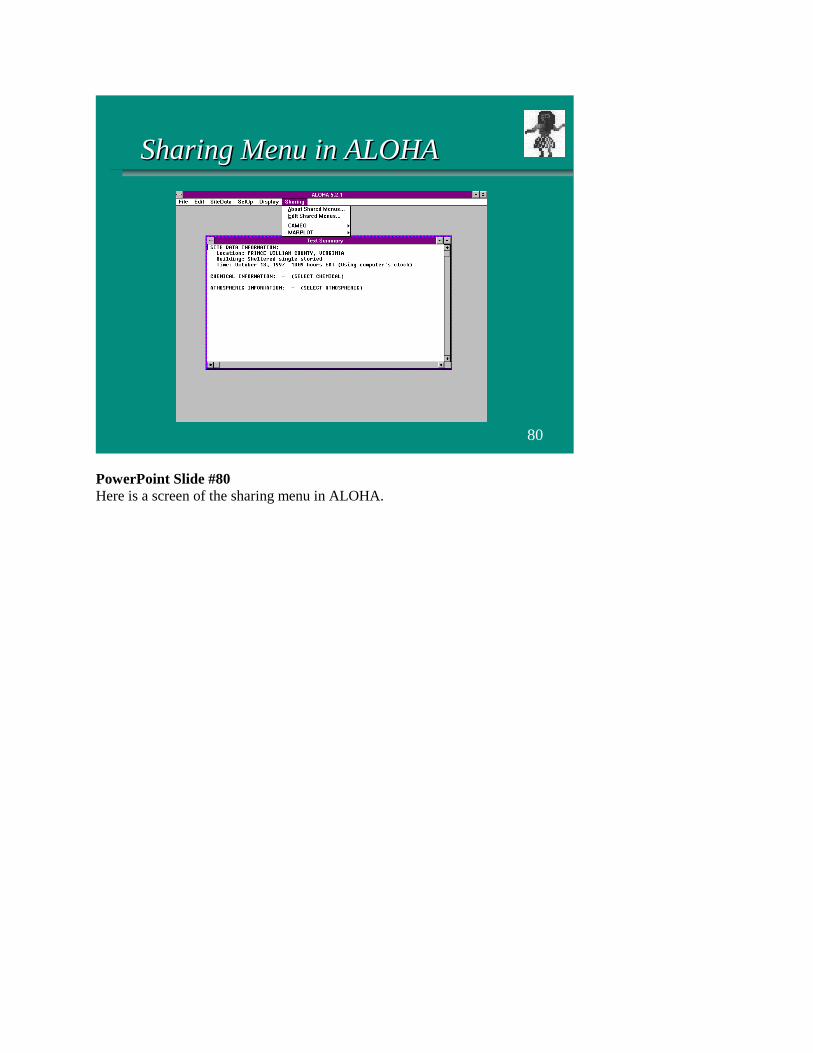
PowerPoint Slide #80 Here is a screen of the sharing menu in ALOHA.
80
Sharing Menu in ALOHASharing Menu in ALOHA
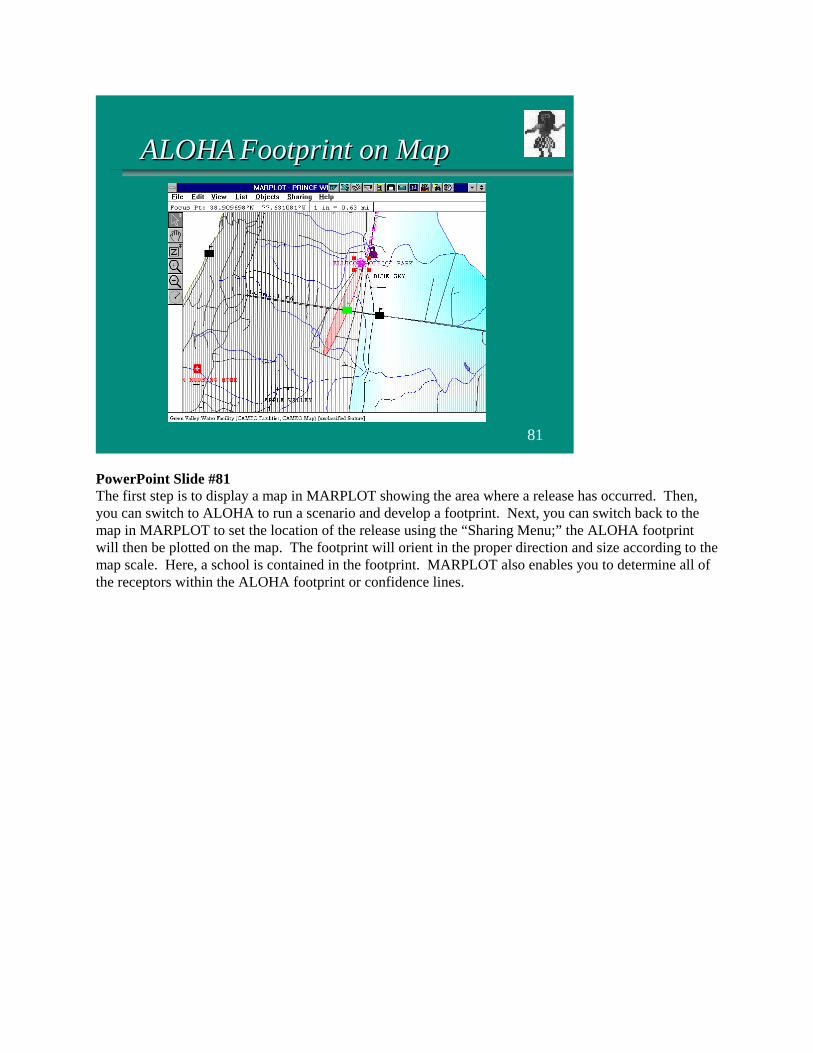
PowerPoint Slide #81 The first step is to display a map in MARPLOT showing the area where a release has occurred. Then,you can switch to ALOHA to run a scenario and develop a footprint. Next, you can switch back to themap in MARPLOT to set the location of the release using the “Sharing Menu;” the ALOHA footprintwill then be plotted on the map. The footprint will orient in the proper direction and size according to themap scale. Here, a school is contained in the footprint. MARPLOT also enables you to determine all ofthe receptors within the ALOHA footprint or confidence lines.
81
ALOHAALOHA Footprint on MapFootprint on Map
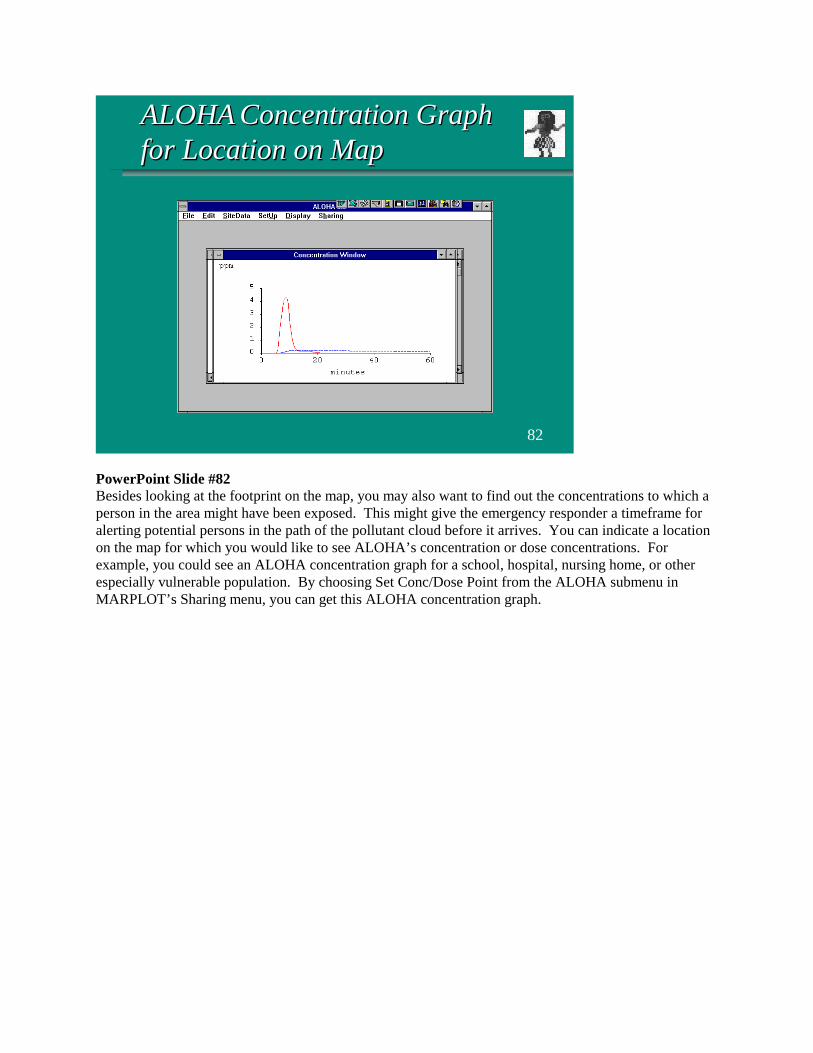
PowerPoint Slide #82 Besides looking at the footprint on the map, you may also want to find out the concentrations to which aperson in the area might have been exposed. This might give the emergency responder a timeframe foralerting potential persons in the path of the pollutant cloud before it arrives. You can indicate a locationon the map for which you would like to see ALOHA’s concentration or dose concentrations. Forexample, you could see an ALOHA concentration graph for a school, hospital, nursing home, or otherespecially vulnerable population. By choosing Set Conc/Dose Point from the ALOHA submenu inMARPLOT’s Sharing menu, you can get this ALOHA concentration graph.
82
ALOHAALOHA Concentration GraphConcentration Graph
for Location on Mapfor Location on Map

PowerPoint Slide #83 ALOHA can be very useful for emergency planners or industry personnel who want to carry out offsiteconsequence analyses for the planning required by the Emergency Planning and Community Right-to-Know Act, or EPCRA. Under EPCRA, local emergency planners must develop emergency plansconsidering the presence of extremely hazardous substances, or EHSs. ALOHA can also be used for conducting the hazard analysis required under section 112(r) of the CleanAir Act. EPA’s Risk Management Program rule under section 112(r) of the Clean Air Act requires somefacilities to conduct hazard assessments for processes with regulated substances, including offsiteconsequence analyses. Regulated facilities must model a worst-case release scenario, which has thepotential to cause the greatest offsite consequences. Facilities also may have to model other releasescenarios, called alternative scenarios. The worst-case and alternative scenario analyses must be reportedin a risk management plan (RMP).
83
Federal RequirementsFederal Requirements
■■ ALOHA useful for modeling:ALOHA useful for modeling:•• Emergency planning forEmergency planning for EHSs EHSs under under
Emergency Planning and Community Right-to-Emergency Planning and Community Right-to-Know Act (EPCRA)Know Act (EPCRA)
•• Hazard analysis under Clean Air Act sectionHazard analysis under Clean Air Act section112(r)112(r)
–– EPA’s Risk Management Program RuleEPA’s Risk Management Program Rule
PowerPoint Slide #84 Under EPCRA, local emergency planning committees (LEPCs) must prepare emergency plans thatinclude facilities with EHSs. Development of the plan should include a hazards analysis. To assist planners in assessing the hazards of airborne releases of EHSs, EPA published a guidancedocument, Technical Guidance for Hazards Analysis, or the “Green Book.” The Green Book providesmethods to estimate release rates and lookup tables to determine dispersion distances. The Green Bookcalculations and tables are computerized in CAMEO under the Screenings & Scenarios module. The Green Book guidance is not mandatory; planners can also use ALOHA or other models to modelairborne releases of EHSs, if they choose, or do no modeling (by using the Green Book).
84
ALOHA Use for EPCRAALOHA Use for EPCRA
■■ Emergency planners must developEmergency planners must developemergency planemergency plan•• Must include facilities withMust include facilities with EHSs EHSs
•• May include real-time hazards analysis forMay include real-time hazards analysis forEHSsEHSs
–– Green BookGreen Book
–– ALOHAALOHA
–– Other models or methodsOther models or methods
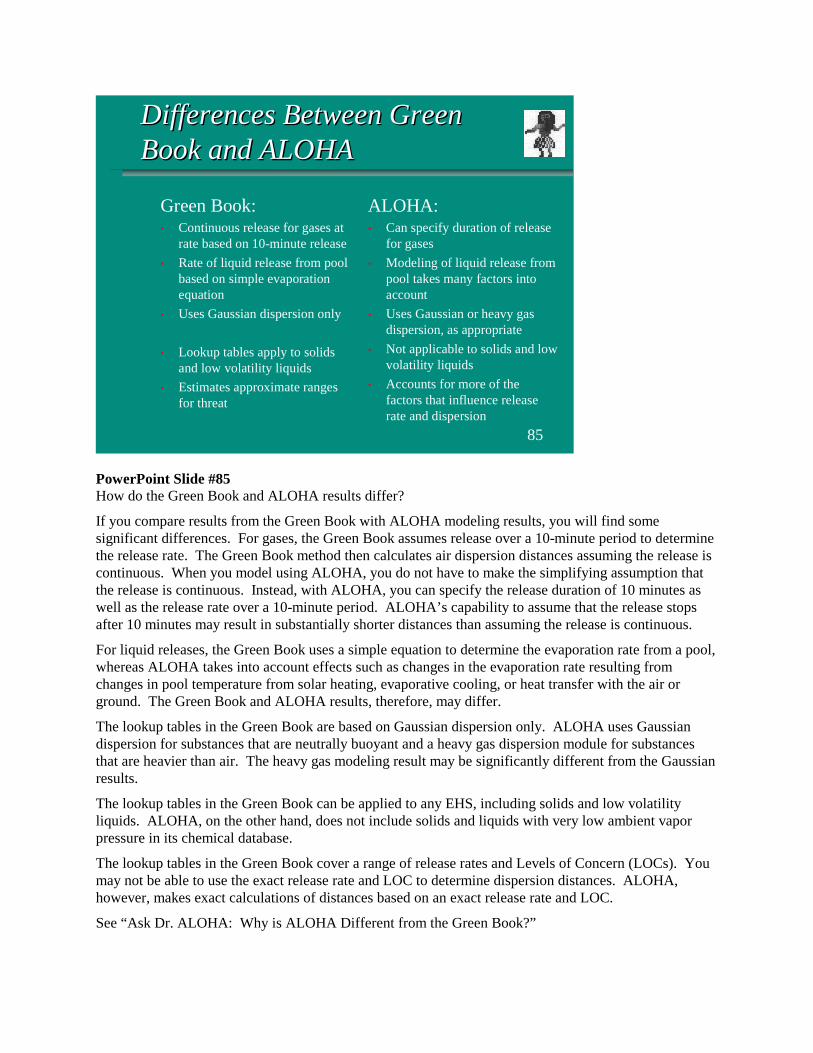
PowerPoint Slide #85 How do the Green Book and ALOHA results differ?
If you compare results from the Green Book with ALOHA modeling results, you will find somesignificant differences. For gases, the Green Book assumes release over a 10-minute period to determinethe release rate. The Green Book method then calculates air dispersion distances assuming the release iscontinuous. When you model using ALOHA, you do not have to make the simplifying assumption thatthe release is continuous. Instead, with ALOHA, you can specify the release duration of 10 minutes aswell as the release rate over a 10-minute period. ALOHA’s capability to assume that the release stopsafter 10 minutes may result in substantially shorter distances than assuming the release is continuous.
For liquid releases, the Green Book uses a simple equation to determine the evaporation rate from a pool,whereas ALOHA takes into account effects such as changes in the evaporation rate resulting fromchanges in pool temperature from solar heating, evaporative cooling, or heat transfer with the air orground. The Green Book and ALOHA results, therefore, may differ.
The lookup tables in the Green Book are based on Gaussian dispersion only. ALOHA uses Gaussiandispersion for substances that are neutrally buoyant and a heavy gas dispersion module for substancesthat are heavier than air. The heavy gas modeling result may be significantly different from the Gaussianresults.
The lookup tables in the Green Book can be applied to any EHS, including solids and low volatilityliquids. ALOHA, on the other hand, does not include solids and liquids with very low ambient vaporpressure in its chemical database.
The lookup tables in the Green Book cover a range of release rates and Levels of Concern (LOCs). Youmay not be able to use the exact release rate and LOC to determine dispersion distances. ALOHA,however, makes exact calculations of distances based on an exact release rate and LOC.
See “Ask Dr. ALOHA: Why is ALOHA Different from the Green Book?”
85
Differences Between GreenDifferences Between GreenBook and ALOHABook and ALOHA
Green Book:• Continuous release for gases at
rate based on 10-minute release
• Rate of liquid release from poolbased on simple evaporationequation
• Uses Gaussian dispersion only
• Lookup tables apply to solidsand low volatility liquids
• Estimates approximate rangesfor threat
ALOHA:• Can specify duration of release
for gases
• Modeling of liquid release frompool takes many factors intoaccount
• Uses Gaussian or heavy gasdispersion, as appropriate
• Not applicable to solids and lowvolatility liquids
• Accounts for more of thefactors that influence releaserate and dispersion
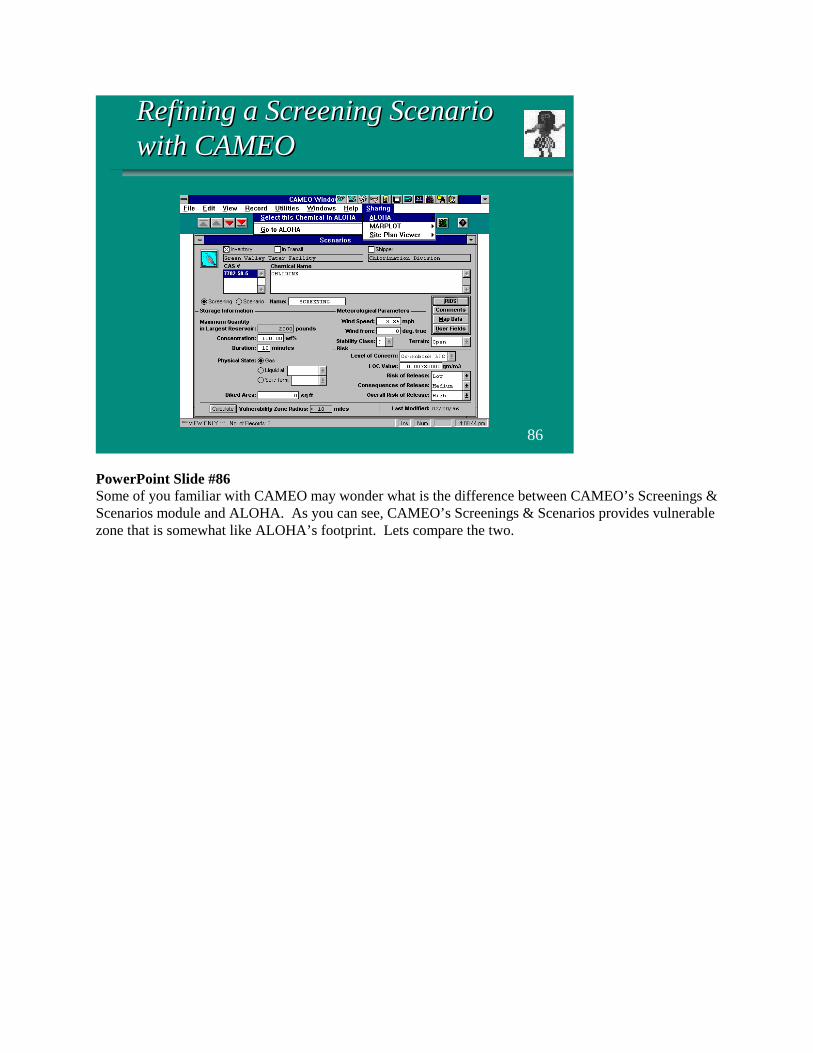
PowerPoint Slide #86 Some of you familiar with CAMEO may wonder what is the difference between CAMEO’s Screenings &Scenarios module and ALOHA. As you can see, CAMEO’s Screenings & Scenarios provides vulnerablezone that is somewhat like ALOHA’s footprint. Lets compare the two.
86
Refining a Screening ScenarioRefining a Screening Scenariowith CAMEOwith CAMEO
PowerPoint Slide #87 What’s the difference between an ALOHA footprint and the threat zone plotted by the Screenings &Scenarios module? The Screenings & Scenarios module makes the simplified threat zone calculationsdescribed in the EPA guidebook, Technical Guidance for Hazards Analysis, often called the “GreenBook.” It is intended for use as a screening tool for planners. In contrast, ALOHA makes a footprintestimate by taking into account many factors - such as additional properties of the chemical, weatherconditions, and the specific characteristics of the release - that are not included in Screenings &Scenarios calculations. ALOHA calculations are more complex and often predict the effects of aparticular release more accurately.
87
When to Use ALOHAWhen to Use ALOHA versusversus CAMEO’s CAMEO’s
Screenings & Scenarios?Screenings & Scenarios?
■■ CAMEO’sCAMEO’s Screenings & Scenarios is Screenings & Scenarios isprimarily a screening tool for planningprimarily a screening tool for planning
■■ ALOHA is more appropriate for emergencyALOHA is more appropriate for emergencyresponseresponse
■■ ALOHAALOHA handles more site- and release-handles more site- and release-
specific factorsspecific factors•• Hole size, vessel type, atmospheric conditionsHole size, vessel type, atmospheric conditions
PowerPoint Slide #88 Facilities subject to the RMP rule must model worst-case release scenarios for processes with regulatedsubstances. They also may have to model alternative release scenarios. Alternative scenario analysismay not be required for a process if the worst-case scenario shows no potential impact on the public. Regulated substances for the RMP include 77 toxic substances and 63 flammable substances. Facilitiesmay use any appropriate model or method, including ALOHA, to carry out the required consequenceanalyses, as long as they use the required assumptions. EPA has developed a draft guidance document,RMP Offsite Consequence Analysis Guidance, or OCA guidance, that includes methods for carrying outthe required offsite consequence analyses and lookup tables for estimating consequence distances. The rule specifies the assumptions that facilities must use for the analyses of the worst-case andalternative scenarios. For example, the rule specifies the endpoints for modeling, that the model usedmust appropriately account for gas density, and that urban or rural topography must be taken intoaccount.
88
RMP Offsite ConsequenceRMP Offsite ConsequenceAnalysisAnalysis
■■ ScenariosScenarios•• Worst caseWorst case
•• AlternativeAlternative
■■ ModelsModels•• OCA GuidanceOCA Guidance
•• ALOHAALOHA
•• Other appropriate modelsOther appropriate models
■■ Modeling parameters specified in ruleModeling parameters specified in rule•• Level of concern (worst case and alternative)Level of concern (worst case and alternative)
•• Wind speed and atmospheric stability (worst case)Wind speed and atmospheric stability (worst case)
•• Ground level release (worst case)Ground level release (worst case)
•• Appropriate gas density (worst case and alternative)Appropriate gas density (worst case and alternative)
PowerPoint Slide #89 Regulated facilities can use ALOHA to model worst-case scenarios for toxic substances, using therequired assumptions, and a variety of alternative scenarios. For the worst case scenario, facilities withmultiple regulated toxic substances may have to determine what scenario has the greatest potential tocause offsite effects. Facilities might want to use ALOHA for initial screening to choose the appropriateworst-case scenario. Planners or other interested parties might want to use ALOHA in reviewing offsite consequence analysisresults reported by regulated sources. You could compare the ALOHA results with the reported resultsand possibly flag results that look questionable, for example, results showing a much smaller offsiteimpact. You could ask the submittors to explain their results. Of course, the explanation could simply bethat different models sometimes produce very different results. For more information, see “Ask Dr. ALOHA: Using ALOHA to perform a worst-case consequenceanalysis” and “Using ALOHA to perform an alternative consequence analysis.”
89
Who Might Use ALOHA forWho Might Use ALOHA forRMP?RMP?
■■ FacilitiesFacilities•• Modeling for RMPModeling for RMP
•• Modeling for screeningModeling for screening
■■ PlannersPlanners•• Modeling for comparison with submitted resultsModeling for comparison with submitted results
PowerPoint Slide #90 ALOHA can model releases of most of the toxic substances.
Using ALOHA for the worst-case scenario analysis is a simple process, because the assumptions youneed are specified by the rule and you just have to enter them into the model along with the toxicchemical and the quantity released. You will have to specify the required endpoint level of concern inthe RMP rule for many of the chemicals, because the ALOHA default level of concern is the IDLH,which may not be the endpoint specified in the RMP rule. ALOHA will determine the correct model(Gaussian or dense gas) for the chemical.
You can easily and quickly model a variety of scenarios with ALOHA that could be alternative scenariosfor the RMP. For example, to model a leaking tank, you can specify a tank size and shape, the quantityof a chemical in the tank and its physical state and temperature, and the shape, size, and position of a holein the tank or in a pipe or valve.
ALOHA will take into account flashing releases of gases liquefied under pressure -- that is, when thepressure is suddenly released, by vessel failure for example, then some of the liquid immediatelyvaporizes, taking with it fine liquid droplets.
You might identify a possible alternative scenario involving a very short release of a gas -- a sudden puff-- that would be stopped very quickly (in less than a minute) by a block valve, for example. If you canestimate the quantity released this way, ALOHA can give you the dispersion distance if you specify aninstantaneous source.
Besides determining impact distances for the worst-case scenario for the RMP, facilities must report theresidential population within this impact distance. They also must report the presence of (not the numberof people in) locations where people might gather, such as schools, hospitals, parks, stores, and officebuildings. The mapping capability with MARPLOT used together with ALOHA will show theselocations. Specific types of environmental receptors within the impact distance also must be reported,
90
ALOHA Advantages for RMPALOHA Advantages for RMP
■■ Models toxic substancesModels toxic substances
■■ Handles required modeling parametersHandles required modeling parameters
■■ Can model many alternative scenarios quicklyCan model many alternative scenarios quickly
■■ Can model flashing releasesCan model flashing releases
■■ Can model puff releasesCan model puff releases
■■ MARPLOT used with ALOHA will show locationsMARPLOT used with ALOHA will show locationsof public and environmental receptorsof public and environmental receptors

including national or state parks and wildlife sanctuaries. ALOHA and MARPLOT will show theseareas as well.
For more information see “Ask Dr. ALOHA: Using ALOHA to perform a worst-case consequenceanalysis” and “Using ALOHA to perform an alternative consequence analysis.”
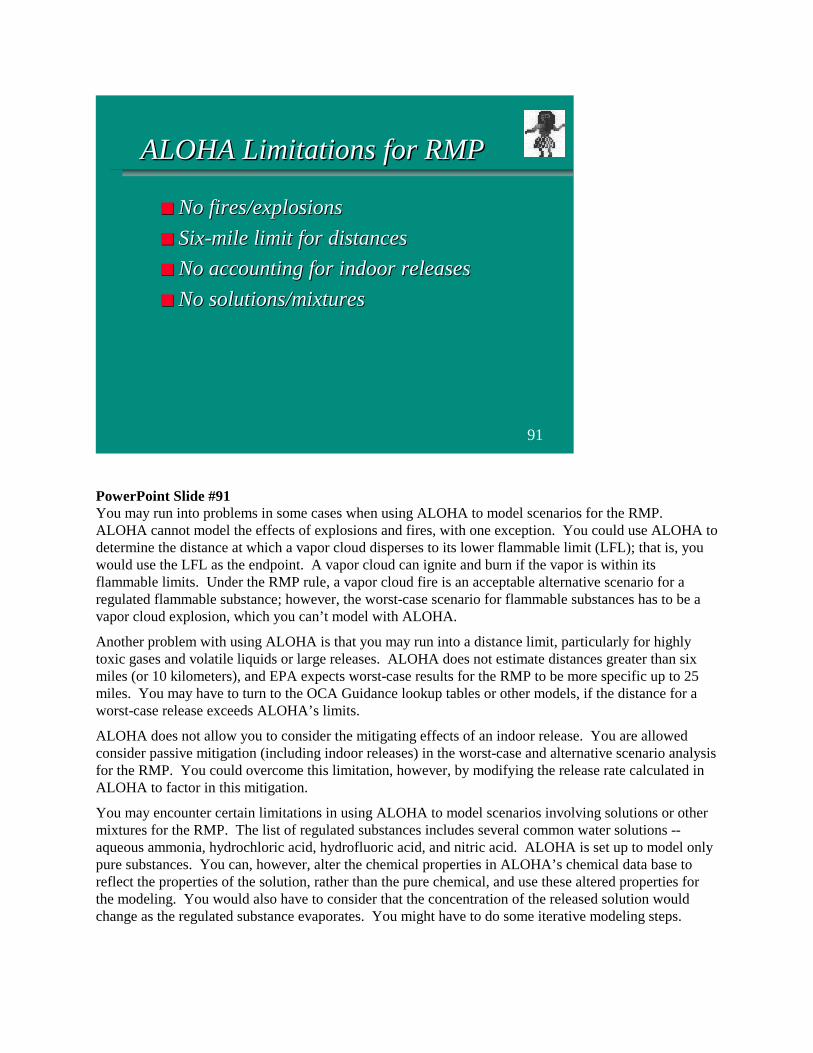
PowerPoint Slide #91 You may run into problems in some cases when using ALOHA to model scenarios for the RMP.ALOHA cannot model the effects of explosions and fires, with one exception. You could use ALOHA todetermine the distance at which a vapor cloud disperses to its lower flammable limit (LFL); that is, youwould use the LFL as the endpoint. A vapor cloud can ignite and burn if the vapor is within itsflammable limits. Under the RMP rule, a vapor cloud fire is an acceptable alternative scenario for aregulated flammable substance; however, the worst-case scenario for flammable substances has to be avapor cloud explosion, which you can’t model with ALOHA.
Another problem with using ALOHA is that you may run into a distance limit, particularly for highlytoxic gases and volatile liquids or large releases. ALOHA does not estimate distances greater than sixmiles (or 10 kilometers), and EPA expects worst-case results for the RMP to be more specific up to 25miles. You may have to turn to the OCA Guidance lookup tables or other models, if the distance for aworst-case release exceeds ALOHA’s limits.
ALOHA does not allow you to consider the mitigating effects of an indoor release. You are allowedconsider passive mitigation (including indoor releases) in the worst-case and alternative scenario analysisfor the RMP. You could overcome this limitation, however, by modifying the release rate calculated inALOHA to factor in this mitigation.
You may encounter certain limitations in using ALOHA to model scenarios involving solutions or othermixtures for the RMP. The list of regulated substances includes several common water solutions --aqueous ammonia, hydrochloric acid, hydrofluoric acid, and nitric acid. ALOHA is set up to model onlypure substances. You can, however, alter the chemical properties in ALOHA’s chemical data base toreflect the properties of the solution, rather than the pure chemical, and use these altered properties forthe modeling. You would also have to consider that the concentration of the released solution wouldchange as the regulated substance evaporates. You might have to do some iterative modeling steps.
91
ALOHA Limitations for RMPALOHA Limitations for RMP
■■ No fires/explosionsNo fires/explosions
■■ Six-mile limit for distancesSix-mile limit for distances
■■ No accounting for indoor releasesNo accounting for indoor releases
■■ No solutions/mixturesNo solutions/mixtures

Mixtures of regulated substances (other than the solutions that are specifically listed) also would presenta problem for modeling.
Limitations of ALOHA for RMP analysis are also discussed in “Ask Dr. ALOHA: Using ALOHA toperform a worst-case consequence analysis” and “Using ALOHA to perform an alternative consequenceanalysis.”
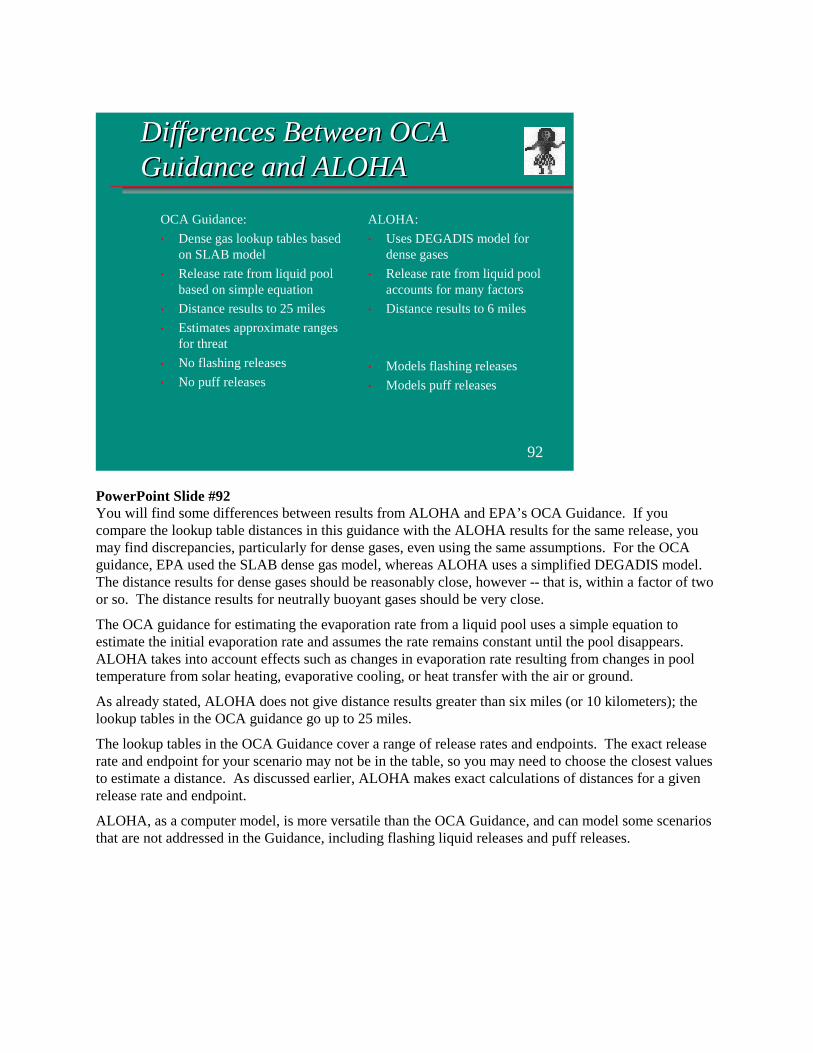
PowerPoint Slide #92 You will find some differences between results from ALOHA and EPA’s OCA Guidance. If youcompare the lookup table distances in this guidance with the ALOHA results for the same release, youmay find discrepancies, particularly for dense gases, even using the same assumptions. For the OCAguidance, EPA used the SLAB dense gas model, whereas ALOHA uses a simplified DEGADIS model.The distance results for dense gases should be reasonably close, however -- that is, within a factor of twoor so. The distance results for neutrally buoyant gases should be very close.
The OCA guidance for estimating the evaporation rate from a liquid pool uses a simple equation toestimate the initial evaporation rate and assumes the rate remains constant until the pool disappears.ALOHA takes into account effects such as changes in evaporation rate resulting from changes in pooltemperature from solar heating, evaporative cooling, or heat transfer with the air or ground.
As already stated, ALOHA does not give distance results greater than six miles (or 10 kilometers); thelookup tables in the OCA guidance go up to 25 miles.
The lookup tables in the OCA Guidance cover a range of release rates and endpoints. The exact releaserate and endpoint for your scenario may not be in the table, so you may need to choose the closest valuesto estimate a distance. As discussed earlier, ALOHA makes exact calculations of distances for a givenrelease rate and endpoint.
ALOHA, as a computer model, is more versatile than the OCA Guidance, and can model some scenariosthat are not addressed in the Guidance, including flashing liquid releases and puff releases.
92
Differences Between OCADifferences Between OCAGuidance and ALOHAGuidance and ALOHA
OCA Guidance:
• Dense gas lookup tables basedon SLAB model
• Release rate from liquid poolbased on simple equation
• Distance results to 25 miles
• Estimates approximate rangesfor threat
• No flashing releases
• No puff releases
ALOHA:
• Uses DEGADIS model fordense gases
• Release rate from liquid poolaccounts for many factors
• Distance results to 6 miles
• Models flashing releases
• Models puff releases

Script Notes for Session VIII
Day 2
VIII. Examples: Class Exercises and Scavenger Hunt (2:25-3:25 p.m.) ? Provide three different examples (see student workbook, let class try them and go over them)• Work through Dr. ALOHA’s Scavenger Hunt problems
Detailed Script for Session VIII
Day 2
VII. Examples: Class Exercises and Scavenger Hunt (2:25 - 3:25 p.m.)
PowerPoint Slide #93 Have students run three ALOHA examples in the student workbook. Suggested examples to run includethe releases in Phoenix, Indianapolis, and Albany. Also, as a group, have them answer questions in theDr. ALOHA Scavenger Hunt. Answer any and all questions that come up on modeling.
93
VIII. Examples/Scavenger HuntVIII. Examples/Scavenger Hunt

Script Notes for Session IX
Day 2
IX. Conclusion: MINI-Test and Wrap-up (3:25-4:10 p.m.) ? MINI-Test and Answers? Questions and Answers? Conclusion
Detailed Script for Session IX
Day 2
IX. Conclusion, MINI-Test and Wrap-up (3:25-4:10 p.m.)
During this session, instructor covers the MINI-Test, answers any questions, and provides a conclusionof the course.
PowerPoint Slide #94An air dispersion model like ALOHA can be a great help to you when you need to respond to anaccidental hazardous chemical release or to plan for a potential accident, but only if you know how to useit and when not to use it. Some ways to ensure that you can use the model safely and effectively are topractice with it as often as you can, to know the limitations for ALOHA, to become familiar with thebasics of air modeling, and to consider taking an introductory chemistry class.
94
IX. ConclusionsIX. Conclusions
■■ Keys to getting the most from ALOHAKeys to getting the most from ALOHA•• Practice modelingPractice modeling
•• KnowKnow ALOHA’s ALOHA’s limitations limitations
•• Be familiar with air dispersion modelingBe familiar with air dispersion modelingconceptsconcepts
•• Consider taking an introductory chemistryConsider taking an introductory chemistryclassclass
•• Access to chemical libraryAccess to chemical library
MINI-Test
Please answer the following questions to “test” your knowledge of ALOHA:
1. What is the IDLH of Ammonia?
300 ppm
2. True or False. The IDLH for Ammonia or any other chemical is permanently set, and will notchange.
False. Any toxicity guideline level used as a level of concern can be revised if newinformation or study results become available.
3. What generally would happen to a footprint distance if the level of concern for Ammonia wasreduced by 1/2?
The footprint distance would be larger. However, it would not simply be larger by afactor of 2 because dispersion calculations have many factors with complex relationships.
4. You decide you would like to use a reference dose (RfD) as a level of concern. The RfDvalue for your chemical is 5 mg/kg-day. Will you have a problem entering this value?
Yes. The units are inappropriate and the value can not be used. ALOHA only acceptslevels of concern with units of concentrations, such as ppm or milligrams/cubic meter.
5. Ammonia liquified under pressure is released at a temperature of 75oF. Will it be a gas,liquid, or two-phase release?
Two-phase. Ammonia’s boiling point is -28.17 oF. It will likely be a mixture of gas andfine liquid droplets (aerosols).
6. True or False. The only way to evaluate the concentration at a specific location is to select alocation in the Footprint Window.
False. Relative or Fixed coordinates can also be selected from the Concentrationselection under the Display menu.
7. A rupture occurs in a tank holding hydrochloric and sulfuric acid. There is, however, no fireor chemical reaction. Is it proper to use ALOHA in this situation?
No. ALOHA does not incorporate effects of chemical mixtures.
8. How would you use ALOHA to calculate the impact distance of a methanol fire?
You can’t; ALOHA does not handle fires.
9. Methanol is released, but does not explode or catch on fire. Can ALOHA be used at all to seeif it could explode or catch on fire?
Yes. The Lower Explosive Limit (LEL) or Lower Flammability Limit (LFL), or afraction of the limit, could be used as a level of concern. ALOHA would then predict thearea within which mathanol concentrations might become high enough to be flammable.
10. True or False. ALOHA’s results are easier to generate and are therefore more accurate whenthe wind speeds are very low.
False. Caution should be used when interpreting results from modeling with very lowwind speeds (as displayed in the Limitations window when first beginning ALOHA).The direction of slower winds are less predictable. Also, remember that ALOHA alwaysgives ballpark estimates.
11. Why should you use caution when running ALOHA for releases in Hawaii?
The effects of terrain steering and wind shifts may be an issue in this and otherenvironments with large hills or mountains.
12. During the night there is a release. In the morning, your co-worker runs ALOHA using thecomputer’s internal clock and atmospheric stability B. Would you believe the results?
No. The actual time of the release was not used. Atmospheric stability B occurs onlyduring the daytime.
13. ALOHA would not allow me to select a source (pool, tank, pipe) because the choices aregreyed out. What could be wrong?
Either you didn’t select a location or chemical yet, or you haven’t entered weatherinformation.
14. True or false. An inversion entraps a chemical and reduces the impact distance of thechemical.
False. An inversion does entrap a chemical, but it may actually extend the impactdistance. This is because a chemical will not likely disperse above a specific inversionheight.
15. True or false. Changing from F stability to A stability will decrease the footprint length.
True. Generally increasing the stability makes the footprint longer. F stability is muchmore stable than A.
16. What are 3 reasons to use ALOHA versus CAMEO’s Screenings & Scenarios?
1. ALOHA is more appropriate for emergency response. Screenings & Scenarios isintended to be used for planning.2. ALOHA uses more site-specific and chemical-specific input factors and is often moreaccurate.3. ALOHA can model dense gases.
17. What is the upper limit in estimating distances in ALOHA?
6 miles (10 kilometers).
18. Can you use ALOHA to satisfy EPA’s Risk Management Program requirements?
Yes, but ALOHA has limitations, including: can’t model fires or explosions, has a 6-mile limit,can’t account for indoor releases, and doesn’t model solutions or mixtures.