Almond Insights 2016-18-00000 · The Almond Board of Australia is pleased to provide this...
20
Transcript of Almond Insights 2016-18-00000 · The Almond Board of Australia is pleased to provide this...
..........................................................................................................................................................................................................................
The Almond Board of Australia is pleased to provide this publication that gives a statistical insight into the story behind Australia’s almonds
Australianalmonds were
exported to52 countries
in 2017.............................................................
This project has been funded by Hort Innovation, using the Almond research and development levy and contributions from the Australian Government. Hort Innovation is the grower owned, not-for-profit research and development corporation for Australian horticulture.
This publication was produced by the Almond Board of Australia. For further information contact:
Almond Board of Australia PO Box 1507, LOXTON, SA. 5333, Australia. T +61 8 8584 7053E [email protected]

CONTENTSONTENTS
ABA ROLE ........................................................................................ 2
INTRODUCTION ........................................................................... 3
INDUSTRY OVERVIEW ............................................................. 4
PLANTINGS ..................................................................................... 6
ENVIRONMENT ............................................................................ 8
PRODUCTION ................................................................................ 9
SUPPLY & DEMAND ..............................................................11
CONSUMPTION .........................................................................12
EXPORTS ........................................................................................13
WORLD EXPORT DESTINATIONS ..................................14
GLOBAL ..........................................................................................15
ALMOND MARKETERS ........................................................17
ABA activitiescover 99%
of production.
As the Australian almond industry’s peak body, the ABA facilitates growth of the industry, seeks to maximise its profitability and ensure its sustainability, by providing a platform for industry members to collectively respond to industry wide issues, invest in research and market development, share knowledge and interact with government and other stakeholders.
PAGE 1
...........................................................................................................................................................................................................................
............................................................

PAGE 2
ABA ROLE
THE ROLE OF THE ALMOND BOARD OF AUSTRALIA..........................................................................................................................................................................................................................
The Almond Board of Australia is guiding the industry’s development by implementing our strategic plan for Australian almonds. The plan involves building domestic consumption, developing brand awareness of Australian almonds in export markets and addressing market access issues. Also addressed in the plan are productivity issues such as: yield improvement; surety of inputs, cost of inputs and their efficient use; and better managing risk from pests, weath-er, disease, and ensuring appropriate quality in terms of food safety and meeting customer expectations.
To achieve these strategies, the ABA relies on the knowledge of industry members and the development of technologies and the filling of knowledge gaps from research providers as well as information from other sources including suppliers.
The implementation of the industry’s strategic plan is overseen by the ABA Board representing 99% of production who guide the ABA’s endeavours to facilitate an enhanced operating environment for industry stakeholders by providing advocacy on industry wide issues such as market access, biosecurity, research, water, energy, labour, pollination services, and transport.
The ABA supports the
development of the Almond industry
............................................................

............................................................
INTRODUCTIONNTRODUCTION
PAGE 3
The 2017 Australian almond crop was 79,461 tonnes. Our industry’s expected growth to 90,000 tonnes has not yet eventuated as poor pollination, frost, pest and disease issues have impacted the outlook.
The domestic market has continued to grow and gains are now being made on a high average consumption level per person of over one kilogram. 48.1% of Australian households purchased almonds during the 2017/18 marketing year. Approximately half of the Australian almonds consumed domestically are in manufactured products where almonds remain by far the number one nut choice for inclusion in recipes of new products, particularly for protein bars, snack packs and breakfast cereals. Almond milk also continues to grow.
The three key drivers of almonds popularity are their enjoyable taste, broad versatility in usage as witnessed in their inclusion in cuisines around the world and very positive health attributes. During 2017, a review of the nutritional research relating to almonds highlighted that almonds can be acknowledged as ‘Heart Healthy’ on pack. Research is also showing benefits for diabetes, brain health, gut health, and satiety to avoid obesity.
With static production and increasing sales to the domestic market, less tonnage was exported. The drop in sales in the second half of the marketing year is indicative that a larger export tonnage is achievable if there was available supply. A change of shipments between export markets has occurred with growth in some markets shifting supply away from others. Despite the slight fall in export tonnage, almonds remain Australia’s most valuable horticultural export product. This reduced volume available for the export market will continue in the 2018/19 marketing year due to the wet and windy weather during the 2017 pollination season and followed by widespread frosts reducing the 2018 crop to well below 80,000 tonnes. This is the smallest crop since 2014 and was unexpected given the increase in orchard maturity and the coming into production of some newer orchard plantings.
The plateauing of production in the past few years is not expected to continue if nature enables the true productive capacity of the industry to be delivered. The large numbers of trees planted in 2016 and again in 2017 will soon add tonnage and we will again be in a position to grow export volume. The Californian industry is also expanding as is the Spanish. Global almond production is moving towards a 50% growth in supply over the five-year period from 2017. Such growth has led to an increase in world demand via lower but more sustainable pricing. US domestic and export shipments have been setting monthly records and leading towards a reduced ‘carry forward’ inventory level going into their 2018-19 marketing year commencing in August.
Almonds remain
Australia’smost valuable
horticultural export product.
...........................................................................................................................................................................................................................
The information contained in this booklet provides industry stakeholders, government and those in the broader community with the key statistics on the productive capacity, crops, markets and demand for Australian almonds within the global context.
The booklet is prepared on a marketing year basis spanning March to February and based on data provided to the ABA from growers, processors and marketers on a confidential basis. Information was also sourced from the Australian Bureau of Statistics (ABS), Australian Nut Industry Council (ANIC), International Nut and Dried Fruit Council (INC), Almond Board of California (ABC), The Nielsen Company and Innova Market Insights. This assistance is gratefully acknowledged.
..........................................................................................................................................................................................................................
Neale Bennett - ChairRoss Skinner - CEO

PAGE 4
INDUSTRY OVERVIEW
Almonds were first planted in Australia in Kangaroo Island in 1836 and soon spread to private gardens throughout Adelaide and other South Australian towns. Australian production is centered in the Murray Valley, eastward from the Northern Adelaide Plains to the Riverland, Sunraysia and Riverina regions. Some smaller orchards still remain at Willunga, the pioneering region for Australian almonds. The most recent area to be planted is the Swan region of Western Australia.
The total area planted to almonds has increased from 3,546 hectares in 2000 to 39,662 in 2017, representing an eleven-fold increase in orchard area and taking the number of almond trees planted on commercial orchards past 11 million. Plantings increased rapidly during 2006 and 2007 when over 12,500 hectares of orchard were established. In the ensuing eight-year period plantings were steady with approximately 7,000 hectares added.
Large investments in new plantings occurred during winter 2016 and 2017 totaling a further 9,000 hectares planted. Being guided by tree orders with nurseries, the planting in 2018 will slow in pace.
Almond trees take three years to bear a crop and around seven years to reach mature production levels at conventional tree spacing. Presently, 10,724 hectares or 26.7% of orchard plantings are not yet bearing a crop, and 29.6% of bearing trees are not yet fully mature. Australian almond production will continue to trend upwards in coming years towards more than 120,000 tonnes regardless of future plantings, and may be significantly larger if orchard development continues as planned.
27% of orchardplanting are not yetbearing & 30% arenot yet fully mature.
AdelaideRiverland
Sunraysia
Riverina
Swan
1-49 Hectares 63%
PROPERTY SIZE BY GROWER
------------------------------------------4949494994949444494449944449499499449494494949444944944494949999994949494949949949494494944494449999494949499994949449494444449449949994994949494944494444499494949494949499499494944444449949994994949444444444449949994999999944444944444444494994999494944444444444999994949999999944444444444944494999949499999494449444444494999499999494444444499999949444494999999994949449494449499949999494944444494944449499994994444444494444499944444449999949444444444999444444499444944494944444999994949494499994449449944449944449999944999944449999944499 HHHHHHHHHHHHHHHHHHHHHHHHHHHHHHHHHHHHHHHHHHHHHHHHHHHHHHHHHHHHHHHHHHHHHHHHHHHHHHHHHHHHHHHHHHHHHHHHHHHHHHHHHHHHHHHHHHHHHHHHHHHHHHHHHHHHHHHHHHHHHHHHHHHHHHHHHHHHHHHHHHHHHHHHHHHHHHHHHHHHHHHHHHHHHHHHHHHHHHHHHHHHHHHHHHHHHHHHHHHHHHHHHHHHHHHHHHHHHHHHHHHHHHHHHHHHHHHHHHHHHHHHHHHHHHHeeeceeeceeeeeeeeeeecececececceccccecccceceeeeececeeceeecececcccccceccceeeeeeeeeeecececececcccccccccceeeeeeeceececececeeccccccecceccceeeecececeeeececcccceccceceeeececeeecceccccececeeceececcccccecececeeeececceccceeceececcceecececeeeeeceececccccecececccecececeececeeeeccccceceeececccceeeeeceeeceeeeceeecceeeeeeeecceeeeeeeeeceeeeeeecctatattttttttattttatatttttttaatatattttttattttattttttatttattttttttttatattttatatttaaaaaaaaaattttttaaaaaaaaaaaaattttttaaaaaaaataaaatatattattttaaaaaaaaaaaaaatttattttataaaaaaaaaaatttttatataaaaaaatatatttattaaataaaaaatatatatttttataaataaatataaatatatatatttttaaaaaataatatttttatatttatataaataaaaatatttttataaatatatttatataataaataaaatattattaataaaattttttataataaatataattataaatttaaaattttttaaaaaaaaaattataaaaaaaattttttaaattataatttttttaarrrrrrrrrrrrrrrrrrrrrrrrrrrrr1-1-11-1111-1-11111-1-1111-1-11111-11-1111-11-1-11-11-11-11-1111-1111--1-11-11111111-1-11-1111-1-111-11-11111-111-11111111-11-1-11111-1111---1111-11-111111-1-11111111----1-111-111--1111-1111111---1111111111111111111111111111111111111111111 aaaaaaaaaaaaaaaaaaarerrrerrererererereeeereereeeerereeeeeererrerrerrrrrreeeeeereeeeeeererrrererrereeereeeeeeeeererererrererrrreeeereeeeeeeererererrrrrrereereeerereereeeeeeeeererrrrerrereereeeereeeeererrrrrereeeeeereerereererrrreeeeeeeeeerrrrrrreeeeeeeereeeeeeererrrrrerereeeeeeeeeeererrrrrrerreeeeeereeeeeeerrrreeeeereeeeeeererrrrrereeereereeeeerererrrreeeeeeeeeeererrrererrrreeeeeerrrrrrreeeereerrrrreeeeeereerrrrrreeeeeeeeerrrreeeeeeeeeerreeeeererrrreeeeerreeeeeesssssssssssssssssssssssssssssssssssssssssssssssss sssssssssssssssssssssssssssssssssssssssssssssssssssssssssssssssssssssssssssssssssssssssssssssssssssssssssssssssssssssssssssss sss 663363633663633363336636666666666363636666363333636336363336666666366663666663333633633336363366666666663636663333333336333333366666366663333333333336366636366666663663666633336333633363336663663663636363666336333633336336366366666666366666333336336363333363636663636666636333363633336363636363636366333633633336366636636366663633336336363636366333336333366636666366366366363333363363666666636666333333333636636363663636636666633363366666666663663363333336366666663333363636666333333333333636666633333336366666663633333333336666333336666663633336333336363333666633333666633333363333363333366666 %%%%%%%%%%%%%%%%%%%%%%%%%%%%%%%%%%%%%%%%%%%%%%%%%%%%%%%%%%%%%%%%%%%%%%%%%%%%%%%%%%%%%%%%%%%%%%%%%%%%%%%%%%%%%%%%%%%%%%%%%%%%%%%%%%%%%%%%%%%%%%%%%%%%%%%%%%%%%%%%%%%%%%%%%%%%%%%%%%%%%%%%%%%%%%%%%%%%%%%%%%%%%%%%%%%%%%%%%%%%%%%%%%%%%%%%%%%%%%%%%%%%%%%%%%%%%%%%%%%%%%%%%%%%%%%%%%%%%%%%%%%%%%%%%%%%%%%%%%%%%%%%%%%%%%%%%%%%%%%%%%%%%%%%%%%%%%%%%%%%%%%%%%%%%%%%%%%%%%%%%%%%%%%%%%%%%%%%%%%%%%%%%%%%%%%%%%%%
............................................................
...............................................................
ALMOST 75% OFAUSTRALIAN ALMONDPROPERTIES ARE 100 HECTARES OR LESS ................................................................................................................................................................................................
150-199 Hectares 7%
200 + Hectares 14%
100-149 Hectares 6%
50-99 Hectares 10%
1-49 Hectares 63%
PAGE 5
INDUSTRY OVERVIEW
For every one tonne of almonds sold in Australia,2.4 tonneswere exported.
............................................................
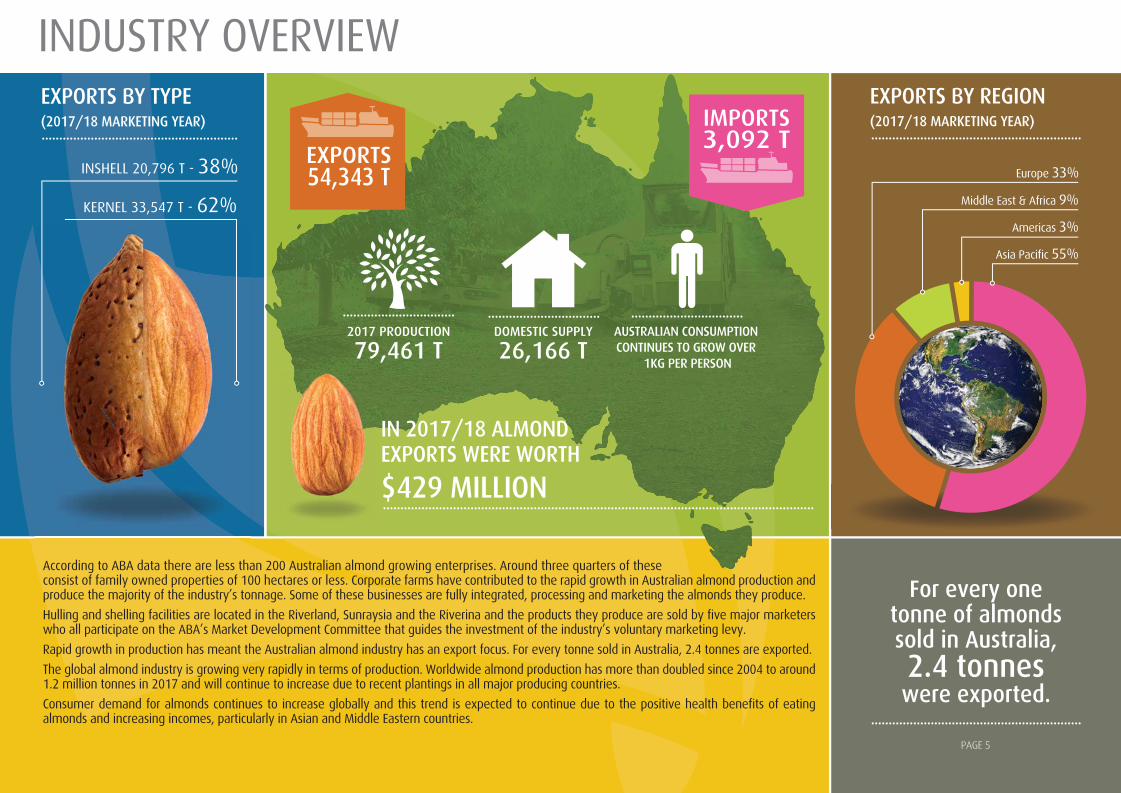
According to ABA data there are less than 200 Australian almond growing enterprises. Around three quarters of these consist of family owned properties of 100 hectares or less. Corporate farms have contributed to the rapid growth in Australian almond production and produce the majority of the industry’s tonnage. Some of these businesses are fully integrated, processing and marketing the almonds they produce.
Hulling and shelling facilities are located in the Riverland, Sunraysia and the Riverina and the products they produce are sold by five major marketers who all participate on the ABA’s Market Development Committee that guides the investment of the industry’s voluntary marketing levy.
Rapid growth in production has meant the Australian almond industry has an export focus. For every tonne sold in Australia, 2.4 tonnes are exported.
The global almond industry is growing very rapidly in terms of production. Worldwide almond production has more than doubled since 2004 to around 1.2 million tonnes in 2017 and will continue to increase due to recent plantings in all major producing countries.
Consumer demand for almonds continues to increase globally and this trend is expected to continue due to the positive health benefits of eating almonds and increasing incomes, particularly in Asian and Middle Eastern countries.
2017 PRODUCTION
79,461 TDOMESTIC SUPPLY
26,166 TAUSTRALIAN CONSUMPTION CONTINUES TO GROW OVER
1KG PER PERSON
IMPORTS3,092 T
EXPORTS54,343 T
IN 2017/18 ALMOND EXPORTS WERE WORTH
$429 MILLION...........................................................................................................................
EXPORTS BY REGION(2017/18 MARKETING YEAR)
EXPORTS BY TYPE (2017/18 MARKETING YEAR)........................................................ ............................................................
................................................................ ................................
Middle East & Africa 9%
Europe 33%
Americas 3%
Asia Pacific 55%
KERNEL 33,547 T - 62%
INSHELL 20,796 T - 38%
INSHELL16,948 T
29%KERNEL42,015 T
71%

PAGE 6
PLANTINGSLANTINGS
46% of allAustralian
almond trees are Nonpareil
CURRENT ALMOND PLANTINGS BY VARIETY (HECTARES)
OVER 11.5 MILLIONALMOND TREESPLANTED IN AUSTRALIA
............................................................ ....................................................................
.........................................................................................................................................................................................................................
VICTORIA
6,152,687TREES
NEW SOUTH WALES
2,732,019TREES
SOUTH AUSTRALIA
2,399,306TREES
WESTERN AUSTRALIA
223,395TREES
Carmel 26.6%
Monterey 7.1%
Nonpareil 45.9%
Price 9.7%
Others 9.9%
Butte - 2 40 7 - - - - - 5 - - - 54 - 5 49 0.1% Carina - - - - - - - - 1 - 4 87 107 199 198 1 - 0.5% Carmel (115) 1,869 2,220 633 107 191 459 33 88 133 199 294 575 10,561 1,068 713 8,780 26.6% Fritz - - - - - - - - - - - - - 71 - - 71 0.2% Independence - - - 0 - - - - - 72 48 87 117 325 253 72 0 0.8% Johnston - 0 - 0 (0) 1 0 - - - 0 - - 34 0 0 34 0.1% Keane (817) 4 14 5 2 2 - - 1 - - 1 0 72 1 1 69 0.2% Maxima (24) - - - - - - - 1 - - 54 5 60 59 1 - 0.2% Mira (3) - - - - - - - 1 - - 7 - 8 7 1 - 0.0% Monterey (75) 64 60 18 81 59 178 16 71 73 412 870 878 2,814 2,160 337 317 7.1% NePlus (1) 0 - - - - 0 1 - - 3 0 - 164 3 1 161 0.4% Nonpareil - 2,733 3,140 924 187 276 736 62 182 300 668 1,671 1,161 18,218 3,500 1,280 13,437 45.9% Padre (27) 2 39 3 - - - - - 5 - - - 50 - 5 45 0.1% Peerless (17) 37 53 9 2 2 2 2 2 11 8 32 4 439 43 17 379 1.1% Price - 736 785 256 12 22 94 11 15 39 44 243 89 3,861 376 159 3,327 9.7% Rhea (1) - - - - - - - 1 - - 15 - 15 15 1 - 0.0% Wood Colony - - - - - - 3 - 0 28 120 676 437 1,265 1,234 32 - 3.2% Other Varieties - - - - 3 1 - - 0 - 49 1,165 172 1,452 1,387 0 65 3.7% Total Current (1,080) 5,448 6,352 1,854 393 555 1,472 124 363 666 1,555 5,203 3,546 39,662 10,304 2,625 26,734 100.0% by Year
Variety Pre ‘06 2006 2007 2008 2009 2010 2011 2012 2013 2014 2015 2016 2017 TOTAL Non Maturing Fully % of Bearing Mature Plantings

PAGE 7
............................................................
PLANTINGS
SUNRAYSIA (VIC)
56%22,390 HA
RIVERINA (NSW)
20%7,885 HA
RIVERLAND (SA)
20%7,910 HA
SWAN (WA)
2%753 HA
ADELAIDE PLAINS (SA)
2%724 HA
ORCHARDPLANTINGS BY REGION(Hectares)
2005 2006 2007 2008 2009 2010 2011 2012 2013 2014 2015 2016 2017Bearing 5,580 7,086 9,490 12,124 17,645 24,004 25,865 26,258 26,813 28,284 28,408 28,771 29,358Non Bearing 3,909 5,037 8,155 11,880 8,219 2,254 948 2,026 1,595 486 1,029 2,211 6,758New Plantings 2,634 5,522 6,359 1,861 393 555 1,472 124 363 666 1,545 4,904 3,546
TOTAL 12,123 17,645 24,004 25,865 26,258 26,813 28,285 28,408 28,771 29,436 30,982 35,886 39,662
.....................................................
37,500
35,000
40,000
32,500
30,000
27,500
25,000
22,500
20,000
17,500
15,000
12,500
10,000
7,500
5,000
2,500
0
Hect
ares
TOTAL CURRENT AUSTRALIAN ALMOND AREA PLANTED (Hectares)
Industry Total
39,662hectares
PAGE 8
ENVIRONMENTWATER USE EFFICIENCY
.......................................................................................................
............................................................ ...........................................................
...........................................................
BEES & POLLINATION
BUDWOOD & NURSERY SALES
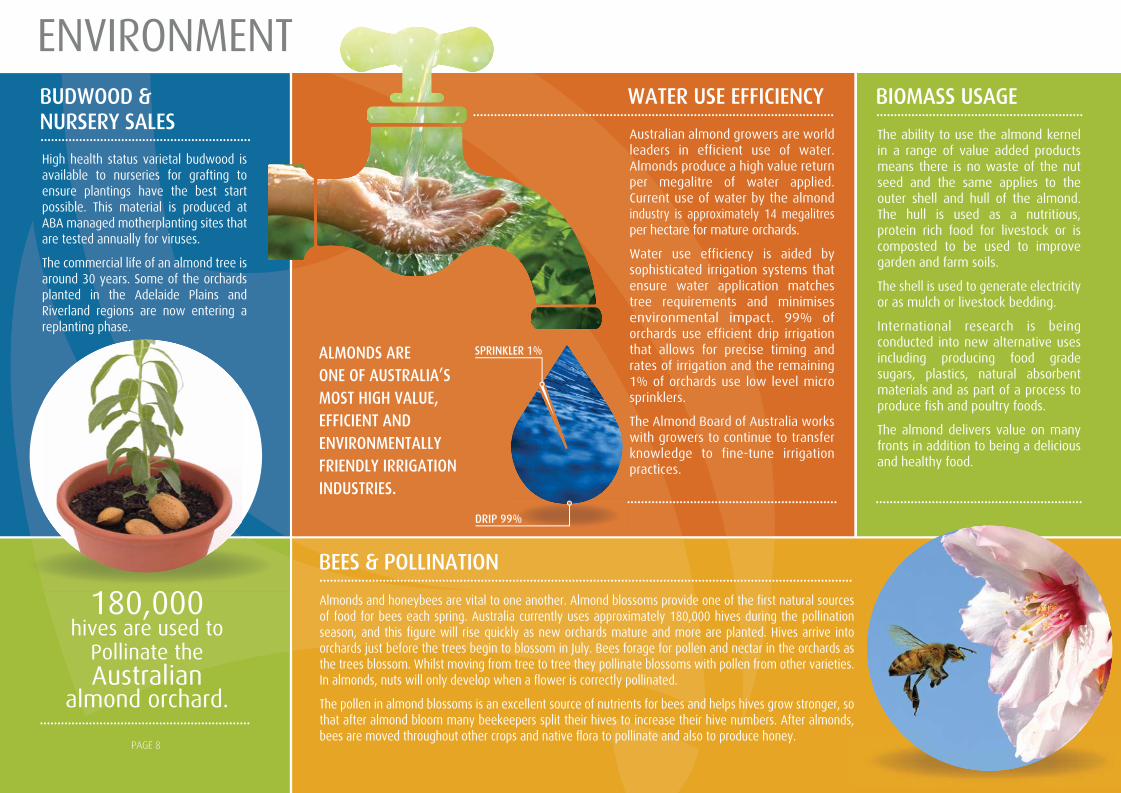
The ability to use the almond kernel in a range of value added products means there is no waste of the nut seed and the same applies to the outer shell and hull of the almond. The hull is used as a nutritious, protein rich food for livestock or is composted to be used to improve garden and farm soils.
The shell is used to generate electricity or as mulch or livestock bedding.
International research is being conducted into new alternative uses including producing food grade sugars, plastics, natural absorbent materials and as part of a process to produce fish and poultry foods.
The almond delivers value on many fronts in addition to being a delicious and healthy food.
High health status varietal budwood is available to nurseries for grafting to ensure plantings have the best start possible. This material is produced at ABA managed motherplanting sites that are tested annually for viruses.
The commercial life of an almond tree is around 30 years. Some of the orchards planted in the Adelaide Plains and Riverland regions are now entering a replanting phase.
180,000 hives are used to
Pollinate theAustralian
almond orchard.............................................................
Almonds and honeybees are vital to one another. Almond blossoms provide one of the first natural sources of food for bees each spring. Australia currently uses approximately 180,000 hives during the pollination season, and this figure will rise quickly as new orchards mature and more are planted. Hives arrive into orchards just before the trees begin to blossom in July. Bees forage for pollen and nectar in the orchards as the trees blossom. Whilst moving from tree to tree they pollinate blossoms with pollen from other varieties. In almonds, nuts will only develop when a flower is correctly pollinated.
The pollen in almond blossoms is an excellent source of nutrients for bees and helps hives grow stronger, so that after almond bloom many beekeepers split their hives to increase their hive numbers. After almonds, bees are moved throughout other crops and native flora to pollinate and also to produce honey.
Australian almond growers are world leaders in efficient use of water. Almonds produce a high value return per megalitre of water applied. Current use of water by the almond industry is approximately 14 megalitres per hectare for mature orchards.
Water use efficiency is aided by sophisticated irrigation systems that ensure water application matches tree requirements and minimises environmental impact. 99% of orchards use efficient drip irrigation that allows for precise timing and rates of irrigation and the remaining 1% of orchards use low level micro sprinklers.
The Almond Board of Australia works with growers to continue to transfer knowledge to fine-tune irrigation practices.
........................................................................................................................................................
BIOMASS USAGE
ALMONDS ARE ONE OF AUSTRALIA’S MOST HIGH VALUE, EFFICIENT AND ENVIRONMENTALLY FRIENDLY IRRIGATION INDUSTRIES.
............................................................
SPRINKLER 1%
DRIP 99%

PAGE 9
............................................................
PRODUCTION
2017 Crop Total
79,461tonnesVictoria
68%53,952 t
South Australia
20%15,979 t
New South Wales
12%9,288 t
Western Australia
3%241 t
ALMOND PRODUCTION - PAST & PRESENT (KERNEL)(Estimated future tonnage based on current plantings only)..........................................................................................................................................................................................................................
.....................................................................
2017 ALMOND PRODUCTIONBY STATE (KERNEL)
97,000**
92,000**
76,000*
79,461
82,333
82,509
65,060
73,361
49,585
37,626
39,081
5,000 15,000 25,000 35,000 45,000 55,000 65,000 75,000 85,000 95,000 105,000 Tonnes
* ESTIMATE base on marketers’ assesments. ** FORECAST base on plantings data.
2010
20
11
2012
20
13
2014
20
15
2016
20
17
2018
20
19
2020

............................................................
PAGE 10
PRODUCTION
55% of the 2017 crop was sized 23/25 & 27/30
Baxendale 163 1% 230 1% 168 1% 173 - 160 - 105 - 21 - 118 - 1,103 2% 97 - 55 - 45 - Capella - - - - - - - - - - - - - - - - - - - - - - 1 - Carina - - - - - - - - - - - - - - - - - - - - 1 - 1 - Carmel 4,246 27% 7,383 27% 7,996 31% 11,681 32% 10,561 27% 14,091 37% 15,718 32% 26,922 37% 19,834 30% 28,495 35% 28,471 35% 27,654 35% Chellaston 59 - 62 - 23 - 33 - 15 - 24 - 4 - 18 - 3 - 7 - 2 - 4 - Fritz 249 2% 331 1% 240 1% 151 - 198 1% 85 - 108 - 99 - 108 - 87 - 118 - 86 - Independence - - - - - - - - - - - - - - - - - - - - - - 22 - Johnston 30 - 36 - 35 - 47 - 24 - 36 - 13 - 31 - 11 - 24 - 11 - 26 - Keane 112 1% 132 - 70 - 69 - 79 - 65 - 71 - 112 - 103 - 141 - 98 - 162 - Maxima - - - - - - - - - - - - - - - - - - - - - - 1 - Mira - - - - - - - - - - - - - - - - - - - - 1 - 1 - Mission 273 2% 314 1% 251 1% 196 1% 156 - 146 - 23 - 133 - 43 - 75 - 49 - 31 - Monterey 5 - 24 - 42 - 97 - 181 - 328 1% 429 1% 689 1% 704 1% 1,146 1% 1,217 1% 1,290 2% Ne Plus 594 4% 823 3% 527 2% 443 1% 425 1% 290 1% 276 1% 409 1% 453 1% 278 - 328 - 264 - Nonpareil 7,989 50% 13,751 51% 13,376 51% 18,686 51% 21,219 54% 17,154 46% 25,766 52% 36,305 49% 33,772 52% 40,523 49% 39,788 48% 40,120 50% Peerless 576 4% 936 3% 597 2% 693 2% 747 2% 765 2% 715 1% 949 1% 970 1% 757 1% 777 1% 717 1% Price 903 6% 2,037 8% 2,338 9% 4,023 11% 3,936 10% 4,196 11% 5,796 12% 7,212 10% 7,124 11% 7,506 9% 9,865 12% 7,111 9% Rhea - - - - - - - - - - - - - - - - - - - - - - 1 - Somerton 6 - 13 - 12 % 18 - 682 2% 19 - 12 - 24 - 5 - 16 - 7 - 14 - Organic - - 129 - - - - - - - - - - - - - - - - - - - - - Other 796 5% 682 3% 330 1% 94 - 697 2% 321 1% 387 1% 285 - 825 1% 976 1% 1,042 1% 481 1% Mixed/Broken - - - - - - - - - - - - 246 - 55 - - - 2,381 3% 503 1% 1,429 2%
Total KERNEL 16,001 100% 26,882 100% 26,006 100% 36,403 100% 39,081 100% 37,626 100% 49,585 100% 73,361 100% 65,060 100% 82,509 100% 82,333 100% 79,461 100%
Variety 2006 2007 2008 2009 2010 2011 2012 2013 2014 2015 2016 2017
FrInJo
K
PRODUCTION BY VARIETY (KERNEL)
2017 CROP KERNEL SIZE BY VARIETY (KERNELS PER OUNCE)........................................................................................................................................................................................................................
........................................................................................................................................................................................................................
16/18 18/20 20/22 23/25 25/27 27/30 30/35 35/40 Other
Nonpareil 0.5% 6.2% 14.7% 39.5% 18.0% 11.8% 3.3% 1.3% 4.7%
Carmel 0.3% 1.7% 8.0% 33.8% 24.5% 18.5% 5.9% 1.9% 5.5%
Price 0.0% 3.1% 5.2% 17.9% 16.7% 24.1% 16.2% 8.1% 8.6%
TOTAL 0% 4% 11% 35% 20% 15% 5% 2% 5%
40%
35%
30%
25%
20%
15%
10%
5%
0%
CarmelNonpareil
Price
CONTRIBUTION TO AUSTRALIAN TREE NUT PRODUCTION %(2017 INSHELL TONNES)
Source: ANIC
LARGER SMALLER
Pecans 2%
Almonds 62%
Walnuts 7%
Chestnuts 1%
Macadamias 27%
Pistachios 1%
............................................................

PAGE 13PAGE 11
............................................................
SUPPLY & DEMAND
Total 2017 domestic sales
26,166Tonnes
AUSTRALIAN EXPORT & DOMESTIC SUPPLY (MARKETING YEAR) KERNEL EQUIVALENT......................................................................................................................................................................................................................
SUPPLY & DEMAND
2008
2009
2010
2011
2012
2013
2014
2015
2016
2017
13,355
2,53822,654
58,963
1,70821,208 59,307
49,751
2,12719,905
1,94618,856 48,788
2,847 17,35031,047
1,861
24,483
14,961
1,085
21,315
14,546
90124,132
1,250
15,402
14,535
3,09223,074
54,343
Tonnes0 5,000 10,000 15,000 20,000 25,000 30,000 35,000 40,000 45,000 50,000 55,000 60,000
IMPORTS
EXPORTS
DOMESTIC SUPPLY
AUSTRALIAN EXPORT & DOMESTIC SUPPLY (MARKETING YEAR) KERNEL EQUIVALENT......................................................................................................................................................................................................................
SUPPLY & DEMAND
l 2017 d i l
AUSTRALIAN EXPORT & DOMESTIC SUPPLY (MARKETING YEAR) KERNEL EQUIVALENT......................................................................................................................................................................................................................

PAGE 12
CONSUMPTION
Nielsen’s Homescan research indicated that almond purchases within the Australian domestic market grew in the 2017 calendar year with 48.1% of households buying some almonds. This is an increase of 2.2 basis points or 4.8%. By comparison, mixed nuts have a household penetration of 45.3%, cashews at 43.5%, walnuts at 27.4%, pistachio 16.8% and macadamias 14.4%.
There was an increase in the number of households within Homescan’s ‘family’ segments who purchased almonds during 2017. The number of ‘start-up’ families (oldest child is under 6 years) who purchased almonds increased from 46.9% to 50.2%; ‘small scale’ families (oldest child is between 6 and 11 years) increased from 46.9% to 48.3% and ‘bustling’ families (oldest child over 12 years) increased from 46.5% to 51.3%.
The Innova New Product research highlighted that almonds remain the most frequently used nut ingredient in new product launches. During the last Australian almond marketing year (March 2017 to February 2018), 302 products were launched into the Australian market with almonds as an ingredient. This compares to 123 new products with cashews, 70 products with hazelnuts and 173 products with peanuts.
The three categories that featured the highest number of new products with almonds were: cereal and energy bars with 81 new products, snack nuts and seeds with 32 new products and breakfast cereals with 31 new products.
During the 2017-18 year, after studying the review of the nutritional science relating to nuts and heart health conducted by the Nuts for Life program, the Almond Board of Australia lodged a General Level Health Claim with Food Standards Australia New Zealand (FSANZ) to promote almonds and heart health. Claims of ‘heart healthy almonds’ can be made on pack and in the media. Australian almond marketers will be encouraged to take advantage of these claims and utilise the range of creative elements developed by the ABA’s marketing program.
KERNEL WHOLE BLANCHED BLANCHED SLICED MEALSLIVEREDNATURAL SLICED DICED
Almonds are themost frequently used
tree nut in new product launches in Australia
THIS IS ONE OF THE HIGHEST PER CAPITA CONSUMPTION RATES IN THE WORLD AND STILL GROWING.
IN SHELL
............................................................
FORMS OF AUSTRALIAN ALMONDS............................................................................................................................................................................................................................
In 2017 the average
Australian almond consumption was
1.09Kg per person
......
......
......
......
......
......
......
......
......
......
Heart HealthyAlmonds >
’
KERNEL WHOLE BLANCHHED BLANCHED SLICED MEALSLIVEREDNATURAL SLICED DICEDLELL

............................................................................................................................................................................................................................
PAGE 13
EXPORTS
The smaller Australian almond crop in 2017 limited the opportunities for export growth. However, a number of our key export markets continued to expand. The Indian market grew by 23%, the UAE market grew by 35% and exports to Vietnam grew by 46%.
It is worth noting that while the combined kernel and in-shell export volumes have fallen during the 2017-18 marketing year, exports of processed nuts have increased. This category is understood as predominantly the range of blanched almond products. Exports of processed nuts grew by 2,387 tonnes during the 2017-18 year which is a growth rate of 128%.
The key features of the Australian Almonds export development program are our major trade exhibitions. The 2017-18 marketing year featured an exhibition at Anuga, the major European trade fair held in Cologne in October, 2017 and at Gulfoods, Dubai in February 2018. The Gulfoods trade exhibition attracts many of our industry’s key Indian customers as well as servicing the Middle East and African markets. At our 2018 Gulfoods trade mission, a large trade exhibition was augmented with a customer networking event and a special indoor cricket match between an Indian Almond team and the Australian Almond team. The cricket match helped strengthen the cultural connection between our largest export market and the Australian almond industry.
Another major feature of our export market development program in 2017-18 was an enhanced focus on growing the Australian almond market in China. Three trade missions were undertaken during 2017: Sial China in Shanghia in May 2017, the China Tree Nut Conference in August 2017 and Asia Fruit Logistica in Hong Kong in September 2017. Significant emphasis was placed on the reducing tariffs on Australian almonds into Mainland China available because of the China-Australia Free Trade Agreement.
............................................................
2017/18 MARKETING YEAR TOTAL EXPORT VALUE
$429 MILLION
YEAR20172016201520142013
TONNES4,257.61,870.32,075.31,608.21,170.5
EXPORT OF AUSTRALIAN PROCESSED NUTS
Europe$140.5 million
32.8%
Africa &Middle East
$39.5 million9.2% Asia Pacific
Oceania$236 million
55.1%
Americas$12.2 million
2.9%

PAGE 14
............................................................
WORLD EXPORT DESTINATIONS2017/18 MARKETING YEAR
NORTHEAST ASIA CHINA (EXCLUDING SARS & TAIWAN) 128 $1,166,158 510 $4,407,825 600 $5,573,983 88% HONGKONG (SAR OF CHINA) 87 $398,208 260 $2,022,738 321 $2,420,946 -83% JAPAN 50 $393,759 512 $4,457,275 547 $4,851,034 58% KOREA, REPUBLIC OF - - 60 $588,282 60 $588,282 -15% TAIWAN - - 2 $29,136 2 $29,136 29% TOTAL NORTHEAST ASIA 265 $1,958,125 1,343 $11,505,256 1,529 $13,463,381 -42% SOUTHEAST ASIA BRUNEI DARUSSALAM - - 0 $2,905 0 $2,905 -13% INDONESIA - - 17 $163,062 17 $163,062 -94% MALAYSIA 40 $282,097 106 $801,675 133 $1,083,772 264% PHILIPPINES 1 $21,879 19 $240,551 19 $262,430 -80% SINGAPORE - - 253 $2,084,112 253 $2,084,112 36% THAILAND 155 $1,260,002 780 $6,580,514 889 $7,840,516 -47% VIET NAM 4,770 $24,236,241 1,024 $5,709,432 4,363 $29,945,673 46% TOTAL SOUTHEAST ASIA 4,966 $25,800,219 2,199 $15,582,251 5,675 $41,382,470 7% SOUTH/CENTRAL ASIA INDIA 22,727 $140,267,651 2,286 $18,055,377 18,195 $158,323,028 23% PAKISTAN 258 $1,422,610 401 $2,996,719 582 $4,419,329 138% TOTAL SOUTH/CENTRAL ASIA 22,986 $141,690,261 2,687 $21,052,096 18,777 $162,742,357 25% AUSTRALASIA/OCEANIA FIJI - - 15 $127,440 15 $127,440 -13% NEW ZEALAND 113 $850,638 1,992 $17,568,462 2,071 $18,419,100 13% PAPUA NEW GUINEA 0 $2,268 0 $3,685 0 $5,953 -84% TOTAL AUSTRALASIA/OCEANIA 113 $852,906 2,007 $17,699,587 2,086 $18,552,493 13% TOTAL ASIA PACIFIC 28,330 $170,301,511 8,237 $65,839,190 28,068 $236,140,701 13% WESTERN EUROPE BELGIUM - - 318 $2,100,405 318 $2,100,405 -25% DENMARK - - 1,072 $7,270,604 1,072 $7,270,604 -2% FRANCE - - 1,060 $7,928,025 1,060 $7,928,025 2% GERMANY 34 $236,872 3,809 $31,518,346 3,833 $31,755,218 -17% GREECE 2 $17,565 129 $981,013 130 $998,578 -36% ITALY - - 1,215 $9,056,487 1,215 $9,056,487 -35% NETHERLANDS 238 $1,838,295 2,597 $19,074,141 2,764 $20,912,436 35% NEW CALEDONIA - - 1 $8,938 1 $8,938 44% NORWAY - - - $- - - -100% SPAIN 793 $4,593,338 5,502 $34,826,200 6,057 $39,419,538 -49% SWEDEN - - 297 $2,100,777 297 $2,100,777 -16% SWITZERLAND - - 328 $3,035,308 328 $3,035,308 20% UNITED KINGDOM 40 $317,622 1,376 $10,564,945 1,404 $10,882,567 144% TOTAL WESTERN EUROPE 1,107 $7,003,692 17,704 $128,465,189 18,479 $135,468,881 -25% CENTRAL & CROATIA 16 $121,056 102 $818,967 113 $940,023 -16% EASTERN EUROPE CZECH REPUBLIC - - 20 $140,003 20 $140,003 POLAND - - 453 $3,675,915 453 $3,675,915 -6% RUSSIAN FEDERATION - - 35 $352,942 35 $352,942 UKRAINE - - - - - - -100% TOTAL CENTRAL & EASTERN EUROPE 16 $121,056.00 609 $4,987,827 620 $5,108,883 -2% TOTAL EUROPE 1,124 $7,124,748.00 18,313 $133,453,016 19,099 $140,577,764 -24 MIDDLE EAST JORDAN - - 55 $526,031 55 $526,031 200% KUWAIT 0 $200 181 $1,664,116 181 $1,664,316 20% LEBANON 0 $2,330 - - 0 $2,330 -100% QATAR - - 37 $345,376 37 $345,376 SAUDI ARABIA 0 $300 412 $3,388,999 412 $3,389,299 222% TURKEY 51 $385,728 846 $6,747,661 881 $7,133,389 -39% UNITED ARAB EMIRATES 168 $2,028,366 2,404 $19,603,655 2,522 $21,632,021 35% TOTAL MIDDLE EAST 219 $2,416,924 3,934 $32,275,838 4,088 $34,692,762 3% NORTH AFRICA EGYPT - - 262 $2,330,599 26 $2,330,599 -26% LIBYA - - 128 $810,497 128 $810,497 TUNISIA - - - - - $- -100% TOTAL NORTH AFRICA - - 390 $3,141,096 390 $3,141,096 -60% SUB-SAHARAN AFRICA MAURITIUS 16 $146,865 - - 11 $146,865 SOUTH AFRICA - - 202 $1,551,281 202 $1,551,281 105% TOTAL SUB-SAHARAN AFRICA 16 $146,865 202 $1,551,281 213 $1,698,146 117% TOTAL MIDDLE EAST & AFRICA 236 $2,563,789 4,526 $36,968,215 4,691 $39,532,004 -7% LATIN AMERICA/CARIBBEAN ARGENTINA - - 217 $1,644,437 217 $1,644,437 324% URUGUAY - - 17 $87,057 17 $87,057 TOTAL LATIN AMERICA/CARIBBEAN - - 235 $1,731,494 235 $1,731,494 357%
NORTH AMERICA CANADA - - 2 $46,200 2 $46,200 -8% TOTAL NORTH AMERICA - - 2 $46,200 2 $46,200 -8% UNITED STATES UNITED STATES OF AMERICA 19 $448,455 2,235 $10,061,153 2,248 $10,509,608 -43% TOTAL UNITED STATES 19 $448,455 2,235 $10,061,153 2,248 $10,509,608 -43% TOTAL AMERICAS 19 $448,455 2,472 $11,838,847 2,485 $12,287,302 -38%
WORLD TOTAL 29,708 $180,438,503 33,547 $248,099,268 54,343 $428,537,771 -8%
Source: ABS, ABA
INSHELL INSHELL KERNEL KERNEL TOTAL TOTAL % CHANGE (TONNES) $ AUD (TONNES) $ AUD (TONNES) $ AUD FROM 2016 MY
EUROPE
MIDDLE EAST& AFRICA
AMERICAS
ASIAPACIFIC

PAGE 15
GLOBAL
While Australian almonds are typically harvested during the months of February to April each year, harvesting of northern hemisphere almonds typically occurs between August to October. Californian almond shipments (sales) for each crop marketing year are recorded from August through to July each year. In April 2017, the five year drought in California lifted, with a deep snowpack and flooding rains in winter.
The US production in 2017 that is marketable is recorded as 2.213 billion pounds of kernel (slightly more than one million tonnes) an increase of 5.9% over the previous year. This was produced from 1.06 million acres of almond orchards, up 7% from the previous year, of which one million acres was bearing a crop.
According to the 2018 Almond Subjective Forecast undertaken by the USDA National Agricultural Statistics Service, based on randomly chosen grower estimates, California almond orchards are expected to produce a record crop but only 1.3% larger than the 2017 tonnage.
The 2018 California Almond Objective Report, which is released in July, uses a more statistically rigorous methodology based on actual almond counts and measurements taken in orchards throughout the state.
............................................................................................................................................................................
The Australian dollar has traded below the US$ since 2013.
USA Production
USA PLANTINGS & TOTAL HA
As the Californian industry sells 80% of the world’s almonds the global price is quoted in US dollars per pound. The return for Australian almonds in our local currency is heavily influenced by the prevailing exchange rate between the A$ and the US$.
A strong Australian dollar delivers lower returns, whilst the weaker A$ delivers better returns once the US$ price is converted.
In June 2013, the Australian dollar fell below parity and has remained this way. The Australian dollar traded within a band in the mid US$0.70’s during the 2017-18 year and generally around US$0.76.
With farm inputs such as orchard machinery, fertilizer and pest and disease sprays produced overseas these cost more when the A$ is weaker.
New TotalYear Plantings Hectares
2006 12,938 305,538 2007 5,820 309,584 2008 8,773 333,866 2009 7,391 339,936 2010 5,407 346,006 2011 6,054 354,100 2012 4,965 376,358 2013 4,494 392,545 2014 8,040 400,585 2015 10,439 411,024 2016* 8,415 419,439 2017* 8,481 427,921 2018* 8,967 436,888
Source: ABC, USDA*Estimated as of July 6, 2017
CALIFORNIA ALMOND EXPORTS BY REGION % (2016/17)............................................................
Source: ANIC
Middle East/Africa 8.9%
Latin America/Caribbean 0.6%
Central/Eastern Europe 0.9%
Asia Pacific 24.5%
North America 36.2%
Western Europe 28.9%
COMPARATIVE $AUD VS $USD EXCHANGE RATES..........................................................................................................................................................................................................................
............................................................
...........................................................
$0.60
$0.65
$0.70
$0.75
$0.80
$0.85
$0.90
$0.95
$1.00
$1.05
$1.10
Jan-Jun
July-Dec
Jan-Jun
July-Dec
Jan-Jun
July-Dec
Jan-Jun
July-Dec
Jan-Jun
July-Dec
Jan-Jun
July-Dec
Jan-Jun
July-Dec
Jan-Jun
July-Dec
Jan-Jun
July-Dec
Jan-Jun
July-Dec
Jan-Jun
July-Dec
2007 2008 2009 2010 2011 2012 2013 2014 2015 2016 2017
$ US
D
$ AUD

PAGE 16
GLOBAL
............................................................
GLOBAL ALMOND PRODUCTION (KERNEL) Source: INC ............................................................................................................................................................................................................................
Total global almond production
in 2017 was1.17 million
tonnes
COUNTRY lbs TONNES lbs TONNES lbs TONNES lbs TONNES lbs TONNES lbs TONNES lbs TONNES lbs TONNES lbs TONNES lbs TONNES lbs TONNES (mill) (mill) (mill) (mill) (mill) (mill) (mill) (mill) (mill) (mill) (mill)
Chile
China
Greece
India
Iran
Italy
Morocco
Others Countries
Spain
Syria
Tunisia
Turkey
Total
United States
Australia
TOTAL World Prod'n
2007 2008 2009 2010 2011 2012 2013 2014 2015 2016 2017
22 10,200 19.8 9,000 17.6 8,000 22.0 10,000 22.0 10,000 22.0 10,000 22.0 10,000 22.0 10,000 28.7 13,000 26.46 12,000 30.86 14,000
3 1,500 2.2 1,000 1.8 800 2.4 1,100 2.6 1,200 2.6 1,200 - - - - - - - - - -
26 12,000 26.5 12,000 17.6 8,000 17.6 8,000 17.6 8,000 17.6 8,000 11.0 5,000 11.0 5,000 8.8 4,000 16.53 7,500 6.61 3,000
2 1,000 2.4 1,100 2.2 1,000 2.5 1,150 2.6 1,200 2.4 1,100 - - - - - - - - - -
22 9,979 22.0 10,000 22.0 10,000 26.5 12,000 26.5 12,000 55.1 25,000 33.1 15,000 33.1 15,000 33.1 15,000 33.07 15,000 33.07 15,000
33 14,969 23.1 10,500 13.2 6,000 13.2 6,000 26.5 12,000 27.6 12,500 11.0 5,000 19.8 9,000 16.5 7,500 16.53 7,500 16.53 7,500
18 8,000 17.6 8,000 19.8 9,000 19.8 9,000 19.8 9,000 19.8 9,000 13.2 6,000 19.8 9,000 24.3 11,000 24.25 11,000 24.25 11,000
62 28,000 61.7 28,000 61.7 28,000 61.7 28,000 66.1 30,000 66.1 30,000 66.1 30,000 66.1 30,000 - - 66.14 30,000 66.14 30,000
66.14 30,000 77.2 35,000 152.1 69,000 77.2 35,000 110.2 50,000 99.2 45,000 70.5 32,000 133.9 60,750 145.4 65,957 101.12 45,866 112.33 50,954
15 7,000 15.4 7,000 11.0 5,000 11.0 5,000 11.0 5,000 11.0 5,000 - - - - - - - - - -
22 10,000 22.0 10,000 26.5 12,000 26.5 12,000 26.5 12,000 27.6 12,500 28.7 13,000 30.9 14,000 33.1 15,000 33.07 15,000 33.07 15,000
21 9,500 20.9 9,500 30.3 13,750 35.3 16,000 35.3 16,000 35.3 16,000 33.1 15,000 22.0 10,000 28.7 13,000 28.66 13,000 28.66 13,000
313 142,148 311.1 141,100 376.0 170,550 315.8 143,250 366.8 166,400 386.5 175,300 288.8 131,000 358.8 162,750 318.5 144,457 345.83 156,866 351.54 159,454
1,117 506,527 1,383.0 627,318 1,614.6 732,370 1,405.9 637,706 1,628.2 738,539 2,020.3 916,393 1,885.0 855,022 2,009.7 911,585 1,870.0 848,218 1,895.0 859,558 2,050.0 929,864
59 26,882 57.3 26,006 80.3 36,403 86.2 39,081 83.0 37,626 109.3 49,585 161.7 73,361 143.4 65,060 181.9 82,509 181.5 82,333 175.2 79,461 1,489 675,556 1,751.4 794,424 2,070.9 939,323 1,807.9 820,036 2,078.0 942,565 2,516.1 1,141,278 2,335.5 1,059,382 2,511.9 1,139,394 2,370.4 1,075,184 2,422.3 1,098,757 2,576.7 1,168,779
SUPPLY
CONSUMPTION
PRODUCTION
CARRY-OUT2006 2007 2008 2009 2010 2011 2012 2013 2014 2015 2016 2017 2018 2019 2020
0
200,000
400,000
600,000
800,000
1,000,000
1,200,000
1,400,000
1,600,000
A
TOP
WORLD ALMOND SUPPLY VS DEMAND
Source: ABC
WORLD PRODUCTION 2017
Spain 4%
Turkey 1%
Chile 1%
Australia 7%
*US 2015 Crop Production figures as at May 2017
Others 7%
USA 80%
...............................................................
........................................................................................

............................................................PAGE 17
ALMOND MARKETERS
Nut Producers Australia Ltd249 Wright Street, Adelaide SA 5000Ph: +61 8 8231 7011 Fax: +61 8 8231 2177Enquiries: [email protected]
Olam Orchards Australia55 Wyandra Street, Newstead QLD 4006Ph: +61 7 3250 3300 Fax: +61 7 3852 1600www.olamonline.com
Almondco Australia LtdSturt Highway, PO Box 1744, Renmark SA 5341Ph: +61 8 8586 8800 Fax: +61 8 8595 1559 Enquiries: [email protected] www.almondco.com.au
Select Harvests Ltd360 Settlement Road, Thomastown VIC 3074Ph: +61 3 9474 3544 Fax: +61 3 9474 3588Enquiries: [email protected] www.selectharvests.com.au
Bright Light Agribusiness Pty Ltd
Unit 7/435 Williamstown Road, PO Box 101 Port Melbourne VIC 3207 Ph: (03) 9674 8188Enquiries: [email protected]
Almonds account
for 62% of Australian tree nut
production
Australian Almond Insights 2017-18 can be downloaded from www.australianalmonds.com.au