ALMA Calibration Device Prototype Calibration Load Test Report
35
ALMA Calibration Device Prototype Calibration Load Test Report FEND-40.06.04.00-005-A-REP Version: A Status: Released 2007-07-24 Prepared By: Organisation Date A. Murk, A. Duric IAP 2007-07-24 Approved by: Organisation Released by ESO: Organisation
Transcript of ALMA Calibration Device Prototype Calibration Load Test Report
ALMA Calibration Device Prototype Calibration Load
Test Report
FEND-40.06.04.00-005-A-REP
Version: A
Status: Released
2007-07-24
Prepared By: Organisation Date A. Murk, A. Duric
IAP
2007-07-24
Approved by: Organisation
Released by ESO: Organisation

ALMA System
ALMA Calibration Device Prototype Calibration Load
Test Report
Doc # : FEND-40.06.04.00-005-A-REP Date: 2007-07-24 Status: Released Version: A Page: 2 of 35
Change Record Version Date Affected
Section(s) Change Request # Reason/Initiation/Remarks
A 2007-04-03 all first issue
A1 2007-07-10 all Radiometric tests and back-scatter results for Band 8+9 added
A2 2007-08-30 All Backscatter results of an Ambient Prototype in Band 5 added. Final release.

ALMA System
ALMA Calibration Device Prototype Calibration Load
Test Report
Doc # : FEND-40.06.04.00-005-A-REP Date: 2007-07-24 Status: Released Version: A Page: 3 of 35
Table of Contents 1 INTRODUCTION...................................................................................................4
1.1 Purpose .............................................................................................................4 1.2 Scope ................................................................................................................4 1.3 Acronyms..........................................................................................................5 1.4 Applicable documents ......................................................................................5 1.5 Reference documents........................................................................................5
2 CALIBRATION TARGET SPECIFICATIONS ....................................................6 2.1 Total Scattering.................................................................................................6 2.2 Backscattering ..................................................................................................6 2.3 Temperature Gradients .....................................................................................7 2.4 ALMA Specifications.......................................................................................7
3 TESTED CALIBRATION TARGETS AND SAMPLES ......................................8 3.1 Pyramidal Target ..............................................................................................8 3.2 Conical Target ..................................................................................................8 3.3 Tiles ..................................................................................................................9 3.4 Barrier Sheets ...................................................................................................9
4 ACTIVE BACKSCATTER MEASUREMENTS.................................................10 4.1 Test Setup .......................................................................................................10 4.2 Data Analysis..................................................................................................15 4.3 Backscatter Results.........................................................................................16
4.3.1 Pre-Prototype Pyramids ...........................................................................16 4.3.2 Pyramids and Cone ..................................................................................17 4.3.3 Barrier Sheets...........................................................................................23
5 RADIOMETRIC TESTS ......................................................................................24 5.1 Experimental Setup.........................................................................................24 5.2 Measurement Results......................................................................................26 5.3 Standing wave results .....................................................................................28
6 THERMAL TESTS WITH AN IR CAMERA .....................................................30 7 DISCUSSION .......................................................................................................32
7.1 Measurement Accuracy ..................................................................................32 7.2 Conclusions ....................................................................................................33 7.3 Recommendations ..........................................................................................34
ALMA System
ALMA Calibration Device Prototype Calibration Load
Test Report
Doc # : FEND-40.06.04.00-005-A-REP Date: 2007-07-24 Status: Released Version: A Page: 4 of 35
1 Introduction 1.1 Purpose This document reports the measurement results of different black-body targets for the ALMA calibration system according to the Calibration Load Return Loss Test Plan [AD02]. 1.2 Scope Section 2 discusses different performance aspects of radiometric calibration targets. The following sections give the results of active backscatter measurements with a vector network analyzer at the frequencies of ALMA Band 1 to 9 and radiometric measurements with an ALMA Band 7 cartridge and an IRAM 90 GHz SIS receiver. Section 6 includes additional measurements of the temperature gradients in the heated pre-prototype target with an IR camera. The last section gives a discussion of the test results and recommendations for an improved target design.
ALMA System
ALMA Calibration Device Prototype Calibration Load
Test Report
Doc # : FEND-40.06.04.00-005-A-REP Date: 2007-07-24 Status: Released Version: A Page: 5 of 35
1.3 Acronyms ALMA Atacama Large Millimeter Array
CIDL Configured Items Data List
CP Contract & Procurement
CRE Change Request
ESO European Organisation for Astronomical Research in the Southern Hemisphere
FE Front End
IPT Integrated Product Team
NCR Non Conformance Report
PAI Preliminary Acceptance In-House
PAS Preliminary Acceptance on site
PPR Pre-Production Review
RAL Rutherford Appleton Laboratory
RFW Request for Waiver
RID Review Item Discrepancy
SE&I System Engineering and Integration
UTC Coordinated Universal Time
RAL Rutherford Appleton Laboratory, UK
TK Thomas Keating Ltd., UK
1.4 Applicable documents AD01 Calibration Device
Technical Specifications FEND-40.06.00.00-009-A-SPE
AD02 Calibration Device Calibration Load Return Loss Test Plan
FEND-40.06.04.00-001-A-SPE
1.5 Reference documents RD01 Design Study for the
ALMA Calibration Device FEND-40.06.00.00-012-A-REP
RD02 Calibration Load Design Simulation Report
FEND-40.06.04.00-004-A-REP
ALMA System
ALMA Calibration Device Prototype Calibration Load
Test Report
Doc # : FEND-40.06.04.00-005-A-REP Date: 2007-07-24 Status: Released Version: A Page: 6 of 35
2 Calibration Target Specifications The ALMA receivers will be calibrated using two calibration targets in the receiver cabin. One is heated to an elevated temperature of up to 100 ºC, while the other remains at ambient temperature. The quality of these calibration targets is crucial for the accuracy of the astronomical observations. A perfect black-body radiator with a known and uniform temperature would be the ideal calibration target, but any practical target will have an emissivity smaller than unity. The following characteristics of the calibration target have to be determined in order to assess its performance. 2.1 Total Scattering When a receiver is pointing at the calibration target it will also receive a certain amount of radiation from the surroundings. This can be due to spill-over when the target is too small to cover the complete field-of view of the receiver, but also due to scattering at the target. The resulting calibration error is the integral over the product of the power scattering coefficients over all possible directions and the difference between the equivalent brightness temperatures of the target and the surroundings. Since the scattered radiation and the radiation coming from the target are incoherent this calibration error is proportional to the total scattered power. It can be expected that it will lead to an almost constant or only slowly varying calibration offset over a typical observation bandwidth of a few GHz. The total amount of scattering could be calculated from a series of bi-static reflection measurements over a wide range of incidence angles, but this approach is very time consuming and difficult to calibrate. An alternative are radiometric tests with a variable thermal background on the target under test, which is described in Section 5. 2.2 Backscattering A special case of scattering occurs when a signal that is originating from the receiver is scattered at the target back into the receiver. Since this is a coherent process the initial and the backscattered waves will interfere with each other. The result of this standing wave is a periodic baseline ripple on the calibrated spectra. The amplitude of this baseline error is now proportional to the field backscatter coefficients of the target and the receiver, and the difference of the equivalent brightness temperatures emanating from them. For that reason the backscatter performance of the target is more critical than its total scattering for most spectroscopic observations. The periodicity and phase of the baseline ripple depends on the distance between target and receiver, typical dimensions lead to several baseline periods within a 1GHz observation bandwidth. This baseline ripple can be expected for all receivers with a realistic mismatch at their input, including ALMA Band 1 and 2 where a cooled LNA preamplifier will be used. Additional problems can be expected for the other ALMA

ALMA System
ALMA Calibration Device Prototype Calibration Load
Test Report
Doc # : FEND-40.06.04.00-005-A-REP Date: 2007-07-24 Status: Released Version: A Page: 7 of 35
bands with SIS mixers, because the local oscillator signal, which can leak from the mixer into the optics, will be also reflected at the target and causes a standing wave. The result can be different bias conditions of the SIS mixer during a calibration cycle, which will depend on the LO frequency and the distance between target and receiver. Section 4 shows active backscatter measurements of the ALMA targets using a vector network analyzer. 2.3 Temperature Gradients The calibration is only as good as the knowledge of the thermodynamic temperature of the calibration target. Low density foam absorbers have a low heat capacity and are bad thermal conductors, which makes them less suited for calibration purposes. Many calibration targets consist of a layer of solid microwave absorber on a metal backing, which is equipped with one or more temperature sensors. The absorber material has usually a lower thermal conductivity than the metal. Depending on the design of the target significant thermal gradients can exist within the absorber layer or over the complete structure. The gradients depend on the temperature difference between the target and ambient temperature, and also on the environmental conditions, for example the IR background radiation or convective heat flux through the air. The presence of such gradients has been investigated with an IR camera as described in Section 6. 2.4 ALMA Specifications The ALMA specifications for the calibration device in AD01 require reflections below -40dB in average for Band 2 to 19 and below -30dB for Band 1. It is not clear, however, whether this refers to the total integrated scattering or the backscattering as outlined above. Backscattering at the -40 dB level could still lead to considerable standing waves with amplitudes up to 1% of the brightness temperature of the target, which is most likely not acceptable for ALMA. If the specification refers to the total scattering the worst case error, without taking into account any standing waves, would be in the order of 0.03 K for the heated target with reflections from the cold sky. This has to be considered as a very tight specification, which could possibly be relaxed without compromising the absolute calibration accuracy. For the thermal performance of the target only the accuracy and repeatability of the temperature sensors are specified with 0.1 K and 0.05 K, respectively. It does not tell how well the temperature of the radiating elements must be coupled to this temperature sensor, and which thermal gradients are acceptable over the aperture of the target and within the absorber layer.
ALMA System
ALMA Calibration Device Prototype Calibration Load
Test Report
Doc # : FEND-40.06.04.00-005-A-REP Date: 2007-07-24 Status: Released Version: A Page: 8 of 35
3 Tested Calibration Targets and Samples The final design of the ALMA calibration targets has not been decided yet the time the tests in this report. This section gives an overview of the target designs that were compared during our tests. 3.1 Pyramidal Target The current baseline design consists of a periodic array of Aluminium pyramids, which are covered with an approximately 0.7 mm thick layer of casted Eccosorb MF114 absorber material. The distance between the sharp tips of the pyramids are 10 mm and their slant angle 7.15 degrees, which results in a height of about 40mm. The design of this load and first electro-magnetic simulations are described in RD01 and RD02, respectively. Two of these targets have been manufactured by RAL during a manufacturing study. For the first pre-prototype the pyramids were machined by wire erosion, covering an area of 150 mm diameter. It is mounted with heaters and temperature sensors in a massive metal shroud with an aperture of 150 mm and a length of 150 mm, which is lined with an absorber sheet. Since these dimensions are too small for the beam size of ALMA Band 1 and 2 optics, this pre-prototype it was used only for a few backscatter experiments and the thermal tests with the IR camera. The final prototype was manufactured by metal casting, and its pyramids cover the nominal area of 150 mm diameter. Most measurements were made with this target without any shroud, only for the tests in Band 1 and 2 a provisional shroud made of Aluminium foil was attached to it, which had a length of ~150 mm and an aperture diameter of ~200 mm. Similar pyramidal targets have been used in the past, e.g. in AMSU-B, MARSS or in the cold target of MARSCHALS, which are all space- or airborne instruments for remote sensing in the millimetre and sub-millimetre wave range. The main advantage of this design is its relative compact size, but it results in more scattering and thermal gradients than alternative designs. 3.2 Conical Target The objective of a previous breadboard study of the European Space Agency was the development of a black-body calibration target for very stringent requirements on the backscatter, total scattering and thermal gradients. The solution from TK was a conical target with a half angle of 12 degrees, which is made out of a 3 mm thick absorber cast with an Aluminium backing. The backscatter of several flight models of this target has been characterized in our lab, resulting in values below -70dB. The aperture of the original ESA design is too small for the ALMA requirements and no dedicated sample was available for this test series.
ALMA System
ALMA Calibration Device Prototype Calibration Load
Test Report
Doc # : FEND-40.06.04.00-005-A-REP Date: 2007-07-24 Status: Released Version: A Page: 9 of 35
A larger Cone from TK has been tested in parallel with the Pyramids for comparison purposes. This target consists of a 10 mm thick carbon loaded polypropylene cone with 8 degree half-angle, 140 mm aperture and a total length of 0.5 m. It was originally developed as an efficient beam dump for pulsed Electron Spin Resonance experiments without any requirements on thermal control, thus it has no metal backing. The main advantage of this design is, besides the reduced scattering, that it can be mass produced by injection moulding at low costs per unit. Its bad thermal properties do not allow using it in the hot target without further measures against thermal gradients. 3.3 Tiles TK-RAM Tiles are off-the-shelf available absorber tiles made of carbon loaded polypropylene with a pyramidal surface structure. Several grades are available for different frequency bands. The low frequency version consists of 10cm x 10cm large tessellating Tiles of 10mm thickness, which are covered with 5 mm high pyramids at a 4 mm pitch. This type of absorber would be difficult to use in the ALMA hot target because of its low thermal conductivity, but since it became recently being considered for the ambient target it was included in part of the test series. At the end of the tests a prototype of an ALMA ambient target made out of Tiles became available and has been characterized at a limited number of frequencies in Band 5 and 6. This prototype has a circular aperture of 200mm and is made out of four Tiles attached to a metal backing. 3.4 Barrier Sheets In order to reduce thermal gradients by minimizing the convective heat transfer the calibration target could be covered by a low loss dielectric sheet. Reflections at this window are crucial and must be as low as possible. Samples of 0.254 mm (1mil) thick porous PTFE foil (MUPORE from POREX) and 3.2 mm thick expanded PTFE foam (GR30 from GORE-TEX) have been tested by backscatter measurements at normal incidence. The same materials are used in the cryostat as IR filter for some of the ALMA bands.

ALMA System
ALMA Calibration Device Prototype Calibration Load
Test Report
Doc # : FEND-40.06.04.00-005-A-REP Date: 2007-07-24 Status: Released Version: A Page: 10 of 35
4 Active Backscatter Measurements 4.1 Test Setup The setup for the backscatter measurements consists of a submillimeter-wave vector network analyzer and a directional coupler. In order to be able to differentiate between the backscatter of the target and the other spurious signals, the targets were mounted on a motorized translation stage that is used to vary the distance between the reflectometer and the target. The data analysis, which is described in section 4.2, is thus similar to a usual sliding load calibration of a conventional network analyzer. The optical axis of the different ALMA receivers is tilted from the optical axis of the telescope by 0.95 to 2.43 degrees. Because of the periodic surface structure of the pyramidal absorbers, its backscatter varies significantly depending on the angle of incidence and frequency. For that reason the calibration target and the translation stage were mounted on an additional rotation stage and each measurement series was repeated for 100 different angles of incidence between -10 and +10 degrees. Optics for Band 1 and 2: For the measurements in the 30-100 GHz range, the original corrugated feeds and lenses of the ALMA optics Band 1 and 2 were used together with a directional waveguide coupler, which leads to exactly the same probing beam as given in the ALMA specifications (Figure 2 and 4). The distance between the target and the lenses has been set according to the values in RD1. In this setup, the backscatter signal of the target under test is significantly smaller than the crosstalk of the waveguide coupler and the reflections at the lens. Optics for Band 3 to 9: Above 100 GHz the directional coupler was realized quasi-optically by using two wire grids as polarizing beam splitters, two elliptical mirrors as focusing elements and corrugated horn antennas at the signal generator and detector (Figure 3, 5 and 6). The second observation port of this quasi-optical coupler is terminated by a conical beam dump with low backscatter, which leads to a significantly higher directivity of this setup. Still the same data processing was applied to correct the measurements from residual reflections at the beam dump. The distance between beam waist of the reflectometer optics and the target under test was set to a value of about 340 mm, which corresponds to the dimensions given in the design study RD1. Different horn antennas, multiplied sources and detectors had to be used to cover the full frequency range up to 700GHz (Band 9). Measurements at Band 10 were not feasible because of the limited output power of our signal generator at these frequencies. The beam waist of the IAP optical bench is about 10 mm at the band centers of the different horn antennas. For Band 4 to 6 the beam waist of the test setup is similar to the one of the ALMA specifications, but in all other frequency bands they differ from each other. In the higher frequency bands, the beam waist of the reflectometer is
ALMA System
ALMA Calibration Device Prototype Calibration Load
Test Report
Doc # : FEND-40.06.04.00-005-A-REP Date: 2007-07-24 Status: Released Version: A Page: 11 of 35
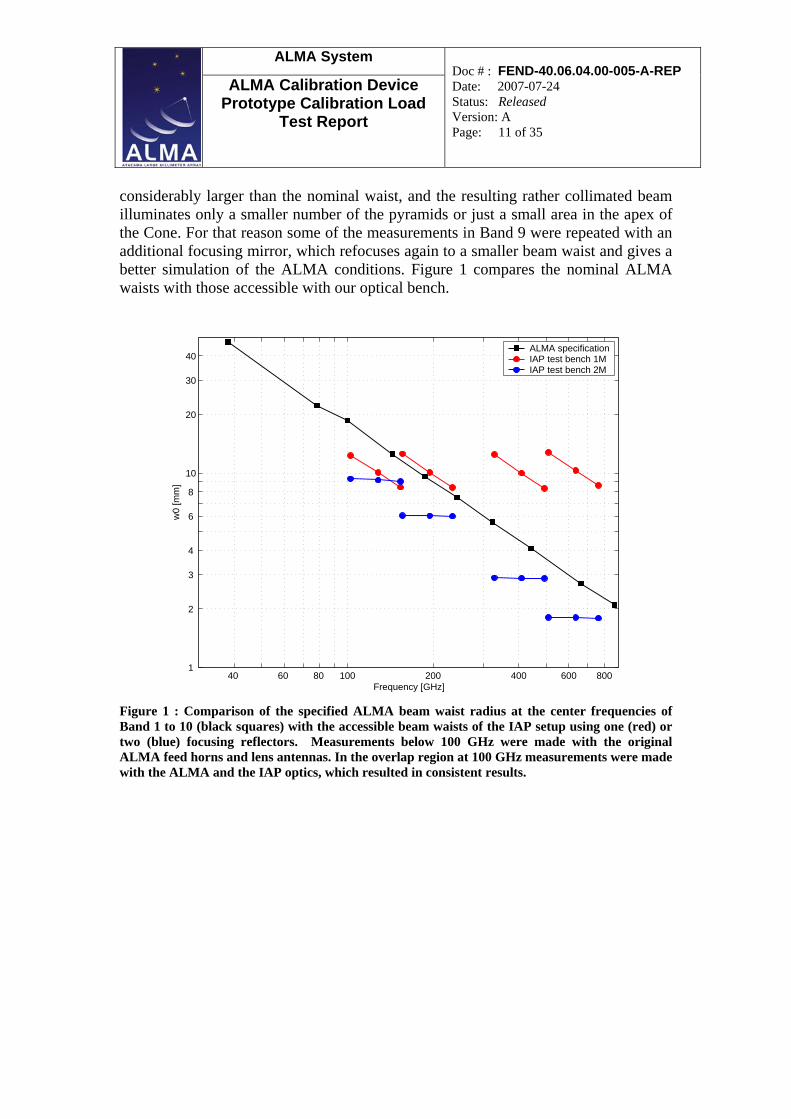
considerably larger than the nominal waist, and the resulting rather collimated beam illuminates only a smaller number of the pyramids or just a small area in the apex of the Cone. For that reason some of the measurements in Band 9 were repeated with an additional focusing mirror, which refocuses again to a smaller beam waist and gives a better simulation of the ALMA conditions. Figure 1 compares the nominal ALMA waists with those accessible with our optical bench.
40 60 80 100 200 400 600 8001
2
3
4
6
8
10
20
30
40
Frequency [GHz]
w0
[mm
]
ALMA specificationIAP test bench 1MIAP test bench 2M
Figure 1 : Comparison of the specified ALMA beam waist radius at the center frequencies of Band 1 to 10 (black squares) with the accessible beam waists of the IAP setup using one (red) or two (blue) focusing reflectors. Measurements below 100 GHz were made with the original ALMA feed horns and lens antennas. In the overlap region at 100 GHz measurements were made with the ALMA and the IAP optics, which resulted in consistent results.

ALMA System
ALMA Calibration Device Prototype Calibration Load
Test Report
Doc # : FEND-40.06.04.00-005-A-REP Date: 2007-07-24 Status: Released Version: A Page: 12 of 35
SubmmVector−NetworkAnalyzer
Translation andRotation Stages
Test Object
Source
Detector
ALMA Band 1 or 2Horn + Lens
Figure 2 : Test setup for the active backscatter measurements using the original ALMA Band 1 and 2 feed system and a waveguide coupler.
Conical AbsorberTermination
MirrorElliptical
horizontalDetector
SubmmVector−NetworkAnalyzer
Sourcevertical
Grid 1horizontal
Grid 245 deg
Translation andRotation Stages
Test Object
Figure 3: Test setup for the active backscatter measurements above 100 GHz with a quasi-optical directional coupler.

ALMA System
ALMA Calibration Device Prototype Calibration Load
Test Report
Doc # : FEND-40.06.04.00-005-A-REP Date: 2007-07-24 Status: Released Version: A Page: 13 of 35
Figure 4: Test setup using the original horn and lens combination of ALMA Band 1 (top) and Band 2 (bottom). The signal source Tx and the detector Rx are a multiplier and a harmonic detector, respectively.

ALMA System
ALMA Calibration Device Prototype Calibration Load
Test Report
Doc # : FEND-40.06.04.00-005-A-REP Date: 2007-07-24 Status: Released Version: A Page: 14 of 35
Figure 5: Test setup for Band 3 to 9, using the IAP optical test bench. In this setup the beam waist is about 10 mm at the center frequency of the different horn antennas that were used.
Figure 6: IAP test bench with a second focusing mirror and an additional plane mirror, which was used to produce a beam waist of about 1.9mm for some of the Band 9 measurements.

ALMA System
ALMA Calibration Device Prototype Calibration Load
Test Report
Doc # : FEND-40.06.04.00-005-A-REP Date: 2007-07-24 Status: Released Version: A Page: 15 of 35
4.2 Data Analysis Each reflection measurement consists of a series of 50 to 100 single measurements during which the distance has been shifted by at least half of a wavelength. These data points are lying on a circle in the complex measurement plane. The radius of this circle is fitted using a least-squares algorithm and corresponds to the backscatter coefficient. Figure 7 gives an example for such circles for the Pyramids and the Cone at 660 GHz. The offset from the origin of the coordinate system is caused by the finite directivity of the test setup. For the measurements in Band 1 and 2 the offset is significantly larger than in this example, but this does not limit the measurement accuracy. The zero dB value, which is required to normalize the data, is determined from a series of measurements with a flat metal reflector placed at the position of the beam waist. These reference measurements were also recorded while moving the reflector by about half a wavelength in order to correct for the effect of standing waves in the reference data.
0.0005
0.001
0.0015
0.002
0.0025
−54.7 dB PYRAMIDS
0.00025
0.0005
−71.2 dB Cone
Figure 7: Examples of the raw data of two backscatter measurements of the Pyramids and the Cone in the complex coordinate system. These measurements were recorded at a constant incidence angle and a frequency of 660 GHz. The data was fitted by a circle. Its offset is determined by the directivity of the reflectometer setup, and its radius (thick black line) is a measure for the backscatter of the target under test.

ALMA System
ALMA Calibration Device Prototype Calibration Load
Test Report
Doc # : FEND-40.06.04.00-005-A-REP Date: 2007-07-24 Status: Released Version: A Page: 16 of 35
4.3 Backscatter Results 4.3.1 Pre-Prototype Pyramids The pre-prototype Pyramids have been measured only at a few frequencies. Since the ALMA horn and lens combination of Band 1 and 2 were not available at the time of these tests a simple corrugated horn antenna without focusing optics has been used to measure between 70-100 GHz. In this case the measurement distance was closer than the 340mm of the final setup. This measurement was repeated at a slightly different angle and after a 5 mm lateral shift of the target, which corresponds to half of the pitch between the pyramids. For the measurements at 625 GHz the test setup was similar to the one of the final prototype, but nevertheless the backscatter results in Figure 8 are significantly higher. They exhibit typical Bragg reflection peaks at angles that correspond very well to the the periodicity of the pyramids and the wavelength of the measurement. The reason for the bad performance of the pre-prototype is still unclear and needs further investigation.
75 80 85 90 95 100 105 110−70
−60
−50
−40
−30
−20
Frequency [GHz]
Bac
ksca
tter
[dB
]
Pyramids pre−prototype
initialΔθΔy= +5mm
−10 −5 0 5 10−70
−60
−50
−40
−30
−20
Angle [deg]
Bac
ksca
tter
[dB
]
Pyramids pre−prototype
Δθ=1.4
initialΔz= +λ/4Δy= +5mmν=625 GHz
Figure 8: Backscatter results of the RAL-0 pre-prototype at different frequencies between 75 to 110 GHz with small variations of the angle of incidence and lateral position of the target (left), and at 625 GHz for different angles of incidence (right).

ALMA System
ALMA Calibration Device Prototype Calibration Load
Test Report
Doc # : FEND-40.06.04.00-005-A-REP Date: 2007-07-24 Status: Released Version: A Page: 17 of 35
4.3.2 Prototype Targets and Cone The final prototype of the Pyramids and the Cone were characterized over a wide range of frequencies. A summary of the tests with the ALMA Band 1 and 2 feeds at normal incidence is given in Figure 9. The measurements of the Pyramids were re-peated with the polarization parallel or diagonal to their base, but this did not have any significant influence on the results.
30 40 50 60 70 80 90 100 110−90
−80
−70
−60
−50
−40
−30
Frequency [GHz]
Bac
ksca
tter
[dB
]
ConePyramidsPyramids 45deg
Figure 9: Backscatter measurements of the Cone (red) and the Pyramids (blue) using the ALMA Band 1 and 2 feed optics and a directional waveguide coupler. Very similar results were obtained after rotating the Pyramids by 45 degrees (light blue).
ALMA System
ALMA Calibration Device Prototype Calibration Load
Test Report
Doc # : FEND-40.06.04.00-005-A-REP Date: 2007-07-24 Status: Released Version: A Page: 18 of 35
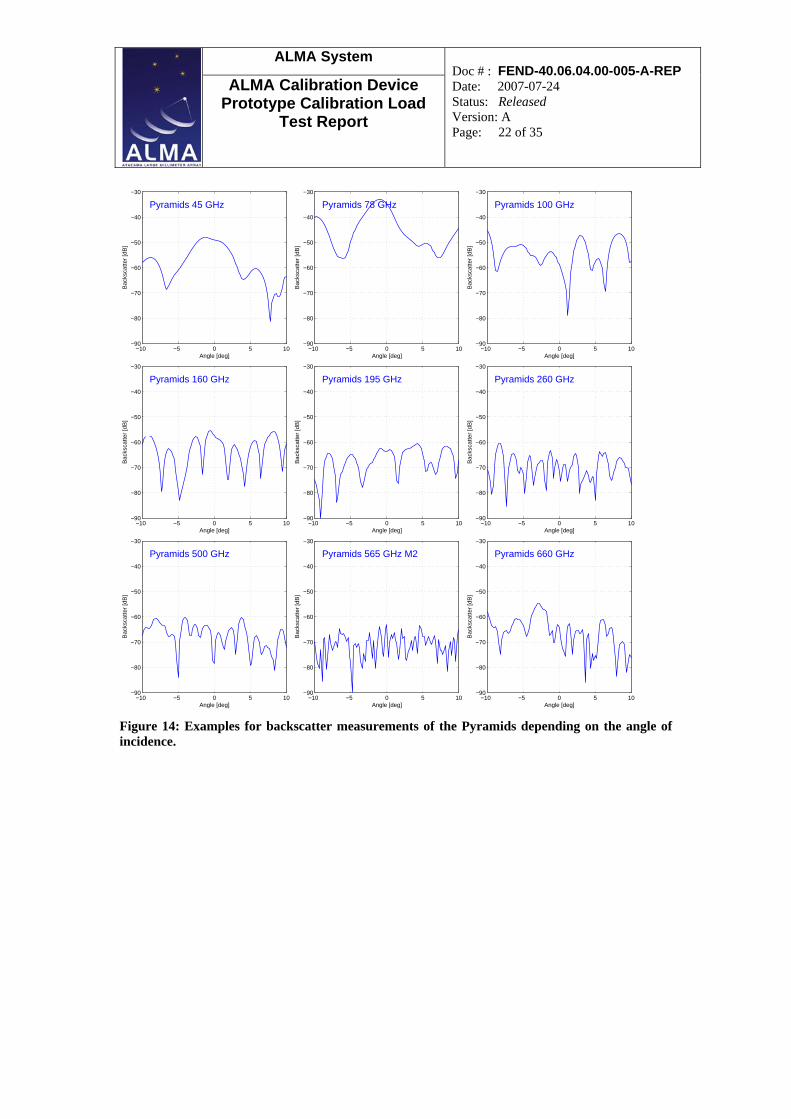
Figure 10 gives an overview of the maximum backscatter of the measurement series during which the angle of incidence had been scanned between -10 and +10 degrees with. Again no polarization effects were observed for the Pyramids (blue and light blue). The results of the Cone were always significantly lower (red). In addition, it is most likely that the backscatter results of the Cone are overestimated for several rea-sons. The circular aperture of the Cone is smaller than the diameter of the pyramidal target, and especially at the lower frequencies the spillover at its rim is not negligible and will be partly scattered back. The provisional shroud that was used on the Cone in the Band 1 and 2 measurements was made well enough to avoid this problem completely. Measurements of the Cone in a setup with a lower spillover at 90 GHz resulted in sig-nificantly lower backscatter. At the higher frequencies, the 10mm beam waist of our test bench produces a rather collimated beam, which illuminates only a small area in the tip of the Cone. For the measurements only an early prototype of the Cone was available, and the tip was not perfectly sharp because of the difficulties of the molding process. Our previous meas-urements of casted conical targets have shown that the backscatter can be below -80dB with this design, but only when the tip has no manufacturing errors. Measure-ments with the two mirror configuration of our test bench, which produces a more di-vergent beam similar to the ALMA Band 9 beam waist, result for the Cone in a sig-nificant reduction of the maximum backscatter values. For the Pyramids the im-provement is much smaller (dashed lines at 565 and 660 GHz). The RAM Tiles became a candidate for the ALMA ambient target at a later stage of this test series. For that reason, they were initially tested only above 400 GHz (green). After the main test series a prototype of a Tiles Ambient target became available and was characterized at a few frequencies in Band 5 and 6 (dark green). The mean values of the same measurement series, averaged over all angles of inci-dence, are given in Figure 11. Examples from the complete data set including the an-gular dependence are shown in Figures 12 to 14. For the Cone the backscatter peaks at normal incidence for the higher frequencies, whereas the Pyramids and Tiles show periodic reflection maxima at certain angles.

ALMA System
ALMA Calibration Device Prototype Calibration Load
Test Report
Doc # : FEND-40.06.04.00-005-A-REP Date: 2007-07-24 Status: Released Version: A Page: 19 of 35
0 100 200 300 400 500 600 700−90
−80
−70
−60
−50
−40
−30
Frequency [GHz]
Max
imum
Bac
ksca
tter
[dB
]
ConeCone M2PyramidsPyramids M2Pyramids 45TilesTiles M2
Figure 10: Summary of the maximum backscatter values of the Pyramids (blue), Cone (red) and the Tiles (green). Each triangle represents the maximum of a series of 100 measurements at angles of incidence between -10 and +10 degrees. Solid lines above 110 GHz are measurements using the test bench with one focusing mirror and a beam waist of about 10mm. For the dashed lines a second mirror (M2) has been employed, which is closer to the ALMA optical specification.
0 100 200 300 400 500 600 700−90
−80
−70
−60
−50
−40
−30
Frequency [GHz]
Mea
n B
acks
catte
r [d
B]
ConeCone M2PyramidsPyramids M2Pyramids 45TilesTiles M2
Figure 11: Mean values of the backscatter measurements, averaged over angles of incidence from -10 to 10 degrees.

ALMA System
ALMA Calibration Device Prototype Calibration Load
Test Report
Doc # : FEND-40.06.04.00-005-A-REP Date: 2007-07-24 Status: Released Version: A Page: 20 of 35
−10 −5 0 5 10−90
−80
−70
−60
−50
−40
−30
−10 −5 0 5 10−90
−80
−70
−60
−50
−40
−30
−10 −5 0 5 10−90
−80
−70
−60
−50
−40
−30
Cone 38 GHz Cone 100 GHz Cone 160 GHz
Angle [deg]
Bac
ksca
tter
[dB
]
Angle [deg]
Bac
ksca
tter
[dB
]
Angle [deg]
Bac
ksca
tter
[dB
]
−10 −5 0 5 10−90
−80
−70
−60
−50
−40
−30
−10 −5 0 5 10−90
−80
−70
−60
−50
−40
−30
−10 −5 0 5 10−90
−80
−70
−60
−50
−40
−30
Cone 195 GHz Cone 240 GHz Cone 417 GHz
Angle [deg]
Bac
ksca
tter
[dB
]
Angle [deg]
Bac
ksca
tter
[dB
]
Angle [deg]
Bac
ksca
tter
[dB
]
−10 −5 0 5 10−90
−80
−70
−60
−50
−40
−30
−10 −5 0 5 10−90
−80
−70
−60
−50
−40
−30
−10 −5 0 5 10−90
−80
−70
−60
−50
−40
−30
Cone 500 GHz Cone 660 GHz Cone 660 GHz M2
Angle [deg]
Bac
ksca
tter
[dB
]
Angle [deg]
Bac
ksca
tter
[dB
]
Angle [deg]
Bac
ksca
tter
[dB
]
Figure 12: Examples for backscatter measurements of the Cone depending on the angle of incidence.

ALMA System
ALMA Calibration Device Prototype Calibration Load
Test Report
Doc # : FEND-40.06.04.00-005-A-REP Date: 2007-07-24 Status: Released Version: A Page: 21 of 35
−10 −5 0 5 10−90
−80
−70
−60
−50
−40
−30
Tile ALMA 200
Angle [deg]
Bac
ksca
tter
[dB
]
−10 −5 0 5 10−90
−80
−70
−60
−50
−40
−30
Tile ALMA 270
Angle [deg]
Bac
ksca
tter
[dB
]
−10 −5 0 5 10−90
−80
−70
−60
−50
−40
−30
Tile ALMA 300
Angle [deg]
Bac
ksca
tter
[dB
]
−10 −5 0 5 10−90
−80
−70
−60
−50
−40
−30
Tiles 417 GHz
Angle [deg]
Bac
ksca
tter
[dB
]
−10 −5 0 5 10−90
−80
−70
−60
−50
−40
−30
Tiles 500 GHz
Angle [deg]
Bac
ksca
tter
[dB
]
−10 −5 0 5 10−90
−80
−70
−60
−50
−40
−30
Tiles 565 GHz
Angle [deg]
Bac
ksca
tter
[dB
]
−10 −5 0 5 10−90
−80
−70
−60
−50
−40
−30
Tiles 660 GHz
Angle [deg]
Bac
ksca
tter
[dB
]
−10 −5 0 5 10−90
−80
−70
−60
−50
−40
−30
Tiles 565 GHz M2
Angle [deg]
Bac
ksca
tter
[dB
]
−10 −5 0 5 10−90
−80
−70
−60
−50
−40
−30
Tiles 660 GHz M2
Angle [deg]
Bac
ksca
tter
[dB
]
Figure 13: Examples for backscatter measurements of the Tiles depending on the angle of incidence. The first three plots labeled Tile ALMA were made with the ambient prototype target, which consists of an assembly of four Tiles with an 200mm circular aperture, the others with a single 100x100mm Tile.
ALMA System
ALMA Calibration Device Prototype Calibration Load
Test Report
Doc # : FEND-40.06.04.00-005-A-REP Date: 2007-07-24 Status: Released Version: A Page: 22 of 35
−10 −5 0 5 10−90
−80
−70
−60
−50
−40
−30
Pyramids 45 GHz
Angle [deg]
Bac
ksca
tter
[dB
]
−10 −5 0 5 10−90
−80
−70
−60
−50
−40
−30
Pyramids 78 GHz
Angle [deg]
Bac
ksca
tter
[dB
]
−10 −5 0 5 10−90
−80
−70
−60
−50
−40
−30
Pyramids 100 GHz
Angle [deg]
Bac
ksca
tter
[dB
]
−10 −5 0 5 10−90
−80
−70
−60
−50
−40
−30
Pyramids 160 GHz
Angle [deg]
Bac
ksca
tter
[dB
]
−10 −5 0 5 10−90
−80
−70
−60
−50
−40
−30
Pyramids 195 GHz
Angle [deg]
Bac
ksca
tter
[dB
]
−10 −5 0 5 10−90
−80
−70
−60
−50
−40
−30
Pyramids 260 GHz
Angle [deg]
Bac
ksca
tter
[dB
]
−10 −5 0 5 10−90
−80
−70
−60
−50
−40
−30
Pyramids 500 GHz
Angle [deg]
Bac
ksca
tter
[dB
]
−10 −5 0 5 10−90
−80
−70
−60
−50
−40
−30
Pyramids 565 GHz M2
Angle [deg]
Bac
ksca
tter
[dB
]
−10 −5 0 5 10−90
−80
−70
−60
−50
−40
−30
Pyramids 660 GHz
Angle [deg]
Bac
ksca
tter
[dB
]
Figure 14: Examples for backscatter measurements of the Pyramids depending on the angle of incidence.

ALMA System
ALMA Calibration Device Prototype Calibration Load
Test Report
Doc # : FEND-40.06.04.00-005-A-REP Date: 2007-07-24 Status: Released Version: A Page: 23 of 35
4.3.3 Barrier Sheets The reflectivity of the barrier sheets has been tested at normal incidence using the same test setup as for the targets. The samples were mounted on a translation stage close to the beam waist of the reflectometer. Figure 15 compares the measurement results of the two samples with theoretical curves. For the simulations the actual thickness of the samples has been used, and the dielectric constant was adjusted to obtain similar results as in the measurements. To characterize the thicker Gore-Tex slab accurately a finer frequency resolution of the measurements would be required, but this was not the objetive of these measurements. Up to 500 GHz the test results correspond reasonably well with the assumed theoretical curves. At higher frequencies the test results are significantly lower, but this could also be a measurement error from the fact that the samples could not be mounted perfectly flat on the sample holder. The resulting phase errors are larger at higher frequencies and may have reduced the detected signal.
0 100 200 300 400 500 600 700−50
−45
−40
−35
−30
−25
−20
−15
−10
Frequency [GHz]
Bac
ksca
tter
[dB
]
MuporTM
GORE−TEXTM
ε=1.45, d=0.245mmε=1.25, d=3.2mm
Figure 15: Backscatter of the Mupor and Gore-Tex sample at normal incidence, together with theoretical curves (thin lines). At some frequencies more than one marker is shown when the measurements were repeated to check the repeatability of the setup.

ALMA System
ALMA Calibration Device Prototype Calibration Load
Test Report
Doc # : FEND-40.06.04.00-005-A-REP Date: 2007-07-24 Status: Released Version: A Page: 24 of 35
5 Radiometric Tests 5.1 Experimental Setup The active backscatter measurements of the previous section sample only a small fraction of the total scattered signal. To determine the total scattered power radiometric tests were made at IRAM, using either an ALMA Band 7 cartridge in a test cryostat tuned to 323 GHz or an IRAM Plateau de Bure receiver operating at 90 GHz. The IF output of the two receivers is band limited to either 4GHz or 0.5 GHz, respectively, and detected using a diode detector. The measurement technique described in this section is not sensitive to small detector nonlinearities, but still care has been taken to keep the power level at the detector within its linear range. The video output of the detector is analyzed by a Lock-In Amplifier. An optical chopper operating around 80 Hz switches between the calibration target under test and a second reference target. Both targets are at ambient temperature, so chopping between them leads only to a small signal at the output of the Lock-In amplifier. The absorber under test is in a metal enclosure with a Styrofoam floor, under which an extended cold load is placed. The front wall of the enclosure with the chopper, which are at an angle of 45 degrees, and also the other walls of the enclosure illuminate the target under test from all sides with the cold background. At the beginning of each test series the cold load is covered by an ambient temperature absorber. The scattering of this ambient background at the target under test should not change its radiometric temperature since they have both the same physical temperature. After 30s the ambient absorber sheet is removed from the liquid nitrogen target. A small fraction of this cold background signal is scattered at the target under test, whereas the reference target ideally does not see any change of its background signal. This leads to an increase of the Lock-In reading, which depends only on the total reflectivity of the target under test, but not on the quality of the reference target. Figure 16 and the following show a schematic diagram of the test setup and the actual experiment at IRAM.
under TestTarget
Removable Absorber
SIS Receiver
Lock−In Amplifier
Optical Chopper
LN2 Background
Reference Target
Figure 16: Schematic setup for radiometric measurement of the total scattering of the target.

ALMA System
ALMA Calibration Device Prototype Calibration Load
Test Report
Doc # : FEND-40.06.04.00-005-A-REP Date: 2007-07-24 Status: Released Version: A Page: 25 of 35
Both targets and the enclosure with the chopper are placed in a closed Styrofoam box to reduce temperature drifts or cooling effects from the cold target. The cold target consists of a second closed Styrofoam box with a sheet of microwave absorber immersed in liquid nitrogen. The effective brightness temperature of the cold background does not need to be known for this test method. An additional measurement of a fully reflecting target is necessary to normalize the output signal of the Lock-In amplifier and to zero its phase. For that purpose a metal reflector with a 45degree inclination was placed in front of the target under test, which points the receiver directly to the cold target. This calibration was repeated before and after the test series to check its repeatability and to make sure that the measurements are not affected by condensation on the cold target.
Figure 17: Radiometric tests using the ALMA Band 7 cartridge at IRAM. The whole setup is in a large Styrofoam box to keep the temperature of the targets as stable as possible. The cold background signal is coming from an absorber in a second Styrofoam box below that is filled with liquid Nitrogen. For measurements with the ambient background an absorber sheet is placed between the two boxes.
Figure 18: Top view of the radiometric setup. The reflecting lid of the metal enclosure was removed for this picture. The chopper wheel and the window to the cryostat are not visible below the slanted front wall of the enclosure.

ALMA System
ALMA Calibration Device Prototype Calibration Load
Test Report
Doc # : FEND-40.06.04.00-005-A-REP Date: 2007-07-24 Status: Released Version: A Page: 26 of 35
5.2 Measurement Results Each measurement consists of a time series with 30s ambient background and 30s cold background. The recorded in-phase output signal of the Lock-In amplifier is divided by the mean value of a reference cycle with the metal reflector, i.e. by the signal from chopping directly between the cold background and the ambient reference target. Ideally the first 30s with the ambient background should be identical to zero, but small temperature differences between the targets or other effects, e.g. backscatter of leaking local oscillator power at one of the targets, usually produce a certain offset on each test record. In order to show the increase of the normalized signals more clearly the mean value of the first 25s on the ambient background has been subtracted from each measurement in the following figures. Several other absorber samples were included in this test series, but here only the results of two commercially available flat foam absorbers are shown for comparison. These are AN-72 from Emerson&Cuming and LAO-5 from Marconi. For the Tile measurements four absorber pieces were connected to cover an area of 20cm x 20cm. Figure 19 shows the test results at 323 GHz using the ALMA Band 7 cartridge. In this case the experiment was not sensitive enough to detect any noticeable change of the Lock-In signal for the Cone when the cold background is uncovered at t=0s. Possibly the signal-to-noise ratio could have been improved by increasing the IF power level at the detector diode with some compromise on the linearity of the measurement, but this has not been done during this test series. Thus this measurement sets only an upper limit in the order of 1e-4 for the total scattering of the Cone. The Tiles resulted in a distinct increase of about 5e-4. With the Pyramids some, but not all of the measurements show an increase in the order of 1e-4 to 5e-4. It remains unclear why the measurements appear to be noisier and less repeatable for this target than for the others. The total scattering at the AN-72 and the LAO-5 samples is significantly higher at values of 2.5e-2 and 3.8e-2, respectively. It should be noted, however, that these absorbers are not designed for millimeter wave frequencies. Figure 20 shows the test results using the Plateau de Bure receiver at 90 GHz. The scattering at the AN-72 sample remained almost unchanged at the 2e-3 level, whereas the LAO absorber has improved to about 6e-3. The best performance was obtained for the Tiles at about 1e-3. The Cone is slightly worse at about 2e-3 and the Pyramids at about 2.5e-3. It is well possible, however, that these measurements are an overestimation because of the spillover at the targets, especially for the Cone, which has the smallest aperture. The Plateau de Bure optics is designed for f/D=5, which results in a higher beam divergence than in ALMA. In addition the beam waist of the receiver had to be placed at the position of the optical chopper because of mechanical constraints and to avoid truncation. Each target is still larger than 4w, but the edge taper is higher than in ALMA Band 2 and 3. Spillover effects became evident from the fact that the metal mounting fixture of the targets had to be covered with additional absorber material, otherwise the Lock-In signal increased slightly more. To

ALMA System
ALMA Calibration Device Prototype Calibration Load
Test Report
Doc # : FEND-40.06.04.00-005-A-REP Date: 2007-07-24 Status: Released Version: A Page: 27 of 35
make sure that most of the observed signal increase was still related to the targets, additional background measurements were made without any target and after removing the back wall off the Styrofoam box. In this case the receiver was pointing on a large absorber sheet in some distance, which does not see any change of its thermal background when the absorber from the cold target is removed. As expected these background measurements measurement did not show any rise of the Lock-in signal, which rules out that the experimental setup contributes significantly to these results. This is also a test for the alignment between the beam and the window in front of the chopper, because the initial measurements with a less accurate alignment showed significant reflection artifacts in the background measurement, which were caused by the scattering at the edge of that window.
−60 −40 −20 0 20 40 60−0.005
0
0.005
0.01
0.015
0.02
0.025
0.03
0.035
0.04
Time [s]
Nor
mal
ized
Loc
k−In
Sig
nal
323GHz ALMA Band 7
PyramidsConeTK−RAMLAO−5AN−72
−60 −40 −20 0 20 40 60−4
−2
0
2
4
6
8
10x 10
−4
Time [s]
Nor
mal
ized
Loc
k−In
Sig
nal
323GHz ALMA Band 7
PyramidsConeTK−RAMLAO−5AN−72
Figure 19: Radiometric measurements at 323 GHz using the ALMA Band 7 cartridge. The figures show the same data set on different amplitude scales.
−30 −20 −10 0 10 20 30
0
0.005
0.01
0.015
0.02
0.025
Time [s]
Nor
mal
ized
Loc
k−In
Sig
nal
90 GHz Plateau de Bure
PyramidsConeTK−RAMLAO−5AN−72
−30 −20 −10 0 10 20 30−1
0
1
2
3
4
5x 10
−3
Time [s]
Nor
mal
ized
Loc
k−In
Sig
nal
90 GHz Plateau de Bure
PyramidsConeTK−RAMLAO−5AN−72
Figure 20: Radiometric measurements at 90 GHz using the Plateau de Bure receiver.

ALMA System
ALMA Calibration Device Prototype Calibration Load
Test Report
Doc # : FEND-40.06.04.00-005-A-REP Date: 2007-07-24 Status: Released Version: A Page: 28 of 35
5.3 Standing wave results The Plateau de Bure receiver has been also used to directly measure the standing wave ratio between the SIS mixer and the targets under test using a simple spectrum analyzer. The target under test was mounted on a motorized translation stage in front of the receiver (Figure 21). The motor was slowly moving at a constant speed for about 30 s. A spectrum analyzer was connected to the IF output of the receiver and recorded its signal amplitude. In order to obtain a sufficient sensitivity at the 0.01dB level, which is required for this kind of measurement, the spectrum analyzer was operated in zero span mode at the IF band center with its largest resolution bandwidth of 5 MHz and a rather low video bandwidth of 30 Hz. Moving the target shifts the standing wave pattern in frequency. Since only one frequency channel, which has to be narrower than the standing wave period, is observed the time record on the spectrum analyzer shows a sinusoidal oscillation.
30Hz VBW
Zero Span5MHz RBW
Translation Stage
Target under Test
v
SIS Receiver
AnalyzerSpectrum
Figure 21: Experimental setup for the passive standing wave observations.
0 5 10 15 20 25 30−0.06
−0.04
−0.02
0
0.02
0.04
0.06
Time [s]
SW
R A
mpl
iude
[dB
]
PyramidsMoving Average
0 5 10 15 20 25 30−0.06
−0.04
−0.02
0
0.02
0.04
0.06
Time [s]
SW
R A
mpl
iude
[dB
]
ConeMoving Average
Figure 22: Standing wave observations at 90 GHz for the Pyramids (left) and the Cone (right).
The measurement results in Figure 22 show for the Pyramids a standing wave amplitude of 0.04dB, whereas no standing waves become evident for the Cone.

ALMA System
ALMA Calibration Device Prototype Calibration Load
Test Report
Doc # : FEND-40.06.04.00-005-A-REP Date: 2007-07-24 Status: Released Version: A Page: 29 of 35
This passive test method is complementary to the active backscatter measurements described in the previous section, but in this case the actual standing wave amplitude depends also on the reflections of the receiver. The value of 0.04dB with the Pyramids corresponds to an intensity modulation of almost 1% amplitude. With an assumed receiver noise temperature of 80K and the ambient temperature absorber this is equivalent to peak-to-peak baseline ripple of more than 7K. The total roundtrip loss between the receiver and the target can be estimated as 20*log(0.01/2) = -46dB. This is consistent with the results of the active backscatter measurements at that frequency when the return loss of the SIS mixer is in the order of -10dB.
ALMA System
ALMA Calibration Device Prototype Calibration Load
Test Report
Doc # : FEND-40.06.04.00-005-A-REP Date: 2007-07-24 Status: Released Version: A Page: 30 of 35
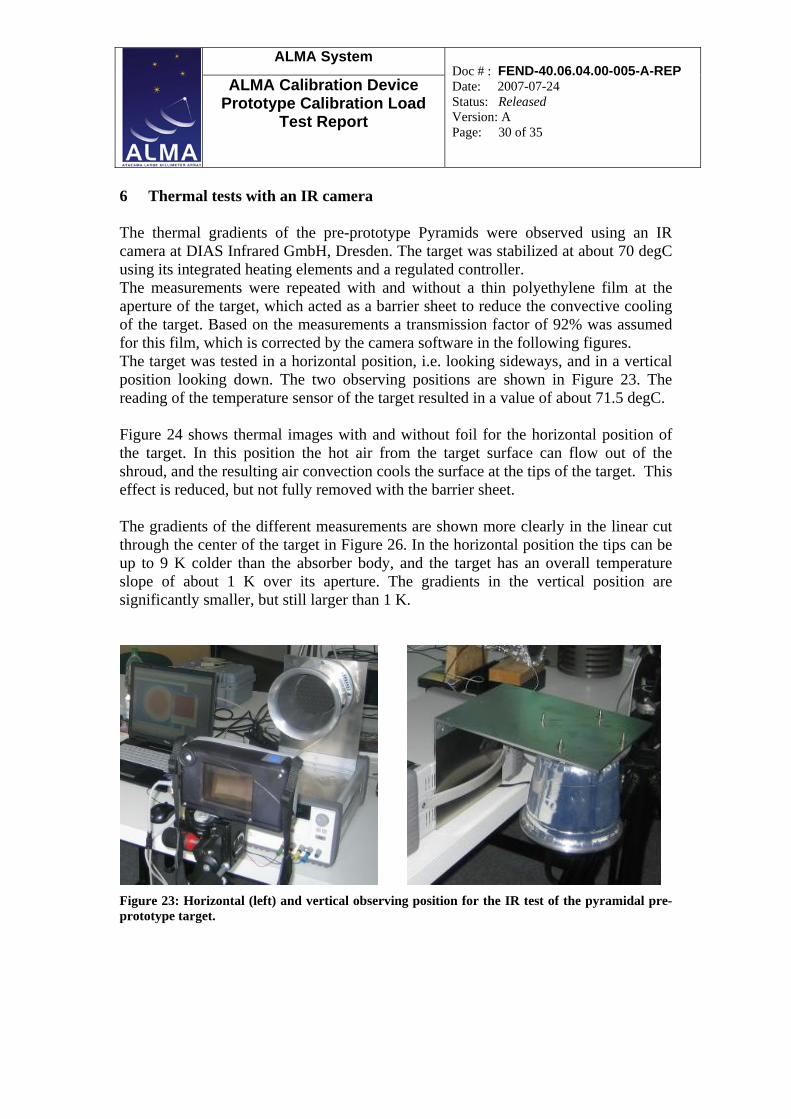
6 Thermal tests with an IR camera The thermal gradients of the pre-prototype Pyramids were observed using an IR camera at DIAS Infrared GmbH, Dresden. The target was stabilized at about 70 degC using its integrated heating elements and a regulated controller. The measurements were repeated with and without a thin polyethylene film at the aperture of the target, which acted as a barrier sheet to reduce the convective cooling of the target. Based on the measurements a transmission factor of 92% was assumed for this film, which is corrected by the camera software in the following figures. The target was tested in a horizontal position, i.e. looking sideways, and in a vertical position looking down. The two observing positions are shown in Figure 23. The reading of the temperature sensor of the target resulted in a value of about 71.5 degC. Figure 24 shows thermal images with and without foil for the horizontal position of the target. In this position the hot air from the target surface can flow out of the shroud, and the resulting air convection cools the surface at the tips of the target. This effect is reduced, but not fully removed with the barrier sheet. The gradients of the different measurements are shown more clearly in the linear cut through the center of the target in Figure 26. In the horizontal position the tips can be up to 9 K colder than the absorber body, and the target has an overall temperature slope of about 1 K over its aperture. The gradients in the vertical position are significantly smaller, but still larger than 1 K.
Figure 23: Horizontal (left) and vertical observing position for the IR test of the pyramidal pre-prototype target.

ALMA System
ALMA Calibration Device Prototype Calibration Load
Test Report
Doc # : FEND-40.06.04.00-005-A-REP Date: 2007-07-24 Status: Released Version: A Page: 31 of 35
Figure 24: Thermal images of the Pyramids in the horizontal position without (left) and with barrier sheet (right).
Figure 25: Thermal images of the Pyramids in the vertical position without (left) and with barrier sheet (right).
60
62
64
66
68
70
72
74
T [d
egC
]
HorizontalHorizontal with Foil
60
62
64
66
68
70
72
74
T [d
egC
]
VerticalVertical with Foil
Figure 26: Thermal profiles of the previous images.

ALMA System
ALMA Calibration Device Prototype Calibration Load
Test Report
Doc # : FEND-40.06.04.00-005-A-REP Date: 2007-07-24 Status: Released Version: A Page: 32 of 35
7 Discussion 7.1 Measurement Accuracy The characterization of high quality calibration targets is experimentally very challenging and the obtained results depend on many factors. For that reason it is difficult to give a detailed error budget for the tests described in this report. For the active backscatter measurements the moving target calibration is well suited to remove spurious contributions of the test setup from the true backscatter signal. Depending on the frequency the dynamic range of our test setup drops, especially above 650 GHz, and the integration time had to be increased to improve the sensitivity. When the signal approaches the noise floor at very low reflection values the data analysis will result always in an overestimation of the backscatter value until it can only give an upper limit for it. Almost all measurements in this report are not limited by the noise floor. An exception are the measurements above 600GHz at very low values below -70dB, which were observed with the Cone at off-axis angles or with the M2 configuration. Even for the measurements with a very high signal-to-noise ratio at lower frequencies or of the targets with a higher reflectivity an uncertainty is introduced by standing waves in the reference measurement with the flat reflector at the beam waist of the reflectometer, which is required to normalize the data. Since this measurement was repeated with varying reflector offset these errors are highly reduced and are estimated to be in the order of 1dB. The main error source of the backscatter measurements are the differences between the ALMA optics and the optics of our test setup. In Band 1 and 2 they are identical, and in Band 4 to 6 they have very similar beam waists. In all other bands significant differences of the beam waist exist, and the measurements with the ALMA optics could result in different results. For that reason it can be expected that the measurements at the higher frequency end overestimate the backscatter, especially for the Cone. Another important error source for the low-level backscatter results is the mode content of the beam. Some of the measurements with the Cone seem to be dominated by scattering at its aperture, which will be very sensitive to higher order modes. The test bench makes use of high quality corrugated feed horns and elliptical mirrors with 60 degrees off-axis angle. This results in a high Gaussianity of the beam, but several percent of the signal will be always carried by the higher order modes, which increases the spillover on the aperture of the Cone. The largest errors because of the beam characteristics of our test setup can be expected in the frequency band between 250 to 350 GHz. For his frequency band no dedicated horn antennas were available and it had to be tested by stressing the existing 200 GHz and 400 GHz beyond their nominal frequency range with some compromise on the beam quality. With the Pyramids spillover was less of an issue since the absorber itself has no rim that could scatter back into the reflectometer, so it is safe to assume that all of the

ALMA System
ALMA Calibration Device Prototype Calibration Load
Test Report
Doc # : FEND-40.06.04.00-005-A-REP Date: 2007-07-24 Status: Released Version: A Page: 33 of 35
backscatter results of this target are coming form the target itself. They may rise in the actual ALMA configuration, however, when the target is mounted in a shroud with a scattering rim. For the radiometric tests with the Band 7 cartridge the setup was a good representation of the ALMA optics. This measurement showed that the Tiles and the Pyramids would not meet a -40dB requirement on the total scattering. The radiometric measurements at 90 GHz should be treated with care since the spillover at the targets was larger. The thermal tests with the IR camera are a good qualitative tool to detect temperature gradients. The absolute temperature accuracy of the camera, however, is specified with 2K, which is not sufficient to determine the absorber temperature with a desired 0.1 K absolute accuracy. The observed gradients may be also slightly overestimated because the IR emissivity of the absorber material is not unity, which can also lead to an apparently lower temperature at the tips of the Pyramids. The significant reduction of the gradients in the vertical position of the target indicates, however, that this artifact is not the dominant reason for the observed gradients in the horizontal position. It should be also noted that the IR camera only measures the surface temperature of the absorber, whereas the penetration depth will be higher for the millimeter and submillimeter waves. 7.2 Conclusions The backscatter measurements show that the Pyramids meet a -40dB specification at frequencies above 100 GHz and in Band 1, but not in the full frequency range of Band 2. At higher frequencies it is at the -50 dB level or even better, but to avoid calibration errors from standing waves it would be desirable to have an even better target. The Tiles were only tested at a few frequencies above 400 GHz, where they are slightly worse than the Pyramids. The best solution in terms of backscatter offers the Cone. It is most likely that most of the maximum reflections of this target can be attributed to the spillover at its aperture or the non-ideal illumination of the tip area. It can be expected that its performance would be in the order of -70 dB or better when an appropriate shroud and the beam waists of the ALMA optics would have been used for the measurements. The radiometric measurements in Band 7 indicate that a -40dB specification for the total scattering could not be met with the Tiles or the Pyramids. For the Cone only an upper limit of about -50dB can be given since the sensitivity of the setup was not sufficient to detect any response of that target. With the 90 GHz Plateau de Bure receiver significantly higher values above -30dB were obtained for the total scattering, but part of this my be attributed to the higher edge taper, especially for the Cone.

ALMA System
ALMA Calibration Device Prototype Calibration Load
Test Report
Doc # : FEND-40.06.04.00-005-A-REP Date: 2007-07-24 Status: Released Version: A Page: 34 of 35
The radiometric standing wave measurements with the 90 GHz receiver in section 5.3 demonstrate that the backscatter of the Pyramids is high enough to generate substantial standing wave amplitudes, whereas standing waves of the Cone could not be resolved within the sensitivity of this experiment. 90 GHz is close to the frequency where the Pyramids showed their worst performance in the active backscatter measurements, so smaller standing wave amplitudes can be expected in the higher frequency bands, but they will be always significantly larger than with the Cone target. The IR observations showed that temperature gradients are a critical issue for the hot target. Since they depend on the position of the target and its environmental conditions, e.g. the temperature and the air circulation in the receiver cabin, it would be difficult to correct them with a simple temperature offset. A barrier sheet in front of the target would help to reduce the temperature gradients, but the measured reflections of the Gore-Tex and Mupor barrier sheets show that they would dominate the target reflectivity. Temperature gradients were not measured for the Tiles and the Cone. Since both are made of a 10mm thick sheet of the same plastic material, which has a low thermal conductivity and low heat capacity, it can be expected that they exhibit significantly higher thermal gradients than the 0.7mm thin absorber layer on the metal pyramids. In addition, the heat conductivity of the absorber material of the Pyramids is more than five times higher than the one of the Cone. 7.3 Recommendations It is not possible to optimize at the same time the backscatter, the integrated scattering and thermal performance of a calibration target. The best tradeoff between them depends on the scientific requirements on the calibration. For continuum measurements over large bandwidth the absolute accuracy of the temperature scale may be more important than an ultra low backscatter performance, whereas spectroscopic measurements usually require very low standing wave artifacts and might be able to tolerate a higher uncertainty of the absolute calibration. The calibration errors of an imperfect target will also depend on the calibration scheme, e.g. whether it is required to extrapolate a total power calibration with the ambient and the hot target directly to much lower sky temperatures. For these reasons, the astronomical community should specify in more detail their scientific requirements and the planned calibration sequences. The Tiles offer a very cost effective solution for the ambient target, but they are not the best choice in terms of thermal performance and reflections. To obtain a consistent data set their backscatter performance should be verified at least at some of the frequencies of the lower ALMA bands. Because of their low heat conductivity the Tiles are not well suited for the hot target.

ALMA System
ALMA Calibration Device Prototype Calibration Load
Test Report
Doc # : FEND-40.06.04.00-005-A-REP Date: 2007-07-24 Status: Released Version: A Page: 35 of 35
The Pyramids have a surprisingly good backscatter and total scattering performance, considering the fact that they are only covered by a relative thin absorbing layer and that the target consists of an array of scattering tips. Nevertheless, the backscatter is still high enough to introduce significant calibration errors because of the standing waves. From the thermal point of view for the hot load, the Pyramids are currently the best choice of the three tested targets. However, even with the Pyramids the temperature gradients will contribute to the absolute calibration error. The Cone is the optimum solution for low backscatter and total scattering. Most likely the measured backscatter results of this target would be even lower with the nominal ALMA beam parameters and an improved shroud at its aperture. In addition, the Cone is well suited for a cost efficient mass production by injection molding. The main drawbacks are the larger overall length of the Cone when compared to the Pyramids, and the bad thermal properties of the Cone material. This should be acceptable for the ambient target, but it makes it very difficult to use in the hot target. It may be possible to use the current Cone also at elevated temperatures by mounting it in an isothermal enclosure and feeding it through a series of focusing mirrors. These would need to be heated to the same elevated temperature and blackened with an IR absorbing paint in order to reduce also the radiative heat losses of the Cone surface. First designs of this concept have already demonstrated that a folded solution would fit in the available space on the calibration device. The final device, however, would be no longer simple or cost efficient, and it still unclear whether it would meet all performance requirements. The best option would be to realize the low backscatter performance of a conical target by using a thinner absorber layer with high thermal conductivity. TK has already built similar targets for remote sensing applications, and our measurements showed that they usually achieve backscatter values below -70dB. The main drawback of this concept is that the manufacturing costs would be significantly higher than for the injection molded targets. An open question remains whether it is necessary to use a barrier sheet in front of the hot or even on both targets. Preferably the barrier sheet should be avoided, otherwise care has to be taken that it does not cause any backscatter and that the reflected signals are terminated on an absorber of known temperature. A possible solution to avoid the barrier sheet is to mount the target sufficiently deep in a temperature stabilized baffle, but further electro-magnetic and especially thermal simulations are required to find an optimum solution. Thermal simulations and tests are also highly recommended for the current design concepts to predict the temperature gradients and stability in the ALMA environment at 5000m altitude.