ALMA – GC-assisted JVM Live Migration for Java Server ... · it provides fast live migration for...
14
ALMA – GC-assisted JVM Live Migration for Java Server Applications Rodrigo Bruno, Paulo Ferreira INESC-ID / Instituto Superior Técnico, University of Lisbon {rodrigo.bruno,paulo.ferreira}@inesc-id.pt ABSTRACT Live migration of Java Virtual Machines (JVMs) consumes significant amounts of time and resources, imposing relevant application performance overhead. This problem is specially hard when memory modified by applications changes faster than it can be transferred through the network (to a re- mote host). Current solutions to this problem resort to sev- eral techniques which depend on high-speed networks and application throttling, require lots of CPU time to com- press memory, or need explicit assistance from the appli- cation. We propose a novel approach, Garbage Collector (GC) assisted JVM Live Migration for Java Server Appli- cations (ALMA). ALMA makes a snapshot to be migrated containing a minimal amount of application state, by tak- ing into account the amount of reachable memory (i.e. live data) detected by the GC. The main novelty of ALMA is the following: ALMA analyzes the JVM heap looking for regions in which a collection phase is advantageous w.r.t. the network bandwidth available (i.e. it pays to collect be- cause a significant amount of memory will not be part of the snapshot). ALMA is implemented on OpenJDK 8 and ex- tends CRIU (a Linux disk-based process checkpoint/restore tool) to support process live migration over the network. We evaluate ALMA using well-known JVM performance bench- marks (SPECjvm2008 and DaCapo), and by comparing it to other previous approaches. ALMA shows very good per- formance results. CCS Concepts •Networks → Cloud computing; •Software and its engineering → Virtual machines; Garbage collection; Process management; Keywords Virtual Machine Migration; Garbage Collection; Garbage First; Java Heap; OpenJDK; JVM; CRIU Permission to make digital or hard copies of all or part of this work for personal or classroom use is granted without fee provided that copies are not made or distributed for profit or commercial advantage and that copies bear this notice and the full citation on the first page. Copyrights for components of this work owned by others than the author(s) must be honored. Abstracting with credit is permitted. To copy otherwise, or republish, to post on servers or to redistribute to lists, requires prior specific permission and/or a fee. Request permissions from [email protected]. Middleware’16, December 12-16, 2016, Trento, Italy c 2016 Copyright held by the owner/author(s). Publication rights licensed to ACM. ISBN 978-1-4503-4300-8/16/12. . . $15.00 DOI: http://dx.doi.org/10.1145/2988336.2988341 1. INTRODUCTION Live migration of a running Java application entails the full transfer of its state to a remote location, where it is re- sumed, with minimal downtime. Live migration is useful for a number of situations, for example: replacing a crashed ser- vice [34] (fault tolerance), replicating an application for work distribution [42] (load balancing), application fast start-up [26], co-locating services to reduce resource usage [9, 35] (power saving), live service updates [19]. In this work we are interested in improving the live migra- tion of Java server applications which do not rely on other local processes (running on the same node). For example, if two processes in the local node depend on each other, one cannot be migrated if the other isn’t; in this case, a full system virtual machine 1 migration would be necessary (to migrate both processes at the same time). However, if the application to be migrated does not rely on other local processes to run, we can avoid a full system-VM migration (which migrates all the Operating System state and other processes that might be running) and, instead, perform a JVM migration (single process migration), which is a faster and less resource demanding alternative to migrate the ap- plication. The efficiency of live migration can be measured in three metrics: i) total migration time, i.e., the amount of time since the migration starts until it finishes; ii) application throughput, i.e, the difference between the normal appli- cation throughput and the throughput experienced includ- ing a migration (note that application downtime is not the only factor affecting the application throughput, other fac- tors such as application throttling or some application slow- down after migration also affect the throughput); iii) other resources overhead (e.g., network bandwidth, CPU). We target these three metrics with out system called ALMA, i.e. we aim at achieving Java application live migration with: i) minimal total migration time, ii) minimal appli- cation throughput impact, iii) minimal resource overhead (mainly CPU and network bandwidth). Additionally, we also want to avoid requiring programmer intervention/help for the migration, special hardware and modifications to the Operating System as all of these factors impose difficult ob- stacles to deploying and using the system. To fulfill such requirements, the migration engine must be effective and efficient in several ways. To ensure a low to- tal migration time and low resource overhead, the migration 1 In this paper we differentiate a system-VM (e.g. Xen-based or similar) from the Java Virtual Machine (JVM) using the terms system-VM and JVM.
Transcript of ALMA – GC-assisted JVM Live Migration for Java Server ... · it provides fast live migration for...

ALMA – GC-assisted JVM Live Migrationfor Java Server Applications
Rodrigo Bruno, Paulo FerreiraINESC-ID / Instituto Superior Técnico, University of Lisbon
{rodrigo.bruno,paulo.ferreira}@inesc-id.pt
ABSTRACTLive migration of Java Virtual Machines (JVMs) consumessignificant amounts of time and resources, imposing relevantapplication performance overhead. This problem is speciallyhard when memory modified by applications changes fasterthan it can be transferred through the network (to a re-mote host). Current solutions to this problem resort to sev-eral techniques which depend on high-speed networks andapplication throttling, require lots of CPU time to com-press memory, or need explicit assistance from the appli-cation. We propose a novel approach, Garbage Collector(GC) assisted JVM Live Migration for Java Server Appli-cations (ALMA). ALMA makes a snapshot to be migratedcontaining a minimal amount of application state, by tak-ing into account the amount of reachable memory (i.e. livedata) detected by the GC. The main novelty of ALMA isthe following: ALMA analyzes the JVM heap looking forregions in which a collection phase is advantageous w.r.t.the network bandwidth available (i.e. it pays to collect be-cause a significant amount of memory will not be part of thesnapshot). ALMA is implemented on OpenJDK 8 and ex-tends CRIU (a Linux disk-based process checkpoint/restoretool) to support process live migration over the network. Weevaluate ALMA using well-known JVM performance bench-marks (SPECjvm2008 and DaCapo), and by comparing itto other previous approaches. ALMA shows very good per-formance results.
CCS Concepts•Networks → Cloud computing; •Software and itsengineering→Virtual machines; Garbage collection;Process management;
KeywordsVirtual Machine Migration; Garbage Collection; GarbageFirst; Java Heap; OpenJDK; JVM; CRIU
Permission to make digital or hard copies of all or part of this work for personal orclassroom use is granted without fee provided that copies are not made or distributedfor profit or commercial advantage and that copies bear this notice and the full citationon the first page. Copyrights for components of this work owned by others than theauthor(s) must be honored. Abstracting with credit is permitted. To copy otherwise, orrepublish, to post on servers or to redistribute to lists, requires prior specific permissionand/or a fee. Request permissions from [email protected].
Middleware’16, December 12-16, 2016, Trento, Italyc© 2016 Copyright held by the owner/author(s). Publication rights licensed to ACM.
ISBN 978-1-4503-4300-8/16/12. . . $15.00
DOI: http://dx.doi.org/10.1145/2988336.2988341
1. INTRODUCTIONLive migration of a running Java application entails the
full transfer of its state to a remote location, where it is re-sumed, with minimal downtime. Live migration is useful fora number of situations, for example: replacing a crashed ser-vice [34] (fault tolerance), replicating an application for workdistribution [42] (load balancing), application fast start-up[26], co-locating services to reduce resource usage [9, 35](power saving), live service updates [19].
In this work we are interested in improving the live migra-tion of Java server applications which do not rely on otherlocal processes (running on the same node). For example,if two processes in the local node depend on each other,one cannot be migrated if the other isn’t; in this case, afull system virtual machine1 migration would be necessary(to migrate both processes at the same time). However, ifthe application to be migrated does not rely on other localprocesses to run, we can avoid a full system-VM migration(which migrates all the Operating System state and otherprocesses that might be running) and, instead, perform aJVM migration (single process migration), which is a fasterand less resource demanding alternative to migrate the ap-plication.
The efficiency of live migration can be measured in threemetrics: i) total migration time, i.e., the amount of timesince the migration starts until it finishes; ii) applicationthroughput, i.e, the difference between the normal appli-cation throughput and the throughput experienced includ-ing a migration (note that application downtime is not theonly factor affecting the application throughput, other fac-tors such as application throttling or some application slow-down after migration also affect the throughput); iii) otherresources overhead (e.g., network bandwidth, CPU). Wetarget these three metrics with out system called ALMA,i.e. we aim at achieving Java application live migrationwith: i) minimal total migration time, ii) minimal appli-cation throughput impact, iii) minimal resource overhead(mainly CPU and network bandwidth). Additionally, wealso want to avoid requiring programmer intervention/helpfor the migration, special hardware and modifications to theOperating System as all of these factors impose difficult ob-stacles to deploying and using the system.
To fulfill such requirements, the migration engine must beeffective and efficient in several ways. To ensure a low to-tal migration time and low resource overhead, the migration
1In this paper we differentiate a system-VM (e.g. Xen-basedor similar) from the Java Virtual Machine (JVM) using theterms system-VM and JVM.

engine must minimize the data to transmit; this, it avoidstransmitting data that is not necessary or that can be gen-erated at the destination node. To achieve low applicationoverhead (i.e., low throughput impact), the migration enginemust: i) efficiently identify the process working set, and ii)avoid forcing the application to slowdown before or after themigration.
Keeping an overall low performance overhead is particu-larly challenging because the network bandwidth, which istypically used to transfer the JVM state to a remote com-puter, is very slow compared to the memory bandwidthwithin a single system [29]. Allocation intensive applica-tions (i.e., applications with high memory demands) are evenharder to migrate since more memory pages are constantlybeing dirtied.
A common approach to this problem is to take an initialsnapshot of the underlying system-VM state while appli-cation is running (pre-copy [44, 7]). After the snapshot istransferred, the system-VM is suspended and an incrementalsnapshot is taken (containing only the differences since thelast snapshot). This second snapshot is transferred and thesystem-VM is resumed at the destination host. Previouswork try to improve this approach by using several tech-niques such as: application throttling [7] and use of high-speed networks [22], compress system-VM state [23], usingapplication assistance or looking into the application stateto reduce the amount of state to transfer [21, 19]. However,these solutions require special hardware, or impose high ap-plication overhead, or fail to completely determine the exactstate of the application state (i.e., determine which memorypages are actually required to transfer) ending up transfer-ring more data than needed, leading to longer migrationdowntimes.
Using GC to reduce the amount of data to transfer hasbeen proposed in previous works ([21, 26]). However, theynot take full advantage of the GC information available whenperforming the migration and therefore, force a heap col-lection even if not necessary; this adds more downtime tothe application without significantly reducing the size of thesnapshot.
In this work we investigate how much improvement canbe attained by taking advantage of knowledge about thereachability of heap objects. This technique is not exclusiveas other techniques can be combined to boost performance(for example snapshot compression).
In ALMA we are focused on migrating applications run-ning on top of JVMs. We assume that a system-VM is al-ready available at the destination node, ready to receive theJVM. By migrating only the JVM, we avoid all the Operat-ing System state and other processes that might be running;this contributes to a small total migration time and low re-source usage (since all snapshots only contain informationabout the JVM and application).
To minimize the size of each snapshot (that will be mi-grated), we force a migration-aware garbage collection be-fore taking the snapshot of the process state. In ALMA weuse the Garbage First (G1) GC, a region-based GC targetedto be used with large heaps while maintaining low pausetimes.2
We augment G1 by introducing a new GC policy to se-
2Garbage First Garbage Collector is a region-based GC. It isthe most recent GC implementation and it will be the nextdefault collector in OpenJDK’s HotSpot JVM.
lect which regions to collect when collecting the heap. Thegoal of the new policy is to select for collection only thoseregions whose amount of dead bytes divided by the GC time(for the particular region only) is lower than the availablenetwork bandwidth (see Section 3 for more details). Thismigration-aware GC policy introduces no application over-head since it uses only internal information already beinggathered by the G1 collector (see Section 2 for details). Byforcing a migration-aware GC before creating each applica-tion snapshot, we minimize the amount of dead data in thesnapshot, thus substantially minimizing its size.
To implement ALMA we extended CRIU3 (a checkpointand restore tool for Linux processes that runs in userspace)with a Migration Controller; this controller interacts withthe JVM and forwards its snapshots to the destinationsystem-VM. The migration-aware GC policy is implementedinside the G1 GC in the Open Java Development Kit 8(OpenJDK 8).4 All the ALMA code is publicly availablethis allowing others to reuse the ALMA and perform exper-iments with it.5
We evaluate ALMA by using well-known benchmarksuites based on real world Java applications (SPECjvm-2008 [39] and DaCapo [3]), and by comparing it to: i) anapplication-assisted approach called JAVMM [21] (a simi-lar system we could find on the literature), ii) CRIU (writessnapshots to disk and then migrates them by means of NFS),and iii) ALMA-PS (our solution configured to work similarlyto JAVMM [21], more details in Section 5). The evalua-tion results show that ALMA is able to deliver low totalmigration time, low resource overhead, and low applicationthroughput impact. Compared to the results obtained inJAVMM [21] and CRIU, ALMA reduces the total migrationtime by 5.69 and 2.57 times, the used network bandwidth by4.42 and 2.86 times, and the application downtime by 1.125and 3.58 times, respectively.
In short, this work presents several contributions. First,it provides fast live migration for Java server applicationsthat do not require full system-VM migration. For theseapplications, migrating only the JVM is sufficient. Second,it describes a G1 GC migration-aware policy implementedon OpenJDK 8. This policy uses internal information abouteach heap region to determine the best set of regions to col-lect based on the available network bandwidth; Third, itproposes JVM heap collection before each snapshot. To thebest of our knowledge, this is the first system to employa collection at each snapshot. This ensures that no snap-shot contains more data than necessary (according to ourmigration-aware policy). Fourth, it provides a JVM live-migration tool that runs in user space implemented on topof CRIU which increases, in multiple ways, the performanceof live JVM migration, compared to previous approaches.And finally, it presents a detailed performance evaluationcomparing our solution to Hou [21], and CRIU.
The remaining of this document is organized as follows.Section 2 gives some background on the OpenJDK’s heap,the G1 GC approach, and CRIU (a checkpoint and restoretool for Linux processes). Section 3 presents the design of
3CRIU is an open-source project available at criu.org4The Open Java Development Kit is available at open-jdk.java.net5The code is available at: https://github.com/rodrigo-bruno/ALMA-JMigration. Part of the developed code isbeing integrated in the main CRIU repository.

Figure 1: Parallel Scavenge GC Heap
ALMA followed by some implementation details on Section4. In Section 5, we evaluate ALMA and analyze the resultsobtained. We conclude with an analysis of the current state-of-art (Section 6), and some conclusions (Section 7).
2. BACKGROUNDThis section presents several basic concepts regarding the
Java heap and the corresponding GCs; this is relevant forthe next sections describing ALMA. Additionally, we alsodiscuss CRIU, a Linux process checkpoint and restore toolsince it is the basis for the implementation of the MigrationController (presented in Section 4.2).
The Java heap is a continuous segment of memory whereall application objects are allocated. In order to remove dead(unreachable) objects and free space for new ones, a GC isused. Different garbage collectors take different approachesto collect death objects and, most of the times, differentcollectors also organize the heap differently [24].
We target two important GC algorithms (currently avail-able in the OpenJDK): i) Parallel Scavenge (PS), a simplegenerational GC which has two distinct memory spaces (gen-erations), and ii) G1, a more recent generational GC whichdivides the heap in equally sized regions that can belong toany generation. Although ALMA is designed using G1 GC,we discuss both collectors (G1 and PS) to understand theirkey characteristics as they are both extensively discussed inin the Evaluation Section.
2.1 Parallel ScavengeThe idea behind generational GC algorithms [31] (based
on the intuition that young objects die young) is not new.Therefore, through time, many generational algorithms havebeen developed ([13, 1, 38, 46, 14, 2] just to name a few).Although most of them share the basic principle of splittingthe heap in young and old generations, the way to collecteach generation differs a lot. We consider the OpenJDK8’s Parallel Scavenge collector because: i) it is the currentdefault collector (and therefore it is probably one of the mostused GC implementations), and ii) it was used in previouswork [21].
This specific collector (PS for short) uses two differentalgorithms [17]: a copy collector [6] for the young generation,and a mark-and-sweep collector [33] for the old generation(see the PS heap layout in Figure 1).6 Both generationsare collected using multiple threads but are not concurrentwith the mutator, i.e., both require stopping the application(forcing stop-the-world pauses).
6In generational GCs (and therefore in PS and G1, the heapis divided in two generations: young and old. The younggeneration is where all recently allocated objects live. Asobjects survive collections, older objects are promoted intothe old generation.
Figure 2: Garbage First GC Heap(each square represents a region)
The young generation is divided into three areas (see Fig-ure 1): Eden, From, and To spaces. The Eden is where allnew objects are allocated. Once it is full, a minor collectiontakes place: when such collection starts, all live data insidethe Eden space is copied to From space and all live datainside To space is copied to the old generation. Full GCs(i.e., all the heap is collected) are triggered when the heapis almost full and typically entail an extra heap compactionstep.
This collector aims at achieving high throughput. How-ever, this comes at the cost of forcing the mutator to stopwhile the garbage collector is performing a minor or a fullcollection. Increasing the size of the young generation willresult in less frequent GCs but will increase the per-GCpause as the pause time is proportional to the number oflive objects (that need to be copied away from Eden space).
2.2 Garbage FirstGarbage First GC [12] is generational [31] and has a spe-
cific heap organization (see Figure 2). A G1 heap is dividedinto equally sized regions (the default region size for theOpenJDK 8 is 1024 Kilobytes) which can be in one of thefollowing states: Eden (newly allocated objects), Survivor(objects moved from Eden in the latest collection), Old (ob-jects that survived at least two collections), and Humongous(large objects). In order to maintain enough free space fornew regions (necessary to allocate new objects when currentyoung regions are full), periodic GCs are performed.
Similarly to other generational GCs, the G1 provides twotypes of collections: i) young collections, in which onlyyoung (eden and survivor) regions are selected to be col-lected, and ii) mixed collection, in which both young andold (including humongous) regions can be selected for col-lection. Both types of collections are triggered by differentconditions (which are not relevant for now). The importantidea is that all the live data in the set of regions selected forcollection is copied to one or more regions. This results inmore compacted heap regions.
Since G1 is thought for collecting large heaps while main-taining a low GC pause time, it must control how manyregions will be collected at each collection. To do so, itrelies on data gathered by the concurrent marking threads,which traverse the heap and, for each region, produce statis-tic information relevant for a possible collection of that re-gion (e.g., predicted time to collect, number of reclaimableobjects, etc). With this information, more particularly thetime it will take to collect a particular region, the GC willselect a set of regions, named Collection Set, to collect whilekeeping the GC pause lower than an user defined threshold.This particular metric (time to collect a region) is estimatedbased on several factors: number of live objects in the region,

number of cached reference updates (dirty cards), previouscollections, etc.
In ALMA, we take advantage of the information gatheredby the concurrent marking threads to select an optimizedCollection Set, according to the available network bandwidth(see Section 3.2). Since we are harnessing information thatis already there (for GC purposes) we incur in no extra ap-plication overhead.
Note that this information (time necessary to collect eachregion, reclaimable space per region) does not exist in PSbecause it uses a heap with two long generations (as illus-trated in Figure 1) as opposed to G1 which uses a heap withmultiple regions (see Figure 2).
Regardless of the information provided by the collector,another key important reason for using G1 in ALMA is thatG1 is being prepared to be the default GC for the nextversions of the OpenJDK.
2.3 CRIUCRIU [25] is a checkpoint and restore tool for Linux. Us-
ing CRIU, it is possible to freeze a process and checkpoint itto local disk as a collection of files. One can, later, use thiscollection of files (snapshot) to restore the application in thepoint it was frozen. CRIU is implemented in user space andnot in the Linux kernel.
CRIU supports snapshoting processes and subprocesses,memory-mapped files, shared memory, open files, pipes, FI-FOs, unix domain sockets, network sockets, signals, andmore are still being implemented (the system is still un-der development). Currently, it is mostly used to supportcontainer [16] live migration.
This tool is used by ALMA as basis for the implementa-tion of the Migration Controller (described in Section 3.1).To enable Java application live migrations, ALMA extendsCRIU to allow snapshot data to be transferred to the desti-nation site (instead of being saved to local disk). By default,CRIU supports remote migration by using an NFS share tosend the snapshot files. More details on how ALMA extendsCRIU are presented in Section 4.2.
3. JVM LIVE MIGRATIONIn this section we start by giving a small introduction
to the migration workflow and how ALMA minimizes theamount of data to transmit during the migration. Then, wedescribe ALMA’s architecture, how it selects regions to col-lect before a migration, the migration worklow, and finally,a set of optimizations.
The JVM live migration uses the following workflow (thisworkflow is described in further detail in Section 3.3): i) thesource site takes a snapshot of the JVM, and sends it to thedestination site; ii) upon reception at the destination site,the source site stops the application and takes an incremen-tal snapshot of the JVM and sends it to the destination site.Although the algorithm described in Section 3.3 works withany number of incremental snapshots, ALMAis implementedto use only one incremental snapshot (after the initial snap-shot). This is discussed in greater detail in Section 3.3.
To reduce the amount of data to transfer when performinga JVM live migration while keeping a low overhead on theapplication throughput, ALMA analyzes the heap to dis-cover heap regions with a GC Rate (amount of data thatcan be collected in some amount of time) that is superiorto the network bandwidth; such regions will be collected to
Figure 3: ALMA architecture.
reduce their size.
3.1 ArchitectureALMA is composed by two components, each one used
on both source and destination nodes/sites (see Figure 3):Migration Controller, and JVMTI agent (described below).Both destination and source sites are represented usingdashed lines. Each process is represented with a gray back-ground. JVMTI agents are represented by dotted lines.
The Migration Controller is responsible for: i) communi-cating with the local JVM at the source site to inform that amigration is being prepared (this will trigger the heap anal-ysis and collection of the chosen regions); ii) looking into thelocal JVM process to save all the necessary information (inthe source site) for the process to resume at the destinationsite (this includes page mappings, open files, threads, etc);note that apart from the first snapshot, only the differen-tials are transferred between the source and the destinationsites; iii) transfer all the gathered process state data to thedestination site; iv) bootstraping the process at the destina-tion site, using the collected information by the MigrationController at the source site. More details on how the Mi-gration Controller is implemented (including a description ofboth Image Proxy, Image Cache, and CRIU) can be foundin Section 4.2.
The JVM was modified to contain a migration aware G1GC policy. This policy is used, when a migration starts, todetermine the set of regions to consider for collection (moredetails in the next section). Note that we do not change orrequire any application-specific code. Only the JVM code ismodified.7
To facilitate the communication between the MigrationController and the JVM, we use a JVMTI agent, a simplepluggable component that accesses the internal JVM state8.This agent is responsible for: i) receiving requests from theMigration Controller to prepare the heap for a snapshot,(e.g., request to start a migration-aware GC), and ii) enu-merating heap ranges of unused memory (that will be usedto reduce the size of the snapshot, as described in Section3.3).
7As discussed in Section 4.1, the changes to the JVM codeare very small and therefore, are easily ported to other JVMsusing a patch, for example.8The JVMTI documentation is accessible atdocs.oracle.com/javase/8/docs/technotes/guides/jvmti/

3.2 Heap Region AnalysisIn order to reduce the amount of data to transfer,
ALMA looks into the JVM heap for memory locations whichare no longer reachable, i.e., garbage (thus containing onlydead objects). To identify dead objects, one must scan/tracethe entire heap and mark live objects, leaving dead objectsunmarked (please note that we are focused in tracing collec-tion [33] rather than reference counting [8] collection). Thisis a difficult task and many tracing GC implementationsstrive to reduce its negative effect on the performance of theapplication. Hence, we do not want to impose an extra over-head by using our own marking mechanism. Therefore, werely on the marking operations performed by the G1 GC toanalyze the heap, i.e., we neither modify the G1 GC mark-ing operations to collect more data nor introduce new GCdata structures.
As already said, the G1 GC (discussed in Section 2.2),periodically marks the heap and produces several metricsper heap region (resulting from the marking heap traversal)that allows ALMA to draw relevant conclusions leading to aminimal snapshot size. Two of the most important metricsare the following: i) an estimate of the amount of spacethe GC would be able to reclaim if a particular region iscollected, and ii) an estimate of the time needed to collect aparticular region.
With these estimates, ALMA decides, for each heap re-gion, either to collect it, i.e., moving all live data to anotherregion, or to avoid collecting it and thus not paying the timeto do so. The set of regions selected for collection is calledCollection Set (CS for short).
Thus, the total amount of heap data to transfer (i.e., to beincluded in the snapshot) is defined as the sum of the usedspace (i.e., allocated space, which might include reachableand unreachable data) of each region minus the reclaimablespace (i.e., dead objects) in the regions in CS (see Eq. 1).
Data =∑Heap
used(r)−∑CS
dead(r) (1)
Collecting a set of regions has a cost (time), which is de-fined in Eq. 2 as the sum of the cost of collecting each regionin CS.
GCCost =∑CS
cost(r) (2)
We can now define the migration cost (in time) for mi-grating all heap regions (after each region r in CS has beencollected) as the amount of data to transfer divided by thenetwork bandwidth (which will be used to transfer the JVM)plus the cost of collecting the CS (see Eq. 3).
MigrationCost =Data
NetBandwidth+ GCCost (3)
Taking into account that we want to minimize the migra-tion cost by properly selecting regions for the CS, we mustminimize Eq. 3. In other words, we need to maximize theamount of reclaimable space and minimize the cost of col-lecting it. Hence, we define the ratio GCRate (see Eq. 4)as the amount of data reclaimed per amount of time for aregion r.
GCRate(r) =dead(r)
cost(r)(4)
Figure 4: ALMA’s Migration Controller Workflow
With GCRate defined, we can estimate, for each region inthe JVM heap, the GCRate and make sure that each regionwhich has a GCRate superior to the network bandwidth isadded to the CS. In other words, ALMA selects the regionsthat can have their size reduced and, as a result, transmittedfaster than if that same region with its original size is trans-mitted. Thus, the CS is constructed as defined in Eq. 5:all regions whose GCRate is greater than the NetBandwidthare selected for collection.
CS = {∀r : GCRate(r) > NetBandwidth} (5)
3.3 Migration WorkflowHaving explained how the heap is analyzed and prepared
for migration, we now describe the live migration workflow;it starts when the migration request is issued, and finisheswhen the JVM is resumed at the destination site.
The flowchart in Figure 4 represents this process. To start,we launch two instances of the Migration Controller (StartMigration), one at each site. The controller spawned at thesource site is then responsible for asking the JVM to pre-pare for a migration (Prepare JVM Snapshot). This requesttriggers a heap analysis, which results in the construction ofthe CS, which is then collected (Build and Collect CS).The request is then answered with a list of virtual memoryranges that contain no live data (Send Free Mappings to
Migration Controller). Note that these virtual memoryranges can be as large as a full heap region, but can also besmaller. This ensures that only live data is transmitted andall other memory is skipped.
Also note that we guarantee that the virtual memoryranges marked as containing only dead objects are consistentwith the real application state. ALMA does this by analyz-ing the heap memory and taking the process snapshot whilethe JVM is still inside the last stop-the-world pause aftercollecting the CS.
The next step (still at the source site) is to snapshot theJVM (Snapshot JVM (ignoring free mappings)). In this

step, the Migration Controller looks into the process stateand takes a snapshot of its memory, which is then forwardedto the destination site Migration Controller (Send Snapshot
to Destination Site). This snapshot is incremental w.r.t.the previous one (except if this is the first snapshot).
Subsequent snapshots take the same approach until uponthe last snapshot; then, the Migration Controller at thesource site notifies the controller at the destination site toresume the JVM with all the state already forwarded (TellDestination Controller to Resume JVM on the source siteand Wait for JVM Snapshot from Source Controller atthe destination site). At the destination site, the MigrationController simply receives application snapshots (ReceiveJVM Snapshot), which are kept in memory, and waits forthe resume JVM request (Resume JVM). Upon reception, itrebuilds the JVM and the process resumes.
This algorithm works with any number of snapshots.However, ALMA is configured by default to perform onlytwo snapshots: one initial snapshot when the migrationstarts, and a second one (incremental with regards to thefirst one) when the initial snapshot arrives at the destina-tion site. We found that having more than two snapshotsdoes not reduce the application downtime (at least for theapplications used in Section 5). Limiting ALMA to onlytwo snapshots decreases the network bandwidth usage, andthe total migration time. In addition, it turns migrationmore predictable, i.e., the Migration Controller does nottake an arbitrary number of snapshots that will result inunpredictable total migration time and network bandwidthusage.
3.4 OptimizationsIn order to improve the efficiency of the migration engine,
ALMA employs several techniques to minimize the snapshotsize and reduce the application overhead. For the rest ofthis section, we explore these optimizations: i) avoiding un-necessary collections when GCs triggered by the applicationare frequent; ii) avoid collecting regions included in previ-ous snapshots to avoid increasing the size of the differentialsnapshot.
3.4.1 Avoid Unnecessary CollectionsDepending on the mutator memory consumption rate,
more or less GCs will be triggered. Applications that allo-cate memory very fast will most likely end up being collectedmuch more often than applications that allocate much lessmemory.
We can take advantage of this fact in two ways. First,applications that allocate lots of memory will trigger GCsvery often and ALMA can take advantage of these GCs tostart a migration. In other words, instead of forcing a GC,ALMA can simply wait for the next application-triggeredGC to start the snapshot cycle or start a forced GC after anused defined migration-timeout. Second, applications thatallocate less memory will take longer to trigger a GC andwill probably hit the migration-timeout most of the time.However, this is not a problem since these applications takelonger to dirty memory and the migration engine can easilycatch up with the memory changes.
3.4.2 Avoid GCs between SnapshotsSince G1 behaves just like a per-region copy collector (i.e.,
it copies the live content of one region to another upon col-
lection), memory might get dirtied by the collector. This isparticularly bad if the collector ends up copying live dataaround the heap because it breaks the benefits of using in-cremental snapshots.
To deal with this issue, ALMA prevents regions that hadlive data in the previous snapshot to be collected. By doingthis, we prevent memory that was not filtered as garbagein the previous snapshot from being copied by the GC (thiswould create unnecessary incremental modifications betweenthe previous and the next snapshot). Obviously, if the heapgets nearly full, we let the GC collect any regions. However,at this point, it probably means that most of the heap isdirtied anyway.
4. IMPLEMENTATIONIn this section we describe some implementation details
regarding our solution. First, we present how our migrationaware GC is implemented using G1, and then we discuss theinternal architecture of the Migration Controller: its internalcomponents and their purpose.
4.1 Migration Aware GCALMA is implemented in the OpenJDK HotSpot JVM
8 by modifying its G1 collector. ALMA adds a migrationaware policy which takes advantage of the already existingG1 data structures to perform the heap analysis. The mod-ifications done into the JVM are small, about 50 lines ofcode changed/inserted. This means that it is easy to portthis modifications to other JVMs, if needed.
The G1 GC uses, internally, data regarding each heapregion (e.g., number of free bytes, used bytes, references fromobject outside the region to objects inside the region, etc).Such data is gathered by the concurrent marking threads,which scan the heap, marking all live objects. Based onthese information, the G1 GC is able to tell how many livebytes reside inside a particular region. As time goes by andregions get collected, the G1 GC is also able to estimate thetime it will take to collect a particular region. This estimateis based on several factors: e.g., previous collections, numberof inter-region references to update, number of live objects.
Once a migration is about to start, we take advantage ofthis information maintained by G1 to compute the optimalset of memory pages to include in the snapshot. This heapanalysis is ruled by the equations described in Section 3.2. Inother words, only regions in which garbage can be collectedfaster than transmitted through the network are collected.
4.2 Migration ControllerThe Migration Controller component used in ALMA is im-
plemented using CRIU. We modified CRIU to: i) supportlive migration through the network (original CRIU writesthe process state to disk and uses NFS to provide remotemigration), and ii) filter free mappings (reported by theJVMTI Agent) from the snapshot. CRIU runs in userspaceand therefore, there is no need neither to modify the kernelnor to load any extra modules. Note that CRIU alreadyhandles the migration of process’s resources such as openfiles, subprocesses, locks, etc.
The original CRIU (i.e., without our modifications) writeslocally a process snapshot to disk which can then be mi-grated using a NFS share. In addition, the original CRIUdoes not provide live migration, the user being responsiblefor requesting the restoration of the process at the destina-

tion site. We have also modified CRIU to wait and react tonew process snapshots, and to restore a process as soon thelast snapshot is transferred to the destination site.
ALMA’ Migration Controller extends CRIU by addingtwo new components: the Image Proxy (runs at the sourcesite), a component that forwards process snapshots to thedestination site, and the Image Cache (runs at the des-tination site), a component that caches process snapshotsin memory until ALMA restores the process. Both ImageCache and Image proxy are auxiliary components that actas an in-memory snapshot caches. The benefits from usingsuch components is twofold. First, both components keepsnapshots in memory, which is much faster than writing andreading from disk (even for SSDs). Second, since the Im-age Proxy proactively forwards the snapshot to the ImageCache, we can start restoring the process while CRIU is stillfinishing the creation the snapshot and while the snapshotis still being transferred; in other words, process restorationis concurrent with the last snapshot creation.
5. EVALUATIONThis section describes the evaluation of ALMA. We use
two benchmark suites, SPECjvm2008 [39] and DaCapo 9.12[3], and evaluate ALMA against:
- CRIU (a checkpoint and restore tool for Linux pro-cesses); this solution uses NFS to transfer snapshots fromthe source site to the destination site; thus, it does not takeinto consideration unused or unreachable memory and there-fore, snapshots all memory allocated to a particular process;
- JAVMM [21], a recent system with the same goal:migrate Java applications. We compare this system toALMA because they share the same goal (migrate Java ap-plications) and also try to use garbage collection for reducingthe size of snapshots. However, authors decided to imple-ment JAVMM through system-VM migration, as opposed tothe other evaluated systems (CRIU, ALMA-PS, and ALMA)that only migrate a specific process (enclosing a JVM); thisnaturally results in more network bandwidth usage and in-creased total migration time given that the initial snapshotcontains the state of all processes running on the system aswell as the Linux kernel itself; for this solution, we presentthe results that we extracted from Hou [21].9 This meansthat we only present results regarding the downtime, net-work utilization, and total migration time for the scimark,derby and crypto benchmark applications. For the otherbenchmark applications and other experiments, we do notshow any results since we could not perform experimentswith JAVMM;
- ALMA-PS which is the ALMA solution using theGC and tuning proposed in JAVMM [21]; in other words,ALMA-PS uses the Parallel Scavenge GC with 1GB foryoung generation and 1GB for old generation, and forces oneminor (young) collection upon snapshot creation (settingsdescribed in Hou [21]). We use this system to: i) isolate theperformance benefits of using JVM migration versus system-VM migration (comparing it to JAVMM) and, ii) measurethe performance benefits of using ALMA’s migration-awareGC policy versus using the regular not migration-aware GCpolicy. Note that by using 1GB for the young generation,
9The paper authors did not provide their solution for le-gal reasons. Having access to the source code would haveenabled us to obtain more results.
ALMA-PS ensures that all benchmarks applications’ work-ing set fits in the young generation. This represents the bestscenario for this collector. Using less memory for the younggeneration would lead to some benchmark applications hav-ing data in the old generation, which would increase thesize of the snapshots (as this generation is not collected byALMA-PS).
Note that in ALMA we do not impose any configurationparameter on G1, letting the GC automatically adapt tothe memory usage. This obviously leads to some data beingpromoted into the old generation. However, for ALMA thisis not a problem since any region can be collected beforecreating a snapshot (see Section 3.2 for details).
All these three solutions were executed on a local Open-Stack10 installation, where we spawn system-VMs and per-form the JVM migration between them (note that we couldnot conduct these experiments using JAVMM since we donot have access to it). The physical machines that host thesystem-VMs are Intel Xeon @ 2.13GHz with 40GB of RAM.Each of these physical machines (and thus the system-VMs)are connected using a 1Gbps network. We always spawnsystem-VMs in different physical nodes and we make surethat these physical nodes are being used only for our ex-periments. Each system-VM has 4 virtual CPUs and 2GBsof RAM except when we run experiments with ALMA-PS,which needs 4GBs of RAM to run (more details in Section5.2).
With this environment setup, we approximate as much aspossible the environment used for evaluating JAVMM (forwhich we present the results available in the paper [21]) andthe environment used for evaluating ALMA. The amountof RAM and network bandwidth are the same for bothJAVMM and ALMA; the virtual CPUs used in for evaluat-ing JAVMM are slightly faster (AMD Opteron @ 2.2 GHz)than those used for evaluating ALMA (Intel Xeon @ 2.13GHz). This gives a little advantage to JAVMM since themigration engine run faster when a migration needs to beperformed.
In this section we start by characterizing the applicationsincluded in both benchmarks w.r.t. memory utilization, andthen present the evaluation results regarding: i) applicationdowntime - amount of time that the application is stoppedduring migration; ii) network bandwidth usage - amountof data transferred through the network for migrating theapplication; iii) total migration time - time between the mi-gration starts and the application resumes at the destina-tion site; iv) application throughput - throughput differencebetween normal execution and execution including a migra-tion; v) migration-aware GC performance overhead - theoverhead imposed by our migration-aware GC versus theoriginal G1; vi) ALMA performance with more resources- performance results (application downtime) when morecores and/or more network bandwidth are used.
5.1 Benchmark DescriptionTable 1 shows a summary of the memory characterization
for the benchmarks used in our experiments. Other applica-tions belonging to either SPEC or DaCapo benchmark arenot presented because: i) some do not run in our JVM (asthey fail to compile, for example the compiler benchmark ap-plication fro SPEC) or could not be migrated using CRIU
10OpenStack is a cloud computing software platform. It isaccessible at openstack.org.

Figure 5: Application Downtime (seconds) for SPEC (left) and DaCapo (right) benchmarks
Benchmark AR GR % Gbg % Yng HUscimark 11.85 6.28 53.22 .21 481.40derby 815.53 301.75 37.41 37.41 449.10crypto 258.46 250.53 96.93 .57 349compress 31.25 0.94 2.88 3.60 55.60xml 740.94 614.98 82.72 82.38 149.30serial 585.86 181.62 30.92 30.87 187.90mpegaudio 86.07 66.27 76.75 86.42 24.30avrora 1.94 1.44 74.38 75.22 22.60h2 405.14 121.54 29.62 34.75 423.00fop 223.66 140.20 60.23 63.33 176.00pmd 130.63 84.91 64.57 68.45 232.30snuflow 457.03 389.33 82.63 82.18 142.20eclipse 9.05 4.80 53.40 57.67 107.50tomcat 61.05 53.11 87.49 88.35 127.90jython 794.59 659.51 82.54 82.54 178.10
Table 1: Benchmark Analysis for SPEC and DaCapo
(for example the tradebeans and tradesoap benchmark ap-plications from DaCapo); ii) the others provide similar per-formance results and this leads to no new conclusions (inother words, the applications that we present are represen-tative regarding the concerns of this evaluation).
The top rows (Table 1) refer to SPEC benchmark appli-cations while the bottom rows refer to DaCapo benchmarkapplications. For each application we present: i) allocationrate (AR), the amount of data allocated by the applicationper unit of time (MB/s); ii) garbage creation rate (GR),i.e. the amount of dead data allocated per unit of time(MB/s); iii) percentage of allocated heap space which is un-reachable (% Gbg) upon a minor collection; iv) percentageof used heap space which belongs to the young generation 11
(% Yng) upon a minor collection; v) heap usage (HU), i.e.amount of application data in the heap (this includes bothlive and dead objects) upon a minor collection.
Each one of these metrics is obtained by looking into G1GC logs (we did not modify the logging infrastructure forthe JVM) produced by running each benchmark application.We analyze the last GCs runs before migration starts. Thisensures that these metrics represent the state of the JVMwhen the migration is performed. For example, to obtainthe allocation rate (AR), we consider the last two consecu-tive allocation failure triggered 12 GCs before the migration
11The young generation comprehends all heap regions whichcontain recently allocated objects. Objects that survive atleast two garbage collections are promoted (to the old gen-eration) and no longer belong to the young generation.
12An allocation failure happens when no more free memory
starts. We take the heap usage after one GC and the heapusage right before the next one and divide it by the timeelapsed between the two GCs. All values are averages of atleast 5 runs (we enforce additional runs when outliers aredetected).13 This is also true for all values presented duringthe evaluation section. We found that these metrics are sta-ble at least during the migration process. This means that:i) the size of the application working set (i.e., the amount oflive data left after the GC runs) is stable, and ii) GCs runperiodically when the percentage of free space approacheszero, setting the heap usage back to the working set size.
Note that all metrics in Table 1 are obtained using theG1 GC. Other GCs might produce slightly different resultsbecause of the different heap partitioning and different col-lection techniques. Nevertheless, for all generational collec-tors (i.e., collectors belonging to the same family of G1), theconclusions taken from Table 1 also apply.
5.2 Application DowntimeIn this section, we present the results obtained when mea-
suring the application downtime: time span between the mo-ment the JVM is stopped at the source site and the JVMstarts at the destination site. In other words, the time in-terval during which the application does not run (neither onthe source site nor on the destination site).
These results were obtained for all systems using a totalof 15 applications (presented in Table 1). For each experi-ment we start the application at the source site, let it runfor 1 minute and then migrate the enclosing process (JVMincluded) to the destination site. We found that 1 minuteis enough for all applications to warm-up and to reach theirmaximal resource consumption (mainly CPU and memory).All applications run at least five times; we show both the av-erage and the standard deviation for these runs. More runsare performed when outliers are detected. This procedure isalso used in the next sections.
Figure 5 shows the results for the application downtime.For each benchmark application, results are grouped, hav-ing one bar for system (from left to right): JAVMM, CRIU,ALMA-PS, and ALMA. This organization of columns is alsoused in subsequent figures. We note that CRIU is the mi-gration solution with worse downtime. This is because itsnapshots all the process memory, not taking into accountunused or unreachable memory, and also because it usesNFS to transfer all snapshots. Regarding ALMA-PS, themeasured downtime is much better than CRIU’s (except
exists to satisfy an allocation request. This event triggers agarbage collection.
13We execute each experiment 5 times given that the resultsobtained remain stable even with more runs.

Figure 6: Network Bandwidth Usage (MBs) for SPEC (left) and DaCapo (right) benchmarks
mpegaudio) but still worse than ALMA. The reasons arethe following. First, ALMA-PS initializes the young genera-tion with the size of 1GB. This forces the process of taking asnapshot and restoring it to handle 1GB of memory. If thisyoung generation size pre-condition was not imposed, tak-ing and restoring a snapshot would handle potentially muchless memory (the actual amount of memory used by the ap-plication). The mpegaudio application is a clear example:it uses around 24MB of memory (Table 1). Therefore, theoverhead of handling 1GB instead of 24MB (approximately)makes ALMA-PS perform worse than ALMA and CRIU. InALMA, we do not impose such young generation size pre-condition and therefore, this overhead does not exist, i.e, weonly process the amount of memory that the application ac-tually uses. Second, old generation garbage is not collectedby ALMA-PS, which only forces a minor (young) collection.This way, all garbage that resides in the old generation willbe transferred to the destination site. This is specially no-ticeable in h2 (DaCapo) and scimark (SPEC), for example.
Regarding ALMA and JAVMM (still see SPEC resultsfrom Figure 5), ALMA achieves better results in 2 out of 3applications. Considering that the environment in whichboth systems are evaluated (JAVMM uses slightly fasterCPUs), we expect ALMA to perform even better versusJAVMM if running in the same exact environment.
Another important difference between ALMA andJAVMM is that ALMA runs in the same system-VM asthe application while JAVMM runs directly on the physicalmachine (that hosts the system-VM containing the appli-cation). This means that ALMA might take a little longerto take a snapshot compared to JAVMM if the system-VMCPU is exhausted by the application. Therefore, our envi-ronment represents a worst case scenario for ALMA sincethe CPU is exhausted by the applications.
Taking into account these application downtime resultsand the benchmarks applications characterization shown inTable 1, it is possible to draw some general conclusions. Highallocation ratio does not imply a high application downtime.For example, the jython application has one of the highestallocation ratio but the corresponding application downtimeis not among the highest ones. The highest downtime (andtherefore the most costly applications to migrate) are theones with high allocation ratio and low garbage creationratio; in other words, applications with higher long-livedobjects creation ratio lead to higher application downtime.Examples of such applications are h2, scimark, and derby.Even for these worse cases, the downtime with ALMA is lessthan CRIU, ALMA-PS. ALMA and JAVMM achieve similardowntime results for scimark and derby.
5.3 Network Bandwidth UsageIn this section we present the evaluation results of
ALMA regarding the network bandwidth usage, i.e., theamount of data transferred through the network to migratean application (see Figure 6). JAVMM clearly yields theworse results, even worse than CRIU. This is due to thefact that JAVMM migrates a whole system-VM. Note that,since the goal is to migrate an application from one ma-chine to another, ALMA only migrates the application pro-cess (including the JVM) while JAVMM migrates the wholesystem-VM.
CRIU follows JAVMM as it does not remove unreachabledata from the snapshots; thus, it transfers more data thanALMA and ALMA-PS. Comparing ALMA and ALMA-PS,ALMA is superior in 10 out of 15 applications. The onlybenchmark applications where PS achieves better resultsare the following: derby, avrora, fop, pmd, and sunflow.The common particular feature of these applications comesis that most garbage (collected before taking the snapshot)originates from the young generation. The better results ofALMA-PS are due to the fact that its Parallel Scavenge col-lector is more efficient collecting the young generation thanG1 (which is used by ALMA). This comes from the fact thatin G1, although objects are all in the young generation, theyoccupy several regions which imply handling inter-region ref-erences (stored in card tables) and, consequently, need moreGC effort to collect all young garbage; such inter-region ref-erences do not exist in the GC of ALMA-PS as all youngobjects are in the same region (young generation).
In general, applications that use more memory tend toconsume more memory bandwidth during migration. FromTable 1 and Figure 6, we may conclude that applicationswith more heap usage and less garbage percentage (e.g. sci-mark, derby, h2) result in increased network bandwidth us-age.
5.4 Application ThroughputFigure 7 shows the normalized results for the throughput
of CRIU, ALMA-PS, and ALMA. These results are obtainedby sampling the benchmark throughput (number of opera-tions) each five seconds. The measured number of operationsis specific to each benchmark, i.e., one cannot compare thenumber of operations of two different benchmarks. The onlypossible comparison (which we do) is the number of opera-tions between multiple runs of the same benchmark.
The average throughput in normal execution of the bench-marks represents the value one in Figure 7. The normal-ized throughput for each system, represents the throughputachieved when the migration occurred.
The throughput results have a strong correlation with the

Figure 7: Application Throughput (normalized) for SPEC (left) and DaCapo (right) benchmarks
application downtime (see Section 5.2). In other words,there is no relevant slowdown in the application through-put after starting at the destination site (i.e., the applica-tion is already running at a normal throughput and doesnot need to warm-up). Therefore, most conclusions derivedfrom analyzing application downtime are still applicable toapplication throughput.
In short, CRIU is clearly the solution with lower through-put for almost all benchmarks, followed by ALMA-PS.ALMA is the solution with highest throughput, which isabove 80 % of the normal throughput for almost all bench-marks. The benchmark with lower throughput is scimark,which is a CPU and memory bound benchmark, reason whythe migration of this specific benchmark produces a severethroughput slowdown for all systems. Compared to ALMA-PS, ALMA achieves higher throughput in 14 out of 15 bech-mark applications.
5.5 Total Migration TimeThis section presents the results for total migration time,
i.e., the time between a process migration is requested andthe process resuming at the destination site.
Once again (see Figure 8), JAVMM performs worse thanall others. This results from the fact that JAVMM migratesa whole system-VM while the other solutions migrate onlya process (the JVM). Regarding CRIU, the results are pro-portional to those presented in Figure 6 (bandwidth usage)since the total migration time mostly comes from transfer-ring snapshot data.
ALMA performs better than any other solution. ALMA-PS, which shows better results for network bandwidth usage(Figure 6) in some cases, has the drawback of forcing a 1GByoung generation space; this increases the cost of each snap-shot and restoration of the process. Reducing the size of theyoung generation wouldn’t help either because it would leadto more young collections and push more objects into theold generation, which is not collected by ALMA-PS beforea migration. As with application downtime, the mpegau-dio application provides a clear example of this overhead:ALMA-PS achieves the worst performance because the pro-cess heap size is very small but the young generation is stillset to 1GB.
Table 2 shows the average of each one of the previouslypresented evaluation results (application downtime, networkusage, total migration time, and throughput) of each so-lution normalized to ALMA. We could not measure thethroughput for JAVMM since we could not reproduce ourexperiments with JAVMM.
ALMA clearly achieves the best performance in all threemetrics. Compared to JAVMM, ALMA: i) improves the
Metric CRIU JAVMM ALMA-PSDowntime 3.58 1.13 1.68Net. Usage 2.86 4.42 1.41
Total Migr. Time 2.57 5.69 1.06Throughput 0.61 NA 0.89
Table 2: Performance Results Normalized to ALMA
Benchmark G1 GC Migr. GC Migr. GC (Norm.)scimark 19 ms 18 ms 0.94derby 7 ms 7 ms 1.00crypto 12 ms 8 ms 0.67
compress 2 ms 3 ms 1.50xml 6 ms 11 ms 1.83
serial 2 ms 4 ms 2.00mpegaudio 3 ms 7 ms 2.33
avrora 5 ms 12 ms 2.40h2 102 ms 36 ms 0.35fop 19 ms 26 ms 1.36
pmd 17 ms 22 ms 1.29sunflow 5 ms 6 ms 1.20eclipse 14 ms 38 ms 2.71tomcat 14 ms 17 ms 1.21jython 5 ms 13 ms 2.60
Table 3: ALMA Migration Aware GC Overhead Comparedto G1 GC for SPEC and DaCapo
downtime by 13%, ii) network usage is 4.42 times lower, andiii) total migration time is 5.69 times faster.
ALMA-PS presents the closest performance results whencompared to ALMA. Table 2 shows that ALMA achieves41% better performance compared to ALMA-PS regardingnetwork usage, 68% regarding downtime, 6% regarding to-tal migration time, and 11% for the application throughput(including migration).
5.6 Migration Aware GC OverheadAs already said, ALMA’s migration-aware GC collects
all heap regions whose GCRate is greater than the networkbandwidth (see Section 3). This section shows the perfor-mance penalty of running such a migration-aware GC. Table3 presents the average duration of: i) column G1 GC - eachcollection done with the default G1 GC (as if there was noALMA), ii) column Migr. GC - using the migration awarepolicy described in Section 3), and iii) column Migr. GC(Norm.) - the normalized values for the migration awareGC w.r.t. the G1 GC.
As expected, a migration-aware GC (as it happens in

Figure 8: Total Migration Time (seconds) for SPEC (left) and DaCapo (right) benchmarks
Figure 9: ALMA Application Downtime With More CoresVersus More Network Bandwidth
ALMA) takes longer than a G1 GC in 12 out of 15 ap-plications. This is due to the fact that ALMA migrationaware policy selects more regions to collect than the defaultG1 policy (which tries to minimize the application pauses),and thus, takes more time to finish.
In 3 applications (h2, scimark, and crypto) this is not true,i.e. the migration aware GC is faster than G1 GC. In theseparticular cases, this is due to the fact that G1 performsseveral full GCs14 because these applications allocate largeblocks of memory which occupy most of the heap leading toallocation failures. For this reason, ALMA migration awareGC takes less time than the average default G1 GC.
Nevertheless, even the cases where the migration-awareGC is slower than G1 GC, the difference in time is very smallcompared to the application downtime during a migration.In other words, an increase of a few dozens of milliseconds inGC duration will have a negligible impact on the migrationdowntime.
5.7 ALMA with More ResourcesIn this last experiment, we study the performance impact
of ALMA on the application downtime, when increasing thenumber of cores used by the application and the networkbandwidth available (used to transfer the application snap-shots). For this experiment only, we used 3 different system-VMs (also hosted in our local OpenStack installation) with2, 4, and 8 cores. We performed this experiment with onlyone application, crypto. We chose this particular applica-tion because it dirties memory at a constant rate, and doesnot concentrate memory operations in a specific heap area(which is frequent in derby, for example). This behavior evi-denced by crpyto represents the worst case for ALMA; otherapplications of the benchmarks are much less demanding
14A full GC happens when the heap has no more free memoryto satisfy an allocation request, and the G1 collection ofthe young generation fails. In a full GC, the entire heapis collected and compacted. This is a particularly costlyoperation.
memory wise.
Downtime =SizeIncSnapshot
NetBandwidth(6)
SizeIncSnapshot =SizeInitSnapshot
NetBandwidth∗DirtyRate (7)
Donwtime =SizeInitSnapshot
NetBandwidth2∗DirtyRate (8)
The results are shown in Figure 9. Since our installationonly has 1Gbps, we estimate the remaining values with morenetwork bandwidth. The estimated values are obtained asfollows (see Eqs. 6,7, and 8): i) we start by measuring theapplication dirty rate (by measuring the size of the incre-mental snapshot) using 2, 4, and 8 cores. Then, with thesize of the initial snapshot divided by the network band-width we get the time needed to transmit the initial snap-shot. Multiplying it with the dirty rate, we get the size ofthe incremental snapshot (Eq. 7). This enables us to esti-mate the application downtime (by replacing Eq. 7 in Eq.6 to obtain Eq. 8). We also consider that part of both theinitial and the incremental snapshots are filtered as garbage(this percentage is taken from Table 1).
Figure 9 clearly shows that increasing the number of cores,results in increasing the application downtime. This comesfrom the fact that the application will dirty memory faster.On the other hand, when we increase the amount of net-work bandwidth used for migration, the application down-time drops because the application has less time to dirtymemory (since the snapshot gets transferred faster).15 Oneimportant conclusion to take from our experiment is thatthe application downtime (see Eq. 8) is: i) proportional tothe number of cores (as it is multiplied by the applicationdirty rate), and ii) inversely proportional to the square of thenetwork bandwidth (as it is divided by the square of the net-work bandwidth). In other words, doubling the number ofcores will double the application downtime but doubling thenetwork bandwidth will reduce the downtime to one quarterof its initial value. Note that these conclusions only holdfor ALMA which has one initial snapshot and one incre-mental snapshot (taken right after transmitting the initialsnapshot).
15Note that memory gets dirty by an application running onthe source site while the first snapshot is transferred to thedestination site.
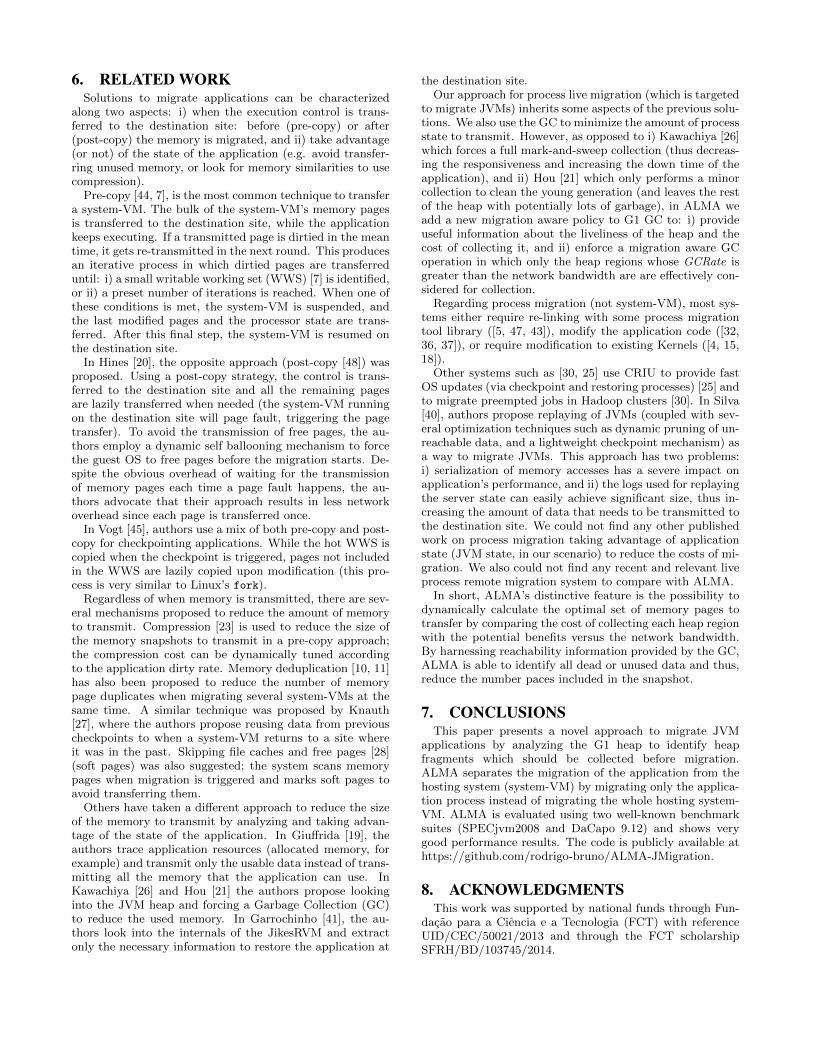
6. RELATED WORKSolutions to migrate applications can be characterized
along two aspects: i) when the execution control is trans-ferred to the destination site: before (pre-copy) or after(post-copy) the memory is migrated, and ii) take advantage(or not) of the state of the application (e.g. avoid transfer-ring unused memory, or look for memory similarities to usecompression).
Pre-copy [44, 7], is the most common technique to transfera system-VM. The bulk of the system-VM’s memory pagesis transferred to the destination site, while the applicationkeeps executing. If a transmitted page is dirtied in the meantime, it gets re-transmitted in the next round. This producesan iterative process in which dirtied pages are transferreduntil: i) a small writable working set (WWS) [7] is identified,or ii) a preset number of iterations is reached. When one ofthese conditions is met, the system-VM is suspended, andthe last modified pages and the processor state are trans-ferred. After this final step, the system-VM is resumed onthe destination site.
In Hines [20], the opposite approach (post-copy [48]) wasproposed. Using a post-copy strategy, the control is trans-ferred to the destination site and all the remaining pagesare lazily transferred when needed (the system-VM runningon the destination site will page fault, triggering the pagetransfer). To avoid the transmission of free pages, the au-thors employ a dynamic self ballooning mechanism to forcethe guest OS to free pages before the migration starts. De-spite the obvious overhead of waiting for the transmissionof memory pages each time a page fault happens, the au-thors advocate that their approach results in less networkoverhead since each page is transferred once.
In Vogt [45], authors use a mix of both pre-copy and post-copy for checkpointing applications. While the hot WWS iscopied when the checkpoint is triggered, pages not includedin the WWS are lazily copied upon modification (this pro-cess is very similar to Linux’s fork).
Regardless of when memory is transmitted, there are sev-eral mechanisms proposed to reduce the amount of memoryto transmit. Compression [23] is used to reduce the size ofthe memory snapshots to transmit in a pre-copy approach;the compression cost can be dynamically tuned accordingto the application dirty rate. Memory deduplication [10, 11]has also been proposed to reduce the number of memorypage duplicates when migrating several system-VMs at thesame time. A similar technique was proposed by Knauth[27], where the authors propose reusing data from previouscheckpoints to when a system-VM returns to a site whereit was in the past. Skipping file caches and free pages [28](soft pages) was also suggested; the system scans memorypages when migration is triggered and marks soft pages toavoid transferring them.
Others have taken a different approach to reduce the sizeof the memory to transmit by analyzing and taking advan-tage of the state of the application. In Giuffrida [19], theauthors trace application resources (allocated memory, forexample) and transmit only the usable data instead of trans-mitting all the memory that the application can use. InKawachiya [26] and Hou [21] the authors propose lookinginto the JVM heap and forcing a Garbage Collection (GC)to reduce the used memory. In Garrochinho [41], the au-thors look into the internals of the JikesRVM and extractonly the necessary information to restore the application at
the destination site.Our approach for process live migration (which is targeted
to migrate JVMs) inherits some aspects of the previous solu-tions. We also use the GC to minimize the amount of processstate to transmit. However, as opposed to i) Kawachiya [26]which forces a full mark-and-sweep collection (thus decreas-ing the responsiveness and increasing the down time of theapplication), and ii) Hou [21] which only performs a minorcollection to clean the young generation (and leaves the restof the heap with potentially lots of garbage), in ALMA weadd a new migration aware policy to G1 GC to: i) provideuseful information about the liveliness of the heap and thecost of collecting it, and ii) enforce a migration aware GCoperation in which only the heap regions whose GCRate isgreater than the network bandwidth are are effectively con-sidered for collection.
Regarding process migration (not system-VM), most sys-tems either require re-linking with some process migrationtool library ([5, 47, 43]), modify the application code ([32,36, 37]), or require modification to existing Kernels ([4, 15,18]).
Other systems such as [30, 25] use CRIU to provide fastOS updates (via checkpoint and restoring processes) [25] andto migrate preempted jobs in Hadoop clusters [30]. In Silva[40], authors propose replaying of JVMs (coupled with sev-eral optimization techniques such as dynamic pruning of un-reachable data, and a lightweight checkpoint mechanism) asa way to migrate JVMs. This approach has two problems:i) serialization of memory accesses has a severe impact onapplication’s performance, and ii) the logs used for replayingthe server state can easily achieve significant size, thus in-creasing the amount of data that needs to be transmitted tothe destination site. We could not find any other publishedwork on process migration taking advantage of applicationstate (JVM state, in our scenario) to reduce the costs of mi-gration. We also could not find any recent and relevant liveprocess remote migration system to compare with ALMA.
In short, ALMA’s distinctive feature is the possibility todynamically calculate the optimal set of memory pages totransfer by comparing the cost of collecting each heap regionwith the potential benefits versus the network bandwidth.By harnessing reachability information provided by the GC,ALMA is able to identify all dead or unused data and thus,reduce the number paces included in the snapshot.
7. CONCLUSIONSThis paper presents a novel approach to migrate JVM
applications by analyzing the G1 heap to identify heapfragments which should be collected before migration.ALMA separates the migration of the application from thehosting system (system-VM) by migrating only the applica-tion process instead of migrating the whole hosting system-VM. ALMA is evaluated using two well-known benchmarksuites (SPECjvm2008 and DaCapo 9.12) and shows verygood performance results. The code is publicly available athttps://github.com/rodrigo-bruno/ALMA-JMigration.
8. ACKNOWLEDGMENTSThis work was supported by national funds through Fun-
dacao para a Ciencia e a Tecnologia (FCT) with referenceUID/CEC/50021/2013 and through the FCT scholarshipSFRH/BD/103745/2014.

9. REFERENCES[1] A. W. Appel. Simple generational garbage collection
and fast allocation. Software: Practice and Experience,19(2):171–183, 1989.
[2] J. Armstrong and R. Virding. One pass real-timegenerational mark-sweep garbage collection. InMemory Management, pages 313–322. Springer, 1995.
[3] S. M. Blackburn et al. The DaCapo benchmarks: Javabenchmarking development and analysis.
[4] M. Bozyigit, K. Al-Tawil, and S. Naseer. A kernelintegrated task migration infrastructure for clusters ofworkstations. Computers & Electrical Engineering,26(3):279–295, 2000.
[5] M. Bozyigit and M. Wasiq. User-level processcheckpoint and restore for migration. ACM SIGOPSOperating Systems Review, 35(2):86–96, 2001.
[6] C. J. Cheney. A nonrecursive list compactingalgorithm. Commun. ACM, 13(11):677–678, Nov.1970.
[7] C. Clark, K. Fraser, S. Hand, J. G. Hansen, E. Jul,C. Limpach, I. Pratt, and A. Warfield. Live migrationof virtual machines. In Proceedings of the 2ndconference on Symposium on Networked SystemsDesign & Implementation-Volume 2, pages 273–286.USENIX Association, 2005.
[8] G. E. Collins. A method for overlapping and erasureof lists. Communications of the ACM, 3(12):655–657,1960.
[9] T. Das, P. Padala, V. N. Padmanabhan, R. Ramjee,and K. G. Shin. Litegreen: Saving energy innetworked desktops using virtualization. In USENIXannual technical conference, 2010.
[10] U. Deshpande, B. Schlinker, E. Adler, andK. Gopalan. Gang migration of virtual machines usingcluster-wide deduplication. In Cluster, Cloud and GridComputing (CCGrid), 2013 13th IEEE/ACMInternational Symposium on, pages 394–401. IEEE,2013.
[11] U. Deshpande, X. Wang, and K. Gopalan. Live gangmigration of virtual machines. In Proceedings of the20th international symposium on High performancedistributed computing, pages 135–146. ACM, 2011.
[12] D. Detlefs, C. Flood, S. Heller, and T. Printezis.Garbage-first garbage collection. In Proceedings of the4th international symposium on Memory management,pages 37–48. ACM, 2004.
[13] D. Doligez and X. Leroy. A concurrent, generationalgarbage collector for a multithreaded implementationof ml. In Proceedings of the 20th ACMSIGPLAN-SIGACT symposium on Principles ofprogramming languages, pages 113–123. ACM, 1993.
[14] T. Domani, E. K. Kolodner, and E. Petrank. Agenerational on-the-fly garbage collector for java. InProceedings of the ACM SIGPLAN 2000 Conferenceon Programming Language Design andImplementation, PLDI ’00, pages 274–284, New York,NY, USA, 2000. ACM.
[15] F. Douglis and J. K. Ousterhout. Transparent processmigration: Design alternatives and the spriteimplementation. Softw., Pract. Exper., 21(8):757–785,1991.
[16] R. Dua, A. R. Raja, and D. Kakadia. Virtualization vs
containerization to support paas. In CloudEngineering (IC2E), 2014 IEEE InternationalConference on, pages 610–614, March 2014.
[17] L. Gidra, G. Thomas, J. Sopena, and M. Shapiro.Assessing the scalability of garbage collectors on manycores. In Proceedings of the 6th Workshop onProgramming Languages and Operating Systems,page 7. ACM, 2011.
[18] R. Gioiosa, J. C. Sancho, S. Jiang, F. Petrini, andK. Davis. Transparent, incremental checkpointing atkernel level: a foundation for fault tolerance forparallel computers. In Proceedings of the 2005ACM/IEEE conference on Supercomputing, page 9.IEEE Computer Society, 2005.
[19] C. Giuffrida, C. Iorgulescu, and A. S. Tanenbaum.Mutable checkpoint-restart: automating live updatefor generic server programs. In Proceedings of the 15thInternational Middleware Conference, pages 133–144.ACM, 2014.
[20] M. R. Hines and K. Gopalan. Post-copy based livevirtual machine migration using adaptive pre-pagingand dynamic self-ballooning. In Proceedings of the2009 ACM SIGPLAN/SIGOPS internationalconference on Virtual execution environments, pages51–60. ACM, 2009.
[21] K.-Y. Hou, K. G. Shin, and J.-L. Sung.Application-assisted live migration of virtual machineswith java applications. In Proceedings of the TenthEuropean Conference on Computer Systems, EuroSys’15, pages 15:1–15:15, New York, NY, USA, 2015.ACM.
[22] W. Huang, Q. Gao, J. Liu, and D. K. Panda. Highperformance virtual machine migration with rdmaover modern interconnects. In Cluster Computing,2007 IEEE International Conference on, pages 11–20.IEEE, 2007.
[23] H. Jin, L. Deng, S. Wu, X. Shi, and X. Pan. Livevirtual machine migration with adaptive, memorycompression. In Cluster Computing and Workshops,2009. CLUSTER’09. IEEE International Conferenceon, pages 1–10. IEEE, 2009.
[24] R. Jones, A. Hosking, and E. Moss. The garbagecollection handbook: the art of automatic memorymanagement. Chapman & Hall/CRC, 2011.
[25] S. Kashyap, C. Min, B. Lee, T. Kim, andP. Emelyanov. Instant os updates via userspacecheckpoint-and-restart. In 2016 USENIX AnnualTechnical Conference (USENIX ATC 16), Denver,CO, June 2016. USENIX Association.
[26] K. Kawachiya, K. Ogata, D. Silva, T. Onodera,H. Komatsu, and T. Nakatani. Cloneable jvm: a newapproach to start isolated java applications faster. InProceedings of the 3rd international conference onVirtual execution environments, pages 1–11. ACM,2007.
[27] T. Knauth and C. Fetzer. Vecycle: Recycling vmcheckpoints for faster migrations. In Proceedings of the16th Annual Middleware Conference, pages 210–221.ACM, 2015.
[28] A. Koto, H. Yamada, K. Ohmura, and K. Kono.Towards unobtrusive vm live migration for cloudcomputing platforms. In Proceedings of the

Asia-Pacific Workshop on Systems, page 7. ACM,2012.
[29] H. Li, A. Ghodsi, M. Zaharia, S. Shenker, andI. Stoica. Tachyon: Reliable, memory speed storage forcluster computing frameworks. In Proceedings of theACM Symposium on Cloud Computing, pages 1–15.ACM, 2014.
[30] J. Li, C. Pu, Y. Chen, V. Talwar, and D. Milojicic.Improving preemptive scheduling withapplication-transparent checkpointing in sharedclusters. In Proceedings of the 16th Annual MiddlewareConference, pages 222–234. ACM, 2015.
[31] H. Lieberman and C. Hewitt. A real-time garbagecollector based on the lifetimes of objects.Communications of the ACM, 26(6):419–429, 1983.
[32] M. Litzkow, T. Checkpointing, T. ProcessMigration for MPInbaum, J. Basney, and M. Livny.Checkpoint and migration of UNIX processes in theCondor distributed processing system. ComputerSciences Department, University of Wisconsin, 1997.
[33] J. McCarthy. Recursive functions of symbolicexpressions and their computation by machine, part i.Communications of the ACM, 3(4):184–195, 1960.
[34] A. B. Nagarajan, F. Mueller, C. Engelmann, and S. L.Scott. Proactive fault tolerance for hpc with xenvirtualization. In Proceedings of the 21st annualinternational conference on Supercomputing, pages23–32. ACM, 2007.
[35] R. Nathuji and K. Schwan. Virtualpower: coordinatedpower management in virtualized enterprise systems.In ACM SIGOPS Operating Systems Review,volume 41, pages 265–278. ACM, 2007.
[36] T. Osman and A. Bargiela. Process checkpointing inan open distributed environment. In Proceedings ofEuropean Simulation Multiconference, ESM,volume 97, 1997.
[37] J. S. Plank, M. Beck, G. Kingsley, and K. Li. Libckpt:Transparent checkpointing under unix. ComputerScience Department, 1994.
[38] T. Printezis and D. Detlefs. A generationalmostly-concurrent garbage collector, volume 36. ACM,2000.
[39] K. Shiv, K. Chow, Y. Wang, and D. Petrochenko.Specjvm2008 performance characterization. InComputer Performance Evaluation andBenchmarking, pages 17–35. Springer, 2009.
[40] J. M. Silva, J. Simao, and L. Veiga.Ditto–deterministic executionreplayability-as-a-service for java vm onmultiprocessors. In ACM/IFIP/USENIX InternationalConference on Distributed Systems Platforms andOpen Distributed Processing, pages 405–424. Springer,2013.
[41] J. Simao, T. Garrochinho, and L. Veiga. Acheckpointing-enabled and resource-aware java virtualmachine for efficient and robust e-science applicationsin grid environments. Concurrency and Computation:Practice and Experience, 24(13):1421–1442, 2012.
[42] A. Singh, M. Korupolu, and D. Mohapatra.Server-storage virtualization: integration and loadbalancing in data centers. In Proceedings of the 2008ACM/IEEE conference on Supercomputing, page 53.
IEEE Press, 2008.
[43] G. Stellner. Cocheck: Checkpointing and processmigration for mpi. In Parallel Processing Symposium,1996., Proceedings of IPPS’96, The 10thInternational, pages 526–531. IEEE, 1996.
[44] M. M. Theimer, K. A. Lantz, and D. R. Cheriton.Preemptable remote execution facilities for theV-system, volume 19. ACM, 1985.
[45] D. Vogt, A. Miraglia, G. Portokalidis, H. Bos,A. Tanenbaum, and C. Giuffrida. Speculative memorycheckpointing. In Proceedings of the 16th AnnualMiddleware Conference, pages 197–209. ACM, 2015.
[46] P. R. Wilson and T. G. Moher. Design of theopportunistic garbage collector. In ACM SIGPLANNotices, volume 24, pages 23–35. ACM, 1989.
[47] V. C. Zandy, B. P. Miller, and M. Livny. Processhijacking. In High Performance DistributedComputing, 1999. Proceedings. The EighthInternational Symposium on, pages 177–184. IEEE,1999.
[48] E. Zayas. Attacking the process migration bottleneck.In ACM SIGOPS Operating Systems Review,volume 21, pages 13–24. ACM, 1987.