ALM Interest Rate Risk - p2psoftware -- Interest Rate Risk.pdfALM – Interest Rate Risk 1 ... The...
12
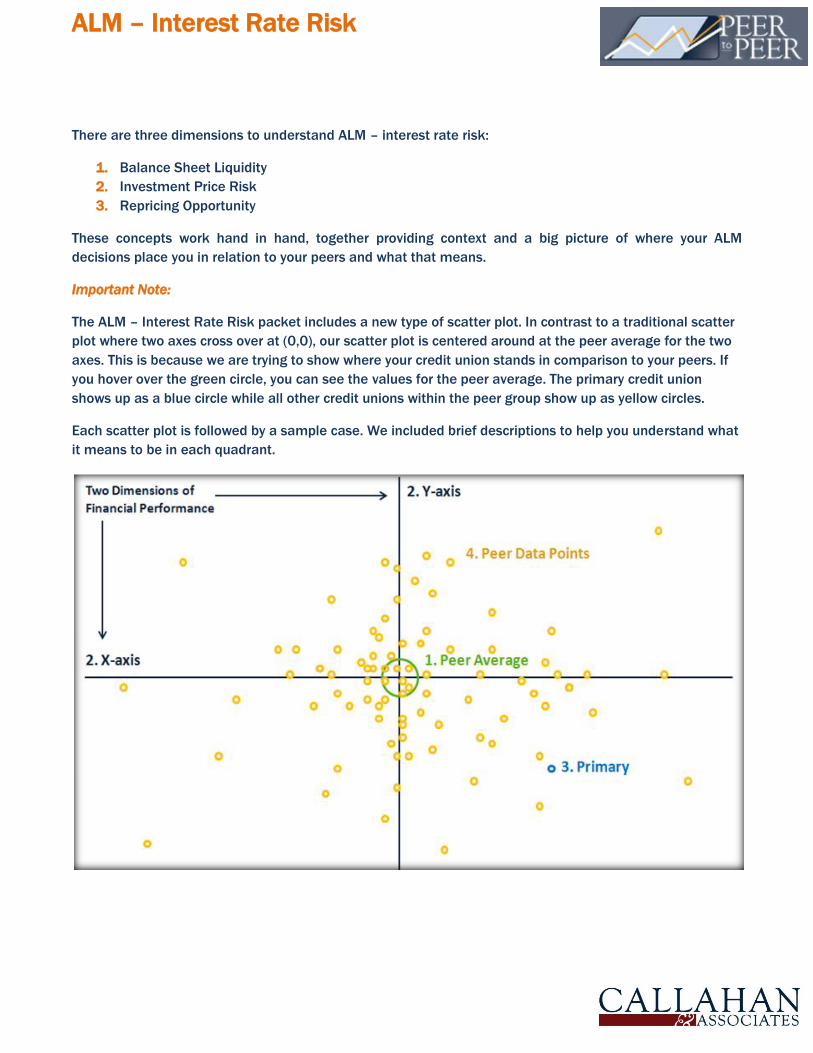
ALM – Interest Rate Risk 1 There are three dimensions to understand ALM – interest rate risk: 1. Balance Sheet Liquidity 2. Investment Price Risk 3. Repricing Opportunity These concepts work hand in hand, together providing context and a big picture of where your ALM decisions place you in relation to your peers and what that means. Important Note: The ALM – Interest Rate Risk packet includes a new type of scatter plot. In contrast to a traditional scatter plot where two axes cross over at (0,0), our scatter plot is centered around at the peer average for the two axes. This is because we are trying to show where your credit union stands in comparison to your peers. If you hover over the green circle, you can see the values for the peer average. The primary credit union shows up as a blue circle while all other credit unions within the peer group show up as yellow circles. Each scatter plot is followed by a sample case. We included brief descriptions to help you understand what it means to be in each quadrant.
Transcript of ALM Interest Rate Risk - p2psoftware -- Interest Rate Risk.pdfALM – Interest Rate Risk 1 ... The...
ALM – Interest Rate Risk
1
There are three dimensions to understand ALM – interest rate risk:
1. Balance Sheet Liquidity
2. Investment Price Risk
3. Repricing Opportunity
These concepts work hand in hand, together providing context and a big picture of where your ALM
decisions place you in relation to your peers and what that means.
Important Note:
The ALM – Interest Rate Risk packet includes a new type of scatter plot. In contrast to a traditional scatter
plot where two axes cross over at (0,0), our scatter plot is centered around at the peer average for the two
axes. This is because we are trying to show where your credit union stands in comparison to your peers. If
you hover over the green circle, you can see the values for the peer average. The primary credit union
shows up as a blue circle while all other credit unions within the peer group show up as yellow circles.
Each scatter plot is followed by a sample case. We included brief descriptions to help you understand what
it means to be in each quadrant.

ALM – Interest Rate Risk
2
Balance Sheet Liquidity
1. Table: Weighted Average Life of Investment Portfolio (incl. Cash)
The weighted average life of investment portfolio estimates the years for the total investment cashflows to
be fully reinvested or repriced. As for the estimated average life, we took the middle points of each
investment subcategory’s maturity range shown on the call report as illustrated in the chart below:
Investment Maturity Range Estimated Average Life (yr)
Cash 0
Investments < =1 yr 0.5
Investments 1-3 yrs 2
Investments 3-5 yrs 4
Investments 5-10 yrs 7.5
Investments > 10 yrs* 10 *Investments >10 yrs is an exception.
The weighted average life of the total investment portfolio is calculated by taking the sum of the estimated
average weights multiplied by the respective investment subcategory balances, then divided by total
investment balances (including cash).
Peer formula =
((0*cash)+(0.5*a799a1)+(2*a799b)+(4*a799c1)+(7.5*a799c2)+(10*a799d))/(cash+investments)
2. Trend: Weighted Average Life of Investment Portfolio (incl. Cash)
This line graph shows the trends in the weighted average life of the total investment portfolio (incl. cash)
over time.
Peer formula =
((0*cash)+(0.5*a799a1)+(2*a799b)+(4*a799c1)+(7.5*a799c2)+(10*a799d))/(cash+investments)
3. Short-Term Liquidity as a % of Total Investments (incl. Cash)
This ratio measures the short-term liquidity in a total investment portfolio by calculating the percentage of
cash and investments < 1yr as a percent of total investment balances. The higher the ratio, the greater the
likelihood the investments can be sold with no principal loss (i.e. lower price risk).
Peer formula = (cash+a799a1)/(investments+cash)
4. Short-Term Liquidity as a % of Shares & Borrowings
This ratio shows the short-term liquidity in relation to the credit unions’ funding base, shares and
borrowings. The ratio provides a measure of “cash” immediately available if there is an unexpected
volatility in the funding base (i.e. share outflows or borrowing repayment).
Peer formula = (cash+a799a1)/(shares+a011c+a883c)

ALM – Interest Rate Risk
3
5. Total Investments/Assets (incl. Cash)
This ratio shows the total amount of investments (incl. cash) as a percentage of total assets. Investments
are credit unions’ liquidity warehouse – funds available to meet loan demand or held as earning assets to
generate income. The level of investments reflects both member demand for shares and loans and the
management’s business strategy.
Peer formula = (investments+cash)/assets
6. Scatter Plot of Balance Sheet Liquidity and Weighted Average Life
This scatter plot shows a credit union’s balance sheet liquidity position relative to its peers given its
weighted average life of an investment portfolio. The vertical axis shows how much of a credit union’s
balance sheet is in investments, which are likely to be its most marketable (i.e. liquid) assets. The
horizontal axis measures the number of years that it will take to receive the money invested, which can be
repriced or reinvested.
Peer formula = (directly below)
Vertical axis: (investments+cash)/assets
Horizontal axis:
((0*cash)+(0.5*a799a1)+(2*a799b)+(4*a799c1)+(7.5*a799c2)+(10*a799d))/(cash+investments)
- +
-
+
Hi ST Liquidity
Lo (Investments+Cash)/Assets
Hi ST Liquidity
Hi (Investments+Cash)/Assets
Lo ST Liquidity
Hi (Investments+Cash)/Assets
Lo ST Liquidity
Lo (Investments+Cash)/Assets
Weighted Average Life of Investment Portfolio (incl. Cash)
(In
vest
men
ts+C
ash
)/A
sset
s

ALM – Interest Rate Risk
4
Sample Case
Primary Credit Union: Wright-Patt
Comparison Peer Group: Credit Unions Over $1B in Assets as of September 2014
ALM – Interest Rate Risk
5
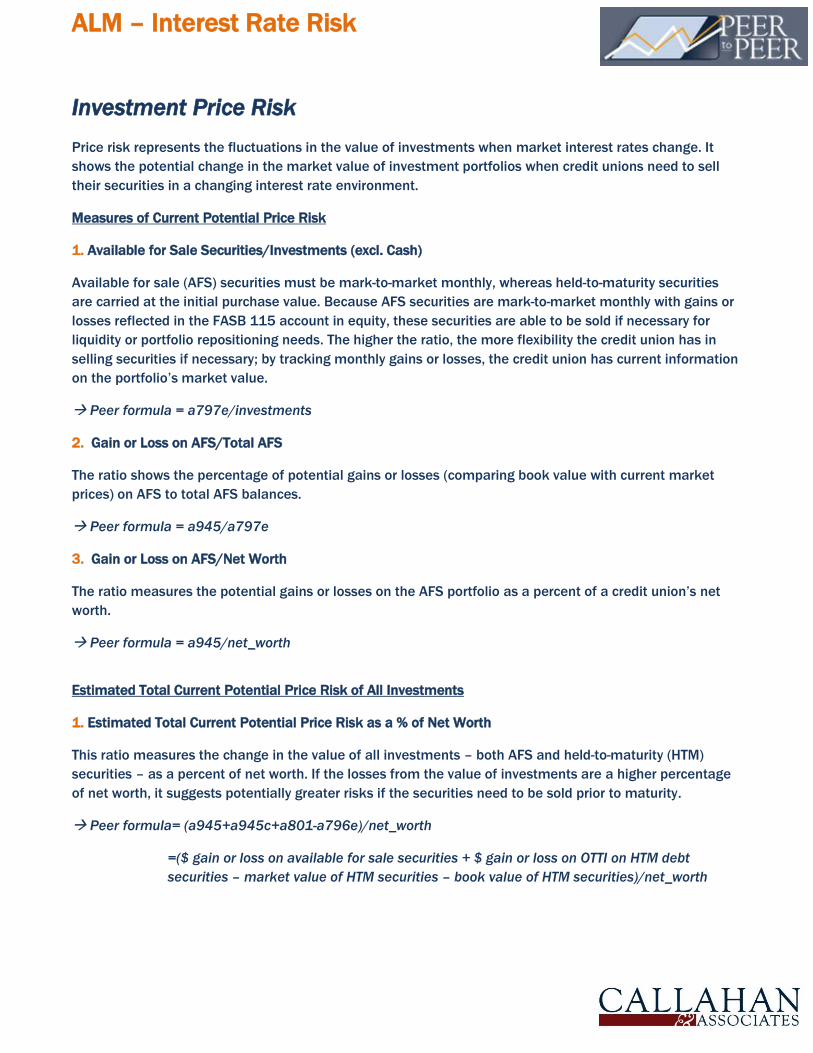
Investment Price Risk
Price risk represents the fluctuations in the value of investments when market interest rates change. It
shows the potential change in the market value of investment portfolios when credit unions need to sell
their securities in a changing interest rate environment.
Measures of Current Potential Price Risk
1. Available for Sale Securities/Investments (excl. Cash)
Available for sale (AFS) securities must be mark-to-market monthly, whereas held-to-maturity securities
are carried at the initial purchase value. Because AFS securities are mark-to-market monthly with gains or
losses reflected in the FASB 115 account in equity, these securities are able to be sold if necessary for
liquidity or portfolio repositioning needs. The higher the ratio, the more flexibility the credit union has in
selling securities if necessary; by tracking monthly gains or losses, the credit union has current information
on the portfolio’s market value.
Peer formula = a797e/investments
2. Gain or Loss on AFS/Total AFS
The ratio shows the percentage of potential gains or losses (comparing book value with current market
prices) on AFS to total AFS balances.
Peer formula = a945/a797e
3. Gain or Loss on AFS/Net Worth
The ratio measures the potential gains or losses on the AFS portfolio as a percent of a credit union’s net
worth.
Peer formula = a945/net_worth
Estimated Total Current Potential Price Risk of All Investments
1. Estimated Total Current Potential Price Risk as a % of Net Worth
This ratio measures the change in the value of all investments – both AFS and held-to-maturity (HTM)
securities – as a percent of net worth. If the losses from the value of investments are a higher percentage
of net worth, it suggests potentially greater risks if the securities need to be sold prior to maturity.
Peer formula= (a945+a945c+a801-a796e)/net_worth
=($ gain or loss on available for sale securities + $ gain or loss on OTTI on HTM debt
securities – market value of HTM securities – book value of HTM securities)/net_worth

ALM – Interest Rate Risk
6
2. Estimated Total Current Potential Price Risk as a % of All Investments (excl. Cash)
This ratio measures the percentage change in the value (gains or losses) of all investments, comparing
book to current market value. If the losses from the value of investments are a higher percentage of the
investment portfolio, it suggests potentially greater risks if the securities need to be sold prior to maturity.
Peer formula = (a945+a945c+a801-a796e)/investments
= ($ gain or loss on available for sale securities + $ gain or loss on OTTI on HTM debt
securities – market value of HTM securities – book value of HTM securities)/investments
3. Scatter Plot of Liquidity and Total Price Risk
This scatter plot shows a credit union’s relative position in terms of both liquidity and total current potential
price risk. The vertical axis represents liquidity, using the (cash+investments < 1yr)/(shares+ borrowings)
ratio. The horizontal axis represents the total current potential price risk on all investments as a
percentage of net worth1.
Peer formula = (directly below)
Vertical axis: (cash+a799a1)/(shares+ a011c+a883c)
Horizontal axis: (a945+a945c+a801-a796e)/net_worth
1 The higher the total current potential price risk as a percentage of net worth ratio, the lower the price risk the credit union has.
+
-
- +
Total Price Risk/Net Worth
ST L
iqu
idit
y/(S
har
es&
Bo
rro
win
gs)
Lo Price Risk
Lo ST Liquidity
Lo Price Risk
Hi ST Liquidity
Hi Price Risk
Lo ST Liquidity
Hi Price Risk
Hi ST Liquidity

ALM – Interest Rate Risk
7
Sample Case
Primary Credit Union: Wright-Patt
Comparison Peer Group: Credit Unions Over $1B in Assets as of September 2014
ALM – Interest Rate Risk
8
Repricing Opportunity
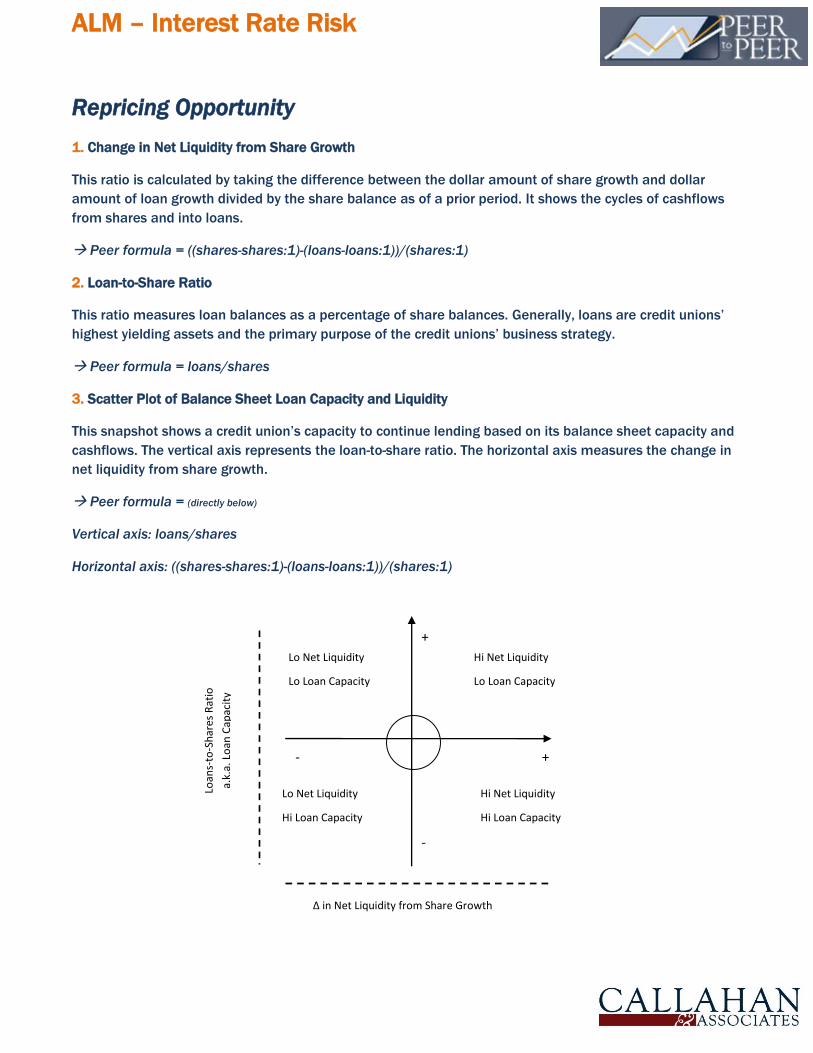
1. Change in Net Liquidity from Share Growth
This ratio is calculated by taking the difference between the dollar amount of share growth and dollar
amount of loan growth divided by the share balance as of a prior period. It shows the cycles of cashflows
from shares and into loans.
Peer formula = ((shares-shares:1)-(loans-loans:1))/(shares:1)
2. Loan-to-Share Ratio
This ratio measures loan balances as a percentage of share balances. Generally, loans are credit unions’
highest yielding assets and the primary purpose of the credit unions’ business strategy.
Peer formula = loans/shares
3. Scatter Plot of Balance Sheet Loan Capacity and Liquidity
This snapshot shows a credit union’s capacity to continue lending based on its balance sheet capacity and
cashflows. The vertical axis represents the loan-to-share ratio. The horizontal axis measures the change in
net liquidity from share growth.
Peer formula = (directly below)
Vertical axis: loans/shares
Horizontal axis: ((shares-shares:1)-(loans-loans:1))/(shares:1)
-
+
∆ in Net Liquidity from Share Growth
Loan
s-to
-Sh
ares
Rat
io
a.k.
a. L
oan
Cap
acit
y
+ -
Hi Net Liquidity
Hi Loan Capacity
Hi Net Liquidity
Lo Loan Capacity
Lo Net Liquidity
Hi Loan Capacity
Lo Net Liquidity
Lo Loan Capacity

ALM – Interest Rate Risk
9
Sample Case
Primary Credit Union: Wright-Patt
Comparison Peer Group: Credit Unions Over $1B in Assets as of September 2014
4. Paydown Rate on Loans
The paydown rate measures the estimated cashflows from loans in the next 12 months as a percentage of
total loans. The numerator is the sum of loan balances as of the previous December and year-to-date loan
origination balances minus the sum of the current period loan balances and first mortgage loans that have
been sold to the secondary market. This value is divided by total current loan balances. This estimate is an
indication of a credit union’s ability to reprice new assets in the next 12 months based on its loan
cashflows.
Peer formula = annual(loans:dec+a031b-loans-a736)/loans
5. Asset Repricing Opportunity in the Next 12 Mo. as a % of Shares & Borrowings
This ratio provides a measure of estimated cashflows (consisting of estimated loan cashflows for the next
12 months, cash, and investments < 1yr) available that can be repriced in the next 12 months if there is an
unexpected volatility in the funding base (i.e. share outflows or borrowing repayment). The higher the ratio,
the greater the asset repricing opportunities the credit union has if interest rates change.
Peer formula = (annual(loans:dec+a031b-loans-a736)+ (cash+a799a1))/(shares+a011c+a883c)

ALM – Interest Rate Risk
10
6. Net Interest Margin
The net interest margin is the result of asset liability management and demonstrates the credit union’s
ability to maintain a sufficient margin to meet its operating expenses. This ratio should be relatively stable
in all interest rate environments.
Peer formula = net_int_margin
7. Scatter Plot of Net Share Growth and Asset Repricing Opportunity
This snapshot shows a credit union’s ALM asset repricing opportunities from projected cashflows in
relation to its current net liquidity flow from shares. The vertical axis represents the change in net liquidity
from share growth. The horizontal axis measures the asset reprcing opportunities in the next 12 months as
a % of shares & borrowings.
Peer formula = (directly below)
Vertical axis: ((shares-shares:1)-(loans-loans:1))/(shares:1)
Horizontal axis: (annual(loans:dec+a031b-loans-a736)+ (cash+a799a1))/(shares+a011c+a883c)
-
+
Asset Repricing Opportunity in the Next 12 Months as a % of Shares & Borrowings
∆ in
Net
Liq
uid
ity
fro
m
Shar
e G
row
th
+ -
Hi Repricing Opp.
Lo Liquidity
Hi Repricing Opp.
Hi Liquidity
Lo Repricing Opp.
Lo Liquidity
Lo Repricing Opp.
Hi Liquidity

ALM – Interest Rate Risk
11
Sample Case
Primary Credit Union: Wright-Patt
Comparison Peer Group: Credit Unions Over $1B in Assets as of September 2014

ALM – Interest Rate Risk
12
Appendix: Account Code & Formula Guide
5300 Account Codes Used In This Analysis
Account Code Peer
Shortcut Definition
Pg # on the
Call Report
a730a+a730b+a730c cash or a730 $ Total cash = Cash on hand (a730a)+ Cash on deposit
(a730b) + Cash equivalents (a730c)
1
a799a1 - $ Investments <= 1 year 1
a799b - $ Investments 1-3 years 1
a799c1 - $ Investments 3-5 years 1
a799c2 - $ Investments 5-10 years 1
a799d - $ Investments > 10 years 1
a799i investments $ Total investments excluding cash 1
a010 assets $ Total assets 2
a797e - $ Total available for sale (AFS) securities 1
a945 - $ Gain or loss on AFS securities 4
a997 net_worth $ Total net worth 11
a801 - $ Market value of total held-to-maturity (HTM) securities 18
a796e - $ Book value of total HTM securities 1
a945c - $ Gain or loss on OTTI on HTM debt securities 4
a011c+a883c - $ Total borrowings = Notes payables (a011c) + Total
draws against lines of credit (a883c)
3
a018 shares $ Total shares and deposits 3
a025b loans $ Total loans & leases outstanding 2
a031b - $ YTD total loans originated 2
a736 - $ YTD first mortgage loans that have been sold to the
secondary market
14
annual(a110-
a119+a120+a124-a380-
a381-a340)/ave_asssets
net_int_margin Spread between interest income and interest expenses as
a percent of average assets
5