ALM. BRAND A/S after tax -74 -275 -122 -353 -401 Profit Group Profit before tax, Group -117 -363...
33
Alm. Brand A/S · Midtermolen 7 · DK-2100 Copenhagen Ø · registration (CVR) no. 77 33 35 17 ALM. BRAND A/S interim report -the third quarter of year 2011
Transcript of ALM. BRAND A/S after tax -74 -275 -122 -353 -401 Profit Group Profit before tax, Group -117 -363...

1ALM. BRAND A/S ÅRSRAPPORT 2010
Alm. Brand A/S · Midtermolen 7 · DK-2100 Copenhagen Ø · registration (CVR) no. 77 33 35 17
ALM. BRAND A/Si n t e r i m r e p o r t - t h e t h i r d q u a r t e r o f y e a r 2 0 1 1

Alm. Brand A/S – Q3 2011
Page 2 of 33
CONTENTS
COMPANY INFORMATION
3 Company information
3 Group structure
MANAGEMENT´S REVIEW
4 Financial highlights and key ratios
5 The Alm. Brand A/S Group
8 Non-life insurance
12 Banking
16 Lending portfolio
19 Report - Life insurance
SIGNATURES
22 Statement by the Board of Directors
and the Management Board
FINANCIAL STATEMENTS
Group
23 Balance sheet
24 Income statement
25 Statement of changes in equity
26 Capital target
27 Cash flow statement
28 Segment reporting
29 Notes
Parent company
30 Balance sheet
31 Income statement
32 Statement of changes in equity
33 Notes

Alm. Brand A/S – Q3 2011
Page 3 of 33
COMPANY INFORMATION BOARD OF DIRECTORS Jørgen H. Mikkelsen, Chairman Boris N. Kjeldsen, Deputy Chairman Henrik Christensen Tage Benjaminsen Per V. H. Frandsen Arne Nielsen Jan S. Pedersen Per Dahlbom Helle L. Frederiksen Henning Kaffka Susanne Larsen EXECUTIVE BOARD Søren Boe Mortensen, Chief Executive
AUDITORS Deloitte, Statsautoriseret Revisionsaktieselskab INTERNAL AUDITOR Poul-Erik Winther, Chief auditor REGISTRATION Alm. Brand A/S Registration Number CVR 77 33 35 17 ADDRESS Alm. Brand Huset Midtermolen 7, DK-2100 Copenhagen Ø Phone: +45 35 47 47 47 Fax: +45 35 47 35 47 Internet: www.almbrand.dk E-mail: [email protected]
GROUP STRUCTURE
ALM . BRAND A/S
ALM . BRAND L IV O G PENSIO NALM . BRAND FO RSIKRING ALM . BRAND BANK
ALM . BRAND FO RM UE
ALM . BRAND LEASING
NO N-LIFE INSURANCE LIFE INSURANCE BANKING
Dormant or discontinuing activities are not included. Alm. Brand A/S is a listed Danish financial services group focusing on the Danish market. The group carries on non-life insurance, life insurance and pension activities as well as banking activities and generates annual consolidated revenue of DKK 7 billion. Alm. Brand’s vision “We take care of our customers” is the guiding principle for the experience customers should have when they interact with Alm. Brand. The group’s insurance and pension products cover private lines, agriculture as well as small and medium-sized businesses. The bank focuses primarily on the private customer market as well as on asset manage-ment and markets activities. Alm. Brand is Denmark’s fourth largest provider of non-life insurance products. The group’s life insurance, pension and banking activities complement the services we provide to our non-life insurance customers.

Alm. Brand A/S – Q3 2011
Page 4 of 33
FINANCIAL HIGHLIGHTS AND KEY RATIOS
Q3 Q3 Q1-Q3 Q1-Q3 Year
DKKm 2011 2010 2011 2010 2010
Income
Non-Life Insurance 1,229 1,201 3,567 3,559 4,762
Banking 252 289 779 846 1,132
Life Insurance 126 151 455 499 719
Investments 172 170 531 530 728
Total income 1,779 1,811 5,332 5,434 7,341
Profit excluding minorities
Non-Life Insurance 39 105 283 41 207
Banking -156 -488 -504 -660 -869
Life Insurance 38 30 100 159 181
Other activities -16 -9 -39 -36 -55
Profit before tax -95 -362 -160 -496 -536
Tax 21 87 38 143 135
Profit after tax -74 -275 -122 -353 -401
Profit Group
Profit before tax, Group -117 -363 -194 -500 -539
Tax 21 87 38 143 135
Profit after tax, Group -96 -276 -156 -357 -404
Provisions for insurance contracts 19,291 19,164 19,291 19,164 18,413
Shareholders´ equity 4,583 3,304 4,583 3,304 4,758
Of which minority interests 107 156 107 156 160
Total assets 46,829 49,669 46,829 49,669 48,149
Return on equity before tax excluding minorities p.a. -8% -44% -5% -20% -16%
Return on equity after tax excluding minorities p.a. -7% -33% -4% -14% -12%
Earnings per Share -0.4 -16 -0.7 -21 -24
Diluted Earnings per Share -0.4 -16 -0.7 -21 -24
Net assets value per Share 26 186 26 186 27
Share price end of period 7.1 48 7.1 48.0 14.2
Share price/Net asset value 0.27 0.26 0.27 0.26 0.53
Number of shares end of period ('000) 173,358 16,929 173,358 16,929 173,079
Average number of shares ('000) 173,358 16,882 173,358 16,882 16,882

Alm. Brand A/S – Q3 2011
Page 5 of 33
The Alm. Brand A/S Group Financial results
The Alm. Brand A/S Group posted a profit before tax and before losses and writedowns in the bank of DKK 36 million for the third quarter of 2011. In-cluding losses and writedowns, the group incurred a loss of DKK 95 million. For the year to date, Alm. Brand A/S posted a pro-fit of DKK 197 million before tax and before losses and writedowns, against a profit of DKK 255 mil-lion for the same period of 2010. Including losses and writedowns, the company incurred a loss of DKK 160 million, against a loss of DKK 496 million in 2010. The performance was favourably impacted by a general improvement of the claims experience in spite of many weather-related claims, a positive development of the life insurance activities and a sustained decline in costs. The performance was adversely affected by value adjustments, substantial financing costs and de-clining interest income due to the bank's winding up of parts of its lending portfolio. The group’s overall costs amounted to DKK 965 million for the year to date, a fall of 13% relative to the same period of last year. Non-life insurance The group's non-life insurance activities continue to develop positively and ahead of expectations. Accordingly, the combined ratio was 95.7 for the third quarter and 93.0 for the year to date in spite of net expenses of DKK 141 million for the 2 July cloudburst. Before reinsurance recoveries, claims expenses in relation to the cloudburst amounted to DKK 500 million. Claims expenses for the underlying business as well as for major claims declined, while costs con-tinued to fall. The expense ratio was thus 15.7 for the year to date. In the same period of last year, it was 17.3. Banking In line with expectations, the bank's third quarter operating performance was adversely affected by value adjustments due to sustained turmoil in the financial markets and by falling net interest in-come due to a combination of higher financing costs and declining interest income as a result of the winding up of parts of the bank's lending port-folio.
The financial results were thus adversely affected by the bank's substantial expenses for the state-guaranteed bonds and for the hybrid Tier 1 capital raised under Bank Package II. The bank's performance for the year to date was impacted by expenses paid to the Danish Guaran-tee Scheme for Depositors and Investors in con-nection with a number of bank closures and bank-ruptcies in a total amount of DKK 34 million. The bank had a substantial amount of excess li-quidity of approximately DKK 7 billion, equivalent to an excess cover of 346% relative to the statu-tory requirement. The bank's impairment writedowns on loans de-veloped in line with expectations, but they remain high. The bank has resolved to raise the individual sol-vency need, primarily for the agricultural segment but also slightly for the private customer segment. The increase is implemented due to the greater uncertainty about future developments in these two areas, although this has not yet led to addi-tional losses and writedowns. The bank's capital base exceeded the individual solvency need by 3.1 percentage points. Life insurance Life insurance and pension activities also perfor-med ahead of expectations, supported by good expense and risk results. As a result of its prudent investment strategy, the company also achieved a bonus rate of 3.1% in spite of the turmoil in the financial markets. Ac-cordingly, there was no need to introduce a trans-fer and surrender charge. For the group as a whole, payments into pension schemes rose by 13% for the year to date. Other business activities Other business activities, consisting primarily of corporate expenses, performed in line with expec-tations at a pre-tax loss of DKK 39 million for the year to date, against a loss of DKK 36 million for the same period of 2010. Group For the year to date, the group had an average of 1,570 employees, compared with 1,724 in the same period of 2010.
Alm. Brand A/S – Q3 2011
Page 6 of 33
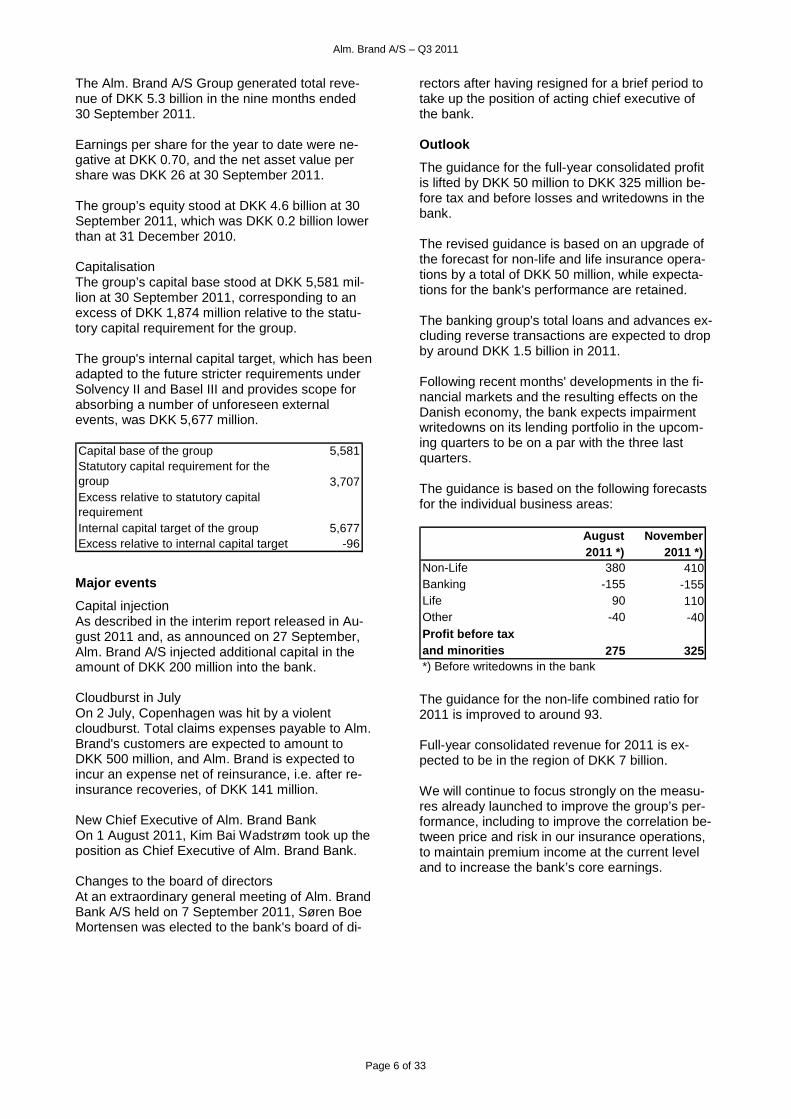
The Alm. Brand A/S Group generated total reve-nue of DKK 5.3 billion in the nine months ended 30 September 2011. Earnings per share for the year to date were ne-gative at DKK 0.70, and the net asset value per share was DKK 26 at 30 September 2011. The group’s equity stood at DKK 4.6 billion at 30 September 2011, which was DKK 0.2 billion lower than at 31 December 2010. Capitalisation The group’s capital base stood at DKK 5,581 mil-lion at 30 September 2011, corresponding to an excess of DKK 1,874 million relative to the statu-tory capital requirement for the group. The group's internal capital target, which has been adapted to the future stricter requirements under Solvency II and Basel III and provides scope for absorbing a number of unforeseen external events, was DKK 5,677 million. Capital base of the group 5,581Statutory capital requirement for the group 3,707Excess relative to statutory capital requirementInternal capital target of the group 5,677Excess relative to internal capital target -96
Major events
Capital injection As described in the interim report released in Au-gust 2011 and, as announced on 27 September, Alm. Brand A/S injected additional capital in the amount of DKK 200 million into the bank. Cloudburst in July On 2 July, Copenhagen was hit by a violent cloudburst. Total claims expenses payable to Alm. Brand's customers are expected to amount to DKK 500 million, and Alm. Brand is expected to incur an expense net of reinsurance, i.e. after re-insurance recoveries, of DKK 141 million. New Chief Executive of Alm. Brand Bank On 1 August 2011, Kim Bai Wadstrøm took up the position as Chief Executive of Alm. Brand Bank. Changes to the board of directors At an extraordinary general meeting of Alm. Brand Bank A/S held on 7 September 2011, Søren Boe Mortensen was elected to the bank's board of di-
rectors after having resigned for a brief period to take up the position of acting chief executive of the bank. Outlook
The guidance for the full-year consolidated profit is lifted by DKK 50 million to DKK 325 million be-fore tax and before losses and writedowns in the bank. The revised guidance is based on an upgrade of the forecast for non-life and life insurance opera-tions by a total of DKK 50 million, while expecta-tions for the bank's performance are retained. The banking group's total loans and advances ex-cluding reverse transactions are expected to drop by around DKK 1.5 billion in 2011. Following recent months' developments in the fi-nancial markets and the resulting effects on the Danish economy, the bank expects impairment writedowns on its lending portfolio in the upcom-ing quarters to be on a par with the three last quarters. The guidance is based on the following forecasts for the individual business areas:
August November2011 *) 2011 *)
Non-Life 380 410Banking -155 -155Life 90 110Other -40 -40Profit before taxand minorities 275 325*) Before writedowns in the bank The guidance for the non-life combined ratio for 2011 is improved to around 93. Full-year consolidated revenue for 2011 is ex-pected to be in the region of DKK 7 billion. We will continue to focus strongly on the measu-res already launched to improve the group’s per-formance, including to improve the correlation be-tween price and risk in our insurance operations, to maintain premium income at the current level and to increase the bank’s core earnings.

Alm. Brand A/S – Q3 2011
Page 7 of 33
Disclaimer The forecast is based on the interest rate and price levels that prevailed at 30 September 2011. All other forward-looking statements are based exclusively on the information available when this interim report was released. This announcement contains forward-looking state-ments regarding the company’s expectations for future financial developments and results and other statements which are not historical facts. Such forward-looking statements are based on various assumptions and expectations which reflect the company’s current views and assumptions, but which are inherently subject to significant risks and uncertainties, including matters beyond the company’s control. Actual and future results and developments may differ materially from those contained or assumed in such statements. Matters which may affect the future development and results of the group as well as of the individual business areas include changes in economic conditions in the financial markets, legislative changes, changes in the competitive environment, in the reinsurance market and in the property mar-ket, unforeseen events, such as extreme weather conditions or terrorist events, bad debts, major changes in the claims experience, unex-pected outcomes of legal proceedings, etc. The above-mentioned risk factors are not exhaustive. Investors and others who base their decisions on the information contained in this report should independently consider any uncertainties of significance to their decision. This interim report has been translated from Danish into English. In the event of any discrepancy between the Danish-language version and the English-language version, the Danish-language version shall prevail.

Alm. Brand A/S – Q3 2011
Page 8 of 33
REPORT – NON-LIFE INSURANCE
Q3 Q3 Q1-Q3 Q1-Q3 Year
DKKm 2011 2010 2011 2010 2010
Gross premiums 1,229 1,201 3,567 3,559 4,762
Investment income on insurance business 8 6 35 25 33
Claims incurred -1,293 -904 -2,904 -2,839 -3,702
Underwriting management expenses -180 -207 -561 -652 -839
Profit from business ceded 297 4 147 -87 -136
Underwriting profit 61 100 284 6 118
Interest and dividends etc. 65 72 197 214 283
Capital gains/losses -43 -27 -49 -46 -22
Management expenses relating to
investment business -4 -5 -14 -15 -19
Interest on technical provisions -40 -36 -135 -120 -155
Profit on investments business after allocation of technical interest -22 4 -1 33 87
Other ordinary items 0 1 0 2 2
Profit before tax 39 105 283 41 207
Tax -10 -26 -70 -10 -51
Profit for the year 29 79 213 31 156
Run-off gains/losses 15 65 92 162 139
Technical provisions 7,717 7,399 7,717 7,399 6,920
Insurance assets 483 192 483 192 163
Shareholders' equity 2,021 1,683 2,021 1,683 1,808
Total assets 10,325 9,854 10,325 9,854 9,383
Gross claims ratio 105.2% 75.3% 81.4% 79.8% 77.8%
Gross expense ratio 14.7% 17.2% 15.7% 18.3% 17.6%
Net reinsurance ratio -24.2% -0.3% -4.1% 2.5% 2.8%
Combined ratio 95.7% 92.2% 93.0% 100.6% 98.2%
Operating ratio 95.1% 91.7% 92.1% 99.8% 97.6%
Return on equity before tax p.a. 8% 26% 20% 3% 12%
Return on equity after tax p.a. 6% 20% 15% 2% 9%
Financial results
Non-life insurance operations posted a profit of DKK 283 million before tax for the year to date, against DKK 41 million in the year-earlier period. The performance for the year to date was highly satisfactory and better than expected in spite of the DKK 141 million expense from the 2 July cloudburst. Non-life insurance operations continue to outper-form expectations. Claims expenses on the under-lying business as well as on major claims de-clined, while costs continued to fall. Finally, the
performance was favourably affected by run-off gains. The performance equalled a return on equity of 20% p.a. before tax, against a return of 3% p.a. in the year-earlier period. Third quarter Non-life insurance operations posted a profit of DKK 39 million before tax in Q3 2011, against a profit of DKK 105 million in Q3 2010. The per-formance was satisfactory in light of the cloud-burst expenses and was better than expected at

Alm. Brand A/S – Q3 2011
Page 9 of 33
the announcement of the half-year financial re-sults. The Q3 performance was lifted by higher premium income, lower expenses for major claims and lower costs. Moreover, the underlying business again outperformed expectations. The Q3 performance was adversely affected by the 2 July cloudburst, fewer run-off gains and a lower investment return compared with the same period of 2010. The performance for the third quarter equalled a return on equity of 8% p.a. before tax, against a return of 26% p.a. in Q3 2010. Premiums The year-to-date premium income was DKK 3,567 million, against DKK 3,559 million for the nine months ended 30 September 2010, an increase of 0.2%. Gross premiums totalled DKK 1,229 million in Q3, an increase of 2.3% on the year-earlier period. The increase in premium income was attributable to an adjustment of the method for calculating provisions for health and personal accident insu-rances at market value. The change resulted in a non-recurring income of DKK 25 million in Q3. Adjusted for this non-recurring effect, premium in-come was slightly higher than had been forecast in the half-year financial statements. Claims experience The year-to-date claims ratio including run-off gains was 81.4, against 79.8 in the same period of last year. The claims ratio for the year to date was ad-versely affected by the cloudburst that hit the Co-penhagen area on 2 July as well as by fewer run-off gains relative to the same period of 2010. The claims ratio was also favourably affected by lower expenses for major claims and by a better performance of the underlying business, which represents the overall claims expenses excluding major claims and weather-related claims. Overall, the claims ratio of the underlying busi-ness improved by 3.0 percentage points relative to the same period of last year. The improvement was driven by a number of per-formance-enhancing activities implemented by Alm. Brand since 2009, including premium ad-justments, changed terms, greater deductibles
and more precise risk assessments and better procurement contracts. The claims frequency continued to fall on most products, among other things, due to higher de-ductibles. The claims ratio was 105.2 in Q3 2011, compared with 75.3 in Q3 2010. Gross claims expenses from the 2 July cloudburst are estimated at DKK 500 million, which reduced the Q3 claims ratio by 40.6 percentage points. Moreover, the claims ratio was adversely affected by higher average expenses for minor claims than in the third quarter of 2010, especially on com-mercial building and motor insurances. The Q3 claims ratio was favourably affected by fewer minor claims and lower expenses for major claims than had been anticipated. Also, the claims frequency was lower than in the same period of last year. The decline in the number of burglary claims con-tinued. In the third quarter, Alm. Brand recorded a 20% decline in the number of claims reported relative to the third quarter of 2010. For the year to date, there was a 10% decline in the number of burglary claims reported. Weather-related claims Total expenses for weather-related claims amounted to DKK 537 million in Q3, against DKK 160 million in Q3 2010. Weather-related claims af-fected the gross claims ratio by 43.7 percentage points in Q3, compared with 13.3 percentage points in the year-earlier period. Alm. Brand's reinsurance programme covers the claims related to the 2 July cloudburst with reten-tion of DKK 75 million. To this should be added an aggregate premium of DKK 66 million to re-establish Alm. Brand's reinsurance cover. After reinsurance recoveries and premiums paid to re-establish the reinsurance cover, weather-related claims amounted to a net expense of DKK 177 million in Q3, against DKK 105 million in Q3 2010. The effect on the combined ratio was 5.7 percent-age points compared with the third quarter of 2010. For the year to date, weather-related claims af-fected the combined ratio by 8.0 percentage points after reinsurance recoveries and re-
Alm. Brand A/S – Q3 2011
Page 10 of 33
establishment of reinsurance cover, against 11.6 percentage points in 2010. Major claims For the year to date, total expenses for major claims after reinsurance recoveries amounted to DKK 229 million, compared with DKK 266 million in the same period of 2010, equivalent to 6.4 per-centage points of the combined ratio in 9M 2011 and 7.5 percentage points of the combined ratio in 9M 2010. Major claims after reinsurance recoveries amounted to DKK 67 million in Q3 2011, against DKK 85 million in Q3 2010. The performance was better than expected. Major claims affected the combined ratio by 5.4 percentage points, com-pared with 7.1 percentage points after reinsurance recoveries last year. Effect of interest rate fluctuations The discounting rate used for provisions was higher in 2011 to date than it was in the same pe-riod of 2010. This reduced the claims ratio by 0.2 of a percentage point for the year to date. Interest rates declined in the third quarter, and at 30 September 2011 interest rates were lower than they were at 30 September 2010. During the third quarter of 2011, however, average interest rates were slightly higher compared with the same pe-riod of 2010. The effect on the claims ratio in the third quarter was a reduction of 0.3 of a percent-age point relative to the third quarter of 2010. Run-off result The run-off result for the year to date amounted to a gain of DKK 92 million, against DKK 162 million in 2010. Gains were reported in the motor, per-sonal accident and building and house contents lines. The run-off result was a gain of DKK 15 million in Q3 2011, against a gain of DKK 65 million in Q3 2010. Net reinsurance ratio For the year to date, the net reinsurance ratio amounted to a 4.1% income, against a 2.5% ex-pense for the same period of 2010. The Q3 reinsurance result was a net income of DKK 297 million, equivalent to a net reinsurance ratio of 24.2%. In Q3 2010, the net reinsurance ra-tio was 0.3%, equivalent to an income of DKK 4 million for Alm. Brand. Expenses for claims related to the 2 July cloud-burst are estimated at DKK 500 million, of which reinsurers will cover DKK 425 million. Reinsuran-
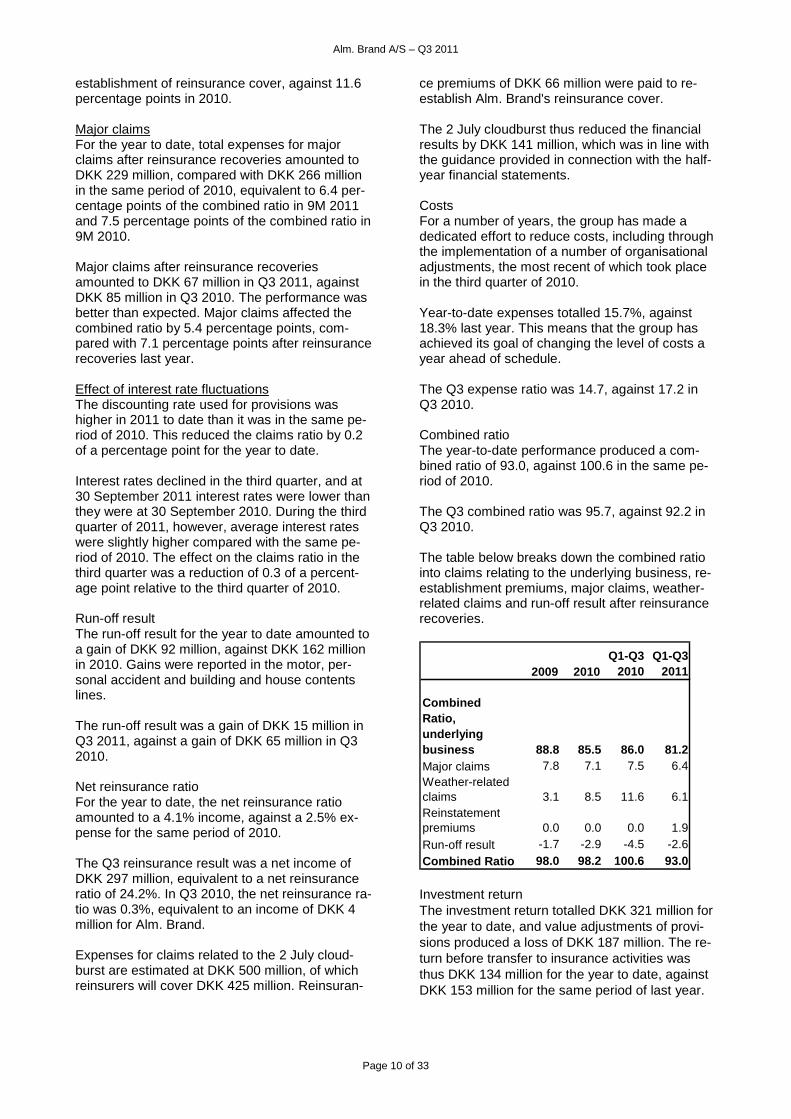
ce premiums of DKK 66 million were paid to re-establish Alm. Brand's reinsurance cover. The 2 July cloudburst thus reduced the financial results by DKK 141 million, which was in line with the guidance provided in connection with the half-year financial statements. Costs For a number of years, the group has made a dedicated effort to reduce costs, including through the implementation of a number of organisational adjustments, the most recent of which took place in the third quarter of 2010. Year-to-date expenses totalled 15.7%, against 18.3% last year. This means that the group has achieved its goal of changing the level of costs a year ahead of schedule. The Q3 expense ratio was 14.7, against 17.2 in Q3 2010. Combined ratio The year-to-date performance produced a com-bined ratio of 93.0, against 100.6 in the same pe-riod of 2010. The Q3 combined ratio was 95.7, against 92.2 in Q3 2010. The table below breaks down the combined ratio into claims relating to the underlying business, re-establishment premiums, major claims, weather-related claims and run-off result after reinsurance recoveries.
2009 2010Q1-Q3
2010Q1-Q3
2011
Combined Ratio, underlying business 88.8 85.5 86.0 81.2Major claims 7.8 7.1 7.5 6.4Weather-related claims 3.1 8.5 11.6 6.1Reinstatement premiums 0.0 0.0 0.0 1.9Run-off result -1.7 -2.9 -4.5 -2.6Combined Ratio 98.0 98.2 100.6 93.0 Investment return The investment return totalled DKK 321 million for the year to date, and value adjustments of provi-sions produced a loss of DKK 187 million. The re-turn before transfer to insurance activities was thus DKK 134 million for the year to date, against DKK 153 million for the same period of last year.

Alm. Brand A/S – Q3 2011
Page 11 of 33
The return after interest on technical provisions was negative at DKK 1 million, against a positive return of DKK 33 million in 2010. The non-life investment assets are predominantly placed in interest-bearing assets with an over-weight of mortgage bonds. Throughout the third quarter, the interest-bearing assets had a weighted duration of approximately two years. Alm. Brand intends, through the use of interest rate swaps, to roughly align the interest rate ex-posure on assets with the interest rate exposure on provisions. The non-life equity exposure was less than 1% of the investment assets in Q3 2011. Interest rates declined significantly during the third quarter of 2011, which resulted in positive value adjustments of assets. However, these positive value adjustments were outweighed by the nega-tive value adjustments of provisions in non-life in-surance resulting from the decline in interest rates. Value adjustments of assets and provisions contributed a net loss of DKK 43 million in Q3 2011. For the year to date, value adjustments of assets and provisions contributed a loss of DKK 49 mil-lion. Balance sheet
At 30 September 2011, the equity allocated to the non-life insurance business was DKK 2.0 billion. Alm. Brand Forsikring A/S had a solvency ratio of 2.9 at 30 September 2011, compared with 2.7 at 31 December 2010.
Major events
Cloudburst on 2 July The cloudburst on 2 July was the most severe single cloudburst event ever recorded in Den-mark. In aggregate, Alm. Brand received almost 8,000 claims related to this one event. In terms of num-bers, almost 56% of the claims reported were re-lated to residential dwellings and house contents, while the rest of the claims were related to the commercial segment. In terms of amounts, the commercial segment accounted for approximately 70% of the claims expenses.
Since the affected area is characterised by a large concentration of properties, heavy asphalting and a shortage of green areas suited for natural water drainage, the individual claims were greater than previously experienced. As a result, many of the group's customers, par-ticularly in the residential, office and retail property segments, experienced flooded basements and shop areas, triggering substantial expenses for the clearing and re-establishment of damaged buildings and inventories. In connection with the processing of the many claims, Alm. Brand's claims assessors also fo-cused on discussing preventative measures with the customers in connection with future claims – both in terms of construction and materials. Higher deductibles for commercial and agricultural customers In order to redress several years of unprofitable results on commercial and agricultural building in-surances, Alm. Brand changed its terms for this segment. Among other things, both existing and new customers will have higher deductibles in the future. Most of the portfolio is expected to be transferred to the new terms by the end of 2012. Workers' compensation In September 2011, Alm. Brand introduced a new workers' compensation insurance product. This product enables more precise risk assessments relative to the insured employees of Alm. Brand's customers. The more precise risk exposure will produce more competitive prices without affecting the level of earnings. The new workers' compen-sation product will also result in smoother proces-ses for writing new business for self-employed business operators, which is expected to benefit many of Alm. Brand's customers. Outlook
The full-year guidance for non-life operations is upgraded from a profit of DKK 380 million to a profit of DKK 410 million before tax. The upgrade is based on an improved performance of the un-derlying business, lower costs and run-off gains. Moreover, the combined ratio is expected to im-prove from 94 to around 93. The growth forecast is lifted from around minus 1% to 0 for the year as a whole.

Alm. Brand A/S – Q3 2011
Page 12 of 33
REPORT – BANKING
Q3 Q3 Q1-Q3 Q1-Q3 Year Q3 Q3 Q1-Q3 Q1-Q3 Year
DKKm 2011 2010 2011 2010 2010 2011 2010 2011 2010 2010
Interest receivable 222 250 669 703 954 224 254 676 720 974
Interest payable -131 -104 -376 -297 -416 -133 -105 -381 -301 -421
Net interest income 91 146 293 406 538 91 149 295 419 553
Net fees and commissions receivable and dividends, etc. 28 36 102 126 159 28 35 103 126 158
Net interest and fee income 119 182 395 532 697 119 184 398 545 711
Value adjustments -62 -138 -233 -217 -350 -88 -137 -275 -221 -351
Other operating income 7 7 25 16 23 6 7 24 17 23
Profit before expenses 64 51 187 331 370 37 54 147 341 383
Expenses and depreciation/amortisation -118 -140 -362 -397 -516 -119 -143 -364 -404 -523
Other operation costs 4 -23 -40 -65 -67 4 -22 -40 -66 -76Write-downs of loans, advances and receivables, etc. -107 -375 -288 -548 -668 -107 -375 -288 -548 -660
Profit from equity investments 1 -1 -1 19 12 1 -1 -1 19 11
Profit/loss before tax -156 -488 -504 -660 -869 -184 -487 - 546 -658 -865
Tax 36 119 125 184 222 37 119 125 184 222
Profit after tax -120 -369 -379 -476 -647 -147 -368 -421 -47 4 -643
Share attributable to minority interests - - - - - 27 -1 42 -2 -4
Profit after tax excluding minority interests - - - - - -120 -369 -379 -476 -647
Profit before tax excluding minority interests - - - - - -156 -488 -504 -660 -869
Loans and advances 11,240 14,286 11,240 14,286 12,738 11,061 14,010 11,061 14,010 12,485
Deposits 7,723 9,620 7,723 9,620 8,599 7,723 9,618 7,723 9,618 8,598
Shareholders' equity 1,633 886 1,633 886 1,564 1,766 1,076 1,766 1,076 1,759
Share attributable to minority interests - - - - - 133 190 133 190 195
Total assets 23,034 27,031 23,034 27,031 24,782 23,420 27,339 23,420 27,339 25,597
Average no. of employees (full-time equivalents) 289 336 290 349 327 289 336 287 349 327
Interest margin - - - - - 1.7% 2.4% 1.7% 2.4% 2.3%
Income/cost ratio 0.30 0.10 0.27 0.35 0.31 0.17 0.10 0.21 0.35 0.31
Impairment ratio 0.8% 2.1% 2.1% 3.1% 4.3% 0.8% 2.2% 2.2% 3.2% 4.3%
Solvency ratio - - - - - 20.6% 12.6% 20.6% 12.6% 18.8%
Return on equity before tax -39% -182% -45% -78% -81% -39% -182% -45% -78% -81%
Return on equity after tax -30% -138% -34% -57% -60% -30% -138% -34% -57% -60%
PRO RATA CONSOLIDATED FIGURES
In order to increase the transparency of Alm. Brand Bank A/S’ financial statements, the bank publishes pro rata consolidated figures. The figures are set out in the financial highlights and key ratios above and, unless otherwise indicated, the comments provided in the review below concern pro-rata figures. Banking group figures are commented on only when found relevant. To the extent it is dee-med relevant, Q1-Q3 2010 and Q3 2010, respectively, are used as benchmarks for Q1-Q3 2011 and Q3 2011, respectively.

Alm. Brand A/S – Q3 2011
Page 13 of 33
Financial results
The bank posted a loss of DKK 25 million before losses and writedowns in Q3 2011. The performance was highly unsatisfactory but in line with the guidance provided in the half-year fi-nancial statements. The performance was adversely affected by value adjustments due to sustained turmoil in the finan-cial markets and by falling net interest income due to a combination of substantial financing costs and declining interest income as a result of the winding up of parts of the bank's lending portfolio. After losses and writedowns, the bank incurred a loss of DKK 156 million before tax. Total impairment writedowns on loans, including credit-related losses and writedowns on mortgage deeds, amounted to DKK 131 million in Q3 2011. Losses and writedowns developed in line with ex-pectations, but they remain high. For the year to date, the bank posted a loss of DKK 504 million before tax, of which DKK 357 mil-lion was attributable to the bank's total impairment writedowns on loans. In the same period of last year, the bank incurred a loss of DKK 660 million after losses and writedowns. Net interest and fee income In Q3 2011, net interest and fee income totalled DKK 119 million, which was DKK 12 million lower than in Q2 2011. In Q3 2010, net interest and fee income amounted to DKK 182 million. Interest income and expenses In Q3 2011, net interest income totalled DKK 91 million, which was DKK 5 million lower than in Q2 2011. In Q3 2010, net interest income amounted to DKK 146 million. For the year to date, net interest income was DKK 293 million, against DKK 406 million for the same period of 2010. The decline in net interest income was attributable to a combination of lower interest income from lending due to the bank's strategy of winding up parts of the lending portfolio and generally higher funding costs due, among other things, to a bond issue secured against a government guarantee which was completed at the end of June 2010. The interest margins for the parent company and the banking group were 1.6% and 1.7%, respec-tively, in both Q2 and Q3 2011. The level of the in-terest margin is too low, and the bank's strategy
going forward is intended to raise the interest margin. The parent company and the banking group both had an interest margin of 1.7% for the year to date, against 2.1% and 2.3%, respectively, in 2010. Fee income and expenses In Q3 2011, net fee income totalled DKK 28 mil-lion, against DKK 36 million in Q3 2010. For the year to date, net fee income was DKK 102 million, against DKK 126 million for the same pe-riod of 2010. Value adjustments Value adjustments amounted to a DKK 62 million loss in Q3. For the year to date, value adjustments amounted to a loss of DKK 233 million, against a DKK 217 million loss in the same period of last year. Value adjustments in Q3 2011 were adversely af-fected by credit-related writedowns on the mort-gage deed portfolio in the amount of DKK 24 mil-lion. Excluding credit-related writedowns on mort-gage deeds, the bank thus posted a capital loss of DKK 38 million in Q3 2011. Value adjustments for the year to date were ad-versely affected by credit-related value adjust-ments of mortgage deeds in the amount of DKK 69 million. Interest-related value adjustments, ex-cluding credit-related writedowns on mortgage deeds, amounted to a loss of DKK 98 million for the year to date, of which DKK 13 million was re-lated to the third quarter. The capital loss was, among other things, due to the fact that the bank had taken positions in ex-pectation of rising interest rates in the second quarter and in the first half of the third quarter. The capital loss was thus primarily attributable to the turmoil in the financial markets and to the po-sitions taken by the bank. Today, the bank's excess liquidity is placed in bonds with short duration and in certificates of de-posit. Equity-related value adjustments amounted to a loss of DKK 33 million in Q3 and a loss of 65 mil-lion for the year to date. Of this amount, illiquid shares accounted for a loss of DKK 13 million in Q3 and DKK 43 million for the year to date. The bank’s equity portfolio is mainly composed of sector equities, while the trading portfolio of equi-

Alm. Brand A/S – Q3 2011
Page 14 of 33
ties makes up only a limited amount. In connec-tion with the winding up of distressed investment exposures, the bank acquired a number of illiquid shares in 2010 and 2011 on which it incurred capital losses in Q3 2011. The market value of the illiquid shares was just over DKK 100 million at 30 September 2011. Foreign exchange adjustments amounted to a gain of DKK 8 million in Q3 and a gain of 1 million for the year to date. Costs The bank's costs amounted to DKK 118 million in Q3 2011, against DKK 124 million in Q2 2011. For the year to date, costs totalled DKK 362 mil-lion, against DKK 397 million for the same period of 2010. Other operating expenses This item mainly comprises the bank's expenses for the Danish Guarantee Fund for Depositors and Investors. In Q3 2011, there was a net income of DKK 6 million attributable to the revised dividend from Amagerbanken and the bankruptcy of Max Bank. For the year to date, the bank's expenses due to the bankruptcies of Amagerbanken, Fjord-bank Mors and Max Bank totalled DKK 34 million. In 2010, the item primarily comprised the bank's expenses in connection with Bank Package I. Impairment of loans, etc. The bank’s impairment writedowns on loans amounted to DKK 288 million for the year to date, against DKK 548 million for the same period of 2010. In Q3 2011, impairment writedowns on loans amounted to DKK 107 million, compared with DKK 375 million in Q3 2010. In addition, the bank incurred credit-related losses and writedowns on its mortgage deed portfolio of DKK 24 million in Q3 2011 and of DKK 69 million for the year to date. These losses and writedowns are recognised under value adjustments but have been included in the table in the section “Lending portfolio” below, in which the lending portfolio and losses and writedowns are described in further detail. Total impairment writedowns on loans, including credit-related losses and writedowns on mortgage deeds, amounted to DKK 131 million in Q3 2011, against DKK 465 million in Q3 2010. For the year to date, total losses and writedowns, including credit-related losses and writedowns on mortgage deeds, amounted to DKK 357 million,
compared with DKK 751 million for the same pe-riod of 2010. Balance sheet Loans and advances, etc. The bank’s loans and advances amounted to DKK 11.2 billion at 30 September 2011, against DKK 12.7 billion at 31 December 2010. Consistent with its strategy, the bank expects to continue to reduce its total loans and advances going forward. Debt to credit institutions The bank’s debt to credit institutions amounted to DKK 5.5 billion at 30 September 2011, which was DKK 0.8 billion lower than at 31 December 2010. Deposits The bank's deposits amounted to DKK 7.7 billion at 30 September 2011, against DKK 7.9 billion at 30 June 2011 and DKK 8.6 billion at 31 December 2010. In spite of the decline in deposits, the bank's de-posit deficit fell from DKK 4.1 billion at 31 Decem-ber 2010 to DKK 3.5 billion at 30 September 2011. The bank's strategy is to continue to reduce the deposit deficit. Liquidity At 30 September 2011, the bank had excess li-quidity cover of 346% relative to the statutory re-quirement. This marked an increase from 319% at 30 June 2011 and 266% at 31 December 2010. The increase was attributable to the bank's signifi-cant reduction of its lending portfolio, which served to compensate for the decline in deposits. Capitalisation The bank’s equity stood at DKK 1.6 billion at 30 September 2011. The capital base totalled DKK 2.6 billion, and the risk-weighted items amounted to DKK 12.8 billion at 30 September 2011. Ac-cordingly, the solvency ratio was 20.3, and the Tier 1 capital ratio was 17.8. The bank has resolved to raise the individual sol-vency need, primarily for the agricultural segment but also slightly for the private customer segment. The increase is implemented due to the greater uncertainty about future developments in these two areas, although this has not yet led to addi-tional losses and writedowns. The bank's capital base exceeded the individual solvency need by 3.1 percentage points.

Alm. Brand A/S – Q3 2011
Page 15 of 33
Major events New Chief Executive of Alm. Brand Bank On 1 August 2011, Kim Bai Wadstrøm took up the position as Chief Executive of Alm. Brand Bank. Changes to the board of directors At an extraordinary general meeting of Alm. Brand Bank A/S held on 7 September 2011, Søren Boe Mortensen was elected to the bank's board of di-rectors after having resigned for a brief period to take up the position of acting chief executive of the bank.
Outlook The bank retains its expectations of a full-year loss of around DKK 155 million before losses and writedowns. The banking group's total loans and advances ex-cluding reverse transactions are expected to drop by around DKK 1.5 billion in 2011. The bank expects losses and writedowns in the upcoming quarters to be on a par with recent quarters. The relatively high level is mainly due to developments in the agricultural sector and dete-riorated conditions in the property and housing markets.

Alm. Brand A/S – Q3 2011
Page 16 of 33
LENDING PORTFOLIO The bank’s total writedowns and losses on the lending and guarantee portfolio amounted to an expense of DKK 131 million in Q3 2011. Of this amount, identified losses amounted to DKK 25 million. For the year to date, total writedowns and identi-fied losses amounted to DKK 357 million. Of this amount, identified losses totalled DKK 87 million. In addition, losses in the amount of DKK 364 mil-lion were identified for the year to date, but since provisions have previously been made to cover these losses, they will have no impact on opera-tions in 2011. Identified losses, for which provi-sions have previously been made, were attribut-able to lending commitments on which the bank is close to incurring or has already incurred a loan loss as well as to the guarantee provided in con-nection with Bank Package II. The banking group's accumulated writedowns at 30 September 2011 were on a par with 31 De-cember 2010, but due to the reduction of lending and guarantees during the year, accumulated writedowns rose from 9.2% at 31 December 2010 to 9.4% at 30 September 2011. The table below shows a consolidated segment-by-segment breakdown of the bank’s lending port-folio. The individual segments have been calcu-lated for the banking group.
The table also shows pro rata consolidated loans and advances which are reviewed in the report on the bank. The table reflects the bank's strategy by breaking down loans and advances on a continuing portfo-lio and a winding-up portfolio. Total losses and writedowns charged to the in-come statement equalled 3.1% of the average lending portfolio for the banking group excluding reverse transactions made for the year to date. The overall lending portfolio amounted to DKK 11.0 billion, which including losses and write-downs was a decline of DKK 1.3 billion relative to 31 December 2010. Adjusted for losses and write-downs, the lending portfolio declined by DKK 0.9 billion. At 30 September 2011, DKK 7.8 billion was being wound up, equivalent to approximately 70% of the overall lending portfolio. The performance of the individual lending seg-ments in the first nine months of 2011 is reviewed in the following sections. The loss and impairment ratio is calculated relative to average lending du-ring the period.
Loans Total loss and writedowns
DKKm 31.12.2010 30.09.2011 2010 Q1 2011 Q2 2011 Q3 2011Q1-Q3
2011
Continuing portfolio
Lending to private customers 3,318 3,013 26.8% 29 25 11 4 40 1.3%
Other lending **) 176 145 1.3% 0 0 0 0 0 0.0%
Winding-up portfolio
Agriculture 1,199 1,221 10.9% 74 35 11 27 73 6.0%
Car finance 736 466 4.1% 13 2 2 0 4 0.7%
Commercial lending 2,230 1,921 17.1% 57 14 -4 40 50 2.4%
Property development projects 492 433 3.9% 61 0 8 2 10 2.2%
Mortgage deed financing 1,936 626 5.6% 380 36 40 34 110 8.6%
Mortgage deeds 2,190 3,154 28.1% 264 16 29 24 69 2.6%
Bank packages etc. - - - 46 1 -1 0 1 -
12,277 10,979 97.7% 924 129 96 131 357 3.1%
Reverse Transactions including
207 82 0.7% - - - - - -
Total group lending 12,484 11,061 98.4% 924 129 96 131 357 3 .0%
Minority interests 254 179 1.6% -16 - - - - -
Total prorata 12,738 11,240 100.0% 908 129 96 131 357 3.0%
*) Losses and writedowns as a percentage of the average portfolio in Q1-Q3 2011. The percentage is not comparable with the
impairment ratio in the bank's financial highlights and key ratios.
**) Fleet management (operating leases) is not included, as it is recognised as other property, plant and equipment and not as loans and advances.
Share of portfolio (%) Loss ratio *)
intercompany transactions
Total group lending - excl. Reverse Transactions

Alm. Brand A/S – Q3 2011
Page 17 of 33
Continuing portfolio Lending to private customers The portfolio consists of loans and advances to private customers and is geographically diversi-fied across Denmark. The portfolio is calculated inclusive of car loans to private customers and represents the majority of the bank's continuing loans and advances. Total loans and advances to private customers declined by DKK 305 million from 31 December 2010 to 30 September 2011. For the year to date, losses and writedowns amounted to DKK 40 mil-lion, equivalent to 1.3% of the average portfolio. Other lending This segment covers loans to investment credit facilities for which the investment mandate is placed with Alm. Brand Markets. These invest-ment credit facilities form part of the bank's con-tinuing loans and advances, whereas other in-vestment credit facilities are being wound up. Other loans and advances declined by DKK 31 million relative to 31 December 2010. No losses or writedowns were identified in this segment in the nine months ended 30 September 2011. Winding-up portfolio Consistent with the bank’s strategy, new custo-mers are not accepted in these segments, and the business volume with existing customers is ex-pected to be wound up over an extended period of time. Focus is on completing a controlled and efficient winding-up process for the lending segments be-ing discontinued. Agriculture The portfolio at 30 September 2011 was on a par with 31 December 2010. For the year to date, losses and writedowns amounted to DKK 73 mil-lion, equivalent to 6.0% of the average portfolio. The level of losses and writedowns reflects the continuing difficult conditions affecting agricultural customers. Car finance This portfolio has declined because the bank no longer provides financing through car dealers etc. These loans typically have a maximum term of five years, and most of the loans are expected to be settled over the next couple of years. The overall portfolio declined by DKK 270 million during the period from 31 December 2010 to 30 September 2011 to stand at DKK 466 million. For the year to date, losses and writedowns amounted to DKK 4 million, equivalent to 0.7% of the avera-ge portfolio.
Commercial customers This portfolio consists of loans for financing of in-vestment properties, loans to small businesses and syndicated loans to medium-sized Danish businesses. The overall portfolio declined by DKK 309 million from 31 December 2010 to 30 September 2011. For the year to date, losses and writedowns amounted to DKK 50 million, equivalent to 2.4% of the average portfolio. Writedowns during the quar-ter were affected by a single large commitment. Property development projects The portfolio consists of a limited number of pro-perty development projects. The bank will only fi-nance the completion of ongoing projects pursu-ant to existing agreements. The portfolio declined by DKK 59 million from 31 December 2010 to 30 September 2011. For the year to date, losses and writedowns amounted to DKK 10 million, equivalent to 2.2% of the average portfolio. Mortgage deed financing This portfolio consists of investment exposures secured against mortgage deeds. The portfolio declined by DKK 1.3 billion from 31 December 2010 to 30 September 2011. The de-cline was primarily attributable to the bank winding up a number of investment exposures. In that connection, the bank has taken over the mortgage deeds provided as security. For the year to date, losses and writedowns amounted to DKK 110 million, equivalent to 8.6% of the average portfolio. The writedowns were attributable to mortgage deed debtors defaulting on their loans and to a declining excess cover on the exposures as a re-sult of price falls on mortgage deeds provided as security. Mortgage deeds This segment comprises the bank’s own portfolio of private and commercial mortgage deeds. Private mortgage deeds amounted to DKK 2,277 million, comprising the bank’s portfolio of mort-gage deeds secured primarily against single-family houses, commonhold flats and summer houses. The properties are located throughout Denmark. Commercial mortgage deeds amounted to DKK 877 million, comprising the bank’s portfolio of commercial mortgage deeds secured against residential rental property, commercial property for office, trade and industrial use as well as land and mixed residential/commercial property.

Alm. Brand A/S – Q3 2011
Page 18 of 33
The portfolio is marked to market on a current ba-sis using a cash flow-based pricing model, which considers factors such as estimated early re-demptions and credit losses. Individual write-downs are taken on all mortgages in arrears or known to be showing signs of weakness. This portfolio is being wound up, but new mort-gage deeds may be added when the bank winds up an investment facility whose collateral security consists wholly or partly of mortgage deeds.
In that connection, the portfolio increased by DKK 964 million from 31 December 2010 to 30 Sep-tember 2011. For the year to date, losses and writedowns amounted to DKK 69 million, equiva-lent to 2.6% of the average portfolio. Bank packages etc. The guarantee of DKK 107 million provided to Fi-nansiel Stabilitet A/S was settled in the first quar-ter of 2011.

Alm. Brand A/S – Q3 2011
Page 19 of 33
REPORT – LIFE INSURANCE
Q3 Q3 Q1-Q3 Q1-Q3 Year
DKKm 2011 2010 2011 2010 2010
Premiums 126 151 455 499 719
Claims incurred -231 -236 -791 -788 -1,056
Investment return after allocation of interest 465 323 548 962 786
Total underwriting management expenses -19 -18 -54 -54 -73
Profit on business ceded -6 -3 3 5 2
Change in life insurance provisions -473 -189 -289 -373 65
Change in collective bonus potential 162 -4 210 -122 -292
Underwriting profit/loss 24 24 82 129 151
Return on investments allocated to equity 14 6 18 30 30
Profit before tax 38 30 100 159 181
Tax -9 -8 -25 -40 -50
Profit after tax 29 22 75 119 131
Result in life insurance
Administrative result 0 2 11 9 11
Investment result 481 404 398 911 521
Change in provision for guaranteed pension benefits -608 -380 -572 -671 -109
Change in collective bonus potential 162 -4 210 -122 -292
Risk result 9 11 50 27 48
Profit on business ceded -6 -3 3 5 2
Profit before tax 38 30 100 159 181
Tax -9 -8 -25 -40 -50
Profit after tax 29 22 75 119 131
Total technical provisions 11,574 11,764 11,574 11,764 11,493
Shareholders' equity 997 1,111 997 1,111 1,122
Total assets 13,309 14,336 13,309 14,336 13,131
Return on equity before tax p.a. 15% 23% 13% 19% 17%
Return on equity after tax p.a. 11% 17% 10% 15% 12%
Bonus rate 3.1% 3.4% 3.1% 3.4% 5.1%
Financial results
Life insurance operations posted a profit of DKK 38 million before tax in Q3 2011, against DKK 30 million in Q3 2010. For the year to date, profit was DKK 100 million before tax, against DKK 159 million in 2010. The performance was highly satisfactory and better than expected. The difference in the results reported for the nine months ended 30 September 2011 and the same period of 2010 was primarily due to a DKK 56 million reversal from the shadow account.
The performance for the year to date equalled a return on equity before tax of 13% p.a., com-pared with 19% p.a. in the year-earlier period. New principles for calculating return The principles for calculating the return on equity have been changed for 2011 as a result of the changed contribution rules. As from 1 January 2011, customers are divided into a number of contribution groups based on in-terest rate, insurance risk and expenses. The risk premium on shareholders' equity is calcu-lated separately for each group. Similarly, any shadow account, collective bonus potential, transfer and surrender charge, etc. will be de-termined separately for each contribution group.

Alm. Brand A/S – Q3 2011
Page 20 of 33
The risk premium for 2011 has been determined as follows:
• Interest rate groups: 0.1% of the average life insurance provisions net of reinsu-rance exclusive of collective bonus po-tential and any use of the bonus poten-tial on paid-up policies;
• Insurance risk groups: 100% of the risk result net of reinsurance after bonuses;
• Expense groups: 100% of the expense result net of reinsurance after bonuses.
In the nine months ended 30 September 2011, no risk premium was allocated to shareholders' equity for any of the interest rate groups, but the full risk premium was allocated for all risk and expense groups. The outstanding risk premium for the four interest rate groups of DKK 8 million was transferred to the respective shadow ac-counts, which had a combined balance of DKK 8 million at 30 September 2011. Premiums Gross premiums fell by 17% to DKK 126 million in Q3 2011 from DKK 151 million in Q3 2010. For the year to date, gross premiums fell by 9% to DKK 455 million, from DKK 499 million for the same period of 2010. The decline for the year was attributable to both single premiums and re-gular premiums. The total amount of pension contributions, in-cluding investment schemes with the bank and premium income in the life insurance company rose by 17% to DKK 226 million in Q3 2011 from DKK 193 million in Q3 2010. Year-to-date contri-butions rose by 13% to DKK 719 million, against DKK 634 million in the same period of last year. The group aims for the life insurance company, Alm. Brand Liv og Pension, to generate growth and for an increasing proportion of overall pen-sion savings to be placed in the Alm. Brand In-vestment Scheme, which has been set up with Alm. Brand Bank. This strategy has produced a highly satisfactory 94% increase in contributions to investment schemes in the bank. On the other hand, the de-velopment in premium income in the life insuran-ce company's guaranteed schemes was not sa-tisfactory. New agreements in the life insurance company are placed in an interest rate group in which the composition of investments is roughly as follows: equities 20%, properties 15% and bonds 65%. This composition and the low level of investment costs involved are considered to be attractive for a large part of the customer base.
This is expected to make a positive contribution to growth in the life insurance company going forward. Investment return The return on investment assets belonging to po-licyholders was DKK 665 million for the year to date, corresponding to a return of 5.6% (7.4% p.a.), against a return of DKK 1,148 million for the same period of 2010. The return was made up before tax on pension returns but after fi-nance costs. The return on financial instruments for (partial) hedging of insurance obligations was affected by falling interest rates. The portfolio consists of swaps and swaptions, which have produced sig-nificant capital gains. The return on the bond portfolio was favourably affected by the sustained decline in interest rates and in turn by the rising prices on the bond port-folio in the third quarter. The return was not en-tirely satisfactory relative to the benchmark, as investments were made at a lower interest rate risk, i.e. with a shorter duration, than the bench-mark. The return on the equity portfolio was adversely affected by the general equity market trends of the third quarter of 2011. The total equity return for Q3 was a loss of DKK 254 million. For the year to date, the return on the equity portfolio was a loss of 246 million. The return was not en-tirely satisfactory, as the portfolio was overweight in equities relative to the benchmark. The return on the portfolio of properties was above expectations, primarily due to positive a value adjustment. The valuation of properties is based on assessments made by independent estate agents. The company's properties are valued at an average rate of return of 6.1%. The return on investment assets attributable to shareholders’ equity was DKK 18 million for the nine months ended 30 September 2011, equiva-lent to a return of 1.6% (2.1% p.a.), against a re-turn of DKK 30 million in the same period of last year. Investments of shareholders’ equity are placed in short-term interest-bearing assets. This return was acceptable considering the low yield level for short-term bonds. Benefits paid Benefits paid in Q3 2011 amounted to DKK 231 million, against DKK 236 million in 2010. For the year to date, the benefits paid amounted to DKK 791 million, against DKK 788 million for the same period of 2010.

Alm. Brand A/S – Q3 2011
Page 21 of 33
Life insurance provisions Life insurance provisions are calculated using a market value principle that applies an expected cash flow discounted by the adjusted yield curve published by the Danish FSA for discounting provisions. Total provisions for the year to date increased by DKK 289 million. Collective bonus potential The collective bonus potential declined by DKK 162 million in Q3 2011 to a total of DKK 307 mil-lion, corresponding to an average bonus rate of 3.1%. The collective bonus potential declined for all in-terest rate groups, but it remains positive. For the interest rate groups with the lowest basic rates of interest, the decline was mainly due to the equity portfolio. For the interest rate group with the highest basic rates of interest, the decline was mainly due to insurance obligations not being ful-ly hedged against interest rate declines. Costs Acquisition and administrative expenses totalled DKK 19 million in Q3 2011, against DKK 18 mil-lion in Q3 2010. Expenses for the year to date amounted to DKK 54 million, which was equiva-lent to the same period of last year. Total expenses for 2011 to date were slightly lo-wer than anticipated, due to a lower-than-expec-ted level of new business written in traditional guaranteed products and thus lower-than-expec-ted acquisition costs. Expense and risk results Net of reinsurance, the expense result, which expresses the difference between expense loa-ding and expenses incurred, was positive at DKK 9 million for the year to date. The overall expen-se result was satisfactory. The aim is for the overall expense result to be positive. Net of reinsurance, the risk result, which ex-presses the difference between risk premiums and actual claims expenses, was positive at DKK 60 million for the year to date. The overall risk result was highly satisfactory.
Balance sheet
The life group’s shareholders’ equity was DKK 997 million at 30 September 2011. The solvency ratio was 236 at 30 September 2011. Major events
Financial turmoil In spite of declining equity markets, declining in-terest rates and increased volatility in the financial markets, there was no need to introduce a trans-fer and surrender charge. The financial buffers were reduced, but they remain positive. The overall investment strategy was maintained during the period. However, there was a slight re-alignment of the interest rate groups to the effect that the equity portfolio was reduced in interest group 3 (the group with the highest basic rates of interest), while the equity portfolio was increased accordingly for interest groups 0 and 1 (the groups with the lowest basic rates of interest). Significant events after the end of the report-
ing period
Reduction of cost rates With effect from 1 October 2011, the company re-duced the costs payable by customers as a per-centage of their premiums. On the other hand, the fixed monthly cost was increased. Customers who set up a scheme with regular premiums may now transfer existing savings from other companies to Alm. Brand Liv og Pension free of charge. Overall, costs have been reduced, and compari-sons made using the new online 'cost meters' in-dicate that the company is very competitive. As a result, the low costs are expected to make a positive contribution to growth in the life insurance company. Outlook
Alm. Brand Liv og Pension expects a full-year profit of DKK 110 million before tax, equivalent to an upgrade of DKK 20 million. The guidance for 2011 does not include recogni-tion of the full risk premium for all interest rate groups. However, this will have no significant im-pact on the profit for the year.

Alm. Brand A/S – Q3 2011
Page 22 of 33
STATEMENT BY THE BOARD OF DIRECTORS AND THE MANAGEMENT BOARD
The Board of Directors and the Management Board have today considered and adopted the in-terim report of Alm. Brand A/S for the nine months ended 30 September 2011. The consolidated financial statements have been prepared in accordance with IAS 34 “Interim Fi-nancial Reporting” as adopted by the EU, and the interim financial statements of the parent com-pany have been prepared in accordance with the Danish Financial Business Act. In addition, the in-terim report has been presented in accordance with additional Danish disclosure requirements for listed financial enterprises.
In our opinion, the accounting policies applied are appropriate, and the interim report gives a true and fair view of the group’s and the parent com-pany’s assets, liabilities and financial position at 30 September 2011 and of the results of the group’s and the parent company’s operations and the group’s cash flows for the nine months ended 30 September 2011. The Management's review also gives a true and fair view of developments in the activities and fi-nancial position of the group and a true and fair description of significant risk and uncertainty fac-tors that may affect the group.
MANAGEMENT BOARD Copenhagen, 16 November 2011 Søren Boe Mortensen Chief Executive BOARD OF DIRECTORS Copenhagen, 16 November 2011 Jørgen H. Mikkelsen Boris N. Kjeldsen Tage Benjaminsen Chairman Deputy Chairman Henrik Christensen Per Dahlbom Per V. H. Frandsen Arne Nielsen Jan S. Pedersen Helle L. Frederiksen Henning Kaffka Susanne Larsen

Alm. Brand A/S – Q3 2011
Page 23 of 33
BALANCE SHEET Group
30 September 30 September 31 December
DKKm 2011 2010 2010
AssetsIntangible assets 56 91 82
Owner-occupied properties 1,077 1,032 1,030
Deferred tax assets 699 665 660
Participating interests in joint ventures 35 35 35
Reinsurers' share of insurance contracts 509 226 190
Current tax assets 4 14 2
Other assets 1,322 1,544 2,006
Loans 11,061 12,879 12,485
Investment properties 421 440 451
Investment assets 25,624 31,790 29,292
Amounts due from credit institutions and central banks 5,983 847 1,537
Cash in hand and demand deposits 38 106 379
Total assets 46,829 49,669 48,149
Liabilities and equityShare capital 1,735 1,388 1,735
Reserves, retained profit etc. 2,741 1,760 2,863
Minority interests 107 156 160
Consolidated shareholders' equity 4,583 3,304 4,758
Subordinated debt 1,828 1,828 1,828
Provisions for insurance contracts 19,291 19,164 18,413
Other provisions 31 163 131
Deferred tax liabilities 46 46 46
Issued bonds 6,032 6,032 6,032
Other liabilities 1,242 1,709 1,751
Deposits 7,610 9,207 8,602
Payables to credit institutions and central banks 6,166 8,216 6,588
Total liabilities and equity 46,829 49,669 48,149
Note 1 Own shares
Note 2 Contingent liabilities, guaranties and leasing
Note 3 Accounting policies
Note 4 Financial highlights and key ratios
Alm. Brand A/S – Q3 2011
Page 24 of 33
INCOME STATEMENT Group
Q3 Q3 Q1-Q3 Q1-Q3 Year
DKKm 2011 2010 2011 2010 2010
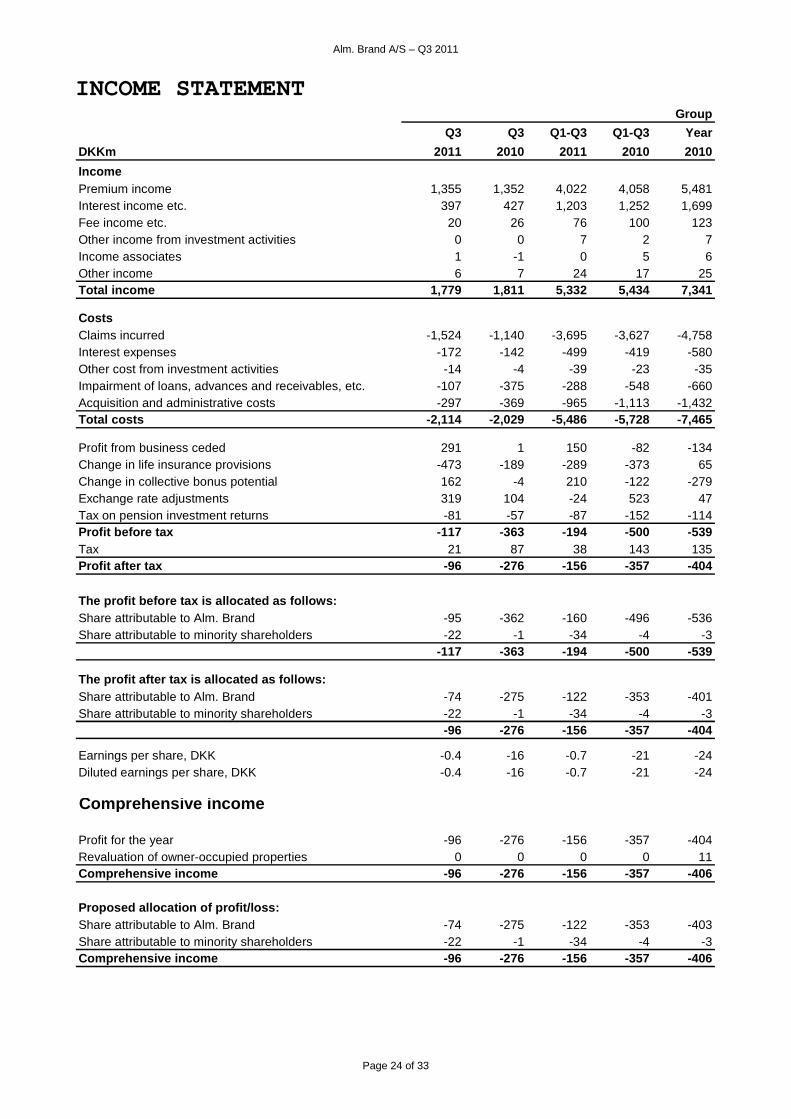
IncomePremium income 1,355 1,352 4,022 4,058 5,481Interest income etc. 397 427 1,203 1,252 1,699Fee income etc. 20 26 76 100 123Other income from investment activities 0 0 7 2 7Income associates 1 -1 0 5 6Other income 6 7 24 17 25Total income 1,779 1,811 5,332 5,434 7,341
CostsClaims incurred -1,524 -1,140 -3,695 -3,627 -4,758Interest expenses -172 -142 -499 -419 -580Other cost from investment activities -14 -4 -39 -23 -35Impairment of loans, advances and receivables, etc. -107 -375 -288 -548 -660Acquisition and administrative costs -297 -369 -965 -1,113 -1,432Total costs -2,114 -2,029 -5,486 -5,728 -7,465
Profit from business ceded 291 1 150 -82 -134Change in life insurance provisions -473 -189 -289 -373 65Change in collective bonus potential 162 -4 210 -122 -279Exchange rate adjustments 319 104 -24 523 47Tax on pension investment returns -81 -57 -87 -152 -114Profit before tax -117 -363 -194 -500 -539Tax 21 87 38 143 135Profit after tax -96 -276 -156 -357 -404
The profit before tax is allocated as follows:Share attributable to Alm. Brand -95 -362 -160 -496 -536Share attributable to minority shareholders -22 -1 -34 -4 -3
-117 -363 -194 -500 -539
The profit after tax is allocated as follows:Share attributable to Alm. Brand -74 -275 -122 -353 -401Share attributable to minority shareholders -22 -1 -34 -4 -3
-96 -276 -156 -357 -404
Earnings per share, DKK -0.4 -16 -0.7 -21 -24Diluted earnings per share, DKK -0.4 -16 -0.7 -21 -24
Comprehensive income
Profit for the year -96 -276 -156 -357 -404Revaluation of owner-occupied properties 0 0 0 0 11Comprehensive income -96 -276 -156 -357 -406
Proposed allocation of profit/loss:Share attributable to Alm. Brand -74 -275 -122 -353 -403Share attributable to minority shareholders -22 -1 -34 -4 -3Comprehensive income -96 -276 -156 -357 -406

Alm. Brand A/S – Q3 2011
Page 25 of 33
STATEMENT OF CHANGES IN EQUITY
Reva- Other Share- Consoli-Share Contingency luation provi- Retained holders' Minority dated
DKKm capital funds reserve sions profit equity interests equity
Shareholders equity, 01.01.2010 1,388 182 2 0 1,923 3,495 199 3,694
Changes in equity Q1-Q3 2010
Profit/loss for the period -353 -353 -4 -357
Revaluation of owner-occupied properties -2 -2
Total income 0 0 0 0 -353 -355 -4 -359
Repurchased shares 8 8 8Change in share attributable to minority interest -39 -39
Changes in equity 0 0 0 0 -345 -347 -43 -390Shareholders equity, 30.09.2010 1,388 182 2 0 1,578 3,148 156 3,304
Shareholders equity, 01.01.2010 1,388 182 2 0 1,923 3,495 199 3,694
Changes in equity 2010
Profit/loss for the year -401 -401 -3 -404
Revaluation of owner-occupied properties -2 13 11 11
Transferred to collective bonus potential -13 -13 -13
Total income 0 0 -2 0 -401 -403 -3 -406Reduction of capital on 11 November 2010 -1,215 1,215 0 0
Share issue on 30 December 2010 1,562 1,562 1,562
Cost relating to share issue -63 -63 -63
Purchase and sale of treasury shares 9 9 9Purchase and sale of treasury shares in subsidiaries -2 -2 -2 -4Change in share attributable to minority interest 0 0 -34 -34
Changes in equity 347 0 -2 1,215 -457 1,103 -39 1,064
Shareholders equity, 31.12.2010 1,735 182 0 1,215 1,466 4 ,598 160 4,758
Shareholders equity, 01.01.2011 1,735 182 0 1,215 1,466 4 ,598 160 4,758
Changes in equity Q1-Q3 2011Profit/loss for the period -122 -122 -34 -156
Total income 0 0 0 0 -122 -122 -34 -156
Purchase and sale of treasury shares 3 3 3Purchase and sale of treasury shares in subsidiaries -4 -4 -8 -12
Tax on changes recognised in equity 1 1 1
Change in share attributable to minority interest 0 0 -11 -11
Changes in equity 0 0 0 0 -122 -122 -53 -175Shareholders equity, 30.09.2011 1,735 182 0 1,215 1,344 4 ,476 107 4,583
30 September 31 December2011 2010
Shareholders' equity exclusive minority interests 4,476 4,598
Consolidation of Pensionskassen under Alm. Brand A/S 0 -8
4,476 4,590
Share of profit attributable to Alm. Brand A/S -122 -401Consolidation of Pensionskassen under Alm. Brand A/S 8 -1
-114 -402
Shareholders' equity under the rules of the Danish Financial Supervisory Authority exclusive minority interests
Share of profit attributable to Alm. Brand A/S unde r the rules of the Danish Financial Supervisory

Alm. Brand A/S – Q3 2011
Page 26 of 33
CAPITAL TARGET Capital base at
DKKm 30 September 2011
Consolidated equity 4,583
Intangible assets -56
Tax asset -699
Supplementary capital 1,753
Consolidated capital base 5,581
Capital target
DKKm 30 September 2011
Non-life insurance (45% of gross premium income) 2,146
Life insurance (9% of life insurance provisions) 1,010
Alm. Brand Bank (20.2% of risk weighted assets) *) 2,581
Alm. Brand Bank subsidiaries 240
Diversification effects -300
Consolidated capital target 5,677
*) calculated as the individual solvency need at 30 September 2011 plus 3 percentage pionts
Statutory capital requirement for the group at 30 Sep tember 2011 3,707
Excess relative to statutory capital requirement 1,874
Excess relative to internal capital target -96

Alm. Brand A/S – Q3 2011
Page 27 of 33
CASH FLOW STATEMENT Group
Q1-Q3 Q1-Q3 Year
DKKm 2011 2010 2010
Cash flows from operating activities
Premiums received 4,343 4,325 5,284
Claims paid -3,411 -3,482 -4,512
Interest receivable, dividends, etc. 1,119 1,109 1,652
Interest payable -379 -276 -395
Payments concerning reinsurance -128 -185 -193
Fee income received 146 144 161
Fee income paid -33 -29 -43
Expences paid -1,178 -906 -1,270
Tax on pension investment returns paid -111 0 8
Acquisition of intangible assets, furniture, equipments etc. -40 -3 7
Other ordinary income received 25 17 23
Taxes paid/received 2 -2 9
Cash flows from operating activities 355 712 731
Change in investment placement (net)
Properties acquired or converted 36 3 -5
Sale/aquisition of equity investments 127 -173 20
Sale/repayment of mortgage deeds and loans 1,138 1,169 1,328
Sale/aquisition of bonds 3,886 -3,327 -1,697
Change in investment placement (net) 5,187 -2,328 -354
Change in financing (net)
Other provisions 0 2 1
Sale/purchase of treasury shares 3 8 -54
Sale/acquisition of subsidiaries (change in minority interests) -22 -39 -38
Share issue 0 0 1,562
Change in issued bonds 0 6,000 6,006
Change in deposits -993 -1,667 -2,271
Change in payables to credit institutions -425 -3,115 -4,744
Change in other payables 0 0 -303
Change in financing (net) -1,437 1,189 159
Net change in cash and cash equivalents 4,105 -427 536
Cash and cash equivalents, beginning of period 1,916 1,380 1,380
Cash and cash equivalents, end of period 6,021 953 1,9 16
Alm. Brand A/S – Q3 2011
Page 28 of 33
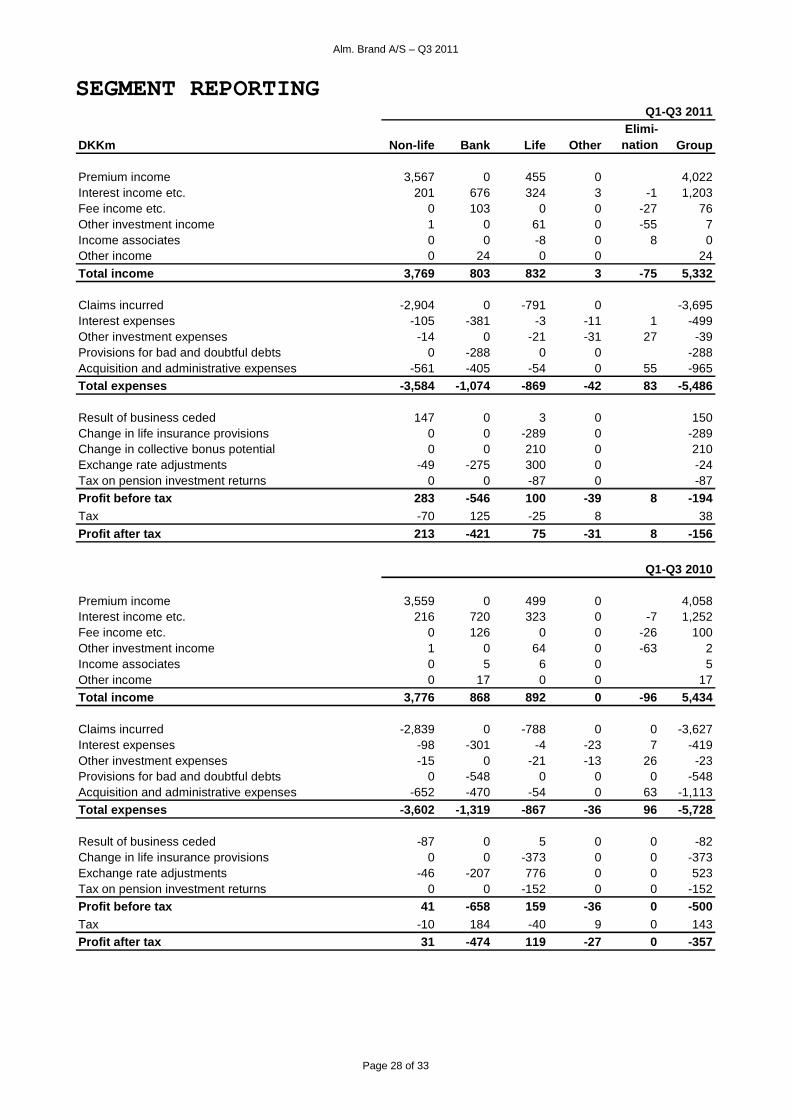
SEGMENT REPORTING
DKKm Non-life Bank Life OtherElimi-
nation Group
Premium income 3,567 0 455 0 4,022Interest income etc. 201 676 324 3 -1 1,203Fee income etc. 0 103 0 0 -27 76Other investment income 1 0 61 0 -55 7Income associates 0 0 -8 0 8 0Other income 0 24 0 0 24
Total income 3,769 803 832 3 -75 5,332
Claims incurred -2,904 0 -791 0 -3,695Interest expenses -105 -381 -3 -11 1 -499Other investment expenses -14 0 -21 -31 27 -39Provisions for bad and doubtful debts 0 -288 0 0 -288Acquisition and administrative expenses -561 -405 -54 0 55 -965Total expenses -3,584 -1,074 -869 -42 83 -5,486
Result of business ceded 147 0 3 0 150Change in life insurance provisions 0 0 -289 0 -289Change in collective bonus potential 0 0 210 0 210Exchange rate adjustments -49 -275 300 0 -24Tax on pension investment returns 0 0 -87 0 -87Profit before tax 283 -546 100 -39 8 -194Tax -70 125 -25 8 38
Profit after tax 213 -421 75 -31 8 -156
Premium income 3,559 0 499 0 4,058Interest income etc. 216 720 323 0 -7 1,252Fee income etc. 0 126 0 0 -26 100Other investment income 1 0 64 0 -63 2Income associates 0 5 6 0 5Other income 0 17 0 0 17Total income 3,776 868 892 0 -96 5,434
Claims incurred -2,839 0 -788 0 0 -3,627Interest expenses -98 -301 -4 -23 7 -419Other investment expenses -15 0 -21 -13 26 -23Provisions for bad and doubtful debts 0 -548 0 0 0 -548Acquisition and administrative expenses -652 -470 -54 0 63 -1,113Total expenses -3,602 -1,319 -867 -36 96 -5,728
Result of business ceded -87 0 5 0 0 -82Change in life insurance provisions 0 0 -373 0 0 -373Exchange rate adjustments -46 -207 776 0 0 523Tax on pension investment returns 0 0 -152 0 0 -152Profit before tax 41 -658 159 -36 0 -500Tax -10 184 -40 9 0 143Profit after tax 31 -474 119 -27 0 -357
Q1-Q3 2011
Q1-Q3 2010

Alm. Brand A/S – Q3 2011
Page 29 of 33
NOTES Group
Q1-Q3 Q1-Q3 YearDKKm 2011 2010 2010
Note 1 Own Shares - Group
Carrying amount, beginning of year 0 0 0Value adjustments 3 8 9Acquired during the period 3 0 0Sold during the period -6 -8 -9Cancellation of shares 0 0 0
Carrying amount, end of period 0 0 0
Nominal value, beginning of year 4 41 41Acquired during the period 3 0 0Sold during the period -6 -7 -7Cancellation of shares 0 0 -29
Nominal value, end of period 1 34 5
Holding (number of shares), beginning of year 421 514 515Additions, number of shares 300 0 0Disposals, number of shares -579 -93 -94Sale of Pre-emptive Rights 0 0 -3,793Allocation of Pre-emptive Rights 0 0 3,793Cancellation of shares 0 0 0
Holding (number of shares), end of period 142 421 421
Percentage of share capital, end of period 0.1% 2.4% 0.2%
Note 2 Contingent liabilities, guaranties and l easing
Guarantee commitments 1,710 2,300 1,888
Note 3 Accounting policies - Group The consolidated interim report has been prepared in compliance with IAS 34 “Interim Financial Reporting” and the requirements of the Danish Financial Business Act and NASDAQ OMX Copenhagen A/S applying to interim financial reporting of Danish listed financial en-terprises. The application of IAS 34 means that the re-port is limited relative to the presentation of a full annual report. The parent company financial statements have been prepared in accordance with the provisions of the Dan-ish Financial Business Act, including the Executive Or-der on financial reports presented by insurance
companies and profession-specific pension funds. The accounting policies applied for the consolidated fi-nancial statements are unchanged from the policies ap-plied for the Annual Report 2010. The accounting policies of the parent company are de-scribed in connection with the parent company’s interim report, as detailed in a separate section of this report. The interim report for the nine months ended 30 Sep-tember 2011 is unaudited.
Note 4 Financia l highlights and key ra tios
Referring to m anagem ent's report.

Alm. Brand A/S – Q3 2011
Page 30 of 33
BALANCE SHEET
30 September 30 September 31 December
DKKm Note 2011 2010 2010
Assets
Investment in group enterprises 1 4,652 3,681 4,495Investment in associates 0 0 0Total investments in group enterprises and associat es 4,652 3,681 4,495
Equity investments 1 1 1Other loans and advances 2 2 2Deposits with credit institutions 135 50 50Cash in hand and balances at call 11 40 371Total other financial investment assets 149 93 424
Total investment assets 4,801 3,774 4,919
Receiveables from group enterprises 9 30 0Other receivables 28 32 38Total receivables 37 62 38
Current tax assets 17 20 8Deferred tax assets 18 14 19Total other assets 35 34 27
Total assets 4,873 3,870 4,984
Liabilities and equity
Share capital 1,735 1,388 1,735Other provisions 1,215 0 1,215Retained earnings 1,526 1,753 1,640Total shareholders' equity 4,476 3,141 4,590
Subordinated loan capital 250 250 250Total subordinated loan capital 250 250 250
Deferred tax liabilities 46 46 46Total provisions 46 46 46
Payables to subsidiaries 3 303 13Issued bonds 32 32 32Other payables 66 98 53Total payables 101 433 98
Deferred income 0 0 0
Total liabilities and equity 4,873 3,870 4,984
Parent company

Alm. Brand A/S – Q3 2011
Page 31 of 33
INCOME STATEMENT
Q3 Q3 Q1-Q3 Q1-Q3 Year
DKKm Note 2011 2010 2011 2010 2010
Income from group enterprises 2 -62 -268 -91 -326 -360Interest income and dividends, etc. 1 0 3 0 1Interest expenses -4 -8 11 23 -34Administrative expenses related to investment activities -8 2 -23 -11 -21
Profit before tax -73 -274 -100 -314 -414Tax 3 2 8 9 14Profit for the Year -70 -272 -92 -305 -400
Comprehensive income
Profit for the period -70 -272 -114 -351 -400Revaluation of owner-occupied properties 0 0 0 -2 -2
Comprehensive income -70 -272 -114 -353 -402
Proposed allocation of profit/loss:Retained earnings -71 -272 0 0 -402
Note 3 Accounting policies parent company
Parent company

Alm. Brand A/S – Q3 2011
Page 32 of 33
STATEMENT OF CHANGES IN EQUITY
Parent company
Share- Other Retained Shareholders' DKKm Capital provisions earnings equity
Shareholders equity, 01.01.2010 1,388 0 2,098 3,486
Changes in equity Q1-Q3 2010Profit/loss for the period -351 -351Revaluation of owner-occupied properties -2Total income 0 -351 -353Purchase and sale of treasury shares 8 8Changes in equity 0 -343 -345Shareholders equity, 30.09.2010 1,388 1,755 3,141
Shareholders equity, 01.01.2010 1,388 0 2,098 3,486
Changes in equity 2010Profit/loss for the year -400 -400
Revaluation of owner-occupied properties -2 -2
Total income 0 -402 -402Reduction of capital on 11 November 2010 -1,215 1,215 0 0
Share issue on 30 December 2010 1,562 1,562
Cost relating to share issue -63 -63
Purchase and sale of treasury shares 9 9Purchase and sale of treasury shares in subsidiaries -2 -2Changes in equity 347 1,215 -458 1,104Shareholders equity, 31.12.2010 1,735 1,215 1,640 4,590
Shareholders equity, 01.01.2011 1,735 1,215 1,640 4,590
Changes in equity Q1-Q3 2011Profit/loss for the period -114 -114Total income 0 -114 -114Purchase and sale of treasury shares 3 3Purchase and sale of treasury shares in subsidiaries -4 -4Tax on changes recognised in equity 1 1Changes in equity 0 0 -114 -114Shareholders equity, 30.09.2011 1,735 1,215 1,526 4,476
Alm. Brand A/S – Q3 2011
Page 33 of 33
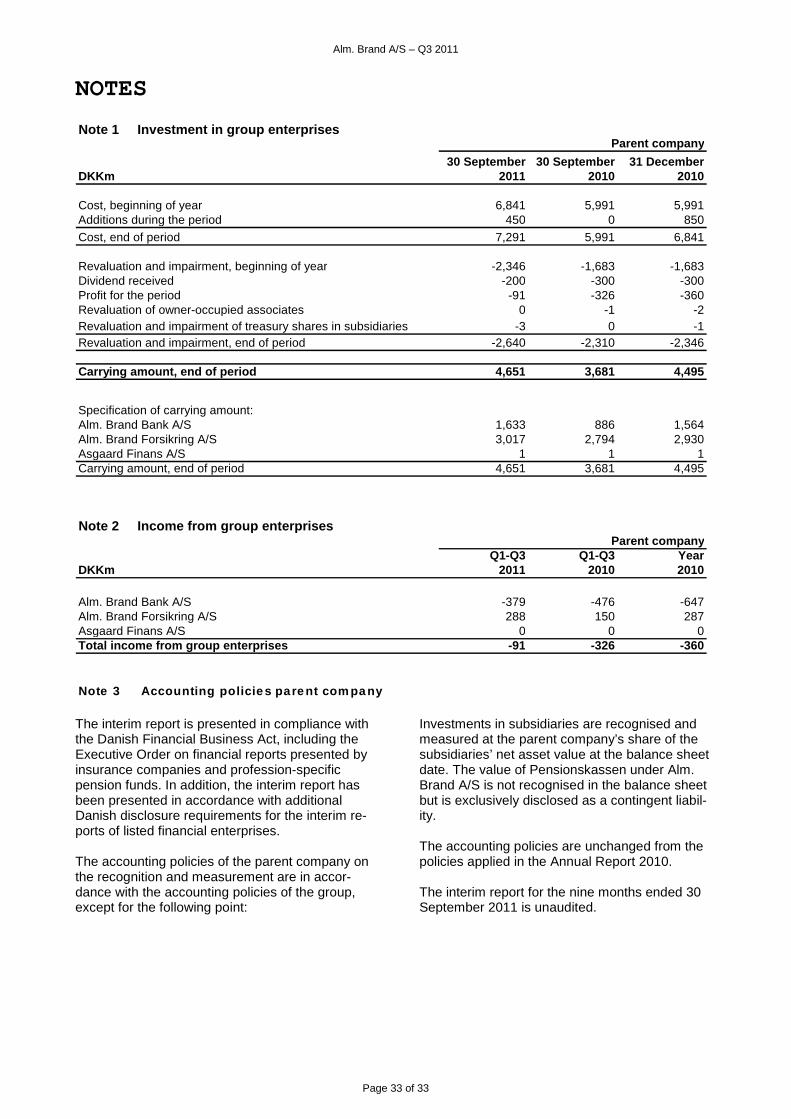
NOTES
Note 1 Investment in group enterprisesParent company
30 September 30 September 31 DecemberDKKm 2011 2010 2010
Cost, beginning of year 6,841 5,991 5,991Additions during the period 450 0 850
Cost, end of period 7,291 5,991 6,841
Revaluation and impairment, beginning of year -2,346 -1,683 -1,683Dividend received -200 -300 -300Profit for the period -91 -326 -360Revaluation of owner-occupied associates 0 -1 -2Revaluation and impairment of treasury shares in subsidiaries -3 0 -1Revaluation and impairment, end of period -2,640 -2,310 -2,346
Carrying amount, end of period 4,651 3,681 4,495
Specification of carrying amount:Alm. Brand Bank A/S 1,633 886 1,564Alm. Brand Forsikring A/S 3,017 2,794 2,930Asgaard Finans A/S 1 1 1Carrying amount, end of period 4,651 3,681 4,495
Note 2 Income from group enterprisesParent company
Q1-Q3 Q1-Q3 YearDKKm 2011 2010 2010
Alm. Brand Bank A/S -379 -476 -647Alm. Brand Forsikring A/S 288 150 287Asgaard Finans A/S 0 0 0Total income from group enterprises -91 -326 -360 Note 3 Accounting policie s pa re nt com pa ny The interim report is presented in compliance with the Danish Financial Business Act, including the Executive Order on financial reports presented by insurance companies and profession-specific pension funds. In addition, the interim report has been presented in accordance with additional Danish disclosure requirements for the interim re-ports of listed financial enterprises. The accounting policies of the parent company on the recognition and measurement are in accor-dance with the accounting policies of the group, except for the following point:
Investments in subsidiaries are recognised and measured at the parent company’s share of the subsidiaries’ net asset value at the balance sheet date. The value of Pensionskassen under Alm. Brand A/S is not recognised in the balance sheet but is exclusively disclosed as a contingent liabil-ity. The accounting policies are unchanged from the policies applied in the Annual Report 2010. The interim report for the nine months ended 30 September 2011 is unaudited.