Ally Financial Inc. 3Q 2021 Earnings Review
40
1 3Q 2021 Preliminary Results Ally Financial Inc. 3Q 2021 Earnings Review October 21, 2021 Contact Ally Investor Relations at (866) 710-4623 or [email protected]
Transcript of Ally Financial Inc. 3Q 2021 Earnings Review

1
3Q 2021 Preliminary Results
Ally Financial Inc.3Q 2021 Earnings ReviewOctober 21, 2021
Contact Ally Investor Relations at (866) 710-4623 or [email protected]

2
3Q 2021 Preliminary Results
Forward-Looking Statements and Additional Information
This presentation and related communications should be read in conjunction with the financial statements, notes, and other information contained in our
Annual Reports on Form 10-K, Quarterly Reports on Form 10-Q, and Current Reports on Form 8-K. This information is preliminary and based on company
and third-party data available at the time of the presentation or related communication.
This presentation and related communications contain forward-looking statements within the meaning of the Private Securities Litigation Reform Act of 1995.
These statements can be identified by the fact that they do not relate strictly to historical or current facts—such as statements about future effects of COVID-
19 and our ability to navigate them, the outlook for financial and operating metrics and performance, and future capital allocation and actions. Forward-looking
statements often use words such as “believe,” “expect,” “anticipate,” “intend,” “pursue,” “seek,” “continue,” “estimate,” “project,” “outlook,” “forecast,” “potential,”
“target,” “objective,” “trend,” “plan,” “goal,” “initiative,” “priorities,” or other words of comparable meaning or future-tense or conditional verbs such as “may,”
“will,” “should,” “would,” or “could.” Forward-looking statements convey our expectations, intentions, or forecasts about future events, circumstances, or
results. All forward-looking statements, by their nature, are subject to assumptions, risks, and uncertainties, which may change over time and many of which
are beyond our control. You should not rely on any forward-looking statement as a prediction or guarantee about the future. Actual future objectives,
strategies, plans, prospects, performance, conditions, or results may differ materially from those set forth in any forward-looking statement. Some of the
factors that may cause actual results or other future events or circumstances to differ from those in forward-looking statements are described in our Annual
Report on Form 10-K for the year ended December 31, 2020, our subsequent Quarterly Reports on Form 10-Q or Current Reports on Form 8-K, or other
applicable documents that are filed or furnished with the U.S. Securities and Exchange Commission (collectively, our “SEC filings”). Any forward-looking
statement made by us or on our behalf speaks only as of the date that it was made. We do not undertake to update any forward-looking statement to reflect
the impact of events, circumstances, or results that arise after the date that the statement was made, except as required by applicable securities laws. You,
however, should consult further disclosures (including disclosures of a forward-looking nature) that we may make in any subsequent SEC filings.
This presentation and related communications contain specifically identified non-GAAP financial measures, which supplement the results that are reported
according to U.S. generally accepted accounting principles (“GAAP”). These non-GAAP financial measures may be useful to investors but should not be
viewed in isolation from, or as a substitute for, GAAP results. Differences between non-GAAP financial measures and comparable GAAP financial measures
are reconciled in the presentation.
Unless the context otherwise requires, the following definitions apply. The term “loans” means the following consumer and commercial products associated
with our direct and indirect financing activities: loans, retail installment sales contracts, lines of credit, and other financing products excluding operating leases.
The term “operating leases” means consumer- and commercial-vehicle lease agreements where Ally is the lessor and the lessee is generally not obligated to
acquire ownership of the vehicle at lease-end or compensate Ally for the vehicle’s residual value. The terms “lend,” “finance,” and “originate” mean our direct
extension or origination of loans, our purchase or acquisition of loans, or our purchase of operating leases, as applicable. The term “consumer” means all
consumer products associated with our loan and operating-lease activities and all commercial retail installment sales contracts. The term “commercial” means
all commercial products associated with our loan activities, other than commercial retail installment sales contracts. The term “partnerships” means business
arrangements rather than partnerships as defined by law.
3
3Q 2021 Preliminary Results
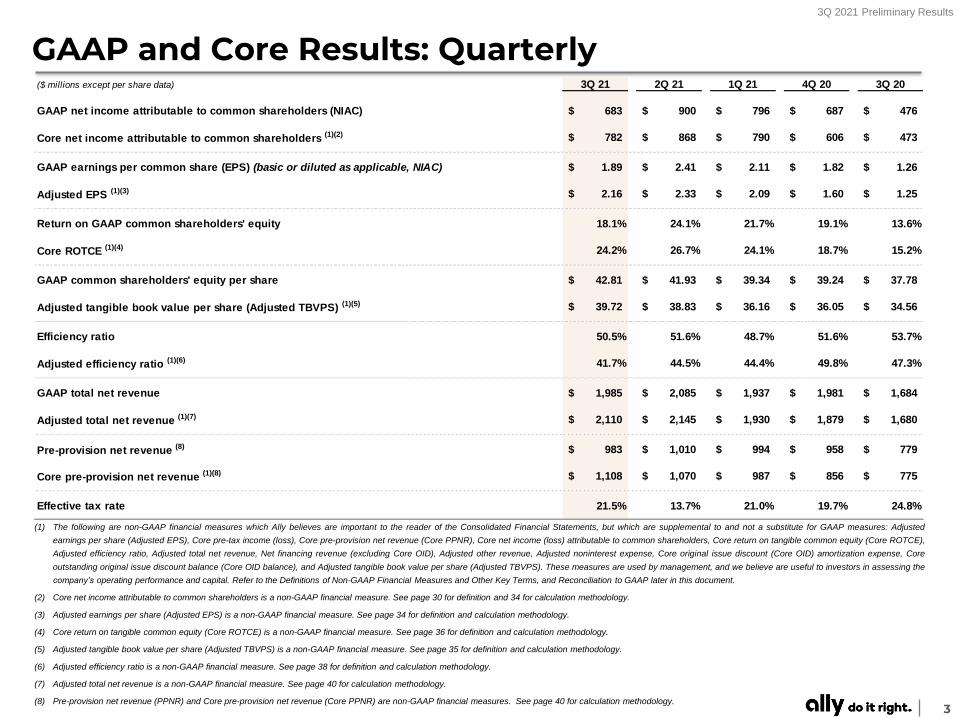
GAAP and Core Results: Quarterly
(1) The following are non-GAAP financial measures which Ally believes are important to the reader of the Consolidated Financial Statements, but which are supplemental to and not a substitute for GAAP measures: Adjusted
earnings per share (Adjusted EPS), Core pre-tax income (loss), Core pre-provision net revenue (Core PPNR), Core net income (loss) attributable to common shareholders, Core return on tangible common equity (Core ROTCE),
Adjusted efficiency ratio, Adjusted total net revenue, Net financing revenue (excluding Core OID), Adjusted other revenue, Adjusted noninterest expense, Core original issue discount (Core OID) amortization expense, Core
outstanding original issue discount balance (Core OID balance), and Adjusted tangible book value per share (Adjusted TBVPS). These measures are used by management, and we believe are useful to investors in assessing the
company’s operating performance and capital. Refer to the Definitions of Non-GAAP Financial Measures and Other Key Terms, and Reconciliation to GAAP later in this document.
(2) Core net income attributable to common shareholders is a non-GAAP financial measure. See page 30 for definition and 34 for calculation methodology.
(3) Adjusted earnings per share (Adjusted EPS) is a non-GAAP financial measure. See page 34 for definition and calculation methodology.
(4) Core return on tangible common equity (Core ROTCE) is a non-GAAP financial measure. See page 36 for definition and calculation methodology.
(5) Adjusted tangible book value per share (Adjusted TBVPS) is a non-GAAP financial measure. See page 35 for definition and calculation methodology.
(6) Adjusted efficiency ratio is a non-GAAP financial measure. See page 38 for definition and calculation methodology.
(7) Adjusted total net revenue is a non-GAAP financial measure. See page 40 for calculation methodology.
(8) Pre-provision net revenue (PPNR) and Core pre-provision net revenue (Core PPNR) are non-GAAP financial measures. See page 40 for calculation methodology.
($ millions except per share data) 3Q 21 2Q 21 1Q 21 4Q 20 3Q 20
GAAP net income attributable to common shareholders (NIAC) 683$ 900$ 796$ 687$ 476$
Core net income attributable to common shareholders (1)(2) 782$ 868$ 790$ 606$ 473$
GAAP earnings per common share (EPS) (basic or diluted as applicable, NIAC) 1.89$ 2.41$ 2.11$ 1.82$ 1.26$
Adjusted EPS (1)(3) 2.16$ 2.33$ 2.09$ 1.60$ 1.25$
Return on GAAP common shareholders' equity 18.1% 24.1% 21.7% 19.1% 13.6%
Core ROTCE (1)(4) 24.2% 26.7% 24.1% 18.7% 15.2%
GAAP common shareholders' equity per share 42.81$ 41.93$ 39.34$ 39.24$ 37.78$
Adjusted tangible book value per share (Adjusted TBVPS) (1)(5) 39.72$ 38.83$ 36.16$ 36.05$ 34.56$
Efficiency ratio 50.5% 51.6% 48.7% 51.6% 53.7%
Adjusted efficiency ratio (1)(6) 41.7% 44.5% 44.4% 49.8% 47.3%
GAAP total net revenue 1,985$ 2,085$ 1,937$ 1,981$ 1,684$
Adjusted total net revenue (1)(7) 2,110$ 2,145$ 1,930$ 1,879$ 1,680$
Pre-provision net revenue (8) 983$ 1,010$ 994$ 958$ 779$
Core pre-provision net revenue (1)(8) 1,108$ 1,070$ 987$ 856$ 775$
Effective tax rate 21.5% 13.7% 21.0% 19.7% 24.8%

4
3Q 2021 Preliminary Results
Ally’s Culture and Priorities
Relentless focus on our dealers,
consumers & commercial clients
customers
Ongoing prioritization of our teammates
and their well-being
Driving meaningful and lasting change through
our actions and the Ally Charitable Foundation
employees
communities
Driving long-term, enhanced value for ALL stakeholders
do it rightculture & values

5
3Q 2021 Preliminary Results
3Q 2021 Highlights
Focused Execution Delivering Results
Auto & Insurance: Leading, adaptable partner, driving attractive risk-adjusted returns
Ally Bank: Leading, growing, digital-bank focused on deepening customer relationships
• 12th straight year of dealer network growth | Consumer volume of $12.3B, highest 3Q in 15 years from record 3.3M apps
• 7.10% estimated retail auto originated yield(2) and 27bps retail auto net charge-offs, reflecting solid credit performance
• Insurance written premiums of $295 million, durable investment income sourced from $6.4B portfolio
• 50 consecutive quarters of customer growth | $131.6B retail deposit balances, ↑9% YoY from existing and new customers
• Ally Home®: $3.6B originations, ↑176% YoY, strong revenue-per-loan trends
• Ally Invest: $16.3B net customer assets, ↑42% YoY, 503k active self-directed and managed accounts
• Ally Lending: $362 million point-of-sale originations, ↑110% YoY, 2.8k merchants, ↑23% YoY
• Corporate Finance: $6.6B loan portfolio, ↑12% YoY, strong syndication and origination volume trends
(1) Represents a non-GAAP financial measure. See pages 34, 36, and 40 for calculation methodology and details.
(2) Estimated Retail Auto Originated Yield is a forward-looking non-GAAP financial measure. See page 31 for details.
Note: Ally Bank, Member FDIC and Equal Housing Lender, offers mortgage lending, point-of-sale personal lending, and a variety of deposit and other banking products, including savings,
money market, and checking accounts, CDs, and IRAs. Additionally, we offer securities-brokerage and investment-advisory services through Ally Invest.
Adjusted
EPS(1)
$2.16Core
ROTCE(1)
24.2%CET1
Capital Ratio
11.2%
• Ally acquiring Fair Square Financial for $750 million (all-cash) Remain on track with FY 2021 buyback authorization of $2.0B
• Scalable, customer-centric, digital-first credit card platform Announced 4Q 2021 dividend of $0.25 per share
Adjusted Total
Net Revenue(1)
$2.11B

6
3Q 2021 Preliminary Results
($ billions)
$1.52 $1.56 $1.54 $1.56 $1.62 $1.62 $1.61
$1.53 $1.68
$1.88 $1.93
$2.14 $2.11
$0.71 $0.75 $0.71 $0.68 $0.78 $0.74
$0.69 $0.59
$0.77 $0.86
$0.99 $1.07 $1.11
3Q 18 4Q 18 1Q 19 2Q 19 3Q 19 4Q 19 1Q 20 2Q 20 3Q 20 4Q 20 1Q 21 2Q 21 3Q 21
Adj. Total Net Revenue Core Pre-Provision Net Revenue (Core PPNR)
$28.6$29.9
$31.4
$33.6$34.7 $35.1
$32.8$33.7
$34.6
$36.1 $36.2
$38.8$39.7
3Q 18 4Q 18 1Q 19 2Q 19 3Q 19 4Q 19 1Q 20 2Q 20 3Q 20 4Q 20 1Q 21 2Q 21 3Q 21
Quarterly Core Metric Trends
(1), (2) Represents a non-GAAP financial measure. See page 34 and 36 for calculation methodology and details. (3) Represents a non-GAAP financial measure. See page 40 for calculation methodology and details.
Adjusted Earnings Per Share & Core ROTCE Adjusted Total Net Revenue & Core PPNR
Adjusted Tangible Book Value per Share(4)
(4) Represents a non-GAAP financial measure. See page 35 for calculation methodology and details.
Total Deposits
(3) (3)
Note: Other includes sweep deposits, mortgage escrow & other deposits. May not foot due to rounding.
(1) (2)
($ billions)
$85 $89 $95 $99 $101 $104 $106 $116 $121 $124 $128 $129 $132
$17$17
$18 $18 $18 $17 $16
$15$14 $13 $11 $10 $8
$101$106
$113 $116 $119 $121 $122$131 $135 $137 $140 $139 $139
3Q 18 4Q 18 1Q 19 2Q 19 3Q 19 4Q 19 1Q 20 2Q 20 3Q 20 4Q 20 1Q 21 2Q 21 3Q 21
Retail Deposits Brokered / Other
CE
CL D
ay 1
Impact:
$2.7
/share
$0.91 $0.92 $0.80
$0.97 $1.01 $0.95
($0.44)
$0.61
$1.25
$1.60
$2.09 $2.33
$2.16
13.7% 13.4%10.9% 12.4% 12.3% 11.2%
(5.4%)
7.6%
15.2%18.7%
24.1%26.7%
24.2%
3Q 18 4Q 18 1Q 19 2Q 19 3Q 19 4Q 19 1Q 20 2Q 20 3Q 20 4Q 20 1Q 21 2Q 21 3Q 21
Adj. EPS Core ROTCE

7
3Q 2021 Preliminary Results
Strategically and Financially Attractive Acquisition
▪ Enhances relationship
deepening & diversification
▪ Leverages Ally’s brand,
funding & customer platform
▪ Expands growth opportunities
(~$1T credit card market)
▪ Customer-centric culture
▪ Digital-first approach
▪ Tech-forward, data driven
▪ Disciplined risk philosophy
▪ Deep credit expertise
▪ Experienced leadership
▪ Scalable, nimble platform
▪ Organic asset & customer
acquisition engine
▪ Enhances strong earnings &
risk-adjusted return profile
Accretive
Synergistic Aligned
Customers9M
Consumer Auto Loans& Leases
Commercial Auto Lending
Insurance: Auto Consumer & Dealer
Servicing & Customer Solutions
Investing & Wealth(Launched 2016)
Checking & Savings
PoS:Health, Home & Retail(Launched 2019)
Credit Card(@ closing)
Mortgage(Launched 2016)
Corporate Finance
• Ally’s acquisition of Fair Square advances our evolution as the leading digital consumer bank
• Enhances frictionless, innovative product offerings available to our growing customer base✓
• Highly aligned customer-centric and digital-first approach in core banking product
• Accretive to Ally’s attractive and structurally enhanced long-term return profile✓
→
Powerful branded offerings
10M

8
3Q 2021 Preliminary Results
Scalable, Digital-first Credit Card Provider
Customer-Centric>90% Satisfaction
55+ NPS
24/7 Customer Service
Robust GrowthCustomers:↑66% 4-yr CAGR
Revenues:↑109% 4-yr CAGR
Ongoing growth in ‘20-‘21
Data-Driven Proprietary, analytics based
underwriting
Disciplined, informed
risk based decisioning
Scalable, Tech-Forward
Cutting-edge, cloud platform
High-efficiency via
digital engagement
FairSquare
Founded
2016Active
Cardholders
658kLoan
Balances
$763MRun-rate Return
on Assets
5%
Growing digital first, customer-centric company | Attractive risk-adjusted return profile
Consumer-oriented Products Outpacing Industry Trends
Digital-DNA100% Digital Applications
90% Digital Engagement
4.7 / 5.0 App Rating
Risk-Adjusted Margin(1)
Mid-TeensNormalized NCO’s
6-8%Avg. FICO
657Avg. Credit Line
$2.3k
Current
Employees
80
Customers
Loan
Balances
($millions)
Transaction Highlights
Earnings & EPS Accretive to FY 2023
Core ROTCE100-125bps Accretive (2022-2023)
>150bps Accretive (Medium Term)
Opportunities across broadened customer base not included in model
Purchase Price $750 million (all-cash)
Anticipated Closing By the end of 1Q‘22
IRR 25%+
~50-55bps CET1 consumed @ closing | $2B buyback program unchanged
Loan Balance
CAGR Since 2017
74%
De
tail
Ou
tlo
ok
Note: Company, operational and financial information provided by Fair Square Financial and is unaudited. Headcount data as of August 31, 2021. Active cardholders, customers and loan balances as of September 30, 2021. ‘Run-rate Return on Assets’ & ‘Core ROTCE’ (for definition see page 36) represent non-GAAP measures, reflect tax-effected results, excluding deal-specific impacts including goodwill & intangibles amortization expense, integration & advisory fees.
(1) Risk adjusted margin is a non-GAAP measure defined as net interest income plus non-interest income less provision expense.
$95
$300
$552 $573
$763
99K
291K
461K 451K
658K
2017 2018 2019 2020 2021 YTD

9
3Q 2021 Preliminary Results
Inc / (Dec) v.
$ millions; except per share data 3Q 21 2Q 21 3Q 20 2Q 21 3Q 20
Net financing revenue (ex. Core OID) (1) 1,603$ 1,556$ 1,209$ 47$ 394$
Core OID (1) (9) (9) (9) 0 (0)
Net financing revenue 1,594$ 1,547$ 1,200$ 47$ 394$
Adjusted other revenue (1) 507 588 471 (81) 37
Repositioning & change in fair value of equity securities(2) (116) (50) 13 (66) (130)
Other revenue 391 538 484 (147) (93)
Provision for credit losses 76 (32) 147 108 (71)
Noninterest expense 1,002 1,075 905 (73) 97
Pre-tax income 907$ 1,042$ 632$ (135)$ 275$
Income tax expense 195 143 156 52 39
Net income from discontinued operations - 1 - (1) -
Net income 712$ 900$ 476$ (188)$ 236$
Preferred stock dividends 29 - - 29 29
Net income attributable to common stockholders 683$ 900$ 476$ (217)$ 207$
GAAP EPS (diluted) 1.89$ 2.41$ 1.26$ (0.53)$ 0.62$
Core OID, net of tax 0.02 0.02 0.02 0.00 0.00
Change in fair value of equity securities, net of tax 0.14 (0.04) (0.03) 0.18 0.17
Repositioning, discontinued ops., and other, net of tax (3) 0.11 0.14 - (0.03) 0.11
Significant discrete tax items (4) - (0.21) - 0.21 -
Adjusted EPS (5) 2.16$ 2.33$ 1.25$ (0.17)$ 0.91$
3Q 2021 Financial Results
(1) Represents a non-GAAP financial measure. For calculation methodology see page 40.
(2) See page 39 for details and calculation methodology.
(3) Represents a non-GAAP financial measure. For calculation methodology see pages 34 and 39.
(4) 2Q’21 effective tax rate included a $78 million release of valuation allowance on foreign tax credit carryforwards.
(5) Represents a non-GAAP financial measure. For calculation methodology see page 34.
Incl. $52M charge
on TRUP’s debt
extinguishment

10
3Q 2021 Preliminary Results
Balance Sheet and Net Interest Margin
(1) Mortgage includes held-for-investment (HFI) loans from the Mortgage Finance segment and the HFI legacy mortgage portfolio in run-off at the Corporate and Other segment.
(2) Unsecured lending from point-of-sale financing.
(3) Includes retail, brokered, and other deposits (inclusive of sweep deposits, mortgage escrow and other deposits).
(4) Represents a non-GAAP financial measure. Excludes Core OID and Core OID balance. See page 40 calculation methodology.
(5) Includes FHLB borrowings, Repurchase Agreements, Demand Notes (Ally’s program was terminated & all outstanding demand notes redeemed. $2.1B were outstanding as of 12/31/2020), and Other.
(6) Includes remaining trust preferred securities.
($ millions)
Average
Balance Yield Average Balance Yield
Average
Balance Yield
Retail Auto Loan 76,557$ 6.62% 74,662$ 6.70% 72,999$ 6.56%
Retail Auto Loan (ex. hedge impact) 6.84% 6.92% 6.83%
Auto Lease (net of depreciation) 10,919 9.21% 10,355 11.67% 9,317 7.89%
Commercial Auto 13,887 3.54% 16,332 3.60% 21,265 3.30%
Corporate Finance 6,735 5.12% 6,383 5.37% 6,188 5.40%
Mortgage(1) 15,125 2.83% 13,179 2.80% 17,096 3.00%
Consumer Other - Ally Lending (2) 728 13.86% 537 14.44% 285 17.77%
Cash and Cash Equivalents 13,055 0.14% 16,564 0.10% 20,719 0.11%
Investment Securities & Other 35,532 1.76% 36,784 1.63% 32,244 2.14%
Earning Assets 172,538$ 4.68% 174,796$ 4.69% 180,113$ 4.35%
Deposits (3) 139,244$ 0.70% 139,382$ 0.77% 132,964$ 1.35%
Unsecured Debt (4)(6) 9,787 5.19% 11,737 5.33% 12,315 5.74%
Secured Debt 1,675 4.29% 2,618 4.44% 6,154 2.94%
Other Borrowings (5) 4,929 3.42% 5,044 2.81% 14,427 2.36%
Funding Sources (3) 155,635$ 1.11% 158,781$ 1.23% 165,860$ 1.82%
NIM (ex. Core OID) (3) 3.68% 3.57% 2.67%
NIM (as reported) 3.66% 3.55% 2.65%
3Q 21 2Q 21 3Q 20

11
3Q 2021 Preliminary Results
Note: For more details on the final rules to address the impact of CECL on regulatory capital by allowing BHC’s
and banks, including Ally, to delay and subsequently phase-in its impact, see page 31 for details.
Capital Ratios and Shareholder Distributions• 3Q 2021 CET1 ratio of 11.2%
• Remain on track with 2021 full-year $2B share repurchase program
– Ally has repurchased (1) $1.4B of common shares year-to-date
• Ally’s Board of Directors approved 4Q 2021 common dividend of $0.25 per share
• Following Moody’s senior upgrade in the quarter, Ally now rated investment grade by all major rating agencies
• Announced redemption of remaining legacy TRUPs in 3Q
• Deploying ~25% of excess capital above internal target to fund strategic acquisition of Fair Square
(1) Repurchased common shares include shares withheld to cover income taxes owed by participants related to share-based incentive plans. Excludes commissions.
Capital Ratios and Risk-Weighted Assets
Capital Deployment Actions
($ billions)
$138 $140 $139 $139 $140
14.1% 14.1% 14.6% 14.8% 14.6%
12.1% 12.4% 12.8% 13.1% 12.8%
10.4% 10.6% 11.1% 11.3% 11.2%
3Q 20 4Q 20 1Q 21 2Q 21 3Q 21
Risk-Weighted Assets ($B) Total Capital Ratio Tier 1 Ratio CET1 Ratio
Outstanding Shares (# millions)
484 475 467 462 452 444 437 433 426 417 405 400 393 384 374 373 374 374 375 372 363 350
2Q 3Q 4Q 1Q 2Q 3Q 4Q 1Q 2Q 3Q 4Q 1Q 2Q 3Q 4Q 1Q 2Q 3Q 4Q 1Q 2Q 3Q
2016 2017 2018 2019 2020 2021
Dividend Per Share
8¢ 8¢ 8¢ 8¢
12¢ 12¢13¢ 13¢
15¢ 15¢17¢ 17¢ 17¢ 17¢
19¢ 19¢ 19¢ 19¢ 19¢ 19¢
25¢
2Q 3Q 4Q 1Q 2Q 3Q 4Q 1Q 2Q 3Q 4Q 1Q 2Q 3Q 4Q 1Q 2Q 3Q 4Q 1Q 2Q 3Q
2016 2017 2018 2019 2020 2021

12
3Q 2021 Preliminary Results
Asset Quality: Key Metrics
Ratios exclude loans measured at fair value and loans held-for-sale.
Note: Includes accruing contracts only. Days-past-due (“DPD”)
(1) Corp/Other includes legacy Mortgage HFI portfolio.
Note: See page 31 for definition.
Retail Auto Net Charge-Offs Retail Auto Delinquencies
Consolidated Net Charge-Offs (NCOs) Net Charge-Off Activity($ millions) Variance
Net Charge-Offs 3Q 20 4Q 20 1Q 21 2Q 21 3Q 21
Retail Auto 117$ 186$ 97$ (5)$ 51$
Commercial Auto 4 7 - - -
Mortgage Finance 1 2 1 1 -
Corporate Finance - (1) 14 (4) -
Ally Lending 2 4 8 4 5
Corp/Other(1) (2) - (2) (2) (2)
Total 122$ 198$ 118$ (6)$ 54$
(60+ DPD)
30+ DPD ($M and %)
3.32% 3.61% 3.19% 2.20% 2.25% 2.49% 1.43% 1.60% 1.83%
$2,428 $2,616 $2,322 $1,599 $1,658 $1,834 $1,059 1,218$ 1,427$
$480$540
$478
$341 $350$428
$233 $241$298
0.66%0.75%
0.66%
0.47% 0.47%
0.58%
0.32% 0.32%0.38%
0.00%
0.50%
1.00%
3Q 19 4Q 19 1Q 20 2Q 20 3Q 20 4Q 20 1Q 21 2Q 21 3Q 21
Delinquent Contracts ($M) Delinquency Rate
$253 $271 $262
$137 $117
$186
$97
($5)
$51
1.38%1.49% 1.44%
0.76%0.64%
1.01%
0.53%
(0.03%)
0.27%
-$125-$105-$85-$65-$45-$25-$5$15$35$55$75$95$115$135$155$175$195$215$235$255$275$295$315$335$355$375$395$415$435$455$475$495
3Q 19 4Q 19 1Q 20 2Q 20 3Q 20 4Q 20 1Q 21 2Q 21 3Q 21
Net Charge-Offs ($M) Annualized NCO Rate
119% 109%305%
471%691%
414%667%
1,448%0.83%0.91%
0.84%
0.58%
0.41%
0.67%
0.41%
(0.02%)
0.19%
-0.02%
0.08%
0.18%
0.28%
0.38%
0.48%
0.58%
0.68%
0.78%
0.88%
0.98%
0%50%100%150%200%250%300%350%400%450%500%550%600%650%700%750%800%850%900%950%1000%1050%1100%1150%1200%1250%1300%1350%1400%1450%1500%1550%
3Q 19 4Q 19 1Q 20 2Q 20 3Q 20 4Q 20 1Q 21 2Q 21 3Q 21
Allowance as % of Annualized NCOs Annualized NCO Rate

13
3Q 2021 Preliminary Results
All Other Incl. Macroeconomic
∆ in Portfolio Size
Net Charge-off Activity
Asset Quality: Coverage and Reserves
1 2 32Q’21Reserve
$3,126 $3,148$96 ($74)($54) 3Q’21 NCOs
3Q’21Reserve
($ millions)
↑ Retail Auto,
↑ Ally Lending, ↑ Mortgage
Primarily Favorable
Macroeconomic Trends
Coverage rate calculations exclude fair value adjustment for loans in hedge accounting relationships. Coverage rate calculations exclude fair value adjustment for loans in hedge accounting relationships.
Consolidated Coverage Ratio Retail Auto Coverage Ratio
Consolidated QoQ Reserve Walk
$54 Replenished
($ billions)
$1.3
$2.6$3.2 $3.4 $3.4 $3.3 $3.2 $3.1 $3.1
0.99%
2.03%
2.54%2.85% 2.87% 2.78% 2.79% 2.79% 2.75%
4Q 19 CECL
Day 1
1Q 20 2Q 20 3Q 20 4Q 20 1Q 21 2Q 21 3Q 21
Reserve - $ Reserve - %($ billions)
$1.1
$2.4$2.8 $3.0 $3.0 $2.9 $2.8 $2.8 $2.8
1.49%
3.34%
3.91%4.09% 4.06% 3.95%
3.80% 3.70%3.62%
4Q 19 CECL
Day 1
1Q 20 2Q 20 3Q 20 4Q 20 1Q 21 2Q 21 3Q 21
Reserve - $ Reserve - %

14
3Q 2021 Preliminary Results
Ally Bank: Deposit & Customer Trends
Note: Brokered / Other includes sweep deposits, mortgage escrow and other deposits. See page 31 for Customer
Retention Rate definition. Numbers may not foot due to rounding.
• Retail Deposits of $131.6 billion, up 9% YoY
– Total deposits of $139.4 billion, up 3% YoY, representing 90% of
Ally’s overall funding
– Brokered / other deposits of $7.9 billion, reduced 44% YoY
• 2.45 million retail deposit customers, up 11% YoY
– Customer retention of 96% remained solid
– Expanded customer base by 54 thousand in 3Q’21, our 50th
consecutive quarter of growth
– Customer engagement and multi-product usage remains robust;
surpassed 500 thousand active ‘Smart Savings Tool’ users
– 71% of new customers in 3Q from millennial or younger generation
Note: Multi-relationship customers represent Deposit Customers with an Ally Invest or Ally Home relationship.
Total Deposits: Retail & Brokered Balances
Retail Deposit Customer Quarterly Growth Multi-Product Relationship Customers
2%
4%
5%
7%
9%
1Q 2Q 3Q 4Q 1Q 2Q 3Q 4Q 1Q 2Q 3Q 4Q 1Q 2Q 3Q 4Q 1Q 2Q 3Q 4Q 1Q 2Q 3Q
2016 2017 2018 2019 2020 '21
(thousands)
4341 28
5649
5241
5941
5772
120100
72 3071
9478 39
8360
54
1Q 2Q 3Q 4Q 1Q 2Q 3Q 4Q 1Q 2Q 3Q 4Q 1Q 2Q 3Q 4Q 1Q 2Q 3Q 4Q 1Q 2Q 3Q
2016 2017 2018 2019 2020 '21
1,105
2,448
($ billions, EoP)
$120.8 $124.4 $128.4 $129.2 $131.6
$14.1 $12.7 $11.2 $9.9 $7.9
$135 $137 $140 $139 $139
96% 96% 96% 96% 96%
3Q 20 4Q 20 1Q 21 2Q 21 3Q 21
Retail Brokered / Other Customer Retention Rate
1.26%0.97% 0.81% 0.69% 0.64%
Avg. Retail Portfolio Interest Rate

15
3Q 2021 Preliminary Results
$82M
$362M
Acquired:4Q'19
3Q'20 3Q'21
230K
503K
Acquired: 2Q'16
3Q'18 2Q'20 3Q'21
324K
2.45M
2010 2016 3Q'21
$3.6B
Launched:1Q'17
3Q'18 3Q'20 3Q'21
$0.3B
Ally Invest
Ally Bank: Leading, Growing, All-Digital Disruptor
$
Sustained momentum demonstrates Ally’s brand value and strength
~12x FY’17 111% CAGR
See page 32 for footnotes.
Note: Ally Bank, Member FDIC and Equal Housing Lender, offers mortgage lending, point-of-sale personal lending, and a variety of deposit and other banking products, including savings, money-
market, and checking accounts, CDs, and IRAs. Additionally, we offer securities-brokerage and investment-advisory services through Ally Invest.
19% CAGR
12+Consecutive Years of
Retail Deposit Growth
50Consecutive Quarters
of Customer Growth
Largest All-Digital,
Direct U.S. Bank(1)
#1 $132BRetail Deposit
Balances
16% CAGR
Ally LendingAlly HomeDepositors drove 30% of Home originations in 3Q’21 Point-of-Sale Volume: Healthcare (4Q’19), Home improvement (3Q’20), Retail (2Q’21)
Depositors drove 71% of self-directed and managed account growth in 3Q’21
Ally Bank CustomersDeposit Customers: Serving as the ‘gateway’ to digital-first consumer products
Best Internet Bank
(2017-2021)

16
3Q 2021 Preliminary Results
Auto Finance• Auto pre-tax income of $825 million in 3Q 2021,
reflecting industry leading capabilities and well-positioned platform
– Net financing revenue reflects strong retail auto trends and
elevated off-lease vehicle gains, offsetting lower floorplan
balances
– Continued strong credit performance resulting in historically
low net losses
– Earning assets of $101.2 billion, down $3.6 billion YoY and
down $522 million QoQ, due to lower industry inventory levels
• Used vehicle values continue to reflect strong consumer demand and low vehicle supplies
– $86 million of remarketing gains despite elevated lessee and
dealer buyout activity
• Ally delivering comprehensive products and innovative solutions for our dealers and customers
– Dealer relationships(2) surpassed 20k with a continued focus
on deepening engagement
– Decisioned 3.3 million applications, highest third quarter
volume on record
– Pricing and credit trends reflect disciplined underwriting and
ongoing investments in talent and technology capabilities
Retail Auto Trends(3)
See page 32 for additional footnotes.
(3) Estimated Retail Auto Originated Yield is a forward-looking non-GAAP financial measure. See page 31 for details.
Key Financials ($ millions) 3Q 21 2Q 21 3Q 20
Net financing revenue 1,329$ (4)$ 227$
Total other revenue 61 - -
Total net revenue 1,390 (4) 227
Provision for credit losses 53 76 (75)
Noninterest expense(1) 512 12 43
Pre-tax income 825$ (92)$ 259$
U.S. auto earning assets (EOP) 101,239$ (522)$ (3,553)$
Key Statistics
Remarketing gains ($ millions) 86$ (42)$ 16$
Average gain per vehicle 2,495$ (1,189)$ 58$
Off-lease vehicles terminated (# units) 34,475 (293) 5,558
Application Volume (# thousands) 3,257 (270) 17
Inc / (Dec) v.
6.66% 6.74% 6.66%6.77% 6.83% 6.83% 6.90% 6.92% 6.84%
7.50%
7.07%7.25%
7.10%6.95% 6.81%
7.21% 7.15% 7.10%
1.38% 1.49% 1.44%
0.76% 0.64%1.01%
0.53%
(0.03%)0.27%
3Q 19 4Q 19 1Q 20 2Q 20 3Q 20 4Q 20 1Q 21 2Q 21 3Q 21
Portfolio Yield (ex. hedge) Est. Retail Auto Orig inated Yield Retail Auto NCO %
17
3Q 2021 Preliminary Results
3.7M
9.1M
11.2M12.1M
10.1M YTD'21
~13M12.4K
15.6K17.1K
18.7K20.4K
2010 2014 2016 2020 2021
U.S. Consumer Applications Active U.S. Dealer Relationships
3Q'21
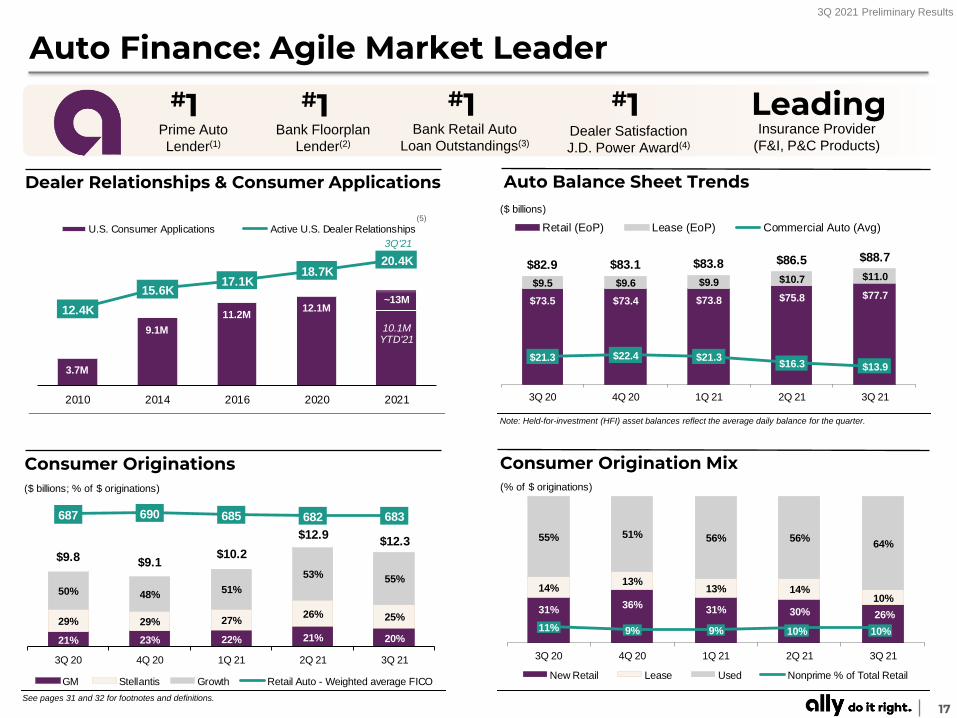
Auto Finance: Agile Market Leader
Note: Held-for-investment (HFI) asset balances reflect the average daily balance for the quarter.
Consumer Originations Consumer Origination Mix
Auto Balance Sheet TrendsDealer Relationships & Consumer Applications
(5)
See pages 31 and 32 for footnotes and definitions.
#1Prime Auto
Lender(1)
LeadingInsurance Provider
(F&I, P&C Products)
#1Bank Floorplan
Lender(2)
Bank Retail Auto
Loan Outstandings(3)
#1Dealer Satisfaction
J.D. Power Award(4)
#1
($ billions; % of $ originations)
21% 23% 22% 21% 20%
29% 29% 27%26% 25%
50% 48%51%
53% 55%
$9.8 $9.1$10.2
$12.9$12.3
687 690 685 682 683
3Q 20 4Q 20 1Q 21 2Q 21 3Q 21
GM Stellantis Growth Retail Auto - Weighted average FICO
(% of $ originations)
31%36%
31% 30% 26%
14%13%
13% 14%10%
55% 51% 56% 56%64%
11% 9% 9% 10% 10%
3Q 20 4Q 20 1Q 21 2Q 21 3Q 21
New Retail Lease Used Nonprime % of Total Retail
($ billions)
$73.5 $73.4 $73.8 $75.8 $77.7$9.5 $9.6 $9.9 $10.7 $11.0
$82.9 $83.1 $83.8 $86.5 $88.7
$21.3 $22.4 $21.3$16.3 $13.9
3Q 20 4Q 20 1Q 21 2Q 21 3Q 21
Retail (EoP) Lease (EoP) Commercial Auto (Avg)

18
3Q 2021 Preliminary Results
$275 $250 $240 $236 $269 $242 $269 $274 $242
$82 $85 $77
$31
$64 $70
$64 $27 $53
$333$301
$357 $335 $317 $267
$333 $312 $295
3Q 19 4Q 19 1Q 20 2Q 20 3Q 20 4Q 20 1Q 21 2Q 21 3Q 21
F&I P&C
$3.8$3.6
$3.6
$0.6 $1.1 $1.0
$1.4$1.6 $1.8
$5.7 $6.3 $6.4
3Q 19 4Q 19 1Q 20 2Q 20 3Q 20 4Q 20 1Q 21 2Q 21 3Q 21
Fixed Income Securities Equity Securities Cash & Cash Equivalents and Other
Insurance
(1) Represents a non-GAAP financial measure. See page 39 for calculation methodology and details.
For additional footnotes see page 32.
• Insurance pre-tax income of $24 million and core pre-tax income, excluding the change in fair value of equities of $89 million in 3Q 2021
– Loss claims declined YoY driven by favorable weather losses
– Investment income higher YoY and QoQ reflecting realized gain
activity and growth in the $6.4 billion investment portfolio
• Written premiums of $295 million in 3Q 2021, despite lower industry inventories and unit sales
– $242 million in consumer F&I product written premiums, down 10%
YoY, impacted by vehicle sales
– P&C premiums of $53 million continue to be impacted by supply
chain disruptions and prevailing vehicle inventory constraints
Insurance Written PremiumsInsurance Investment Portfolio($ millions)
F&I: Finance and insurance products. P&C: Property and casualty insurance.
Key Financials ($ millions) 3Q 21 2Q 21 3Q 20
Premiums, service revenue earned and other 282$ (1)$ 3$
VSC Losses 33 - (1)
Weather Losses 11 (4) (15)
Other Losses 25 (1) (0)
Losses and loss adjustment expenses 69 (5) (16)
Acquisition and underwriting expenses (2) 204 6 21
Total underwriting income 9 (2) (2)
Investment income and other (adjusted)(1) 80 24 26
Core pre-tax income(1) 89$ 22$ 24$
Change in fair value of equity securities (3) (65) (85) (78)
Pre-tax income 24$ (63)$ (54)$
Total assets (EOP) 9,354$ (40)$ 410$
Key Statistics - Insurance Ratios 3Q 21 2Q 21 3Q 20
Loss ratio 24.4% 26.3% 30.3%
Underwriting expense ratio 72.0% 70.4% 65.8%
Combined ratio 96.4% 96.7% 96.1%
Inc / (Dec) v.
($ billions, EOP)

19
3Q 2021 Preliminary Results
Corporate Finance• Corporate Finance pre-tax income of $61 million, and
core pre-tax income, excluding the change in fair value of equities, of $60 million in 3Q 2021
– Revenues reflect strong fee income, the QoQ decline in other
revenue was driven by elevated 2Q’21 investment gain activity
– Strong credit performance reflects disciplined approach to
underwriting and servicing
• $6.6 billion HFI loans grew 7% QoQ and 12% YoY
– Strong pipeline activity and $4.6 billion of unfunded commitments,
positions Ally for ongoing portfolio expansion
Asset Based Lending
54% 99.9%First Lien
Key Portfolio MetricsOutstandings by Industry (as of 9/30/21)
HFI Loans and Unfunded Commitments~75%Loans with
interest rate floors
(1) Represents a non-GAAP financial measure. See page 39 for calculation methodology and details.
For additional footnotes see page 32.
(end of period balances, $ billions)
$5.9 $6.0 $6.3 $6.2 $6.6
$3.8 $4.1 $4.7 $4.3
$4.6
3Q 20 4Q 20 1Q 21 2Q 21 3Q 21
Held-for-investment loans Unfunded Commitments
Food And Beverages
1%
Financial Services33%
Health Services18%
Other Services17%
Retail Trade1%
Auto & Transportation
8%
Machinery. Equip. Elect.
6%
Other Manufactured Prod.2%
Wholesale2%
Lumber Wood Furnitures &
Fixtures2%
Chemicals & Metals
9%
Other1% Paper Printing &
Publishing
1%
Other
Services
Manufacturing
Key Financials ($ millions) 3Q 21 2Q 21 3Q 20
Net financing revenue 77$ -$ 2$
Adjusted total other revenue (1) 15 (19) 7
Adjusted total net revenue (1) 92 (19) 9
Provision for credit losses 5 18 4
Noninterest expense(2) 27 (1) 4
Core pre-tax income (1) 60$ (36)$ 1$
Change in fair value of equity securities (3) 1 2 0
Pre-tax income 61$ (34)$ 1$
Total assets (EOP) 6,729$ 483$ 734$
Inc / (Dec) v.

20
3Q 2021 Preliminary Results
Mortgage Finance• Mortgage pre-tax income of $6 million in 3Q 2021
– Net financing revenue trends reflect ongoing elevated
prepayment activity mitigated by increased direct to consumer
lending activity
– Other revenue down QoQ as origination mix shifted from HFS
to HFI and gain on sale margins moderated
• Direct-to-Consumer (DTC) originations of $3.6 billion in 3Q 2021, up 60% QoQ and 176% YoY
– 30% of 3Q originations from Ally Bank deposit customers
– 69% of origination units from refinance activity, up 120% YoY
Mortgage Finance Held-for-Investment AssetsMortgage Finance DTC Originations
See page 33 for footnotes
($ billions, EOP)($ billions)
$11.2 $10.7 $8.5 $8.8 $9.0
$3.9 $3.9
$3.9 $4.8 $7.0
$15.1 $14.6
$12.4$13.6
$16.0
3Q 20 4Q 20 1Q 21 2Q 21 3Q 21
Bulk DTC
34% 38% 42%64%
78%
66% 62%58%
36%
22%
$1.3 $1.4 $1.8
$2.2
$3.6
3Q 20 4Q 20 1Q 21 2Q 21 3Q 21
DTC - HFI DTC - HFS
Key Financials ($ millions) 3Q 21 2Q 21 3Q 20
Net financing revenue 36$ 13$ 6$
Total other revenue 19 (3) (17)
Total net revenue 55$ 10$ (11)$
Provision for credit losses 2 2 2
Noninterest expense(1) 47 2 7
Pre-tax income 6$ 6$ (20)$
Total assets (EOP) 16,328$ 2,463$ 825$
Mortgage Finance HFI Portfolio 3Q 21 2Q 21 3Q 20
Net Carry Value ($ billions) 16.0$ 13.6$ 15.1$
Wtd. Avg. LTV/CLTV (2) 57.6% 58.8% 60.3%
Refreshed FICO 776 776 776
Inc / (Dec) v.
21
3Q 2021 Preliminary Results
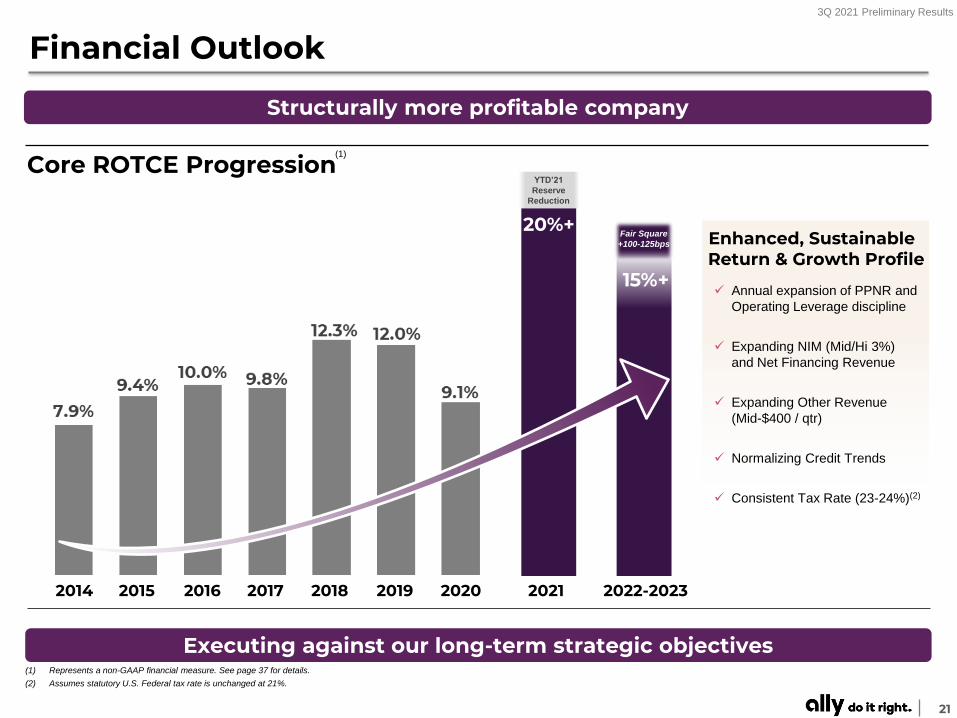
Financial Outlook
(1) Represents a non-GAAP financial measure. See page 37 for details.
(2) Assumes statutory U.S. Federal tax rate is unchanged at 21%.
Core ROTCE Progression
✓ Annual expansion of PPNR and
Operating Leverage discipline
✓ Expanding NIM (Mid/Hi 3%)
and Net Financing Revenue
✓ Expanding Other Revenue
(Mid-$400 / qtr)
✓ Normalizing Credit Trends
✓ Consistent Tax Rate (23-24%)(2)
(1)
Executing against our long-term strategic objectives
2014 2015 2016 2017 2018 2019 2020 2021 2022-2023
9.8%
12.3% 12.0%
9.1%
20%
15%+
2017 2018 2019 2020 2021 2022
YTD’21
Reserve
Reduction
Enhanced, Sustainable Return & Growth Profile
Structurally more profitable company
Fair Square
+100-125bps
7.9%9.4%
10.0% 9.8%
12.3% 12.0%
9.1%
20%+
15%+
2014 2015 2016 2017 2018 2019 2020 2021 2022

22
3Q 2021 Preliminary Results
Strategic Priorities
Leading, adaptable Auto and Insurance and digitally-based Ally Bank platforms
Ongoing customer growth and relationship deepening across scalable platforms
Sustainable growth in evolving and expanded product offerings
Efficient, disciplined risk management and capital deployment
Long-term execution driving sustainable results and enhanced value
Servicing & Customer
Solutions
PaymentsPoS & Card
Investing
Savings & Checking
Consumer &
CommercialLender
Insurance
‘Do It Right’ Culture
Driving enhanced long-term value

23
3Q 2021 Preliminary Results
Supplemental

24
3Q 2021 Preliminary Results
Results by SegmentSupplemental
(1) Represents a non-GAAP financial measure. See pages 39 and 40 for calculation methodology and details.
See page 33 for additional footnotes.
Core pre-tax income Walk
Segment Detail ($ millions) 3Q 21 2Q 21 3Q 20 2Q 21 3Q 20
Automotive Finance 825$ 917$ 566$ (92)$ 259$
Insurance 24 87 78 (63) (54)
Dealer Financial Services 849$ 1,004$ 644$ (155)$ 205$
Corporate Finance 61 95 60 (34) 1
Mortgage Finance 6 - 26 6 (20)
Corporate and Other (9) (57) (98) 48 89
Pre-tax income from continuing operations 907$ 1,042$ 632$ (135)$ 275$
Core OID (1) 9 9 9 (0) 0
Change in fair value of equity securities (2) 65 (19) (13) 84 78
Repositioning and other (3) 52 70 - (18) 52
Core pre-tax income (1) 1,032$ 1,102$ 628$ (69)$ 405$
Inc / (Dec) v.

25
3Q 2021 Preliminary Results
Funding Profile DetailsSupplemental
(1) Excludes retail notes and trust preferred securities; as of 9/30/2021.
(2) Reflects notional value of outstanding bond. Excludes total GAAP OID and capitalized transaction costs.
(3) Weighted average coupon based on notional value and corresponding coupon for all unsecured bonds as of
January 1st of the respective year. Does not reflect weighted average interest expense for the respective year.
2025+ excludes Trust Preferred securities (excluding OID/issuance costs). Note: Term ABS shown includes funding amounts (notes sold) at new issue and does not include private
offerings sold later. Excludes $2.35 billion of preferred equity issued in 2021.
$5.4 $0.9 $0.0 $0.0 $0.0$0.8 $2.8
Funding Mix
Unsecured Long-Term Debt Maturities(1) Wholesale Funding Issuance
Note: Other includes sweep deposits, mortgage escrow and other deposits.
Deposit Mix
($ billions)
Term Unsecured Issuance
$1.8 $2.4
$4.6
$3.0 $3.5
$1.3
$1.4
$2.6
$4.0
$2.5
$0.5 $1.8
$0.8
$7.9
$4.9
$6.5 $7.3
$3.5
2015 2016 2017 2018 2019 2020 2021
AART (Ally Bank - Retail Auto) AMOT (Ally Bank - Floorplan)
AFIN (AFI-Retail Auto) AART-SN (Ally Bank - Lease)Principal Amount
Outstanding(2)
($ billions)
2022 4.32 $1.05
2023 2.09 $2.00
2024 4.48 $1.45
2025+(3) 6.81 $4.79
Maturity Date Coupon
Note: Totals may not foot due to rounding.
65%74%
82%90%
6%
6%4%
1%
12%
12%7%
3%8%
8% 7% 6%
3Q 18 3Q 19 3Q 20 3Q 21
Deposits Secured Debt FHLB / Other Unsecured Debt
10% 9% 8% 7% 6%
34% 33% 30% 28% 27%
56% 58% 62% 65% 67%
0.00%
0.50%
1.00%
1.50%
2.00%
2.50%
3.00%
3Q 20 4Q 20 1Q 21 2Q 21 3Q21
Brokered / Other Retail CD MMA/OSA/Checking
No Deals Issued
26
3Q 2021 Preliminary Results
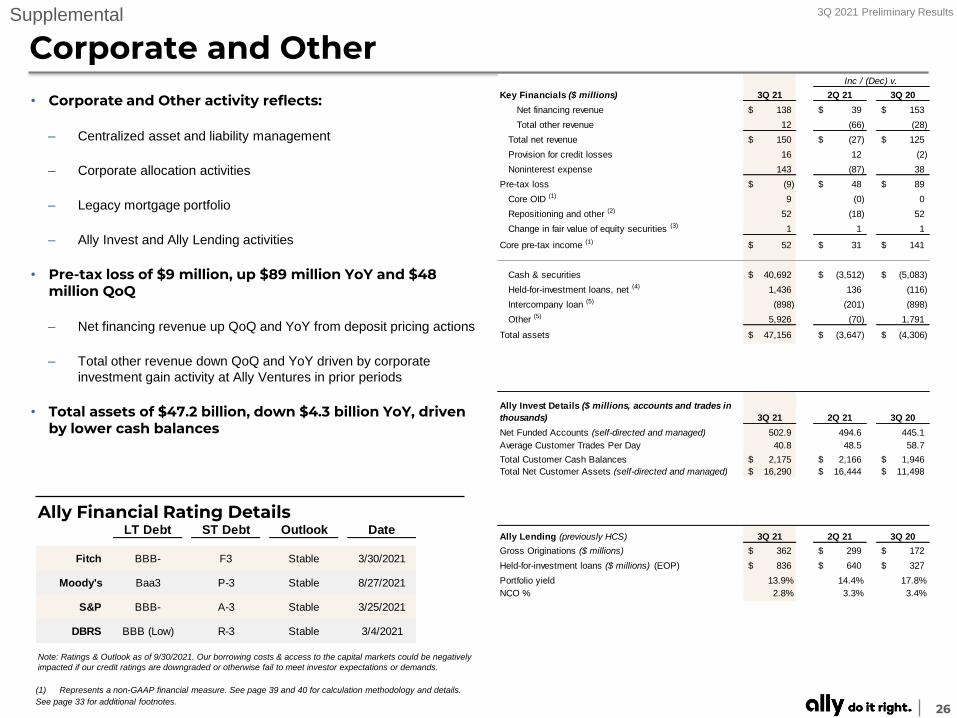
Corporate and Other
(1) Represents a non-GAAP financial measure. See page 39 and 40 for calculation methodology and details.
See page 33 for additional footnotes.
• Corporate and Other activity reflects:
– Centralized asset and liability management
– Corporate allocation activities
– Legacy mortgage portfolio
– Ally Invest and Ally Lending activities
• Pre-tax loss of $9 million, up $89 million YoY and $48 million QoQ
– Net financing revenue up QoQ and YoY from deposit pricing actions
– Total other revenue down QoQ and YoY driven by corporate
investment gain activity at Ally Ventures in prior periods
• Total assets of $47.2 billion, down $4.3 billion YoY, driven by lower cash balances
Supplemental
Note: Ratings & Outlook as of 9/30/2021. Our borrowing costs & access to the capital markets could be negatively
impacted if our credit ratings are downgraded or otherwise fail to meet investor expectations or demands.
Ally Financial Rating DetailsLT Debt ST Debt Outlook Date
Fitch BBB- F3 Stable 3/30/2021
Moody's Baa3 P-3 Stable 8/27/2021
S&P BBB- A-3 Stable 3/25/2021
DBRS BBB (Low) R-3 Stable 3/4/2021
Key Financials ($ millions) 3Q 21 2Q 21 3Q 20
Net financing revenue 138$ 39$ 153$
Total other revenue 12 (66) (28)
Total net revenue 150$ (27)$ 125$
Provision for credit losses 16 12 (2)
Noninterest expense 143 (87) 38
Pre-tax loss (9)$ 48$ 89$
Core OID (1) 9 (0) 0
Repositioning and other (2) 52 (18) 52
Change in fair value of equity securities (3) 1 1 1 - -
Core pre-tax income (1) 52$ 31$ 141$
Cash & securities 40,692$ (3,512)$ (5,083)$
Held-for-investment loans, net (4) 1,436 136 (116)
Intercompany loan (5) (898) (201) (898)
Other (5) 5,926 (70) 1,791
Total assets 47,156$ (3,647)$ (4,306)$
3Q 21 2Q 21 3Q 20
Net Funded Accounts (self-directed and managed) 502.9 494.6 445.1
Average Customer Trades Per Day 40.8 48.5 58.7
Total Customer Cash Balances 2,175$ 2,166$ 1,946$
Total Net Customer Assets (self-directed and managed) 16,290$ 16,444$ 11,498$
Ally Lending (previously HCS) 3Q 21 2Q 21 3Q 20
Gross Originations ($ millions) 362$ 299$ 172$
Held-for-investment loans ($ millions) (EOP) 836$ 640$ 327$
Portfolio yield 13.9% 14.4% 17.8%
NCO % 2.8% 3.3% 3.4%
Inc / (Dec) v.
Ally Invest Details ($ millions, accounts and trades in
thousands)

27
3Q 2021 Preliminary Results
Interest Rate Risk SensitivitiesSupplemental
(1) Net financing revenue impacts reflect a rolling 12-month view. See page 31 for additional details.
(2) Gradual changes in interest rates are recognized over 12 months.
(3) The -100bps shock has been replaced with a -25bps shock, given low interest rate environment. Model assumes OSA rate near current pricing levels in down shock scenarios.
Net Financing Revenue Sensitivity Analysis (1)
Change in interest rates Gradual (2) Instantaneous Gradual (2) Instantaneous
-25 bps (3) (27)$ (54)$ (43)$ (96)$
+100 bps 70$ 53$ (71)$ (70)$
Stable rate environment n/m (29)$ n/m (27)$
3Q 21 2Q 21
($ millions)

28
3Q 2021 Preliminary Results
(1) GAAP does not prescribe a method for calculating individual elements of deferred taxes for interim periods; therefore, these balances are estimates.
Deferred Tax AssetSupplemental
Note: 4Q19 to 1Q20 DTA build was significantly impacted by CECL adoption on 1-1-2020. 1Q21, 2Q21 and 3Q21 increase in DTA driven primarily by change in tax depreciation election.
Deferred Tax Asset / (Liability) Utilization
($ millions)
$137
$77
$2
$249
$871$839
$18 $17 $20 $36$75
$48
2Q 20 3Q 20 4Q 20 1Q 21 2Q 21 3Q 21
Net GAAP DTA Balance Disallowed DTA
Deferred Tax Asset 3Q 21(1) 2Q 21(1)
($ millions) Gross DTA
Balance
Valuation
Allowance
Net DTA
Balance
Net DTA
Balance
Net Operating Loss (Federal) 7$ -$ 7$ 8$
Tax Credit Carryforwards 918 (702) 216 266
State/Local Tax Carryforwards 220 (103) 117 121
Other Deferred Tax Assets, net 499 - 499 476
Net Deferred Tax Asset 1,644$ (805)$ 839$ 871$

29
3Q 2021 Preliminary Results
Fair Square Credit Card Offerings
Attractive, customer-centric product offerings
No Surprise
Fees
$0 Fraud
Liability
Free
FICO
Annual
Fee
Benefits &
Rewards
Platinum P P P $0e.g. No Balance
Transfer Fees
Rewards P P P $0 / $392% Gas, Grocery, Phrmc'y
1% Everyw here Else
Rewards+Nurses & Educators
P P P $0 2% Cash Back
OptimumPilot launched in '21
P P P $0 2.5% Cash Back

30
3Q 2021 Preliminary Results
Notes on Non-GAAP Financial MeasuresSupplemental
1) Core pre-tax income is a non-GAAP financial measure that adjusts pre-tax income from continuing operations by excluding (1) Core OID, and (2) equity fair value
adjustments related to ASU 2016-01 which requires change in the fair value of equity securities to be recognized in current period net income as compared to
periods prior to 1/1/18 in which such adjustments were recognized through other comprehensive income, a component of equity (change in fair value of equity
securities impacts the Insurance and Corporate Finance segments), and (3) Repositioning and other which are primarily related to the extinguishment of high cost
legacy debt, strategic activities and significant other one-time items, as applicable for respective periods or businesses. Management believes core pre-tax income
can help the reader better understand the operating performance of the core businesses and their ability to generate earnings. See page 39 for calculation
methodology and details.
2) Core pre-provision net revenue (Core PPNR) is a non-GAAP financial measure calculated by adjusting Core pre-tax income to add back provision for credit
losses. Management believes that Core PPNR is a helpful financial metric because it enables the reader to assess the core business' ability to generate earnings to
cover credit losses and as it is utilized by Federal Reserve's approach to modeling within the Supervisory Stress Test Framework that generally follows U.S.
generally accepted accounting principles (GAAP) and includes a calculation of PPNR as a component of projected pre-tax net income.
3) Core net income attributable to common shareholders is a non-GAAP financial measure that serves as the numerator in the calculations of Adjusted EPS and
Core ROTCE and that, like those measures, is believed by management to help the reader better understand the operating performance of the core businesses and
their ability to generate earnings. Core net income attributable to common shareholders adjusts GAAP net income attributable to common shareholders for
discontinued operations net of tax, tax-effected Core OID expense, tax-effected repositioning and other primarily related to the extinguishment of high-cost legacy
debt and strategic activities and significant other, preferred stock capital actions, significant discrete tax items and tax-effected changes in equity investments
measured at fair value, as applicable for respective periods. See page 34 calculation methodology and details.
4) Tangible Common Equity is a non-GAAP financial measure that is defined as common stockholders’ equity less goodwill and identifiable intangible assets , net of
deferred tax liabilities. Ally considers various measures when evaluating capital adequacy, including tangible common equity. Ally believes that tangible common
equity is important because we believe readers may assess our capital adequacy using this measure. Additionally, presentation of this measure allows readers to
compare certain aspects of our capital adequacy on the same basis to other companies in the industry. For purposes of calculating Core return on tangible common
equity (Core ROTCE), tangible common equity is further adjusted for Core OID balance and net deferred tax asset. See page 35 for more details.
5) Core original issue discount (Core OID) amortization expense is a non-GAAP financial measure for OID and is believed by management to help the reader
better understand the activity removed from: Core pre-tax income (loss), Core net income (loss) attributable to common shareholders, Adjusted EPS, Core ROTCE,
Adjusted efficiency ratio, Adjusted total net revenue, and Net financing revenue (excluding Core OID). Core OID is primarily related to bond exchange OID which
excludes international operations and future issuances. Core OID for all periods shown is applied to the pre-tax income of the Corporate and Other segment. See
page 40 calculation methodology and details.
6) Core outstanding original issue discount balance (Core OID balance) is a non-GAAP financial measure for outstanding OID and is believed by management to
help the reader better understand the balance removed from Core ROTCE and Adjusted TBVPS. Core OID balance is primarily related to bond exchange OID
which excludes international operations and future issuances. See page 40 for calculation methodology and details
7) Accelerated issuance expense (Accelerated OID) is the recognition of issuance expenses related to calls of redeemable debt.
The following are non-GAAP financial measures which Ally believes are important to the reader of the Consolidated Financial Statements, but which are
supplemental to, and not a substitute for, GAAP measures: Adjusted Earnings per Share (Adjusted EPS), Core pre-tax income, Pre-provision net revenue
(PPNR) and Core pre-provision net revenue (Core PPNR), Core net income attributable to common shareholders, Core return on tangible common equity
(Core ROTCE), Adjusted efficiency ratio, Adjusted total net revenue, Adjusted other revenue, Adjusted noninterest expense, Core original issue discount
(Core OID) amortization expense and Core outstanding original issue discount balance (Core OID balance), Net financing revenue (excluding Core OID), and
Adjusted tangible book value per share (Adjusted TBVPS). These measures are used by management, and we believe are useful to investors in assessing
the company’s operating performance and capital. For calculation methodology, refer to the Reconciliation to GAAP later in this document.

31
3Q 2021 Preliminary Results
Notes on Other Financial MeasuresSupplemental
8) Estimated Retail Auto Originated Yield is a forward-looking non-GAAP financial measure determined by calculating the estimated average annualized yield for
loans originated during the period. At this time there currently is no comparable GAAP financial measure for Estimated Retail Auto Originated Yield and therefore
this forecasted estimate of yield at the time of origination cannot be quantitatively reconciled to comparable GAAP information.
9) Interest rate risk modeling – We prepare our forward-looking baseline forecasts of net financing revenue taking into consideration anticipated future business
growth, asset/liability positioning, and interest rates based on the implied forward curve. The analysis is highly dependent upon a variety of assumptions including
the repricing characteristics of retail deposits with both contractual and non-contractual maturities. We continually monitor industry and competitive repricing activity
along with other market factors when contemplating deposit pricing actions. Please see our SEC filings for more details.
10) Net charge-off ratios are calculated as annualized net charge-offs divided by average outstanding finance receivables and loans excluding loans measured at fair
value and loans held-for-sale.
11) U.S. consumer auto originations
▪ New Retail – standard and subvented rate new vehicle loans
▪ Lease – new vehicle lease originations
▪ Used – used vehicle loans
▪ Growth – total originations from non-GM/Stellantis dealers and direct-to-consumer loans. Note: Stellantis N.V. (“Stellantis”) announced January 17, 2021,
following completion of the merger of Peugeot S.A. (“Groupe PSA”) and Fiat Chrysler Automobiles N.V. (“FCA”) on January 16, 2021, the combined
company was renamed Stellantis.
▪ Nonprime – originations with a FICO® score of less than 620
12) Customer retention rate is the annualized 3-month rolling average of 1 minus the monthly attrition rate; excludes escheatment.
13) Estimated impact of CECL on regulatory capital per final rule issued by U.S. banking agencies - In December 2018, the FRB and other U.S. banking
agencies approved a final rule to address the impact of CECL on regulatory capital by allowing BHCs and banks, including Ally, the option to phase in the day-one
impact of CECL over a three-year period. In March 2020, the FRB and other U.S. banking agencies issued an interim final rule that became effective on March 31,
2020 and provided an alternative option for banks to temporarily delay the impacts of CECL, relative to the incurred loss methodology for estimating the allowance
for loan losses, on regulatory capital. A final rule that was largely unchanged from the March 2020 interim final rule was issued by the FRB and other U.S. banking
agencies in August 2020, and became effective in September 2020. For regulatory capital purposes, these rules permitted us to delay recognizing the estimated
impact of CECL on regulatory capital until after a two-year deferral period, which for us extends through December 31, 2021. Beginning on January 1, 2022, we will
be required to phase in 25% of the previously deferred estimated capital impact of CECL, with an additional 25% to be phased in at the beginning of each
subsequent year until fully phased in by the first quarter of 2025. Under these rules, firms that adopt CECL and elect the five-year transition will calculate the
estimated impact of CECL on regulatory capital as the day-one impact of adoption plus 25% of the subsequent change in allowance during the two-year deferral
period, which according to the final rule approximates the impact of CECL relative to an incurred loss model. We adopted this transition option during the first
quarter of 2020, and plan to phase in the regulatory capital impacts of CECL based on this five-year transition period.
14) Change in fair value of equity securities impacts the Insurance, Corporate Finance and Corporate Other segments. Reflects equity fair value adjustments related
to ASU 2016-01 which requires change in the fair value of equity securities to be recognized in current period net income as compared to periods prior to 1/1/18 in
which such adjustments were recognized through other comprehensive income, a component of equity.

32
3Q 2021 Preliminary Results
Additional NotesSupplemental
Page – 16 | Auto Finance
(1) Noninterest expense includes corporate allocations of $233 million in 3Q 2021, $218 million in 2Q 2021, and $190 million in 3Q 2020.
(2) ‘Active U.S. Dealers’ defined as all dealers who utilize one or more of Ally’s products including consumer & commercial lending, SmartAuction or Commercial
Services Group and excludes RV Commercial & Consumer lines of business exited in 2Q 2018.
Page – 15 | Ally Bank: Leading, Growing, All-Digital Disruptor
(1) Source: FDIC, FFIEC Call Reports and Company filings of branchless banks including Marcus, Discover, American Express, Synchrony.
Page – 17 | Auto Finance: Agile Market Leader
(1) ‘Prime Auto Lender’ - Source: PIN Navigator Data & Analytics, a business division of J.D. Power. The credit scores provided within these reports have been provided
by FICO® Risk Score, Auto 08 FICO® is a registered trademark of Fair Isaac Corporation in the United States and other countries. Ally management defines retail
auto market segmentation (unit based) for consumer automotive loans primarily as those loans with a FICO® Score (or an equivalent score) at origination by the
following:
• Super-prime 720+
• Prime 620 - 719
• Nonprime less than 620
(2) ‘Bank Floorplan Lender’ - Source: Company filings, including WFC and HBAN.
(3) ‘Retail Auto Loan Outstandings’ - Source: Big Wheels Auto Finance Data 2021.
(4) ‘#1 Dealer Satisfaction among Non-Captive Lenders with Sub-Prime Credit’ - Source: J.D. Power.
(5) ‘Active U.S. Dealers’ defined as all dealers who utilize one or more of Ally’s products including consumer & commercial lending, SmartAuction or Commercial
Services Group and excludes RV Commercial & Consumer lines of business exited in 2Q 2018.
Page – 18 | Insurance
Page – 19 | Corporate Finance
(2) Noninterest expense includes corporate allocations of $10 million in 3Q 2021, $9 million in 2Q 2021, and $8 million in 3Q 2020.
(3) Change in fair value of equity securities impacts the Corporate Finance segment. Reflects equity fair value adjustments related to ASU 2016-01 which requires
change in the fair value of equity securities to be recognized in current period net income as compared to periods prior to 1/1/18 in which such adjustments were
recognized through other comprehensive income, a component of equity.
(2) Acquisition and underwriting expenses includes corporate allocations of $22 million in 3Q 2021, $20 million in 2Q 2021, and $17 million in 3Q 2020.
(3) Change in fair value of equity securities impacts the Insurance segment. Reflects equity fair value adjustments related to ASU 2016-01 which requires change in the
fair value of equity securities to be recognized in current period net income as compared to periods prior to 1/1/18 in which such adjustments were recognized through
other comprehensive income, a component of equity.

33
3Q 2021 Preliminary Results
Additional NotesSupplemental
Page – 26 | Corporate and Other
(2) Repositioning and other which are primarily related to the extinguishment of high-cost legacy debt, strategic activities and significant other one-time items, as
applicable for respective periods or businesses.
(3) Change in fair value of equity securities impacts the Corporate and Other segment. Reflects equity fair value adjustments related to ASU 2016-01 which requires
change in the fair value of equity securities to be recognized in current period net income as compared to periods prior to 1/1/18 in which such adjustments were
recognized through other comprehensive income, a component of equity.
(4) HFI legacy mortgage portfolio and HFI Ally Lending portfolio.
(5) Intercompany loan related to activity between Insurance and Corporate for liquidity purposes from the wind down of the Demand Notes program. Includes loans held-
for-sale.
(2) Change in fair value of equity securities impacts the Insurance, Corporate Finance and Corp/Other segments. Reflects equity fair value adjustments related to ASU
2016-01 which requires change in the fair value of equity securities to be recognized in current period net income as compared to periods prior to 1/1/18 in which such
adjustments were recognized through other comprehensive income, a component of equity.
(3) Repositioning and other which are primarily related to the extinguishment of high-cost legacy debt, strategic activities and significant other one-time items, as
applicable for respective periods or businesses.
Page – 24 | Results by Segment
Page – 20 | Mortgage Finance
(1) Noninterest expense includes corporate allocations of $24 million in 3Q 2021, $21 million in 2Q 2021, and $19 million in 3Q 2020.
(2) 1st lien only. Updated home values derived using a combination of appraisals, Broker price opinion (BPOs), Automated Valuation Models (AVMs) and Metropolitan
Statistical Area (MSA) level house price indices.

34
3Q 2021 Preliminary Results
GAAP to Core Results: Adjusted EPS - QuarterlySupplemental
Adjusted earnings per share (Adjusted EPS) is a non-GAAP financial measure that adjusts GAAP EPS for revenue and expense items that are typically strategic in nature or
that management otherwise does not view as reflecting the operating performance of the company. Management believes Adjusted EPS can help the reader better understand
the operating performance of the core businesses and their ability to generate earnings. In the numerator of Adjusted EPS, GAAP net income attributable to common shareholders
is adjusted for the following items: (1) excludes discontinued operations, net of tax, as Ally is primarily a domestic company and sales of international businesses and other
discontinued operations in the past have significantly impacted GAAP EPS, (2) adds back the tax-effected non-cash Core OID, (3) adjusts for tax-effected repositioning and other
which are primarily related to the extinguishment of high cost legacy debt, strategic activities and significant other one-time items, (4) excludes equity fair value adjustments (net of
tax) related to ASU 2016-01 which requires change in the fair value of equity securities to be recognized in current period net income as compared to periods prior to 1/1/18 in
which such adjustments were recognized through other comprehensive income, a component of equity, (5) excludes significant discrete tax items that do not relate to the
operating performance of the core businesses, and adjusts for preferred stock capital actions (e.g., Series A and Series G) that have been taken by the company to normalize its
capital structure, as applicable for respective periods.
Adjusted Earnings per Share ("Adjusted EPS")
3Q 21 2Q 21 1Q 21 4Q 20 3Q 20 2Q 20 1Q 20 4Q 19 3Q 19 2Q 19 1Q 19 4Q 18 3Q 18
Numerator ($ millions)
GAAP net income / (loss) attributable to common shareholders 683$ 900$ 796$ 687$ 476$ 241$ (319)$ 378$ 381$ 582$ 374$ 290$ 374$
Discontinued operations, net of tax - (1) - - - 1 - 3 - 2 1 (1) -
Core OID 9 9 10 9 9 9 8 8 7 7 7 23 22
Repositioning Items 52 70 - - - 50 - - - - - - -
Change in fair value of equity securities 65 (19) (17) (111) (13) (90) 185 (29) 11 (2) (70) 95 (6)
Tax on Core OID, Repo & change in fair value of equity securities
(assumes 21% tax rate) (26) (13) 1 21 1 17 (41) 4 (4) (1) 13 (25) (3)
Significant discrete tax items - (78) - - - - - - - (201) - - -
Core net income / (loss) attributable to common shareholders [a] 782$ 868$ 790$ 606$ 473$ 228$ (166)$ 364$ 396$ 387$ 325$ 382$ 386$
Denominator
Weighted-average common shares outstanding - (Diluted, thousands) [b] 361,855 373,029 377,529 378,424 377,011 375,762 375,723 383,391 392,604 399,916 405,959 414,750 424,784
Metric
GAAP EPS 1.89$ 2.41$ 2.11$ 1.82$ 1.26$ 0.64$ (0.85)$ 0.99$ 0.97$ 1.46$ 0.92$ 0.70$ 0.88$
Discontinued operations, net of tax - (0.00) - - - 0.00 - 0.01 - 0.01 0.00 (0.00) -
Core OID 0.03 0.02 0.03 0.02 0.02 0.02 0.02 0.02 0.02 0.02 0.02 0.06 0.05
Change in fair value of equity securities 0.18 (0.05) (0.04) (0.29) (0.04) (0.24) 0.49 (0.08) 0.03 (0.01) (0.17) 0.23 (0.01)
Repositioning Items 0.14 0.19 - - - 0.13 - - - - - - -
Tax on Core OID, Repo & change in fair value of equity securities
(assumes 21% tax rate) (0.07) (0.03) 0.00 0.06 0.00 0.05 (0.11) 0.01 (0.01) (0.00) 0.03 (0.06) (0.01)
Significant discrete tax items - (0.21) - - - - - - - (0.50) - - -
Adjusted EPS [a] / [b] 2.16$ 2.33$ 2.09$ 1.60$ 1.25$ 0.61$ (0.44)$ 0.95$ 1.01$ 0.97$ 0.80$ 0.92$ 0.91$
QUARTERLY TREND

35
3Q 2021 Preliminary Results
GAAP to Core Results: Adjusted TBVPS - QuarterlySupplemental
Adjusted tangible book value per share (Adjusted TBVPS) is a non-GAAP financial measure that reflects the book value of equity attributable to shareholders even if Core
OID balance were accelerated immediately through the financial statements. As a result, management believes Adjusted TBVPS provides the reader with an assessment of
value that is more conservative than GAAP common shareholder’s equity per share. Adjusted TBVPS generally adjusts common equity for: (1) goodwill and identifiable
intangibles, net of DTLs, (2) tax-effected Core OID balance to reduce tangible common equity in the event the corresponding discounted bonds are redeemed/tendered, and (3)
Series G discount which reduces tangible common equity as the company has normalized its capital structure, as applicable for respective periods.
Note: In December 2017, tax-effected Core OID balance was adjusted from a statutory U.S. Federal tax rate of 35% to 21% (“rate”) as a result of changes to U.S. tax law. The
adjustment conservatively increased the tax-effected Core OID balance and consequently reduced Adjusted TBVPS as any acceleration of the non-cash charge in future periods
would flow through the financial statements at a 21% rate versus a previously modeled 35% rate.
Calculated Impact to Adjusted TBVPS from CECL Day-1
1Q 20
Numerator ($ billions)
Adjusted tangible book value 12.2$
CECL Day-1 impact to retained earnings, net of tax 1.0
Adjusted tangible book value less CECL Day-1 impact [a] 13.3$
Denominator
Issued shares outstanding (period-end, thousands) [b] 373,155
Metric
Adjusted TBVPS 32.8$
CECL Day-1 impact to retained earnings, net of tax per share 2.7
Adjusted tangible book value, less CECL Day-1 impact per share [a] / [b] 35.5$
Ally adopted CECL on January 1, 2020. Upon implementation of CECL Ally recognized a reduction to our opening retained earnings balance of approximately $1.0 billion, net
of income tax, which reflects a pre-tax increase to the allowance for loan losses of approximately $1.3 billion. This increase is almost exclusively driven by our consumer
automotive loan portfolio.
Adjusted Tangible Book Value per Share ("Adjusted TBVPS")
3Q 21 2Q 21 1Q 21 4Q 20 3Q 20 2Q 20 1Q 20 4Q 19 3Q 19 2Q 19 1Q 19 4Q 18 3Q 18
Numerator ($ billions)
GAAP shareholder's equity 17.3$ 17.5$ 14.6$ 14.7$ 14.1$ 13.8$ 13.5$ 14.4$ 14.5$ 14.3$ 13.7$ 13.3$ 13.1$
less: Preferred equity (2.3) (2.3) - - - - - - - - - - -
GAAP common shareholder's equity 15.0$ 15.2$ 14.6$ 14.7$ 14.1$ 13.8$ 13.5$ 14.4$ 14.5$ 14.3$ 13.7$ 13.3$ 13.1$
Goodwill and identifiable intangibles, net of DTLs (0.4) (0.4) (0.4) (0.4) (0.4) (0.4) (0.4) (0.5) (0.3) (0.3) (0.3) (0.3) (0.3)
Tangible common equity 14.6 14.8 14.2 14.3 13.7 13.4 13.1 14.0 14.2 14.0 13.4 13.0 12.8
Tax-effected Core OID balance
(assumes 21% tax rate) (0.7) (0.8) (0.8) (0.8) (0.8) (0.8) (0.8) (0.8) (0.8) (0.9) (0.9) (0.9) (0.9)
Adjusted tangible book value [a] 13.9$ 14.1$ 13.4$ 13.5$ 12.9$ 12.6$ 12.2$ 13.1$ 13.3$ 13.2$ 12.6$ 12.1$ 11.9$
Denominator
Issued shares outstanding (period-end, thousands) [b] 349,599 362,639 371,805 374,674 373,857 373,837 373,155 374,332 383,523 392,775 399,761 404,900 416,591
Metric
GAAP common shareholder's equity per share 42.8$ 41.9$ 39.3$ 39.2$ 37.8$ 37.0$ 36.2$ 38.5$ 37.7$ 36.4$ 34.3$ 32.8$ 31.4$
Goodwill and identifiable intangibles, net of DTLs per share (1.1) (1.0) (1.0) (1.0) (1.0) (1.0) (1.2) (1.2) (0.7) (0.7) (0.7) (0.7) (0.7)
Tangible common equity per share 41.8 40.9 38.3 38.2 36.7 35.9 35.0 37.3 37.0 35.7 33.6 32.1 30.7
Tax-effected Core OID balance
(assumes 21% tax rate) per share (2.0) (2.1) (2.2) (2.2) (2.2) (2.2) (2.2) (2.2) (2.2) (2.2) (2.1) (2.1) (2.1)
Adjusted tangible book value per share [a] / [b] 39.7$ 38.8$ 36.2$ 36.1$ 34.6$ 33.7$ 32.8$ 35.1$ 34.7$ 33.6$ 31.4$ 29.9$ 28.6$
QUARTERLY TREND

36
3Q 2021 Preliminary Results
GAAP to Core Results: Core ROTCE - QuarterlySupplemental
Core return on tangible common equity (Core ROTCE) is a non-GAAP financial measure that management believes is helpful for readers to better understand the ongoing
ability of the company to generate returns on its equity base that supports core operations. For purposes of this calculation, tangible common equity is adjusted for Core OID balance and net DTA. Ally’s Core net income attributable to common shareholders for purposes of calculating Core ROTCE is based on the actual effective tax rate for the period adjusted for significant discrete tax items including tax reserve releases, which aligns with the methodology used in calculating adjusted earnings per share.
(1) In the numerator of Core ROTCE, GAAP net income attributable to common shareholders is adjusted for discontinued operations net of tax, tax-effected Core OID, tax-effected repositioning and other which are primarily related to the extinguishment of high cost legacy debt, strategic activi ties and significant other one-time items, fair
value adjustments (net of tax) related to ASU 2016-01 which requires change in the fair value of equity securities to be recognized in current period net income as compared to periods prior to 1/1/18 in which such adjustments were recognized through other comprehensive income, a component of equity, significant discrete tax items, and preferred stock capital actions, as applicable for respective periods.
(2) In the denominator, GAAP shareholder’s equity is adjusted for goodwill and identifiable intangibles net of DTL, Core OID balance, and net DTA.
Core Return on Tangible Common Equity ("Core ROTCE")
3Q 21 2Q 21 1Q 21 4Q 20 3Q 20 2Q 20 1Q 20 4Q 19 3Q 19 2Q 19 1Q 19 4Q 18 3Q 18
Numerator ($ millions)
GAAP net income / (loss) attributable to common shareholders 683$ 900$ 796$ 687$ 476$ 241$ (319)$ 378$ 381$ 582$ 374$ 290$ 374$
Discontinued operations, net of tax - (1) - - - 1 - 3 - 2 1 (1) -
Core OID 9 9 10 9 9 9 8 8 7 7 7 23 22
Repositioning Items 52 70 - - - 50 - - - - - - -
Change in fair value of equity securities 65 (19) (17) (111) (13) (90) 185 (29) 11 (2) (70) 95 (6)
Tax on Core OID, Repo & change in fair value of equity securities
(assumes 21% tax rate) (26) (13) 1 21 1 17 (41) 4 (4) (1) 13 (25) (3)
Significant discrete tax items & other - (78) - - - - - - - (201) - - -
Core net income / loss attributable to common shareholders [a] 782$ 868$ 790$ 606$ 473$ 228$ (166)$ 364$ 396$ 387$ 325$ 382$ 386$
Denominator (Average, $ billions)
GAAP shareholder's equity 17.4$ 16.1$ 14.7$ 14.4$ 14.0$ 13.7$ 14.0$ 14.4$ 14.4$ 14.0$ 13.5$ 13.2$ 13.1$
less: Preferred equity (2.3) (1.2) - - - - - - - - - - -
GAAP common shareholder's equity 15.1$ 14.9$ 14.7$ 14.4$ 14.0$ 13.7$ 14.0$ 14.4$ 14.4$ 14.0$ 13.5$ 13.2$ 13.1$
Goodwill & identifiable intangibles, net of deferred tax liabilities ("DTLs") (0.4) (0.4) (0.4) (0.4) (0.4) (0.4) (0.4) (0.4) (0.3) (0.3) (0.3) (0.3) (0.3)
Tangible common equity 14.7$ 14.5$ 14.3$ 14.0$ 13.6$ 13.3$ 13.5$ 14.1$ 14.1$ 13.7$ 13.2$ 12.9$ 12.8$
Core OID balance (0.9) (1.0) (1.0) (1.0) (1.0) (1.1) (1.1) (1.1) (1.1) (1.1) (1.1) (1.1) (1.1)
Net deferred tax asset ("DTA") (0.9) (0.6) (0.1) (0.1) (0.1) (0.2) (0.1) (0.0) (0.1) (0.1) (0.2) (0.4) (0.4)
Normalized common equity [b] 12.9$ 13.0$ 13.1$ 12.9$ 12.4$ 12.0$ 12.3$ 13.0$ 12.9$ 12.5$ 11.9$ 11.4$ 11.2$
Core Return on Tangible Common Equity [a] / [b] 24.2% 26.7% 24.1% 18.7% 15.2% 7.6% -5.4% 11.2% 12.3% 12.4% 10.9% 13.4% 13.7%
QUARTERLY TREND

37
3Q 2021 Preliminary Results
GAAP to Core Results: Core ROTCE - AnnualSupplemental
Core return on tangible common equity (Core ROTCE) is a non-GAAP financial measure that management believes is helpful for readers to better understand the ongoing
ability of the company to generate returns on its equity base that supports core operations. For purposes of this calculation, tangible common equity is adjusted for Core OID balance and net DTA. Ally’s Core net income attributable to common shareholders for purposes of calculating Core ROTCE is based on the actual effective tax rate for the period adjusted for significant discrete tax items including tax reserve releases, which aligns with the methodology used in calculating adjusted earnings per share.
(1) In the numerator of Core ROTCE, GAAP net income attributable to common shareholders is adjusted for discontinued operations net of tax, tax-effected Core OID, tax-effected repositioning and other which are primarily related to the extinguishment of high cost legacy debt, strategic activi ties and significant other one-time items, fair
value adjustments (net of tax) related to ASU 2016-01 which requires change in the fair value of equity securities to be recognized in current period net income as compared to periods prior to 1/1/18 in which such adjustments were recognized through other comprehensive income, a component of equity, significant discrete tax items, and preferred stock capital actions, as applicable for respective periods.
(2) In the denominator, GAAP shareholder’s equity is adjusted for goodwill and identifiable intangibles net of DTL, Core OID balance, and net DTA.
Core Return on Tangible Common Equity ("Core ROTCE")
FY 2020 FY 2019 FY 2018 FY 2017 FY 2016 FY 2015 FY 2014
Numerator ($ millions)
GAAP net income / (loss) attributable to common shareholders 1,085$ 1,715$ 1,263$ 929$ 1,037$ (1,282)$ 882$
Discontinued operations, net of tax 1 6 - (3) 44 (392) (225)
Core OID 36 29 86 71 59 59 186
Repositioning items 50 - - - 11 349 187
Change in fair value of equity securities (29) (89) 121 - - - -
Tax on Core OID & change in fair value of equity securities
(tax rate 21% starting in 1Q18, 35% prior) (1) 13 (43) (25) (24) (139) (127)
Significant discrete tax items & other - (201) - 119 (84) 22 (103)
Series G actions - - - - - 2,350 -
Series A actions - - - - 1 22 -
Core net income / (loss) attributable to common shareholders [a] 1,141$ 1,472$ 1,427$ 1,091$ 1,043$ 990$ 800$
Denominator (Average, $ billions)
GAAP shareholder's equity 14.1$ 13.8$ 13.4$ 13.4$ 13.4$ 14.4$ 14.8$
Preferred equity - - - - (0.3) (1.0) (1.3)
Goodwill & identifiable intangibles, net of deferred tax liabilities ("DTLs") (0.4) (0.4) (0.3) (0.3) (0.2) (0.0) (0.0)
Tangible common equity 13.7$ 13.5$ 13.1$ 13.1$ 12.9$ 13.4$ 13.5$
Core OID balance (1.0) (1.1) (1.1) (1.2) (1.3) (1.3) (1.4)
Net deferred tax asset ("DTA") (0.1) (0.2) (0.4) (0.7) (1.2) (1.6) (1.9)
Normalized common equity [b] 12.6$ 12.2$ 11.6$ 11.2$ 10.4$ 10.5$ 10.2$
Core Return on Tangible Common Equity [a] / [b] 9.1% 12.0% 12.3% 9.8% 10.0% 9.4% 7.9%
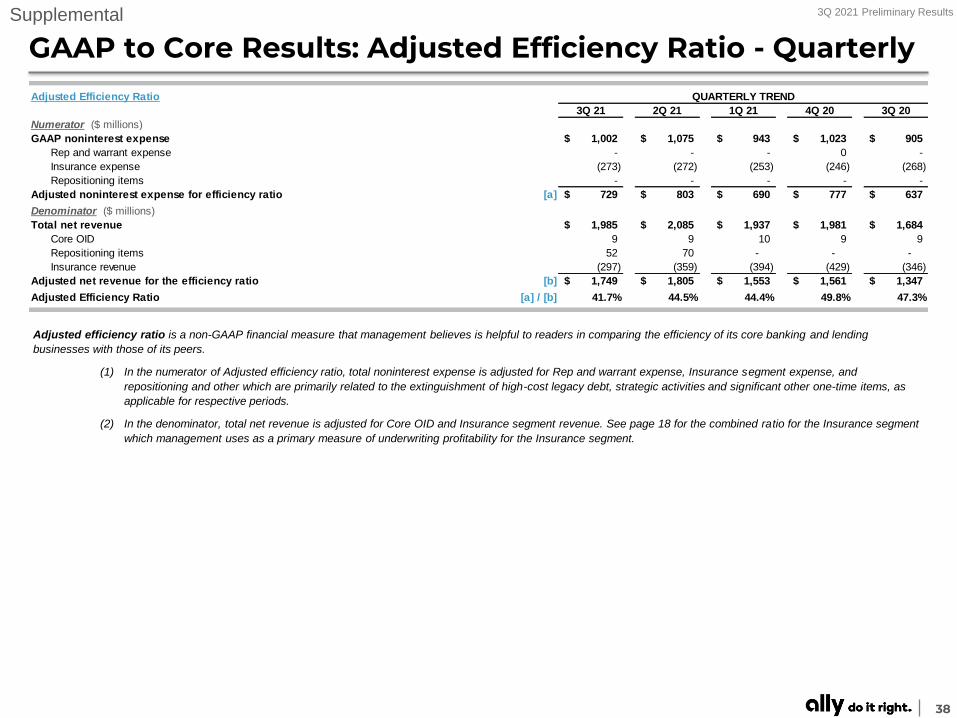
38
3Q 2021 Preliminary Results
GAAP to Core Results: Adjusted Efficiency Ratio - QuarterlySupplemental
Adjusted efficiency ratio is a non-GAAP financial measure that management believes is helpful to readers in comparing the efficiency of its core banking and lending
businesses with those of its peers.
(1) In the numerator of Adjusted efficiency ratio, total noninterest expense is adjusted for Rep and warrant expense, Insurance segment expense, and
repositioning and other which are primarily related to the extinguishment of high-cost legacy debt, strategic activities and significant other one-time items, as
applicable for respective periods.
(2) In the denominator, total net revenue is adjusted for Core OID and Insurance segment revenue. See page 18 for the combined ratio for the Insurance segment
which management uses as a primary measure of underwriting profitability for the Insurance segment.
Adjusted Efficiency Ratio
3Q 21 2Q 21 1Q 21 4Q 20 3Q 20
Numerator ($ millions)
GAAP noninterest expense 1,002$ 1,075$ 943$ 1,023$ 905$
Rep and warrant expense - - - 0 -
Insurance expense (273) (272) (253) (246) (268)
Repositioning items - - - - -
Adjusted noninterest expense for efficiency ratio [a] 729$ 803$ 690$ 777$ 637$
Denominator ($ millions)
Total net revenue 1,985$ 2,085$ 1,937$ 1,981$ 1,684$
Core OID 9 9 10 9 9
Repositioning items 52 70 - - -
Insurance revenue (297) (359) (394) (429) (346)
Adjusted net revenue for the efficiency ratio [b] 1,749$ 1,805$ 1,553$ 1,561$ 1,347$
Adjusted Efficiency Ratio [a] / [b] 41.7% 44.5% 44.4% 49.8% 47.3%
QUARTERLY TREND

39
3Q 2021 Preliminary Results
Non-GAAP Reconciliation – Core IncomeSupplemental
(1) Non-GAAP line items walk to Core pre-tax income, a non-GAAP financial measure that adjusts pre-tax income. See page 30 for definitions.
Note: Equity fair value adjustments related to ASU 2016-01 requires change in the fair value of equity securities to be recognized in current period net income as compared to periods prior to 1/1/18 in which such
adjustments were recognized through other comprehensive income, a component of equity.
($ millions)
GAAP Core OID
Change in fair
value of equity
securities
Repositioning Non-GAAP (1) GAAP Core OID
Change in fair
value of equity
securities
Repositioning Non-GAAP (1) GAAP Core OID
Change in fair
value of equity
securities
Repositioning Non-GAAP (1)
Consolidated Ally
Net financing revenue 1,594$ 9$ -$ -$ 1,603 1,547$ 9$ -$ -$ 1,556$ 1,200$ 9$ -$ -$ 1,209$
Total other revenue 391 - 65 52 507 538 - (19) 70 588 484 - (13) - 471
Provision for credit losses 76 - - - 76 (32) - - - (32) 147 - - - 147
Noninterest expense 1,002 - - - 1,002 1,075 - - - 1,075 905 - - - 905
Pre-tax income 907$ 9$ 65$ 52$ 1,032$ 1,042$ 9$ (19)$ 70$ 1,102$ 632$ 9$ (13)$ -$ 628$
Corporate / Other
Net financing revenue 138$ 9$ -$ -$ 147$ 99$ 9$ -$ -$ 108$ (15)$ 9$ -$ -$ (6)$
Total other revenue 12 - 1 52 64 78 - (1) 70 147 40 - - - 40
Provision for credit losses 16 - - - 16 4 - - - 4 18 - - - 18
Noninterest expense 143 - - - 143 230 - - - 230 105 - - - 105
Pre-tax income (9)$ 9$ 1$ 52$ 52$ (57)$ 9$ (1)$ 70$ 21$ (98)$ 9$ -$ -$ (89)$
Insurance
Premiums, service revenue earned and other 282$ -$ -$ -$ 282$ 283$ -$ -$ -$ 283$ 279$ -$ -$ -$ 279$
Losses and loss adjustment expenses 69 - - - 69 74 - - - 74 85 - - - 85
Acquisition and underwriting expenses 204 - - - 204 198 - - - 198 183 - - - 183
Investment income and other 15 - 65 - 80 76 - (20) - 56 67 - (13) - 54
Pre-tax income 24$ -$ 65$ -$ 89$ 87$ -$ (20)$ -$ 67$ 78$ -$ (13)$ -$ 65$
Corporate Finance
Net financing revenue 77$ -$ -$ -$ 77$ 77$ -$ -$ -$ 77$ 75$ -$ -$ -$ 75$
Total other revenue 16 - (1) - 15 33 - 1 - 34 9 - (1) - 8
Provision for credit losses 5 - - - 5 (13) - - - (13) 1 - - - 1
Noninterest expense 27 - - - 27 28 - - - 28 23 - - - 23
Pre-tax income 61$ -$ (1)$ -$ 60$ 95$ -$ 1$ -$ 96$ 60$ -$ (1)$ -$ 59$
3Q 21 2Q 21 3Q 20

40
3Q 2021 Preliminary ResultsSupplemental
Note: Equity fair value adjustments related to ASU 2016-01 requires change in the fair value of equity securities to be recognized in current period net income as compared to periods prior to 1/1/18 in which such
adjustments were recognized through other comprehensive income, a component of equity.
Core pre-provision net revenue (Core PPNR) is a non-GAAP financial measure calculated by adjusting Core pre-tax income to add back provision for credit losses. Management believes that Core PPNR is a helpful
financial metric because it enables the reader to assess the core business' ability to generate earnings to cover credit losses
‘Repositioning’ is primarily related to the extinguishment of high-cost legacy debt, strategic activities and significant other one-time items.
Non-GAAP Reconciliations
Adjusted Total Net Revenue
($ millions)
Adjusted Total Net Revenue [a]+[b] 2,110$ 2,145$ 1,930$ 1,879$ 1,680$ 1,528$ 1,606$ 1,622$ 1,620$ 1,557$ 1,535$ 1,556$ 1,521$
Original issue discount amortization expense
($ millions) 3Q 21 2Q 21 1Q 21 4Q 20 3Q 20 2Q 20 1Q 20 4Q 19 3Q 19 2Q 19 1Q 19 4Q 18 3Q 18
Core original issue discount (Core OID) amortization expense (1) 9$ 9$ 10$ 9$ 9$ 9$ 8$ 8$ 7$ 7$ 7$ 23$ 22$
Other OID 3 3 3 3 3 4 3 3 3 3 3 2 4
GAAP original issue discount amortization expense 12$ 12$ 12$ 13$ 12$ 12$ 11$ 11$ 11$ 10$ 10$ 26$ 25$
Outstanding original issue discount balance
($ millions) 3Q 21 2Q 21 1Q 21 4Q 20 3Q 20 2Q 20 1Q 20 4Q 19 3Q 19 2Q 19 1Q 19 4Q 18 3Q 18
Core outstanding original issue discount balance (Core OID balance) (900)$ (952)$ (1,018)$ (1,027)$ (1,037)$ (1,046)$ (1,055)$ (1,063)$ (1,071)$ (1,078)$ (1,085)$ (1,092)$ (1,115)$
Other outstanding OID balance (29) (32) (34) (37) (48) (46) (34) (37) (40) (44) (39) (43) (46)
GAAP outstanding original issue discount balance (929)$ (983)$ (1,052)$ (1,064)$ (1,084)$ (1,092)$ (1,089)$ (1,100)$ (1,111)$ (1,122)$ (1,125)$ (1,135)$ (1,161)$
QUARTERLY TREND
QUARTERLY TREND
Net Financing Revenue (ex. Core OID)
($ millions) 3Q 21 2Q 21 1Q 21 4Q 20 3Q 20 2Q 20 1Q 20 4Q 19 3Q 19 2Q 19 1Q 19 4Q 18 3Q 18
GAAP Net Financing Revenue 1,594$ 1,547$ 1,372$ 1,303$ 1,200$ 1,054$ 1,146$ 1,156$ 1,188$ 1,157$ 1,132$ 1,140$ 1,107$
Core OID 9 9 10 9 9 9 8 8 7 7 7 23 22
Net Financing Revenue (ex. Core OID) [a] 1,603$ 1,556$ 1,382$ 1,312$ 1,209$ 1,063$ 1,154$ 1,164$ 1,195$ 1,164$ 1,139$ 1,163$ 1,129$
Adjusted Other Revenue
($ millions) 3Q 21 2Q 21 1Q 21 4Q 20 3Q 20 2Q 20 1Q 20 4Q 19 3Q 19 2Q 19 1Q 19 4Q 18 3Q 18
GAAP Other Revenue 391$ 538$ 565$ 678$ 484$ 555$ 266$ 487$ 413$ 395$ 466$ 298$ 398$
Accelerated OID & repositioning items 52 70 - - - - - - - - - - -
Change in fair value of equity securities 65 (19) (17) (111) (13) (90) 185 (29) 11 (2) (70) 95 (6)
Adjusted Other Revenue [b] 507$ 588$ 548$ 567$ 471$ 465$ 451$ 458$ 424$ 393$ 396$ 393$ 392$
QUARTERLY TREND
QUARTERLY TREND
Adjusted NIE (ex. Repositioning)
($ millions) 3Q 21 2Q 21 1Q 21 4Q 20 3Q 20 2Q 20 1Q 20 4Q 19 3Q 19 2Q 19 1Q 19 4Q 18 3Q 18
GAAP Noninterest Expense 1,002$ 1,075$ 943$ 1,023$ 905$ 985$ 920$ 880$ 838$ 881$ 830$ 804$ 807$
Repositioning - - - - - (50) - - - - - - -
Adjusted NIE (ex. Repositioning) [c] 1,002$ 1,075$ 943$ 1,023$ 905$ 935$ 920$ 880$ 838$ 881$ 830$ 804$ 807$
QUARTERLY TREND
Core Pre-Provision Net Revenue
($ millions) 3Q 21 2Q 21 1Q 21 4Q 20 3Q 20 2Q 20 1Q 20 4Q 19 3Q 19 2Q 19 1Q 19 4Q 18 3Q 18
Pre-Provision Net Revenue 983 1,010 994 958 779 624 492 763 763 671 768 634 698
Core Pre-Provision Net Revenue 1,108$ 1,070$ 987$ 856$ 775$ 593$ 686$ 742$ 782$ 676$ 705$ 752$ 714$
QUARTERLY TREND
[a]+[b]-[c]
[x]+[y]-[z]