Alloy element redistribution during sintering of powder...
64
Alloy element redistribution during sintering of powder metallurgy steels by Abdul Malik Tahir Doctoral Thesis in Engineering Mechanics May 2014 Technical Reports from Royal Institute of Technology Department of Mechanics SE-100 44 Stockholm, Sweden
Transcript of Alloy element redistribution during sintering of powder...
Alloy element redistribution during sintering ofpowder metallurgy steels
by
Abdul Malik Tahir
Doctoral Thesis in Engineering Mechanics
May 2014Technical Reports from
Royal Institute of TechnologyDepartment of Mechanics
SE-100 44 Stockholm, Sweden
Akademisk avhandling som med tillstand av Kungliga Tekniska Hogskolan i Stock-holm framlagges till o!entlig granskning for avlaggande av teknologie doktorsexamenmandag den 26 May 2014 kl 10.15 i sal F3, Kungliga Tekniska Hogskolan, Lindst-edsvagen 26, Stockholm.
c!Abdul Malik Tahir 2014
Universitetsservice US–AB, Stockholm 2014
Proclaim! (or read!) in the name of thy Lord and Cherisher, Who created-Created man, out of a (mere) clot of congealed blood: Proclaim! And thy Lord is MostBountiful,- Who taught (the use of) the pen,- Taught man that which he knew not.
Quran, sura 96 (Al-Alaq), ayat 1-5.
iii


To my brother, Abdul-Khaliq
v

Alloy element redistribution during sintering of powder metal-lurgy steels
Abdul Malik TahirKTH MechanicsSE-100 44 Stockholm, Sweden
Abstract
Homogenization of alloying elements is desired during sintering of powder metal-lurgy components. The redistribution processes such as penetration of liquid phaseinto the interparticle/grain boundaries of solid particles and subsequent solid-statedi!usion of alloy element(s) in the base powder, are important for the e!ective ho-mogenization of alloy element(s) during liquid phase sintering of the mixed powders.The aim of this study is to increase the understanding of alloy element redistributionprocesses and their e!ect on the dimensional properties of the compact by means ofnumerical and experimental techniques.
The phase field model coupled with Navier-Stokes equations is used for the sim-ulations of dynamic wetting of millimeter- and micrometer-sized metal drops andliquid phase penetration into interparticle boundaries. The simulations of solid parti-cle rearrangement under the action of capillary forces exerted by the liquid phase arecarried out by using the equilibrium equation for a linear elastic material. Thermo-dynamic and kinetic calculations are performed to predict the phase diagram and thedi!usion distances respectively. The test materials used for the experimental studiesare three di!erent powder mixes; Fe-2%Cu, Fe-2%Cu-0.5%C, and Fe-2%(Cu-2%Ni-1.5%Si)-0.5%C. Light optical microscopy, energy dispersive X-ray spectroscopy anddilatometry are used to study the microstructure, kinetics of the liquid phase pene-tration, solid-state di!usion of the Cu, and the dimensional changes during sintering.
The wetting simulations are verified by matching the spreading experiments ofmillimeter-sized metal drops and it is observed that wetting kinetics is much fasterfor a micrometer-sized drop compared to the millimeter-sized drop. The simulationspredicted the liquid phase penetration kinetics and the motion of solid particles dur-ing the primary rearrangement stage of liquid phase sintering in agreement with theanalytical model. Microscopy revealed that the C addition delayed the penetration ofthe Cu rich liquid phase into interparticle/grain boundaries of Fe particles, especiallyinto the grain boundaries of large Fe particles, and consequently the Cu di!usion inFe is also delayed. We propose that the relatively lower magnitude of the sudden vol-umetric expansion in the master alloy system could be due to the continuous meltingof liquid forming master alloy particles.
Descriptors: Contact line friction, Cu redistribution kinetics, di!usion, dimensionalvariations, dilatometry, DICTRA, dynamic wetting, liquid phase sintering, master al-loy, microstructure, phase field modeling, primary rearrangement, powder metallurgysteels, SEM/EDXS, swelling, Thermo-Calc.
vii

Omfordelning av legeringselement under sintring av pulvermet-allurgiska stal
Abdul Malik TahirKTH MekanikSE-100 44 Stockholm, Sverige
Sammanfattning
Homogenisering av legeringselement ar onskvard under sintring av pulvermetal-lurgiska komponenter. Omfordelningsprocesser sasom penetrering av vatskefasen ini partikel- eller korngranserna och efterfoljande solid-state di!usion av legeringsele-ment i baspulvret, ar viktiga for e!ektiv homogenisering av legeringselement undervatskefassintring av pulver blandningar. Syftet med denna studie var att med hjalpav numeriska och experimentella tekniker oka forstaelsen om omfordelningsprocesservid sintring och deras inverkan pa dimensionsforandringar hos de sintrade detaljerna.
Fasfaltsmodellen i kombination med Navier-Stokes ekvationer anvandes for simu-lering av dynamisk vatning av millimeter- och mikrometerstora metalldroppar ochvatskepenetration i partikelgranser. Simuleringarna av partikelomfordelning underinverkan av kapillara krafter som utovas av den flytande fasen genomfordes genom kop-pling av jamviktsekvationen for ett linjart elastiskt material och Cahn-Hilliards ochNavier-Stokes ekvationer. Termodynamiska och kinetiska berakningar utfordes for attforutsaga di!usionsavstand och materialsystemets fas diagram. De testmaterial somanvandes for de experimentella studierna var tre olika pulverblandningar; Fe-2%Cu,Fe-2%Cu-0.5%C, och Fe-2%(Cu-2%Ni-1,5%Si)-0.5%C. Optisk mikroskopi, energi dis-persiv rontgenspektroskopi och dilatometri anvandes for att studera mikrostruktur,kinetik i vatskepenetrationsfasen, di!usion av Cu i fast fas, och dimensionsforan-dringar under sintring.
Vatningssimuleringarna verifierades genom att noggrant matcha simuleringar medspridningsexperiment med millimeterstora metalldroppar. Det visar sig att vatningsk-inetiken ar mycket snabbare for en mikrometerstor droppe jamfort med den millime-terstora droppen. Simuleringarna forutspadde vatskefasens penetration och de fastapartiklarnas rorelse under det primara skedet av vatskefassintringen i enlighet medden analytiska modellen. Mikroskopi avslojar att tillsats av kol fordrojde penetra-tionen av Cu rik vatskefas in i partikel och korngranser, i synnerhet i korngransernai stora Fe partiklar, och foljaktligen Cu di!usion i Fe. Det foreslas att den mojligaorsaken till den relativt sett lagre plotsliga expansionen av masterlegeringssystemetskulle kunna vara den kontinuerliga smaltningen av masterlegeringspartiklar, jamfortmed partiklar av ren koppar.
Deskriptorer: Kontaktlinjefriktion, Cu omfordelningskinetik, di!usion, dimensionsvari-ationer, dilatometri, DICTRA, dynamisk vatning, smaltfas sintring, mikrostruktur,fasfaltsmodellering, pulvermetallurgiskt stal, SEM/EDXS, Thermo-Calc.
ix

Preface
In the first part, an overview of the PM manufacturing process, basic theory of therelated problems, methods employed for the investigations, and brief summary of theresults are presented. The second part consists of the following papers;
Paper 1. Tahir, A. M., Amberg, G. and Do-Quang, M.: Initial rapid wetting inmetallic systems. Acta Materialia, 2013 61, 5375.
Paper 2. Tahir, A. M., Amberg, G., Hedstrom, P., Bergman, O. and Frisk, K.:Investigation of Cu distribution and porosity in Fe-2Cu and Fe-2Cu-0.5C compacts.Proc. EuroPM2013, Goteborg, Sweden, 2013, EPMA, 2.
Paper 3. Tahir, A. M., Amberg, G., Hedstrom, P., Bergman, O. and Frisk, K.:Cu redistribution during sintering of Fe-2Cu and Fe-2Cu-0.5C compacts. PowderMetallurgy, in press, doi.org/10.1179/1743290114Y.0000000085.
Paper 4. Tahir, A. M., Amberg, G., Hedstrom, P., Bergman, O., Chasoglou, D.and Frisk, K.: Behavior of master alloy during sintering of PM steels; redistributionand dimensional variations. submitted to Powder Metallurgy.
Paper 5. Tahir, A. M., Amberg, G. and Malik, A.: Modeling of the primary re-arrangement stage of liquid phase sintering. To be submitted.
xi
The author has presented part of this work in the following presentations;
Alloy element redistribution in PM steels, HERO-M Workshop, Sweden 2009, 2010and 2013.
Phase field modeling of the alloy element(s) distribution during sintering, Hoganaschair 2009, Sweden.
Modeling the initial rapid wetting of Cu during sintering, EUROMAT 2013, Spain.
Investigation of Cu distribution and porosity in Fe-2Cu and Fe-2Cu-0.5C compacts,EuroPM2013, Sweden.
xii
Division of work between authors;
Paper 1The code was implemented by Minh Do-Quang (MDQ) and Abdul Malik Tahir(AMT). AMT performed the simulations with feedback from Gustav Amberg (GA).AMT analyzed the results and wrote the paper, with feedback from GA and MDQ.
Paper 2AMT analyzed the results and wrote the paper, with input from Peter Hedstrom(PH), GA, Ola Bergman (OB), and Karin Frisk (KF). Sintering trials were performedby Swerea KIMAB AB. The microstructure analysis was done by the Metallographydepartment, Hoganas AB and AMT.
Paper 3OB and KF planned the experimental work together with AMT. Sintering trials wereperformed by Swerea KIMAB AB. The microstructure analysis was done by AMTat the Metallography department, Hoganas AB with the help of Heike Grosser. Thedi!usion measurements were performed at the Dept. of Materials Science and Engi-neering KTH by AMT and PH. AMT analyzed the results and wrote the paper, withinput from PH, GA, OB, and KF.
Paper 4AMT and OB designed the experimental work. Sintering trials were performed bySwerea KIMAB AB with feedback from AMT. The microstructure analysis was doneby AMT at the Metallography department, Hoganas AB together with Heike Grosser.The di!usion measurements were performed at the Dept. of Materials Science andEngineering KTH by AMT with feedback from PH. AMT analyzed the results andwrote the paper, with input from PH, GA, OB, KF, and Dimitris Chasoglou (DC).
Paper 5Amer Malik (AM) set the numerical model and performed simulations together withAMT. AMT analyzed the results and wrote the paper, with feedback from AM, GA,and OB.
xiii

xiv
Contents
Abstract vii
Preface xi
Chapter 1. Introduction 1
1.1. Motivation and scope of the work 2
Chapter 2. Processing route for powder metallurgy steels 3
2.1. Powder fabrication 3
2.2. Powder alloying 5
2.3. Blending 6
2.4. Compaction 6
2.5. Sintering 8
2.6. Liquid phase sintering 10
Chapter 3. Alloy element redistribution and dimensional variations 14
Chapter 4. Basic theory 19
4.1. Wetting 19
4.1.1. Surface tension 19
4.1.2. Wetting and Young-Laplace law 20
4.1.3. Dynamic wetting 20
4.2. Solid particle rearrangement 21
4.3. Di!usion 22
Chapter 5. Modeling and experiments 23
5.1. Modeling 23
5.1.1. Wetting 23
5.1.1.1. Cahn-Hilliard and Navier-Stokes 24
5.1.1.2. Numerical treatment 26
5.1.2. Di!usion 27
5.2. Experiments 28
5.2.1. Materials 28
5.2.2. Sintering trials and dilatometry 28
xv
5.2.3. Microscopy 29
Chapter 6. Summary of results 30
6.1. Wetting 30
6.2. Microstructure 32
6.3. Dimensional variations 34
6.4. Di!usion 36
Chapter 7. Conclusions and outlook 38
Acknowledgment 41
Bibliography 43
xvi
Part I
Summary

CHAPTER 1
Introduction
The process of manufacturing metallic components from metal powder is called pow-der metallurgy (PM). The earliest uses of PM technology can be traced back severalthousand years. For instance, ancient Incas converted platinum grains into consoli-dated form and Egyptians hammered metallic iron powder to produce tools (German(1994)). Modern development of PM technology is attributed to the production ofcemented carbides in the 1900-1930s (Schwartzkopf et al. (1960), which led to a revo-lution in the tool industry. The large-scale production of structural steel parts by PMmethod started after World War II. The low cost benefit of PM technology comparedto the traditional manufacturing processes continuously boosted the production ofPM structural steel parts and today their share in the PM products is among thehighest.
The main advantages of PM compared to other conventional metal forming tech-niques are; near net-shape components, high production rate, low consumption ofenergy, tailored microstructures, and high material utilization (German (1994)). Thenear net-shape feature of the PM technology reduces the production cost as feweror no secondary operations are required. The production of high melting point re-fractory metals at lower cost and with less di"culty is another advantage of PM.Moreover, the high material utilization and energy e"ciency makes the PM produc-tion process environmental friendly (MPIF (2014)). The PM components used in theautomotive industry i.e., bearings, valve seats, engine timing components etc, reflectsa good example of economically produced parts with precision. And the production ofmaterials such as porous filters, oxide-dispersion-strengthened turbine alloys, cermetsand artificial bones illustrate the capacity of PM method to produce materials withunique properties and microstructure (German (2005)).
The PM process mainly consists of mixing powdered materials (blending), press-ing to obtain the desired shape (compaction) and heating the compact to bond thepowder (sintering). Optional post processing operations i.e., machining, grinding,sizing, heat treatment etc, could be further employed. During sintering of the pow-dered compacts the important criteria for the proper distribution of the liquid phasethroughout the solid matrix are: 1, melting of the liquid forming additives (elemen-tal or master alloy) below normal sintering temperatures; 2, good wettability of themolten phase; 3, removal of oxides; 4, the dissolution e!ects. Although it is desiredthat the liquid phase should wet and spread over the solid particles and act as a vehi-cle to improve the homogenization of the alloying elements, in order to tailor desiredproperties of the final product. At the same time dimensional instabilities causedby the liquid penetration could be detrimental for the final tolerances of the finished
1
2 1. INTRODUCTION
product. Moreover, the rapid kinetics of the melt formation, subsequent liquid pene-tration and associated changes of the microstructure make it di"cult to understandand tailor these processes.
1.1. Motivation and scope of the work
The quantitative treatment of the overall process of liquid phase sintering (LPS) ishindered because of the complexities involved such as various solubility, viscosity, anddi!usivity e!ects coupled with the multiple phases. The rapid nature of the eventsduring rearrangement stage of LPS also poses a challenge for experimental investiga-tions. The main objective of this work is to quantitatively investigate the processesresponsible for the homogenization of alloying elements such as wetting, liquid phasedistribution, solid-state di!usion, and the associated dimensional changes. Moreover,the numerical models were implemented to predict the kinetics of micro scale eventsof rapid nature, which could be very challenging to investigate experimentally.
In this work, numerical tools were applied to study the rapid dynamic wetting,penetration of the liquid phase, and particle motion during the primary rearrange-ment stage of LPS using realistic physical material properties. Thermodynamic andkinetic calculations were employed using DICTRA and Thermo-Calc. In addition,interrupted sintering trials of the test materials were performed in N2/H2 (90/10)atmosphere for di!erent holding times at 1120oC, to investigate the kinetics of redis-tribution processes during sintering. The microstructure evolution, and the kineticsand extent of the liquid phase penetration were analyzed by light optical microscopy.Dilatometry was used to investigate the dimensional change of the compact duringsintering. Energy dispersive X-ray spectroscopy was applied to study the kinetics ofthe solid-state di!usion of Cu at the Fe interparticle boundaries.
CHAPTER 2
Processing route for powder metallurgy steels
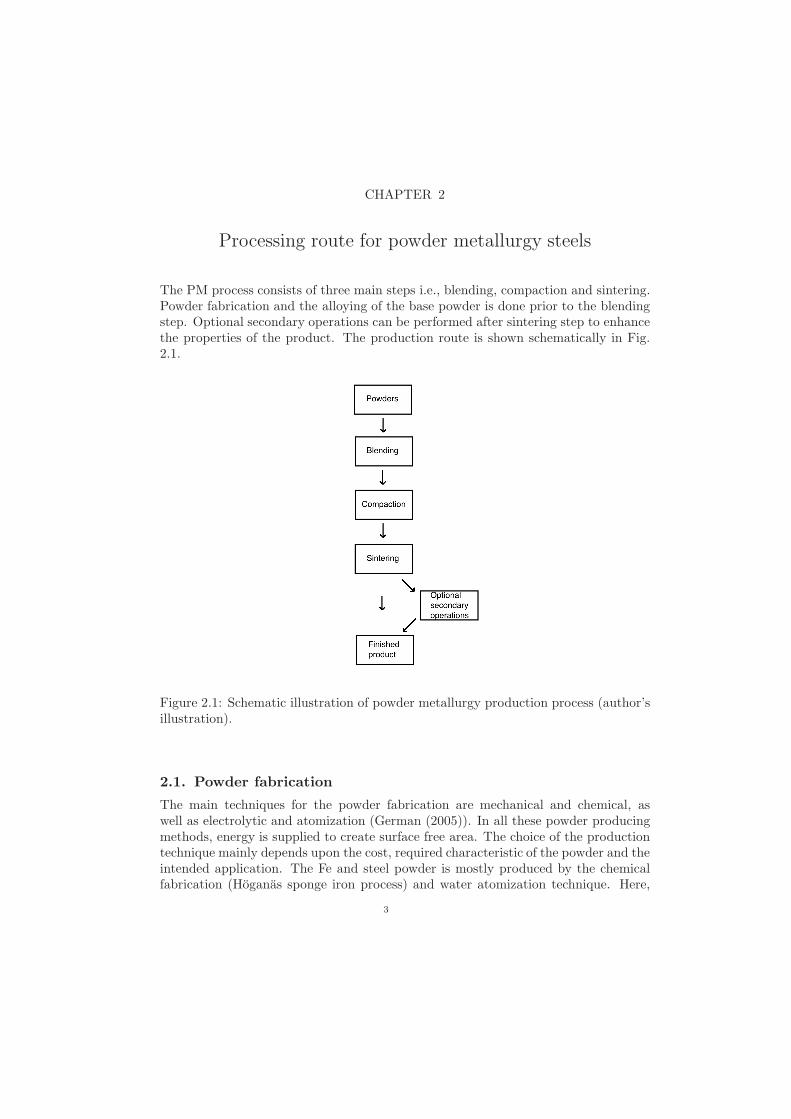
The PM process consists of three main steps i.e., blending, compaction and sintering.Powder fabrication and the alloying of the base powder is done prior to the blendingstep. Optional secondary operations can be performed after sintering step to enhancethe properties of the product. The production route is shown schematically in Fig.2.1.
Figure 2.1: Schematic illustration of powder metallurgy production process (author’sillustration).
2.1. Powder fabrication
The main techniques for the powder fabrication are mechanical and chemical, aswell as electrolytic and atomization (German (2005)). In all these powder producingmethods, energy is supplied to create surface free area. The choice of the productiontechnique mainly depends upon the cost, required characteristic of the powder and theintended application. The Fe and steel powder is mostly produced by the chemicalfabrication (Hoganas sponge iron process) and water atomization technique. Here,
3
4 2. PROCESSING ROUTE FOR POWDER METALLURGY STEELS
the emphasis will be only given to the water atomization technique, since the wateratomized Fe powder is used in the present work.
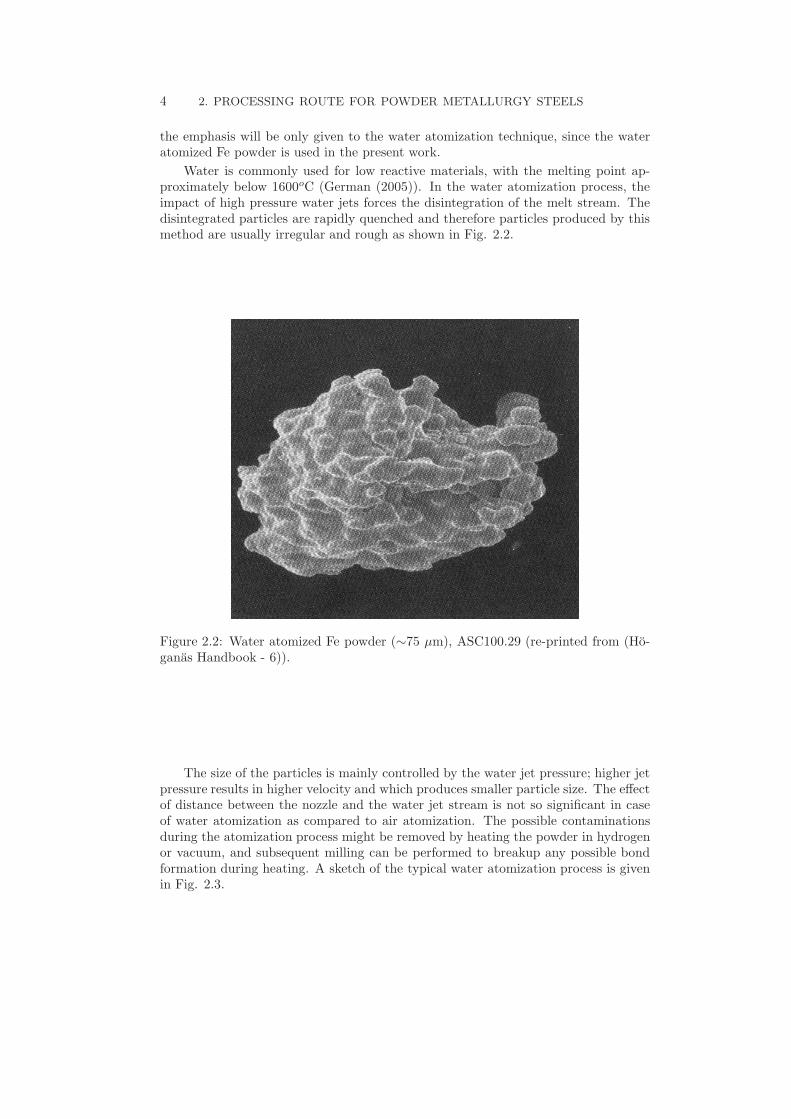
Water is commonly used for low reactive materials, with the melting point ap-proximately below 1600oC (German (2005)). In the water atomization process, theimpact of high pressure water jets forces the disintegration of the melt stream. Thedisintegrated particles are rapidly quenched and therefore particles produced by thismethod are usually irregular and rough as shown in Fig. 2.2.
Figure 2.2: Water atomized Fe powder ("75 µm), ASC100.29 (re-printed from (Ho-ganas Handbook - 6)).
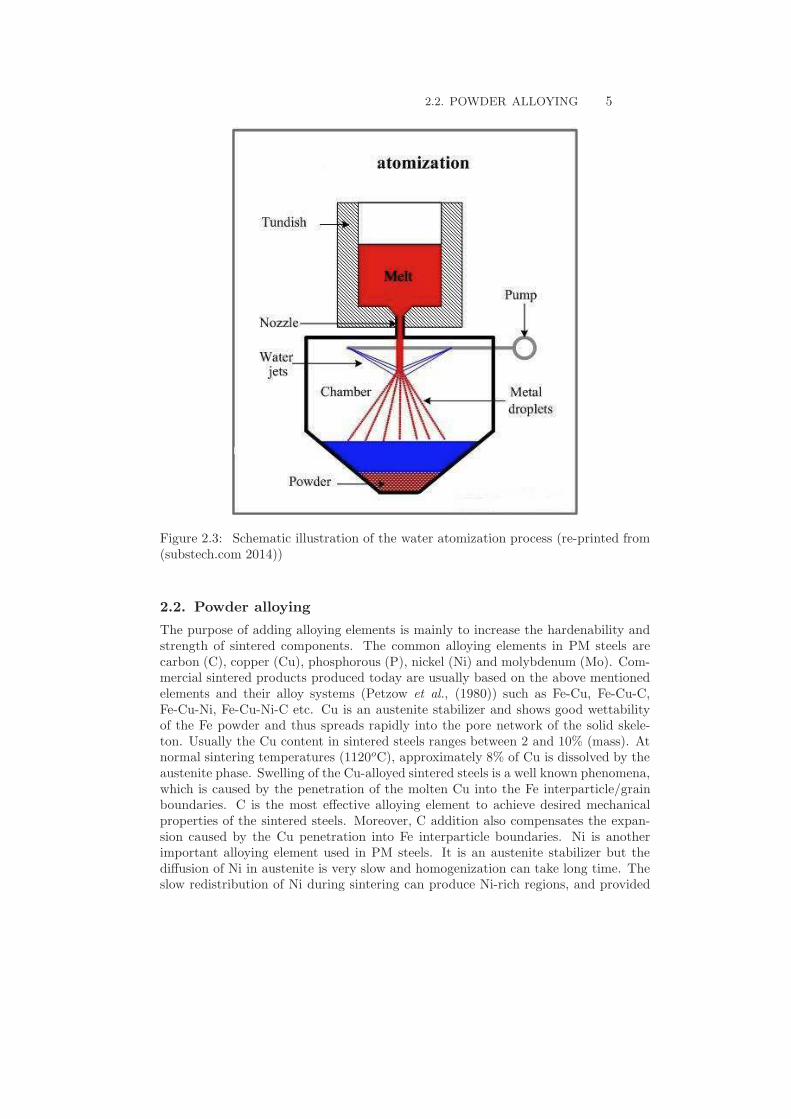
The size of the particles is mainly controlled by the water jet pressure; higher jetpressure results in higher velocity and which produces smaller particle size. The e!ectof distance between the nozzle and the water jet stream is not so significant in caseof water atomization as compared to air atomization. The possible contaminationsduring the atomization process might be removed by heating the powder in hydrogenor vacuum, and subsequent milling can be performed to breakup any possible bondformation during heating. A sketch of the typical water atomization process is givenin Fig. 2.3.
2.2. POWDER ALLOYING 5
Figure 2.3: Schematic illustration of the water atomization process (re-printed from(substech.com 2014))
2.2. Powder alloying
The purpose of adding alloying elements is mainly to increase the hardenability andstrength of sintered components. The common alloying elements in PM steels arecarbon (C), copper (Cu), phosphorous (P), nickel (Ni) and molybdenum (Mo). Com-mercial sintered products produced today are usually based on the above mentionedelements and their alloy systems (Petzow et al., (1980)) such as Fe-Cu, Fe-Cu-C,Fe-Cu-Ni, Fe-Cu-Ni-C etc. Cu is an austenite stabilizer and shows good wettabilityof the Fe powder and thus spreads rapidly into the pore network of the solid skele-ton. Usually the Cu content in sintered steels ranges between 2 and 10% (mass). Atnormal sintering temperatures (1120oC), approximately 8% of Cu is dissolved by theaustenite phase. Swelling of the Cu-alloyed sintered steels is a well known phenomena,which is caused by the penetration of the molten Cu into the Fe interparticle/grainboundaries. C is the most e!ective alloying element to achieve desired mechanicalproperties of the sintered steels. Moreover, C addition also compensates the expan-sion caused by the Cu penetration into Fe interparticle boundaries. Ni is anotherimportant alloying element used in PM steels. It is an austenite stabilizer but thedi!usion of Ni in austenite is very slow and homogenization can take long time. Theslow redistribution of Ni during sintering can produce Ni-rich regions, and provided
6 2. PROCESSING ROUTE FOR POWDER METALLURGY STEELS
that the Ni content is su"ciently high, the austenite structure may be found in thesintered microstructure after cooling. Mo increases hardenability more than Cu andNi, and also improves the material strength at higher temperatures.
The proper method for adding alloying elements is very important and if notdone adequately, may cause the uneven distribution and segregation of the alloyingelements in the powder compact. Basically there are three methods for the addi-tion of elemental powders in sintered steels i.e., mixing, partial pre-alloying and fullypre-alloyed. In mixing, the elemental powders are mixed before the compaction andsubsequent heating will bond the particles together. This method may cause inho-mogeneous distribution of the alloying elements, and also segregation of the powdermixes. In case of partially pre-alloyed powders, segregation of the particles is avoidedand homogenization level is enhanced. This is done either by annealing, where bondswill form between powder particles, or with the aid of some organic binder. Mixing thealloying elements in the melt before powder fabrication produces the fully pre-alloyedpowders and the maximum level of homogenization is achieved after sintering.
Mixed powders are the best in terms of compressibility and show relatively highergreen density at a given pressure. While the partially pre-alloyed powders have almostthe same level of compressibility and the fully pre-alloyed powders show the lowestgreen density. The choice of the alloying method also depends upon the oxidationsensitivity and di!usion rate of the alloying elements. For instance, C di!usion ismuch faster than Cu or Ni, so it is admixed in the Fe powder, while the Mn and Siare preferentially introduced by the pre-alloying method to avoid oxidation.
2.3. Blending
In sintered steels, the Fe powder is mixed with alloying elements and some organiccompounds. The objective of the blending step is to produce a homogenous powdermix. The proper mixing of lubricant is also required to reduce the friction betweendie walls and powder particles. In addition, the lubricant also improves the slidingof the powder during compaction and results in uniform density from top to bottom.Common lubricants are stearic acid, metallic stearates (zinc stearate) and waxes.Moreover, less friction between die walls and powder makes it easier to eject the com-pact and minimizes the risk of crack formation in the green compact. The lubricantshould be burn o! during pre-heating or in the start of sintering process otherwisethe residue might a!ect the compact strength.
2.4. Compaction
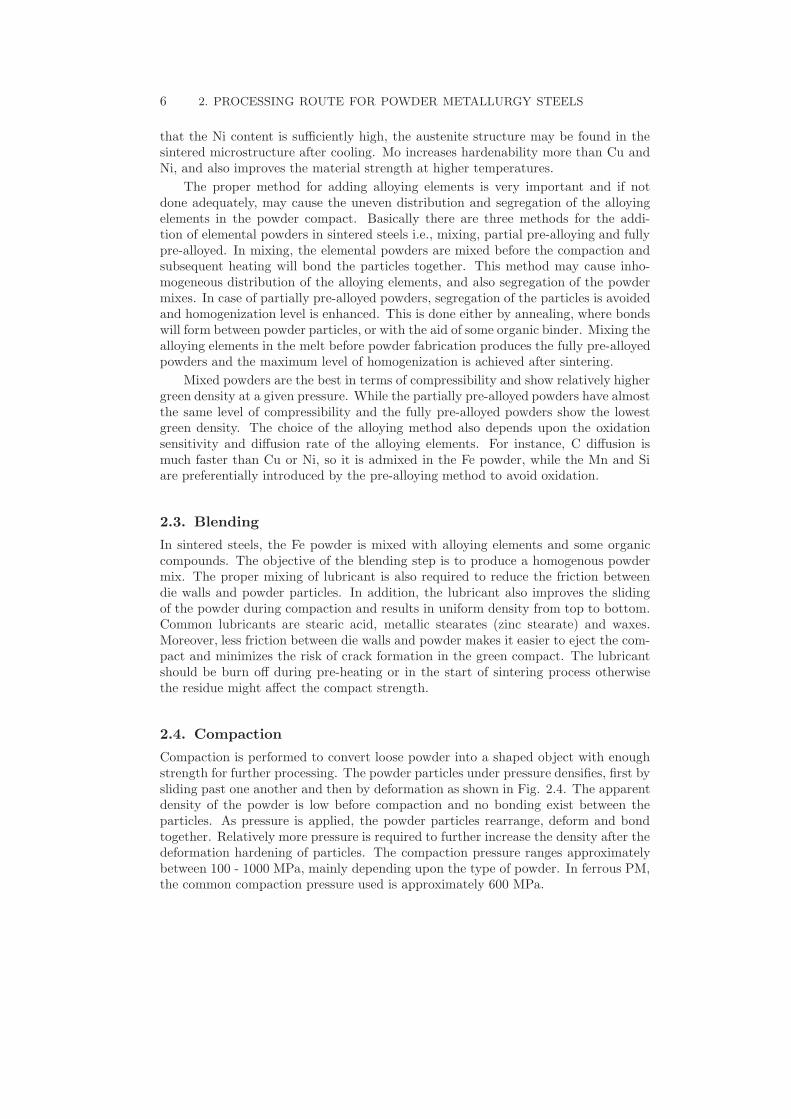
Compaction is performed to convert loose powder into a shaped object with enoughstrength for further processing. The powder particles under pressure densifies, first bysliding past one another and then by deformation as shown in Fig. 2.4. The apparentdensity of the powder is low before compaction and no bonding exist between theparticles. As pressure is applied, the powder particles rearrange, deform and bondtogether. Relatively more pressure is required to further increase the density after thedeformation hardening of particles. The compaction pressure ranges approximatelybetween 100 - 1000 MPa, mainly depending upon the type of powder. In ferrous PM,the common compaction pressure used is approximately 600 MPa.
2.4. COMPACTION 7
Figure 2.4: Illustrative sketch of the compaction stages (re-printed from (German2005)).
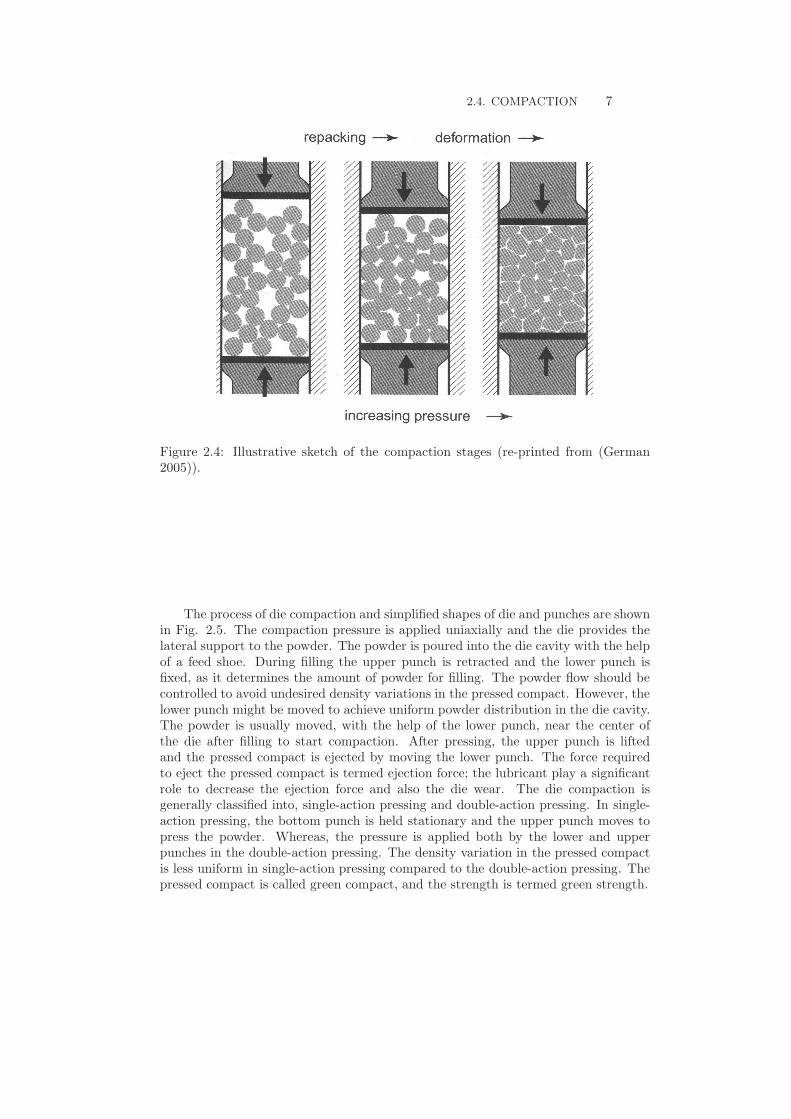
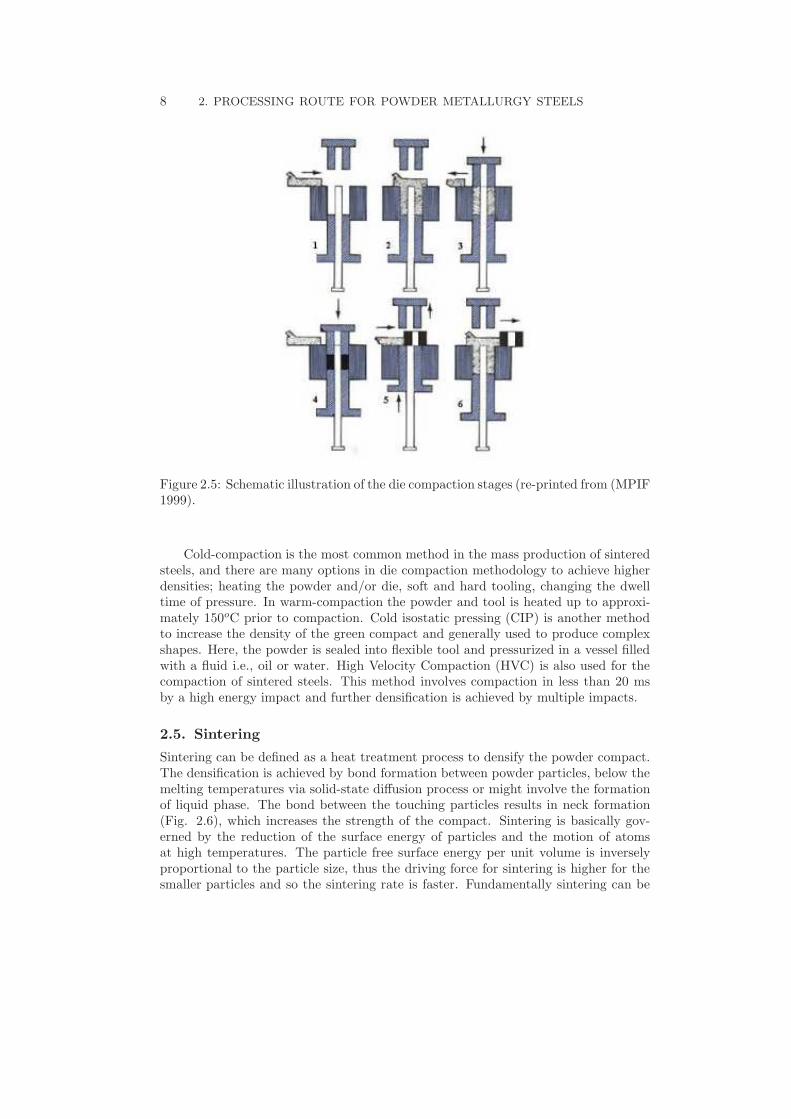
The process of die compaction and simplified shapes of die and punches are shownin Fig. 2.5. The compaction pressure is applied uniaxially and the die provides thelateral support to the powder. The powder is poured into the die cavity with the helpof a feed shoe. During filling the upper punch is retracted and the lower punch isfixed, as it determines the amount of powder for filling. The powder flow should becontrolled to avoid undesired density variations in the pressed compact. However, thelower punch might be moved to achieve uniform powder distribution in the die cavity.The powder is usually moved, with the help of the lower punch, near the center ofthe die after filling to start compaction. After pressing, the upper punch is liftedand the pressed compact is ejected by moving the lower punch. The force requiredto eject the pressed compact is termed ejection force; the lubricant play a significantrole to decrease the ejection force and also the die wear. The die compaction isgenerally classified into, single-action pressing and double-action pressing. In single-action pressing, the bottom punch is held stationary and the upper punch moves topress the powder. Whereas, the pressure is applied both by the lower and upperpunches in the double-action pressing. The density variation in the pressed compactis less uniform in single-action pressing compared to the double-action pressing. Thepressed compact is called green compact, and the strength is termed green strength.
8 2. PROCESSING ROUTE FOR POWDER METALLURGY STEELS
Figure 2.5: Schematic illustration of the die compaction stages (re-printed from (MPIF1999).
Cold-compaction is the most common method in the mass production of sinteredsteels, and there are many options in die compaction methodology to achieve higherdensities; heating the powder and/or die, soft and hard tooling, changing the dwelltime of pressure. In warm-compaction the powder and tool is heated up to approxi-mately 150oC prior to compaction. Cold isostatic pressing (CIP) is another methodto increase the density of the green compact and generally used to produce complexshapes. Here, the powder is sealed into flexible tool and pressurized in a vessel filledwith a fluid i.e., oil or water. High Velocity Compaction (HVC) is also used for thecompaction of sintered steels. This method involves compaction in less than 20 msby a high energy impact and further densification is achieved by multiple impacts.
2.5. Sintering
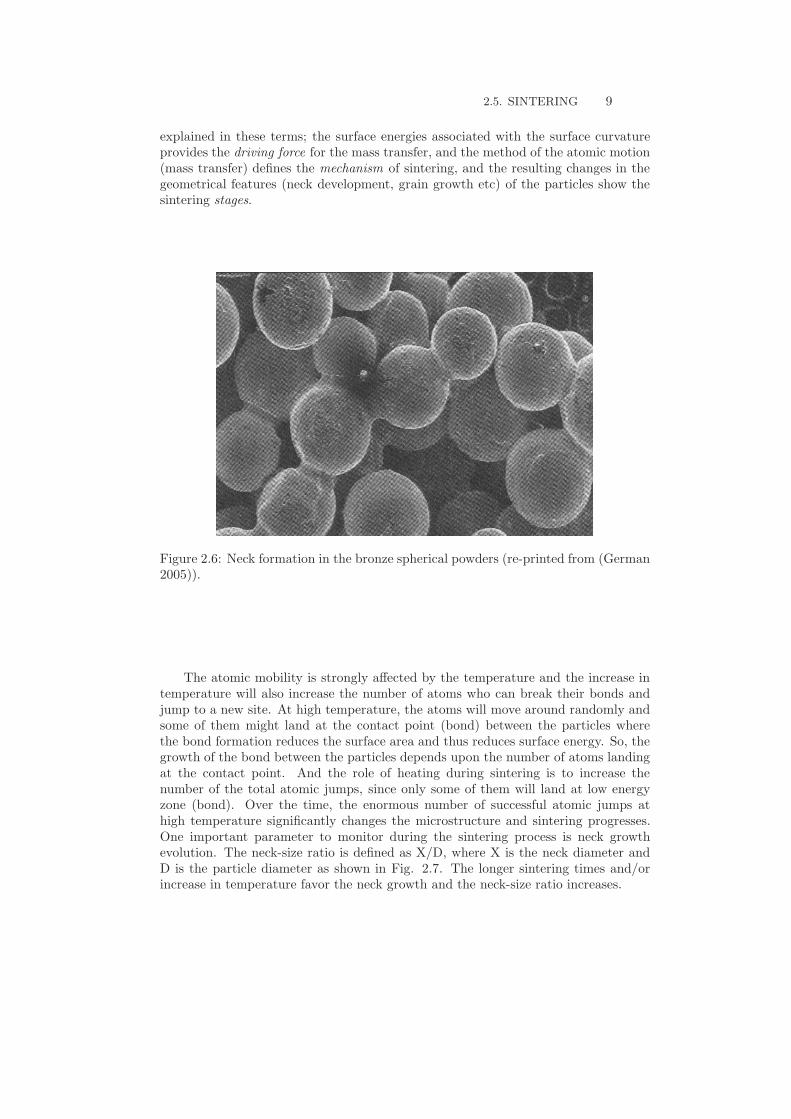
Sintering can be defined as a heat treatment process to densify the powder compact.The densification is achieved by bond formation between powder particles, below themelting temperatures via solid-state di!usion process or might involve the formationof liquid phase. The bond between the touching particles results in neck formation(Fig. 2.6), which increases the strength of the compact. Sintering is basically gov-erned by the reduction of the surface energy of particles and the motion of atomsat high temperatures. The particle free surface energy per unit volume is inverselyproportional to the particle size, thus the driving force for sintering is higher for thesmaller particles and so the sintering rate is faster. Fundamentally sintering can be
2.5. SINTERING 9
explained in these terms; the surface energies associated with the surface curvatureprovides the driving force for the mass transfer, and the method of the atomic motion(mass transfer) defines the mechanism of sintering, and the resulting changes in thegeometrical features (neck development, grain growth etc) of the particles show thesintering stages.
Figure 2.6: Neck formation in the bronze spherical powders (re-printed from (German2005)).
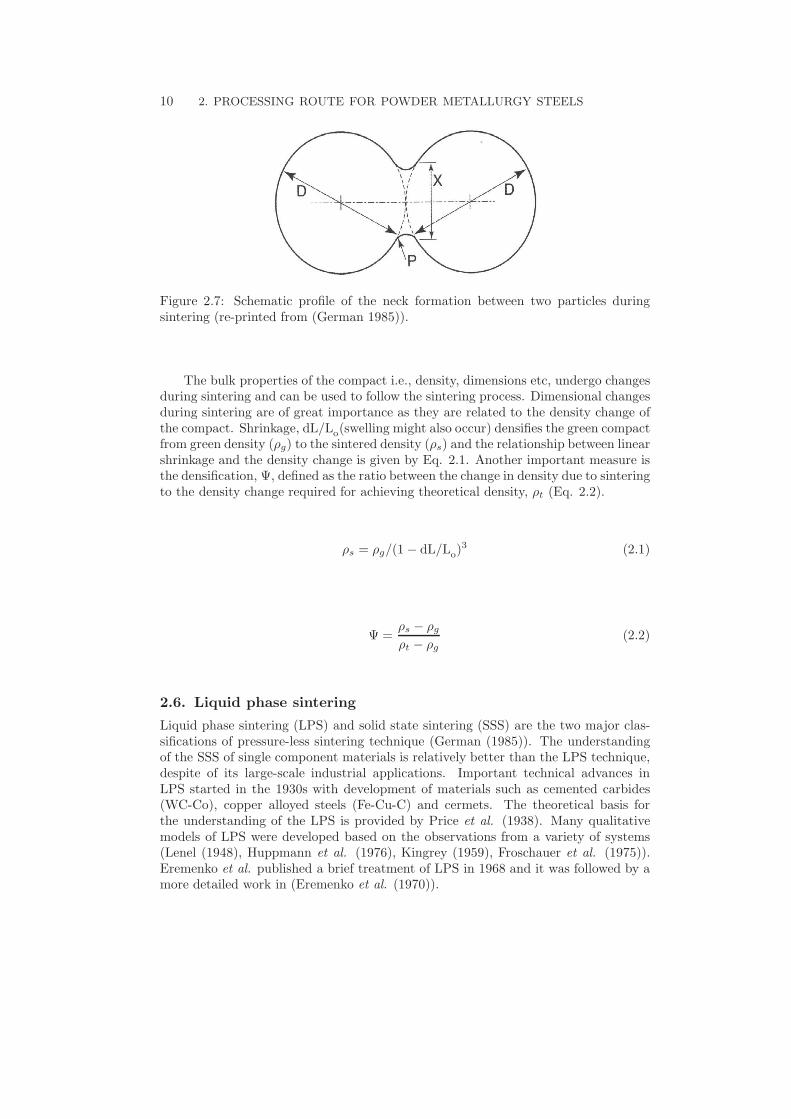
The atomic mobility is strongly a!ected by the temperature and the increase intemperature will also increase the number of atoms who can break their bonds andjump to a new site. At high temperature, the atoms will move around randomly andsome of them might land at the contact point (bond) between the particles wherethe bond formation reduces the surface area and thus reduces surface energy. So, thegrowth of the bond between the particles depends upon the number of atoms landingat the contact point. And the role of heating during sintering is to increase thenumber of the total atomic jumps, since only some of them will land at low energyzone (bond). Over the time, the enormous number of successful atomic jumps athigh temperature significantly changes the microstructure and sintering progresses.One important parameter to monitor during the sintering process is neck growthevolution. The neck-size ratio is defined as X/D, where X is the neck diameter andD is the particle diameter as shown in Fig. 2.7. The longer sintering times and/orincrease in temperature favor the neck growth and the neck-size ratio increases.
10 2. PROCESSING ROUTE FOR POWDER METALLURGY STEELS
Figure 2.7: Schematic profile of the neck formation between two particles duringsintering (re-printed from (German 1985)).
The bulk properties of the compact i.e., density, dimensions etc, undergo changesduring sintering and can be used to follow the sintering process. Dimensional changesduring sintering are of great importance as they are related to the density change ofthe compact. Shrinkage, dL/Lo(swelling might also occur) densifies the green compactfrom green density (!g) to the sintered density (!s) and the relationship between linearshrinkage and the density change is given by Eq. 2.1. Another important measure isthe densification, #, defined as the ratio between the change in density due to sinteringto the density change required for achieving theoretical density, !t (Eq. 2.2).
!s = !g/(1# dL/Lo)3 (2.1)
# =!s # !g!t # !g
(2.2)
2.6. Liquid phase sintering
Liquid phase sintering (LPS) and solid state sintering (SSS) are the two major clas-sifications of pressure-less sintering technique (German (1985)). The understandingof the SSS of single component materials is relatively better than the LPS technique,despite of its large-scale industrial applications. Important technical advances inLPS started in the 1930s with development of materials such as cemented carbides(WC-Co), copper alloyed steels (Fe-Cu-C) and cermets. The theoretical basis forthe understanding of the LPS is provided by Price et al. (1938). Many qualitativemodels of LPS were developed based on the observations from a variety of systems(Lenel (1948), Huppmann et al. (1976), Kingrey (1959), Froschauer et al. (1975)).Eremenko et al. published a brief treatment of LPS in 1968 and it was followed by amore detailed work in (Eremenko et al. (1970)).
2.6. LIQUID PHASE SINTERING 11
Figure 2.8: Stages of the classic liquid phase sintering process involving mixed powders(re-printed from (German 1985)).
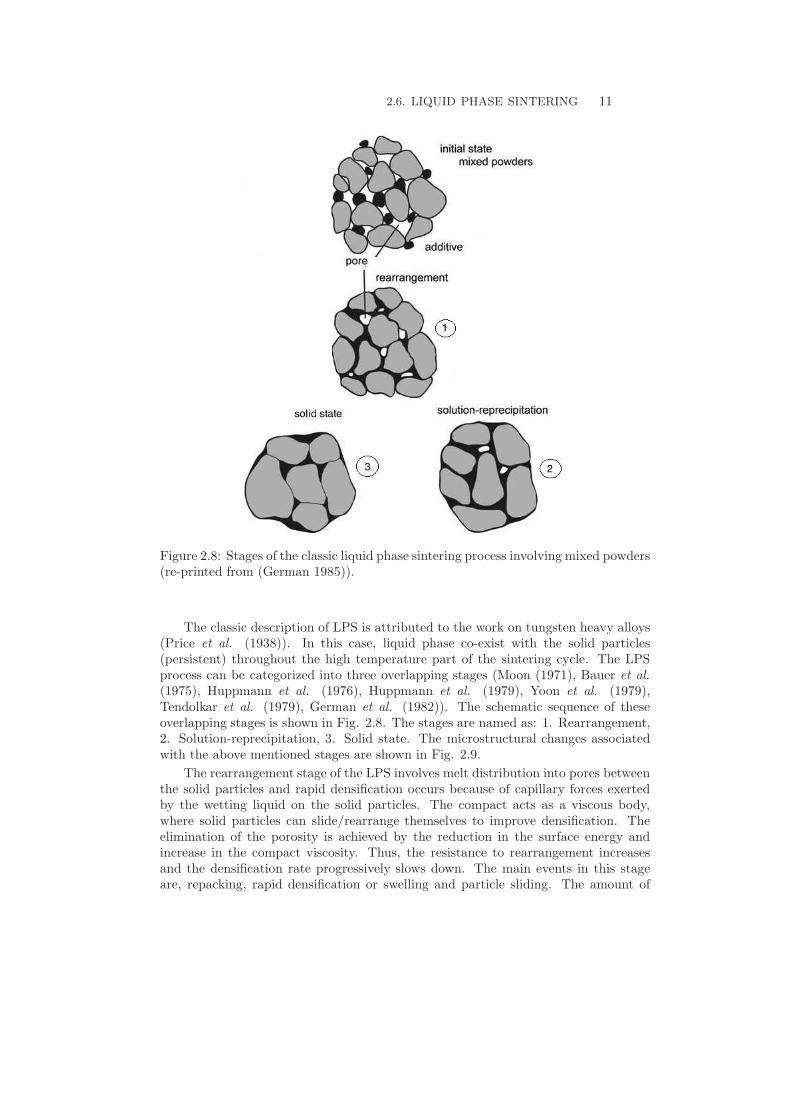
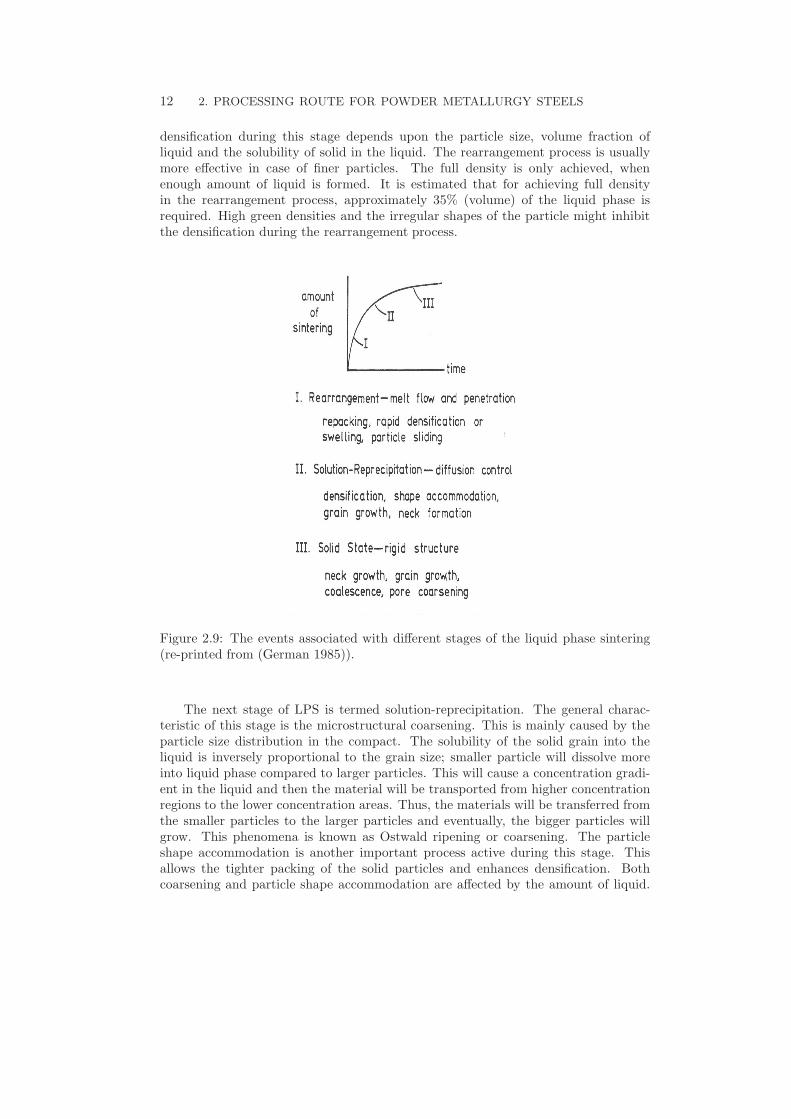
The classic description of LPS is attributed to the work on tungsten heavy alloys(Price et al. (1938)). In this case, liquid phase co-exist with the solid particles(persistent) throughout the high temperature part of the sintering cycle. The LPSprocess can be categorized into three overlapping stages (Moon (1971), Bauer et al.(1975), Huppmann et al. (1976), Huppmann et al. (1979), Yoon et al. (1979),Tendolkar et al. (1979), German et al. (1982)). The schematic sequence of theseoverlapping stages is shown in Fig. 2.8. The stages are named as: 1. Rearrangement,2. Solution-reprecipitation, 3. Solid state. The microstructural changes associatedwith the above mentioned stages are shown in Fig. 2.9.
The rearrangement stage of the LPS involves melt distribution into pores betweenthe solid particles and rapid densification occurs because of capillary forces exertedby the wetting liquid on the solid particles. The compact acts as a viscous body,where solid particles can slide/rearrange themselves to improve densification. Theelimination of the porosity is achieved by the reduction in the surface energy andincrease in the compact viscosity. Thus, the resistance to rearrangement increasesand the densification rate progressively slows down. The main events in this stageare, repacking, rapid densification or swelling and particle sliding. The amount of
12 2. PROCESSING ROUTE FOR POWDER METALLURGY STEELS
densification during this stage depends upon the particle size, volume fraction ofliquid and the solubility of solid in the liquid. The rearrangement process is usuallymore e!ective in case of finer particles. The full density is only achieved, whenenough amount of liquid is formed. It is estimated that for achieving full densityin the rearrangement process, approximately 35% (volume) of the liquid phase isrequired. High green densities and the irregular shapes of the particle might inhibitthe densification during the rearrangement process.
Figure 2.9: The events associated with di!erent stages of the liquid phase sintering(re-printed from (German 1985)).
The next stage of LPS is termed solution-reprecipitation. The general charac-teristic of this stage is the microstructural coarsening. This is mainly caused by theparticle size distribution in the compact. The solubility of the solid grain into theliquid is inversely proportional to the grain size; smaller particle will dissolve moreinto liquid phase compared to larger particles. This will cause a concentration gradi-ent in the liquid and then the material will be transported from higher concentrationregions to the lower concentration areas. Thus, the materials will be transferred fromthe smaller particles to the larger particles and eventually, the bigger particles willgrow. This phenomena is known as Ostwald ripening or coarsening. The particleshape accommodation is another important process active during this stage. Thisallows the tighter packing of the solid particles and enhances densification. Bothcoarsening and particle shape accommodation are a!ected by the amount of liquid.
2.6. LIQUID PHASE SINTERING 13
The geometrical shape of the solid particles is determined by the solid-solid and solid-liquid interfacial energies, amount of liquid, and the anisotropy in the surface energy ofthe solid particles. The final stage of LPS is the solid state controlled sintering. Here,the densification is slow because of the formation of solid skeleton. The remainingpores might grow, if they contain any entrapped gas, to reduce the pressure.
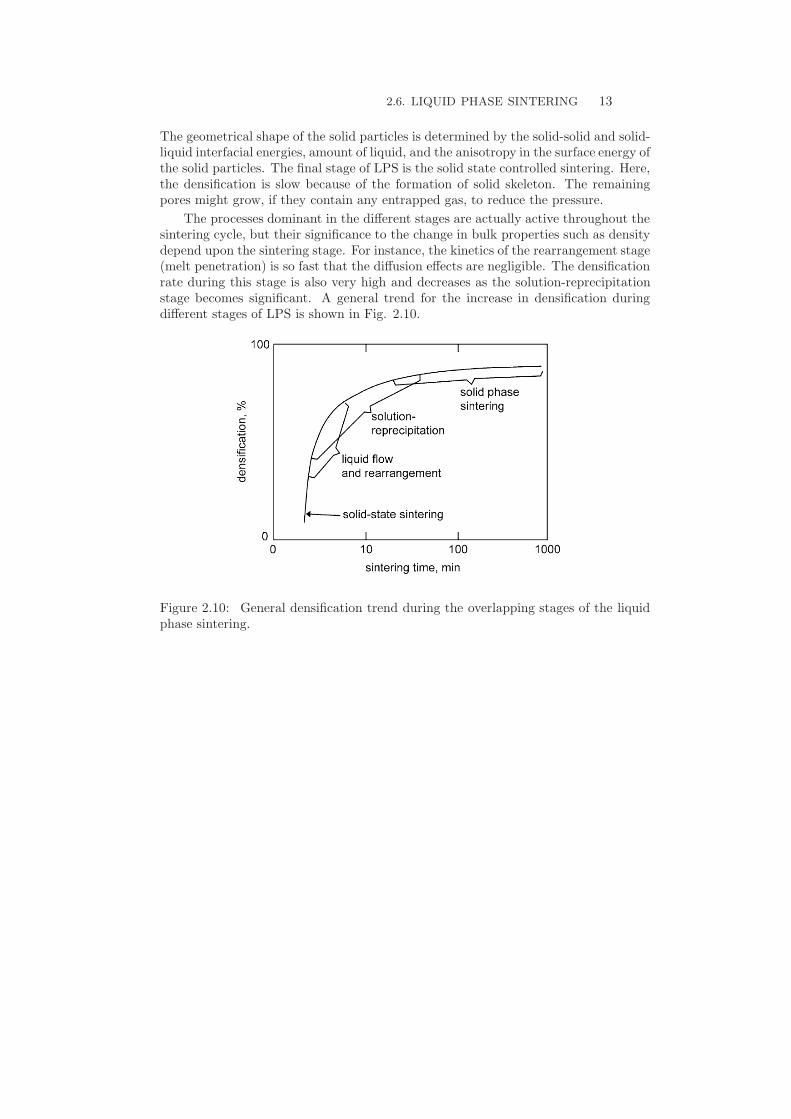
The processes dominant in the di!erent stages are actually active throughout thesintering cycle, but their significance to the change in bulk properties such as densitydepend upon the sintering stage. For instance, the kinetics of the rearrangement stage(melt penetration) is so fast that the di!usion e!ects are negligible. The densificationrate during this stage is also very high and decreases as the solution-reprecipitationstage becomes significant. A general trend for the increase in densification duringdi!erent stages of LPS is shown in Fig. 2.10.
Figure 2.10: General densification trend during the overlapping stages of the liquidphase sintering.
CHAPTER 3
Alloy element redistribution and dimensional variations
Alloying of the Fe powder is very common for optimizing the desired properties ofthe final product. In case of elemental or partially pre-alloyed powder mixes, it isusually desired that the proper homogenization of the alloying elements is achieved.The presence of liquid phase (persistent or transient) acts as a vehicle for the alloyingelements, which rapidly redistribute them into the solid matrix. This will coat thesolid particles by a liquid layer (depending upon the amount of liquid) and increasesthe e!ective cross-section for the solid-state di!usion of the alloying elements. Assintering is basically the di!usion (motion) of atoms that is why the liquid phaseenhances the sintering mechanism. Hence, in general liquid phase not only enhancesthe sintering mechanism but also provides a faster channel for the redistribution ofalloying element.
As always there are some disadvantages, the dimensional variation associated withthe rapid distribution of the liquid phase is one such e!ect of the LPS. The fasterkinetics of the liquid phase penetration makes it more di"cult to control the dimen-sional variations and they might a!ect the final dimensional tolerances of the product.According to the heavy alloy mechanism (Lenel (1948)) the significant rearrangementof the solid particles for the densification of the compact on melt formation is depen-dent on five criteria; solubility of solid in the liquid, low contact angle, small dihedralangle, low degree of solid state interparticle bonding, and loose powder structure.The probability of swelling increases as fewer of these criteria are fulfilled. The firstthree criteria mentioned above are the material parameters, while the last two are theprocessing conditions. There are several other processing factors like green density,heating rate and particle size, which can also e!ect the rearrangement of solid parti-cles. So the basic criteria might not show the complete picture, but still they are agood starting point for predicting the overall behavior of a system.
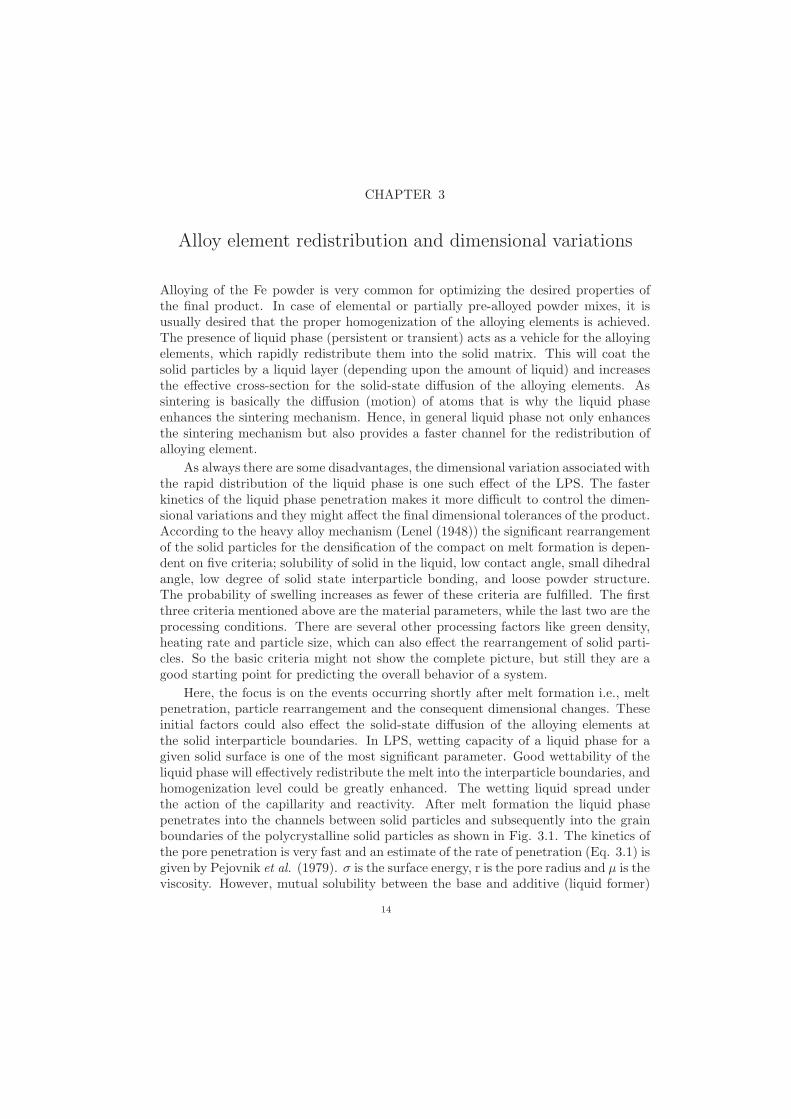
Here, the focus is on the events occurring shortly after melt formation i.e., meltpenetration, particle rearrangement and the consequent dimensional changes. Theseinitial factors could also e!ect the solid-state di!usion of the alloying elements atthe solid interparticle boundaries. In LPS, wetting capacity of a liquid phase for agiven solid surface is one of the most significant parameter. Good wettability of theliquid phase will e!ectively redistribute the melt into the interparticle boundaries, andhomogenization level could be greatly enhanced. The wetting liquid spread underthe action of the capillarity and reactivity. After melt formation the liquid phasepenetrates into the channels between solid particles and subsequently into the grainboundaries of the polycrystalline solid particles as shown in Fig. 3.1. The kinetics ofthe pore penetration is very fast and an estimate of the rate of penetration (Eq. 3.1) isgiven by Pejovnik et al. (1979). " is the surface energy, r is the pore radius and µ is theviscosity. However, mutual solubility between the base and additive (liquid former)
14
3. ALLOY ELEMENT REDISTRIBUTION AND DIMENSIONAL VARIATIONS 15
also a!ects the spreading/penetration kinetics. The dissolution processes between thesolid and liquid phase improves the wetting but the kinetics of the spreading becomesslow. In addition, the melting behavior (precise melting point or melting over a range)of the additive phase is also important in determining the distribution of the liquidphase and how it e!ects the dimensional variations. Moreover, the presence of oxideson the solid particles inhibits the proper wetting of liquid phase.
x2 = "·r·t·cos#/2µ (3.1)
Figure 3.1: Schematic illustration of the melt penetration into interparticle and grainboundaries and the consequent rearrangement (re-printed from (German 1985)).
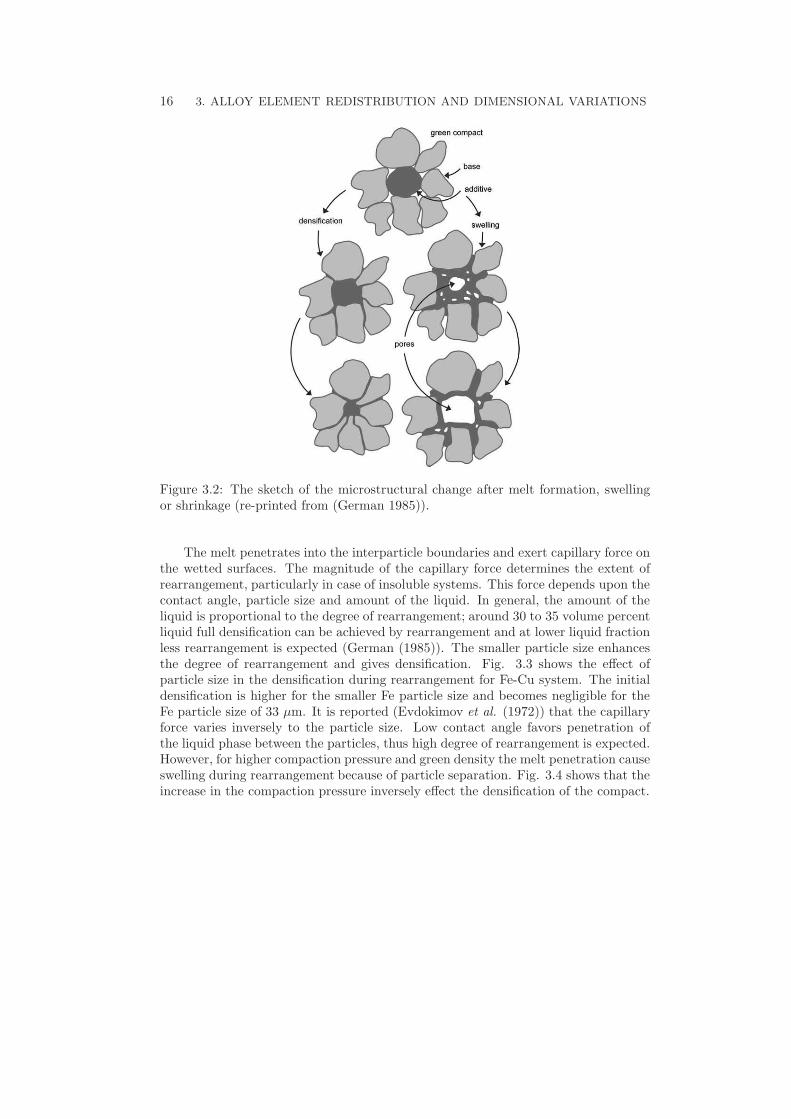
In general melt formation (spreading/penetration) and the mutual solubilityamong the components of the system are the important material parameters in deter-mining the dimensional behavior of the compact during rearrangement stage; shrink-age or expansion. A high solid solubility in the liquid helps densification by rearrange-ment, whereas high solubility of the liquid in the solid coupled with the low solubilityof the solid in the liquid gives swelling. The solubility ratio SR is defined as, = SB/SA.S represent the solubility, where the subscript B is the base (major phase) solubilityin the additive and A is the additive solubility in the base. The schematic of theshrinkage and expansion is shown in Fig. 3.2. The densification because of highsolid solubility in liquid is related to the lubrication and surface smoothing of solidparticles.
16 3. ALLOY ELEMENT REDISTRIBUTION AND DIMENSIONAL VARIATIONS
Figure 3.2: The sketch of the microstructural change after melt formation, swellingor shrinkage (re-printed from (German 1985)).
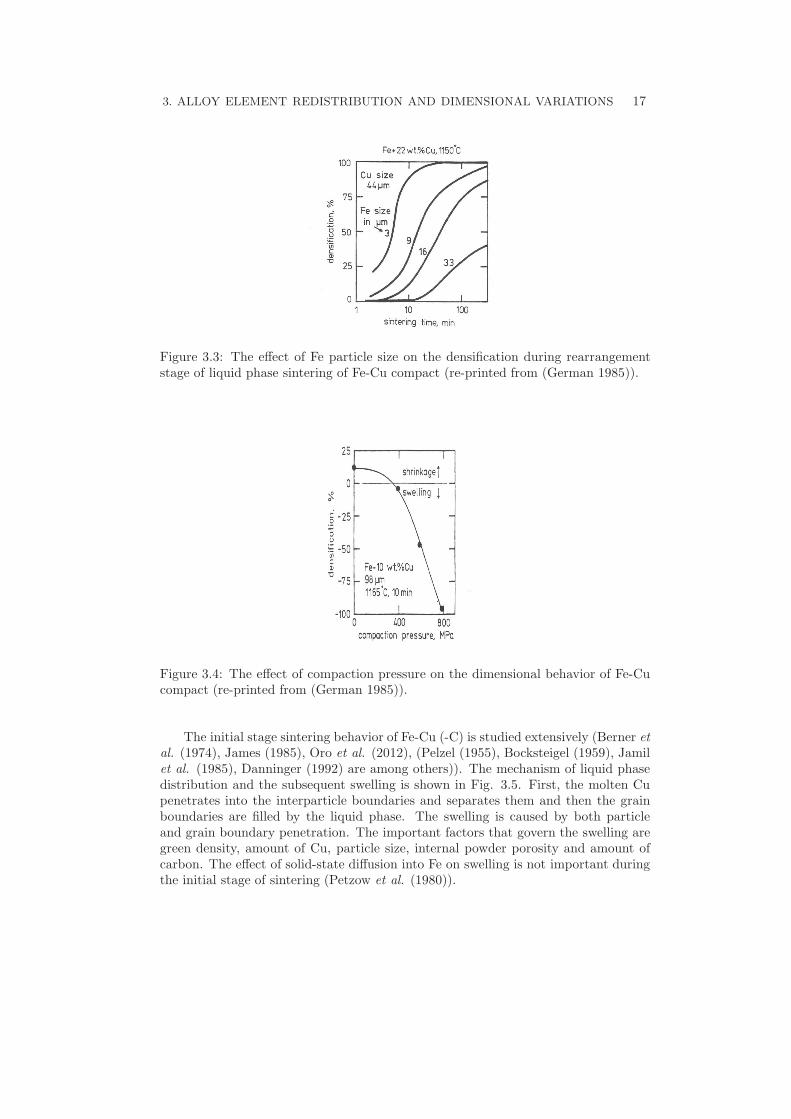
The melt penetrates into the interparticle boundaries and exert capillary force onthe wetted surfaces. The magnitude of the capillary force determines the extent ofrearrangement, particularly in case of insoluble systems. This force depends upon thecontact angle, particle size and amount of the liquid. In general, the amount of theliquid is proportional to the degree of rearrangement; around 30 to 35 volume percentliquid full densification can be achieved by rearrangement and at lower liquid fractionless rearrangement is expected (German (1985)). The smaller particle size enhancesthe degree of rearrangement and gives densification. Fig. 3.3 shows the e!ect ofparticle size in the densification during rearrangement for Fe-Cu system. The initialdensification is higher for the smaller Fe particle size and becomes negligible for theFe particle size of 33 µm. It is reported (Evdokimov et al. (1972)) that the capillaryforce varies inversely to the particle size. Low contact angle favors penetration ofthe liquid phase between the particles, thus high degree of rearrangement is expected.However, for higher compaction pressure and green density the melt penetration causeswelling during rearrangement because of particle separation. Fig. 3.4 shows that theincrease in the compaction pressure inversely e!ect the densification of the compact.
3. ALLOY ELEMENT REDISTRIBUTION AND DIMENSIONAL VARIATIONS 17
Figure 3.3: The e!ect of Fe particle size on the densification during rearrangementstage of liquid phase sintering of Fe-Cu compact (re-printed from (German 1985)).
Figure 3.4: The e!ect of compaction pressure on the dimensional behavior of Fe-Cucompact (re-printed from (German 1985)).
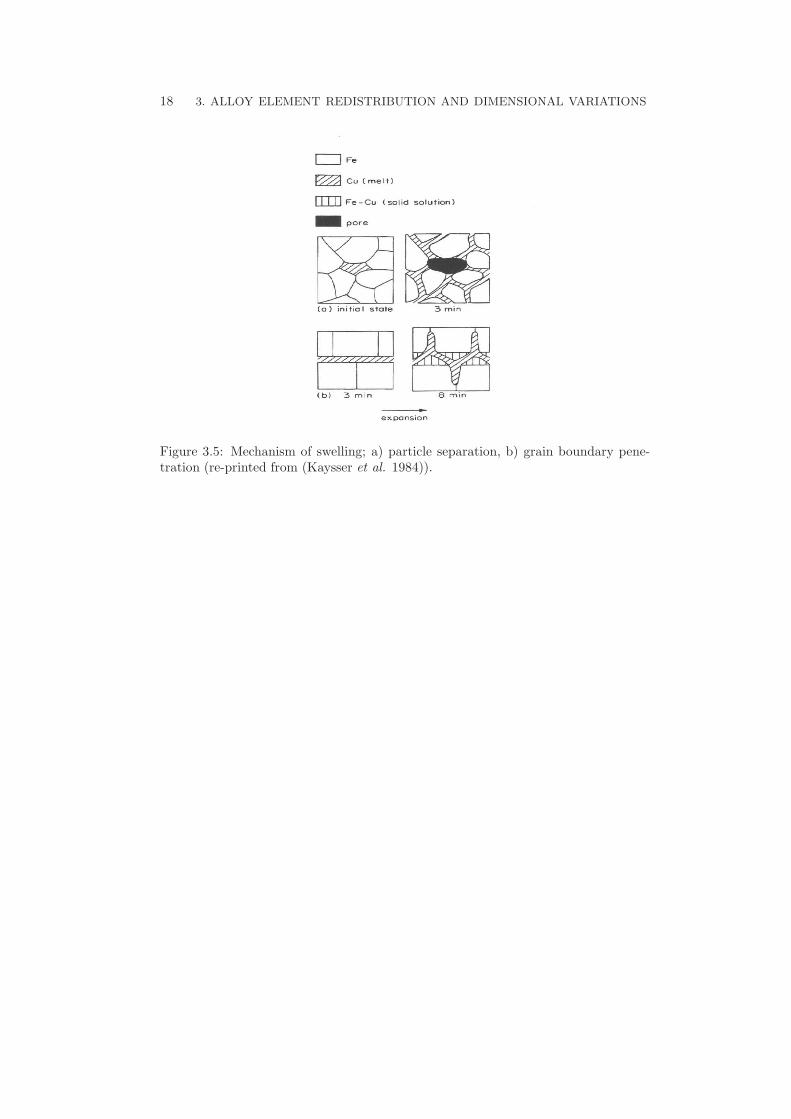
The initial stage sintering behavior of Fe-Cu (-C) is studied extensively (Berner etal. (1974), James (1985), Oro et al. (2012), (Pelzel (1955), Bocksteigel (1959), Jamilet al. (1985), Danninger (1992) are among others)). The mechanism of liquid phasedistribution and the subsequent swelling is shown in Fig. 3.5. First, the molten Cupenetrates into the interparticle boundaries and separates them and then the grainboundaries are filled by the liquid phase. The swelling is caused by both particleand grain boundary penetration. The important factors that govern the swelling aregreen density, amount of Cu, particle size, internal powder porosity and amount ofcarbon. The e!ect of solid-state di!usion into Fe on swelling is not important duringthe initial stage of sintering (Petzow et al. (1980)).
18 3. ALLOY ELEMENT REDISTRIBUTION AND DIMENSIONAL VARIATIONS
Figure 3.5: Mechanism of swelling; a) particle separation, b) grain boundary pene-tration (re-printed from (Kaysser et al. 1984)).
CHAPTER 4
Basic theory
4.1. Wetting
4.1.1. Surface tension
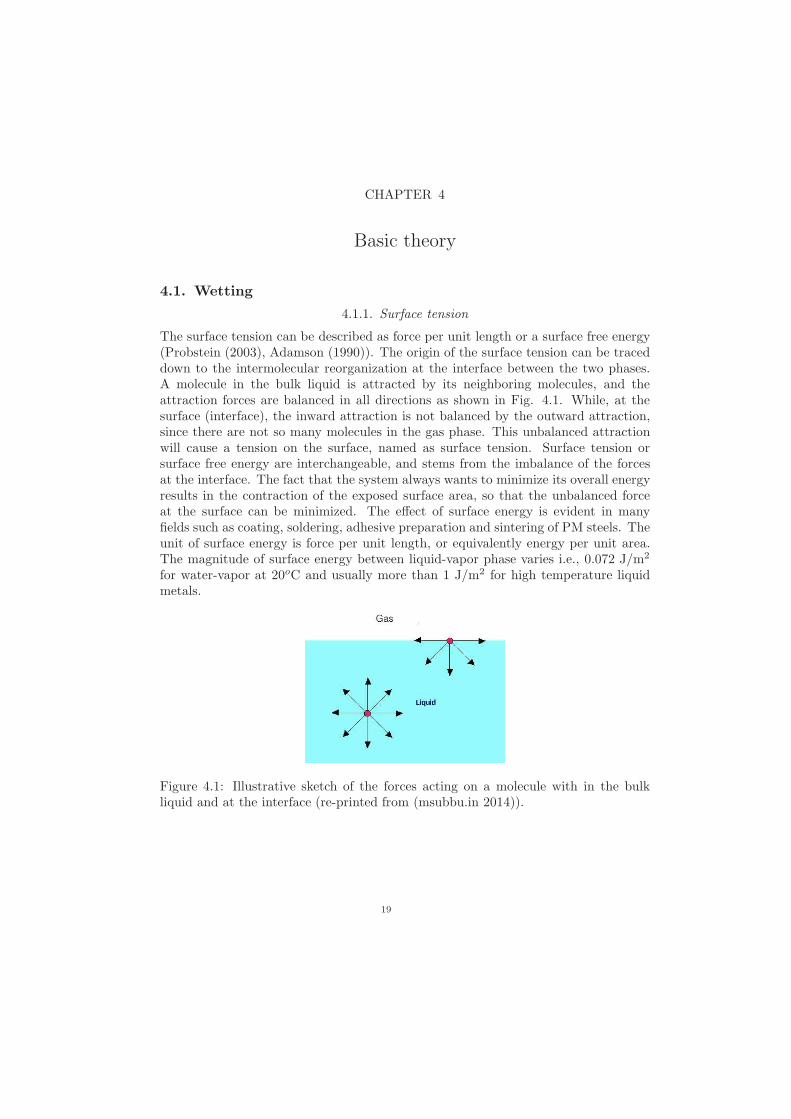
The surface tension can be described as force per unit length or a surface free energy(Probstein (2003), Adamson (1990)). The origin of the surface tension can be traceddown to the intermolecular reorganization at the interface between the two phases.A molecule in the bulk liquid is attracted by its neighboring molecules, and theattraction forces are balanced in all directions as shown in Fig. 4.1. While, at thesurface (interface), the inward attraction is not balanced by the outward attraction,since there are not so many molecules in the gas phase. This unbalanced attractionwill cause a tension on the surface, named as surface tension. Surface tension orsurface free energy are interchangeable, and stems from the imbalance of the forcesat the interface. The fact that the system always wants to minimize its overall energyresults in the contraction of the exposed surface area, so that the unbalanced forceat the surface can be minimized. The e!ect of surface energy is evident in manyfields such as coating, soldering, adhesive preparation and sintering of PM steels. Theunit of surface energy is force per unit length, or equivalently energy per unit area.The magnitude of surface energy between liquid-vapor phase varies i.e., 0.072 J/m2
for water-vapor at 20oC and usually more than 1 J/m2 for high temperature liquidmetals.
Figure 4.1: Illustrative sketch of the forces acting on a molecule with in the bulkliquid and at the interface (re-printed from (msubbu.in 2014)).
19
20 4. BASIC THEORY
4.1.2. Wetting and Young-Laplace law
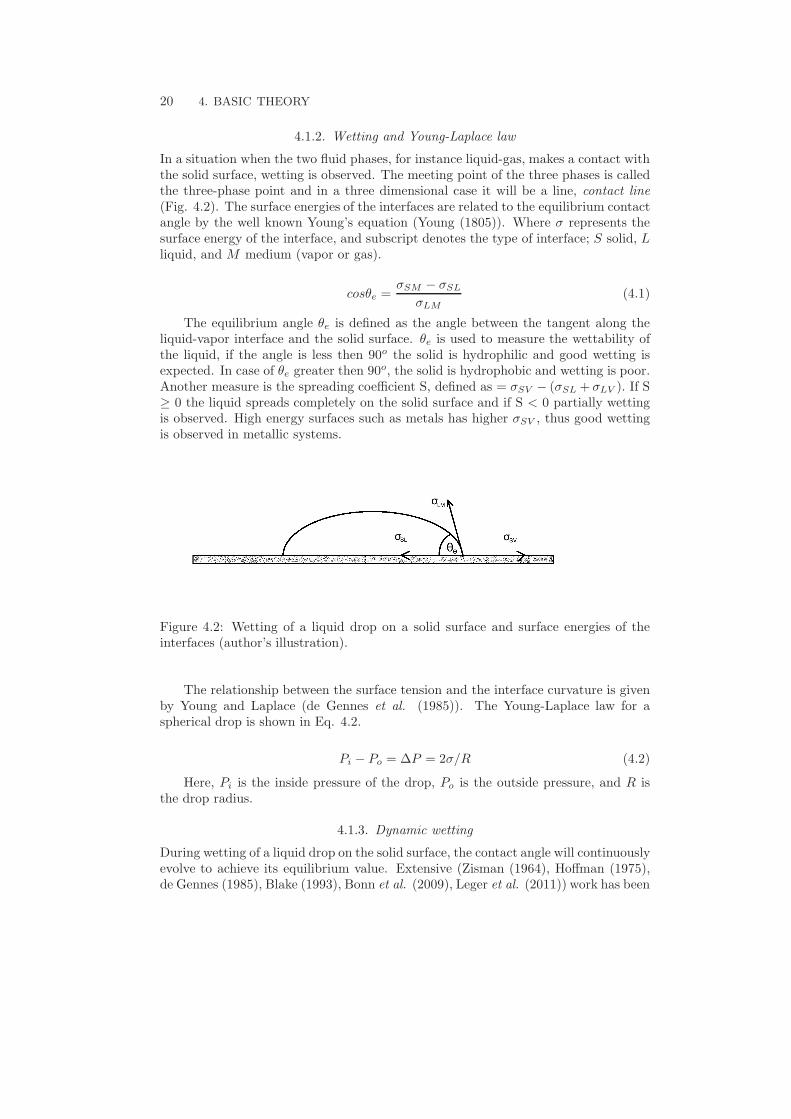
In a situation when the two fluid phases, for instance liquid-gas, makes a contact withthe solid surface, wetting is observed. The meeting point of the three phases is calledthe three-phase point and in a three dimensional case it will be a line, contact line(Fig. 4.2). The surface energies of the interfaces are related to the equilibrium contactangle by the well known Young’s equation (Young (1805)). Where " represents thesurface energy of the interface, and subscript denotes the type of interface; S solid, Lliquid, and M medium (vapor or gas).
cos#e ="SM # "SL
"LM(4.1)
The equilibrium angle #e is defined as the angle between the tangent along theliquid-vapor interface and the solid surface. #e is used to measure the wettability ofthe liquid, if the angle is less then 90o the solid is hydrophilic and good wetting isexpected. In case of #e greater then 90o, the solid is hydrophobic and wetting is poor.Another measure is the spreading coe"cient S, defined as = "SV # ("SL + "LV ). If S$ 0 the liquid spreads completely on the solid surface and if S < 0 partially wettingis observed. High energy surfaces such as metals has higher "SV , thus good wettingis observed in metallic systems.
Figure 4.2: Wetting of a liquid drop on a solid surface and surface energies of theinterfaces (author’s illustration).
The relationship between the surface tension and the interface curvature is givenby Young and Laplace (de Gennes et al. (1985)). The Young-Laplace law for aspherical drop is shown in Eq. 4.2.
Pi # Po = $P = 2"/R (4.2)
Here, Pi is the inside pressure of the drop, Po is the outside pressure, and R isthe drop radius.
4.1.3. Dynamic wetting
During wetting of a liquid drop on the solid surface, the contact angle will continuouslyevolve to achieve its equilibrium value. Extensive (Zisman (1964), Ho!man (1975),de Gennes (1985), Blake (1993), Bonn et al. (2009), Leger et al. (2011)) work has been
4.2. SOLID PARTICLE REARRANGEMENT 21
done to explain the evolution of contact angle during wetting. Dynamic wetting canbe explained primarily by two theories, known as the molecular-kinetic (MK) theoryand the hydrodynamic theory. According to the MK theory (Cherry et al. (1969),Blake et al. (1969), Blake et al. (2002), Carlson et al. (2009), Carlson et al. (2102))during wetting the solid substrate o!ers adsorptive sites for the molecules of the liquidphase. Let ko and k represent the frequency and length respectively, of each moleculardisplacement to and from adsorptive sites on the solid surface. Then the velocity ofthe contact line is determined by the overall molecular displacement, guided by thesurface energy, in a preferred direction. Hence, the available energy is dissipatedin the TPZ (three phase zone) because of the to-and-fro molecular jumping at theadsorptive sites. However, the hydrodynamic theory emphasizes that the dominantdissipation channel is viscous flow in the wedge-shaped region of the liquid near theTPZ. Despite the fundamental di!erence in approach, these two theories have beenapplied successfully for many di!erent systems, implying that, in a broader scenario,both viscous dissipation and contact line friction control the dynamic wetting.
Understanding the wetting process in metals is challenging compared to liquidsat room temperature, because of high melting temperatures and possible dissolutione!ects. This process has been studied by many researchers (Ambrose et al. (1993),Saiz et al. (2004), Eustathopoulos (2005), Villanueva et al. (2009), Kozlova et al.(2010), Dezellus et al. (2010), Oro et al. (2012), Tahir et al. (2013) and more) inorder to explain the kinetics of spreading, and how it is a!ected by the reactivity ofthe substrate. Generally, wetting is improved by the dissolution of the substrate, butthe kinetics of process slows down. In reactive wetting, the first stage of wetting isvery fast and di!usion e!ects are negligible but during the second stage, substratedissolution becomes active and slow down the speed of liquid front.
4.2. Solid particle rearrangement
Solid particles connected by a liquid bridge can rearrange themselves under the ac-tion of capillary pressure. These forces are caused by the surface energies at thesolid-liquid-vapor boundary and the pressure di!erence due to the curved liquid-vaporinterface. The initial densification is mainly achieved by the rearrangement of solidparticles under the action of capillarity, especially in insoluble systems. Dependingupon the contact angle, solid particle separation and the amount of liquid; the cap-illary forces might be attractive (densification) or repulsive (swelling). Usually forlow contact angles (! 0o) the attractive forces exerted by the wetting liquid tend torearrange the solid particles for maximum packing, while for higher contact angle theforces are repulsive and swelling occurs. However, high green density (compactionpressure) might result in the separation of particle (swelling) due to the penetrationof liquid phase under the action of capillarity.
Several researchers (Heady et al. (1970), Huppmann et al. (1975), Anestiev etal. (1999)) have reported the theoretical and analytical description of the particlemovement connected by the liquid bridge. The theoretical work about the densifica-tion during liquid phase sintering proposed that the densification rate is a function oftime, temperature, and particle size. Huppmann & Riegger derived the interparticleforce as a function of interparticle distance. They also compared the analytical andexperimental results performed on tungsten spheres coated with copper.
22 4. BASIC THEORY
4.3. Di!usion
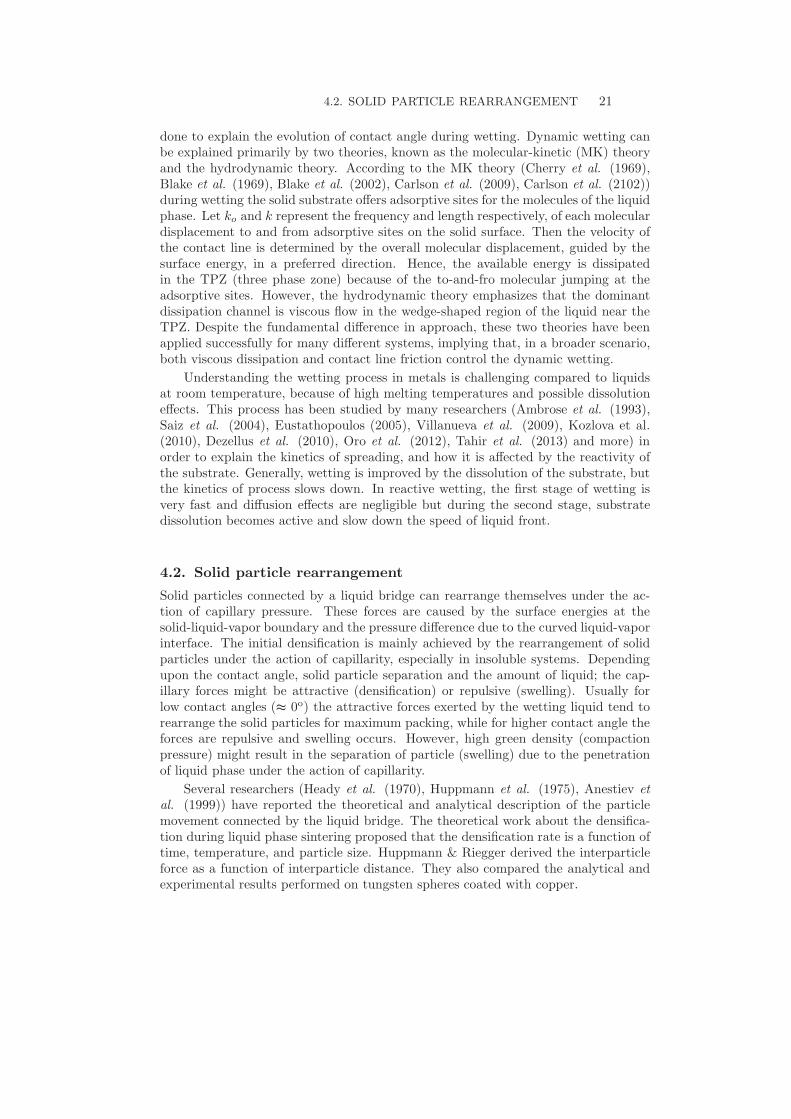
The transfer of atoms, either within a solid, or from another phase into solid, is thebasic mechanism of sintering. This migration of atoms through the crystal latticeis called di!usion. In metals the important di!usion mechanisms are vacancy andinterstitial di!usion. Vacancy or substitutional di!usion refers to the atomic jumpfrom its lattice position into an adjacent vacant site. Since the di!using atoms andvacancies exchange sites, the atomic flux is in the opposite direction of the vacancyflux. In case of interstitial di!usion an atom jumps from an interstitial position toan empty adjacent position. The atoms of relatively small dimensions usually di!useby this di!usion mechanism such as C, H etc. Fig. 4.3 shows the schematic of theinterstitial and substitutional di!usion mechanism. Usually, interstitial di!usion isfaster than the substitutional di!usion because of smaller size of interstitial atomsand also that the number of the interstitial sites are larger than the vacant latticesites.
Figure 4.3: Schematic of di!usion mechanism; a) vacancy, b) interstitial, (re-printedfrom (Hoganas Handbook - 6)).
The di!erence in concentrations of system components throughout the material isminimized by the movement of atoms. In case of non-steady state di!usion condition,which is the case in many particle situations, the di!usion is described by the Fick’ssecond law of di!usion (Eq. 4.3).
$c
$t= D
$2c
$2x(4.3)
Here, D is the di!usion coe"cient, x is the distance, c is the concentration, andt is the time.
CHAPTER 5
Modeling and experiments
5.1. Modeling
5.1.1. Wetting
Wetting can be modeled as a free interface problem where the surface energy of thedeformable interface between two immiscible fluids can be minimized by the changein their shapes. Several modeling techniques are developed to model the two–phaseflow by treating the interface in di!erent ways. Most common are the front-tracking(Unverdi et al. (1992)), volume-of-fluid (Hirt et al. (1981)), level set (Sussman etal. (1994)), and di!use-interface (phase field method) (Jacqmin (1999)). In addition,molecular dynamics simulations are also used to study the wetting dynamics (Yanget al. (1991), Coninck et al. (1995), Fan et al. (1995), Jin et al. (1997)).
In the front-tracking method evenly distributed Lagrangian markers are used totrack an interface. The advection of the markers is governed by the velocity fielddefined on a Eulerian grid. The level set method use a signed distance function todefine the interface. The clustering of markers and contours take place in front-tracking and level set method respectively, which is solved by inserting or deletingthe markers and by reinitializing the interface. The level set method has been appliedto the moving contact line problem (Singh et al. (2005), Mukherjee et al. (2007),Lesage et al. (2007), Son et al. (2007)). While, the volume-of-fluid method use acolor function to illustrate the shape and evolution of the interface. One commonthing in these models is that the boundary condition for the moving liquid front isnot well defined.
In the remaining sections, the focus will be placed on the di!use-interface models.Phase field models for two–phase flow are developed by postulating the free energyof the system. The change in the free energy of system can be used to model theinterfacial dynamics by using an appropriate boundary condition. The phase fieldmodel, considers that the interface have a finite thickness endowed with physicalproperties for instance surface tension. In the phase field method, the boundarycondition for the contact line motion is derived from the interfacial surface energies,which allows the contact line to move, even with a no-slip condition of the velocity.
The main advantages of the phase field models are, mass conservation, contactline motion, flexibility in simulating 2D, axisymmetric, and 3D problems. However,the finite thickness of the di!use interface is the major drawback of this method. Forinstance, a millimeter-sized drop is simulated with the interface thickness (" 0.01mm), which is many fold thicker than the real situation. Even with this unphysicalinterface thickness, many researcher have used the phase field models to predict the
23
24 5. MODELING AND EXPERIMENTS
wetting in accordance with the hydrodynamic theory (Villanueva et al. (2006), Yueet al. (2010) and Yue et al. (2011)).
The two common phase field models are the Cahn-Hilliard and Cahn-Allen theory.Cahn-Hilliard model, uses the conserved order parameter and applies to problems suchas, spinodal decomposition, contact-line dynamics, microfluidics applications (Cahn(1961), Badalassi et al. (2003), Kim et al. (2004)). While Cahn-Allen, uses the non-conserved order parameter and has been applied to problems such as, solidificationand nucleation (Boettinger et al. (2002), Loginova et al. (2003)). The stress singu-larity for the moving contact line is no longer present due to mass transfer across theinterface (Seppecher (1996)). In the above mentioned work, an assumption is madethat the moving interface is at local equilibrium during dynamic wetting. It has beenshown previously (Carlson et al. (2010)) and also in this work (Tahir et al. (2013)),that this assumption over predicts the wetting speed and fails to accurately capturethe temporal evolution of the contact line. Villanueva et al. (2009) qualitatively inves-tigated the important phenomenon in LPS; wetting, microstructure changes, particlemotion under capillarity, coalescence and pore elimination using idealized materialsystems.
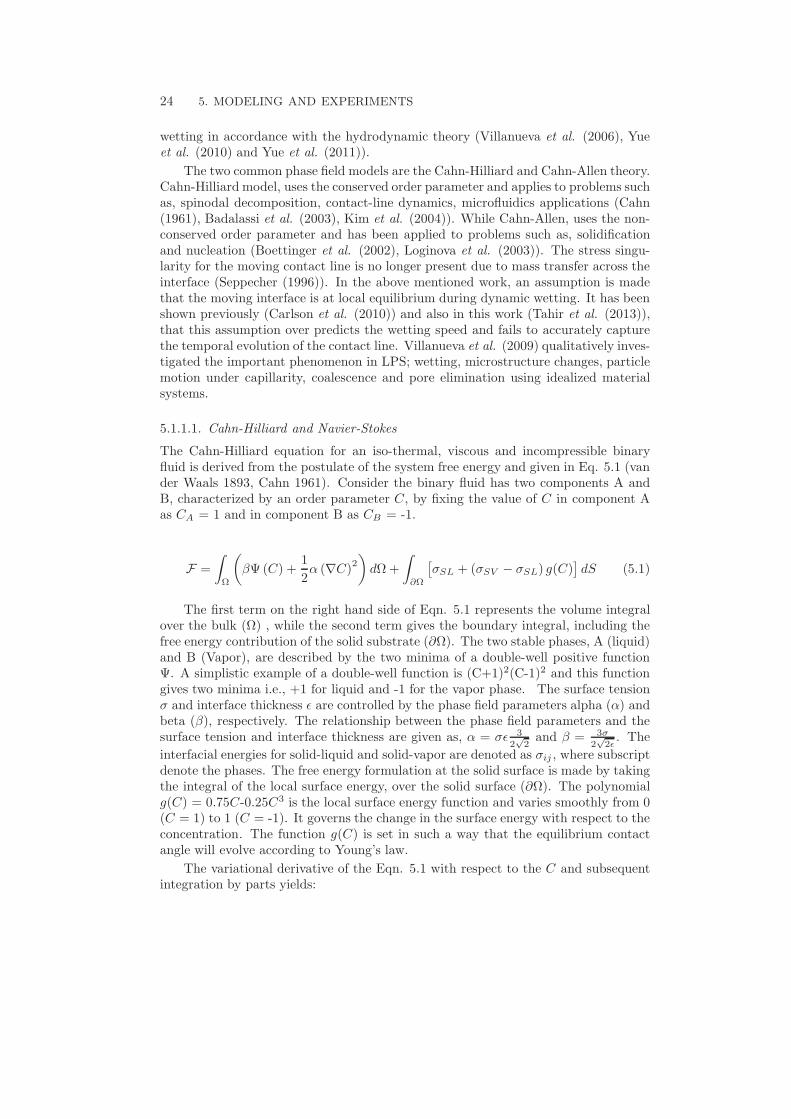
5.1.1.1. Cahn-Hilliard and Navier-Stokes
The Cahn-Hilliard equation for an iso-thermal, viscous and incompressible binaryfluid is derived from the postulate of the system free energy and given in Eq. 5.1 (vander Waals 1893, Cahn 1961). Consider the binary fluid has two components A andB, characterized by an order parameter C, by fixing the value of C in component Aas CA = 1 and in component B as CB = -1.
F =
!
!
"
%# (C) +1
2& (%C)2
#
d%+
!
!!
$
"SL + ("SV # "SL) g(C)%
dS (5.1)
The first term on the right hand side of Eqn. 5.1 represents the volume integralover the bulk (%) , while the second term gives the boundary integral, including thefree energy contribution of the solid substrate ($%). The two stable phases, A (liquid)and B (Vapor), are described by the two minima of a double-well positive function#. A simplistic example of a double-well function is (C+1)2(C-1)2 and this functiongives two minima i.e., +1 for liquid and -1 for the vapor phase. The surface tension" and interface thickness ' are controlled by the phase field parameters alpha (&) andbeta (%), respectively. The relationship between the phase field parameters and thesurface tension and interface thickness are given as, & = "' 3
2!2and % = 3"
2!2#. The
interfacial energies for solid-liquid and solid-vapor are denoted as "ij , where subscriptdenote the phases. The free energy formulation at the solid surface is made by takingthe integral of the local surface energy, over the solid surface ($%). The polynomialg(C) = 0.75C-0.25C3 is the local surface energy function and varies smoothly from 0(C = 1) to 1 (C = -1). It governs the change in the surface energy with respect to theconcentration. The function g(C) is set in such a way that the equilibrium contactangle will evolve according to Young’s law.
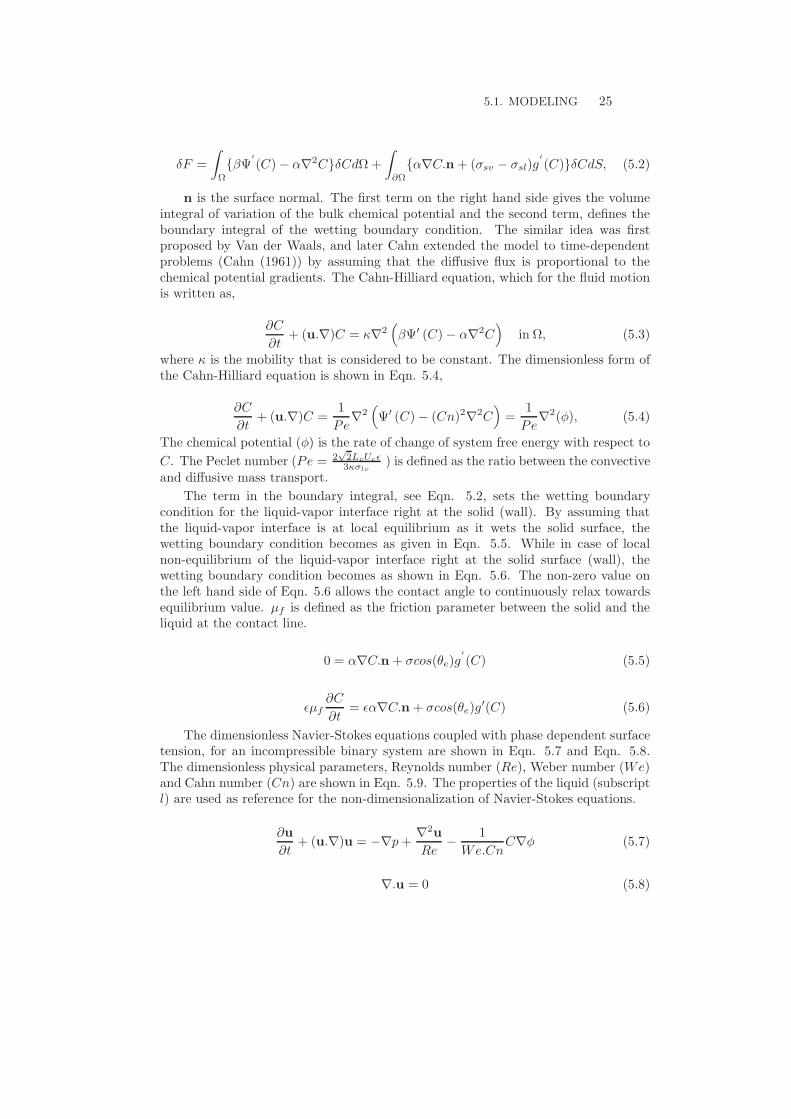
The variational derivative of the Eqn. 5.1 with respect to the C and subsequentintegration by parts yields:
5.1. MODELING 25
(F =
!
!{%#
!
(C)# &%2C}(Cd%+
!
!!{&%C.n+ ("sv # "sl)g
!
(C)}(CdS, (5.2)
n is the surface normal. The first term on the right hand side gives the volumeintegral of variation of the bulk chemical potential and the second term, defines theboundary integral of the wetting boundary condition. The similar idea was firstproposed by Van der Waals, and later Cahn extended the model to time-dependentproblems (Cahn (1961)) by assuming that the di!usive flux is proportional to thechemical potential gradients. The Cahn-Hilliard equation, which for the fluid motionis written as,
$C
$t+ (u.%)C = )%2
&
%#" (C)# &%2C'
in %, (5.3)
where ) is the mobility that is considered to be constant. The dimensionless form ofthe Cahn-Hilliard equation is shown in Eqn. 5.4,
$C
$t+ (u.%)C =
1
Pe%2
&
#" (C)# (Cn)2%2C'
=1
Pe%2(*), (5.4)
The chemical potential (*) is the rate of change of system free energy with respect to
C. The Peclet number (Pe = 2!2LcUc#3$"lv
) is defined as the ratio between the convectiveand di!usive mass transport.
The term in the boundary integral, see Eqn. 5.2, sets the wetting boundarycondition for the liquid-vapor interface right at the solid (wall). By assuming thatthe liquid-vapor interface is at local equilibrium as it wets the solid surface, thewetting boundary condition becomes as given in Eqn. 5.5. While in case of localnon-equilibrium of the liquid-vapor interface right at the solid surface (wall), thewetting boundary condition becomes as shown in Eqn. 5.6. The non-zero value onthe left hand side of Eqn. 5.6 allows the contact angle to continuously relax towardsequilibrium value. µf is defined as the friction parameter between the solid and theliquid at the contact line.
0 = &%C.n + "cos(#e)g!
(C) (5.5)
'µf$C
$t= '&%C.n + "cos(#e)g
"(C) (5.6)
The dimensionless Navier-Stokes equations coupled with phase dependent surfacetension, for an incompressible binary system are shown in Eqn. 5.7 and Eqn. 5.8.The dimensionless physical parameters, Reynolds number (Re), Weber number (We)and Cahn number (Cn) are shown in Eqn. 5.9. The properties of the liquid (subscriptl) are used as reference for the non-dimensionalization of Navier-Stokes equations.
$u
$t+ (u.%)u = #%p+
%2u
Re#
1
We.CnC%* (5.7)
%.u = 0 (5.8)
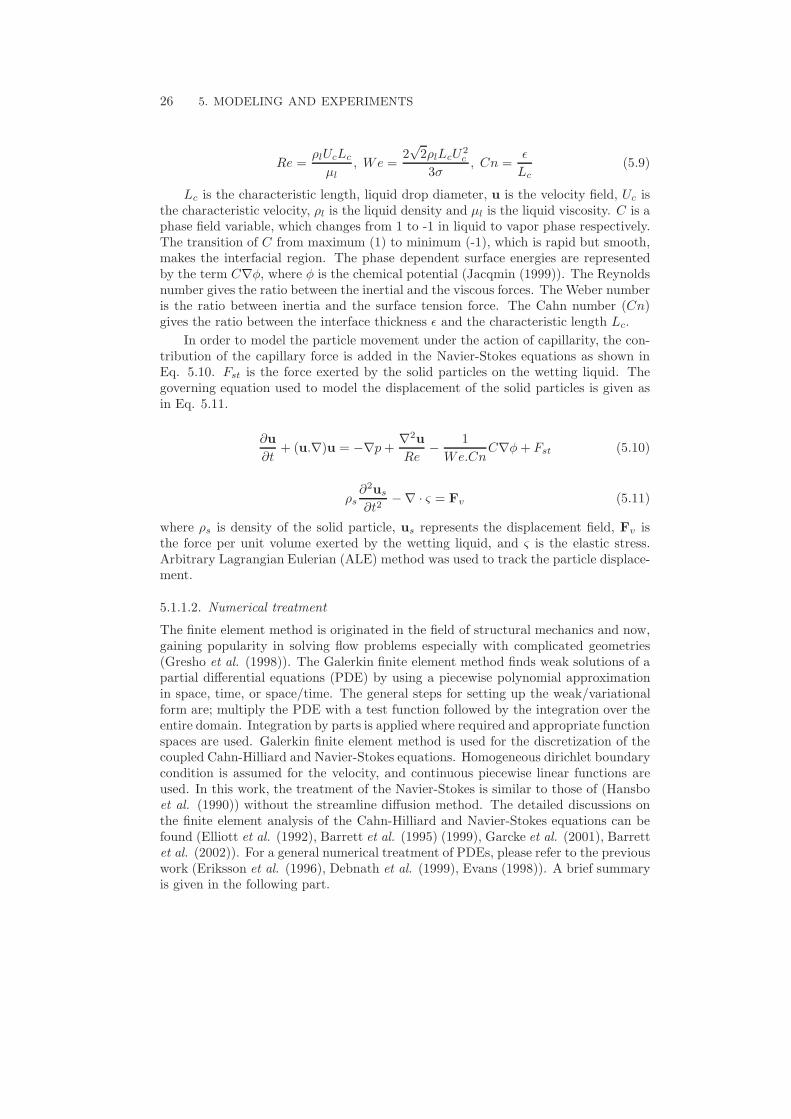
26 5. MODELING AND EXPERIMENTS
Re =!lUcLc
µl, We =
2&2!lLcU2
c
3", Cn =
'
Lc(5.9)
Lc is the characteristic length, liquid drop diameter, u is the velocity field, Uc isthe characteristic velocity, !l is the liquid density and µl is the liquid viscosity. C is aphase field variable, which changes from 1 to -1 in liquid to vapor phase respectively.The transition of C from maximum (1) to minimum (-1), which is rapid but smooth,makes the interfacial region. The phase dependent surface energies are representedby the term C%*, where * is the chemical potential (Jacqmin (1999)). The Reynoldsnumber gives the ratio between the inertial and the viscous forces. The Weber numberis the ratio between inertia and the surface tension force. The Cahn number (Cn)gives the ratio between the interface thickness ' and the characteristic length Lc.
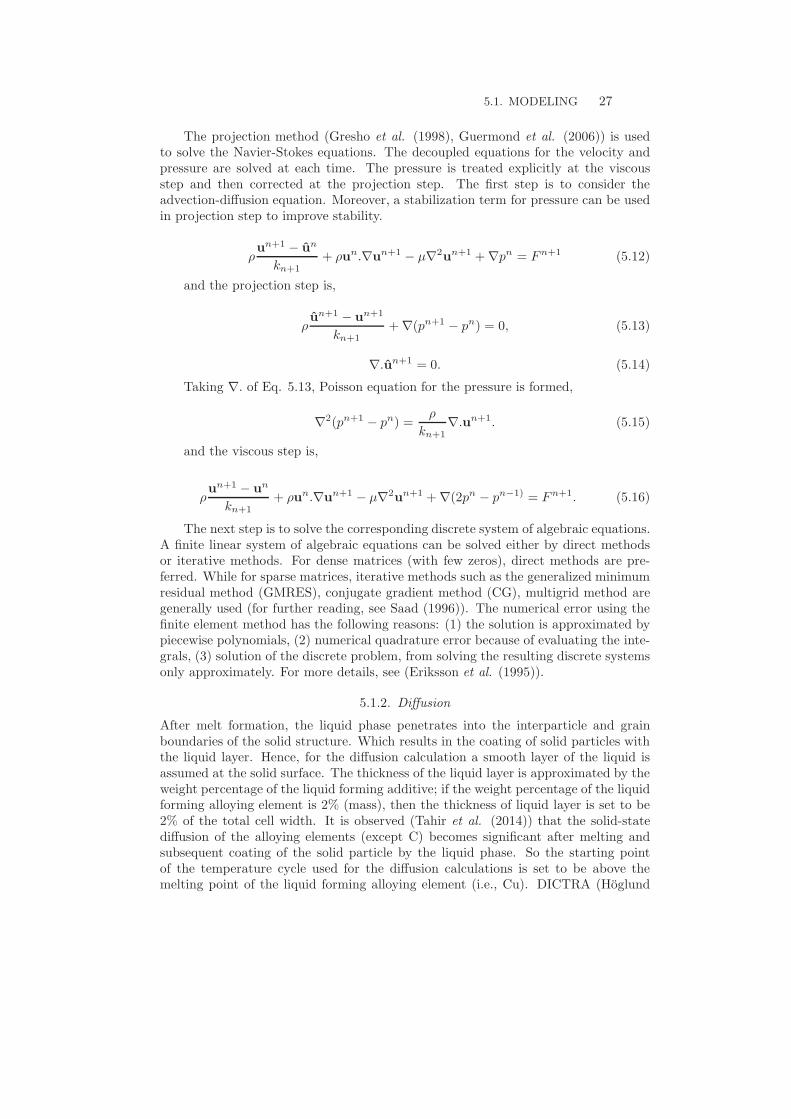
In order to model the particle movement under the action of capillarity, the con-tribution of the capillary force is added in the Navier-Stokes equations as shown inEq. 5.10. Fst is the force exerted by the solid particles on the wetting liquid. Thegoverning equation used to model the displacement of the solid particles is given asin Eq. 5.11.
$u
$t+ (u.%)u = #%p+
%2u
Re#
1
We.CnC%*+ Fst (5.10)
!s$2us
$t2#% · + = Fv (5.11)
where !s is density of the solid particle, us represents the displacement field, Fv isthe force per unit volume exerted by the wetting liquid, and + is the elastic stress.Arbitrary Lagrangian Eulerian (ALE) method was used to track the particle displace-ment.
5.1.1.2. Numerical treatment
The finite element method is originated in the field of structural mechanics and now,gaining popularity in solving flow problems especially with complicated geometries(Gresho et al. (1998)). The Galerkin finite element method finds weak solutions of apartial di!erential equations (PDE) by using a piecewise polynomial approximationin space, time, or space/time. The general steps for setting up the weak/variationalform are; multiply the PDE with a test function followed by the integration over theentire domain. Integration by parts is applied where required and appropriate functionspaces are used. Galerkin finite element method is used for the discretization of thecoupled Cahn-Hilliard and Navier-Stokes equations. Homogeneous dirichlet boundarycondition is assumed for the velocity, and continuous piecewise linear functions areused. In this work, the treatment of the Navier-Stokes is similar to those of (Hansboet al. (1990)) without the streamline di!usion method. The detailed discussions onthe finite element analysis of the Cahn-Hilliard and Navier-Stokes equations can befound (Elliott et al. (1992), Barrett et al. (1995) (1999), Garcke et al. (2001), Barrettet al. (2002)). For a general numerical treatment of PDEs, please refer to the previouswork (Eriksson et al. (1996), Debnath et al. (1999), Evans (1998)). A brief summaryis given in the following part.
5.1. MODELING 27
The projection method (Gresho et al. (1998), Guermond et al. (2006)) is usedto solve the Navier-Stokes equations. The decoupled equations for the velocity andpressure are solved at each time. The pressure is treated explicitly at the viscousstep and then corrected at the projection step. The first step is to consider theadvection-di!usion equation. Moreover, a stabilization term for pressure can be usedin projection step to improve stability.
!un+1 # un
kn+1+ !un.%un+1 # µ%2un+1 +%pn = Fn+1 (5.12)
and the projection step is,
!un+1 # un+1
kn+1+%(pn+1 # pn) = 0, (5.13)
%.un+1 = 0. (5.14)
Taking %. of Eq. 5.13, Poisson equation for the pressure is formed,
%2(pn+1 # pn) =!
kn+1%.un+1. (5.15)
and the viscous step is,
!un+1 # un
kn+1+ !un.%un+1 # µ%2un+1 +%(2pn # pn#1) = Fn+1. (5.16)
The next step is to solve the corresponding discrete system of algebraic equations.A finite linear system of algebraic equations can be solved either by direct methodsor iterative methods. For dense matrices (with few zeros), direct methods are pre-ferred. While for sparse matrices, iterative methods such as the generalized minimumresidual method (GMRES), conjugate gradient method (CG), multigrid method aregenerally used (for further reading, see Saad (1996)). The numerical error using thefinite element method has the following reasons: (1) the solution is approximated bypiecewise polynomials, (2) numerical quadrature error because of evaluating the inte-grals, (3) solution of the discrete problem, from solving the resulting discrete systemsonly approximately. For more details, see (Eriksson et al. (1995)).
5.1.2. Di!usion
After melt formation, the liquid phase penetrates into the interparticle and grainboundaries of the solid structure. Which results in the coating of solid particles withthe liquid layer. Hence, for the di!usion calculation a smooth layer of the liquid isassumed at the solid surface. The thickness of the liquid layer is approximated by theweight percentage of the liquid forming additive; if the weight percentage of the liquidforming alloying element is 2% (mass), then the thickness of liquid layer is set to be2% of the total cell width. It is observed (Tahir et al. (2014)) that the solid-statedi!usion of the alloying elements (except C) becomes significant after melting andsubsequent coating of the solid particle by the liquid phase. So the starting pointof the temperature cycle used for the di!usion calculations is set to be above themelting point of the liquid forming alloying element (i.e., Cu). DICTRA (Hoglund
28 5. MODELING AND EXPERIMENTS
et al. 2002) simulations for the di!usion of alloying element in the base powder wereperformed using the Thermo-Calc software TCFE6 Steels/Fe-alloys database (2013)and DICTRA mobility database mob2 (2013).
5.2. Experiments
5.2.1. Materials
The powder mixes investigated were Fe-2Cu, Fe-2Cu-0.5C and Fe-2MA-0.5C. MA isthe Cu based master alloy containing small amount of the Ni and Si. The detail ofpowder mixes composition and types of powders used are given in Table. 5.1. Theelemental powders were mixed in case of Fe-2Cu(-C) system, and for the master alloysystem Cu is pre-alloyed with Ni and Si and then mixed with the Fe base powder.
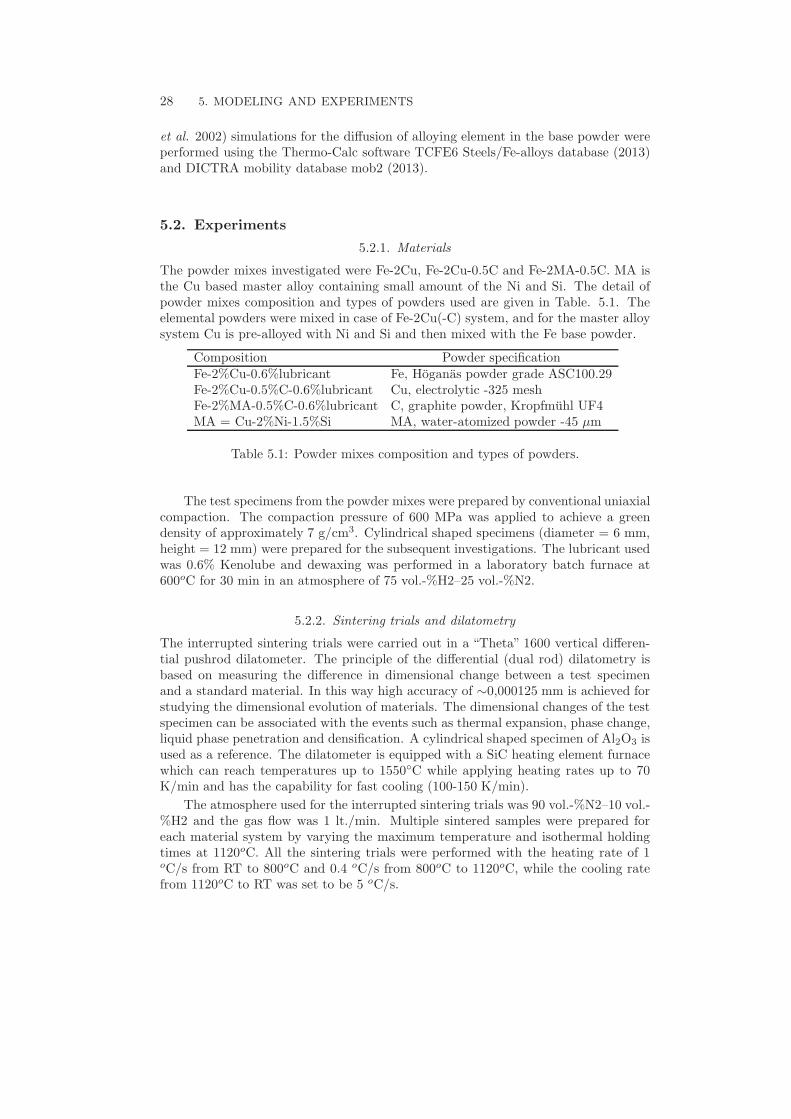
Composition Powder specificationFe-2%Cu-0.6%lubricantFe-2%Cu-0.5%C-0.6%lubricantFe-2%MA-0.5%C-0.6%lubricantMA = Cu-2%Ni-1.5%Si
Fe, Hoganas powder grade ASC100.29Cu, electrolytic -325 meshC, graphite powder, Kropfmuhl UF4MA, water-atomized powder -45 µm
Table 5.1: Powder mixes composition and types of powders.
The test specimens from the powder mixes were prepared by conventional uniaxialcompaction. The compaction pressure of 600 MPa was applied to achieve a greendensity of approximately 7 g/cm3. Cylindrical shaped specimens (diameter = 6 mm,height = 12 mm) were prepared for the subsequent investigations. The lubricant usedwas 0.6% Kenolube and dewaxing was performed in a laboratory batch furnace at600oC for 30 min in an atmosphere of 75 vol.-%H2–25 vol.-%N2.
5.2.2. Sintering trials and dilatometry
The interrupted sintering trials were carried out in a “Theta” 1600 vertical di!eren-tial pushrod dilatometer. The principle of the di!erential (dual rod) dilatometry isbased on measuring the di!erence in dimensional change between a test specimenand a standard material. In this way high accuracy of "0,000125 mm is achieved forstudying the dimensional evolution of materials. The dimensional changes of the testspecimen can be associated with the events such as thermal expansion, phase change,liquid phase penetration and densification. A cylindrical shaped specimen of Al2O3 isused as a reference. The dilatometer is equipped with a SiC heating element furnacewhich can reach temperatures up to 1550$C while applying heating rates up to 70K/min and has the capability for fast cooling (100-150 K/min).
The atmosphere used for the interrupted sintering trials was 90 vol.-%N2–10 vol.-%H2 and the gas flow was 1 lt./min. Multiple sintered samples were prepared foreach material system by varying the maximum temperature and isothermal holdingtimes at 1120oC. All the sintering trials were performed with the heating rate of 1oC/s from RT to 800oC and 0.4 oC/s from 800oC to 1120oC, while the cooling ratefrom 1120oC to RT was set to be 5 oC/s.
5.2. EXPERIMENTS 29
5.2.3. Microscopy
Light optical microscopy (LOM) was used to study the microstructural evolution dur-ing the sintering cycle. The cross-sections of the specimens were prepared by cutting,grinding and polishing. The specimens were subsequently etched with pikral/nitalprior to LOM. The behavior of liquid phase in term of melting and penetration intosolid matrix is investigated. Moreover, the kinetics of liquid phase penetration andsubsequent dissolution in the base powder is studied. In addition, the change in thetotal porosity during sintering is investigated for the Fe-2%Cu (-C) system.
Energy dispersive X-ray spectroscopy (EDXS) is performed to measure the Cudi!usion in Fe, at Fe interparticle boundaries during sintering. The di!usion mea-surements were carried out using a Hitachi 3700N equipped with the Quantax system.The samples were etched with 1% nital to be able to identify Cu-rich Fe interparticleboundaries, before performing line scans. The accelerating voltage was set to 15 kVand the working distance was 10 mm. The minimum detectable composition wasassumed to be 0.3% mass. It is di"cult to find a representative measure of the dif-fusion distance of alloying element in sintered cross section; irregular powder shapes,possible contact of the base particle with the additive particle or not, and the positionof the section makes it challenging. That is why multiple line scans were performedon each sample to measure the alloying element (Cu) di!usion distance in Fe. Themeasured concentration profiles were fitted to a bell curve to extract the di!usiondistance (refer Paper 3 and 4 in part II).
CHAPTER 6
Summary of results
6.1. Wetting
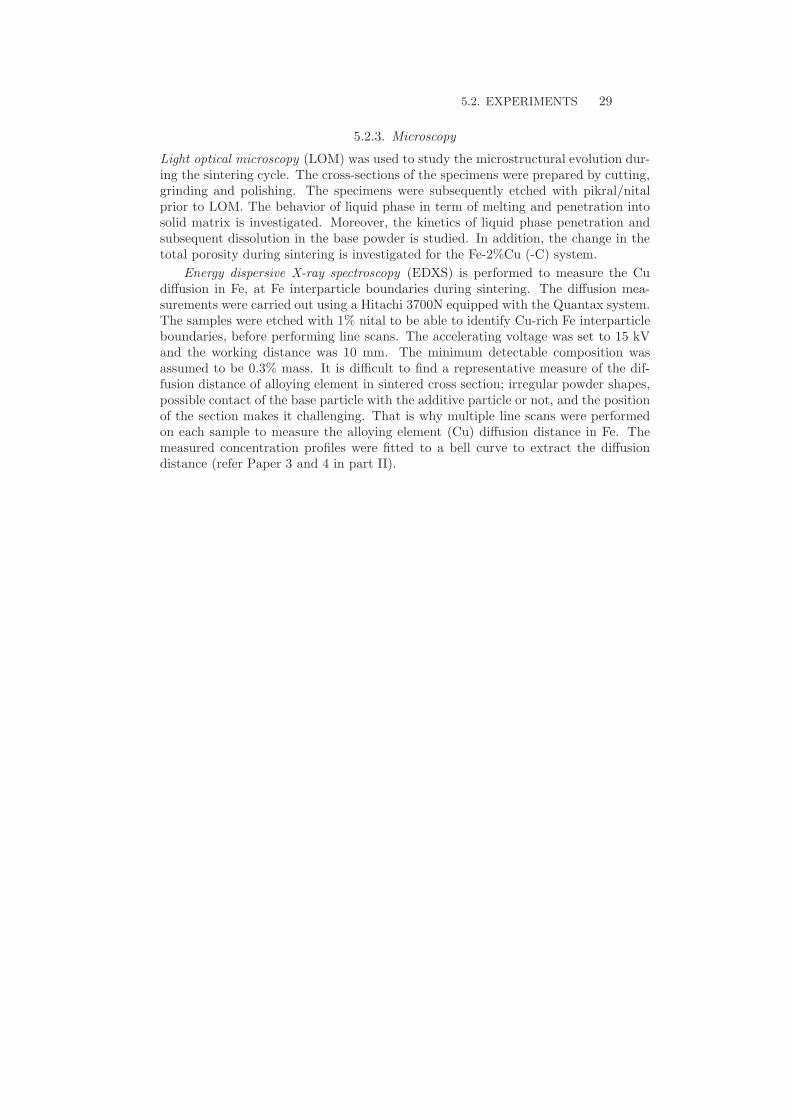
Phase field simulations were performed to simulate the wetting of molten metals onsolid surfaces. The numerical model is implemented to predict the dynamic wet-ting of millimeter-sized metallic drops and subsequently verified with the experimen-tal results. After this, the model is applied to predict the dynamic wetting of themicrometer-sized metallic drop. The metallic systems investigated were Cu on Mo,Cu + 3%Fe on Fe + 8%Cu, and Cu on Fe. Realistic physical properties (density, vis-cosity) and wetting parameters (equilibrium contact angle, drop diameter) were givenas input to model. Some representative 3D snapshots of the wetting simulations areshown in Fig. 6.1. The initial condition of simulations is shown in the snapshot at t= 0. The evolution of the dynamic contact angle as the wetting progresses is shownin the snapshot at t > 0.
(a) (b)
Figure 6.1: 3D snapshot sequence of wetting simulations: (a) at t = 0, (b) t > 0.The time for the snapshots is in dimensionless form. Fig. 2 in Paper 1 in Part II.
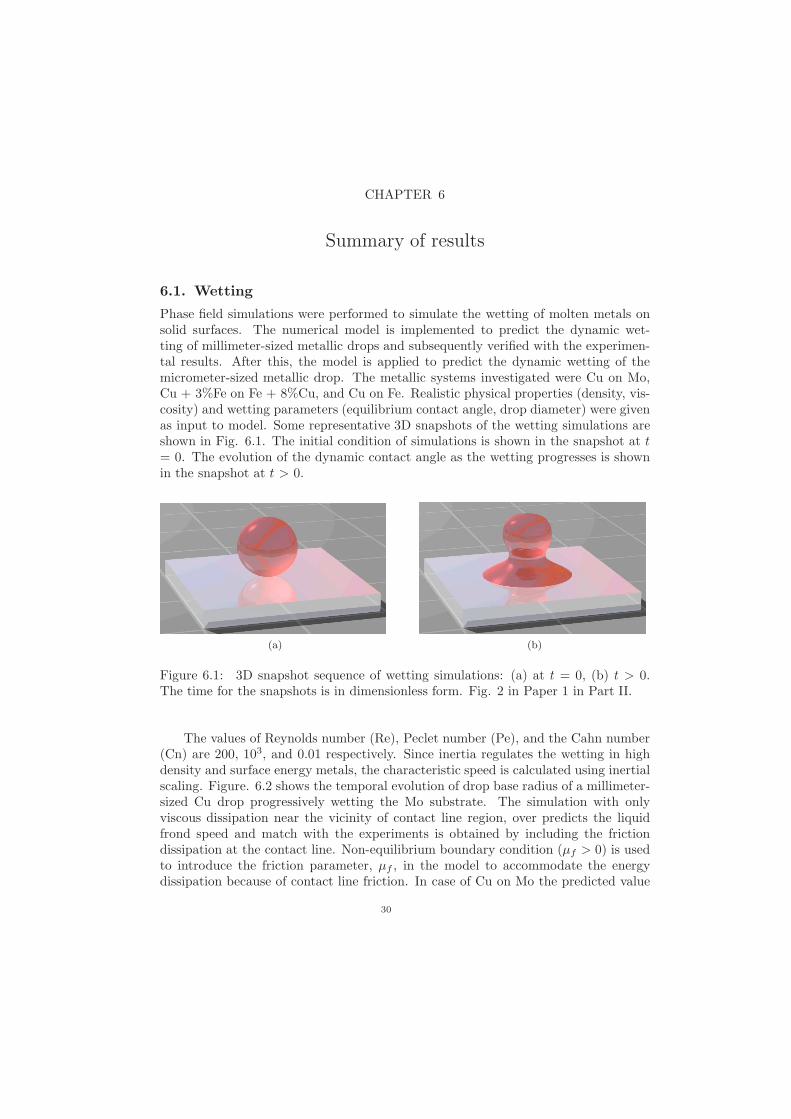
The values of Reynolds number (Re), Peclet number (Pe), and the Cahn number(Cn) are 200, 103, and 0.01 respectively. Since inertia regulates the wetting in highdensity and surface energy metals, the characteristic speed is calculated using inertialscaling. Figure. 6.2 shows the temporal evolution of drop base radius of a millimeter-sized Cu drop progressively wetting the Mo substrate. The simulation with onlyviscous dissipation near the vicinity of contact line region, over predicts the liquidfrond speed and match with the experiments is obtained by including the frictiondissipation at the contact line. Non-equilibrium boundary condition (µf > 0) is usedto introduce the friction parameter, µf , in the model to accommodate the energydissipation because of contact line friction. In case of Cu on Mo the predicted value
30
6.1. WETTING 31
of the adjustable friction parameter, µf is 6.12 Pa.s for #e = 26o, and for saturatedcompositions of Cu on Fe at #e = 74o, µf is 3.4 Pa.s. It is observed that the magnitudeof the fitted friction parameter, µf , is directly proportional to the wettability ofthe liquid; higher wettability gives stronger interaction between metallic liquid andthe solid substrate resulting in higher value of friction parameter. Moreover, thesimulations predict the relaxation of contact angle towards equilibrium value andits relationship with the contact line speed. In accordance with the experimentalfindings a linear relation between the contact angle and contact line speed, except inthe impact regime, is observed.
0 1 2 3 4 5 6 7 8x 10!3
0
0.5
1
1.5
2
2.5
x 10!3
Time (sec)
Dro
p ba
se ra
dius
(m)
µf = 4.5
µf = 0
Experiment
Figure 6.2: Comparison between experimental and simulation results of drop baseradius displacement vs. time. The solid line with open symbols shows the simulationresults with µf = 0. The solid line shows the simulation results with µf = 4.5(dimensional value = 6.12 Pa.s). The experimental results are shown by asterisks.Fig. 5 in Paper 1 in Part II.
Fig. 6.3 illustrates the isocontours of the metal drop shape at di!erent time duringwetting. It is found that the change in the boundary condition a!ects the temporalevolution of dynamic contact angle and surface curvature of wetting metallic drop.The equilibrium boundary condition immediately imposes the contact angle right atthe substrate and also allows more surface curvature, thus adding extra speed. Incase of non-equilibrium boundary condition the dynamic contact right at the solidsurface continuously relax towards the equilibrium value. Qualitatively the pattern ofdynamic wetting of a micrometer-sized metal drop is in many ways similar to that ofthe millimeter-sized. For example, bending of the liquid-vapor interface, propagationof the capillary wave, and the temporal evolution of the liquid front speed. However,the wetting process is much faster at the micro level compare to the millimetric scale.The simulations predict that the wetting speed of a millimeter-sized metal drop is in
32 6. SUMMARY OF RESULTS
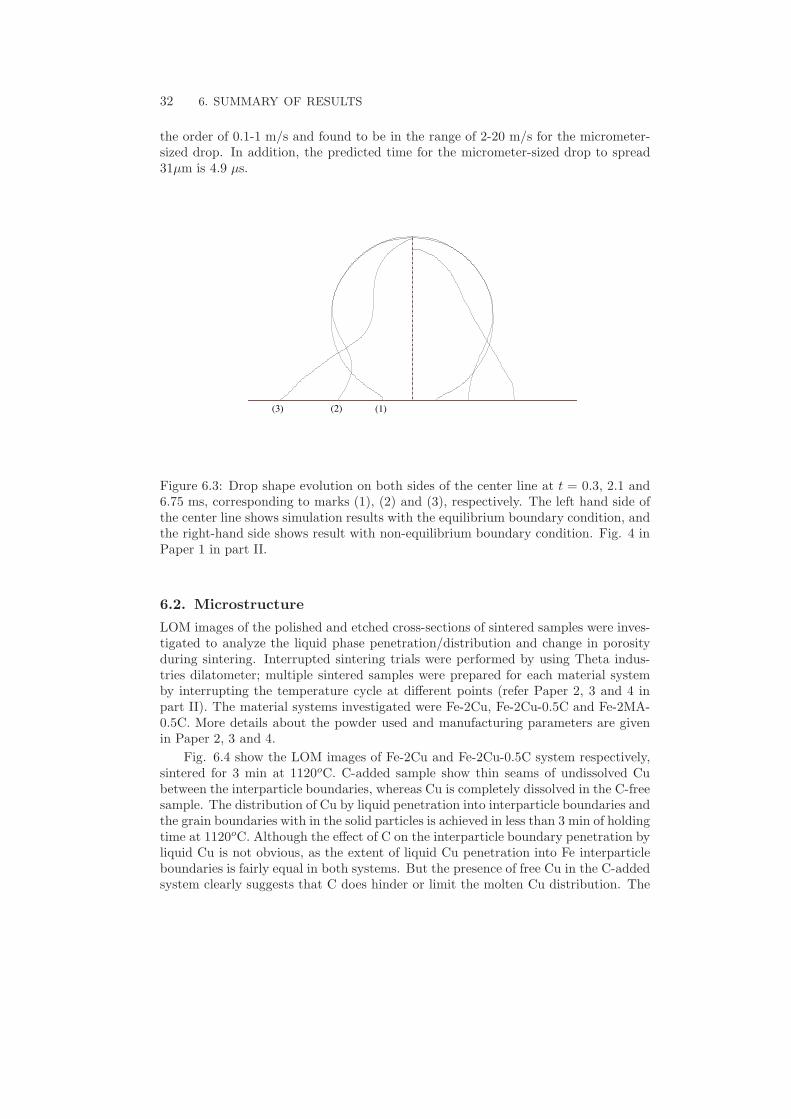
the order of 0.1-1 m/s and found to be in the range of 2-20 m/s for the micrometer-sized drop. In addition, the predicted time for the micrometer-sized drop to spread31µm is 4.9 µs.
(3) (2) (1)
Figure 6.3: Drop shape evolution on both sides of the center line at t = 0.3, 2.1 and6.75 ms, corresponding to marks (1), (2) and (3), respectively. The left hand side ofthe center line shows simulation results with the equilibrium boundary condition, andthe right-hand side shows result with non-equilibrium boundary condition. Fig. 4 inPaper 1 in part II.
6.2. Microstructure
LOM images of the polished and etched cross-sections of sintered samples were inves-tigated to analyze the liquid phase penetration/distribution and change in porosityduring sintering. Interrupted sintering trials were performed by using Theta indus-tries dilatometer; multiple sintered samples were prepared for each material systemby interrupting the temperature cycle at di!erent points (refer Paper 2, 3 and 4 inpart II). The material systems investigated were Fe-2Cu, Fe-2Cu-0.5C and Fe-2MA-0.5C. More details about the powder used and manufacturing parameters are givenin Paper 2, 3 and 4.
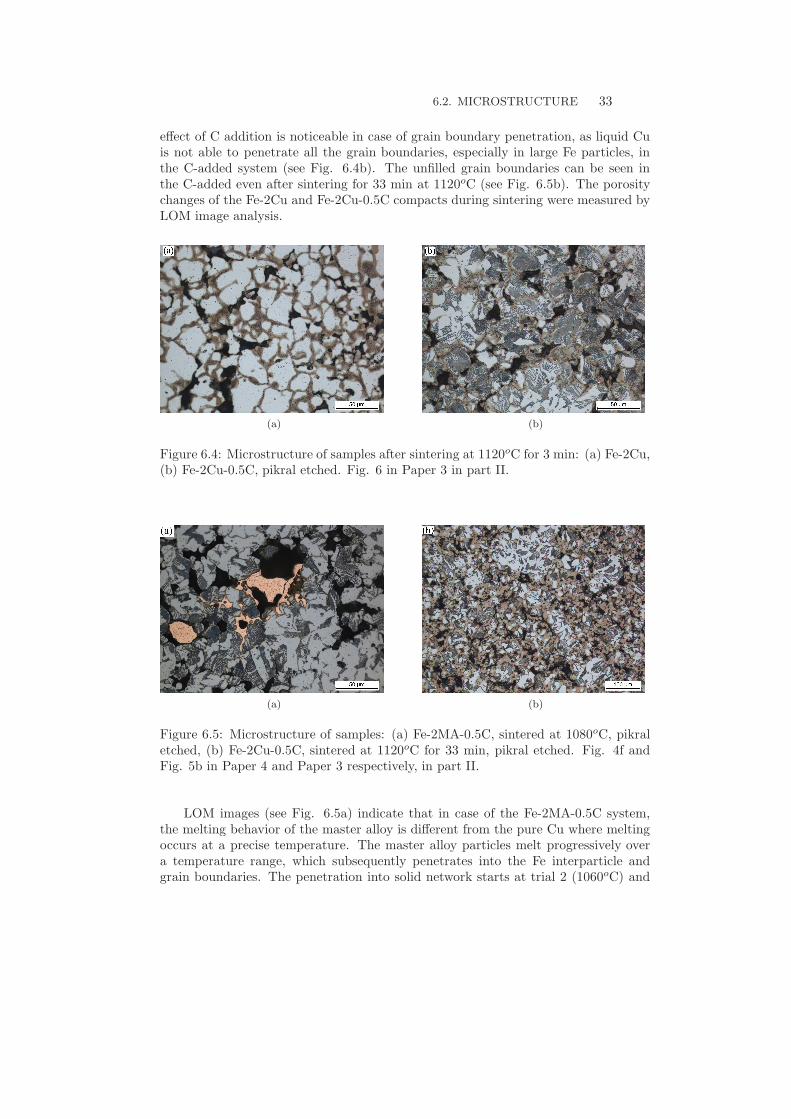
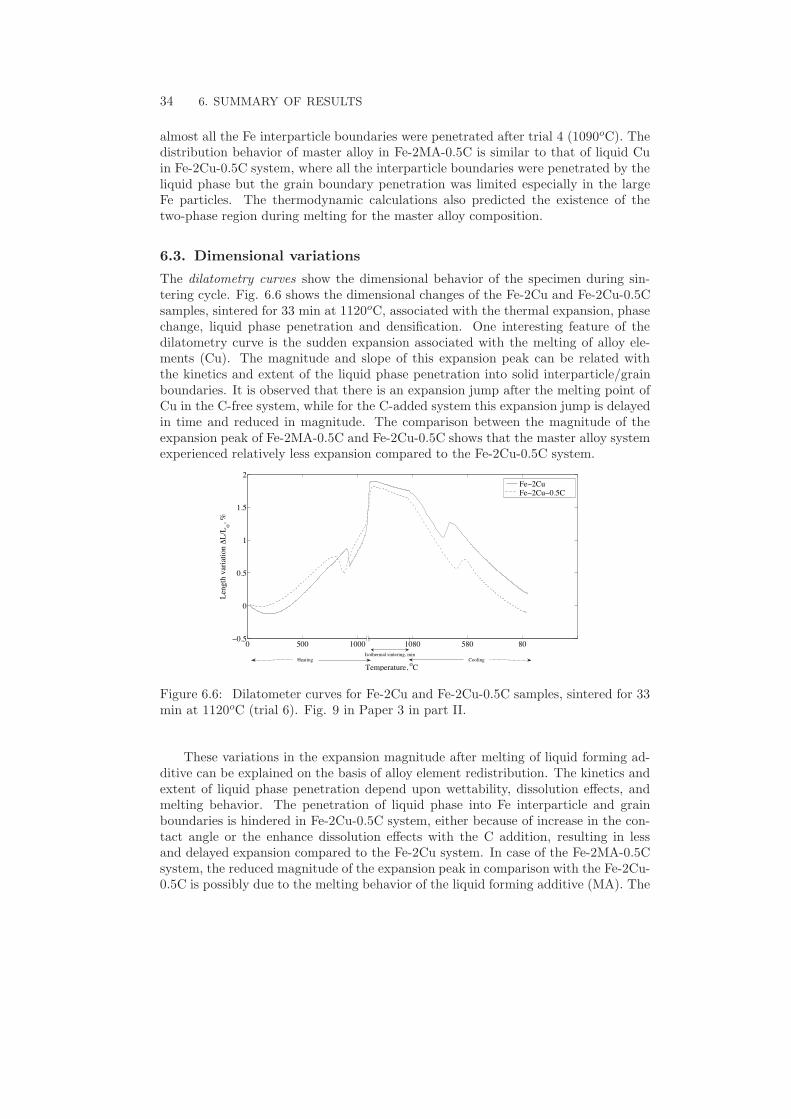
Fig. 6.4 show the LOM images of Fe-2Cu and Fe-2Cu-0.5C system respectively,sintered for 3 min at 1120oC. C-added sample show thin seams of undissolved Cubetween the interparticle boundaries, whereas Cu is completely dissolved in the C-freesample. The distribution of Cu by liquid penetration into interparticle boundaries andthe grain boundaries with in the solid particles is achieved in less than 3 min of holdingtime at 1120oC. Although the e!ect of C on the interparticle boundary penetration byliquid Cu is not obvious, as the extent of liquid Cu penetration into Fe interparticleboundaries is fairly equal in both systems. But the presence of free Cu in the C-addedsystem clearly suggests that C does hinder or limit the molten Cu distribution. The
6.2. MICROSTRUCTURE 33
e!ect of C addition is noticeable in case of grain boundary penetration, as liquid Cuis not able to penetrate all the grain boundaries, especially in large Fe particles, inthe C-added system (see Fig. 6.4b). The unfilled grain boundaries can be seen inthe C-added even after sintering for 33 min at 1120oC (see Fig. 6.5b). The porositychanges of the Fe-2Cu and Fe-2Cu-0.5C compacts during sintering were measured byLOM image analysis.
(a) (b)
Figure 6.4: Microstructure of samples after sintering at 1120oC for 3 min: (a) Fe-2Cu,(b) Fe-2Cu-0.5C, pikral etched. Fig. 6 in Paper 3 in part II.
(a) (b)
Figure 6.5: Microstructure of samples: (a) Fe-2MA-0.5C, sintered at 1080oC, pikraletched, (b) Fe-2Cu-0.5C, sintered at 1120oC for 33 min, pikral etched. Fig. 4f andFig. 5b in Paper 4 and Paper 3 respectively, in part II.
LOM images (see Fig. 6.5a) indicate that in case of the Fe-2MA-0.5C system,the melting behavior of the master alloy is di!erent from the pure Cu where meltingoccurs at a precise temperature. The master alloy particles melt progressively overa temperature range, which subsequently penetrates into the Fe interparticle andgrain boundaries. The penetration into solid network starts at trial 2 (1060oC) and
34 6. SUMMARY OF RESULTS
almost all the Fe interparticle boundaries were penetrated after trial 4 (1090oC). Thedistribution behavior of master alloy in Fe-2MA-0.5C is similar to that of liquid Cuin Fe-2Cu-0.5C system, where all the interparticle boundaries were penetrated by theliquid phase but the grain boundary penetration was limited especially in the largeFe particles. The thermodynamic calculations also predicted the existence of thetwo-phase region during melting for the master alloy composition.
6.3. Dimensional variations
The dilatometry curves show the dimensional behavior of the specimen during sin-tering cycle. Fig. 6.6 shows the dimensional changes of the Fe-2Cu and Fe-2Cu-0.5Csamples, sintered for 33 min at 1120oC, associated with the thermal expansion, phasechange, liquid phase penetration and densification. One interesting feature of thedilatometry curve is the sudden expansion associated with the melting of alloy ele-ments (Cu). The magnitude and slope of this expansion peak can be related withthe kinetics and extent of the liquid phase penetration into solid interparticle/grainboundaries. It is observed that there is an expansion jump after the melting point ofCu in the C-free system, while for the C-added system this expansion jump is delayedin time and reduced in magnitude. The comparison between the magnitude of theexpansion peak of Fe-2MA-0.5C and Fe-2Cu-0.5C shows that the master alloy systemexperienced relatively less expansion compared to the Fe-2Cu-0.5C system.
0 500 1000 1080 580 80!0.5
0
0.5
1
1.5
2
Temperature, oC
Leng
th v
aria
tion !
L/L o, %
Heating Cooling
Fe!2Cu Fe!2Cu!0.5C
Isothermal sintering, min
Figure 6.6: Dilatometer curves for Fe-2Cu and Fe-2Cu-0.5C samples, sintered for 33min at 1120oC (trial 6). Fig. 9 in Paper 3 in part II.
These variations in the expansion magnitude after melting of liquid forming ad-ditive can be explained on the basis of alloy element redistribution. The kinetics andextent of liquid phase penetration depend upon wettability, dissolution e!ects, andmelting behavior. The penetration of liquid phase into Fe interparticle and grainboundaries is hindered in Fe-2Cu-0.5C system, either because of increase in the con-tact angle or the enhance dissolution e!ects with the C addition, resulting in lessand delayed expansion compared to the Fe-2Cu system. In case of the Fe-2MA-0.5Csystem, the reduced magnitude of the expansion peak in comparison with the Fe-2Cu-0.5C is possibly due to the melting behavior of the liquid forming additive (MA). The
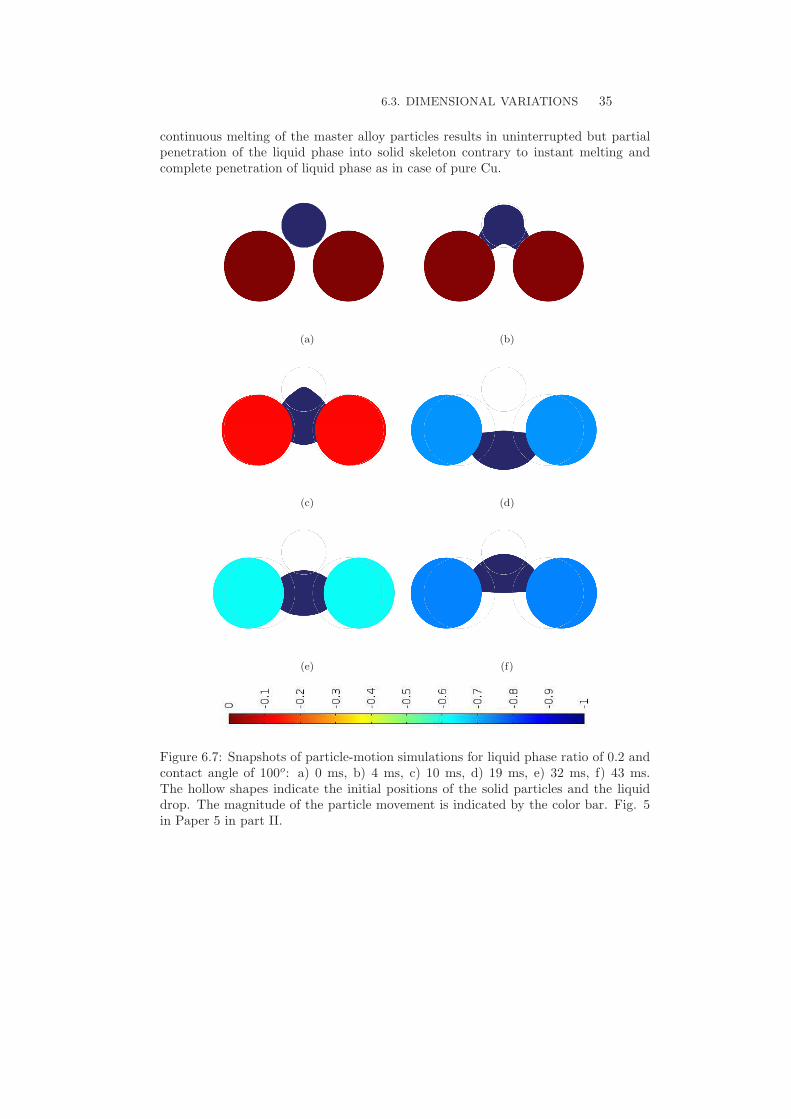
6.3. DIMENSIONAL VARIATIONS 35
continuous melting of the master alloy particles results in uninterrupted but partialpenetration of the liquid phase into solid skeleton contrary to instant melting andcomplete penetration of liquid phase as in case of pure Cu.
(a) (b)
(c) (d)
(e) (f)
Figure 6.7: Snapshots of particle-motion simulations for liquid phase ratio of 0.2 andcontact angle of 100o: a) 0 ms, b) 4 ms, c) 10 ms, d) 19 ms, e) 32 ms, f) 43 ms.The hollow shapes indicate the initial positions of the solid particles and the liquiddrop. The magnitude of the particle movement is indicated by the color bar. Fig. 5in Paper 5 in part II.
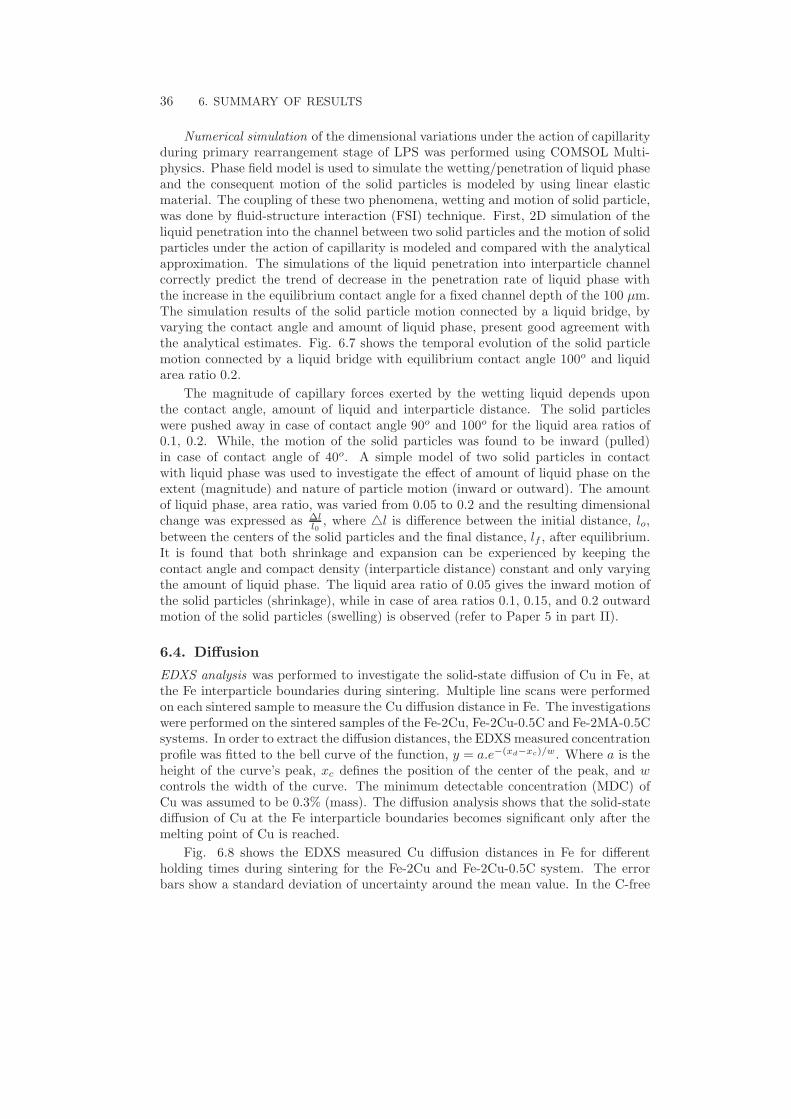
36 6. SUMMARY OF RESULTS
Numerical simulation of the dimensional variations under the action of capillarityduring primary rearrangement stage of LPS was performed using COMSOL Multi-physics. Phase field model is used to simulate the wetting/penetration of liquid phaseand the consequent motion of the solid particles is modeled by using linear elasticmaterial. The coupling of these two phenomena, wetting and motion of solid particle,was done by fluid-structure interaction (FSI) technique. First, 2D simulation of theliquid penetration into the channel between two solid particles and the motion of solidparticles under the action of capillarity is modeled and compared with the analyticalapproximation. The simulations of the liquid penetration into interparticle channelcorrectly predict the trend of decrease in the penetration rate of liquid phase withthe increase in the equilibrium contact angle for a fixed channel depth of the 100 µm.The simulation results of the solid particle motion connected by a liquid bridge, byvarying the contact angle and amount of liquid phase, present good agreement withthe analytical estimates. Fig. 6.7 shows the temporal evolution of the solid particlemotion connected by a liquid bridge with equilibrium contact angle 100o and liquidarea ratio 0.2.
The magnitude of capillary forces exerted by the wetting liquid depends uponthe contact angle, amount of liquid and interparticle distance. The solid particleswere pushed away in case of contact angle 90o and 100o for the liquid area ratios of0.1, 0.2. While, the motion of the solid particles was found to be inward (pulled)in case of contact angle of 40o. A simple model of two solid particles in contactwith liquid phase was used to investigate the e!ect of amount of liquid phase on theextent (magnitude) and nature of particle motion (inward or outward). The amountof liquid phase, area ratio, was varied from 0.05 to 0.2 and the resulting dimensionalchange was expressed as "l
l0, where 'l is di!erence between the initial distance, lo,
between the centers of the solid particles and the final distance, lf , after equilibrium.It is found that both shrinkage and expansion can be experienced by keeping thecontact angle and compact density (interparticle distance) constant and only varyingthe amount of liquid phase. The liquid area ratio of 0.05 gives the inward motion ofthe solid particles (shrinkage), while in case of area ratios 0.1, 0.15, and 0.2 outwardmotion of the solid particles (swelling) is observed (refer to Paper 5 in part II).
6.4. Di!usion
EDXS analysis was performed to investigate the solid-state di!usion of Cu in Fe, atthe Fe interparticle boundaries during sintering. Multiple line scans were performedon each sintered sample to measure the Cu di!usion distance in Fe. The investigationswere performed on the sintered samples of the Fe-2Cu, Fe-2Cu-0.5C and Fe-2MA-0.5Csystems. In order to extract the di!usion distances, the EDXS measured concentrationprofile was fitted to the bell curve of the function, y = a.e#(xd#xc)/w. Where a is theheight of the curve’s peak, xc defines the position of the center of the peak, and wcontrols the width of the curve. The minimum detectable concentration (MDC) ofCu was assumed to be 0.3% (mass). The di!usion analysis shows that the solid-statedi!usion of Cu at the Fe interparticle boundaries becomes significant only after themelting point of Cu is reached.
Fig. 6.8 shows the EDXS measured Cu di!usion distances in Fe for di!erentholding times during sintering for the Fe-2Cu and Fe-2Cu-0.5C system. The errorbars show a standard deviation of uncertainty around the mean value. In the C-free
6.4. DIFFUSION 37
system, 65 % of the final (33 min at 1120oC) mean Cu di!usion distance is achievedwithin 3 min of holding time at 1120oC, compared to the 40 % of the total mean Cudi!usion distance in C-added system. The mean Cu di!usion distance in Fe for trial3 (3 min at 1120oC) is 3.7 µm and 2.4 µm for C-free and -added system respectively.And the final mean Cu di!usion distances in Fe for trial 6 (33 min at 1120oC) are,almost the same, 5.9 and 6.1 µm for C-free and C-added system respectively. Thehindered penetration of the liquid Cu in C-added system delays the availability ofmolten Cu, which results in lower initial di!usion distances compared to the C-addedsystem, but the pockets of free Cu maintain the supply of Cu and hence the finaldi!usion distances in both systems are similar. In case of Fe-2MA-0.5C system, Cudi!usion distances in Fe lies in the same range after 34 min of sintering at 1120oC asfound in Fe-2Cu-0.5C system. This indicates that the homogenization level of Cu inmaster alloy system is approximately the same but with reduced expansion peak.
0 3 13 23 33
1
2
3
4
5
6
7
8
Isothermal sintering time at 1120oC, min
Cu
diff
usio
n di
stan
ce, µ
m
Fe!2CuFe!2Cu!0.5CDictra (Fe!2Cu)Dictra (Fe!2Cu!0.5C)
Figure 6.8: Cu di!usion distances in Fe for Fe-2Cu and Fe-2Cu-0.5C systems forholding times of 3, 13, 23, 33 min at 1120oC. The lines with x-marks show the EDXSmeasured results. The lines with circles show the DICTRA results. Fig. 12 in Paper3 in part II.
DICTRA simulations were performed to predict the di!usion distances of Cu inFe and how it is a!ected by C addition. The predicted di!usion distances for Fe-2Cuand Fe-2Cu-0.5C systems were obtained and plotted as shown in Fig. 6.8. DICTRAsimulations show that the di!usion distances of Cu in Fe and Fe-0.5C are equal, whichmeans that the di!usion of Cu in Fe remains una!ected by the C addition. Overall, thepredicted di!usion distances match very well with the experimental findings. Theseresults further validate the argument that the lower Cu di!usion distance measured byEDXS in C-added system at trial 3 is the result of hindered Fe interparticle boundarypenetration by liquid Cu, which in turn delays the availability of liquid Cu for solid-state di!usion of Cu in Fe.
CHAPTER 7
Conclusions and outlook
An axisymmetric model based on the phase field theory is used to simulate the dy-namic wetting of millimeter- and micrometer-sized metallic (Cu) drops. The con-tribution of energy dissipation because of the contact line friction is introduced toaccurately match the experimental results. We predicted the wetting kinetics of themicrometer-sized drop and simulations show that, qualitatively many features of thedynamic wetting of a micrometer-sized metal drop are similar to that of a millimeter-sized drop. A numerical approach is presented to study the primary rearrangementphase of LPS. The simulations predicted the processes such as, wetting/penetrationkinetics of liquid phase and motion of solid particles under the action of capillaryforce, using realistic physical properties, and a qualitative match between the simu-lation results and the analytical estimates is found.
The quantitative analysis of kinetics of the Cu redistribution showed that theliquid penetration into Fe interparticle/grain boundaries is achieved in less than 3min of holding time at 1120oC. The C-added systems (Fe-2Cu-0.5C and Fe-2MA-0.5C) show hindered/delayed penetration of the liquid phase in the solid matrix,which results in relatively lower di!usion distances of Cu in Fe. For longer sinteringtime, the Cu di!usion in Fe was almost similar for all test systems. The master alloysystem show least magnitude of expansion peak and we proposed that the melting ofliquid forming master alloy particles over a temperature range could be the possiblereason.
We observed that modeling the wetting/penetration and consequent particle mo-tion with the phase field method can be a powerful and practical approach. Thiswork successfully model many important processes such as wetting, liquid phase pen-etration, di!usion, and particle rearrangement during LPS and could be extended forfurther studies. For instance, modeling the secondary rearrangement stage involvingdissolutions, fragmentation and clustering etc. The reactive modeling using realisticphysical properties is another exciting and feasible future work. In addition, modelingthe rearrangement phase of LPS with realistic geometries (irregular) of the powderparticles would be helpful to develop a detailed numerical model. It has been ob-served that C addition and the melting of the liquid forming phase over a range oftemperature slows down the penetration kinetics and consequently reduces the magni-tude of volumetric expansion. It would be interesting to further investigate the e!ectof these parameter by quantifying their individual contribution for the reduction inpenetration kinetics and so the volumetric expansion. The combination of experimen-tal techniques (like EDXS) and numerical tools (DICTRA or phase field) could bepotentially used for studying the di!usion of the alloying elements in more complexmaterial systems.
38


Acknowledgment
First and foremost, I am very grateful to THE Almighty Allah for HIS blessings.
I would like to express my sincere gratitude to my supervisor Prof. Gustav Am-berg for the continuous support of my PhD study, for his patience, enthusiasm, moti-vation, and immense knowledge. His ability to explain complex problems in a simpleway and always being intuitive, yet rational in approach for making the things workinspired me in all the time of research and writing of this thesis.
I would like to express my gratitude to Dr. Minh Do-Quang for his tremen-dous guidance and support in numerical modeling. I am truly grateful to Dr. PeterHedstrom for his support in experimental investigations, discussion of results anddedication in meticulously examining the manuscripts and thesis. My special thanksto Prof. John Agren, Prof. Annika Borgenstam, Asst. Prof. Joakim Odqvist formany fruitful discussions and valuable feedback.
The support of Hero-m, financed by VINNOVA, Swedish industry, and KTHRoyal Institute of Technology is gratefully acknowledged. My sincere thanks to OlaBergman (Hoganas AB) and Karin Frisk (Swerea KIMAB AB) for many valuablediscussions, sharing their industrial experience and giving important feedback duringthe project. I would like to thank Heike Grosser (Hoganas AB) for her support inmetallography. I also want to thank Dimitris Chasoglou (Swerea KIMAB AB) forperforming sintering trials and giving feedback on the manuscript.
I would like to thank the sta!, colleagues, and friends at the department ofmechanics for their support and providing friendly environment. Many thanks toTimea, Daniel, Zeinab, Dr. Jiewei, Carolina, Heide, Par Ekstrand, and in particularto Dr. Amer Malik for helping me to reach the finish line.
Finally, a special thank to my parents for their prayers and support throughoutmy life. I also want to deeply thank my beloved wife, Alia, who always prayed for mysuccess and for her endless support during this work. Last but not least, I extend mysweet love to my wonderful children, Rohaan and Mahad. Their ”cute support” formaking sure that I should not work after coming back home is happily acknowledged.
41

Bibliography
Adamson, A. W.: Physical chemistry of surfaces, 5th edn. 1990, New York, John Wiley &Sons, Inc.
Ambrose, J. C.: Ph.D. thesis, Imperial College of Science, Technology and Medicine, 1992.
Angers, R. and Trudel, Y.: Modern development in powder metallurgy, Vol. 6. 1974, Prince-ton, NJ, MPIF.
Ambrose, J. C., Nicholas, M. G. and Stoneham, A. M.: Acta. Metall. Mater., 1992, 40, 2483.Aksay, I. A.: J. Phys. Chem-US, 1974, 78, 1178.
Ambrose, J. C., Nicholas, M. G. and Stoneham A. M.: Acta Metall. Mater., 1993, 41, (8),2395.
Anestiev, L. A. and Froyen, L.: J. Appl. Phys., 1999, 155, 96.
Bauer, W. and Huppmann, W. J.: Powder Metall., 1975, 8, 249.
Berner, D., Exner, H. E. and Petzow, G.: Modern development in powder metallurgy, Vol. 6.1974, 237.
Bocksteigel, G.: Stahl Eisen, 1959, 79, 1187.Bocksteigel, G.: Metallurgie III, 1962, 4, 65.
Blake, T. D.: Wettability, Dekker, New York, 1993.
Bonn, D., Eggers, J., Indekeu, J., Menunier, J. and Rolley E.: Rev. Mod. Phys., 2009, 81,739.
Blake, T. D. and Coninck, J. D.: Adv. Colloid. Interfac, 2002, 96, 21.
Blake, T. D. and Haynes, J.: J. Colloid Interface Sci., 1969, 30, 421.Badalassi, V. E., Ceniceros, H. D. and Banerjee, S.: J. Comp. Phys., 2003, 190, 371.
Boettinger, W. J., Warren, J. A., Beckermann, C. and Karma, A.: Ann. Rev. Mater. Res.,2002, 32, 163.
Barrett, J. W. and Blowey, J. F.: Numer. Math., 1995, 72, 1.
Barrett, J. W. and Blowey, J. F.: Math. Comp., 1999, 68, 487.
Becker, R. and Rannacher, R.: Acta. Numerica., 2001, 10, 1.Cahn, J. W.: Acta Metallurgica, 1961, 9, 795.
Carlson, A., Do-Quang, M. and Amberg G.: Phys. Fluids, 2009, 21, 121701.
Carlson, A., Bellani, G. and Amberg G.: EPL, 2012, 97, 44004.
Carlson, A., Do-Quang, M. and Amberg G.: Int. J. Multiphase Flow, 2010, 36, 397.Coninck, J. D., D’Ortona, U., Koplik, J. and Banavar, J. R.: Phys. Rev. Lett., 1995, 74, 928.
Cherry, B. and Holmes, C.: J. Colloid Interface Sci., 1969, 29, 174.
Danninger, H.: Powder Metall. Int., 1992, 24, 163.Danninger, H. and Zengin, O. Z.: Modern development in powder metallurgy, Vol. 21. 1988,
171.Danninger, H.: Powder Metall. Int., 1988, 20, 7.
43
44 BIBLIOGRAPHY
Danninger, H. and Kara, T.: Powder Metall. Int., 1988, 20, 9.
Danninger, H.: Powder Metall. Int., 1992, 24, (2).
de Gennes, P. G.: Rev. Mod. Phys., 1985, 57, 827.
Dezellus, O. and Eustathopoulos, N.: J. Mater. Sci., 2010, 45, 4256.
Dorweiler, H. J. and Dautzenberg, N.: Powder Metall. Int., 1985, 17, 279.
Durdaller, D.: Hoganas technical bulletin 174D, 1971, 471.
Do-Quang, M. and Amberg, G.: Int. J. Multiphase Flow, 2009, 80, 1664.
Debnath, L. and Mikusinski, P.: Introduction to Hilbert spaces with applications, 2nd edn.,1999.
Davies, T. J. and Lawcock, R. L.: Powder Metall., 1990, 33, 147.
Eremenko, V. N., Naidich, Y. V. and Lavrinenko, I. A.: Liquid Phase Sintering, ConsultantBureau, New York, 1970.
Elliot, J. E.: Metallurgie, 1959, 59, 17.
Evdokimov, V. A., Naidich, Y. V. and Lavrinenko, I. A.: Soviet Powder Met. Metal Ceram., 1972. 11, 715.
Eustathopoulos, N., Nicholas, M. G. and Drevet, B.: Wettability at High Temperatures,Pergamon, Amsterdam, 1999.
Eustathopoulos, N.: Curr. Opin. Solid St. M., 2005, 9, 152.
Elliott, C. M. and Larsson, S.: Math. Comp., 1992, 58, 603.
Eriksson, K., Estep, D., Hansbo, P. and Johnson, C.: Acta Numerica., 1995, 105.
Eriksson, K., Estep, D., Hansbo, P. and Johnson, C.: Computational Di!erential Equations,Student literature, Lund, Sweden, 1996.
Froschauer, L. and Fulrath, R. M.: J. Mater. Sci., 1976, 11, 142.
Froschauer, L. and Fulrath, R. M.: J. Mater. Sci., 1975, 10, 2146.
Fan, C. F. and Cagin, T.: J. Chem. Phys., 1995, 103, 9053.
Findeisen, G.: Metall., 1960, 14, 295.
German, R. M.: Powder Metallurgy Science, Second Edition, Metal Powder Industries Fed-eration, 1994.
German, R. M.: Powder Metallurgy & Particulate Materials Processing, Metal Powder In-dustries Federation, 2005.
German, R. M.: Liquid Phase Sintering, Plenum Press, New York, 1985
German, R. M., Zovas, C. Li, P. and Hwang, K. S.: Progress in powder metallurgy, Vol. 38,1982, Princeton, NJ, MPIF.
Garcke H., Rumpf, M. and Weikard, U.: Interfaces and Free Boundaries, 2001, 3, 101.
Guermond, J. L. and Quartapelle, L.: Int. J. Numer. Methods Fluids, 1998, 26, 1039.
Hoganas Handbook for Sintered Components - 1. Materials and powder properties, HoganasAB, 1997.
Huppmann, W. J.: Z. Metallkd, 1979, 70, 707.
Huppmann, W. J. and Petzow, G.: Z. Metallkd, 1976, 67, 579.
Huppmann, W. J.: Z. Metallkd, 1979, 70, 792.
Ho!man, R.: J. Colloid and Interface Science, 1975, 50, 228.
Heady, R. B. and Cahn, J. W.: Metallurgical Trans., 1970, 1, 185.
Huppmann, W. J. and Riegger, H.: Acta Metallurgica, 1975, 23, 965.
Hoganas Handbook for Sintered Components - 6. Metallography, Hoganas AB, 2007.
Hirt, C. W. and Nichols, B. D.: J. Comp. Phys., 1981, 39, 201.
Huh, C.and Scriven, L. E.: J. Colloid Interface Sci., 1971, 35, 85.
Hoglund, L., Shi, P. F., Sundman, B., Andersson, J. O. and Helander, T.: Calphad, 2002,26, 273.
BIBLIOGRAPHY 45
Hansbo, P. and Szepessy, A.: Comput. Meth. Appl. Mech. and Eng., 1990, 84, 175.
Huh, C. and Scriven, L. E.: J. Colloid Interface Sci., 1971, 35, 85.
James, B. A.: Powder Metall., 1985, 28, 121.
Jin, W., Koplik, J. and Banavar, J. R.: Phys. Rev. Lett., 1997, 78, 1520.
Jamil, S. J. and Chadwick, G. A.: Powder Metall., 1985, 28, 65.
Kingrey, W. D.: J. Appl. Phys., 1959, 30, 301.
Kozlova, O., Voytovych, R., Protsenko, P. and Eustathopoulos, N.: J. Mater. sci., 2010, 45,(8), 2099.
Kozlova, O., Voytovych, R., Protsenko, P. and Eustathopoulos, N.: J. Mater. sci., 2008, 43,(16), 5669.
Kim, J., Kang, K. and Lowengrub, J.: J. Comput. Phys., 2004, 193, 511.
Krantz, T.: Int. J. Powder Metall., 1969, 5, 35.
Lenel, F. V.: Trans AIME, 1948, 175, 878.
Lenel, F. V. and Cannon, H. S.: In Proc. Metallwerk Plansee, Reutte, Austria, 1953, 106.
Leger, L. and Joanny, J. F.: Rep. Prog. Phys., 2011, 431.
Lesnik, N., Pestun, T. and Eremenko, V.: Poroshkovaya Metall., 1971, 94, (83), 849.
Lesage, A-C., Allain, O. and Dervieux, A.: Int. J. Num. Meth. Fluids, 2007, 53, 1297.
Loginova, I., Agren, J. and Amberg, G.: Acta Mater., 2003, 51, 1327.
Larsson, S. and Thomee V.: Partial di!erential equations with numerical methods, SpringerNew York, Inc., 2003.
Metal Powder Industries Federation (MPIF), www.mpif.org, 2014.
Moon, J. R.: Powder Metall. Int., 1971, 4, 194.
Mukherjee, A. and Kandlikar, S. G.: Int. J. Heat Mass Transfer, 2007, 50, 127.
Naidich, Y. V., Perevertailo, V. M. and Nevodnik, G. M.: Zavod Lab., 1976, 1, 39.
Naidich, Y. V., Perevertailo, V. M. and Nevodnik, G. M.: Porosh-kovaya Metallurgiya, 1972,7, 51.
Oro, R., Bernardo, E., Campos, M. and Torralba, J.: In Proc. EuroPM2011, Barcelona,Spain, October 2011, EPMA, Vol. 1, 57-62.
Oro, R., Campos, M. and Torralba, J.: Powder Metall., 2012, 55, 180.
Probstein, R. F.: Physicochemical Hydrodynamics: An Introduction, 2nd edn. 2003, JohnWiley & Sons, Inc.
Petzow, G., Kaysser, W. A. and Huppmann, W. J.: Powder Metall., 1980, 2.
Price, G. H. S., Smithells, C. J. and Williams, S. V.: J. Inst. Met., 1938, 62, 239.
Pelzel, E.: Metall., 1955, 2, 565.
Pejovnik, S., Kolar D., Huppmann, W. J. and Petzow, G.: In Sintering - New Developments, Amsterdam, Netherlands, 1979, 106.
Saad, Y.: Iterative methods for Sparse Linear Systems, Boston, MA: PWS Publishing Com-pany,1996.
Schwartzkopf, P. and Kie!er, R.: Cemented Carbides, MacMillan, New York, NY, 1960.
Saiz, E., Tomsia, A. P., Rauch, N., Scheu, C., Ruehle, M. and Benhassine, M.: Phys. Rev.E, 2007, 76, 041602.
Saiz, E., Cannon, R. M. and Tomsia, A. P.: Acta. Mater., 2000, 48, 4449.
Saiz, E., Benhassine, M., Coninck, J. D. and Tomsia, A.: Scr. Mater., 2010, 62, 934.
Saiz, E. and Tomsia, A. P.: Nat. Mater., 2004, 3, (12), 903.
Seppecher, P.: Int. J. Eng. Sci., 1996, 34, 977.
Singh, P. and Joseph, D. D.: J. Fluid Mech., 2005, 530, 31.
Son, G. and Hur, N.: Num. Heat Transfer, Part B, 2007, 48, 303.
Sussman, M., Smereka, P. and Osher, S.: J. Comp. Phys., 1994, 114, 146.
Tahir, A. M., Amberg, G., Hedstrom, P., Bergman, O. and Frisk, K.: In Proc. EuroPM2013,Goteborg, Sweden, September 2013, EPMA, Vol. 2.
Tahir, A. M., Amberg, G. and Do-Quang, M.: Acta Mater, 2013, 61, 5375.Thermo-Calc Software TCFE6 Steels/Fe-alloys database. http://www.thermocalc.com (Ac-
cessed 20 Feb 2013).Tendolkar, G. S. and Sebastian, K. V.: Powder Metall. Int., 1979, 11, 62.
Unverdi, S. O. and Tryggvason, G.: J. Comp. Phys., 1992, 100, 25.
Villanueva, W. and Amberg, G.: Int. J. Multiphase Flow, 2006, 32, 1072.
Villanueva, W., Gronhagen, K., Amberg, G. and Agren, J.: Phys. Rev. E, 2008, 77, 056313.
Villanueva, W., Gronhagen, K., Amberg, G. and Agren, J.: Comp. Mater. Sci., 2009, 47,512.
Warren, R.: Int. J. Powder Metall., 1977, 3, 249.
Yoon, D. N., Petzow, G., Kaysser, W. A. and Huppmann, W. J.: Powder Metall. Int., 1979,11, 50.
Yost, F. G.: Scr. Mater., 1998, 38, 1225.Yang, J., Koplik, J. and Banavar, J. R.: Acta Mater., 1991, 67, 3539.
Young, T.: Philos. Trans. Soc. London, 1805, 95, 65.
Yue, P., Zhou, C. and Feng, J. J.: J. Fluid Mech., 2010, 645, 279.Zisman, W. A.: In Advances in Chemistry Series 43, Washington, D.C., New York, 1964.