NERSC Science Highlights A selection of science results produced by NERSC users

Allocations and UsageNERSC Users Group Annual Meeting 2019
July 19, 2019
Richard GerberNERSC Senior Science AdvisorHigh Performance Computing Department Head
1
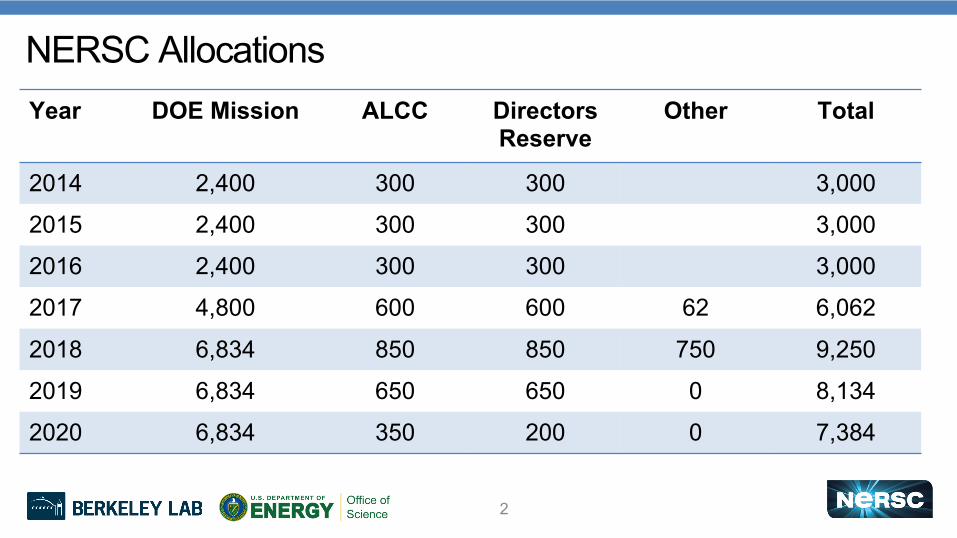
NERSC Allocations
2
Year DOE Mission ALCC Directors Reserve
Other Total
2014 2,400 300 300 3,000
2015 2,400 300 300 3,000
2016 2,400 300 300 3,000
2017 4,800 600 600 62 6,062
2018 6,834 850 850 750 9,250
2019 6,834 650 650 0 8,134
2020 6,834 350 200 0 7,384

Office Allocations
3
Biosciences – 195 M, 2.9%Climate/Env – 845 M, 12.4%
Chem/Geo/Bio – 1,287 M, 18.8%MatSci – 1,099 M, 16.6%UserFac – 232 M, 3.2%
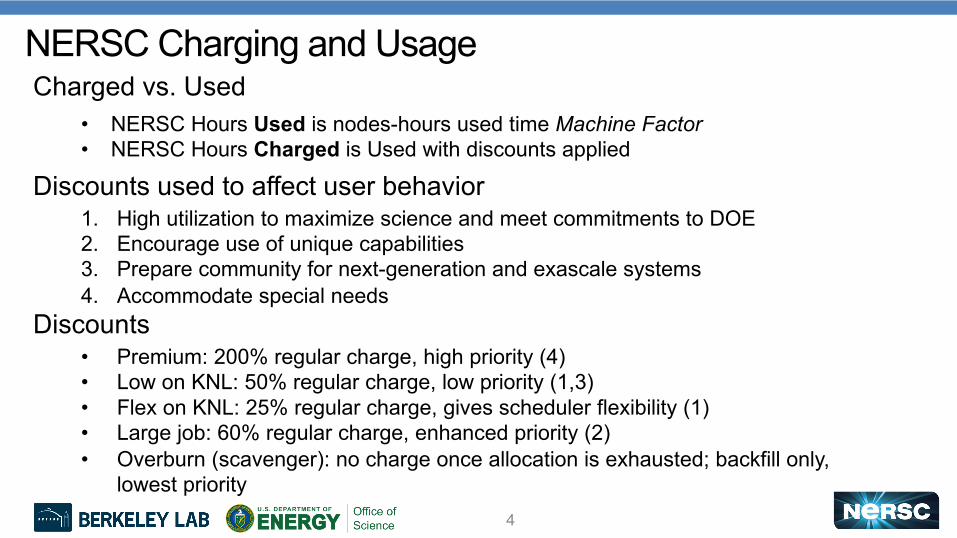
NERSC Charging and Usage
4
Charged vs. Used
• NERSC Hours Used is nodes-hours used time Machine Factor• NERSC Hours Charged is Used with discounts applied
Discounts used to affect user behavior
1. High utilization to maximize science and meet commitments to DOE
2. Encourage use of unique capabilities
3. Prepare community for next-generation and exascale systems
4. Accommodate special needs
Discounts
• Premium: 200% regular charge, high priority (4)
• Low on KNL: 50% regular charge, low priority (1,3)
• Flex on KNL: 25% regular charge, gives scheduler flexibility (1)
• Large job: 60% regular charge, enhanced priority (2)
• Overburn (scavenger): no charge once allocation is exhausted; backfill only,
lowest priority
NUG
NERSC Users Group

Hours Used Relative to Target Pace
5
NERSC is delivering a lot of hours to science.

Hours Charged Relative to Target Pace
6
• Charging is right on pace• This is good: need enough remaining allocation to keep machine
busy, but not so much that regular QOS wait times are long at end of year
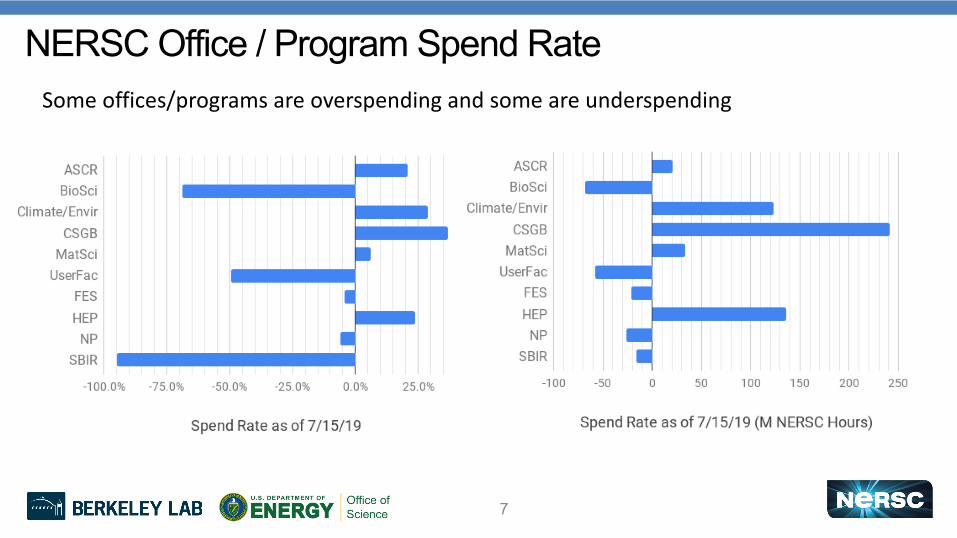
NERSC Office / Program Spend Rate
7
Some offices/programs are overspending and some are underspending

Summary
8
• NERSC is ahead of target for hours delivered to science
• Different communities are using time at different paces
• We will continue to tweak queues and charge factors to
• Increase utilization
• Minimize queue wait times
• If you have been using one architecture or another, we’ll
work with you to try to find a run strategy that maximizes
your throughput and is cost effective
• e.g., DUNE
NUG