Allianz Rohstofffonds Allianz Informationstechnologie Allianz …internetfileserver.phillip.com.sg...
148
Annual Report 31 December 2015 Allianz Rohstofffonds Allianz Informationstechnologie Allianz Europazins Allianz Telemedia Industria Allianz Global Investors GmbH
Transcript of Allianz Rohstofffonds Allianz Informationstechnologie Allianz …internetfileserver.phillip.com.sg...

Annual Report 31 December 2015
Allianz RohstofffondsAllianz Informationstechnologie Allianz EuropazinsAllianz TelemediaIndustria
Allianz Global Investors GmbH

This report is a non-binding translation of the German original.
Annual Report31 December 2015
Allianz Rohstofffonds
Allianz Global Investors GmbH
This report is a non-binding translation of the German original excluding the tax information for investors resident in Germany.
Contents
Allianz Rohstofffonds
Activity report . . . . . . . . . . . . . . . . . . . . . . . . . . . . . . . . . . . . . . . . . . . . . . . . . . . . . 1
Asset overview at 31/12/2015 . . . . . . . . . . . . . . . . . . . . . . . . . . . . . . . . . . . . . . . 4
Investment portfolio at 31/12/2015 . . . . . . . . . . . . . . . . . . . . . . . . . . . . . . . . . . 6
Unit classes . . . . . . . . . . . . . . . . . . . . . . . . . . . . . . . . . . . . . . . . . . . . . . . . . . . . . . . . 14
Annex . . . . . . . . . . . . . . . . . . . . . . . . . . . . . . . . . . . . . . . . . . . . . . . . . . . . . . . . . . . . . 15
Auditor’s Report . . . . . . . . . . . . . . . . . . . . . . . . . . . . . . . . . . . . . . . . . . . . . . . . . . . . 20
Determining the market risk and leverage effect . . . . . . . . . . . . . . . . . . . . . . 21
Engagement of sub-custodians . . . . . . . . . . . . . . . . . . . . . . . . . . . . . . . . . . . . . . 22
Further information (not covered by the auditor’s certificate)
Your Partners . . . . . . . . . . . . . . . . . . . . . . . . . . . . . . . . . . . . . . . . . . . . . . . . . . . . . . 28
Information for investors in the Republic of Austria . . . . . . . . . . . . . . . . . . . . 29
1
Allianz RohstofffondsActivity report
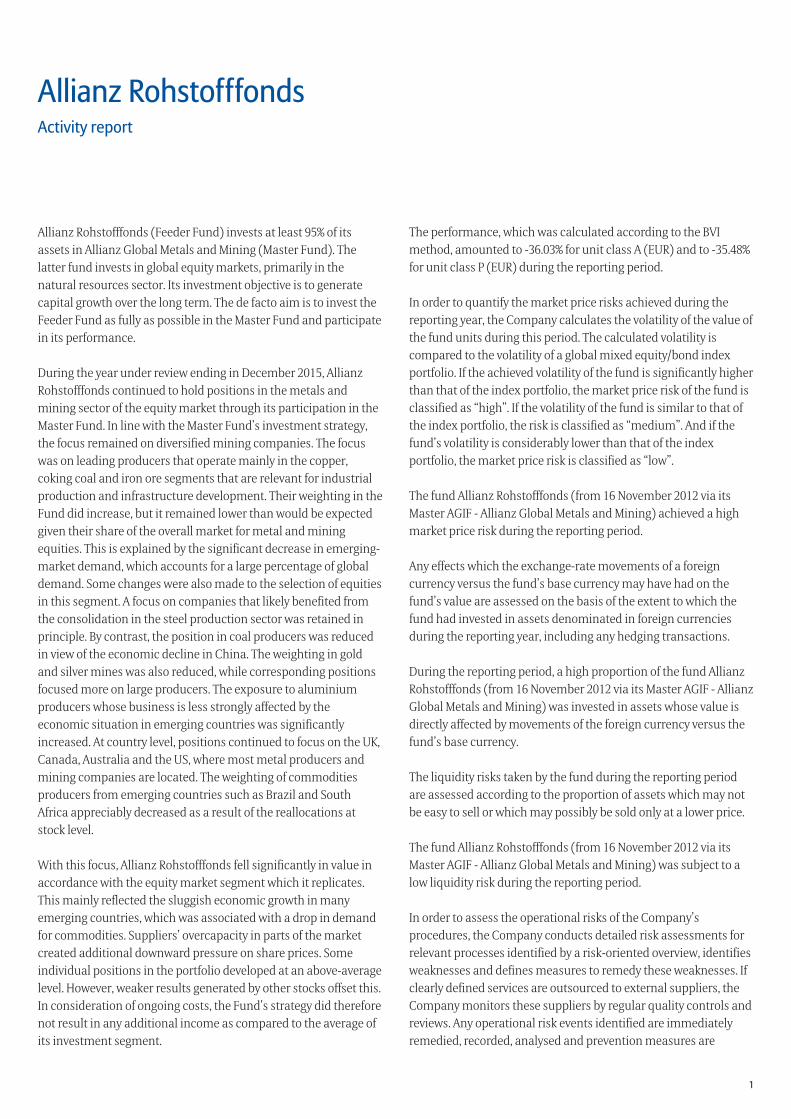
Allianz Rohstofffonds (Feeder Fund) invests at least 95% of its assets in Allianz Global Metals and Mining (Master Fund). The latter fund invests in global equity markets, primarily in the natural resources sector. Its investment objective is to generate capital growth over the long term. The de facto aim is to invest the Feeder Fund as fully as possible in the Master Fund and participate in its performance.
During the year under review ending in December 2015, Allianz Rohstofffonds continued to hold positions in the metals and mining sector of the equity market through its participation in the Master Fund. In line with the Master Fund’s investment strategy, the focus remained on diversified mining companies. The focus was on leading producers that operate mainly in the copper, coking coal and iron ore segments that are relevant for industrial production and infrastructure development. Their weighting in the Fund did increase, but it remained lower than would be expected given their share of the overall market for metal and mining equities. This is explained by the significant decrease in emerging-market demand, which accounts for a large percentage of global demand. Some changes were also made to the selection of equities in this segment. A focus on companies that likely benefited from the consolidation in the steel production sector was retained in principle. By contrast, the position in coal producers was reduced in view of the economic decline in China. The weighting in gold and silver mines was also reduced, while corresponding positions focused more on large producers. The exposure to aluminium producers whose business is less strongly affected by the economic situation in emerging countries was significantly increased. At country level, positions continued to focus on the UK, Canada, Australia and the US, where most metal producers and mining companies are located. The weighting of commodities producers from emerging countries such as Brazil and South Africa appreciably decreased as a result of the reallocations at stock level.
With this focus, Allianz Rohstofffonds fell significantly in value in accordance with the equity market segment which it replicates. This mainly reflected the sluggish economic growth in many emerging countries, which was associated with a drop in demand for commodities. Suppliers’ overcapacity in parts of the market created additional downward pressure on share prices. Some individual positions in the portfolio developed at an above-average level. However, weaker results generated by other stocks offset this. In consideration of ongoing costs, the Fund’s strategy did therefore not result in any additional income as compared to the average of its investment segment.
The performance, which was calculated according to the BVI method, amounted to -36.03% for unit class A (EUR) and to -35.48% for unit class P (EUR) during the reporting period.
In order to quantify the market price risks achieved during the reporting year, the Company calculates the volatility of the value of the fund units during this period. The calculated volatility is compared to the volatility of a global mixed equity/bond index portfolio. If the achieved volatility of the fund is significantly higher than that of the index portfolio, the market price risk of the fund is classified as “high”. If the volatility of the fund is similar to that of the index portfolio, the risk is classified as “medium”. And if the fund’s volatility is considerably lower than that of the index portfolio, the market price risk is classified as “low”.
The fund Allianz Rohstofffonds (from 16 November 2012 via its Master AGIF - Allianz Global Metals and Mining) achieved a high market price risk during the reporting period.
Any effects which the exchange-rate movements of a foreign currency versus the fund’s base currency may have had on the fund’s value are assessed on the basis of the extent to which the fund had invested in assets denominated in foreign currencies during the reporting year, including any hedging transactions.
During the reporting period, a high proportion of the fund Allianz Rohstofffonds (from 16 November 2012 via its Master AGIF - Allianz Global Metals and Mining) was invested in assets whose value is directly affected by movements of the foreign currency versus the fund’s base currency.
The liquidity risks taken by the fund during the reporting period are assessed according to the proportion of assets which may not be easy to sell or which may possibly be sold only at a lower price.
The fund Allianz Rohstofffonds (from 16 November 2012 via its Master AGIF - Allianz Global Metals and Mining) was subject to a low liquidity risk during the reporting period.
In order to assess the operational risks of the Company’s procedures, the Company conducts detailed risk assessments for relevant processes identified by a risk-oriented overview, identifies weaknesses and defines measures to remedy these weaknesses. If clearly defined services are outsourced to external suppliers, the Company monitors these suppliers by regular quality controls and reviews. Any operational risk events identified are immediately remedied, recorded, analysed and prevention measures are

2
Allianz Rohstofffonds
defined. If an operational risk event affects the fund, any relevant losses will be compensated by the Company on principle.
While, during the reporting period, the fund Allianz Rohstofffonds (from 16 November 2012 via its Master AGIF - Allianz Global Metals and Mining) was basically subject to operational risks stemming from the Company’s procedures, it was not subject to elevated operative risks.
The main sources of the performance during the reporting period are as follows:
The Fund did not record any realised gains in the period under review.
Realised losses also mainly resulted from the sale of investment certificates.
Please see the Key Investor Information Document and the prospectus for more information on the Fund’s investment focus and objectives.
The prospectus, the management regulations, the key investor information and the respective annual and semi-annual reports of the Master fund may be obtained free of charge from the management company, the custodian bank or any paying and information agent of the Master fund.
Management company for the Master fund:
Allianz Global Investors GmbH - Luxembourg Branch6A, route de TrèvesL-2633 Senningerberg
Custodian for the Master fund:
State Street Bank Luxembourg S.C.A.49, Avenue J.F. KennedyL-1855 Luxembourg
In addition, the annual and semi-annual reports are available electronically from the website at www.allianzglobalinvestors.de.
Allianz Rohstofffonds
Fund Assets in %
125
100
75
50
25
0
Fund units Cash reserves, other assets
at the beginning of the financial year at the end of the financial year
99 .3 99 .2
0 .7 0 .8

3
Allianz Rohstofffonds
AGIF - Allianz Global Metals and Mining (Master fund)
Fund Assets in %
25
20
15
10
5
0
UK Canada Australia USA Switzer-land
Brazil South Af-rica
Peru Luxem-bourg
China Chile Other countries
Cash re-serves,
other as-sets
at the beginning of the financial year at the end of the financial year
18 .5
9 .2
18 .0 18 .4 17 .0 16 .012 .9
9 .0
0 .0
7 .1 7 .75 .4 6 .0 4 .3
0 .0
5 .7 4 .2 2 .9 4 .3 3 .80 .0
3 .6
11 .2 11 .4
0 .23 .2
Allianz Rohstofffonds
Development of net assets and unit value in a 3-year comparison31/12/2015 31/12/2014 31/12/2013 31/12/2012
Net assets in EUR m
- Unit class A (EUR) WKN: 847 509/ISIN: DE0008475096 249.8 390.5 502.5 759.9
- Unit class P (EUR) 1) WKN: 979 749/ISIN: DE0009797498 2.4 5.4 6.3 8.2
Unit value in EUR
- Unit class A (EUR) WKN: 847 509/ISIN: DE0008475096 36.71 57.86 68.44 94.27
- Unit class P (EUR) 1) WKN: 979 749/ISIN: DE0009797498 291.41 459.57 547.32 756.76
1) Launch date: 13/05/2011
AGIF - Allianz Global Metals and Mining (Master fund)Development of net assets and unit value in a 3-year comparison
31/12/2015 31/12/2014 31/12/2013 31/12/2012Net assets in EUR m
- Unit class F (EUR) WKN: A1J URA/ISIN: LU0753793586 250.2 393.1 504.3 761.3
Unit value in EUR
- Unit class F (EUR) WKN: A1J URA/ISIN: LU0753793586 391.31 629.99 752.24 1,050.70

4
Allianz Rohstofffonds
Asset overview at 31/12/2015
Breakdown by asset category – country Market value in EUR % of netassets *)
I . Assets
1 . Investment units 250,165,656 .93 99 .20
Luxembourg 250,165,656.93 99.20
2 . Bank deposits 1,907,915 .16 0 .76
3 . Other assets 515,709 .54 0 .20II . Liabilities -402,501 .84 -0 .16III . Fund assets 252,186,779 .79 100 .00*) Minor rounding differences may be the result of percentage rounding during the calculation.
Breakdown by asset category – currency Market value in EUR % of netassets *)
I . Assets
1 . Investment units 250,165,656 .93 99 .20
EUR 250,165,656.93 99.20
2 . Bank deposits 1,907,915 .16 0 .76
3 . Other assets 515,709 .54 0 .20II . Liabilities -402,501 .84 -0 .16III . Fund assets 252,186,779 .79 100 .00
5
AGIF - Allianz Global Metals and Mining (Master fund)
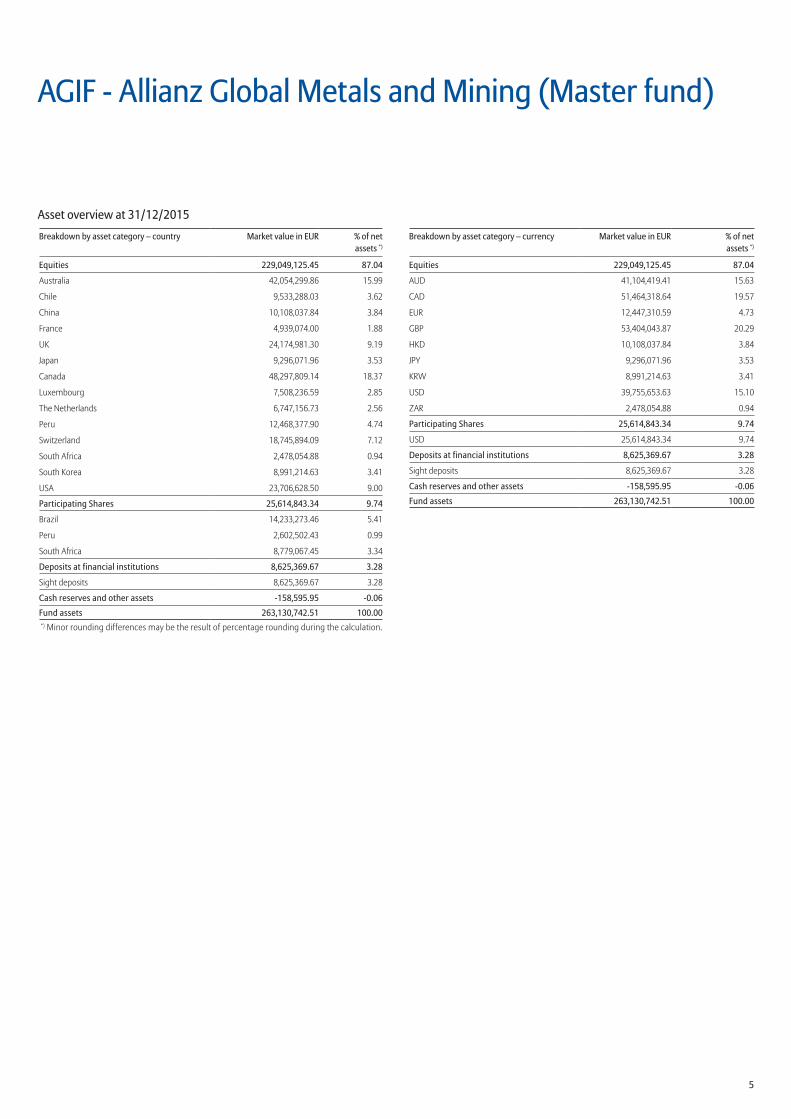
Asset overview at 31/12/2015
Breakdown by asset category – country Market value in EUR % of netassets *)
Equities 229,049,125 .45 87 .04
Australia 42,054,299.86 15.99
Chile 9,533,288.03 3.62
China 10,108,037.84 3.84
France 4,939,074.00 1.88
UK 24,174,981.30 9.19
Japan 9,296,071.96 3.53
Canada 48,297,809.14 18.37
Luxembourg 7,508,236.59 2.85
The Netherlands 6,747,156.73 2.56
Peru 12,468,377.90 4.74
Switzerland 18,745,894.09 7.12
South Africa 2,478,054.88 0.94
South Korea 8,991,214.63 3.41
USA 23,706,628.50 9.00
Participating Shares 25,614,843 .34 9 .74
Brazil 14,233,273.46 5.41
Peru 2,602,502.43 0.99
South Africa 8,779,067.45 3.34
Deposits at financial institutions 8,625,369 .67 3 .28
Sight deposits 8,625,369.67 3.28
Cash reserves and other assets -158,595 .95 -0 .06
Fund assets 263,130,742 .51 100 .00*) Minor rounding differences may be the result of percentage rounding during the calculation.
Breakdown by asset category – currency Market value in EUR % of netassets *)
Equities 229,049,125 .45 87 .04
AUD 41,104,419.41 15.63
CAD 51,464,318.64 19.57
EUR 12,447,310.59 4.73
GBP 53,404,043.87 20.29
HKD 10,108,037.84 3.84
JPY 9,296,071.96 3.53
KRW 8,991,214.63 3.41
USD 39,755,653.63 15.10
ZAR 2,478,054.88 0.94
Participating Shares 25,614,843 .34 9 .74
USD 25,614,843.34 9.74
Deposits at financial institutions 8,625,369 .67 3 .28
Sight deposits 8,625,369.67 3.28
Cash reserves and other assets -158,595 .95 -0 .06
Fund assets 263,130,742 .51 100 .00
6
Allianz Rohstofffonds
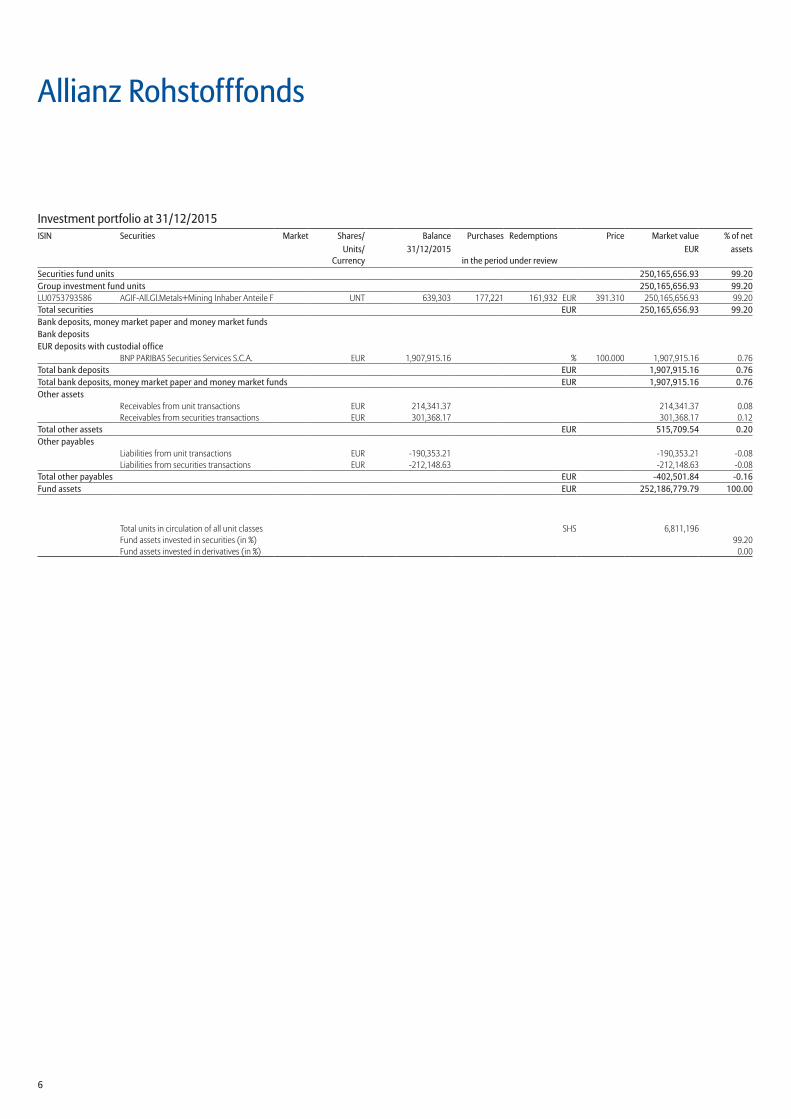
Investment portfolio at 31/12/2015ISIN Securities Market Shares/ Balance Purchases Redemptions Price Market value % of net
Units/ 31/12/2015 EUR assetsCurrency in the period under review
Securities fund units 250,165,656 .93 99 .20Group investment fund units 250,165,656 .93 99 .20LU0753793586 AGIF-All.Gl.Metals+Mining Inhaber Anteile F UNT 639,303 177,221 161,932 EUR 391.310 250,165,656.93 99.20Total securities EUR 250,165,656 .93 99 .20Bank deposits, money market paper and money market fundsBank depositsEUR deposits with custodial office
BNP PARIBAS Securities Services S.C.A. EUR 1,907,915.16 % 100.000 1,907,915.16 0.76Total bank deposits EUR 1,907,915 .16 0 .76Total bank deposits, money market paper and money market funds EUR 1,907,915 .16 0 .76Other assets
Receivables from unit transactions EUR 214,341.37 214,341.37 0.08Receivables from securities transactions EUR 301,368.17 301,368.17 0.12
Total other assets EUR 515,709 .54 0 .20Other payables
Liabilities from unit transactions EUR -190,353.21 -190,353.21 -0.08Liabilities from securities transactions EUR -212,148.63 -212,148.63 -0.08
Total other payables EUR -402,501 .84 -0 .16Fund assets EUR 252,186,779 .79 100 .00
Total units in circulation of all unit classes SHS 6,811,196Fund assets invested in securities (in %) 99.20Fund assets invested in derivatives (in %) 0.00
7
Allianz Rohstofffonds
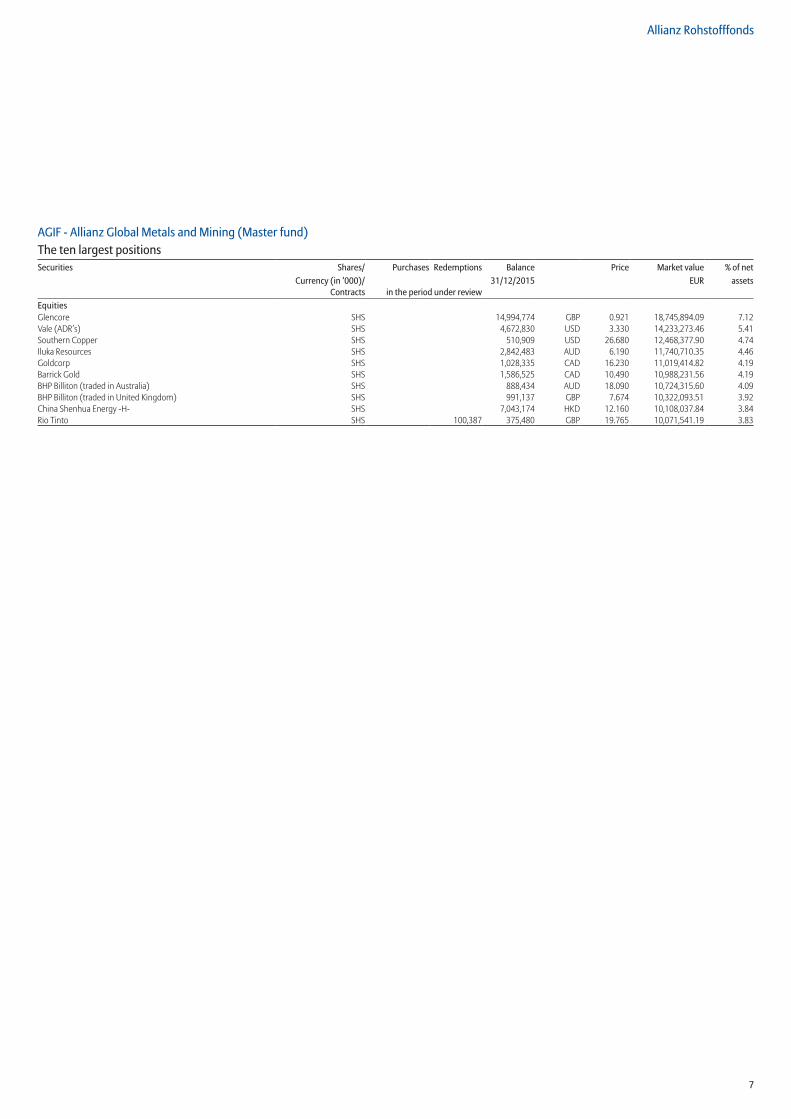
AGIF - Allianz Global Metals and Mining (Master fund)The ten largest positionsSecurities Shares/ Purchases Redemptions Balance Price Market value % of net
Currency (in ‘000)/ 31/12/2015 EUR assets Contracts in the period under review
EquitiesGlencore SHS 14,994,774 GBP 0.921 18,745,894.09 7.12Vale (ADR’s) SHS 4,672,830 USD 3.330 14,233,273.46 5.41Southern Copper SHS 510,909 USD 26.680 12,468,377.90 4.74Iluka Resources SHS 2,842,483 AUD 6.190 11,740,710.35 4.46Goldcorp SHS 1,028,335 CAD 16.230 11,019,414.82 4.19Barrick Gold SHS 1,586,525 CAD 10.490 10,988,231.56 4.19BHP Billiton (traded in Australia) SHS 888,434 AUD 18.090 10,724,315.60 4.09BHP Billiton (traded in United Kingdom) SHS 991,137 GBP 7.674 10,322,093.51 3.92China Shenhua Energy -H- SHS 7,043,174 HKD 12.160 10,108,037.84 3.84Rio Tinto SHS 100,387 375,480 GBP 19.765 10,071,541.19 3.83

8
Allianz Rohstofffonds
Allianz Rohstofffonds A (EUR)ISIN DE0008475096
Fund assets 249,758,148.12
Units in circulation 6,802,862.055
Unit value 36.71
Allianz Rohstofffonds P (EUR)ISIN DE0009797498
Fund assets 2,428,631.67
Units in circulation 8,334.065
Unit value 291.41
Allianz Global Metals and Mining F (EUR)ISIN LU0753793586
Fund assets 250,165,656.93
Units in circulation 639,303.000
Unit value 391.31

9
Allianz Rohstofffonds
Securities prices/market ratesFund assets were valued on the basis of the following prices/market rates:
All assets: prices/market rates as at 30/12/2015 or last known
Capital measures
All sales revenues resulting from capital measures (technical revenues) are reported as additions or disposals.

10
Allianz Rohstofffonds
Unit class: Allianz Rohstofffonds A (EUR)Statement of Income and Expenditure(incl. income equalisation) for the period from 01/01/15 to 31/12/15
EUR EUR
I . Income
1. Interest from liquid investments in Germany 2,755.81
a) Positive deposit interest 2,768.68
b) Negative deposit interest -12.87
2. Income from fund units 8,775,930.46
3. Deduction of foreign withholding tax 89,743.30
a) Reimbursed foreign withholding tax dividends 101,772.93
b) Non-recoverable withholding tax receivables -12,029.63
4. Other income 15.45
Total income 8,868,445 .02
II . Expenses
1. Interest from loans -13.84
2. All-in fee1) -4,863,920.59
3. Other expenses -70.67
Total expenses -4,864,005 .10
III . Ordinary net income 4,004,439 .92IV . Sales transactions
1. Realised gains 0.00
2. Realised losses -45,582,795.83
Result from sales transactions -45,582,795 .83
V . Realised result for the financial year -41,578,355 .91
1. Net change in unrealised gains 0.00
2. Net change in unrealised losses -98,202,387.14
VI . Unrealised result for the financial year -98,202,387 .14
VII . Result for the financial year -139,780,743 .051) Under the Terms and Conditions, an all-in fee of up to 1.80% p.a. (in the financial year 1.80%p.a.) is payable to the investment management company on behalf of the fund. The expensesmet by the investment management company from this fee included the expenses for portfolio management and the custodian charges (in the financial year 0.011% p.a.) as well as other third party payments (e.g. printing and publication expenses, audit fees, etc.).

11
Allianz Rohstofffonds
Unit class: Allianz Rohstofffonds P (EUR)Statement of Income and Expenditure(incl. income equalisation) for the period from 01/01/15 to 31/12/15
EUR EUR
I . Income
1. Interest from liquid investments in Germany 26.74
a) Positive deposit interest 26.86
b) Negative deposit interest -0.12
2. Income from fund units 85,305.24
3. Deduction of foreign withholding tax 870.28
a) Reimbursed foreign withholding tax dividends 986.93
b) Non-recoverable withholding tax receivables -116.65
4. Other income 0.15
Total income 86,202 .41
II . Expenses
1. Interest from loans -0.13
2. All-in fee1) -17,568.39
3. Other expenses -0.67
Total expenses -17,569 .19
III . Ordinary net income 68,633 .22IV . Sales transactions
1. Realised gains 0.00
2. Realised losses -442,128.91
Result from sales transactions -442,128 .91
V . Realised result for the financial year -373,495 .69
1. Net change in unrealised gains 0.00
2. Net change in unrealised losses -1,290,498.26
VI . Unrealised result for the financial year -1,290,498 .26
VII . Result for the financial year -1,663,993 .951) Under the Terms and Conditions, an all-in fee of up to 0.95% p.a. (in the financial year 0.95% p.a.) is payable to the investment management company on behalf of the fund. The expenses met by the investment management company from this fee included the expenses for portfolio management and the custodian charges (in the financial year 0.011% p.a.) as well as other third party payments (e.g. printing and publication expenses, audit fees, etc.).
Unit class: Allianz Rohstofffonds A (EUR)Statement of Changes in Net Assets 2015
EUR EUR
I . Value of the fund at beginning of financial year 390,522,194 .31
1. Previous year distribution/ tax instalment for previous year -3,641,034.07
2. Inflows (net) 2,320,226.01
a) Subscriptions 61,680,244.10
b) Redemptions -59,360,018.09
3. Income equalisation/Expense equalisation 337,504.92
4. Result for the financial year -139,780,743.05
of which net change in unrealised gains 0.00
of which net change in unrealised losses -98,202,387.14
II . Value of the fund at end of financial year 249,758,148 .12
Unit class: Allianz Rohstofffonds P (EUR)Statement of Changes in Net Assets 2015
EUR EUR
I . Value of the fund at beginning of financial year 5,394,834 .74
1. Previous year distribution/ tax instalment for previous year -105,153.12
2. Inflows (net) -1,082,515.39
a) Subscriptions 171,850.00
b) Redemptions -1,254,365.39
3. Income equalisation/Expense equalisation -114,540.61
4. Result for the financial year -1,663,993.95
of which net change in unrealised gains 0.00
of which net change in unrealised losses -1,290,498.26
II . Value of the fund at end of financial year 2,428,631 .67
12
Allianz Rohstofffonds
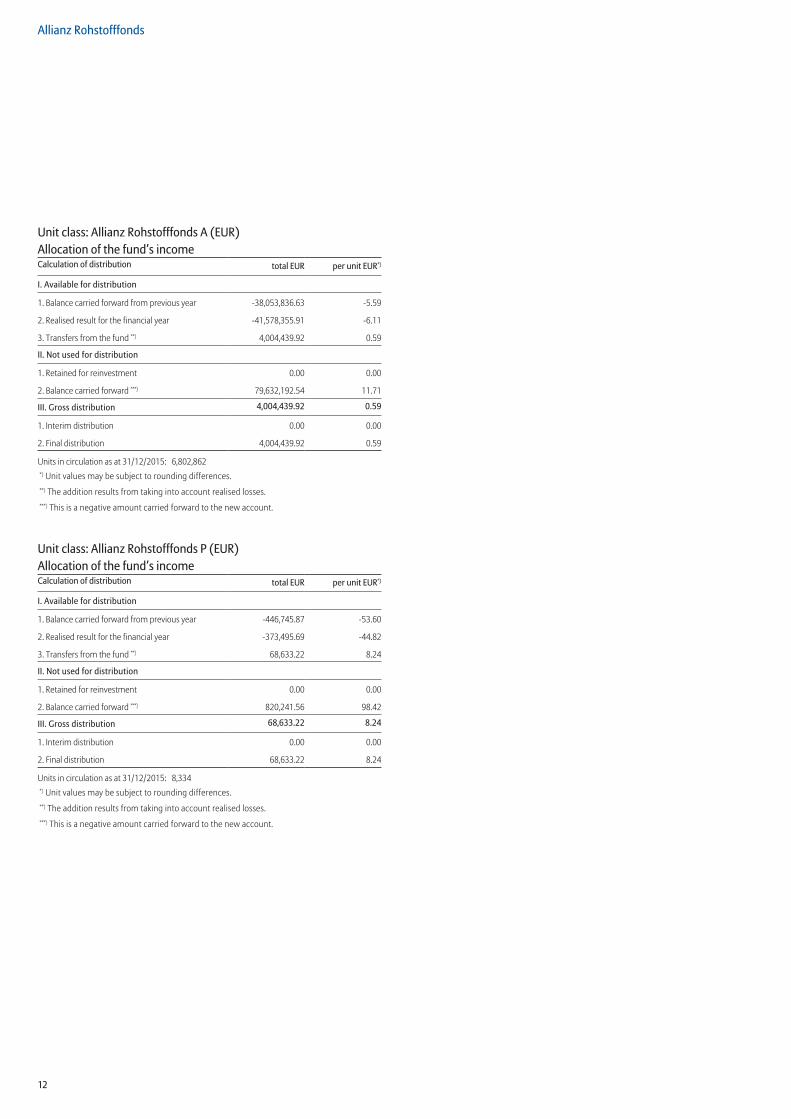
Unit class: Allianz Rohstofffonds A (EUR)Allocation of the fund’s incomeCalculation of distribution total EUR per unit EUR*)
I . Available for distribution
1. Balance carried forward from previous year -38,053,836.63 -5.59
2. Realised result for the financial year -41,578,355.91 -6.11
3. Transfers from the fund **) 4,004,439.92 0.59
II . Not used for distribution
1. Retained for reinvestment 0.00 0.00
2. Balance carried forward ***) 79,632,192.54 11.71
III . Gross distribution 4,004,439 .92 0 .59
1. Interim distribution 0.00 0.00
2. Final distribution 4,004,439.92 0.59
Units in circulation as at 31/12/2015: 6,802,862*) Unit values may be subject to rounding differences.**) The addition results from taking into account realised losses.***) This is a negative amount carried forward to the new account.
Unit class: Allianz Rohstofffonds P (EUR)Allocation of the fund’s incomeCalculation of distribution total EUR per unit EUR*)
I . Available for distribution
1. Balance carried forward from previous year -446,745.87 -53.60
2. Realised result for the financial year -373,495.69 -44.82
3. Transfers from the fund **) 68,633.22 8.24
II . Not used for distribution
1. Retained for reinvestment 0.00 0.00
2. Balance carried forward ***) 820,241.56 98.42
III . Gross distribution 68,633 .22 8 .24
1. Interim distribution 0.00 0.00
2. Final distribution 68,633.22 8.24
Units in circulation as at 31/12/2015: 8,334*) Unit values may be subject to rounding differences.**) The addition results from taking into account realised losses.***) This is a negative amount carried forward to the new account.

13
Allianz Rohstofffonds
Performance of the Allianz Rohstofffonds A (EUR)%
1 year 31/12/2014 - 31/12/2015 -36 .03
2 years 31/12/2013 - 31/12/2015 -45 .68
3 years 31/12/2012 - 31/12/2015 -60 .44
4 years 31/12/2011 - 31/12/2015 -63 .34
5 years 31/12/2010 - 31/12/2015 -74 .63
10 years 31/12/2005 - 31/12/2015 -53 .80
Calculation basis: net asset value per unit (front-end loads excluded), distributions – if any – reinvested. Calculation in accordance with the BVI method (German Investment and Asset Management Association). Past figures are not a guarantee of future performance.
Performance of the Allianz Rohstofffonds P (EUR)%
1 year 31/12/2014 - 31/12/2015 -35 .48
2 years 31/12/2013 - 31/12/2015 -44 .74
3 years 31/12/2012 - 31/12/2015 -59 .40
4 years 31/12/2011 - 31/12/2015 -62 .05
Since launch 13/05/2011 - 31/12/2015 -69 .12
Calculation basis: net asset value per unit (front-end loads excluded), distributions – if any – reinvested. Calculation in accordance with the BVI method (German Investment and Asset Management Association). Past figures are not a guarantee of future performance.
Performance of the AGIF - Allianz Global Metals and Mining F (EUR)%
1 year 31/12/2014 - 31/12/2015 -35 .40
2 years 31/12/2013 - 31/12/2015 -44 .42
3 years 31/12/2012 - 31/12/2015 -59 .09
Since launch 16/11/2012 - 31/12/2015 -57 .02
Calculation basis: net asset value per unit (front-end loads excluded), distributions – if any – reinvested. Calculation in accordance with the BVI method (German Investment and Asset Management Association). Past figures are not a guarantee of future performance.Past performance does not provide any indication of current or future performance. Performance figures do not take any account of commissions and costs incurred upon subscription or redemption of units.
14
Allianz Rohstofffonds
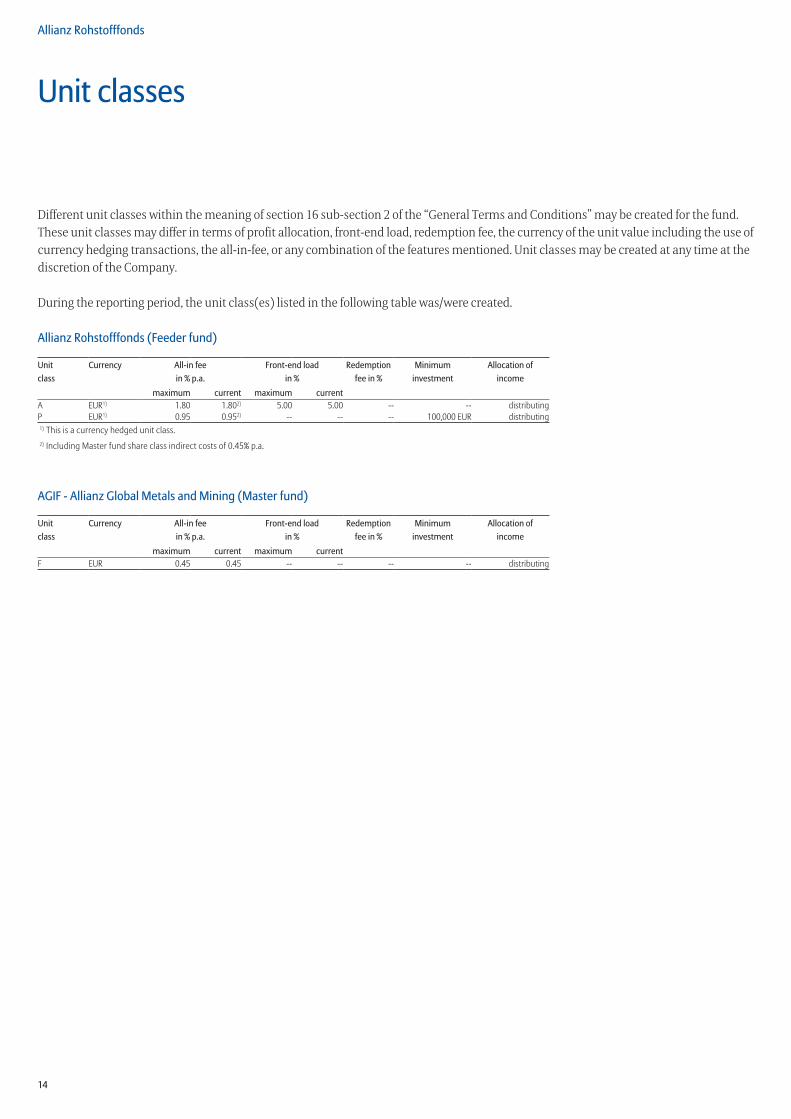
Unit classes
Different unit classes within the meaning of section 16 sub-section 2 of the “General Terms and Conditions” may be created for the fund. These unit classes may differ in terms of profit allocation, front-end load, redemption fee, the currency of the unit value including the use of currency hedging transactions, the all-in-fee, or any combination of the features mentioned. Unit classes may be created at any time at the discretion of the Company.
During the reporting period, the unit class(es) listed in the following table was/were created.
Allianz Rohstofffonds (Feeder fund)
Unit Currency All-in fee Front-end load Redemption Minimum Allocation ofclass in % p .a . in % fee in % investment income
maximum current maximum currentA EUR1) 1.80 1.802) 5.00 5.00 -- -- distributingP EUR1) 0.95 0.952) -- -- -- 100,000 EUR distributing1) This is a currency hedged unit class.2) Including Master fund share class indirect costs of 0.45% p.a.
AGIF - Allianz Global Metals and Mining (Master fund)
Unit Currency All-in fee Front-end load Redemption Minimum Allocation ofclass in % p .a . in % fee in % investment income
maximum current maximum currentF EUR 0.45 0.45 -- -- -- -- distributing

15
Allianz Rohstofffonds
Annex
Information according to Section 7 No . 9 KARBV and Section 37 Para . 1 and 2 DerivateVThe exposure that is obtained through derivatives -
The counterparty to the derivative transactions -
Total collateral granted by third parties in connection with derivatives: -
of which:
Bank deposits -
Debentures -
Equities -
Potential market risk amount (pursuant to Section 37 of the German Derivatives Regulation (DerivateV))Pursuant to the Derivatives Regulation [Derivateverordnung], the degree to which the upper limit for the market risk potential was reached (according to Sections 10 and 11 of DerivateV) was determined for this fund using the qualified method based on a benchmark fund.
The fund is monitored in accordance with Section 7 Paragraph 1 of the Derivatives Ordinance on the basis of the relative VaR method. The potential market risk amount is limited relative to a derivative-free benchmark.
Information based on the qualified method:
smallest potential value at risk 7.87 %
largest potential value at risk 14.18 %
average potential value at risk 10.38 %
Risk model used pursuant to Section 10 of DerivateV:
Delta-normal method
Parameters used pursuant to Section 11 of DerivateV:
assumed holding period: 10 daysone-sided forecast interval with a probability of 99%effective historic observation period of 250 days
Leverage from the use of derivatives during the period from 01/01/2015 to 31/12/2015 99.08 %
The expected leverage effect of the derivatives is calculated as the expected total sum of the nominal values of the derivatives, excluding offsetting effects. The actual total sum of the nominal values of the derivatives may occasionally exceed the expected total sum of the nominal values of the derivatives or change in future.
Derivatives may be employed by the Company with different objectives in mind, including hedging or speculative purposes. The nominal values of the derivatives are aggregated with no differentiation between the different purposes for using derivatives. As a result, the expected sum of the nominal values of the derivatives does not give any indication of the risk content of the fund.
Composition of the benchmark fund EUROMONEY GLOBAL MINING INDEX
The exposure that is obtained through securities lending and repurchase agreements -
The counterparty to the securities lending and repurchase agreements -
Total collateral granted by third parties in connection with derivatives: -
of which:
Bank deposits -
Debentures -
Equities -
The income that is obtained from the securities lending and repurchase agreements for the entire period under review, including direct and indirect expenses and fees that were incurred
Allianz Rohstofffonds -A- -
Allianz Rohstofffonds -P- -

16
Allianz Rohstofffonds
Other informationNet asset value
Allianz Rohstofffonds -A- EUR 36.71
Allianz Rohstofffonds -P- EUR 291.41
Units in circulation
Allianz Rohstofffonds -A- 6,802,862.055
Allianz Rohstofffonds -P- 8,334.065
Information on the procedures for valuing assetsThe valuation is conducted by the investment management company (IMC).
Equities, subscription rights, exchange-traded funds (ETFs), participation certificates, bonds and exchange-traded derivatives are valued at their market price, provided
that a market price is available.
Bonds for which no market price is available are valued at validated broker prices or with the help of regularly reviewed models on the basis of relevant market
information.
Participation certificates for which no market prices are available are valued at the mean of the bid-ask spread.
Derivatives and subscription rights which are not traded on the market are valued with the help of regularly reviewed models on the basis of relevant market
information.
Investment fund units are valued at the redemption price published by the relevant investment company.
Bank deposits and other assets are valued at their nominal value, term deposits at their current value and liabilities at the repayment value.
Unlisted equities and shareholdings are valued at the current value, which is carefully determined with the help of suitable valuation models, taking account of the
current market situation.
Of the investments reported in this annual report, 99.20% are fund assets valued at stock market trading prices or market prices and 0.00% at imputed current market
values and/or verified brokers‘ quotations. The remaining 0.80% of fund assets consists of other assets, other liabilities and cash.
17
Allianz Rohstofffonds
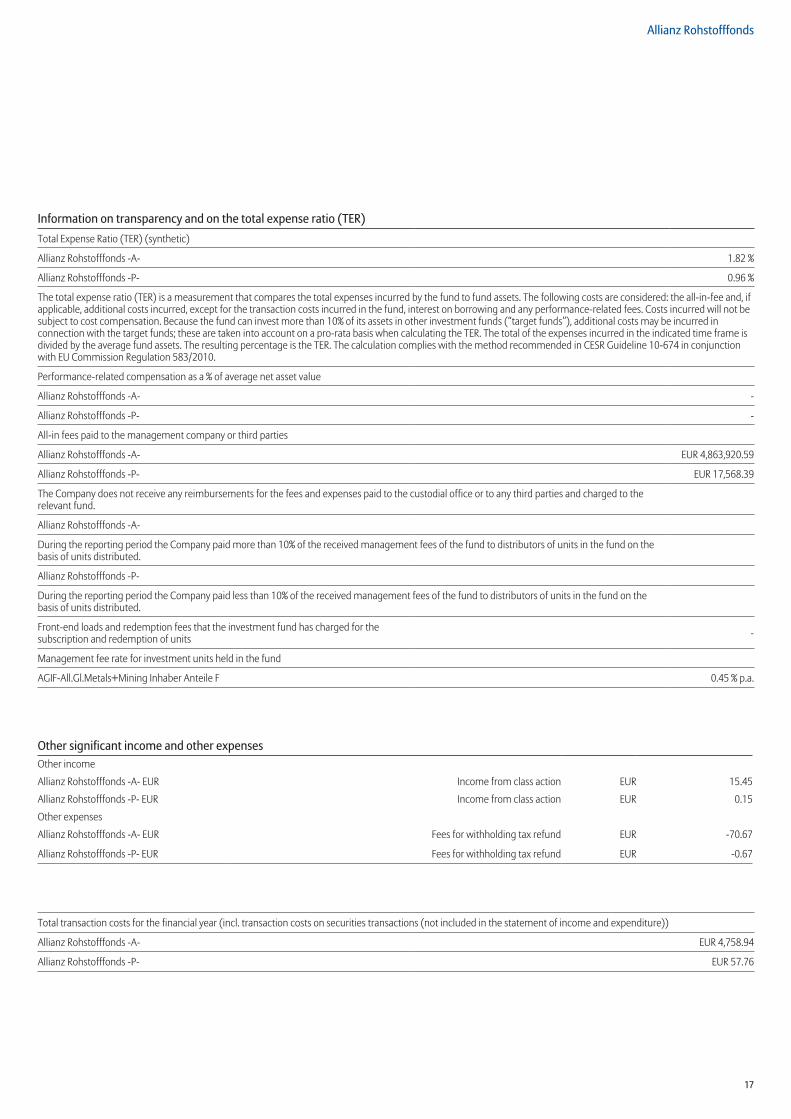
Information on transparency and on the total expense ratio (TER)Total Expense Ratio (TER) (synthetic)
Allianz Rohstofffonds -A- 1.82 %
Allianz Rohstofffonds -P- 0.96 %
The total expense ratio (TER) is a measurement that compares the total expenses incurred by the fund to fund assets. The following costs are considered: the all-in-fee and, if applicable, additional costs incurred, except for the transaction costs incurred in the fund, interest on borrowing and any performance-related fees. Costs incurred will not be subject to cost compensation. Because the fund can invest more than 10% of its assets in other investment funds (“target funds”), additional costs may be incurred in connection with the target funds; these are taken into account on a pro-rata basis when calculating the TER. The total of the expenses incurred in the indicated time frame is divided by the average fund assets. The resulting percentage is the TER. The calculation complies with the method recommended in CESR Guideline 10-674 in conjunction with EU Commission Regulation 583/2010.
Performance-related compensation as a % of average net asset value
Allianz Rohstofffonds -A- -
Allianz Rohstofffonds -P- -
All-in fees paid to the management company or third parties
Allianz Rohstofffonds -A- EUR 4,863,920.59
Allianz Rohstofffonds -P- EUR 17,568.39
The Company does not receive any reimbursements for the fees and expenses paid to the custodial office or to any third parties and charged to the relevant fund.
Allianz Rohstofffonds -A-
During the reporting period the Company paid more than 10% of the received management fees of the fund to distributors of units in the fund on the basis of units distributed.
Allianz Rohstofffonds -P-
During the reporting period the Company paid less than 10% of the received management fees of the fund to distributors of units in the fund on the basis of units distributed.
Front-end loads and redemption fees that the investment fund has charged for the subscription and redemption of units -
Management fee rate for investment units held in the fund
AGIF-All.Gl.Metals+Mining Inhaber Anteile F 0.45 % p.a.
Other significant income and other expensesOther income
Allianz Rohstofffonds -A- EUR Income from class action EUR 15.45
Allianz Rohstofffonds -P- EUR Income from class action EUR 0.15
Other expenses
Allianz Rohstofffonds -A- EUR Fees for withholding tax refund EUR -70.67
Allianz Rohstofffonds -P- EUR Fees for withholding tax refund EUR -0.67
Total transaction costs for the financial year (incl. transaction costs on securities transactions (not included in the statement of income and expenditure))
Allianz Rohstofffonds -A- EUR 4,758.94
Allianz Rohstofffonds -P- EUR 57.76

18
Allianz Rohstofffonds
Explanation of net change
The net change in unrealised gains and losses is calculated by comparing the value of the assets included in the unit price with the respective historical costs each financial year; the amount of the positive differences is included in the total unrealised gains, the amount of the negative differences is included in the total unrealised losses, and the net changes are calculated by comparing total positions as at the end of the financial year with those at the beginning of the financial year.
19
Allianz Rohstofffonds
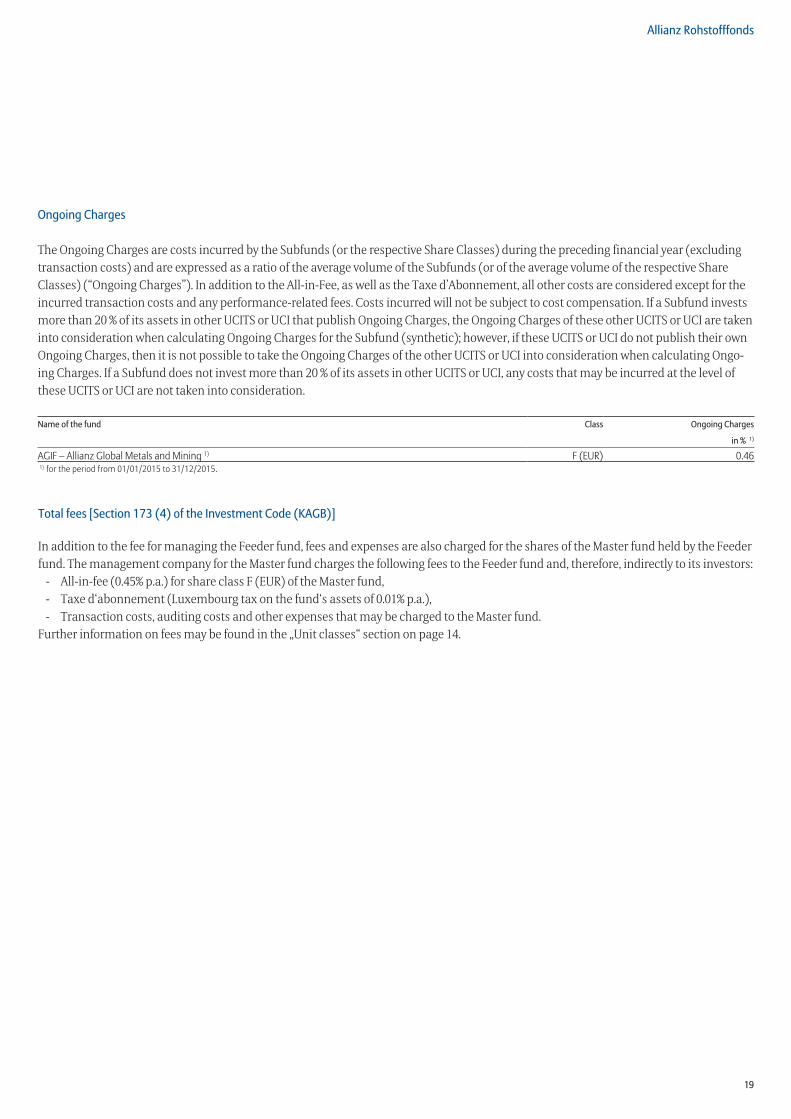
Ongoing Charges
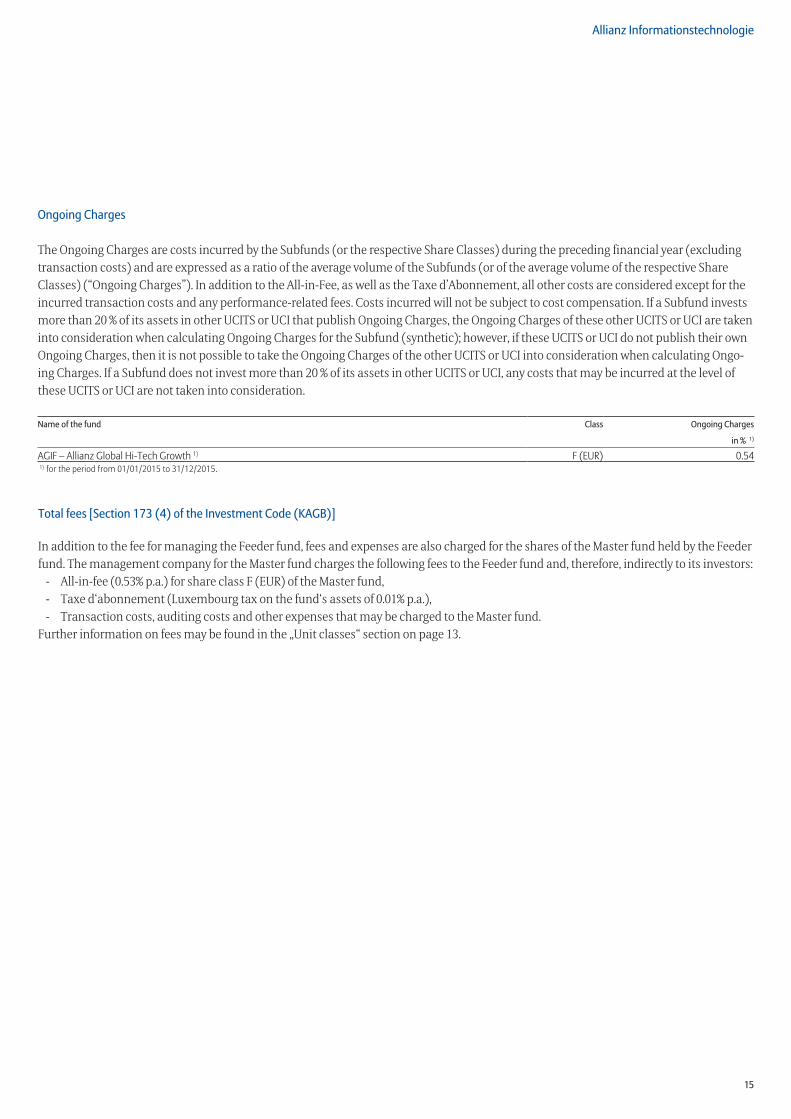
The Ongoing Charges are costs incurred by the Subfunds (or the respective Share Classes) during the preceding financial year (excluding transaction costs) and are expressed as a ratio of the average volume of the Subfunds (or of the average volume of the respective Share Classes) (“Ongoing Charges”). In addition to the All-in-Fee, as well as the Taxe d’Abonnement, all other costs are considered except for the incurred transaction costs and any performance-related fees. Costs incurred will not be subject to cost compensation. If a Subfund invests more than 20 % of its assets in other UCITS or UCI that publish Ongoing Charges, the Ongoing Charges of these other UCITS or UCI are taken into consideration when calculating Ongoing Charges for the Subfund (synthetic); however, if these UCITS or UCI do not publish their own Ongoing Charges, then it is not possible to take the Ongoing Charges of the other UCITS or UCI into consideration when calculating Ongo-ing Charges. If a Subfund does not invest more than 20 % of its assets in other UCITS or UCI, any costs that may be incurred at the level of these UCITS or UCI are not taken into consideration.
Name of the fund Class Ongoing Charges
in % 1)
AGIF – Allianz Global Metals and Mining 1) F (EUR) 0.461) for the period from 01/01/2015 to 31/12/2015.
Total fees [Section 173 (4) of the Investment Code (KAGB)]
In addition to the fee for managing the Feeder fund, fees and expenses are also charged for the shares of the Master fund held by the Feeder fund. The management company for the Master fund charges the following fees to the Feeder fund and, therefore, indirectly to its investors:
- All-in-fee (0.45% p.a.) for share class F (EUR) of the Master fund,- Taxe d‘abonnement (Luxembourg tax on the fund‘s assets of 0.01% p.a.),- Transaction costs, auditing costs and other expenses that may be charged to the Master fund.
Further information on fees may be found in the „Unit classes“ section on page 14.

20
Auditor’s Report1)
Frankfurt/Main, 18 April 2016
Allianz Global Investors GmbHThe Board of Management
To Allianz Global Investors GmbH, Frankfurt/Main
Allianz Global Investors GmbH engaged us to audit the Annual Report of the Fund Allianz Rohstofffonds for the financial year from 1 January 2015 to 31 December 2015 pursuant to Section 102 of the Investment Code (KAGB).
Management’s Responsibility
As stipulated in the German Investment Code (KAGB), the preparation of the annual report is the responsibility of the legal representatives of the investment management company.
Auditor‘s Responsibility
Our responsibility is to express an opinion on the annual report based on our audit.
We conducted our audit in accordance with Section 102 KAGB and the generally accepted standards for the audit of financial statements promulgated by the German Institut der Wirtschaftsprüfer (Institute of Public Auditors in Germany) (IDW). Those standards require that we plan and perform the audit such that misstatements materially affecting the annual report are detected with reasonable assurance. Knowledge of the management of the investment fund and evaluations of possible misstatements are taken into account in the determination of audit procedures. The effectiveness of the accounting-related internal control system and the evidence supporting the annual report are examined primarily on a test basis within the framework of the audit. The audit includes assessing the
accounting principles used for the annual report and significant estimates made by the legal representatives of the Investment Management Company. We believe that our audit provides a reasonable basis for our opinion.
Opinion
In our opinion, based on the findings of our audit, the Annual Report for the financial year from 1 January 2015 to 31 December 2015 complies with the legal requirements.
Frankfurt/Main, 18 April 2016
KPMG AGWirtschaftsprüfungsgesellschaft
Warnke SteinbrennerAuditor Auditor
1) Unsigned translation of the German auditor’s report.

21
Determining the market risk and leverage effect
As part of the risk-management procedure the market risk of the Subfund is measured and limited either using the commitment or Value-at-Risk (VaR) approach (relative or absolute VaR) in accordance with Circular 11/512 issued by the Luxembourg Supervisory Authority. When determining the market risk of the Fund, the commitment approach takes into account the additional risk that is generated through the use of derivative financial
instruments. The VaR approach represents a statistical method for calculating the potential loss arising from value changes in the whole Subfund. The VaR calculation is generally based on the “Delta Normal” method (confidence level of 99 %, an assumed holding period of 10 days, data history of 260 days), otherwise the alternative calculation method is shown in the following table.
At the end of the reporting period, the following approach applied to the Fund for calculating the market risk:Name of the Subfund Approach Reference assets/absolute VaR limit
AGIF - Allianz Global Metals and Mining1) relative VaR Euromoney Global Mining Index1) For the period from 1 January 2015 to 31 December 2015.
The minimum, maximum and average risk budget utilisation (RBU) of the Company in the period under review can be seen in the following table. For Subfunds using the relative value-at-risk (VaR) approach, the utilisation is reported in relation to the limit stipulated by the regulatory authorities (i.e. 2 times the VaR of the
defined benchmark). For funds using the absolute VaR approach, it is reported in relation to the absolute VaR limit indicated in the table above. The table also shows the average leverage effect of the Company in the period under review. The average leverage effect is calculated as the average sum of notionals of derivatives.
Average leverage Minimum Maximum Averageeffect in % RBU in % RBU in % RBU in %
AGIF - Allianz Global Metals and Mining}1) 0.00 48.96 56.42 52.221) For the period from 1 January 2015 to 31 December 2015.
22
Allianz Rohstofffonds
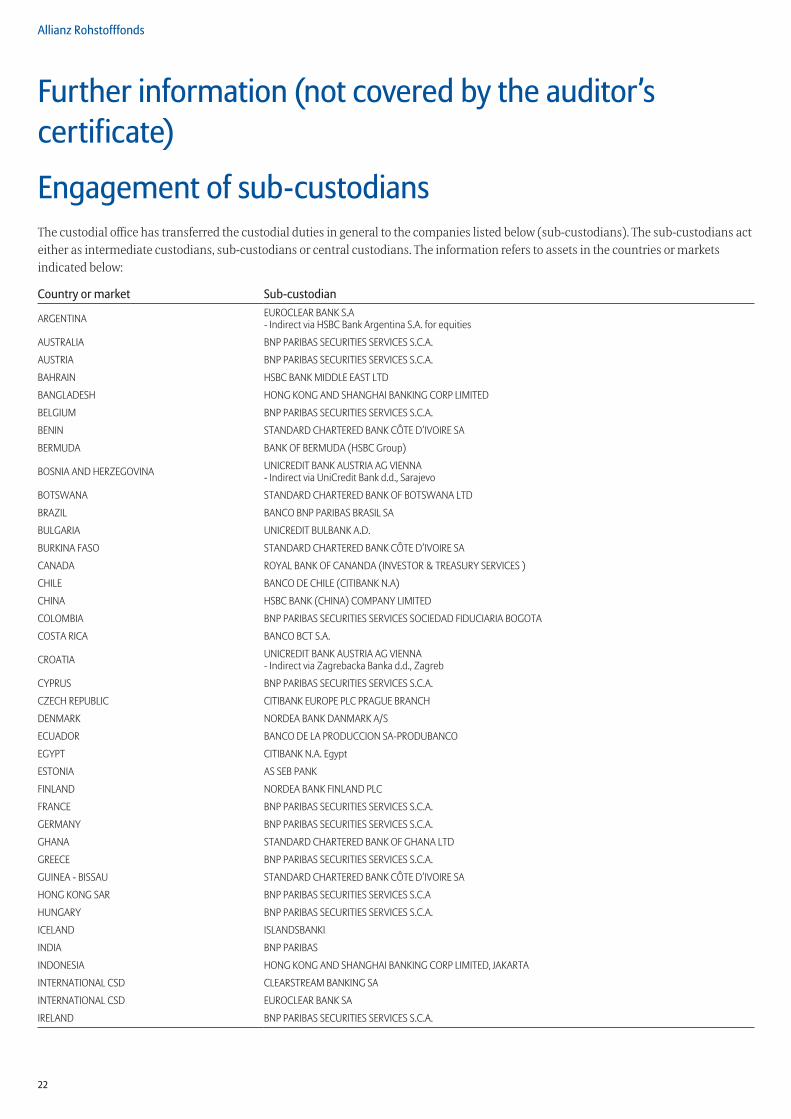
Further information (not covered by the auditor’s certificate)
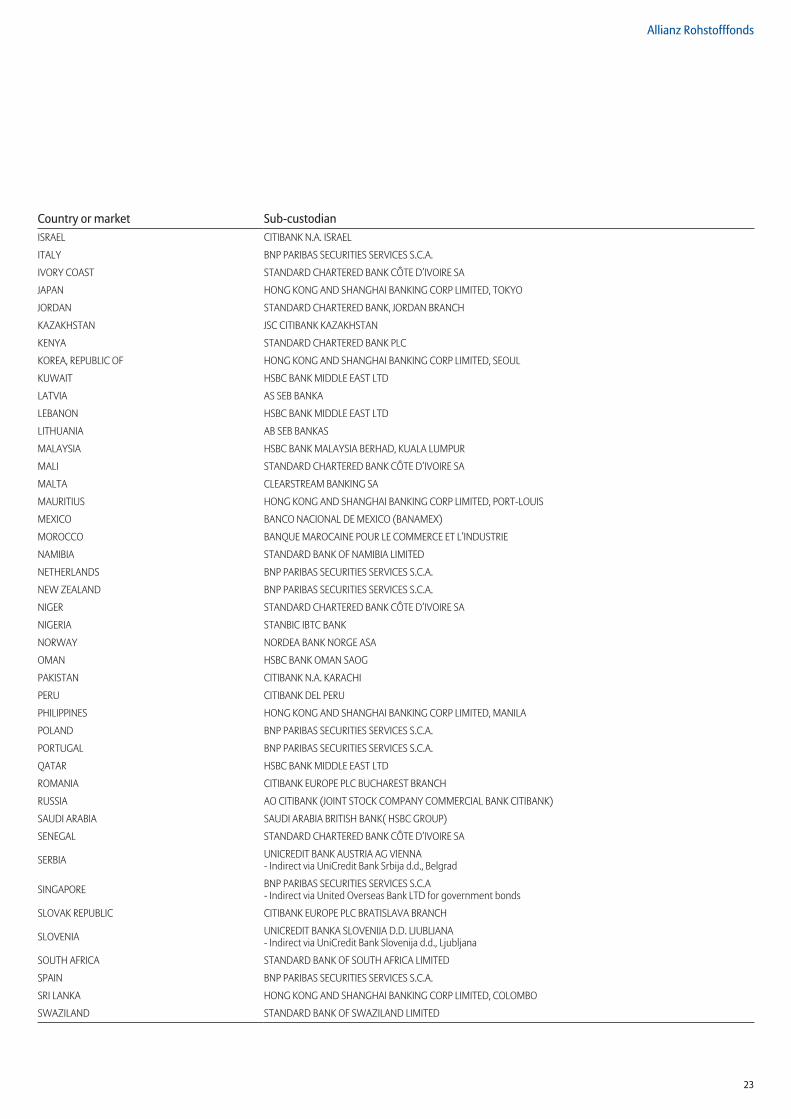
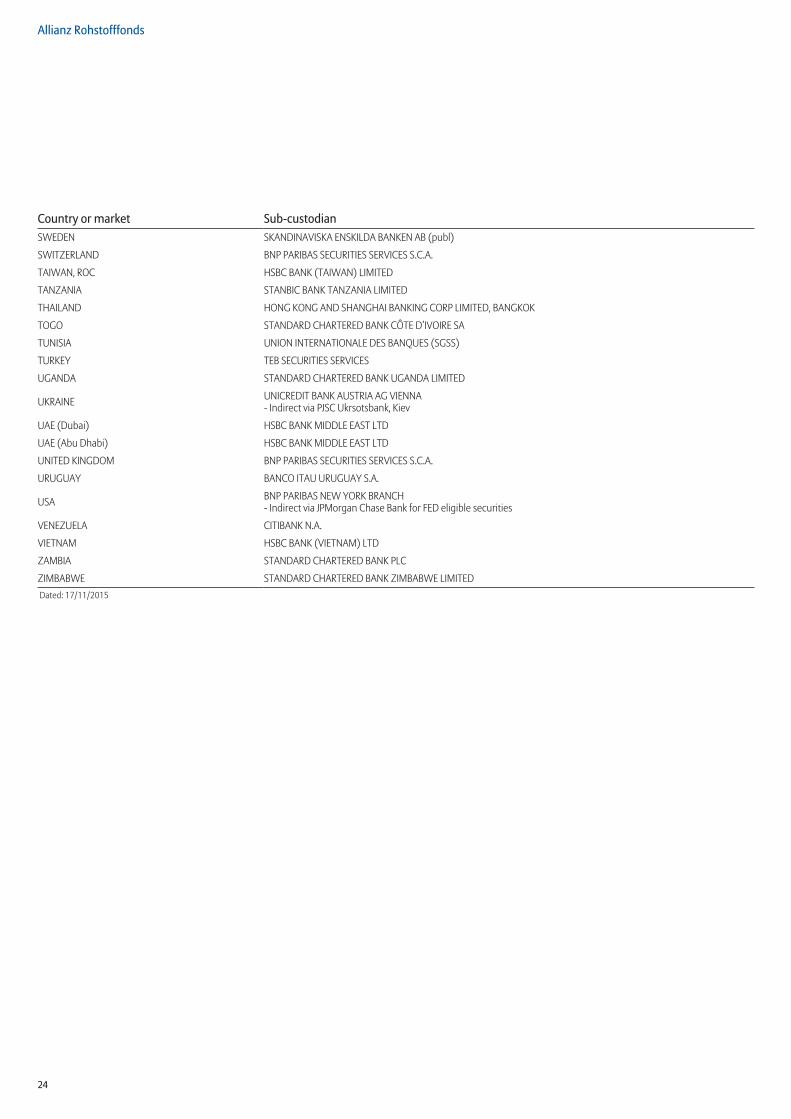
Engagement of sub-custodiansThe custodial office has transferred the custodial duties in general to the companies listed below (sub-custodians). The sub-custodians act either as intermediate custodians, sub-custodians or central custodians. The information refers to assets in the countries or markets indicated below:
Country or market Sub-custodian
ARGENTINA EUROCLEAR BANK S.A- Indirect via HSBC Bank Argentina S.A. for equities
AUSTRALIA BNP PARIBAS SECURITIES SERVICES S.C.A.
AUSTRIA BNP PARIBAS SECURITIES SERVICES S.C.A.
BAHRAIN HSBC BANK MIDDLE EAST LTD
BANGLADESH HONG KONG AND SHANGHAI BANKING CORP LIMITED
BELGIUM BNP PARIBAS SECURITIES SERVICES S.C.A.
BENIN STANDARD CHARTERED BANK CÔTE D’IVOIRE SA
BERMUDA BANK OF BERMUDA (HSBC Group)
BOSNIA AND HERZEGOVINA UNICREDIT BANK AUSTRIA AG VIENNA- Indirect via UniCredit Bank d.d., Sarajevo
BOTSWANA STANDARD CHARTERED BANK OF BOTSWANA LTD
BRAZIL BANCO BNP PARIBAS BRASIL SA
BULGARIA UNICREDIT BULBANK A.D.
BURKINA FASO STANDARD CHARTERED BANK CÔTE D’IVOIRE SA
CANADA ROYAL BANK OF CANANDA (INVESTOR & TREASURY SERVICES )
CHILE BANCO DE CHILE (CITIBANK N.A)
CHINA HSBC BANK (CHINA) COMPANY LIMITED
COLOMBIA BNP PARIBAS SECURITIES SERVICES SOCIEDAD FIDUCIARIA BOGOTA
COSTA RICA BANCO BCT S.A.
CROATIA UNICREDIT BANK AUSTRIA AG VIENNA- Indirect via Zagrebacka Banka d.d., Zagreb
CYPRUS BNP PARIBAS SECURITIES SERVICES S.C.A.
CZECH REPUBLIC CITIBANK EUROPE PLC PRAGUE BRANCH
DENMARK NORDEA BANK DANMARK A/S
ECUADOR BANCO DE LA PRODUCCION SA-PRODUBANCO
EGYPT CITIBANK N.A. Egypt
ESTONIA AS SEB PANK
FINLAND NORDEA BANK FINLAND PLC
FRANCE BNP PARIBAS SECURITIES SERVICES S.C.A.
GERMANY BNP PARIBAS SECURITIES SERVICES S.C.A.
GHANA STANDARD CHARTERED BANK OF GHANA LTD
GREECE BNP PARIBAS SECURITIES SERVICES S.C.A.
GUINEA - BISSAU STANDARD CHARTERED BANK CÔTE D’IVOIRE SA
HONG KONG SAR BNP PARIBAS SECURITIES SERVICES S.C.A
HUNGARY BNP PARIBAS SECURITIES SERVICES S.C.A.
ICELAND ISLANDSBANKI
INDIA BNP PARIBAS
INDONESIA HONG KONG AND SHANGHAI BANKING CORP LIMITED, JAKARTA
INTERNATIONAL CSD CLEARSTREAM BANKING SA
INTERNATIONAL CSD EUROCLEAR BANK SA
IRELAND BNP PARIBAS SECURITIES SERVICES S.C.A.
23
Allianz Rohstofffonds
Country or market Sub-custodianISRAEL CITIBANK N.A. ISRAEL
ITALY BNP PARIBAS SECURITIES SERVICES S.C.A.
IVORY COAST STANDARD CHARTERED BANK CÔTE D’IVOIRE SA
JAPAN HONG KONG AND SHANGHAI BANKING CORP LIMITED, TOKYO
JORDAN STANDARD CHARTERED BANK, JORDAN BRANCH
KAZAKHSTAN JSC CITIBANK KAZAKHSTAN
KENYA STANDARD CHARTERED BANK PLC
KOREA, REPUBLIC OF HONG KONG AND SHANGHAI BANKING CORP LIMITED, SEOUL
KUWAIT HSBC BANK MIDDLE EAST LTD
LATVIA AS SEB BANKA
LEBANON HSBC BANK MIDDLE EAST LTD
LITHUANIA AB SEB BANKAS
MALAYSIA HSBC BANK MALAYSIA BERHAD, KUALA LUMPUR
MALI STANDARD CHARTERED BANK CÔTE D’IVOIRE SA
MALTA CLEARSTREAM BANKING SA
MAURITIUS HONG KONG AND SHANGHAI BANKING CORP LIMITED, PORT-LOUIS
MEXICO BANCO NACIONAL DE MEXICO (BANAMEX)
MOROCCO BANQUE MAROCAINE POUR LE COMMERCE ET L’INDUSTRIE
NAMIBIA STANDARD BANK OF NAMIBIA LIMITED
NETHERLANDS BNP PARIBAS SECURITIES SERVICES S.C.A.
NEW ZEALAND BNP PARIBAS SECURITIES SERVICES S.C.A.
NIGER STANDARD CHARTERED BANK CÔTE D’IVOIRE SA
NIGERIA STANBIC IBTC BANK
NORWAY NORDEA BANK NORGE ASA
OMAN HSBC BANK OMAN SAOG
PAKISTAN CITIBANK N.A. KARACHI
PERU CITIBANK DEL PERU
PHILIPPINES HONG KONG AND SHANGHAI BANKING CORP LIMITED, MANILA
POLAND BNP PARIBAS SECURITIES SERVICES S.C.A.
PORTUGAL BNP PARIBAS SECURITIES SERVICES S.C.A.
QATAR HSBC BANK MIDDLE EAST LTD
ROMANIA CITIBANK EUROPE PLC BUCHAREST BRANCH
RUSSIA AO CITIBANK (JOINT STOCK COMPANY COMMERCIAL BANK CITIBANK)
SAUDI ARABIA SAUDI ARABIA BRITISH BANK( HSBC GROUP)
SENEGAL STANDARD CHARTERED BANK CÔTE D’IVOIRE SA
SERBIA UNICREDIT BANK AUSTRIA AG VIENNA- Indirect via UniCredit Bank Srbija d.d., Belgrad
SINGAPORE BNP PARIBAS SECURITIES SERVICES S.C.A- Indirect via United Overseas Bank LTD for government bonds
SLOVAK REPUBLIC CITIBANK EUROPE PLC BRATISLAVA BRANCH
SLOVENIA UNICREDIT BANKA SLOVENIJA D.D. LJUBLJANA- Indirect via UniCredit Bank Slovenija d.d., Ljubljana
SOUTH AFRICA STANDARD BANK OF SOUTH AFRICA LIMITED
SPAIN BNP PARIBAS SECURITIES SERVICES S.C.A.
SRI LANKA HONG KONG AND SHANGHAI BANKING CORP LIMITED, COLOMBO
SWAZILAND STANDARD BANK OF SWAZILAND LIMITED
24
Allianz Rohstofffonds
Country or market Sub-custodianSWEDEN SKANDINAVISKA ENSKILDA BANKEN AB (publ)
SWITZERLAND BNP PARIBAS SECURITIES SERVICES S.C.A.
TAIWAN, ROC HSBC BANK (TAIWAN) LIMITED
TANZANIA STANBIC BANK TANZANIA LIMITED
THAILAND HONG KONG AND SHANGHAI BANKING CORP LIMITED, BANGKOK
TOGO STANDARD CHARTERED BANK CÔTE D’IVOIRE SA
TUNISIA UNION INTERNATIONALE DES BANQUES (SGSS)
TURKEY TEB SECURITIES SERVICES
UGANDA STANDARD CHARTERED BANK UGANDA LIMITED
UKRAINE UNICREDIT BANK AUSTRIA AG VIENNA- Indirect via PJSC Ukrsotsbank, Kiev
UAE (Dubai) HSBC BANK MIDDLE EAST LTD
UAE (Abu Dhabi) HSBC BANK MIDDLE EAST LTD
UNITED KINGDOM BNP PARIBAS SECURITIES SERVICES S.C.A.
URUGUAY BANCO ITAU URUGUAY S.A.
USA BNP PARIBAS NEW YORK BRANCH- Indirect via JPMorgan Chase Bank for FED eligible securities
VENEZUELA CITIBANK N.A.
VIETNAM HSBC BANK (VIETNAM) LTD
ZAMBIA STANDARD CHARTERED BANK PLC
ZIMBABWE STANDARD CHARTERED BANK ZIMBABWE LIMITEDDated: 17/11/2015

25

26

27

28
Further information (not covered by the auditor’s certificate)
Your PartnersAllianz Global Investors GmbHBockenheimer Landstraße 42-4460323 Frankfurt/Main
Customer Service CentreTelephone: +49 9281-72 20Fax: +49 9281-72 24 61 15
+49 9281-72 24 61 16E-Mail: [email protected]
Subscribed and paid up capital:EUR 49.9 millionDated: 31 December 2014
ShareholderAllianz Asset Management AG
Munich
Supervisory BoardDr. Christian FinckhChief HR OfficerAllianz SEMunich
Stefan BaumjohannMember of the Works Council ofAllianz Global Investors GmbHFrankfurt/Main
Prof. Dr. Michael HütherChairman and Member of the Executive CommitteeInstitut der deutschen Wirtschaft Cologne
Angelika Leutz (until 28/02/2015)Member of the Works Council ofAllianz Global Investors GmbHFrankfurt/Main
Laure Poussin (since 01/03/2015)Member of the Works Council ofAllianz Global Investors GmbHSuccursale FrançaiseParis
Wolfgang PützMember of the Supervisory Board ofAllianz Global Investors GmbHFrankfurt/Main
Dr. Bettina Corves-WundererChief Financial OfficerAllianz S.p.A.Trieste
Board of ManagementElizabeth Corley (CEO)
Thorsten Heymann (since 01/03/2015)
Dr. Markus Kobler
Daniel Lehmann
George McKay (since 01/03/2015)
Michael Peters
Dr. Wolfram Peters
Tobias C. Pross
Andreas Utermann
CustodianBNP Paribas Securities Services S.C.A.Frankfurt/Main branchEuropa-Allee 1260327 Frankfurt/Main
Subscribed capital: EUR 165.28 millionAdditional surplus for tax purposes:EUR 127.93 million
Dated: 31 December 2014
Special Order Placement OfficesFondsdepot Bank GmbHWindmühlenweg 1295030 Hof
RBC Investor Services Bank S.A. 14, Porte de France L-4360 Esch-sur-Alzette
Paying and information agent in AustriaAllianz Investmentbank AGHietzinger Kai 101–105A-1130 Vienna
Appointment of the Austrian Representative to the Tax Authorities in the Republic of AustriaThe following financial institution isappointed as local representative for tax purposes to provide proof of deemed distribution income within the meaning ofSection 186, Paragraph 2, Item 2 of theAustrian Investment Fund Act (InvFG):
Allianz Investmentbank AGHietzinger Kai 101–105A-1130 Vienna
AuditorKPMG AGWirtschaftsprüfungsgesellschaftFrankfurt/Main
The prospectus, the management regulations, the key investor information and the respective annual and semi-annual reports of the Master fund may be obtained free of charge from the management company, the custodian bank or any paying and information agent of the Master fund.Management company for the Master fund:
Allianz Global Investors GmbH - Luxembourg Branch6A, route de TrèvesL-2633 Senningerberg
Custodian for the Master fund:
State Street Bank Luxembourg S.C.A.49, Avenue J.F. KennedyL-1855 Luxembourg
In addition, the annual and semi-annual reports are available electronically from the website at www.allianzglobalinvestors.de.
Dated: 31 December 2015
Visit our website at www .allianzglobalinvestors .de
29
Further information (not covered by the auditor’s certificate)
Information for investors in the Republic of AustriaThe sale of units in the fund Allianz Rohstofffonds in the Republic of Austria has been registered with the Finanzmarktaufsicht (Vienna) in accordance with Section 140 of the Investment Fund Act (Investmentfondsgesetz – InvFG).
Redemption requests for units in the aforementioned fund can be submitted to the Austrian paying and information agent and the redemption proceeds, possible distributions and any other payments can be paid out to the unitholders by the Austrian paying and information agent, at their request, in euro cash.
Investors may obtain all necessary information from the Austrian payment and information agent for free, for example· the prospectus, · the investment terms and conditions,· the key investor information,· the annual and semi-annual reports,· the issue and redemption prices.
Prior to acquiring units of the fund, investors are recommended to ascertain whether the income data on the unit class that is required for tax purposes is published by the Oesterreichische Kontrollbank.

Allianz Global Investors GmbHBockenheimer Landstraße 42–4460323 Frankfurt/[email protected]
Annual Report31 December 2015
Allianz Informationstechnologie
Allianz Global Investors GmbH
This report is a non-binding translation of the German original excluding the tax information for investors resident in Germany.
Contents
Allianz Informationstechnologie
Activity report . . . . . . . . . . . . . . . . . . . . . . . . . . . . . . . . . . . . . . . . . . . . . . . . . . . . . 1
Asset overview at 31/12/2015 . . . . . . . . . . . . . . . . . . . . . . . . . . . . . . . . . . . . . . . 4
Investment portfolio at 31/12/2015 . . . . . . . . . . . . . . . . . . . . . . . . . . . . . . . . . . 6
Unit classes . . . . . . . . . . . . . . . . . . . . . . . . . . . . . . . . . . . . . . . . . . . . . . . . . . . . . . . . 11
Annex . . . . . . . . . . . . . . . . . . . . . . . . . . . . . . . . . . . . . . . . . . . . . . . . . . . . . . . . . . . . . 12
Auditor’s Report . . . . . . . . . . . . . . . . . . . . . . . . . . . . . . . . . . . . . . . . . . . . . . . . . . . . 16
Determining the market risk and leverage effect . . . . . . . . . . . . . . . . . . . . . . 17
Further information (not covered by the auditor’s certificate)
Engagement of sub-custodians . . . . . . . . . . . . . . . . . . . . . . . . . . . . . . . . . . . . . . 18
Your Partners . . . . . . . . . . . . . . . . . . . . . . . . . . . . . . . . . . . . . . . . . . . . . . . . . . . . . . 24
Information for investors in the Republic of Austria . . . . . . . . . . . . . . . . . . . . 25
1
Allianz InformationstechnologieActivity report
Allianz Informationstechnologie (Feeder Fund) invests at least 95% of its assets in Allianz Global Hi-Tech Growth (Master Fund). The latter fund invests in global equity markets, primarily in the IT sector. Its investment objective is to generate capital growth over the long term. The de facto aim is to invest the Feeder Fund as fully as possible in the Master Fund and participate in its performance.
During the year under review ending in December 2015, the Master Fund almost exclusively invested in American IT providers. Holdings in traditional providers of computer hardware and software were represented in addition to holdings in leading social network operators, online trading portals and other web-based service providers. Selective positions were also held in IT companies from France and the Far East. Stock-picking was based on an analytical process that takes into account the fundamental quality of the business model and factors such as growth potential, ongoing revenue inflows and relative valuation.
With its investment policy, the Master Fund obtained a substantial gain in euro terms which was correspondingly reproduced by Allianz Informationstechnologie. The absolute result was due in large part to the appreciation of the US dollar against the euro, as the prices of the US technology companies which dominate the Master Fund increased only moderately in local currency. Some active positions in the portfolio showed comparatively weak development, which meant that the investment result was below the average of the replicated equity market segment in consideration of ongoing costs.
The performance, which was calculated according to the BVI method, amounted to 10.11% during the reporting period.
In order to quantify the market price risks achieved during the reporting year, the Company calculates the volatility of the value of the fund units during this period. The calculated volatility is compared to the volatility of a global mixed equity/bond index portfolio. If the achieved volatility of the fund is significantly higher than that of the index portfolio, the market price risk of the fund is classified as “high”. If the volatility of the fund is similar to that of the index portfolio, the risk is classified as “medium”. And if the fund’s volatility is considerably lower than that of the index portfolio, the market price risk is classified as “low”.
The fund Allianz Informationstechnologie (from 15 November 2013 via its Master AGIF - Allianz Global Hi-Tech Growth) achieved a high market price risk during the reporting period.
Any effects which the exchange-rate movements of a foreign currency versus the fund’s base currency may have had on the fund’s value are assessed on the basis of the extent to which the fund had invested in assets denominated in foreign currencies during the reporting year, including any hedging transactions.
During the reporting period, a small proportion of the fund Allianz Informationstechnologie (from 15 November 2013 via its Master AGIF - Allianz Global Hi-Tech Growth) was invested in assets whose value is directly affected by movements of the foreign currency versus the fund’s base currency.
The liquidity risks taken by the fund during the reporting period are assessed according to the proportion of assets which may not be easy to sell or which may possibly be sold only at a lower price.
The fund Allianz Informationstechnologie (from 15 November 2013 via its Master AGIF - Allianz Global Hi-Tech Growth) was subject to a very low liquidity risk during the reporting period.
In order to quantify the risks of settlement default taken during the reporting period the Company analyses the proportion of assets for which a default risk exists and their default potential. If a considerable proportion of the fund’s money was invested in assets with a high default risk and high default potential, the fund’s risk of settlement default is classified as “high”. If the proportion of assets with a high default risk was moderate or if the default potential is medium, the risk is classified as “medium”. If the fund invested only a small proportion in assets with a high default risk or if the default potential was low, the risk of settlement default is classified as “low”.
During the reporting period, the fund Allianz Informationstechnologie (from 15 November 2013 via its Master AGIF - Allianz Global Hi-Tech Growth) had invested a small proportion of its money in assets with a high default risk.
In order to assess the operational risks of the Company’s procedures, the Company conducts detailed risk assessments for relevant processes identified by a risk-oriented overview, identifies weaknesses and defines measures to remedy these weaknesses. If clearly defined services are outsourced to external suppliers, the Company monitors these suppliers by regular quality controls and reviews. Any operational risk events identified are immediately remedied, recorded, analysed and prevention measures are defined. If an operational risk event affects the fund, any relevant losses will be compensated by the Company on principle.
2
Allianz Informationstechnologie
While, during the reporting period, the fund Allianz Informationstechnologie (from 15 November 2013 via its Master AGIF - Allianz Global Hi-Tech Growth) was basically subject to operational risks stemming from the Company’s procedures, it was not subject to elevated operative risks.
The main sources of the performance during the reporting period are as follows:
The gains realised result mainly from the sale of investment certificates.
Losses were also made primarily from the disposal of investment certificates.
Please see the Key Investor Information Document and the prospectus for more information on the Fund’s investment focus and objectives.
The prospectus, the management regulations, the key investor information and the respective annual and semi-annual reports of the Master fund may be obtained free of charge from the management company, the custodian bank or any paying and information agent of the Master fund.
Management company for the Master fund:
Allianz Global Investors GmbH - Luxembourg Branch6A, route de TrèvesL-2633 Senningerberg
Custodian for the Master fund:
State Street Bank Luxembourg S.C.A.49, Avenue J.F. KennedyL-1855 Luxembourg
In addition, the annual and semi-annual reports are available electronically from the website at www.allianzglobalinvestors.de.
3
Allianz Informationstechnologie
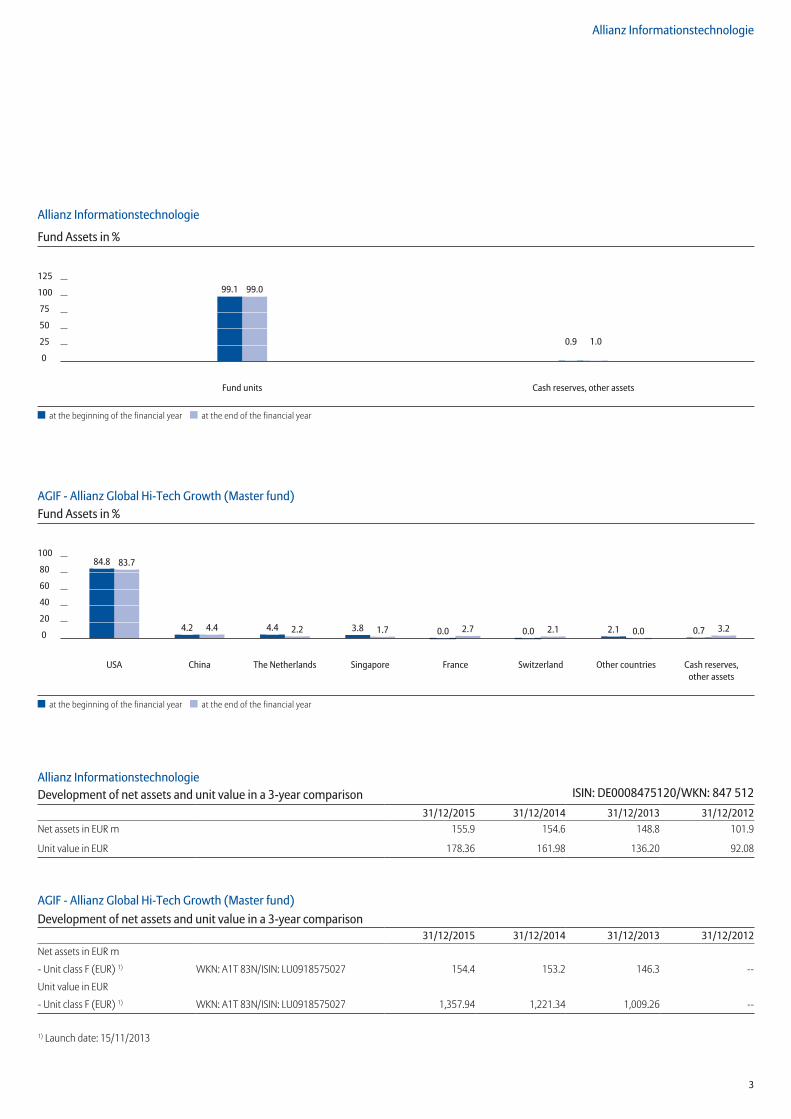
Allianz Informationstechnologie
Fund Assets in %
125
100
75
50
25
0
Fund units Cash reserves, other assets
at the beginning of the financial year at the end of the financial year
99 .1 99 .0
0 .9 1 .0
AGIF - Allianz Global Hi-Tech Growth (Master fund)Fund Assets in %
100
80
60
40
20
0
USA China The Netherlands Singapore France Switzerland Other countries Cash reserves, other assets
at the beginning of the financial year at the end of the financial year
84 .8 83 .7
4 .2 4 .4 4 .4 2 .2 3 .8 1 .7 0 .0 2 .7 0 .0 2 .1 2 .1 0 .0 0 .7 3 .2
Allianz InformationstechnologieDevelopment of net assets and unit value in a 3-year comparison ISIN: DE0008475120/WKN: 847 512
31/12/2015 31/12/2014 31/12/2013 31/12/2012Net assets in EUR m 155.9 154.6 148.8 101.9
Unit value in EUR 178.36 161.98 136.20 92.08
AGIF - Allianz Global Hi-Tech Growth (Master fund)Development of net assets and unit value in a 3-year comparison
31/12/2015 31/12/2014 31/12/2013 31/12/2012Net assets in EUR m
- Unit class F (EUR) 1) WKN: A1T 83N/ISIN: LU0918575027 154.4 153.2 146.3 --
Unit value in EUR
- Unit class F (EUR) 1) WKN: A1T 83N/ISIN: LU0918575027 1,357.94 1,221.34 1,009.26 --
1) Launch date: 15/11/2013
4
Allianz Informationstechnologie
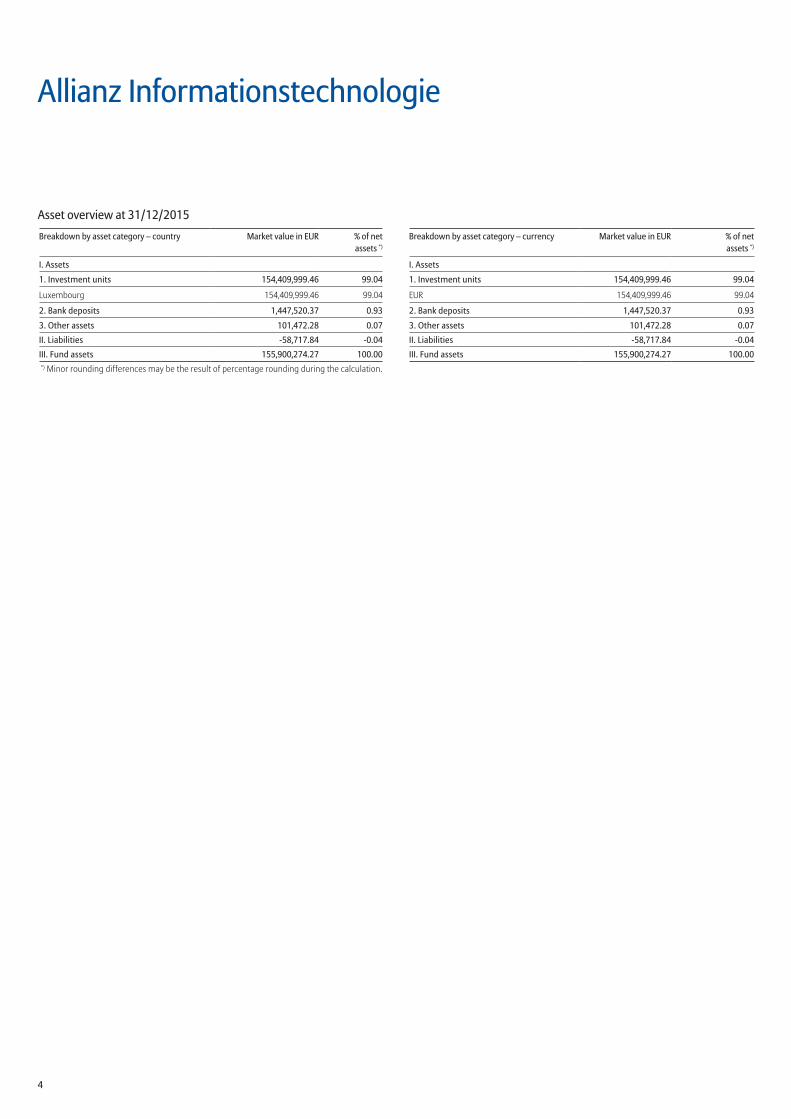
Asset overview at 31/12/2015
Breakdown by asset category – country Market value in EUR % of netassets *)
I . Assets
1 . Investment units 154,409,999 .46 99 .04
Luxembourg 154,409,999.46 99.04
2 . Bank deposits 1,447,520 .37 0 .93
3 . Other assets 101,472 .28 0 .07II . Liabilities -58,717 .84 -0 .04III . Fund assets 155,900,274 .27 100 .00*) Minor rounding differences may be the result of percentage rounding during the calculation.
Breakdown by asset category – currency Market value in EUR % of netassets *)
I . Assets
1 . Investment units 154,409,999 .46 99 .04
EUR 154,409,999.46 99.04
2 . Bank deposits 1,447,520 .37 0 .93
3 . Other assets 101,472 .28 0 .07II . Liabilities -58,717 .84 -0 .04III . Fund assets 155,900,274 .27 100 .00
5
AGIF - Allianz Global Hi-Tech Growth (Master fund)
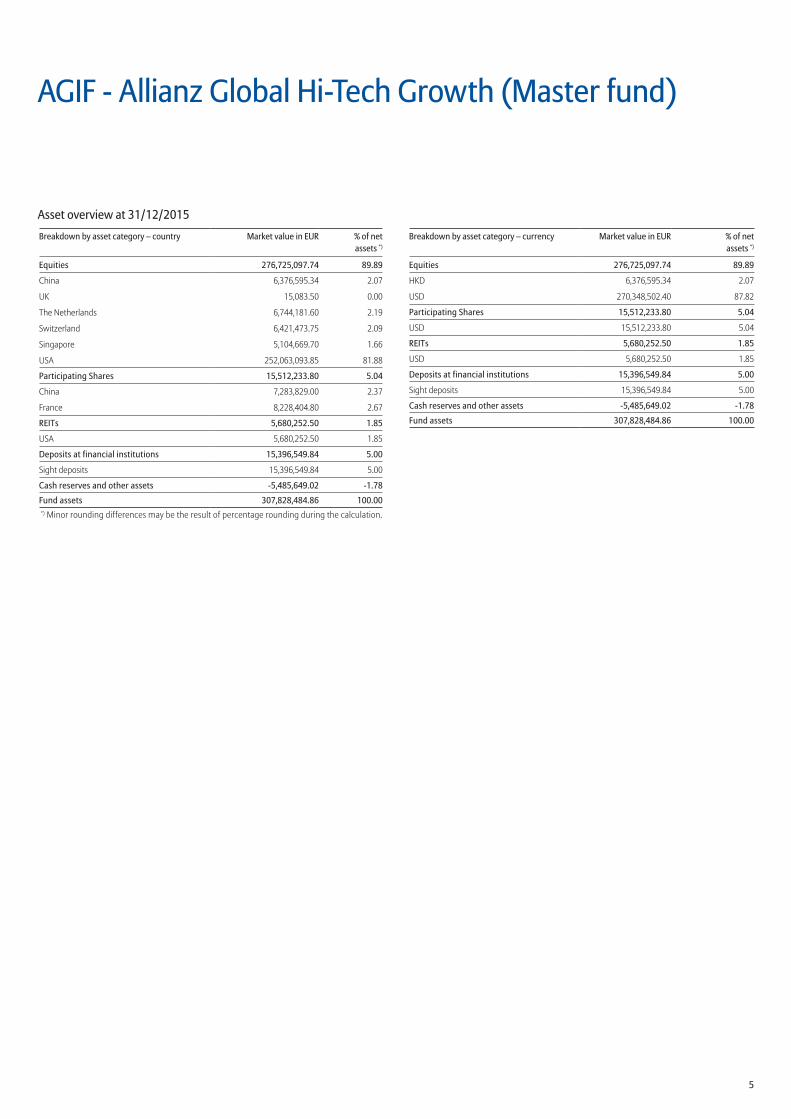
Asset overview at 31/12/2015
Breakdown by asset category – country Market value in EUR % of netassets *)
Equities 276,725,097 .74 89 .89
China 6,376,595.34 2.07
UK 15,083.50 0.00
The Netherlands 6,744,181.60 2.19
Switzerland 6,421,473.75 2.09
Singapore 5,104,669.70 1.66
USA 252,063,093.85 81.88
Participating Shares 15,512,233 .80 5 .04
China 7,283,829.00 2.37
France 8,228,404.80 2.67
REITs 5,680,252 .50 1 .85
USA 5,680,252.50 1.85
Deposits at financial institutions 15,396,549 .84 5 .00
Sight deposits 15,396,549.84 5.00
Cash reserves and other assets -5,485,649 .02 -1 .78
Fund assets 307,828,484 .86 100 .00*) Minor rounding differences may be the result of percentage rounding during the calculation.
Breakdown by asset category – currency Market value in EUR % of netassets *)
Equities 276,725,097 .74 89 .89
HKD 6,376,595.34 2.07
USD 270,348,502.40 87.82
Participating Shares 15,512,233 .80 5 .04
USD 15,512,233.80 5.04
REITs 5,680,252 .50 1 .85
USD 5,680,252.50 1.85
Deposits at financial institutions 15,396,549 .84 5 .00
Sight deposits 15,396,549.84 5.00
Cash reserves and other assets -5,485,649 .02 -1 .78
Fund assets 307,828,484 .86 100 .00

6
Allianz Informationstechnologie
Investment portfolio at 31/12/2015ISIN Securities Market Shares/ Balance Purchases Redemptions Price Market value % of net
Units/ 31/12/2015 EUR assetsCurrency in the period under review
Securities fund units 154,409,999 .46 99 .04Group investment fund units 154,409,999 .46 99 .04LU0918575027 AGIF-All.Gbl Hi-Te. Growth Inhaber Anteile F UNT 113,709 70,728 82,458 EUR 1,357.940 154,409,999.46 99.04Total securities EUR 154,409,999 .46 99 .04Bank deposits, money market paper and money market fundsBank depositsEUR deposits with custodial office
BNP PARIBAS Securities Services S.C.A. EUR 1,447,520.37 % 100.000 1,447,520.37 0.93Total bank deposits EUR 1,447,520 .37 0 .93Total bank deposits, money market paper and money market funds EUR 1,447,520 .37 0 .93Other assets
Receivables from unit transactions EUR 4,410.75 4,410.75 0.00Receivables from securities transactions EUR 72,513.25 72,513.25 0.05Receivables from withholding tax refunds EUR 24,548.28 24,548.28 0.02
Total other assets EUR 101,472 .28 0 .07Other payables
Liabilities from unit transactions EUR -58,717.84 -58,717.84 -0.04Total other payables EUR -58,717 .84 -0 .04Fund assets EUR 155,900,274 .27 100 .00
Units in circulation SHS 874,075Unit value EUR 178.36Fund assets invested in securities (in %) 99.04Fund assets invested in derivatives (in %) 0.00
7
Allianz Informationstechnologie
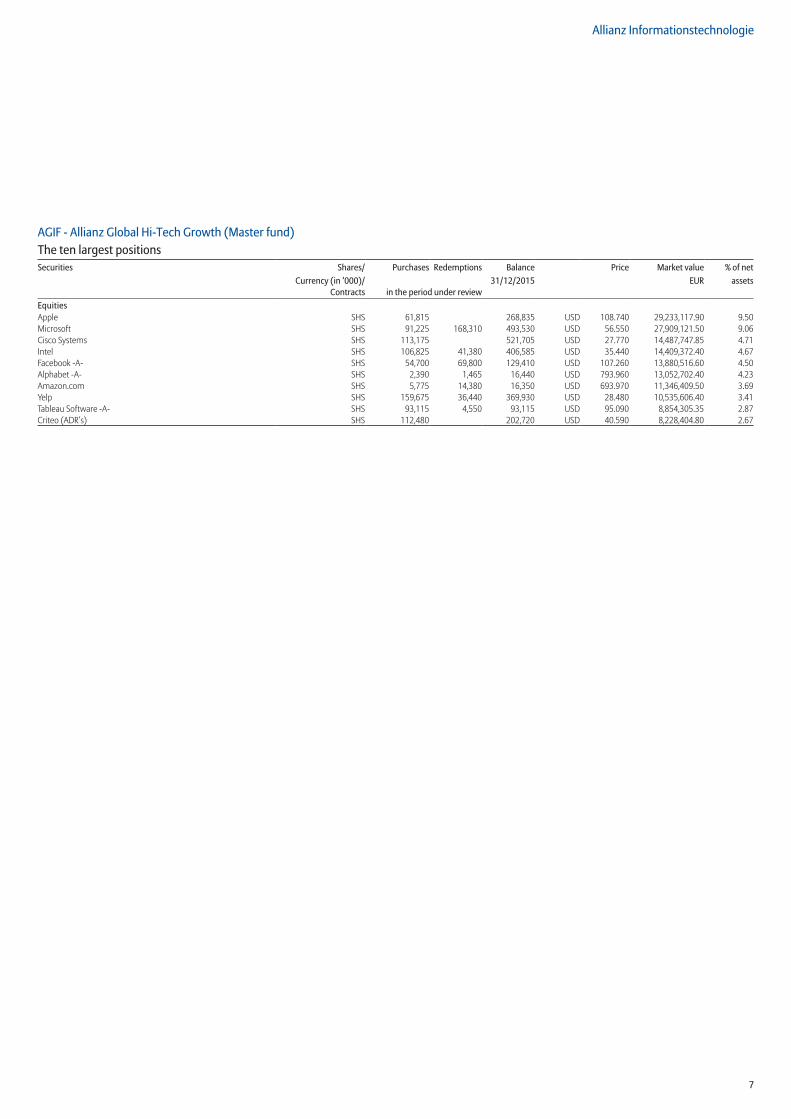
AGIF - Allianz Global Hi-Tech Growth (Master fund)The ten largest positionsSecurities Shares/ Purchases Redemptions Balance Price Market value % of net
Currency (in ‘000)/ 31/12/2015 EUR assets Contracts in the period under review
EquitiesApple SHS 61,815 268,835 USD 108.740 29,233,117.90 9.50Microsoft SHS 91,225 168,310 493,530 USD 56.550 27,909,121.50 9.06Cisco Systems SHS 113,175 521,705 USD 27.770 14,487,747.85 4.71Intel SHS 106,825 41,380 406,585 USD 35.440 14,409,372.40 4.67Facebook -A- SHS 54,700 69,800 129,410 USD 107.260 13,880,516.60 4.50Alphabet -A- SHS 2,390 1,465 16,440 USD 793.960 13,052,702.40 4.23Amazon.com SHS 5,775 14,380 16,350 USD 693.970 11,346,409.50 3.69Yelp SHS 159,675 36,440 369,930 USD 28.480 10,535,606.40 3.41Tableau Software -A- SHS 93,115 4,550 93,115 USD 95.090 8,854,305.35 2.87Criteo (ADR’s) SHS 112,480 202,720 USD 40.590 8,228,404.80 2.67

8
Allianz Informationstechnologie
Allianz Informationstechnologie A (EUR)ISIN DE0008475120
Fund assets 155,900,274.27
Units in circulation 874,075
Unit value 178.36
Allianz Global Hi-Tech Growth F (EUR)ISIN LU0918575027
Fund assets 154,409,999.46
Units in circulation 113,709.000
Unit value 1,357.94
9
Allianz Informationstechnologie
Securities prices/market ratesFund assets were valued on the basis of the following prices/market rates:
All assets: prices/market rates as at 30/12/2015 or last known
Capital measures
All sales revenues resulting from capital measures (technical revenues) are reported as additions or disposals.

10
Allianz Informationstechnologie
Statement of Income and Expenditure(incl. income equalisation) for the period from 01/01/15 to 31/12/15
EUR EUR
I . Income
1. Interest from liquid investments in Germany 146.04
a) Positive deposit interest 150.06
b) Negative deposit interest -4.02
2. Income from fund units 647,455.79
3. Deduction of foreign withholding tax 11,387.73
a) Reimbursed foreign withholding tax dividends 11,387.73
4. Other income 5,004.12
Total income 663,993 .68
II . Expenses
1. Interest from loans -566.90
2. All-in fee1) -1,966,026.84
3. Other expenses -361.86
Total expenses -1,966,955 .60
III . Ordinary net income -1,302,961 .92IV . Sales transactions
1. Realised gains 17,831,888.76
2. Realised losses -11.35
Result from sales transactions 17,831,877 .41
V . Realised result for the financial year 16,528,915 .49
1. Net change in unrealised gains -1,673,146.10
2. Net change in unrealised losses 0.00
VI . Unrealised result for the financial year -1,673,146 .10
VII . Result for the financial year 14,855,769 .391) Under the Terms and Conditions, an all-in fee of up to 1.80% p.a. (in the financial year 1.80%p.a.) is payable to the investment management company on behalf of the fund. The expensesmet by the investment management company from this fee included the expenses for portfolio management and the custodian charges (in the financial year 0.011% p.a.) as well as other third party payments (e.g. printing and publication expenses, audit fees, etc.).
Statement of Changes in Net Assets 2015EUR EUR
I . Value of the fund at beginning of financial year 154,629,628 .75
1. Inflows (net) -13,617,702.35
a) Subscriptions 42,036,161.41
b) Redemptions -55,653,863.76
2. Income equalisation/Expense equalisation 32,578.48
3. Result for the financial year 14,855,769.39
of which net change in unrealised gains -1,673,146.10
of which net change in unrealised losses 0.00
II . Value of the fund at end of financial year 155,900,274 .27
Allocation of the fund’s incomeCalculation of distribution total EUR per unit EUR*)
I . Available for distribution
1. Balance carried forward from previous year 19,119,226.21 21.87
2. Realised result for the financial year 16,528,915.49 18.91
3. Transfers from the fund 0.00 0.00
II . Not used for distribution
1. Retained for reinvestment -12,263,100.56 -14.03
2. Balance carried forward -23,385,041.14 -26.75
III . Gross distribution 0 .00 0 .00
1. Interim distribution 0.00 0.00
2. Final distribution 0.00 0.00
Units in circulation as at 31/12/2015: 874,075 *) Unit values may be subject to rounding differences.
Performance of the fund%
1 year 31/12/2014 - 31/12/2015 10 .11
2 years 31/12/2013 - 31/12/2015 30 .95
3 years 31/12/2012 - 31/12/2015 93 .70
4 years 31/12/2011 - 31/12/2015 119 .90
5 years 31/12/2010 - 31/12/2015 105 .01
10 years 31/12/2005 - 31/12/2015 102 .75
Calculation basis: net asset value per unit (front-end loads excluded), distributions – if any – reinvested. Calculation in accordance with the BVI method (German Investment and Asset Management Association). Past figures are not a guarantee of future performance.
Performance of the AGIF - Allianz Global Hi-Tech Growth F (EUR)%
1 year 31/12/2014 - 31/12/2015 11,67
2 years 31/12/2013 - 31/12/2015 35,33
Since launch 15/11/2013 - 31/12/2015 36,58
Calculation basis: net asset value per unit (front-end loads excluded), distributions – if any – reinvested. Calculation in accordance with the BVI method (German Investment and Asset Management Association). Past figures are not a guarantee of future performance.Past performance does not provide any indication of current or future performance. Performance figures do not take any account of commissions and costs incurred upon subscription or redemption of units.
11
Allianz Informationstechnologie
Unit classes
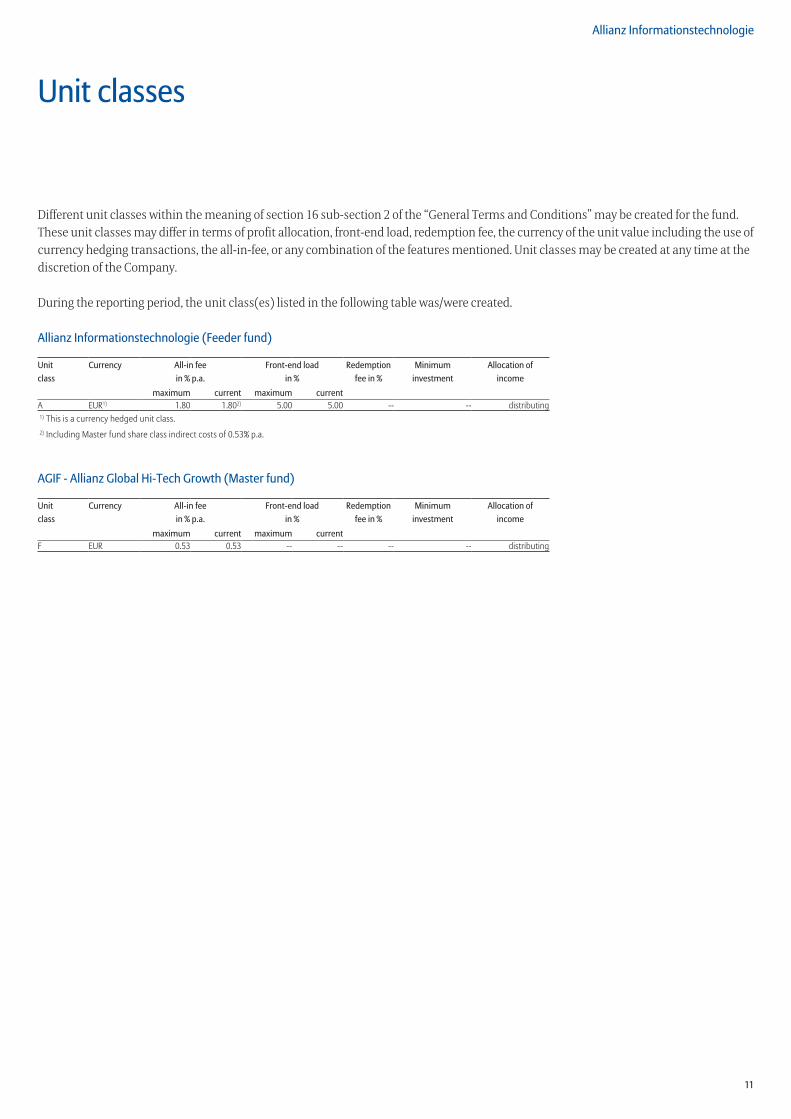
Different unit classes within the meaning of section 16 sub-section 2 of the “General Terms and Conditions” may be created for the fund. These unit classes may differ in terms of profit allocation, front-end load, redemption fee, the currency of the unit value including the use of currency hedging transactions, the all-in-fee, or any combination of the features mentioned. Unit classes may be created at any time at the discretion of the Company.
During the reporting period, the unit class(es) listed in the following table was/were created.
Allianz Informationstechnologie (Feeder fund)
Unit Currency All-in fee Front-end load Redemption Minimum Allocation ofclass in % p .a . in % fee in % investment income
maximum current maximum currentA EUR1) 1.80 1.802) 5.00 5.00 -- -- distributing1) This is a currency hedged unit class.2) Including Master fund share class indirect costs of 0.53% p.a.
AGIF - Allianz Global Hi-Tech Growth (Master fund)
Unit Currency All-in fee Front-end load Redemption Minimum Allocation ofclass in % p .a . in % fee in % investment income
maximum current maximum currentF EUR 0.53 0.53 -- -- -- -- distributing
12
Allianz Informationstechnologie
Annex
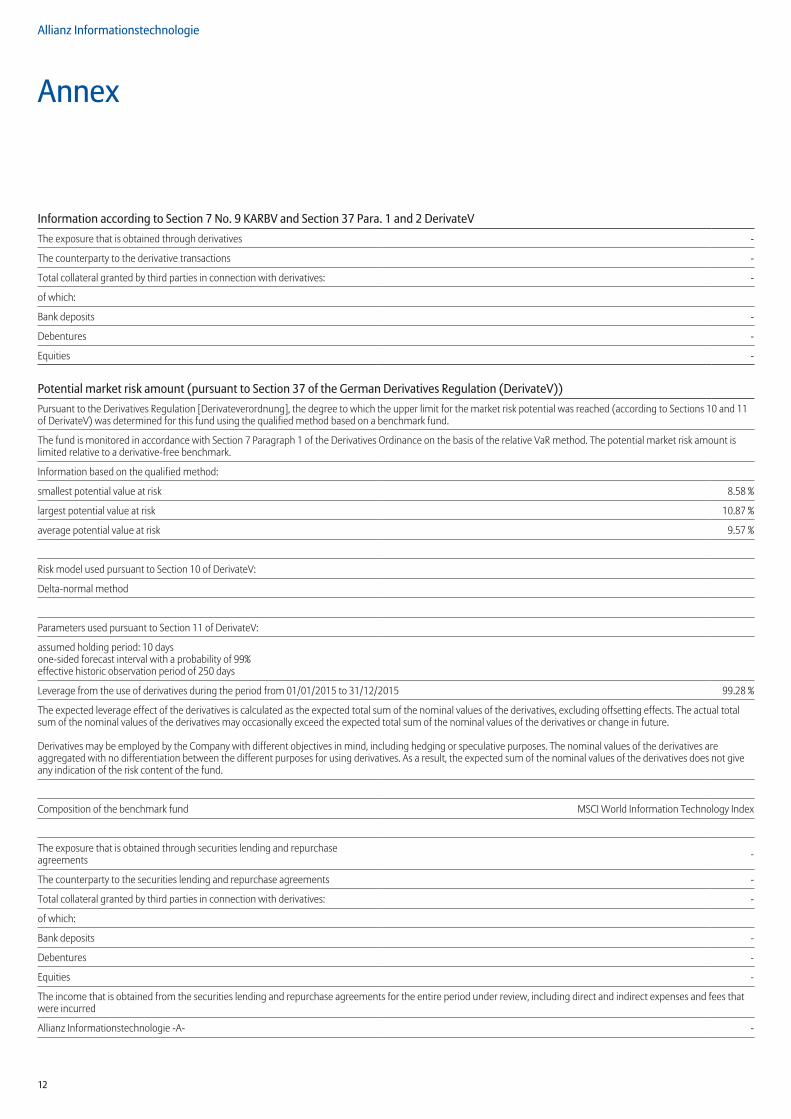
Information according to Section 7 No . 9 KARBV and Section 37 Para . 1 and 2 DerivateVThe exposure that is obtained through derivatives -
The counterparty to the derivative transactions -
Total collateral granted by third parties in connection with derivatives: -
of which:
Bank deposits -
Debentures -
Equities -
Potential market risk amount (pursuant to Section 37 of the German Derivatives Regulation (DerivateV))Pursuant to the Derivatives Regulation [Derivateverordnung], the degree to which the upper limit for the market risk potential was reached (according to Sections 10 and 11 of DerivateV) was determined for this fund using the qualified method based on a benchmark fund.
The fund is monitored in accordance with Section 7 Paragraph 1 of the Derivatives Ordinance on the basis of the relative VaR method. The potential market risk amount is limited relative to a derivative-free benchmark.
Information based on the qualified method:
smallest potential value at risk 8.58 %
largest potential value at risk 10.87 %
average potential value at risk 9.57 %
Risk model used pursuant to Section 10 of DerivateV:
Delta-normal method
Parameters used pursuant to Section 11 of DerivateV:
assumed holding period: 10 daysone-sided forecast interval with a probability of 99%effective historic observation period of 250 days
Leverage from the use of derivatives during the period from 01/01/2015 to 31/12/2015 99.28 %
The expected leverage effect of the derivatives is calculated as the expected total sum of the nominal values of the derivatives, excluding offsetting effects. The actual total sum of the nominal values of the derivatives may occasionally exceed the expected total sum of the nominal values of the derivatives or change in future.
Derivatives may be employed by the Company with different objectives in mind, including hedging or speculative purposes. The nominal values of the derivatives are aggregated with no differentiation between the different purposes for using derivatives. As a result, the expected sum of the nominal values of the derivatives does not give any indication of the risk content of the fund.
Composition of the benchmark fund MSCI World Information Technology Index
The exposure that is obtained through securities lending and repurchase agreements -
The counterparty to the securities lending and repurchase agreements -
Total collateral granted by third parties in connection with derivatives: -
of which:
Bank deposits -
Debentures -
Equities -
The income that is obtained from the securities lending and repurchase agreements for the entire period under review, including direct and indirect expenses and fees that were incurred
Allianz Informationstechnologie -A- -

13
Allianz Informationstechnologie
Other informationNet asset value
Allianz Informationstechnologie -A- EUR 178.36
Units in circulation
Allianz Informationstechnologie -A- 874,075
Information on the procedures for valuing assetsThe valuation is conducted by the investment management company (IMC).
Equities, subscription rights, exchange-traded funds (ETFs), participation certificates, bonds and exchange-traded derivatives are valued at their market price, provided
that a market price is available.
Bonds for which no market price is available are valued at validated broker prices or with the help of regularly reviewed models on the basis of relevant market
information.
Participation certificates for which no market prices are available are valued at the mean of the bid-ask spread.
Derivatives and subscription rights which are not traded on the market are valued with the help of regularly reviewed models on the basis of relevant market
information.
Investment fund units are valued at the redemption price published by the relevant investment company.
Bank deposits and other assets are valued at their nominal value, term deposits at their current value and liabilities at the repayment value.
Unlisted equities and shareholdings are valued at the current value, which is carefully determined with the help of suitable valuation models, taking account of the
current market situation.
Of the investments reported in this annual report, 99.04% are fund assets valued at stock market trading prices or market prices and 0.00% at imputed current market
values and/or verified brokers‘ quotations. The remaining 0.96% of fund assets consists of other assets, other liabilities and cash.

14
Allianz Informationstechnologie
Information on transparency and on the total expense ratio (TER)Total Expense Ratio (TER) (synthetic)
Allianz Informationstechnologie -A- 1.82 %
The total expense ratio (TER) is a measurement that compares the total expenses incurred by the fund to fund assets. The following costs are considered: the all-in-fee and, if applicable, additional costs incurred, except for the transaction costs incurred in the fund, interest on borrowing and any performance-related fees. Costs incurred will not be subject to cost compensation. Because the fund can invest more than 10% of its assets in other investment funds (“target funds”), additional costs may be incurred in connection with the target funds; these are taken into account on a pro-rata basis when calculating the TER. The total of the expenses incurred in the indicated time frame is divided by the average fund assets. The resulting percentage is the TER. The calculation complies with the method recommended in CESR Guideline 10-674 in conjunction with EU Commission Regulation 583/2010.
Performance-related compensation as a % of average net asset value
Allianz Informationstechnologie -A- -
All-in fees paid to the management company or third parties
Allianz Informationstechnologie -A- EUR 1,966,026.84
The Company does not receive any reimbursements for the fees and expenses paid to the custodial office or to any third parties and charged to the relevant fund.
Allianz Informationstechnologie -A-
During the reporting period the Company paid more than 10% of the received management fees of the fund to distributors of units in the fund on the basis of units distributed.
Front-end loads and redemption fees that the investment fund has charged for the subscription and redemption of units -
Management fee rate for investment units held in the fund
AGIF-All.Gbl Hi-Te. Growth Inhaber Anteile F 0.530 % p.a.
Other significant income and other expensesOther income Income from class action EUR 5,004.12
Other expenses Fees for withholding tax refund EUR -361.86
Total transaction costs for the financial year (incl. transaction costs on securities transactions (not included in the statement of income and expenditure))
Allianz Informationstechnologie -A- EUR 3,922.17
Explanation of net change
The net change in unrealised gains and losses is calculated by comparing the value of the assets included in the unit price with the respective historical costs each financial year; the amount of the positive differences is included in the total unrealised gains, the amount of the negative differences is included in the total unrealised losses, and the net changes are calculated by comparing total positions as at the end of the financial year with those at the beginning of the financial year.
15
Allianz Informationstechnologie
Ongoing Charges
The Ongoing Charges are costs incurred by the Subfunds (or the respective Share Classes) during the preceding financial year (excluding transaction costs) and are expressed as a ratio of the average volume of the Subfunds (or of the average volume of the respective Share Classes) (“Ongoing Charges”). In addition to the All-in-Fee, as well as the Taxe d’Abonnement, all other costs are considered except for the incurred transaction costs and any performance-related fees. Costs incurred will not be subject to cost compensation. If a Subfund invests more than 20 % of its assets in other UCITS or UCI that publish Ongoing Charges, the Ongoing Charges of these other UCITS or UCI are taken into consideration when calculating Ongoing Charges for the Subfund (synthetic); however, if these UCITS or UCI do not publish their own Ongoing Charges, then it is not possible to take the Ongoing Charges of the other UCITS or UCI into consideration when calculating Ongo-ing Charges. If a Subfund does not invest more than 20 % of its assets in other UCITS or UCI, any costs that may be incurred at the level of these UCITS or UCI are not taken into consideration.
Name of the fund Class Ongoing Charges
in % 1)
AGIF – Allianz Global Hi-Tech Growth 1) F (EUR) 0.541) for the period from 01/01/2015 to 31/12/2015.
Total fees [Section 173 (4) of the Investment Code (KAGB)]
In addition to the fee for managing the Feeder fund, fees and expenses are also charged for the shares of the Master fund held by the Feeder fund. The management company for the Master fund charges the following fees to the Feeder fund and, therefore, indirectly to its investors:
- All-in-fee (0.53% p.a.) for share class F (EUR) of the Master fund,- Taxe d‘abonnement (Luxembourg tax on the fund‘s assets of 0.01% p.a.),- Transaction costs, auditing costs and other expenses that may be charged to the Master fund.
Further information on fees may be found in the „Unit classes“ section on page 13.
16
Auditor’s Report
Frankfurt/Main, 18 April 2016
To Allianz Global Investors GmbH, Frankfurt/Main
Allianz Global Investors GmbH engaged us to audit the Annual Report of the Fund Allianz Informationstechnologie for the financial year from 1 January 2015 to 31 December 2015 pursuant to Section 102 of the Investment Code (KAGB).
Management’s Responsibility
As stipulated in the German Investment Code (KAGB), the preparation of the annual report is the responsibility of the legal representatives of the investment management company.
Auditor‘s Responsibility
Our responsibility is to express an opinion on the annual report based on our audit.
We conducted our audit in accordance with Section 102 KAGB and the generally accepted standards for the audit of financial statements promulgated by the German Institut der Wirtschaftsprüfer (Institute of Public Auditors in Germany) (IDW). Those standards require that we plan and perform the audit such that misstatements materially affecting the annual report are detected with reasonable assurance. Knowledge of the management of the investment fund and evaluations of possible misstatements are taken into account in the determination of audit procedures. The effectiveness of the accounting-related internal control system and the evidence supporting the annual report are examined primarily on a test basis within the framework of the audit. The audit includes assessing the
accounting principles used for the annual report and significant estimates made by the legal representatives of the Investment Management Company. We believe that our audit provides a reasonable basis for our opinion.
Opinion
In our opinion, based on the findings of our audit, the Annual Report for the financial year from 1 January 2015 to 31 December 2015 complies with the legal requirements.
Frankfurt/Main, 18 April 2016
KPMG AGWirtschaftsprüfungsgesellschaft
Warnke SteinbrennerAuditor Auditor
1) Unsigned translation of the German auditor’s report.
Allianz Global Investors GmbHThe Board of Management

17
Determining the market risk and leverage effect
As part of the risk-management procedure the market risk of the Subfund is measured and limited either using the commitment or Value-at-Risk (VaR) approach (relative or absolute VaR) in accordance with Circular 11/512 issued by the Luxembourg Supervisory Authority. When determining the market risk of the Fund, the commitment approach takes into account the additional risk that is generated through the use of derivative financial
instruments. The VaR approach represents a statistical method for calculating the potential loss arising from value changes in the whole Subfund. The VaR calculation is generally based on the “Delta Normal” method (confidence level of 99 %, an assumed holding period of 10 days, data history of 260 days), otherwise the alternative calculation method is shown in the following table.
At the end of the reporting period, the following approach applied to the Fund for calculating the market risk:Name of the Subfund Approach Reference assets/absolute VaR limit
AGIF - Allianz Global Hi-Tech Growth1) relative VaR MSCI World Information Technology Index1) For the period from 1 January 2015 to 31 December 2015.
The minimum, maximum and average risk budget utilisation (RBU) of the Company in the period under review can be seen in the following table. For Subfunds using the relative value-at-risk (VaR) approach, the utilisation is reported in relation to the limit stipulated by the regulatory authorities (i.e. 2 times the VaR of the
defined benchmark). For funds using the absolute VaR approach, it is reported in relation to the absolute VaR limit indicated in the table above. The table also shows the average leverage effect of the Company in the period under review. The average leverage effect is calculated as the average sum of notionals of derivatives.
Average leverage Minimum Maximum Averageeffect in % RBU in % RBU in % RBU in %
AGIF - Allianz Global Hi-Tech Growth}1) 0.00 50.35 81.79 64.841) For the period from 1 January 2015 to 31 December 2015.

18
Allianz Informationstechnologie
Further information (not covered by the auditor’s certificate)
Engagement of sub-custodiansThe custodial office has transferred the custodial duties in general to the companies listed below (sub-custodians). The sub-custodians act either as intermediate custodians, sub-custodians or central custodians. The information refers to assets in the countries or markets indicated below:
Country or market Sub-custodian
ARGENTINA EUROCLEAR BANK S.A- Indirect via HSBC Bank Argentina S.A. for equities
AUSTRALIA BNP PARIBAS SECURITIES SERVICES S.C.A.
AUSTRIA BNP PARIBAS SECURITIES SERVICES S.C.A.
BAHRAIN HSBC BANK MIDDLE EAST LTD
BANGLADESH HONG KONG AND SHANGHAI BANKING CORP LIMITED
BELGIUM BNP PARIBAS SECURITIES SERVICES S.C.A.
BENIN STANDARD CHARTERED BANK CÔTE D’IVOIRE SA
BERMUDA BANK OF BERMUDA (HSBC Group)
BOSNIA AND HERZEGOVINA UNICREDIT BANK AUSTRIA AG VIENNA- Indirect via UniCredit Bank d.d., Sarajevo
BOTSWANA STANDARD CHARTERED BANK OF BOTSWANA LTD
BRAZIL BANCO BNP PARIBAS BRASIL SA
BULGARIA UNICREDIT BULBANK A.D.
BURKINA FASO STANDARD CHARTERED BANK CÔTE D’IVOIRE SA
CANADA ROYAL BANK OF CANANDA (INVESTOR & TREASURY SERVICES )
CHILE BANCO DE CHILE (CITIBANK N.A)
CHINA HSBC BANK (CHINA) COMPANY LIMITED
COLOMBIA BNP PARIBAS SECURITIES SERVICES SOCIEDAD FIDUCIARIA BOGOTA
COSTA RICA BANCO BCT S.A.
CROATIA UNICREDIT BANK AUSTRIA AG VIENNA- Indirect via Zagrebacka Banka d.d., Zagreb
CYPRUS BNP PARIBAS SECURITIES SERVICES S.C.A.
CZECH REPUBLIC CITIBANK EUROPE PLC PRAGUE BRANCH
DENMARK NORDEA BANK DANMARK A/S
ECUADOR BANCO DE LA PRODUCCION SA-PRODUBANCO
EGYPT CITIBANK N.A. Egypt
ESTONIA AS SEB PANK
FINLAND NORDEA BANK FINLAND PLC
FRANCE BNP PARIBAS SECURITIES SERVICES S.C.A.
GERMANY BNP PARIBAS SECURITIES SERVICES S.C.A.
GHANA STANDARD CHARTERED BANK OF GHANA LTD
GREECE BNP PARIBAS SECURITIES SERVICES S.C.A.
GUINEA - BISSAU STANDARD CHARTERED BANK CÔTE D’IVOIRE SA
HONG KONG SAR BNP PARIBAS SECURITIES SERVICES S.C.A
HUNGARY BNP PARIBAS SECURITIES SERVICES S.C.A.
ICELAND ISLANDSBANKI
INDIA BNP PARIBAS
INDONESIA HONG KONG AND SHANGHAI BANKING CORP LIMITED, JAKARTA
INTERNATIONAL CSD CLEARSTREAM BANKING SA
INTERNATIONAL CSD EUROCLEAR BANK SA
IRELAND BNP PARIBAS SECURITIES SERVICES S.C.A.
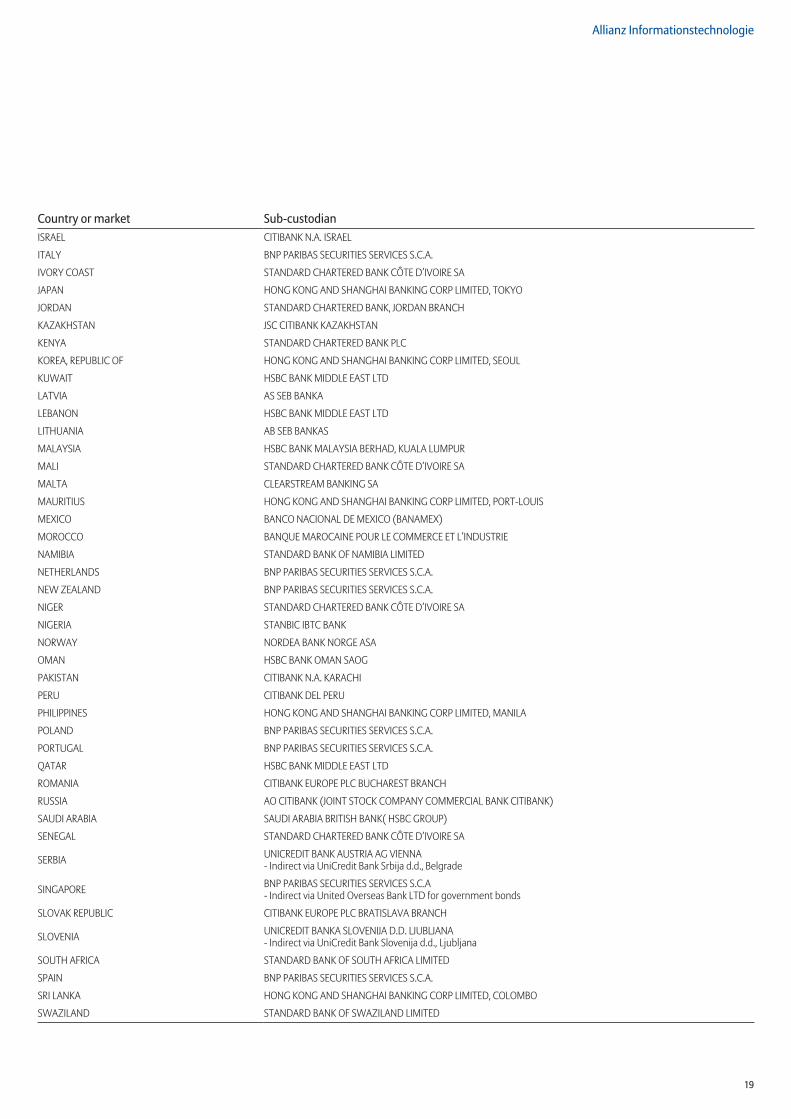
19
Allianz Informationstechnologie
Country or market Sub-custodianISRAEL CITIBANK N.A. ISRAEL
ITALY BNP PARIBAS SECURITIES SERVICES S.C.A.
IVORY COAST STANDARD CHARTERED BANK CÔTE D’IVOIRE SA
JAPAN HONG KONG AND SHANGHAI BANKING CORP LIMITED, TOKYO
JORDAN STANDARD CHARTERED BANK, JORDAN BRANCH
KAZAKHSTAN JSC CITIBANK KAZAKHSTAN
KENYA STANDARD CHARTERED BANK PLC
KOREA, REPUBLIC OF HONG KONG AND SHANGHAI BANKING CORP LIMITED, SEOUL
KUWAIT HSBC BANK MIDDLE EAST LTD
LATVIA AS SEB BANKA
LEBANON HSBC BANK MIDDLE EAST LTD
LITHUANIA AB SEB BANKAS
MALAYSIA HSBC BANK MALAYSIA BERHAD, KUALA LUMPUR
MALI STANDARD CHARTERED BANK CÔTE D’IVOIRE SA
MALTA CLEARSTREAM BANKING SA
MAURITIUS HONG KONG AND SHANGHAI BANKING CORP LIMITED, PORT-LOUIS
MEXICO BANCO NACIONAL DE MEXICO (BANAMEX)
MOROCCO BANQUE MAROCAINE POUR LE COMMERCE ET L’INDUSTRIE
NAMIBIA STANDARD BANK OF NAMIBIA LIMITED
NETHERLANDS BNP PARIBAS SECURITIES SERVICES S.C.A.
NEW ZEALAND BNP PARIBAS SECURITIES SERVICES S.C.A.
NIGER STANDARD CHARTERED BANK CÔTE D’IVOIRE SA
NIGERIA STANBIC IBTC BANK
NORWAY NORDEA BANK NORGE ASA
OMAN HSBC BANK OMAN SAOG
PAKISTAN CITIBANK N.A. KARACHI
PERU CITIBANK DEL PERU
PHILIPPINES HONG KONG AND SHANGHAI BANKING CORP LIMITED, MANILA
POLAND BNP PARIBAS SECURITIES SERVICES S.C.A.
PORTUGAL BNP PARIBAS SECURITIES SERVICES S.C.A.
QATAR HSBC BANK MIDDLE EAST LTD
ROMANIA CITIBANK EUROPE PLC BUCHAREST BRANCH
RUSSIA AO CITIBANK (JOINT STOCK COMPANY COMMERCIAL BANK CITIBANK)
SAUDI ARABIA SAUDI ARABIA BRITISH BANK( HSBC GROUP)
SENEGAL STANDARD CHARTERED BANK CÔTE D’IVOIRE SA
SERBIA UNICREDIT BANK AUSTRIA AG VIENNA- Indirect via UniCredit Bank Srbija d.d., Belgrade
SINGAPORE BNP PARIBAS SECURITIES SERVICES S.C.A- Indirect via United Overseas Bank LTD for government bonds
SLOVAK REPUBLIC CITIBANK EUROPE PLC BRATISLAVA BRANCH
SLOVENIA UNICREDIT BANKA SLOVENIJA D.D. LJUBLJANA- Indirect via UniCredit Bank Slovenija d.d., Ljubljana
SOUTH AFRICA STANDARD BANK OF SOUTH AFRICA LIMITED
SPAIN BNP PARIBAS SECURITIES SERVICES S.C.A.
SRI LANKA HONG KONG AND SHANGHAI BANKING CORP LIMITED, COLOMBO
SWAZILAND STANDARD BANK OF SWAZILAND LIMITED
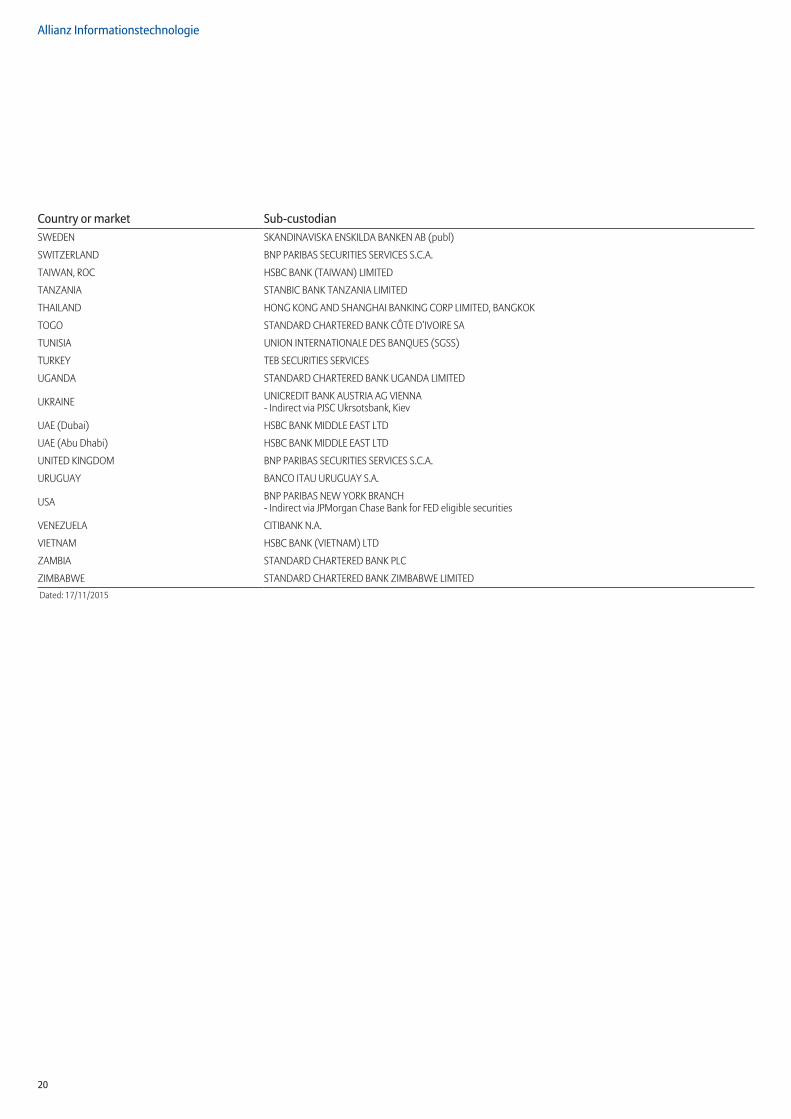
20
Allianz Informationstechnologie
Country or market Sub-custodianSWEDEN SKANDINAVISKA ENSKILDA BANKEN AB (publ)
SWITZERLAND BNP PARIBAS SECURITIES SERVICES S.C.A.
TAIWAN, ROC HSBC BANK (TAIWAN) LIMITED
TANZANIA STANBIC BANK TANZANIA LIMITED
THAILAND HONG KONG AND SHANGHAI BANKING CORP LIMITED, BANGKOK
TOGO STANDARD CHARTERED BANK CÔTE D’IVOIRE SA
TUNISIA UNION INTERNATIONALE DES BANQUES (SGSS)
TURKEY TEB SECURITIES SERVICES
UGANDA STANDARD CHARTERED BANK UGANDA LIMITED
UKRAINE UNICREDIT BANK AUSTRIA AG VIENNA- Indirect via PJSC Ukrsotsbank, Kiev
UAE (Dubai) HSBC BANK MIDDLE EAST LTD
UAE (Abu Dhabi) HSBC BANK MIDDLE EAST LTD
UNITED KINGDOM BNP PARIBAS SECURITIES SERVICES S.C.A.
URUGUAY BANCO ITAU URUGUAY S.A.
USA BNP PARIBAS NEW YORK BRANCH- Indirect via JPMorgan Chase Bank for FED eligible securities
VENEZUELA CITIBANK N.A.
VIETNAM HSBC BANK (VIETNAM) LTD
ZAMBIA STANDARD CHARTERED BANK PLC
ZIMBABWE STANDARD CHARTERED BANK ZIMBABWE LIMITEDDated: 17/11/2015

21

22

23

24
Further information (not covered by the auditor’s certificate)
Your PartnersAllianz Global Investors GmbHBockenheimer Landstraße 42-4460323 Frankfurt/Main
Customer Service CentreTelephone: +49 9281-72 20Fax: +49 9281-72 24 61 15
+49 9281-72 24 61 16E-Mail: [email protected]
Subscribed and paid up capital:EUR 49.9 million
Dated: 31 December 2014
ShareholderAllianz Asset Management AG
Munich
Supervisory BoardDr. Christian FinckhChief HR OfficerAllianz SEMunich
Stefan BaumjohannMember of the Works Council ofAllianz Global Investors GmbHFrankfurt/Main
Prof. Dr. Michael HütherChairman and Member of the Executive CommitteeInstitut der deutschen Wirtschaft Cologne
Angelika Leutz (until 28/02/2015)Member of the Works Council ofAllianz Global Investors GmbHFrankfurt/Main
Laure Poussin (since 01/03/2015)Member of the Works Council ofAllianz Global Investors GmbHSuccursale FrançaiseParis
Wolfgang PützMember of the Supervisory Board ofAllianz Global Investors GmbHFrankfurt/Main
Dr. Bettina Corves-WundererChief Financial OfficerAllianz S.p.A.Trieste
Board of ManagementElizabeth Corley (CEO)
Thorsten Heymann (since 01/03/2015)
Dr. Markus Kobler
Daniel Lehmann
George McKay (since 01/03/2015)
Michael Peters
Dr. Wolfram Peters
Tobias C. Pross
Andreas Utermann
CustodianBNP Paribas Securities Services S.C.A.Frankfurt/Main branchEuropa-Allee 1260327 Frankfurt/Main
Subscribed capital: EUR 165.28 millionAdditional surplus for tax purposes:EUR 127.93 millionDated: 31 December 2014
Special Order Placement OfficesFondsdepot Bank GmbHWindmühlenweg 1295030 Hof
RBC Investor Services Bank S.A. 14, Porte de France L-4360 Esch-sur-Alzette
Paying and information agent in AustriaAllianz Investmentbank AGHietzinger Kai 101–105A-1130 Vienna
Appointment of the Austrian Representative to the Tax Authorities in the Republic of AustriaThe following financial institution isappointed as local representative for tax purposes to provide proof of deemed distribution income within the meaning ofSection 186, Paragraph 2, Item 2 of theAustrian Investment Fund Act (InvFG):
Allianz Investmentbank AGHietzinger Kai 101–105A-1130 Vienna
AuditorKPMG AGWirtschaftsprüfungsgesellschaftFrankfurt/Main
The prospectus, the management regulations, the key investor information and the respective annual and semi-annual reports of the Master fund may be obtained free of charge from the management company, the custodian bank or any paying and information agent of the Master fund.Management company for the Master fund:
Allianz Global Investors GmbH - Luxembourg Branch6A, route de TrèvesL-2633 Senningerberg
Custodian for the Master fund:
State Street Bank Luxembourg S.C.A.49, Avenue J.F. KennedyL-1855 Luxembourg
In addition, the annual and semi-annual reports are available electronically from the website at www.allianzglobalinvestors.de.
Dated: 31 December 2015
Visit our website at www .allianzglobalinvestors .de

25
Further information (not covered by the auditor’s certificate)
Information for investors in the Republic of AustriaThe sale of units in the fund Allianz Informationstechnologie in the Republic of Austria has been registered with the Finanzmarktaufsicht (Vienna) in accordance with Section 140 of the Investment Fund Act (Investmentfondsgesetz – InvFG).
Redemption requests for units in the aforementioned fund can be submitted to the Austrian paying and information agent and the redemption proceeds, possible distributions and any other payments can be paid out to the unitholders by the Austrian paying and information agent, at their request, in euro cash.
Investors may obtain all necessary information from the Austrian payment and information agent for free, for example· the prospectus, · the investment terms and conditions,· the key investor information,· the annual and semi-annual reports,· the issue and redemption prices.
Prior to acquiring units of the fund, investors are recommended to ascertain whether the income data on the unit class that is required for tax purposes is published by the Oesterreichische Kontrollbank.

Allianz Global Investors GmbHBockenheimer Landstraße 42–4460323 Frankfurt/[email protected]

Annual Report31 December 2015
Allianz Europazins
Allianz Global Investors GmbH
An investment fund established under German law

This report is a non-binding translation of the German original excluding the tax information for investors resident in Germany.
Contents
Allianz Europazins
Activity report . . . . . . . . . . . . . . . . . . . . . . . . . . . . . . . . . . . . . . . . . . . . . . . . . . . . . 1
Asset overview at 31/12/2015 . . . . . . . . . . . . . . . . . . . . . . . . . . . . . . . . . . . . . . . 3
Investment portfolio at 31/12/2015 . . . . . . . . . . . . . . . . . . . . . . . . . . . . . . . . . . 4
Unit classes . . . . . . . . . . . . . . . . . . . . . . . . . . . . . . . . . . . . . . . . . . . . . . . . . . . . . . . . 13
Annex . . . . . . . . . . . . . . . . . . . . . . . . . . . . . . . . . . . . . . . . . . . . . . . . . . . . . . . . . . . . . 14
Auditor’s Report . . . . . . . . . . . . . . . . . . . . . . . . . . . . . . . . . . . . . . . . . . . . . . . . . . . . 17
Further information (not covered by the auditor’s certificate)
Engagement of sub-custodians . . . . . . . . . . . . . . . . . . . . . . . . . . . . . . . . . . . . . . 18
Your Partners . . . . . . . . . . . . . . . . . . . . . . . . . . . . . . . . . . . . . . . . . . . . . . . . . . . . . . 22
Information for investors in the Republic of Austria . . . . . . . . . . . . . . . . . . . . 23
Information for investors in Switzerland . . . . . . . . . . . . . . . . . . . . . . . . . . . . . . 24
1
Allianz EuropazinsActivity report
The Fund invests primarily in bonds denominated in European currencies. Securities acquired must have a good credit rating (investment-grade rating). The investment objective is a market-oriented return.
During the year under review ending in December 2015, the Fund’s securities portfolio continued to focus on government bonds, with their weighting significantly increased. Holdings of government securities from Germany and France were expanded in particular. The focus was also on Italian and Spanish issues which offered advantageous yields. Moreover, the Fund still held a position in British government bonds. Holdings in bank and industrial bonds, mortgage bonds and comparable covered bonds were significantly reduced. Bonds from emerging countries continued to be represented on a selective basis. Despite the reallocations, the average credit rating of the securities in the Fund was recently A+. The focus continued to be on the longer-term maturity segment in view of the very low level of short- and medium-term interest rates. The total duration of the portfolio remained largely stable on balance and was recently almost eight years. At currency level, the Fund’s weighting was almost identical to the broad European government bond market. Accordingly, in addition to core investments in euros, the Fund also included investments in Pound Sterling in particular.
With this investment policy the Fund obtained a solid gain. Returns on the European bond market were generally at a low level due to the continuing low interest rate policy of central banks. The positions in peripheral Eurozone countries produced slightly above-average results. By contrast, exposure to non-governmental securities did not produce any noteworthy contributions to the performance of the Fund. The inclusion of longer-term securities with somewhat higher returns than the investments in the short-term segment was beneficial on the whole. The appreciation of the Pound Sterling against the euro was also moderately beneficial for the Fund’s absolute performance. However, in consideration of the ongoing costs attributable to the Fund, no additional income remained compared to the replicated market segment.
The performance, which was calculated according to the BVI method, amounted to 1.91% during the reporting period.
In order to quantify the market price risks achieved during the reporting year, the Company calculates the volatility of the value of the fund units during this period. The calculated volatility is compared to the volatility of a global mixed equity/bond index portfolio. If the achieved volatility of the fund is significantly higher
than that of the index portfolio, the market price risk of the fund is classified as “high”. If the volatility of the fund is similar to that of the index portfolio, the risk is classified as “medium”. And if the fund’s volatility is considerably lower than that of the index portfolio, the market price risk is classified as “low”.
The fund Allianz Europazins achieved a low market price risk during the reporting period.
Any effects which the exchange-rate movements of a foreign currency versus the fund’s base currency may have had on the fund’s value are assessed on the basis of the extent to which the fund had invested in assets denominated in foreign currencies during the reporting year, including any hedging transactions.
During the reporting period, a moderate proportion of the fund Allianz Europazins was invested in assets whose value is directly affected by movements of the foreign currency versus the fund’s base currency.
The liquidity risks taken by the fund during the reporting period are assessed according to the proportion of assets which may not be easy to sell or which may possibly be sold only at a lower price.
The fund Allianz Europazins was subject to a low liquidity risk during the reporting period.
In order to quantify the risks of settlement default taken during the reporting period the Company analyses the proportion of assets for which a default risk exists and their default potential. If a considerable proportion of the fund’s money was invested in assets with a high default risk and high default potential, the fund’s risk of settlement default is classified as “high”. If the proportion of assets with a high default risk was moderate or if the default potential is medium, the risk is classified as “medium”. If the fund invested only a small proportion in assets with a high default risk or if the default potential was low, the risk of settlement default is classified as “low”.
During the reporting period, the fund Allianz Europazins had invested a moderate proportion of its money in assets with a high default risk.
In order to quantify the risk of interest-rate changes taken during the reporting year, the Company calculates the fund’s sensitivity to changes in the current rate level (via the duration-weighted proportion of rate-sensitive positions). If the fund shows a
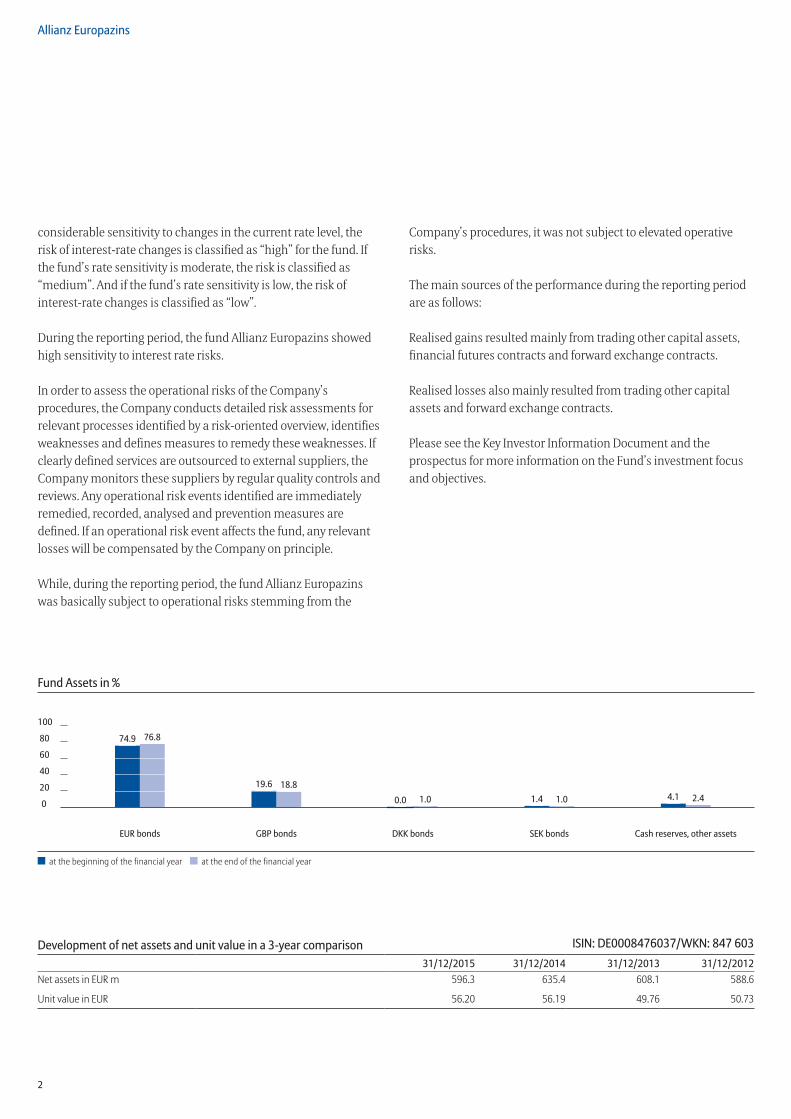
2
Allianz Europazins
considerable sensitivity to changes in the current rate level, the risk of interest-rate changes is classified as “high” for the fund. If the fund’s rate sensitivity is moderate, the risk is classified as “medium”. And if the fund’s rate sensitivity is low, the risk of interest-rate changes is classified as “low”.
During the reporting period, the fund Allianz Europazins showed high sensitivity to interest rate risks.
In order to assess the operational risks of the Company’s procedures, the Company conducts detailed risk assessments for relevant processes identified by a risk-oriented overview, identifies weaknesses and defines measures to remedy these weaknesses. If clearly defined services are outsourced to external suppliers, the Company monitors these suppliers by regular quality controls and reviews. Any operational risk events identified are immediately remedied, recorded, analysed and prevention measures are defined. If an operational risk event affects the fund, any relevant losses will be compensated by the Company on principle.
While, during the reporting period, the fund Allianz Europazins was basically subject to operational risks stemming from the
Company’s procedures, it was not subject to elevated operative risks.
The main sources of the performance during the reporting period are as follows:
Realised gains resulted mainly from trading other capital assets, financial futures contracts and forward exchange contracts.
Realised losses also mainly resulted from trading other capital assets and forward exchange contracts.
Please see the Key Investor Information Document and the prospectus for more information on the Fund’s investment focus and objectives.
Fund Assets in %
100
80
60
40
20
0
EUR bonds GBP bonds DKK bonds SEK bonds Cash reserves, other assets
at the beginning of the financial year at the end of the financial year
74 .9 76 .8
19 .6 18 .8
0 .0 1 .0 1 .4 1 .0 4 .1 2 .4
Development of net assets and unit value in a 3-year comparison ISIN: DE0008476037/WKN: 847 60331/12/2015 31/12/2014 31/12/2013 31/12/2012
Net assets in EUR m 596.3 635.4 608.1 588.6
Unit value in EUR 56.20 56.19 49.76 50.73

3
Allianz Europazins
Asset overview at 31/12/2015
Breakdown by asset category – country Market value in EUR % of netassets *)
I . Assets
1 . Bonds 582,202,403 .47 97 .62
Germany 48,797,471.41 8.18
France 56,883,199.56 9.55
The Netherlands 29,394,366.30 4.93
Italy 137,245,884.90 23.01
Ireland 10,121,928.00 1.70
Denmark 7,326,479.80 1.23
Portugal 3,118,050.00 0.52
Spain 93,497,729.07 15.67
Belgium 30,140,965.00 5.05
Luxembourg 6,014,231.25 1.01
Norway 1,807,092.00 0.30
Sweden 3,791,473.39 0.63
Finland 2,362,551.25 0.40
Austria 2,811,480.00 0.47
Turkey 1,580,092.50 0.26
UK 108,239,079.91 18.16
USA 7,106,192.85 1.18
Mexico 8,118,428.50 1.36
China 3,014,640.00 0.51
Japan 3,982,780.00 0.67
Australia 1,375,972.28 0.23
Others 15,472,315.50 2.60
2 . Derivatives -1,221,614 .50 -0 .20
3 . Bank deposits 9,290,824 .90 1 .56
4 . Other assets 6,398,024 .62 1 .08II . Liabilities -370,524 .05 -0 .06III . Fund assets 596,299,114 .44 100 .00*) Minor rounding differences may be the result of percentage rounding during the calculation.
Breakdown by asset category – currency Market value in EUR % of netassets *)
I . Assets
1 . Bonds 582,202,403 .47 97 .62
DKK 5,776,962.30 0.97
EUR 458,365,134.83 76.84
GBP 111,906,281.70 18.78
SEK 6,154,024.64 1.03
2 . Derivatives -1,221,614 .50 -0 .20
3 . Bank deposits 9,290,824 .90 1 .56
4 . Other assets 6,398,024 .62 1 .08II . Liabilities -370,524 .05 -0 .06III . Fund assets 596,299,114 .44 100 .00
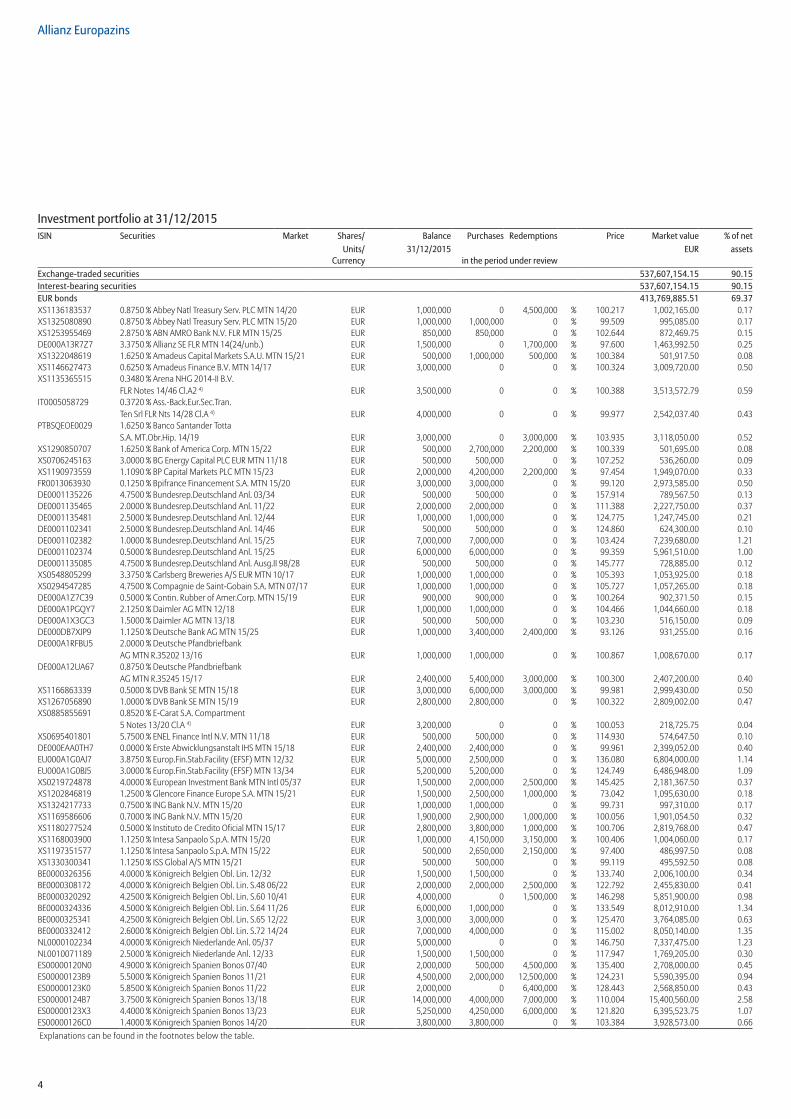
4
Allianz Europazins
Investment portfolio at 31/12/2015ISIN Securities Market Shares/ Balance Purchases Redemptions Price Market value % of net
Units/ 31/12/2015 EUR assetsCurrency in the period under review
Exchange-traded securities 537,607,154 .15 90 .15Interest-bearing securities 537,607,154 .15 90 .15EUR bonds 413,769,885 .51 69 .37XS1136183537 0.8750 % Abbey Natl Treasury Serv. PLC MTN 14/20 EUR 1,000,000 0 4,500,000 % 100.217 1,002,165.00 0.17XS1325080890 0.8750 % Abbey Natl Treasury Serv. PLC MTN 15/20 EUR 1,000,000 1,000,000 0 % 99.509 995,085.00 0.17XS1253955469 2.8750 % ABN AMRO Bank N.V. FLR MTN 15/25 EUR 850,000 850,000 0 % 102.644 872,469.75 0.15DE000A13R7Z7 3.3750 % Allianz SE FLR MTN 14(24/unb.) EUR 1,500,000 0 1,700,000 % 97.600 1,463,992.50 0.25XS1322048619 1.6250 % Amadeus Capital Markets S.A.U. MTN 15/21 EUR 500,000 1,000,000 500,000 % 100.384 501,917.50 0.08XS1146627473 0.6250 % Amadeus Finance B.V. MTN 14/17 EUR 3,000,000 0 0 % 100.324 3,009,720.00 0.50XS1135365515 0.3480 % Arena NHG 2014-II B.V.
FLR Notes 14/46 Cl.A2 4) EUR 3,500,000 0 0 % 100.388 3,513,572.79 0.59IT0005058729 0.3720 % Ass.-Back.Eur.Sec.Tran.
Ten Srl FLR Nts 14/28 Cl.A 4) EUR 4,000,000 0 0 % 99.977 2,542,037.40 0.43PTBSQEOE0029 1.6250 % Banco Santander Totta
S.A. MT.Obr.Hip. 14/19 EUR 3,000,000 0 3,000,000 % 103.935 3,118,050.00 0.52XS1290850707 1.6250 % Bank of America Corp. MTN 15/22 EUR 500,000 2,700,000 2,200,000 % 100.339 501,695.00 0.08XS0706245163 3.0000 % BG Energy Capital PLC EUR MTN 11/18 EUR 500,000 500,000 0 % 107.252 536,260.00 0.09XS1190973559 1.1090 % BP Capital Markets PLC MTN 15/23 EUR 2,000,000 4,200,000 2,200,000 % 97.454 1,949,070.00 0.33FR0013063930 0.1250 % Bpifrance Financement S.A. MTN 15/20 EUR 3,000,000 3,000,000 0 % 99.120 2,973,585.00 0.50DE0001135226 4.7500 % Bundesrep.Deutschland Anl. 03/34 EUR 500,000 500,000 0 % 157.914 789,567.50 0.13DE0001135465 2.0000 % Bundesrep.Deutschland Anl. 11/22 EUR 2,000,000 2,000,000 0 % 111.388 2,227,750.00 0.37DE0001135481 2.5000 % Bundesrep.Deutschland Anl. 12/44 EUR 1,000,000 1,000,000 0 % 124.775 1,247,745.00 0.21DE0001102341 2.5000 % Bundesrep.Deutschland Anl. 14/46 EUR 500,000 500,000 0 % 124.860 624,300.00 0.10DE0001102382 1.0000 % Bundesrep.Deutschland Anl. 15/25 EUR 7,000,000 7,000,000 0 % 103.424 7,239,680.00 1.21DE0001102374 0.5000 % Bundesrep.Deutschland Anl. 15/25 EUR 6,000,000 6,000,000 0 % 99.359 5,961,510.00 1.00DE0001135085 4.7500 % Bundesrep.Deutschland Anl. Ausg.II 98/28 EUR 500,000 500,000 0 % 145.777 728,885.00 0.12XS0548805299 3.3750 % Carlsberg Breweries A/S EUR MTN 10/17 EUR 1,000,000 1,000,000 0 % 105.393 1,053,925.00 0.18XS0294547285 4.7500 % Compagnie de Saint-Gobain S.A. MTN 07/17 EUR 1,000,000 1,000,000 0 % 105.727 1,057,265.00 0.18DE000A1Z7C39 0.5000 % Contin. Rubber of Amer.Corp. MTN 15/19 EUR 900,000 900,000 0 % 100.264 902,371.50 0.15DE000A1PGQY7 2.1250 % Daimler AG MTN 12/18 EUR 1,000,000 1,000,000 0 % 104.466 1,044,660.00 0.18DE000A1X3GC3 1.5000 % Daimler AG MTN 13/18 EUR 500,000 500,000 0 % 103.230 516,150.00 0.09DE000DB7XJP9 1.1250 % Deutsche Bank AG MTN 15/25 EUR 1,000,000 3,400,000 2,400,000 % 93.126 931,255.00 0.16DE000A1RFBU5 2.0000 % Deutsche Pfandbriefbank
AG MTN R.35202 13/16 EUR 1,000,000 1,000,000 0 % 100.867 1,008,670.00 0.17DE000A12UA67 0.8750 % Deutsche Pfandbriefbank
AG MTN R.35245 15/17 EUR 2,400,000 5,400,000 3,000,000 % 100.300 2,407,200.00 0.40XS1166863339 0.5000 % DVB Bank SE MTN 15/18 EUR 3,000,000 6,000,000 3,000,000 % 99.981 2,999,430.00 0.50XS1267056890 1.0000 % DVB Bank SE MTN 15/19 EUR 2,800,000 2,800,000 0 % 100.322 2,809,002.00 0.47XS0885855691 0.8520 % E-Carat S.A. Compartment
5 Notes 13/20 Cl.A 4) EUR 3,200,000 0 0 % 100.053 218,725.75 0.04XS0695401801 5.7500 % ENEL Finance Intl N.V. MTN 11/18 EUR 500,000 500,000 0 % 114.930 574,647.50 0.10DE000EAA0TH7 0.0000 % Erste Abwicklungsanstalt IHS MTN 15/18 EUR 2,400,000 2,400,000 0 % 99.961 2,399,052.00 0.40EU000A1G0AJ7 3.8750 % Europ.Fin.Stab.Facility (EFSF) MTN 12/32 EUR 5,000,000 2,500,000 0 % 136.080 6,804,000.00 1.14EU000A1G0BJ5 3.0000 % Europ.Fin.Stab.Facility (EFSF) MTN 13/34 EUR 5,200,000 5,200,000 0 % 124.749 6,486,948.00 1.09XS0219724878 4.0000 % European Investment Bank MTN Intl 05/37 EUR 1,500,000 2,000,000 2,500,000 % 145.425 2,181,367.50 0.37XS1202846819 1.2500 % Glencore Finance Europe S.A. MTN 15/21 EUR 1,500,000 2,500,000 1,000,000 % 73.042 1,095,630.00 0.18XS1324217733 0.7500 % ING Bank N.V. MTN 15/20 EUR 1,000,000 1,000,000 0 % 99.731 997,310.00 0.17XS1169586606 0.7000 % ING Bank N.V. MTN 15/20 EUR 1,900,000 2,900,000 1,000,000 % 100.056 1,901,054.50 0.32XS1180277524 0.5000 % Instituto de Credito Oficial MTN 15/17 EUR 2,800,000 3,800,000 1,000,000 % 100.706 2,819,768.00 0.47XS1168003900 1.1250 % Intesa Sanpaolo S.p.A. MTN 15/20 EUR 1,000,000 4,150,000 3,150,000 % 100.406 1,004,060.00 0.17XS1197351577 1.1250 % Intesa Sanpaolo S.p.A. MTN 15/22 EUR 500,000 2,650,000 2,150,000 % 97.400 486,997.50 0.08XS1330300341 1.1250 % ISS Global A/S MTN 15/21 EUR 500,000 500,000 0 % 99.119 495,592.50 0.08BE0000326356 4.0000 % Königreich Belgien Obl. Lin. 12/32 EUR 1,500,000 1,500,000 0 % 133.740 2,006,100.00 0.34BE0000308172 4.0000 % Königreich Belgien Obl. Lin. S.48 06/22 EUR 2,000,000 2,000,000 2,500,000 % 122.792 2,455,830.00 0.41BE0000320292 4.2500 % Königreich Belgien Obl. Lin. S.60 10/41 EUR 4,000,000 0 1,500,000 % 146.298 5,851,900.00 0.98BE0000324336 4.5000 % Königreich Belgien Obl. Lin. S.64 11/26 EUR 6,000,000 1,000,000 0 % 133.549 8,012,910.00 1.34BE0000325341 4.2500 % Königreich Belgien Obl. Lin. S.65 12/22 EUR 3,000,000 3,000,000 0 % 125.470 3,764,085.00 0.63BE0000332412 2.6000 % Königreich Belgien Obl. Lin. S.72 14/24 EUR 7,000,000 4,000,000 0 % 115.002 8,050,140.00 1.35NL0000102234 4.0000 % Königreich Niederlande Anl. 05/37 EUR 5,000,000 0 0 % 146.750 7,337,475.00 1.23NL0010071189 2.5000 % Königreich Niederlande Anl. 12/33 EUR 1,500,000 1,500,000 0 % 117.947 1,769,205.00 0.30ES00000120N0 4.9000 % Königreich Spanien Bonos 07/40 EUR 2,000,000 500,000 4,500,000 % 135.400 2,708,000.00 0.45ES00000123B9 5.5000 % Königreich Spanien Bonos 11/21 EUR 4,500,000 2,000,000 12,500,000 % 124.231 5,590,395.00 0.94ES00000123K0 5.8500 % Königreich Spanien Bonos 11/22 EUR 2,000,000 0 6,400,000 % 128.443 2,568,850.00 0.43ES00000124B7 3.7500 % Königreich Spanien Bonos 13/18 EUR 14,000,000 4,000,000 7,000,000 % 110.004 15,400,560.00 2.58ES00000123X3 4.4000 % Königreich Spanien Bonos 13/23 EUR 5,250,000 4,250,000 6,000,000 % 121.820 6,395,523.75 1.07ES00000126C0 1.4000 % Königreich Spanien Bonos 14/20 EUR 3,800,000 3,800,000 0 % 103.384 3,928,573.00 0.66Explanations can be found in the footnotes below the table.

5
Allianz Europazins
Investment portfolio at 31/12/2015ISIN Securities Market Shares/ Balance Purchases Redemptions Price Market value % of net
Units/ 31/12/2015 EUR assetsCurrency in the period under review
ES00000126B2 2.7500 % Königreich Spanien Bonos 14/24 EUR 5,000,000 9,000,000 4,000,000 % 108.800 5,440,000.00 0.91ES00000127H7 1.1500 % Königreich Spanien Bonos 15/20 EUR 15,000,000 15,000,000 0 % 102.026 15,303,825.00 2.57ES0000012411 5.7500 % Königreich Spanien Obl. 01/32 EUR 2,300,000 3,000,000 2,700,000 % 144.833 3,331,159.00 0.56ES0000012932 4.2000 % Königreich Spanien Obligaciones 05/37 EUR 2,500,000 2,500,000 2,000,000 % 123.048 3,076,200.00 0.52ES00000122E5 4.6500 % Königreich Spanien Obligaciones 10/25 EUR 6,000,000 0 0 % 125.360 7,521,570.00 1.26ES00000127A2 1.9500 % Königreich Spanien Obligaciones 15/30 EUR 5,500,000 9,000,000 3,500,000 % 95.450 5,249,722.50 0.88DE000A11QTF7 0.3750 % Kreditanst.f.Wiederaufbau MTN 15/30 EUR 6,500,000 10,000,000 3,500,000 % 88.853 5,775,412.50 0.97DE000A1RQCT2 0.3750 % Land Hessen Schatzanw. S.1515 15/22 EUR 4,000,000 4,000,000 0 % 99.654 3,986,160.00 0.67DE0001735926 5.7500 % Land Nordrhein-Westfalen
Landessch. R.332 98/18 EUR 0.81 0 0 % 112.197 0.91 0.00XS1324535514 0.2500 % Landwirtsch. Rentenbank
MTN S.1126 v.15/22 EUR 3,000,000 3,000,000 0 % 98.982 2,969,460.00 0.50XS1284576581 0.7500 % Merck Financial Services GmbH MTN 15/19 EUR 1,650,000 1,650,000 0 % 101.066 1,667,589.00 0.28XS1319652902 0.7500 % Nestlé Finance Intl Ltd. MTN 15/23 EUR 1,000,000 1,450,000 450,000 % 98.860 988,595.00 0.17XS1199018398 0.2500 % Nord/LB Lux SA Cov.
Bond Bank MT L.d.Ga. 15/20 EUR 2,400,000 2,400,000 0 % 99.615 2,390,760.00 0.40XS1138423774 0.6000 % OMV AG MTN 14/18 EUR 2,800,000 0 0 % 100.410 2,811,480.00 0.47FR0010871376 4.8750 % Pernod-Ricard S.A. Bonds 10/16 EUR 2,000,000 2,000,000 0 % 100.951 2,019,020.00 0.34XS0301010145 4.5500 % Pfizer Inc. EUR Notes 07(07/17) EUR 2,000,000 2,000,000 0 % 106.159 2,123,170.00 0.36FR0013053055 1.3750 % RCI Banque MTN 15/20 EUR 1,000,000 1,000,000 0 % 100.712 1,007,115.00 0.17FR0012596179 0.6250 % RCI Banque MTN 15/20 EUR 1,400,000 3,400,000 2,000,000 % 98.089 1,373,239.00 0.23FR0012557957 0.0000 % Rep. Frankreich O.A.T. 15/20 EUR 5,000,000 5,000,000 0 % 99.817 4,990,825.00 0.84FR0010371401 4.0000 % Rep. Frankreich OAT 06/38 EUR 6,000,000 4,000,000 0 % 139.627 8,377,620.00 1.40FR0010870956 4.0000 % Rep. Frankreich OAT 10/60 EUR 2,500,000 0 6,500,000 % 151.115 3,777,862.50 0.63FR0011196856 3.0000 % Rep. Frankreich OAT 12/22 EUR 7,000,000 7,000,000 0 % 116.691 8,168,370.00 1.37FR0011317783 2.7500 % Rep. Frankreich OAT 12/27 EUR 6,000,000 6,000,000 0 % 116.471 6,988,230.00 1.17FR0011461037 3.2500 % Rep. Frankreich OAT 13/45 EUR 1,500,000 1,500,000 0 % 126.838 1,902,562.50 0.32FR0012517027 0.5000 % Rep. Frankreich OAT 15/25 EUR 3,000,000 3,000,000 0 % 96.272 2,888,160.00 0.48FR0000187635 5.7500 % Rep. Frankreich Obl.Assimil. du Trésor 01/32 EUR 1,000,000 1,000,000 0 % 161.137 1,611,365.00 0.27IT0003535157 5.0000 % Republik Italien B.T.P. 03/34 EUR 4,000,000 4,000,000 0 % 140.083 5,603,320.00 0.94IT0003934657 4.0000 % Republik Italien B.T.P. 05/37 EUR 2,000,000 2,000,000 0 % 124.700 2,494,000.00 0.42IT0004423957 4.5000 % Republik Italien B.T.P. 08/19 EUR 14,500,000 0 0 % 113.481 16,454,745.00 2.75IT0004356843 4.7500 % Republik Italien B.T.P. 08/23 EUR 4,000,000 4,000,000 0 % 125.551 5,022,040.00 0.84IT0004532559 5.0000 % Republik Italien B.T.P. 09/40 EUR 4,000,000 0 4,000,000 % 142.373 5,694,900.00 0.96IT0004594930 4.0000 % Republik Italien B.T.P. 10/20 EUR 11,000,000 8,000,000 4,000,000 % 115.799 12,737,835.00 2.14IT0004848831 5.5000 % Republik Italien B.T.P. 12/22 EUR 5,500,000 0 4,500,000 % 128.850 7,086,722.50 1.19IT0004801541 5.5000 % Republik Italien B.T.P. 12/22 EUR 3,500,000 0 6,500,000 % 128.614 4,501,490.00 0.75IT0004957574 3.5000 % Republik Italien B.T.P. 13/18 EUR 3,000,000 3,000,000 0 % 109.801 3,294,030.00 0.55IT0004907843 3.5000 % Republik Italien B.T.P. 13/18 EUR 15,000,000 4,000,000 2,000,000 % 108.231 16,234,650.00 2.72IT0004966401 3.7500 % Republik Italien B.T.P. 13/21 EUR 12,000,000 0 1,000,000 % 115.814 13,897,680.00 2.33IT0004923998 4.7500 % Republik Italien B.T.P. 13/44 EUR 2,000,000 1,500,000 2,500,000 % 141.252 2,825,030.00 0.47IT0005069395 1.0500 % Republik Italien B.T.P. 14/19 EUR 5,000,000 5,000,000 0 % 102.482 5,124,100.00 0.86IT0005045270 2.5000 % Republik Italien B.T.P. 14/24 EUR 9,500,000 14,000,000 9,500,000 % 108.306 10,289,070.00 1.73IT0005024234 3.5000 % Republik Italien B.T.P. 14/30 EUR 8,000,000 2,000,000 0 % 118.220 9,457,560.00 1.59IT0005090318 1.5000 % Republik Italien B.T.P. 15/25 EUR 4,000,000 4,000,000 0 % 99.766 3,990,620.00 0.67IT0005083057 3.2500 % Republik Italien B.T.P. 15/46 EUR 500,000 500,000 0 % 111.926 559,627.50 0.09IT0001174611 6.5000 % Republik Italien B.T.P. 97/27 EUR 5,000,000 1,500,000 7,500,000 % 148.939 7,446,925.00 1.25XS0212694920 5.5000 % Republik Türkei EUR Notes 05/17 EUR 1,500,000 1,500,000 0 % 105.340 1,580,092.50 0.26XS0172851650 5.1250 % RWE Finance B.V. MTN 03/18 EUR 500,000 500,000 0 % 111.857 559,285.00 0.09XS1318709497 1.3750 % Snam S.p.A. MTN 15/23 EUR 500,000 1,000,000 500,000 % 99.689 498,445.00 0.08XS1310192114 0.0500 % SNCF Réseau MTN 15/18 EUR 1,700,000 1,700,000 0 % 100.109 1,701,853.00 0.29XS0696530228 1.1470 % STORM 2011-IV B.V. FLR Notes 11/53 Cl.A1 4) EUR 800,000 0 0 % 100.111 117,129.32 0.02XS0871785019 0.7970 % STORM 2013-I B.V. FLR
Notes 13(18/54) Cl.A2 4) EUR 3,200,000 0 0 % 101.217 3,238,959.84 0.54XS0593606550 3.8750 % TenneT Holding B.V. MTN 11/18 EUR 1,000,000 1,000,000 0 % 107.687 1,076,870.00 0.18FR0012537124 0.6250 % Union Natle Interp.Em.Com.Ind. MTN 15/25 EUR 3,000,000 8,000,000 5,000,000 % 97.020 2,910,585.00 0.49XS0168881760 5.3750 % Volkswagen Intl Finance N.V. MTN 03/18 EUR 500,000 500,000 0 % 109.384 546,917.50 0.09DE000A1ZY971 0.8750 % Vonovia Finance B.V. MTN 15/20 EUR 1,800,000 1,800,000 0 % 98.169 1,767,042.00 0.30XS1288903278 1.5000 % Wells Fargo & Co. MTN 15/22 EUR 500,000 2,500,000 2,000,000 % 101.131 505,652.50 0.08XS1203856072 1.2500 % Yorkshire Building Society MTN 15/22 EUR 1,000,000 4,500,000 3,500,000 % 97.955 979,550.00 0.16GBP bonds 111,906,281 .70 18 .78XS1074467025 2.2500 % Commonwealth Bank of
Australia GBP MTN 14/18 GBP 1,000,000 0 1,500,000 % 101.524 1,375,972.28 0.23XS0615975652 2.0294 % Gosforth Fd 2011-1 PLC
FLR Notes 11(16/47) Cl.A2 4) GBP 2,900,000 0 0 % 100.305 1,106,029.28 0.19GB0004893086 4.2500 % Großbritannien Treasury Stock 00/32 GBP 8,500,000 1,300,000 800,000 % 125.689 14,479,691.15 2.43Explanations can be found in the footnotes below the table.
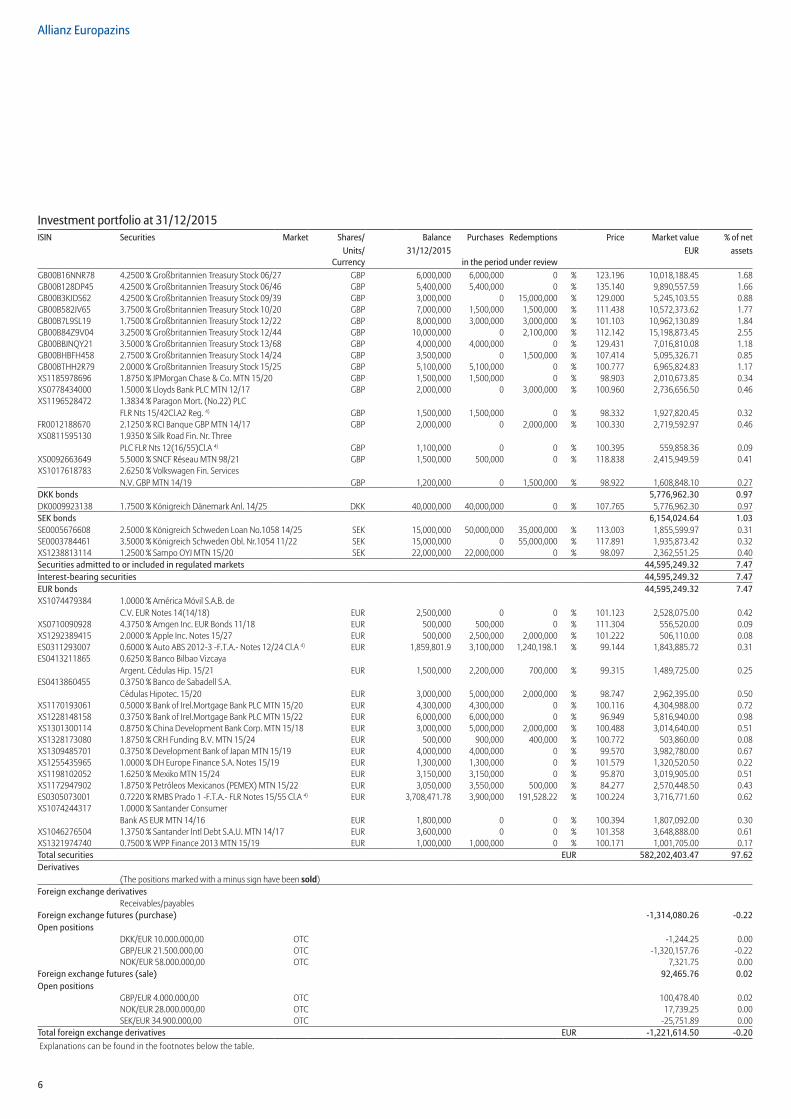
6
Allianz Europazins
Investment portfolio at 31/12/2015ISIN Securities Market Shares/ Balance Purchases Redemptions Price Market value % of net
Units/ 31/12/2015 EUR assetsCurrency in the period under review
GB00B16NNR78 4.2500 % Großbritannien Treasury Stock 06/27 GBP 6,000,000 6,000,000 0 % 123.196 10,018,188.45 1.68GB00B128DP45 4.2500 % Großbritannien Treasury Stock 06/46 GBP 5,400,000 5,400,000 0 % 135.140 9,890,557.59 1.66GB00B3KJDS62 4.2500 % Großbritannien Treasury Stock 09/39 GBP 3,000,000 0 15,000,000 % 129.000 5,245,103.55 0.88GB00B582JV65 3.7500 % Großbritannien Treasury Stock 10/20 GBP 7,000,000 1,500,000 1,500,000 % 111.438 10,572,373.62 1.77GB00B7L9SL19 1.7500 % Großbritannien Treasury Stock 12/22 GBP 8,000,000 3,000,000 3,000,000 % 101.103 10,962,130.89 1.84GB00B84Z9V04 3.2500 % Großbritannien Treasury Stock 12/44 GBP 10,000,000 0 2,100,000 % 112.142 15,198,873.45 2.55GB00BBJNQY21 3.5000 % Großbritannien Treasury Stock 13/68 GBP 4,000,000 4,000,000 0 % 129.431 7,016,810.08 1.18GB00BHBFH458 2.7500 % Großbritannien Treasury Stock 14/24 GBP 3,500,000 0 1,500,000 % 107.414 5,095,326.71 0.85GB00BTHH2R79 2.0000 % Großbritannien Treasury Stock 15/25 GBP 5,100,000 5,100,000 0 % 100.777 6,965,824.83 1.17XS1185978696 1.8750 % JPMorgan Chase & Co. MTN 15/20 GBP 1,500,000 1,500,000 0 % 98.903 2,010,673.85 0.34XS0778434000 1.5000 % Lloyds Bank PLC MTN 12/17 GBP 2,000,000 0 3,000,000 % 100.960 2,736,656.50 0.46XS1196528472 1.3834 % Paragon Mort. (No.22) PLC
FLR Nts 15/42Cl.A2 Reg. 4) GBP 1,500,000 1,500,000 0 % 98.332 1,927,820.45 0.32FR0012188670 2.1250 % RCI Banque GBP MTN 14/17 GBP 2,000,000 0 2,000,000 % 100.330 2,719,592.97 0.46XS0811595130 1.9350 % Silk Road Fin. Nr. Three
PLC FLR Nts 12(16/55)Cl.A 4) GBP 1,100,000 0 0 % 100.395 559,858.36 0.09XS0092663649 5.5000 % SNCF Réseau MTN 98/21 GBP 1,500,000 500,000 0 % 118.838 2,415,949.59 0.41XS1017618783 2.6250 % Volkswagen Fin. Services
N.V. GBP MTN 14/19 GBP 1,200,000 0 1,500,000 % 98.922 1,608,848.10 0.27DKK bonds 5,776,962 .30 0 .97DK0009923138 1.7500 % Königreich Dänemark Anl. 14/25 DKK 40,000,000 40,000,000 0 % 107.765 5,776,962.30 0.97SEK bonds 6,154,024 .64 1 .03SE0005676608 2.5000 % Königreich Schweden Loan No.1058 14/25 SEK 15,000,000 50,000,000 35,000,000 % 113.003 1,855,599.97 0.31SE0003784461 3.5000 % Königreich Schweden Obl. Nr.1054 11/22 SEK 15,000,000 0 55,000,000 % 117.891 1,935,873.42 0.32XS1238813114 1.2500 % Sampo OYJ MTN 15/20 SEK 22,000,000 22,000,000 0 % 98.097 2,362,551.25 0.40Securities admitted to or included in regulated markets 44,595,249 .32 7 .47Interest-bearing securities 44,595,249 .32 7 .47EUR bonds 44,595,249 .32 7 .47XS1074479384 1.0000 % América Móvil S.A.B. de
C.V. EUR Notes 14(14/18) EUR 2,500,000 0 0 % 101.123 2,528,075.00 0.42XS0710090928 4.3750 % Amgen Inc. EUR Bonds 11/18 EUR 500,000 500,000 0 % 111.304 556,520.00 0.09XS1292389415 2.0000 % Apple Inc. Notes 15/27 EUR 500,000 2,500,000 2,000,000 % 101.222 506,110.00 0.08ES0311293007 0.6000 % Auto ABS 2012-3 -F.T.A.- Notes 12/24 Cl.A 4) EUR 1,859,801.9 3,100,000 1,240,198.1 % 99.144 1,843,885.72 0.31ES0413211865 0.6250 % Banco Bilbao Vizcaya
Argent. Cédulas Hip. 15/21 EUR 1,500,000 2,200,000 700,000 % 99.315 1,489,725.00 0.25ES0413860455 0.3750 % Banco de Sabadell S.A.
Cédulas Hipotec. 15/20 EUR 3,000,000 5,000,000 2,000,000 % 98.747 2,962,395.00 0.50XS1170193061 0.5000 % Bank of Irel.Mortgage Bank PLC MTN 15/20 EUR 4,300,000 4,300,000 0 % 100.116 4,304,988.00 0.72XS1228148158 0.3750 % Bank of Irel.Mortgage Bank PLC MTN 15/22 EUR 6,000,000 6,000,000 0 % 96.949 5,816,940.00 0.98XS1301300114 0.8750 % China Development Bank Corp. MTN 15/18 EUR 3,000,000 5,000,000 2,000,000 % 100.488 3,014,640.00 0.51XS1328173080 1.8750 % CRH Funding B.V. MTN 15/24 EUR 500,000 900,000 400,000 % 100.772 503,860.00 0.08XS1309485701 0.3750 % Development Bank of Japan MTN 15/19 EUR 4,000,000 4,000,000 0 % 99.570 3,982,780.00 0.67XS1255435965 1.0000 % DH Europe Finance S.A. Notes 15/19 EUR 1,300,000 1,300,000 0 % 101.579 1,320,520.50 0.22XS1198102052 1.6250 % Mexiko MTN 15/24 EUR 3,150,000 3,150,000 0 % 95.870 3,019,905.00 0.51XS1172947902 1.8750 % Petróleos Mexicanos (PEMEX) MTN 15/22 EUR 3,050,000 3,550,000 500,000 % 84.277 2,570,448.50 0.43ES0305073001 0.7220 % RMBS Prado 1 -F.T.A.- FLR Notes 15/55 Cl.A 4) EUR 3,708,471.78 3,900,000 191,528.22 % 100.224 3,716,771.60 0.62XS1074244317 1.0000 % Santander Consumer
Bank AS EUR MTN 14/16 EUR 1,800,000 0 0 % 100.394 1,807,092.00 0.30XS1046276504 1.3750 % Santander Intl Debt S.A.U. MTN 14/17 EUR 3,600,000 0 0 % 101.358 3,648,888.00 0.61XS1321974740 0.7500 % WPP Finance 2013 MTN 15/19 EUR 1,000,000 1,000,000 0 % 100.171 1,001,705.00 0.17Total securities EUR 582,202,403 .47 97 .62Derivatives
(The positions marked with a minus sign have been sold)Foreign exchange derivatives
Receivables/payablesForeign exchange futures (purchase) -1,314,080 .26 -0 .22Open positions
DKK/EUR 10.000.000,00 OTC -1,244.25 0.00GBP/EUR 21.500.000,00 OTC -1,320,157.76 -0.22NOK/EUR 58.000.000,00 OTC 7,321.75 0.00
Foreign exchange futures (sale) 92,465 .76 0 .02Open positions
GBP/EUR 4.000.000,00 OTC 100,478.40 0.02NOK/EUR 28.000.000,00 OTC 17,739.25 0.00SEK/EUR 34.900.000,00 OTC -25,751.89 0.00
Total foreign exchange derivatives EUR -1,221,614 .50 -0 .20Explanations can be found in the footnotes below the table.

7
Allianz Europazins
Investment portfolio at 31/12/2015ISIN Securities Market Shares/ Balance Purchases Redemptions Price Market value % of net
Units/ 31/12/2015 EUR assetsCurrency in the period under review
Bank deposits, money market paper and money market fundsBank depositsEUR deposits with custodial office
BNP PARIBAS Securities Services S.C.A. EUR 5,715,975.34 % 100.000 5,715,975.34 0.96Deposits in other EU/EEA currencies
BNP PARIBAS Securities Services S.C.A. DKK 708,212.92 % 100.000 94,912.99 0.02BNP PARIBAS Securities Services S.C.A. GBP 146,136.76 % 100.000 198,062.65 0.03BNP PARIBAS Securities Services S.C.A. HUF 949,514.01 % 100.000 3,035.30 0.00BNP PARIBAS Securities Services S.C.A. NOK 29,332.24 % 100.000 3,063.26 0.00BNP PARIBAS Securities Services S.C.A. PLN 64.98 % 100.000 15.33 0.00BNP PARIBAS Securities Services S.C.A. SEK 29,922,518.09 % 100.000 3,275,692.93 0.55
Deposits in non EU/EEA currenciesBNP PARIBAS Securities Services S.C.A. CHF 72.75 % 100.000 67.10 0.00
Total bank deposits 7) EUR 9,290,824 .90 1 .56Total bank deposits, money market paper and money market funds EUR 9,290,824 .90 1 .56Other assets
Accrued interest EUR 5,119,880.32 5,119,880.32 0.86Receivables from unit transactions EUR 158,144.30 158,144.30 0.03Receivables from cash collateral EUR 1,120,000.00 1,120,000.00 0.19
Total other assets EUR 6,398,024 .62 1 .08Other payables
Liabilities from unit transactions EUR -370,524.05 -370,524.05 -0.06Total other payables EUR -370,524 .05 -0 .06Fund assets EUR 596,299,114 .44 100 .00
Units in circulation SHS 10,611,110Unit value EUR 56.20Fund assets invested in securities (in %) 97.62Fund assets invested in derivatives (in %) -0.20
4) These securities are pool factor bonds whose market value is also affected by partial repayment or partial interest capitalisation.7) These bank deposits were transferred in part or in whole to third parties to serve as securities for other derivatives.
Securities total
Total nominal value of bank deposits that serve as collateral for third parties (collateral management): EUR 1,120,000 .00Total current value of securities that have been pledged to third parties as margin collateral for futures: EUR 1,462,975 .00

8
Allianz Europazins
Securities prices/market ratesFund assets were valued on the basis of the following prices/market rates:
International bonds: prices as at 29/12/2015 or last known
All other assets: prices/market rates as at 30/12/2015 or last known
Exchange rate(s) and/or conversion factor(s) (indirect quotation) as at 30/12/2015UK, Pound Sterling (GBP) 1 Euro = GBP 0.73783
Denmark, Krone (DKK) 1 Euro = DKK 7.46171
Norway, Krone (NOK) 1 Euro = NOK 9.57551
Sweden, Krona (SEK) 1 Euro = SEK 9.13471
Switzerland, Franc (CHF) 1 Euro = CHF 1.08422
Poland, Zloty (PLN) 1 Euro = PLN 4.23806
Hungary, Forint (HUF) 1 Euro = HUF 312.82354
Notes to options and financial futures exchangesOTC-dealt derivatives
OTC = Over-the-Counter
Capital measures
All sales revenues resulting from capital measures (technical revenues) are reported as additions or disposals.
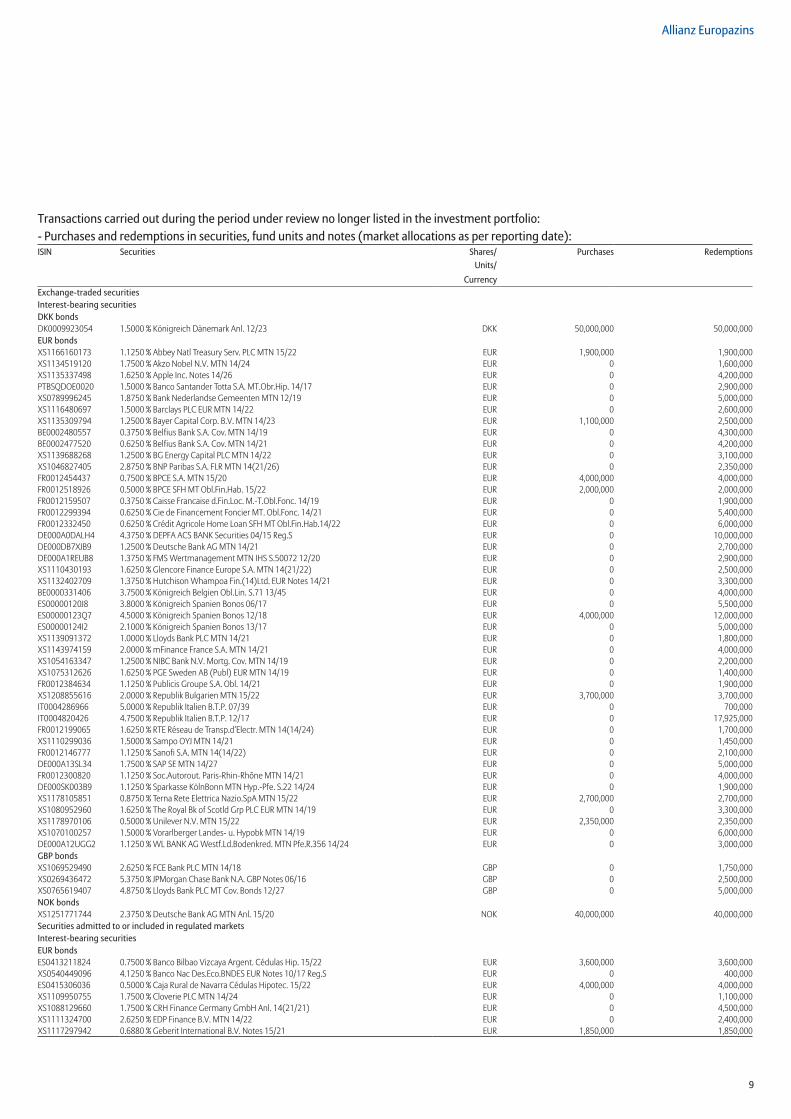
9
Allianz Europazins
Transactions carried out during the period under review no longer listed in the investment portfolio:- Purchases and redemptions in securities, fund units and notes (market allocations as per reporting date):ISIN Securities Shares/ Purchases Redemptions
Units/Currency
Exchange-traded securitiesInterest-bearing securitiesDKK bondsDK0009923054 1.5000 % Königreich Dänemark Anl. 12/23 DKK 50,000,000 50,000,000EUR bondsXS1166160173 1.1250 % Abbey Natl Treasury Serv. PLC MTN 15/22 EUR 1,900,000 1,900,000XS1134519120 1.7500 % Akzo Nobel N.V. MTN 14/24 EUR 0 1,600,000XS1135337498 1.6250 % Apple Inc. Notes 14/26 EUR 0 4,200,000PTBSQDOE0020 1.5000 % Banco Santander Totta S.A. MT.Obr.Hip. 14/17 EUR 0 2,900,000XS0789996245 1.8750 % Bank Nederlandse Gemeenten MTN 12/19 EUR 0 5,000,000XS1116480697 1.5000 % Barclays PLC EUR MTN 14/22 EUR 0 2,600,000XS1135309794 1.2500 % Bayer Capital Corp. B.V. MTN 14/23 EUR 1,100,000 2,500,000BE0002480557 0.3750 % Belfius Bank S.A. Cov. MTN 14/19 EUR 0 4,300,000BE0002477520 0.6250 % Belfius Bank S.A. Cov. MTN 14/21 EUR 0 4,200,000XS1139688268 1.2500 % BG Energy Capital PLC MTN 14/22 EUR 0 3,100,000XS1046827405 2.8750 % BNP Paribas S.A. FLR MTN 14(21/26) EUR 0 2,350,000FR0012454437 0.7500 % BPCE S.A. MTN 15/20 EUR 4,000,000 4,000,000FR0012518926 0.5000 % BPCE SFH MT Obl.Fin.Hab. 15/22 EUR 2,000,000 2,000,000FR0012159507 0.3750 % Caisse Francaise d.Fin.Loc. M.-T.Obl.Fonc. 14/19 EUR 0 1,900,000FR0012299394 0.6250 % Cie de Financement Foncier MT. Obl.Fonc. 14/21 EUR 0 5,400,000FR0012332450 0.6250 % Crédit Agricole Home Loan SFH MT Obl.Fin.Hab.14/22 EUR 0 6,000,000DE000A0DALH4 4.3750 % DEPFA ACS BANK Securities 04/15 Reg.S EUR 0 10,000,000DE000DB7XJB9 1.2500 % Deutsche Bank AG MTN 14/21 EUR 0 2,700,000DE000A1REUB8 1.3750 % FMS Wertmanagement MTN IHS S.50072 12/20 EUR 0 2,900,000XS1110430193 1.6250 % Glencore Finance Europe S.A. MTN 14(21/22) EUR 0 2,500,000XS1132402709 1.3750 % Hutchison Whampoa Fin.(14)Ltd. EUR Notes 14/21 EUR 0 3,300,000BE0000331406 3.7500 % Königreich Belgien Obl.Lin. S.71 13/45 EUR 0 4,000,000ES00000120J8 3.8000 % Königreich Spanien Bonos 06/17 EUR 0 5,500,000ES00000123Q7 4.5000 % Königreich Spanien Bonos 12/18 EUR 4,000,000 12,000,000ES00000124I2 2.1000 % Königreich Spanien Bonos 13/17 EUR 0 5,000,000XS1139091372 1.0000 % Lloyds Bank PLC MTN 14/21 EUR 0 1,800,000XS1143974159 2.0000 % mFinance France S.A. MTN 14/21 EUR 0 4,000,000XS1054163347 1.2500 % NIBC Bank N.V. Mortg. Cov. MTN 14/19 EUR 0 2,200,000XS1075312626 1.6250 % PGE Sweden AB (Publ) EUR MTN 14/19 EUR 0 1,400,000FR0012384634 1.1250 % Publicis Groupe S.A. Obl. 14/21 EUR 0 1,900,000XS1208855616 2.0000 % Republik Bulgarien MTN 15/22 EUR 3,700,000 3,700,000IT0004286966 5.0000 % Republik Italien B.T.P. 07/39 EUR 0 700,000IT0004820426 4.7500 % Republik Italien B.T.P. 12/17 EUR 0 17,925,000FR0012199065 1.6250 % RTE Réseau de Transp.d‘Electr. MTN 14(14/24) EUR 0 1,700,000XS1110299036 1.5000 % Sampo OYJ MTN 14/21 EUR 0 1,450,000FR0012146777 1.1250 % Sanofi S.A. MTN 14(14/22) EUR 0 2,100,000DE000A13SL34 1.7500 % SAP SE MTN 14/27 EUR 0 5,000,000FR0012300820 1.1250 % Soc.Autorout. Paris-Rhin-Rhône MTN 14/21 EUR 0 4,000,000DE000SK003B9 1.1250 % Sparkasse KölnBonn MTN Hyp.-Pfe. S.22 14/24 EUR 0 1,900,000XS1178105851 0.8750 % Terna Rete Elettrica Nazio.SpA MTN 15/22 EUR 2,700,000 2,700,000XS1080952960 1.6250 % The Royal Bk of Scotld Grp PLC EUR MTN 14/19 EUR 0 3,300,000XS1178970106 0.5000 % Unilever N.V. MTN 15/22 EUR 2,350,000 2,350,000XS1070100257 1.5000 % Vorarlberger Landes- u. Hypobk MTN 14/19 EUR 0 6,000,000DE000A12UGG2 1.1250 % WL BANK AG Westf.Ld.Bodenkred. MTN Pfe.R.356 14/24 EUR 0 3,000,000GBP bondsXS1069529490 2.6250 % FCE Bank PLC MTN 14/18 GBP 0 1,750,000XS0269436472 5.3750 % JPMorgan Chase Bank N.A. GBP Notes 06/16 GBP 0 2,500,000XS0765619407 4.8750 % Lloyds Bank PLC MT Cov. Bonds 12/27 GBP 0 5,000,000NOK bondsXS1251771744 2.3750 % Deutsche Bank AG MTN Anl. 15/20 NOK 40,000,000 40,000,000Securities admitted to or included in regulated marketsInterest-bearing securitiesEUR bondsES0413211824 0.7500 % Banco Bilbao Vizcaya Argent. Cédulas Hip. 15/22 EUR 3,600,000 3,600,000XS0540449096 4.1250 % Banco Nac Des.Eco.BNDES EUR Notes 10/17 Reg.S EUR 0 400,000ES0415306036 0.5000 % Caja Rural de Navarra Cédulas Hipotec. 15/22 EUR 4,000,000 4,000,000XS1109950755 1.7500 % Cloverie PLC MTN 14/24 EUR 0 1,100,000XS1088129660 1.7500 % CRH Finance Germany GmbH Anl. 14(21/21) EUR 0 4,500,000XS1111324700 2.6250 % EDP Finance B.V. MTN 14/22 EUR 0 2,400,000XS1117297942 0.6880 % Geberit International B.V. Notes 15/21 EUR 1,850,000 1,850,000
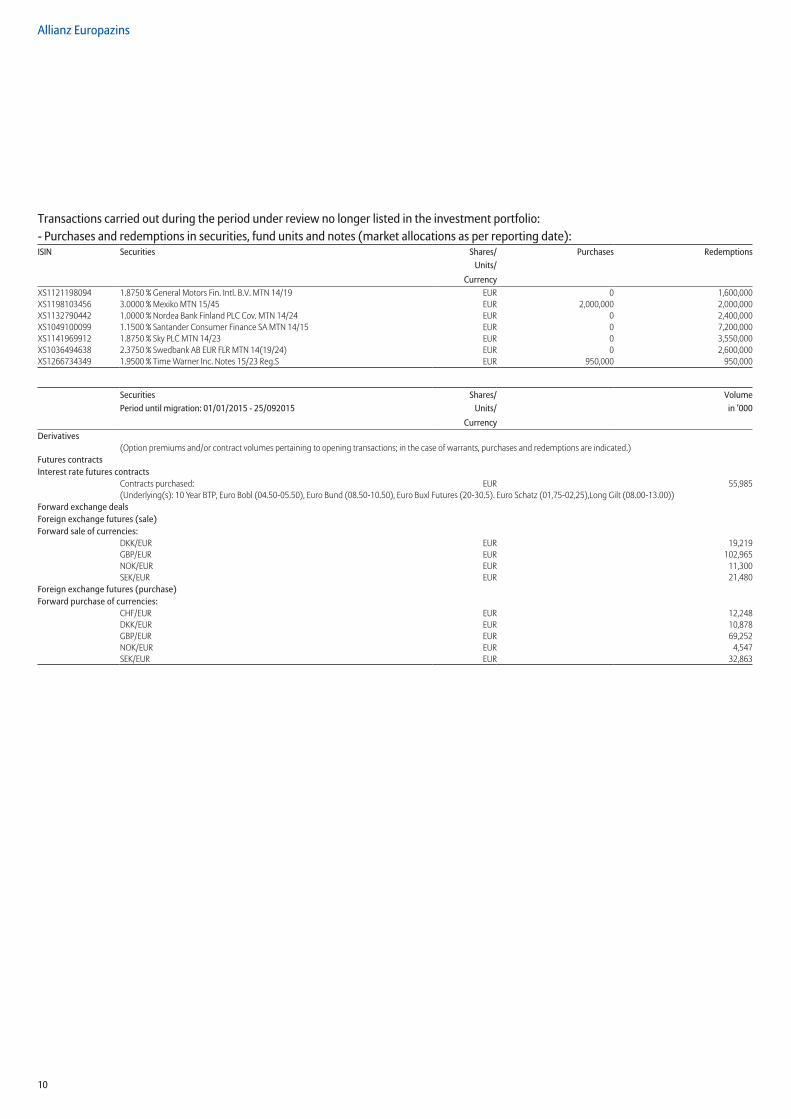
10
Allianz Europazins
Transactions carried out during the period under review no longer listed in the investment portfolio:- Purchases and redemptions in securities, fund units and notes (market allocations as per reporting date):ISIN Securities Shares/ Purchases Redemptions
Units/Currency
XS1121198094 1.8750 % General Motors Fin. Intl. B.V. MTN 14/19 EUR 0 1,600,000XS1198103456 3.0000 % Mexiko MTN 15/45 EUR 2,000,000 2,000,000XS1132790442 1.0000 % Nordea Bank Finland PLC Cov. MTN 14/24 EUR 0 2,400,000XS1049100099 1.1500 % Santander Consumer Finance SA MTN 14/15 EUR 0 7,200,000XS1141969912 1.8750 % Sky PLC MTN 14/23 EUR 0 3,550,000XS1036494638 2.3750 % Swedbank AB EUR FLR MTN 14(19/24) EUR 0 2,600,000XS1266734349 1.9500 % Time Warner Inc. Notes 15/23 Reg.S EUR 950,000 950,000
Securities Shares/ VolumePeriod until migration: 01/01/2015 - 25/092015 Units/ in ’000
CurrencyDerivatives
(Option premiums and/or contract volumes pertaining to opening transactions; in the case of warrants, purchases and redemptions are indicated.)Futures contractsInterest rate futures contracts
Contracts purchased: EUR 55,985(Underlying(s): 10 Year BTP, Euro Bobl (04.50-05.50), Euro Bund (08.50-10.50), Euro Buxl Futures (20-30.5). Euro Schatz (01,75-02,25),Long Gilt (08.00-13.00))
Forward exchange dealsForeign exchange futures (sale)Forward sale of currencies:
DKK/EUR EUR 19,219GBP/EUR EUR 102,965NOK/EUR EUR 11,300SEK/EUR EUR 21,480
Foreign exchange futures (purchase)Forward purchase of currencies:
CHF/EUR EUR 12,248DKK/EUR EUR 10,878GBP/EUR EUR 69,252NOK/EUR EUR 4,547SEK/EUR EUR 32,863

11
Allianz Europazins
Securities Shares/ VolumePeriod after migration: 26/09/2015 - 31/12/2015 Units/ in 1,000
CurrencyDerivatives
(Option premiums and/or contract volumes pertaining to opening transactions; in the case of warrants, purchases and redemptions are indicated.)Futures contractsInterest rate futures contracts
Contracts purchased: EUR 5,663.(Underlying(s): Euro Buxl Futures (30.0). Long Gilt (10.0))
Forward exchange dealsForeign exchange futures (sale)Forward sale of currencies:
SEK/EUR EUR 5,269Foreign exchange futures (purchase)Forward purchase of currencies:
DKK/EUR EUR 2,546GBP/EUR EUR 28,116SEK/EUR EUR 1,609
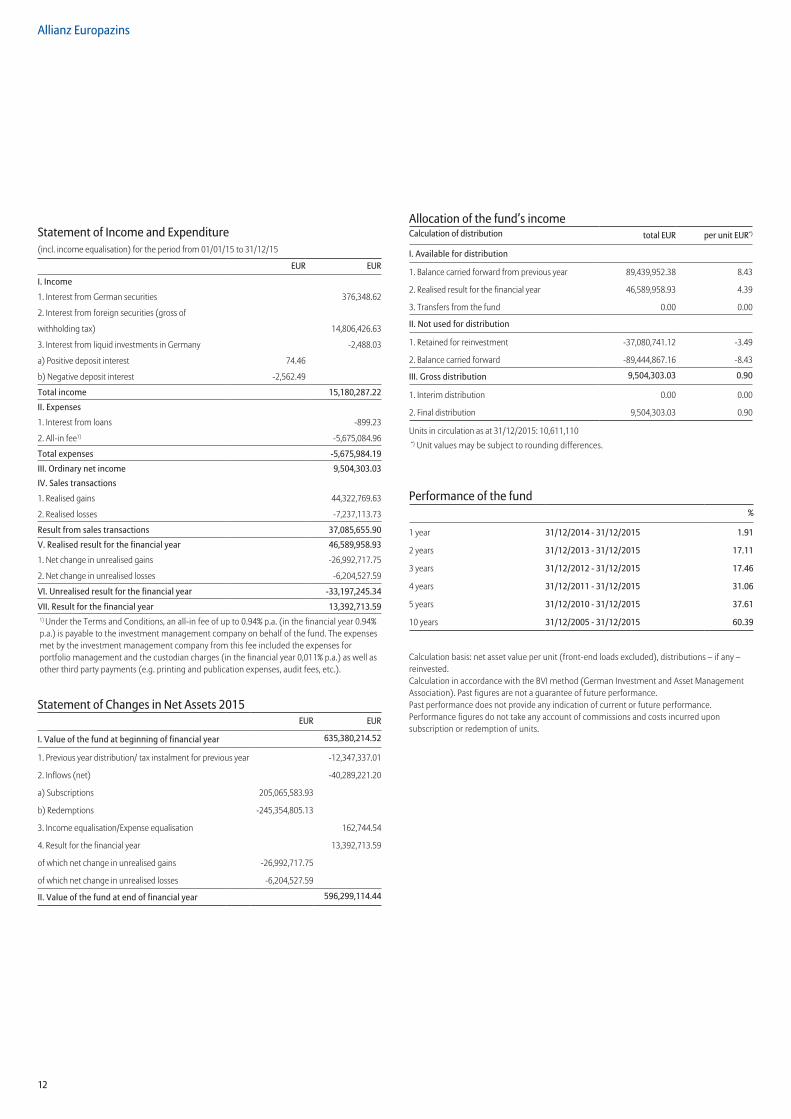
12
Allianz Europazins
Statement of Income and Expenditure(incl. income equalisation) for the period from 01/01/15 to 31/12/15
EUR EUR
I . Income
1. Interest from German securities 376,348.62
2. Interest from foreign securities (gross of
withholding tax) 14,806,426.63
3. Interest from liquid investments in Germany -2,488.03
a) Positive deposit interest 74.46
b) Negative deposit interest -2,562.49
Total income 15,180,287 .22
II . Expenses
1. Interest from loans -899.23
2. All-in fee1) -5,675,084.96
Total expenses -5,675,984 .19
III . Ordinary net income 9,504,303 .03IV . Sales transactions
1. Realised gains 44,322,769.63
2. Realised losses -7,237,113.73
Result from sales transactions 37,085,655 .90
V . Realised result for the financial year 46,589,958 .93
1. Net change in unrealised gains -26,992,717.75
2. Net change in unrealised losses -6,204,527.59
VI . Unrealised result for the financial year -33,197,245 .34
VII . Result for the financial year 13,392,713 .591) Under the Terms and Conditions, an all-in fee of up to 0.94% p.a. (in the financial year 0.94% p.a.) is payable to the investment management company on behalf of the fund. The expenses met by the investment management company from this fee included the expenses for portfolio management and the custodian charges (in the financial year 0,011% p.a.) as well as other third party payments (e.g. printing and publication expenses, audit fees, etc.).
Statement of Changes in Net Assets 2015EUR EUR
I . Value of the fund at beginning of financial year 635,380,214 .52
1. Previous year distribution/ tax instalment for previous year -12,347,337.01
2. Inflows (net) -40,289,221.20
a) Subscriptions 205,065,583.93
b) Redemptions -245,354,805.13
3. Income equalisation/Expense equalisation 162,744.54
4. Result for the financial year 13,392,713.59
of which net change in unrealised gains -26,992,717.75
of which net change in unrealised losses -6,204,527.59
II . Value of the fund at end of financial year 596,299,114 .44
Allocation of the fund’s incomeCalculation of distribution total EUR per unit EUR*)
I . Available for distribution
1. Balance carried forward from previous year 89,439,952.38 8.43
2. Realised result for the financial year 46,589,958.93 4.39
3. Transfers from the fund 0.00 0.00
II . Not used for distribution
1. Retained for reinvestment -37,080,741.12 -3.49
2. Balance carried forward -89,444,867.16 -8.43
III . Gross distribution 9,504,303 .03 0 .90
1. Interim distribution 0.00 0.00
2. Final distribution 9,504,303.03 0.90
Units in circulation as at 31/12/2015: 10,611,110 *) Unit values may be subject to rounding differences.
Performance of the fund%
1 year 31/12/2014 - 31/12/2015 1 .91
2 years 31/12/2013 - 31/12/2015 17 .11
3 years 31/12/2012 - 31/12/2015 17 .46
4 years 31/12/2011 - 31/12/2015 31 .06
5 years 31/12/2010 - 31/12/2015 37 .61
10 years 31/12/2005 - 31/12/2015 60 .39
Calculation basis: net asset value per unit (front-end loads excluded), distributions – if any – reinvested. Calculation in accordance with the BVI method (German Investment and Asset Management Association). Past figures are not a guarantee of future performance.Past performance does not provide any indication of current or future performance. Performance figures do not take any account of commissions and costs incurred upon subscription or redemption of units.
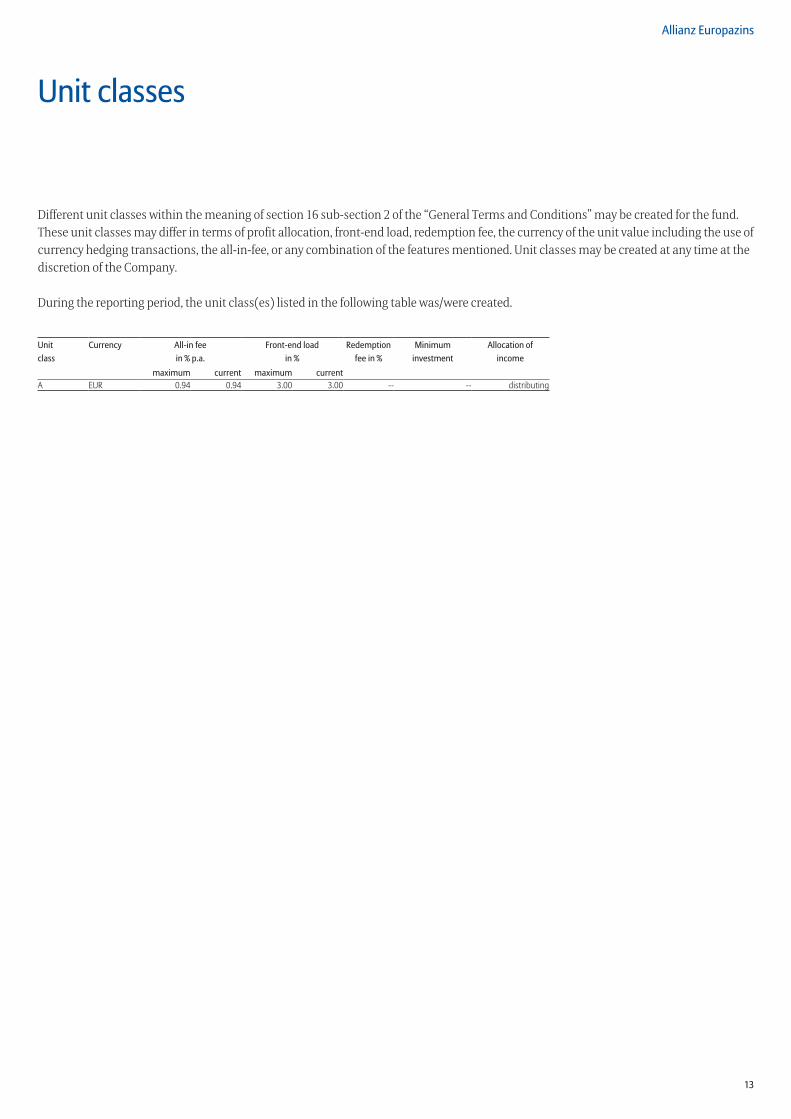
13
Allianz Europazins
Unit classes
Different unit classes within the meaning of section 16 sub-section 2 of the “General Terms and Conditions” may be created for the fund. These unit classes may differ in terms of profit allocation, front-end load, redemption fee, the currency of the unit value including the use of currency hedging transactions, the all-in-fee, or any combination of the features mentioned. Unit classes may be created at any time at the discretion of the Company.
During the reporting period, the unit class(es) listed in the following table was/were created.
Unit Currency All-in fee Front-end load Redemption Minimum Allocation ofclass in % p .a . in % fee in % investment income
maximum current maximum currentA EUR 0.94 0.94 3.00 3.00 -- -- distributing
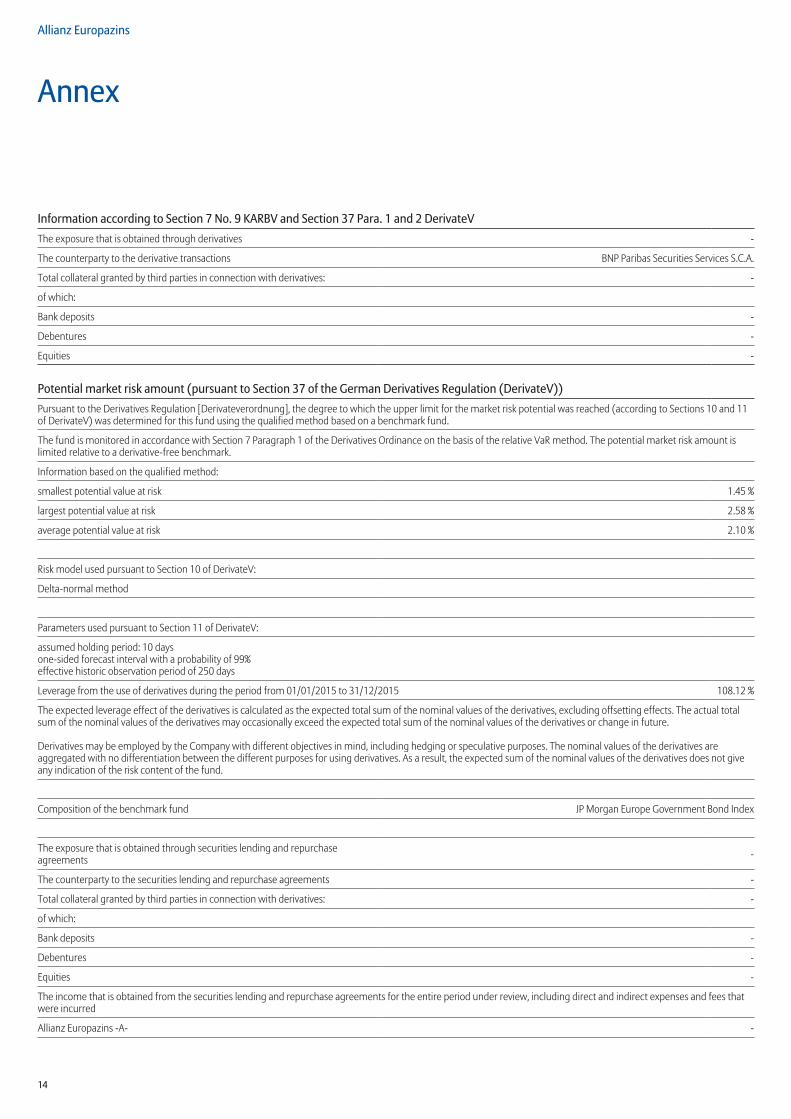
14
Allianz Europazins
Annex
Information according to Section 7 No . 9 KARBV and Section 37 Para . 1 and 2 DerivateVThe exposure that is obtained through derivatives -
The counterparty to the derivative transactions BNP Paribas Securities Services S.C.A.
Total collateral granted by third parties in connection with derivatives: -
of which:
Bank deposits -
Debentures -
Equities -
Potential market risk amount (pursuant to Section 37 of the German Derivatives Regulation (DerivateV))Pursuant to the Derivatives Regulation [Derivateverordnung], the degree to which the upper limit for the market risk potential was reached (according to Sections 10 and 11 of DerivateV) was determined for this fund using the qualified method based on a benchmark fund.
The fund is monitored in accordance with Section 7 Paragraph 1 of the Derivatives Ordinance on the basis of the relative VaR method. The potential market risk amount is limited relative to a derivative-free benchmark.
Information based on the qualified method:
smallest potential value at risk 1.45 %
largest potential value at risk 2.58 %
average potential value at risk 2.10 %
Risk model used pursuant to Section 10 of DerivateV:
Delta-normal method
Parameters used pursuant to Section 11 of DerivateV:
assumed holding period: 10 daysone-sided forecast interval with a probability of 99%effective historic observation period of 250 days
Leverage from the use of derivatives during the period from 01/01/2015 to 31/12/2015 108.12 %
The expected leverage effect of the derivatives is calculated as the expected total sum of the nominal values of the derivatives, excluding offsetting effects. The actual total sum of the nominal values of the derivatives may occasionally exceed the expected total sum of the nominal values of the derivatives or change in future.
Derivatives may be employed by the Company with different objectives in mind, including hedging or speculative purposes. The nominal values of the derivatives are aggregated with no differentiation between the different purposes for using derivatives. As a result, the expected sum of the nominal values of the derivatives does not give any indication of the risk content of the fund.
Composition of the benchmark fund JP Morgan Europe Government Bond Index
The exposure that is obtained through securities lending and repurchase agreements -
The counterparty to the securities lending and repurchase agreements -
Total collateral granted by third parties in connection with derivatives: -
of which:
Bank deposits -
Debentures -
Equities -
The income that is obtained from the securities lending and repurchase agreements for the entire period under review, including direct and indirect expenses and fees that were incurred
Allianz Europazins -A- -
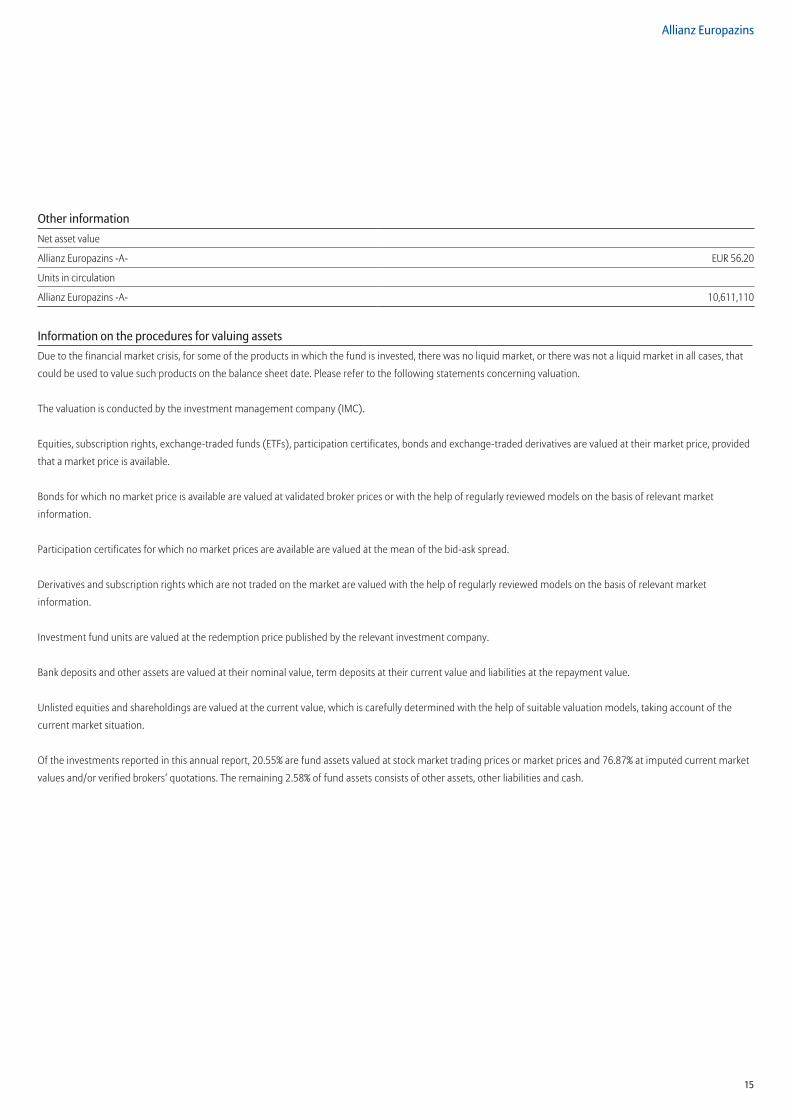
15
Allianz Europazins
Other informationNet asset value
Allianz Europazins -A- EUR 56.20
Units in circulation
Allianz Europazins -A- 10,611,110
Information on the procedures for valuing assetsDue to the financial market crisis, for some of the products in which the fund is invested, there was no liquid market, or there was not a liquid market in all cases, that
could be used to value such products on the balance sheet date. Please refer to the following statements concerning valuation.
The valuation is conducted by the investment management company (IMC).
Equities, subscription rights, exchange-traded funds (ETFs), participation certificates, bonds and exchange-traded derivatives are valued at their market price, provided
that a market price is available.
Bonds for which no market price is available are valued at validated broker prices or with the help of regularly reviewed models on the basis of relevant market
information.
Participation certificates for which no market prices are available are valued at the mean of the bid-ask spread.
Derivatives and subscription rights which are not traded on the market are valued with the help of regularly reviewed models on the basis of relevant market
information.
Investment fund units are valued at the redemption price published by the relevant investment company.
Bank deposits and other assets are valued at their nominal value, term deposits at their current value and liabilities at the repayment value.
Unlisted equities and shareholdings are valued at the current value, which is carefully determined with the help of suitable valuation models, taking account of the
current market situation.
Of the investments reported in this annual report, 20.55% are fund assets valued at stock market trading prices or market prices and 76.87% at imputed current market
values and/or verified brokers‘ quotations. The remaining 2.58% of fund assets consists of other assets, other liabilities and cash.

16
Allianz Europazins
Information on transparency and on the total expense ratio (TER)Total Expense Ratio (TER)
Allianz Europazins -A- 0.94 %
The total expense ratio (TER) is a measurement that compares the total expenses incurred by the fund to the fund assets. The following costs are considered: the all-in-fee and, if applicable, additional costs incurred, except for transaction costs incurred in the fund, interest on borrowing and any performance-related fees. Costs incurred will not be subject to cost compensation. In addition, costs that may be incurred at the level of target funds are not taken into account. The total of the expenses incurred in the indicated time frame is divided by the average fund assets. The resulting percentage is the TER. The calculation complies with the method recommended in CESR Guideline 10-674 in conjunction with EU Commission Regulation 583/2010.
Performance-related compensation as a % of average net asset value
Allianz Europazins -A- -
All-in fees paid to the management company or third parties
Allianz Europazins -A- EUR 5,675,084.96
The Company does not receive any reimbursements for the fees and expenses paid to the custodial office or to any third parties and charged to the relevant fund.
Allianz Europazins -A-
During the reporting period the Company paid more than 10% of the received management fees of the fund to distributors of units in the fund on the basis of units distributed.
Front-end loads and redemption fees that the investment fund has charged for the subscription and redemption of units -
Other significant income and other expensesOther income EUR --
Other expenses EUR --
Total transaction costs for the financial year (incl. transaction costs on securities transactions (not included in the statement of income and expenditure))
Allianz Europazins -A- EUR 986.05
Explanation of net changeThe net change in unrealised gains and losses is calculated by comparing the value of the assets included in the unit price with the respective historical costs each financial year; the amount of the positive differences is included in the total unrealised gains, the amount of the negative differences is included in the total unrealised losses, and the net changes are calculated by comparing total positions as at the end of the financial year with those at the beginning of the financial year.
Note on reporting forward exchange contractsThe presentation of the forward exchange contracts (FEC) held in the portfolio has changed in comparison with the previous financial year.
All FEC are now reported as “opening”. In the previous year the transaction and offsetting transaction of an FEC were presented netted as “closing”, provided the transactions were based on an identical currency pair and identical maturity.
17
Auditor’s Report1)
Frankfurt/Main, 18 April 2016
Allianz Global Investors GmbHThe Board of Management
To Allianz Global Investors GmbH, Frankfurt/Main
Allianz Global Investors GmbH engaged us to audit the Annual Report of the Fund Allianz Europazins for the financial year from 1 January 2015 to 31 December 2015 pursuant to Section 102 of the Investment Code (KAGB).
Management’s Responsibility
As stipulated in the German Investment Code (KAGB), the preparation of the annual report is the responsibility of the legal representatives of the investment management company.
Auditor‘s Responsibility
Our responsibility is to express an opinion on the annual report based on our audit.
We conducted our audit in accordance with Section 102 KAGB and the generally accepted standards for the audit of financial statements promulgated by the German Institut der Wirtschaftsprüfer (Institute of Public Auditors in Germany) (IDW). Those standards require that we plan and perform the audit such that misstatements materially affecting the annual report are detected with reasonable assurance. Knowledge of the management of the investment fund and evaluations of possible misstatements are taken into account in the determination of audit procedures. The effectiveness of the accounting-related internal control system and the evidence supporting the annual report are examined primarily on a test basis within the framework of the audit. The audit includes assessing the
accounting principles used for the annual report and significant estimates made by the legal representatives of the Investment Management Company. We believe that our audit provides a reasonable basis for our opinion.
Opinion
In our opinion, based on the findings of our audit, the Annual Report for the financial year from 1 January 2015 to 31 December 2015 complies with the legal requirements.
Frankfurt/Main, 18 April 2016
KPMG AGWirtschaftsprüfungsgesellschaft
Warnke SteinbrennerAuditor Auditor
1) Unsigned translation of the German auditor’s report.

18
Allianz Europazins
Further information (not covered by the auditor’s certificate)
Engagement of sub-custodiansThe custodial office has transferred the custodial duties in general to the companies listed below (sub-custodians). The sub-custodians act either as intermediate custodians, sub-custodians or central custodians. The information refers to assets in the countries or markets indicated below:
Country or market Sub-custodian
ARGENTINA EUROCLEAR BANK S.A- Indirect via HSBC Bank Argentina S.A. for equities
AUSTRALIA BNP PARIBAS SECURITIES SERVICES S.C.A.
AUSTRIA BNP PARIBAS SECURITIES SERVICES S.C.A.
BAHRAIN HSBC BANK MIDDLE EAST LTD
BANGLADESH HONG KONG AND SHANGHAI BANKING CORP LIMITED
BELGIUM BNP PARIBAS SECURITIES SERVICES S.C.A.
BENIN STANDARD CHARTERED BANK CÔTE D’IVOIRE SA
BERMUDA BANK OF BERMUDA (HSBC Group)
BOSNIA AND HERZEGOVINA UNICREDIT BANK AUSTRIA AG VIENNA- Indirect via UniCredit Bank d.d., Sarajevo
BOTSWANA STANDARD CHARTERED BANK OF BOTSWANA LTD
BRAZIL BANCO BNP PARIBAS BRASIL SA
BULGARIA UNICREDIT BULBANK A.D.
BURKINA FASO STANDARD CHARTERED BANK CÔTE D’IVOIRE SA
CANADA ROYAL BANK OF CANANDA (INVESTOR & TREASURY SERVICES )
CHILE BANCO DE CHILE (CITIBANK N.A)
CHINA HSBC BANK (CHINA) COMPANY LIMITED
COLOMBIA BNP PARIBAS SECURITIES SERVICES SOCIEDAD FIDUCIARIA BOGOTA
COSTA RICA BANCO BCT S.A.
CROATIA UNICREDIT BANK AUSTRIA AG VIENNA- Indirect via Zagrebacka Banka d.d., Zagreb
CYPRUS BNP PARIBAS SECURITIES SERVICES S.C.A.
CZECH REPUBLIC CITIBANK EUROPE PLC PRAGUE BRANCH
DENMARK NORDEA BANK DANMARK A/S
ECUADOR BANCO DE LA PRODUCCION SA-PRODUBANCO
EGYPT CITIBANK N.A. Egypt
ESTONIA AS SEB PANK
FINLAND NORDEA BANK FINLAND PLC
FRANCE BNP PARIBAS SECURITIES SERVICES S.C.A.
GERMANY BNP PARIBAS SECURITIES SERVICES S.C.A.
GHANA STANDARD CHARTERED BANK OF GHANA LTD
GREECE BNP PARIBAS SECURITIES SERVICES S.C.A.
GUINEA - BISSAU STANDARD CHARTERED BANK CÔTE D’IVOIRE SA
HONG KONG SAR BNP PARIBAS SECURITIES SERVICES S.C.A
HUNGARY BNP PARIBAS SECURITIES SERVICES S.C.A.
ICELAND ISLANDSBANKI
INDIA BNP PARIBAS
INDONESIA HONG KONG AND SHANGHAI BANKING CORP LIMITED, JAKARTA
INTERNATIONAL CSD CLEARSTREAM BANKING SA
INTERNATIONAL CSD EUROCLEAR BANK SA
IRELAND BNP PARIBAS SECURITIES SERVICES S.C.A.

19
Allianz Europazins
Country or market Sub-custodianISRAEL CITIBANK N.A. ISRAEL
ITALY BNP PARIBAS SECURITIES SERVICES S.C.A.
IVORY COAST STANDARD CHARTERED BANK CÔTE D’IVOIRE SA
JAPAN HONG KONG AND SHANGHAI BANKING CORP LIMITED, TOKYO
JORDAN STANDARD CHARTERED BANK, JORDAN BRANCH
KAZAKHSTAN JSC CITIBANK KAZAKHSTAN
KENYA STANDARD CHARTERED BANK PLC
KOREA, REPUBLIC OF HONG KONG AND SHANGHAI BANKING CORP LIMITED, SEOUL
KUWAIT HSBC BANK MIDDLE EAST LTD
LATVIA AS SEB BANKA
LEBANON HSBC BANK MIDDLE EAST LTD
LITHUANIA AB SEB BANKAS
MALAYSIA HSBC BANK MALAYSIA BERHAD, KUALA LUMPUR
MALI STANDARD CHARTERED BANK CÔTE D’IVOIRE SA
MALTA CLEARSTREAM BANKING SA
MAURITIUS HONG KONG AND SHANGHAI BANKING CORP LIMITED, PORT-LOUIS
MEXICO BANCO NACIONAL DE MEXICO (BANAMEX)
MOROCCO BANQUE MAROCAINE POUR LE COMMERCE ET L’INDUSTRIE
NAMIBIA STANDARD BANK OF NAMIBIA LIMITED
NETHERLANDS BNP PARIBAS SECURITIES SERVICES S.C.A.
NEW ZEALAND BNP PARIBAS SECURITIES SERVICES S.C.A.
NIGER STANDARD CHARTERED BANK CÔTE D’IVOIRE SA
NIGERIA STANBIC IBTC BANK
NORWAY NORDEA BANK NORGE ASA
OMAN HSBC BANK OMAN SAOG
PAKISTAN CITIBANK N.A. KARACHI
PERU CITIBANK DEL PERU
PHILIPPINES HONG KONG AND SHANGHAI BANKING CORP LIMITED, MANILA
POLAND BNP PARIBAS SECURITIES SERVICES S.C.A.
PORTUGAL BNP PARIBAS SECURITIES SERVICES S.C.A.
QATAR HSBC BANK MIDDLE EAST LTD
ROMANIA CITIBANK EUROPE PLC BUCHAREST BRANCH
RUSSIA AO CITIBANK (JOINT STOCK COMPANY COMMERCIAL BANK CITIBANK)
SAUDI ARABIA SAUDI ARABIA BRITISH BANK( HSBC GROUP)
SENEGAL STANDARD CHARTERED BANK CÔTE D’IVOIRE SA
SERBIA UNICREDIT BANK AUSTRIA AG VIENNA- Indirect via UniCredit Bank Srbija d.d., Belgrad
SINGAPORE BNP PARIBAS SECURITIES SERVICES S.C.A- Indirect via United Overseas Bank LTD for government bonds
SLOVAK REPUBLIC CITIBANK EUROPE PLC BRATISLAVA BRANCH
SLOVENIA UNICREDIT BANKA SLOVENIJA D.D. LJUBLJANA- Indirect via UniCredit Bank Slovenija d.d., Ljubljana
SOUTH AFRICA STANDARD BANK OF SOUTH AFRICA LIMITED
SPAIN BNP PARIBAS SECURITIES SERVICES S.C.A.
SRI LANKA HONG KONG AND SHANGHAI BANKING CORP LIMITED, COLOMBO
SWAZILAND STANDARD BANK OF SWAZILAND LIMITED
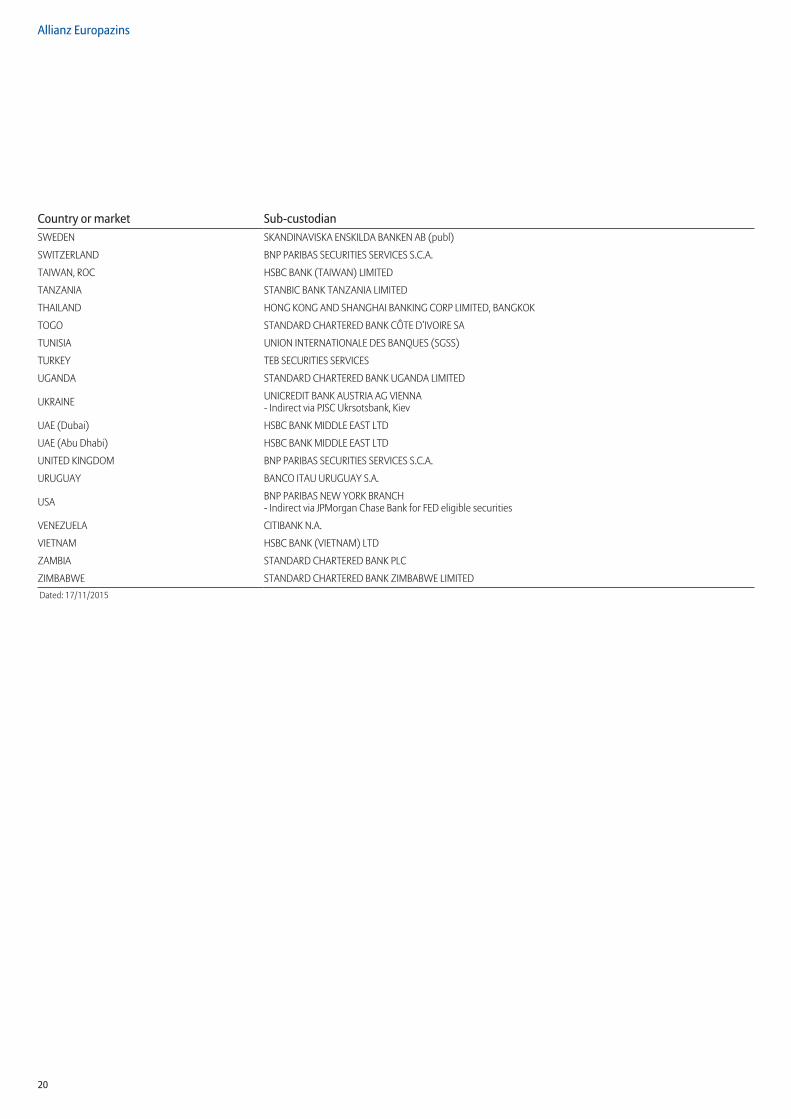
20
Allianz Europazins
Country or market Sub-custodianSWEDEN SKANDINAVISKA ENSKILDA BANKEN AB (publ)
SWITZERLAND BNP PARIBAS SECURITIES SERVICES S.C.A.
TAIWAN, ROC HSBC BANK (TAIWAN) LIMITED
TANZANIA STANBIC BANK TANZANIA LIMITED
THAILAND HONG KONG AND SHANGHAI BANKING CORP LIMITED, BANGKOK
TOGO STANDARD CHARTERED BANK CÔTE D’IVOIRE SA
TUNISIA UNION INTERNATIONALE DES BANQUES (SGSS)
TURKEY TEB SECURITIES SERVICES
UGANDA STANDARD CHARTERED BANK UGANDA LIMITED
UKRAINE UNICREDIT BANK AUSTRIA AG VIENNA- Indirect via PJSC Ukrsotsbank, Kiev
UAE (Dubai) HSBC BANK MIDDLE EAST LTD
UAE (Abu Dhabi) HSBC BANK MIDDLE EAST LTD
UNITED KINGDOM BNP PARIBAS SECURITIES SERVICES S.C.A.
URUGUAY BANCO ITAU URUGUAY S.A.
USA BNP PARIBAS NEW YORK BRANCH- Indirect via JPMorgan Chase Bank for FED eligible securities
VENEZUELA CITIBANK N.A.
VIETNAM HSBC BANK (VIETNAM) LTD
ZAMBIA STANDARD CHARTERED BANK PLC
ZIMBABWE STANDARD CHARTERED BANK ZIMBABWE LIMITEDDated: 17/11/2015

21
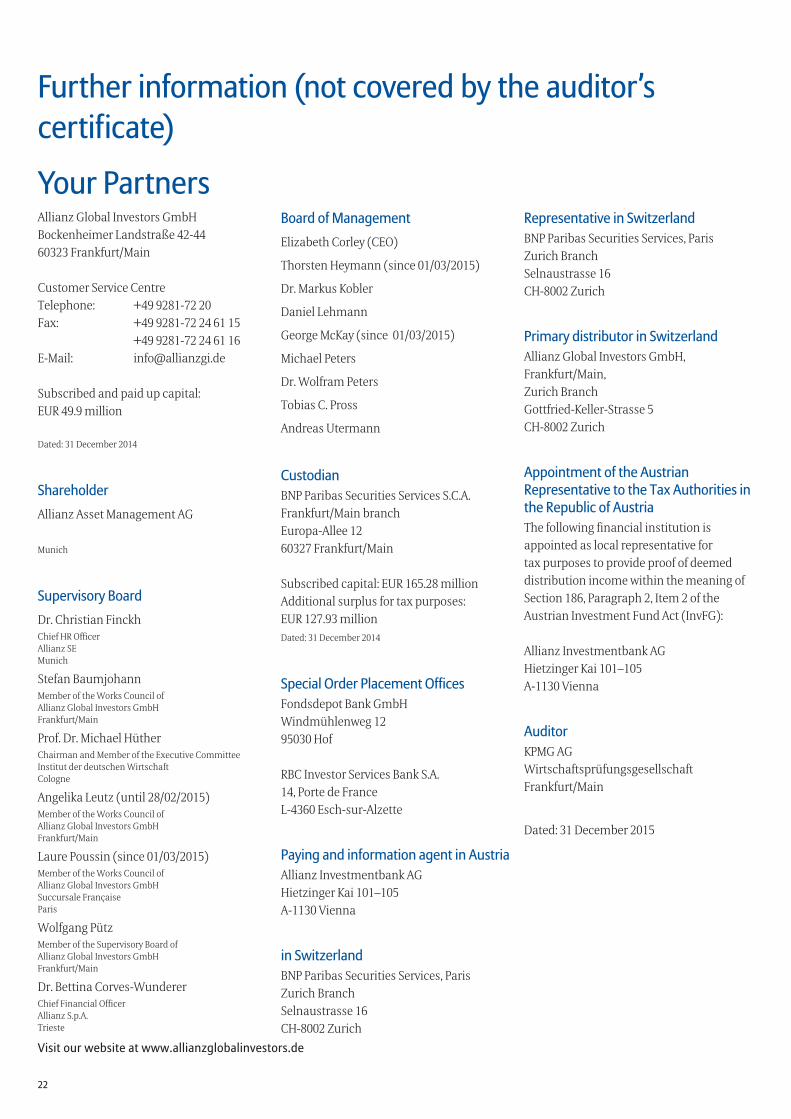
22
Further information (not covered by the auditor’s certificate)
Your PartnersAllianz Global Investors GmbHBockenheimer Landstraße 42-4460323 Frankfurt/Main
Customer Service CentreTelephone: +49 9281-72 20Fax: +49 9281-72 24 61 15
+49 9281-72 24 61 16E-Mail: [email protected]
Subscribed and paid up capital:EUR 49.9 million
Dated: 31 December 2014
ShareholderAllianz Asset Management AG
Munich
Supervisory BoardDr. Christian FinckhChief HR OfficerAllianz SEMunich
Stefan BaumjohannMember of the Works Council ofAllianz Global Investors GmbHFrankfurt/Main
Prof. Dr. Michael HütherChairman and Member of the Executive CommitteeInstitut der deutschen Wirtschaft Cologne
Angelika Leutz (until 28/02/2015)Member of the Works Council ofAllianz Global Investors GmbHFrankfurt/Main
Laure Poussin (since 01/03/2015)Member of the Works Council ofAllianz Global Investors GmbHSuccursale FrançaiseParis
Wolfgang PützMember of the Supervisory Board ofAllianz Global Investors GmbHFrankfurt/Main
Dr. Bettina Corves-WundererChief Financial OfficerAllianz S.p.A.Trieste
Board of ManagementElizabeth Corley (CEO)
Thorsten Heymann (since 01/03/2015)
Dr. Markus Kobler
Daniel Lehmann
George McKay (since 01/03/2015)
Michael Peters
Dr. Wolfram Peters
Tobias C. Pross
Andreas Utermann
CustodianBNP Paribas Securities Services S.C.A.Frankfurt/Main branchEuropa-Allee 1260327 Frankfurt/Main
Subscribed capital: EUR 165.28 millionAdditional surplus for tax purposes:EUR 127.93 millionDated: 31 December 2014
Special Order Placement OfficesFondsdepot Bank GmbHWindmühlenweg 1295030 Hof
RBC Investor Services Bank S.A. 14, Porte de France L-4360 Esch-sur-Alzette
Paying and information agent in AustriaAllianz Investmentbank AGHietzinger Kai 101–105A-1130 Vienna
in SwitzerlandBNP Paribas Securities Services, ParisZurich BranchSelnaustrasse 16CH-8002 Zurich
Representative in SwitzerlandBNP Paribas Securities Services, ParisZurich BranchSelnaustrasse 16CH-8002 Zurich
Primary distributor in SwitzerlandAllianz Global Investors GmbH, Frankfurt/Main, Zurich BranchGottfried-Keller-Strasse 5 CH-8002 Zurich
Appointment of the Austrian Representative to the Tax Authorities in the Republic of AustriaThe following financial institution isappointed as local representative for tax purposes to provide proof of deemed distribution income within the meaning ofSection 186, Paragraph 2, Item 2 of theAustrian Investment Fund Act (InvFG):
Allianz Investmentbank AGHietzinger Kai 101–105A-1130 Vienna
AuditorKPMG AGWirtschaftsprüfungsgesellschaftFrankfurt/Main
Dated: 31 December 2015
Visit our website at www .allianzglobalinvestors .de

23
Further information (not covered by the auditor’s certificate)
Information for investors in the Republic of AustriaThe sale of units in the fund Allianz Europazins in the Republic of Austria has been registered with the Finanzmarktaufsicht (Vienna) in accordance with Section 140 of the Investment Fund Act (Investmentfondsgesetz – InvFG).
Redemption requests for units in the aforementioned fund can be submitted to the Austrian paying and information agent and the redemption proceeds, possible distributions and any other payments can be paid out to the unitholders by the Austrian paying and information agent, at their request, in euro cash.
Investors may obtain all necessary information from the Austrian payment and information agent for free, for example· the prospectus, · the investment terms and conditions,· the key investor information,· the annual and semi-annual reports,· the issue and redemption prices.
Prior to acquiring units of the fund, investors are recommended to ascertain whether the income data on the unit class that is required for tax purposes is published by the Oesterreichische Kontrollbank.
24
Further information (not included in the auditor’s opinion)
Information for investors in Switzerland1 . Representative and Paying Agent in Switzerland
BNP Paribas Securities Services, Paris, Succursale de Zurich, Selnaustrasse 16, CH-8002 Zurich, is Representative and Paying Agent in Switzerland for the units distributed in Switzerland.
2 . Place where the Relevant Documents may be obtained
The prospectus, the key investor information, the investment terms and conditions and the annual and semi-annual reports may be obtained without charge from the Representative in Switzerland.
3 . Publications
Publications in Switzerland are made at www.fundinfo.com. In Switzerland, subscription and redemption prices and/or the net asset value (with the indication “commissions excluded”) of the units are published daily at www.fundinfo.com.
4 . Payment of retrocessions and rebates
Retrocessions:
The Management Company and its agents may pay retrocessions as remuneration for distribution activity in respect of units in or from Switzerland. This remuneration may be deemed payment for the following services in particular:
- setting up processes for subscribing, holding and safe custody of the units;
- keeping a supply of marketing and legal documents, and issuing the said documents;
- forwarding or providing access to legally required publications and other publications;
- performing due diligence delegated by the Management Company in areas such as money laundering, ascertaining client needs and distribution restrictions;
- mandating an authorised auditor to check compliance with certain duties of the Distributor, in particular with the Guidelines on the Distribution of Collective Investment Schemes issued by the Swiss Funds & Asset Management Association SFAMA;
- operating and maintaining an electronic distribution and/or information platform;
- clarifying and answering specific questions from investors pertaining to the funds or the Management Company or the Sub-Investment Manager;
- drawing up fund research material;
- central relationship management;
- subscribing for units as a “nominee” for several clients as mandated by the Management Company;
- training client advisors in collective investment schemes;
- mandating and monitoring additional distributors.
Retrocessions are not deemed to be rebates even if they are ultimately passed on, in full or in part, to the investors.
The recipients of the retrocessions must ensure transparent disclosure and inform the investor, unsolicited and free of charge, about the amount of remuneration they may receive for distribution.
On request, the recipients of retrocessions must disclose the amounts they actually receive for distributing the collective investment schemes of the investors concerned.
Rebates:
In the case of distribution activity in or from Switzerland, the Management Company and its agents may, upon request, pay rebates directly to investors. The purpose of rebates is to reduce the fees or costs incurred by the investor in question.
Rebates are permitted provided that:
- they are paid from fees received by the Management Company and therefore do not represent an additional charge on the fund assets;
- they are granted on the basis of objective criteria;
25
Allianz Europazins
- all investors who meet the objective criteria and demand rebates are also granted these within the same timeframe and to the same extent.
The objective criteria for the granting of rebates by the Management Company are:
- the volume subscribed by the investor or the total volume they hold in the collective investment scheme or, where applicable, in the product range of the promoter;
- the amount of the fees generated by the investor;
- the investment behaviour shown by the investor (e.g. expected investment period);
- the investor’s willingness to provide support in the launch phase of a collective investment scheme.
At the request of the investor, the Management Company must disclose the amounts of such rebates free of charge.
5 . Place of Performance and Jurisdiction
The place of performance and jurisdiction for units distributed in Switzerland is at the registered office of the Representative in Switzerland.

Allianz Global Investors GmbHBockenheimer Landstraße 42–4460323 Frankfurt/[email protected]

Annual Report31 December 2015
Allianz Telemedia
Allianz Global Investors GmbH
This report is a non-binding translation of the German original excluding the tax information for investors resident in Germany.
Contents
Allianz Telemedia
Activity report . . . . . . . . . . . . . . . . . . . . . . . . . . . . . . . . . . . . . . . . . . . . . . . . . . . . . 1
Asset overview at 31/12/2015 . . . . . . . . . . . . . . . . . . . . . . . . . . . . . . . . . . . . . . . 3
Investment portfolio at 31/12/2015 . . . . . . . . . . . . . . . . . . . . . . . . . . . . . . . . . . 4
Unit classes . . . . . . . . . . . . . . . . . . . . . . . . . . . . . . . . . . . . . . . . . . . . . . . . . . . . . . . . 10
Annex . . . . . . . . . . . . . . . . . . . . . . . . . . . . . . . . . . . . . . . . . . . . . . . . . . . . . . . . . . . . . 11
Auditor’s Report . . . . . . . . . . . . . . . . . . . . . . . . . . . . . . . . . . . . . . . . . . . . . . . . . . . . 14
Further information (not covered by the auditor’s certificate)
Engagement of sub-custodians . . . . . . . . . . . . . . . . . . . . . . . . . . . . . . . . . . . . . . 15
Your Partners . . . . . . . . . . . . . . . . . . . . . . . . . . . . . . . . . . . . . . . . . . . . . . . . . . . . . . 20
Information for investors in the Republic of Austria . . . . . . . . . . . . . . . . . . . . 21

1
Allianz TelemediaActivity report
The Fund operates in the global equity market, primarily in the telecommunication services and media sectors. The investment objective is to generate capital growth over the long term.
During the year under review ending in December 2015, the Fund continued to concentrate on investments in US media and telecommunications stocks; however, their share was appreciably reduced. The exposure to the UK was also reduced, in particular by completely selling a holding in a media group. Conversely, positions in companies from Japan, Switzerland and the Netherlands were strengthened as a result of stock-picking. The extensive positions in communication service providers from Germany remained largely unchanged. By contrast, the Fund avoided investments in the relatively low-growth markets in France and countries on the Eurozone’s periphery. A new investment was made in a Chinese mobile phone group which is listed in Hong Kong, among other investments. At industry level, holdings in telecommunications providers increased as a result of reallocations, while the share of more cyclical media companies fell.
With its investment policy, the Fund obtained a significant gain. This was due in large part to the focus on investments in the US stock exchange. They benefited, in euro terms, from the significant appreciation of the dollar, while the broad equity market in the US stagnated in local currency. At the same time, some actively overweighted stocks in the portfolio performed particularly well, with the result that the Fund performed noticeably better than the average of the replicated equity market segment, even in consideration of ongoing costs.
The performance, which was calculated according to the BVI method, amounted to 15.61% during the reporting period. The MSCI World Media/MSCI World Telecommunication Services Total Return (Net) MSCI weighted performance benchmark over the same period was 11.29%.
In order to quantify the market price risks achieved during the reporting year, the Company calculates the volatility of the value of the fund units during this period. The calculated volatility is compared to the volatility of a global mixed equity/bond index portfolio. If the achieved volatility of the fund is significantly higher than that of the index portfolio, the market price risk of the fund is classified as “high”. If the volatility of the fund is similar to that of the index portfolio, the risk is classified as “medium”. And if the fund’s volatility is considerably lower than that of the index portfolio, the market price risk is classified as “low”.
The fund Allianz Telemedia achieved a high market price risk during the reporting period.
Any effects which the exchange-rate movements of a foreign currency versus the fund’s base currency may have had on the fund’s value are assessed on the basis of the extent to which the fund had invested in assets denominated in foreign currencies during the reporting year, including any hedging transactions.
During the reporting period, a high proportion of the fund Allianz Telemedia was invested in assets whose value is directly affected by movements of the foreign currency versus the fund’s base currency.
The liquidity risks taken by the fund during the reporting period are assessed according to the proportion of assets which may not be easy to sell or which may possibly be sold only at a lower price.
The fund Allianz Telemedia was subject to a low liquidity risk during the reporting period.
In order to quantify the risks of settlement default taken during the reporting period the Company analyses the proportion of assets for which a default risk exists and their default potential. If a considerable proportion of the fund’s money was invested in assets with a high default risk and high default potential, the fund’s risk of settlement default is classified as “high”. If the proportion of assets with a high default risk was moderate or if the default potential is medium, the risk is classified as “medium”. If the fund invested only a small proportion in assets with a high default risk or if the default potential was low, the risk of settlement default is classified as “low”.
During the reporting period, the fund Allianz Telemedia had invested a small proportion of its money in assets with a high default risk.
In order to assess the operational risks of the Company’s procedures, the Company conducts detailed risk assessments for relevant processes identified by a risk-oriented overview, identifies weaknesses and defines measures to remedy these weaknesses. If clearly defined services are outsourced to external suppliers, the Company monitors these suppliers by regular quality controls and reviews. Any operational risk events identified are immediately remedied, recorded, analysed and prevention measures are defined. If an operational risk event affects the fund, any relevant losses will be compensated by the Company on principle.

2
Allianz Telemedia
While, during the reporting period, the fund Allianz Telemedia was basically subject to operational risks stemming from the Company’s procedures, it was not subject to elevated operative risks.
The main sources of the performance during the reporting period are as follows:
Realised gains result mainly from the sale of equities and from trading REIT dividends.
Realised losses mainly result from the sale of equities.
Please see the Key Investor Information Document and the prospectus for more information on the Fund’s investment focus and objectives.
Fund Assets in %
75
60
45
30
15
0
Telecommunications Consumer cyclical Financial services provider Information technology Cash reserves, other assets
at the beginning of the financial year at the end of the financial year
40 .448 .5 47 .6
38 .4
3 .3 4 .8 2 .3 5 .0 6 .4 3 .3
Development of net assets and unit value in a 3-year comparison ISIN: DE0008481789/WKN: 848 17831/12/2015 31/12/2014 31/12/2013 31/12/2012
Net assets in EUR m 71.6 79.8 75.7 54.4
Unit value in EUR 58.69 52.62 45.66 33.80

3
Allianz Telemedia
Asset overview at 31/12/2015
Breakdown by asset category – country Market value in EUR % of netassets *)
I . Assets
1 . Equities 69,222,654 .55 96 .69
Germany 10,055,314.04 14.04
The Netherlands 3,260,932.00 4.55
Switzerland 3,636,967.76 5.08
UK 14,847,471.85 20.73
USA 28,959,226.15 40.47
Canada 889,992.05 1.24
China 368.97 0.00
Japan 6,542,035.16 9.14
Hong Kong 1,030,346.57 1.44
2 . Bank deposits 2,168,904 .71 3 .04
3 . Other assets 251,731 .94 0 .35II . Liabilities -62,211 .10 -0 .08III . Fund assets 71,581,080 .10 100 .00*) Minor rounding differences may be the result of percentage rounding during the calculation.
Breakdown by asset category – currency Market value in EUR % of netassets *)
I . Assets
1 . Equities 69,222,654 .55 96 .69
CHF 3,636,967.76 5.08
EUR 13,316,246.04 18.59
GBP 14,847,471.85 20.73
HKD 1,030,715.54 1.44
JPY 6,542,035.16 9.14
USD 29,849,218.20 41.71
2 . Bank deposits 2,168,904 .71 3 .04
3 . Other assets 251,731 .94 0 .35II . Liabilities -62,211 .10 -0 .08III . Fund assets 71,581,080 .10 100 .00

4
Allianz Telemedia
Investment portfolio at 31/12/2015ISIN Securities Market Shares/ Balance Purchases Redemptions Price Market value % of net
Units/ 31/12/2015 EUR assetsCurrency in the period under review
Exchange-traded securities 66,928,254 .55 93 .48Equities 66,928,254 .55 93 .48Miscellaneous telecommunication services 19,240,636 .94 26 .87US00206R1023 AT & T Inc. Reg.Shares SHS 50,424 0 31,500 USD 34.930 1,610,223.09 2.25GB0030913577 BT Group PLC Reg.Shares SHS 550,000 210,000 510,000 GBP 4.700 3,503,139.61 4.89CNE1000002V2 China Telecom Corp. Ltd. Reg.Shares H SHS 857 0 0 HKD 3.650 368.97 0.00DE0005557508 Deutsche Telekom AG Namens-Aktien SHS 50,000 0 5,000 EUR 16.800 840,000.00 1.17NL0000009082 Kon. KPN N.V. Aandelen aan toonder SHS 483,000 330,000 782,000 EUR 3.504 1,692,432.00 2.36JP3735400008 Nippon Telegraph & Telephone Corp. Reg.Shares SHS 98,000 49,000 0 JPY 4,836.000 3,597,356.49 5.03CH0267291224 Sunrise Communications Gr. AG Nam.-Aktien SHS 38,645 38,645 0 CHF 59.000 2,102,954.67 2.94CH0008742519 Swisscom AG Namens-Aktien SHS 3,300 1,440 1,500 CHF 504.000 1,534,013.09 2.14DE000A1J5RX9 Telefónica Deutschland Hldg AG Namens-Aktien SHS 270,000 150,000 124,518 EUR 4.959 1,338,930.00 1.87US92343V1044 Verizon Communications Inc. Reg.Shares SHS 70,000 30,000 36,200 USD 47.210 3,021,219.02 4.22Wireless telecommunication services 15,500,778 .47 21 .65HK0941009539 China Mobile Ltd. Reg.Shares SHS 100,000 100,000 0 HKD 87.350 1,030,346.57 1.44DE0005545503 Drillisch AG Inhaber-Aktien SHS 25,300 0 57,700 EUR 39.410 997,073.00 1.39JP3496400007 KDDI Corp. Reg.Shares SHS 123,000 123,000 0 JPY 3,154.000 2,944,678.67 4.11US85207U1051 Sprint Corp. Reg.Shares Sr.1 SHS 300,000 300,000 0 USD 3.850 1,055,922.77 1.48US8725901040 T-Mobile US Inc. Reg.Shares SHS 73,500 87,086 92,500 USD 40.120 2,695,866.82 3.77GB00BH4HKS39 Vodafone Group PLC Reg.Shares SHS 2,300,000 985,000 1,280,000 GBP 2.174 6,776,890.64 9.46Real estate investment trusts (REITs) 3,405,812 .61 4 .76US03027X1000 American Tower Corp. Reg.Shares SHS 18,000 18,000 0 USD 99.410 1,635,884.92 2.29US22822V1017 Crown Castle Internatl Corp. Reg.Shares new SHS 22,000 25,700 43,700 USD 88.000 1,769,927.69 2.47Internet software and services 1,275,250 .00 1 .78DE0005089031 United Internet AG Namens-Aktien SHS 25,000 11,000 8,000 EUR 51.010 1,275,250.00 1.78Media 27,505,776 .53 38 .42US90130A2006 21st Century Fox Inc. Reg.Shares B SHS 70,000 0 45,000 USD 27.600 1,766,270.81 2.47US1248572026 CBS Corp. Reg.Shares Cl.B SHS 75,000 59,000 67,000 USD 47.290 3,242,505.69 4.53US20030N1019 Comcast Corp. Reg.Shares Cl.A SHS 120,000 54,500 95,000 USD 57.560 6,314,692.41 8.82CA5359192039 Lions Gate Entertainment Corp. Reg.Shares SHS 30,000 51,500 21,500 USD 32.450 889,992.05 1.24DE000PSM7770 ProSiebenSat.1 Media SE Namens-Aktien SHS 30,000 8,400 51,400 EUR 47.000 1,410,000.00 1.97DE0007493991 Ströer SE Inhaber-Aktien SHS 12,560 0 70,157 EUR 57.059 716,661.04 1.00DE000TCAG172 Tele Columbus AG Namens-Aktien SHS 130,000 147,500 17,500 EUR 9.100 1,183,000.00 1.65US2546871060 The Walt Disney Co. Reg.Shares SHS 30,000 0 15,000 USD 107.080 2,936,836.62 4.10US88732J2078 Time Warner Cable Inc. Reg.Shares SHS 17,000 0 13,000 USD 187.230 2,909,876.31 4.07JE00B2R84W06 UBM PLC Reg.Shares SHS 250,000 125,600 420,000 GBP 5.290 1,792,415.88 2.50NL0000395903 Wolters Kluwer N.V. Aandelen op naam SHS 50,000 72,000 22,000 EUR 31.370 1,568,500.00 2.19JE00B8KF9B49 WPP PLC Reg.Shares SHS 130,000 42,000 92,000 GBP 15.750 2,775,025.72 3.88Securities admitted to or included in regulated markets 2,294,400 .00 3 .21Equities 2,294,400 .00 3 .21Internet software and services 2,294,400 .00 3 .21DE000A12UKK6 Rocket Internet SE Inhaber-Aktien SHS 80,000 73,404 13,404 EUR 28.680 2,294,400.00 3.21Total securities EUR 69,222,654 .55 96 .69Bank deposits, money market paper and money market fundsBank depositsEUR deposits with custodial office
BNP PARIBAS Securities Services S.C.A. EUR 226,606.83 % 100.000 226,606.83 0.32Deposits in non EU/EEA currencies
BNP PARIBAS Securities Services S.C.A. JPY 189,314,665.00 % 100.000 1,436,995.36 2.01BNP PARIBAS Securities Services S.C.A. USD 552,715.06 % 100.000 505,302.52 0.71
Total bank deposits EUR 2,168,904 .71 3 .04Total bank deposits, money market paper and money market funds EUR 2,168,904 .71 3 .04Other assets
Accrued dividends EUR 200,395.25 200,395.25 0.28Receivables from unit transactions EUR 2,849.61 2,849.61 0.00Receivables from withholding tax refunds EUR 48,487.08 48,487.08 0.07
Total other assets EUR 251,731 .94 0 .35Short-term liabilitiesLoans in other EU/EEA currencies
BNP PARIBAS Securities Services S.C.A. GBP -33,658.63 -45,618.35 -0.06Total short-term liabilities EUR -45,618 .35 -0 .06Other payables
Liabilities from unit transactions EUR -16,592.75 -16,592.75 -0.02Total other payables EUR -16,592 .75 -0 .02Fund assets EUR 71,581,080 .10 100 .00
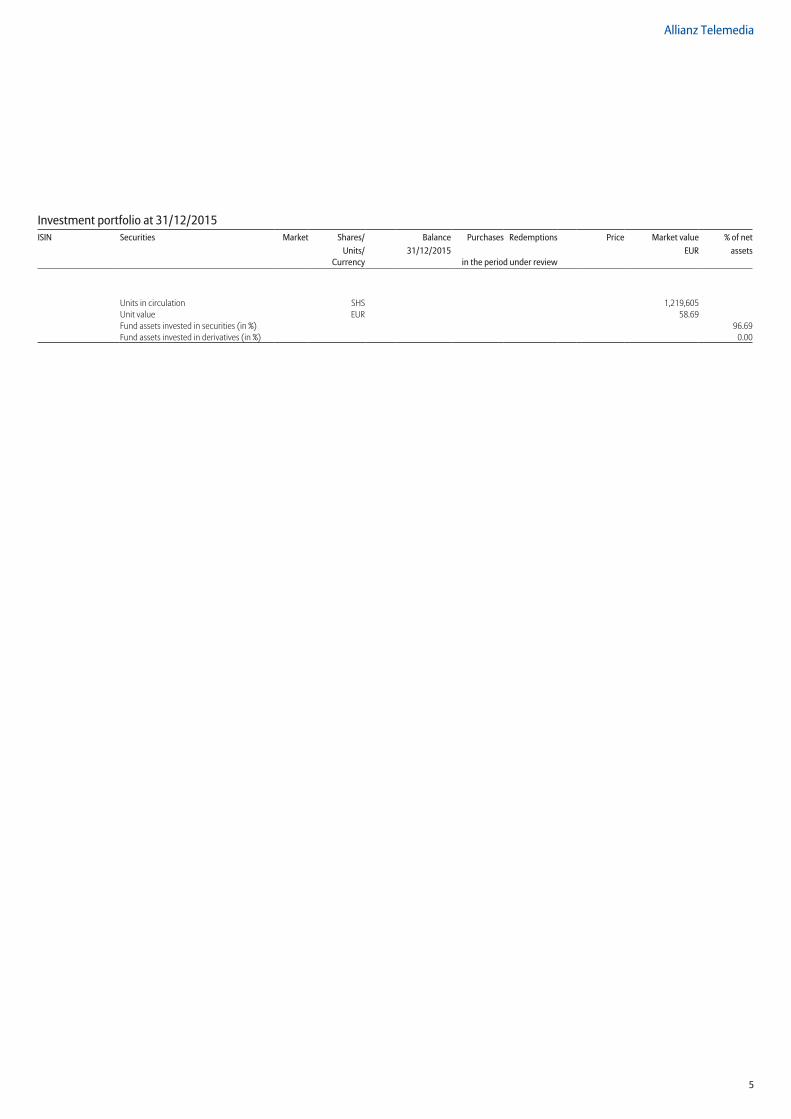
5
Allianz Telemedia
Investment portfolio at 31/12/2015ISIN Securities Market Shares/ Balance Purchases Redemptions Price Market value % of net
Units/ 31/12/2015 EUR assetsCurrency in the period under review
Units in circulation SHS 1,219,605Unit value EUR 58.69Fund assets invested in securities (in %) 96.69Fund assets invested in derivatives (in %) 0.00

6
Allianz Telemedia
Securities prices/market ratesFund assets were valued on the basis of the following prices/market rates:
North and South American equities: prices as at 29/12/2015 or last known
All other assets: prices/market rates as at 30/12/2015 or last known
Exchange rate(s) and/or conversion factor(s) (indirect quotation) as at 30/12/2015UK, Pound Sterling (GBP) 1 Euro = GBP 0.73783
Switzerland, Franc (CHF) 1 Euro = CHF 1.08422
USA, Dollar (USD) 1 Euro = USD 1.09383
Japan, Yen (JPY) 1 Euro = JPY 131.74341
Hong Kong, Dollar (HKD) 1 Euro = HKD 8.47773
Capital measures
All sales revenues resulting from capital measures (technical revenues) are reported as additions or disposals.
VotingTo the extent it was deemed to be in our investors’ interest, we either exercised ourselves or had our agents exercise, in accordance with our instructions, voting rights
for shares held by the Fund.
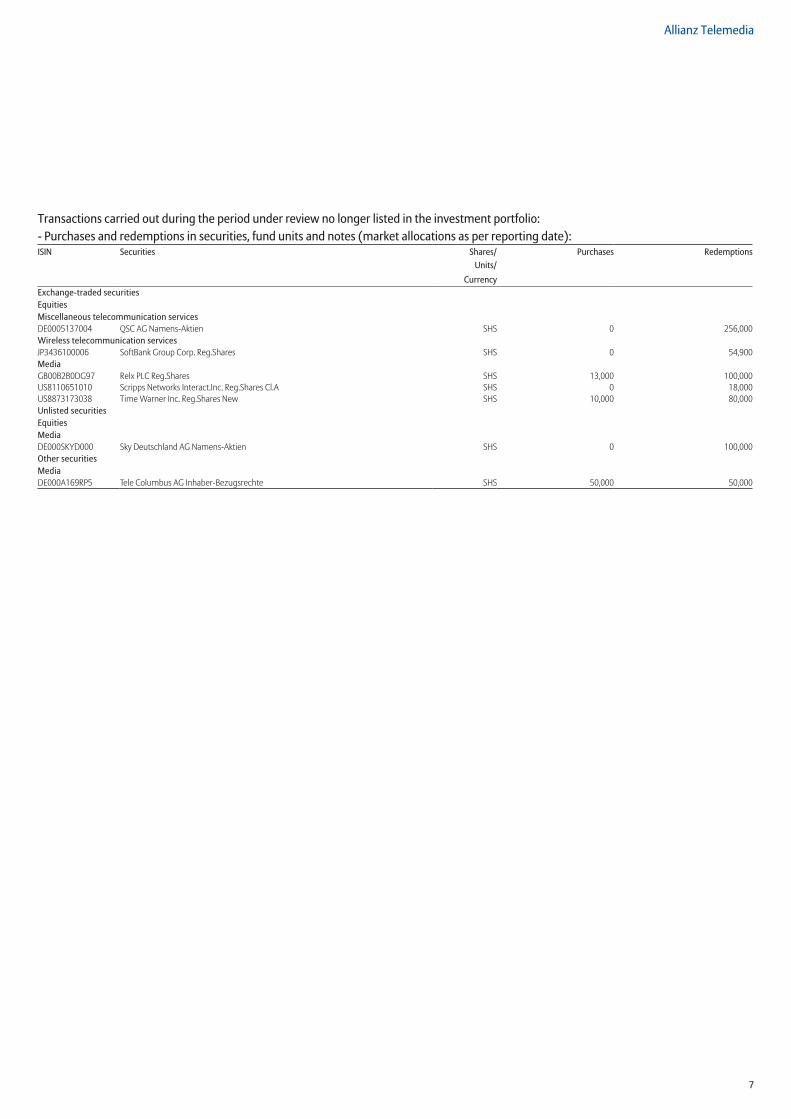
7
Allianz Telemedia
Transactions carried out during the period under review no longer listed in the investment portfolio:- Purchases and redemptions in securities, fund units and notes (market allocations as per reporting date):ISIN Securities Shares/ Purchases Redemptions
Units/Currency
Exchange-traded securitiesEquitiesMiscellaneous telecommunication servicesDE0005137004 QSC AG Namens-Aktien SHS 0 256,000Wireless telecommunication servicesJP3436100006 SoftBank Group Corp. Reg.Shares SHS 0 54,900MediaGB00B2B0DG97 Relx PLC Reg.Shares SHS 13,000 100,000US8110651010 Scripps Networks Interact.Inc. Reg.Shares Cl.A SHS 0 18,000US8873173038 Time Warner Inc. Reg.Shares New SHS 10,000 80,000Unlisted securitiesEquitiesMediaDE000SKYD000 Sky Deutschland AG Namens-Aktien SHS 0 100,000Other securitiesMediaDE000A169RP5 Tele Columbus AG Inhaber-Bezugsrechte SHS 50,000 50,000
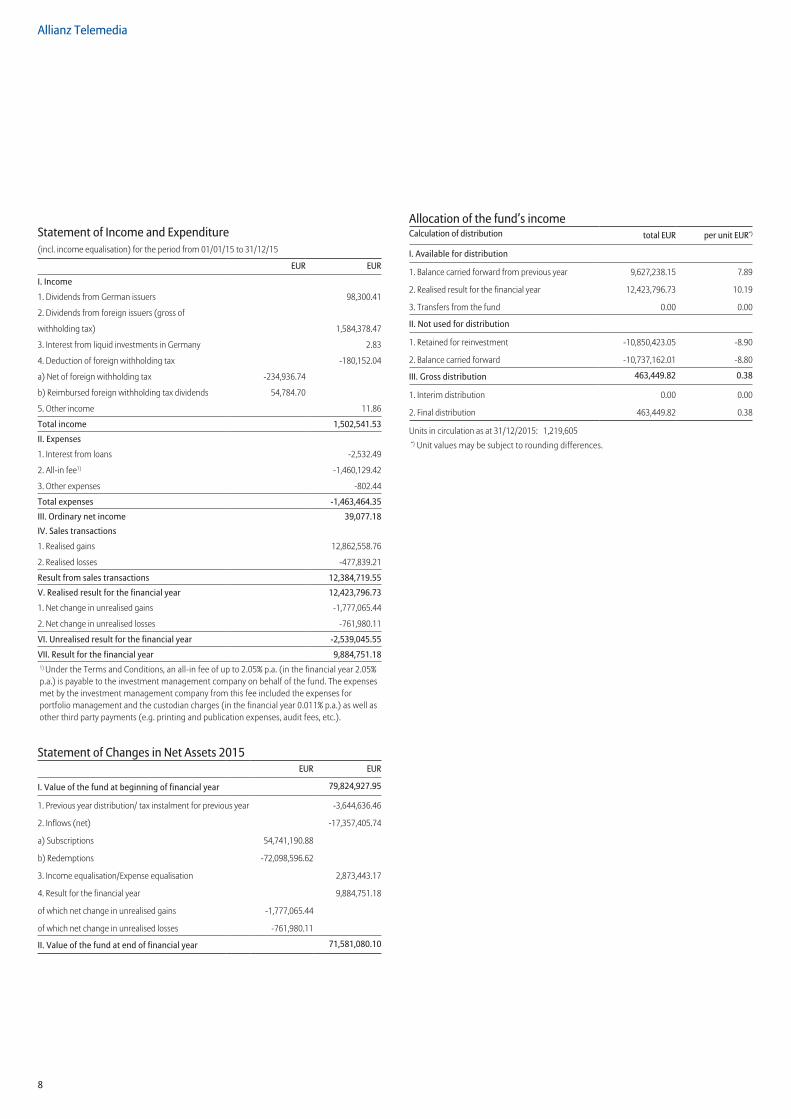
8
Allianz Telemedia
Statement of Income and Expenditure(incl. income equalisation) for the period from 01/01/15 to 31/12/15
EUR EUR
I . Income
1. Dividends from German issuers 98,300.41
2. Dividends from foreign issuers (gross of
withholding tax) 1,584,378.47
3. Interest from liquid investments in Germany 2.83
4. Deduction of foreign withholding tax -180,152.04
a) Net of foreign withholding tax -234,936.74
b) Reimbursed foreign withholding tax dividends 54,784.70
5. Other income 11.86
Total income 1,502,541 .53
II . Expenses
1. Interest from loans -2,532.49
2. All-in fee1) -1,460,129.42
3. Other expenses -802.44
Total expenses -1,463,464 .35
III . Ordinary net income 39,077 .18IV . Sales transactions
1. Realised gains 12,862,558.76
2. Realised losses -477,839.21
Result from sales transactions 12,384,719 .55
V . Realised result for the financial year 12,423,796 .73
1. Net change in unrealised gains -1,777,065.44
2. Net change in unrealised losses -761,980.11
VI . Unrealised result for the financial year -2,539,045 .55
VII . Result for the financial year 9,884,751 .181) Under the Terms and Conditions, an all-in fee of up to 2.05% p.a. (in the financial year 2.05% p.a.) is payable to the investment management company on behalf of the fund. The expenses met by the investment management company from this fee included the expenses for portfolio management and the custodian charges (in the financial year 0.011% p.a.) as well as other third party payments (e.g. printing and publication expenses, audit fees, etc.).
Statement of Changes in Net Assets 2015EUR EUR
I . Value of the fund at beginning of financial year 79,824,927 .95
1. Previous year distribution/ tax instalment for previous year -3,644,636.46
2. Inflows (net) -17,357,405.74
a) Subscriptions 54,741,190.88
b) Redemptions -72,098,596.62
3. Income equalisation/Expense equalisation 2,873,443.17
4. Result for the financial year 9,884,751.18
of which net change in unrealised gains -1,777,065.44
of which net change in unrealised losses -761,980.11
II . Value of the fund at end of financial year 71,581,080 .10
Allocation of the fund’s incomeCalculation of distribution total EUR per unit EUR*)
I . Available for distribution
1. Balance carried forward from previous year 9,627,238.15 7.89
2. Realised result for the financial year 12,423,796.73 10.19
3. Transfers from the fund 0.00 0.00
II . Not used for distribution
1. Retained for reinvestment -10,850,423.05 -8.90
2. Balance carried forward -10,737,162.01 -8.80
III . Gross distribution 463,449 .82 0 .38
1. Interim distribution 0.00 0.00
2. Final distribution 463,449.82 0.38
Units in circulation as at 31/12/2015: 1,219,605 *) Unit values may be subject to rounding differences.

9
Allianz Telemedia
Performance of the fundFund Benchmark
MSCI World Media/MSCI World Telecommunication Services Total Return (Net) MSCI weighted
% %
1 year 31/12/2014 - 31/12/2015 15 .61 11 .29
2 years 31/12/2013 - 31/12/2015 34 .07 30 .84
3 years 31/12/2012 - 31/12/2015 82 .48 72 .03
4 years 31/12/2011 - 31/12/2015 110 .70 96 .68
5 years 31/12/2010 - 31/12/2015 116 .25 105 .46
10 years 31/12/2005 - 31/12/2015 119 .59 119 .70
Benchmark: index considered representative for the relevant investment segment, which is also the basis for the calculation of the performance fee – if any. Calculation basis: net asset value per unit (front-end loads excluded), distributions – if any – reinvested. Calculation in accordance with the BVI method (German Investment and Asset Management Association). Past figures are not a guarantee of future performance.
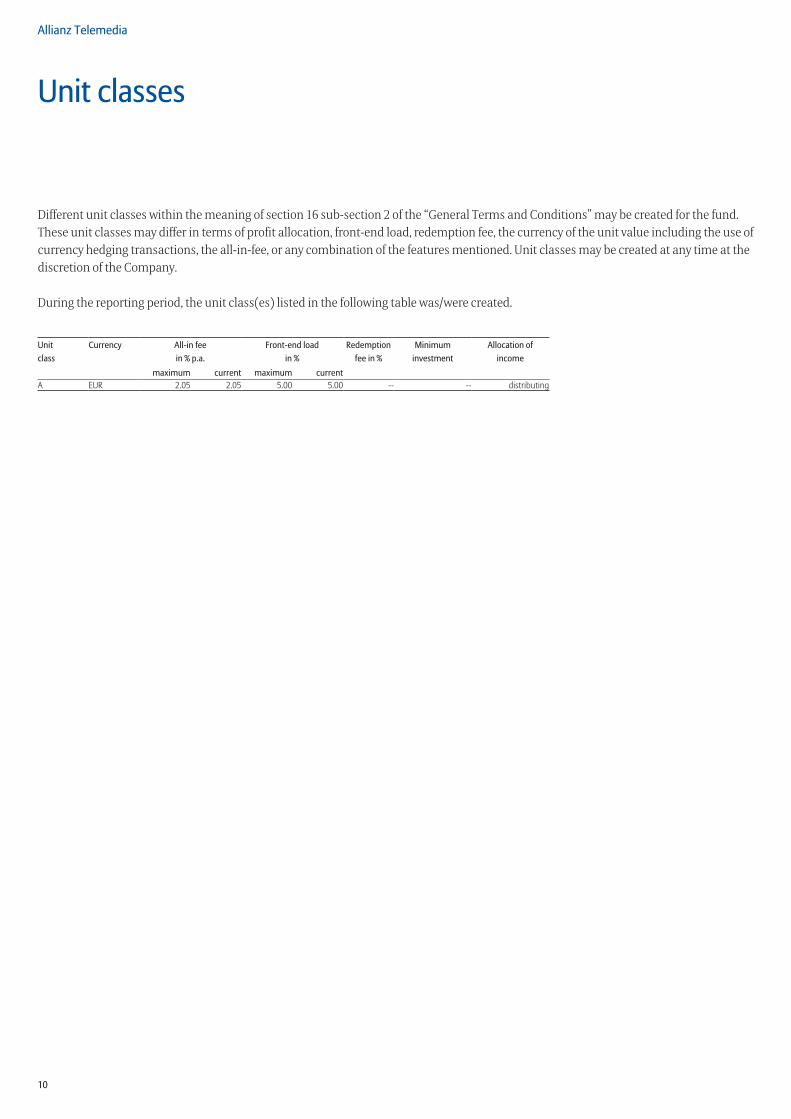
10
Allianz Telemedia
Unit classes
Different unit classes within the meaning of section 16 sub-section 2 of the “General Terms and Conditions” may be created for the fund. These unit classes may differ in terms of profit allocation, front-end load, redemption fee, the currency of the unit value including the use of currency hedging transactions, the all-in-fee, or any combination of the features mentioned. Unit classes may be created at any time at the discretion of the Company.
During the reporting period, the unit class(es) listed in the following table was/were created.
Unit Currency All-in fee Front-end load Redemption Minimum Allocation ofclass in % p .a . in % fee in % investment income
maximum current maximum currentA EUR 2.05 2.05 5.00 5.00 -- -- distributing
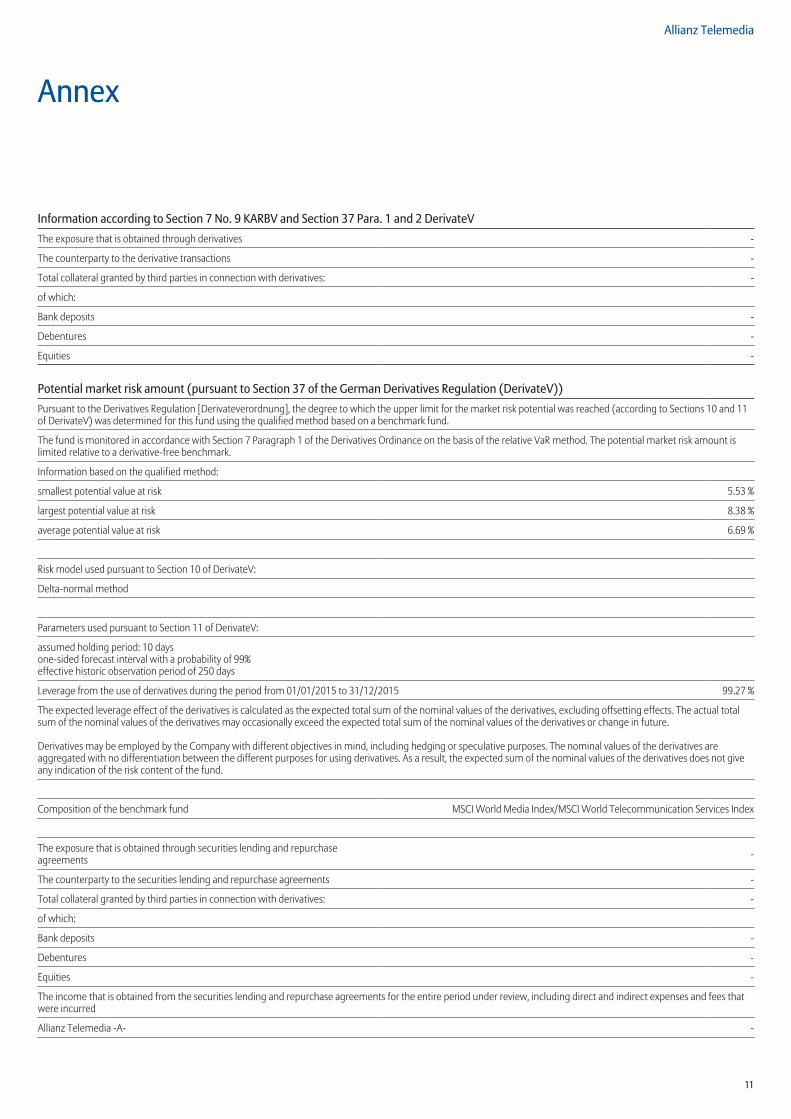
11
Allianz Telemedia
Annex
Information according to Section 7 No . 9 KARBV and Section 37 Para . 1 and 2 DerivateVThe exposure that is obtained through derivatives -
The counterparty to the derivative transactions -
Total collateral granted by third parties in connection with derivatives: -
of which:
Bank deposits -
Debentures -
Equities -
Potential market risk amount (pursuant to Section 37 of the German Derivatives Regulation (DerivateV))Pursuant to the Derivatives Regulation [Derivateverordnung], the degree to which the upper limit for the market risk potential was reached (according to Sections 10 and 11 of DerivateV) was determined for this fund using the qualified method based on a benchmark fund.
The fund is monitored in accordance with Section 7 Paragraph 1 of the Derivatives Ordinance on the basis of the relative VaR method. The potential market risk amount is limited relative to a derivative-free benchmark.
Information based on the qualified method:
smallest potential value at risk 5.53 %
largest potential value at risk 8.38 %
average potential value at risk 6.69 %
Risk model used pursuant to Section 10 of DerivateV:
Delta-normal method
Parameters used pursuant to Section 11 of DerivateV:
assumed holding period: 10 daysone-sided forecast interval with a probability of 99%effective historic observation period of 250 days
Leverage from the use of derivatives during the period from 01/01/2015 to 31/12/2015 99.27 %
The expected leverage effect of the derivatives is calculated as the expected total sum of the nominal values of the derivatives, excluding offsetting effects. The actual total sum of the nominal values of the derivatives may occasionally exceed the expected total sum of the nominal values of the derivatives or change in future.
Derivatives may be employed by the Company with different objectives in mind, including hedging or speculative purposes. The nominal values of the derivatives are aggregated with no differentiation between the different purposes for using derivatives. As a result, the expected sum of the nominal values of the derivatives does not give any indication of the risk content of the fund.
Composition of the benchmark fund MSCI World Media Index/MSCI World Telecommunication Services Index
The exposure that is obtained through securities lending and repurchase agreements -
The counterparty to the securities lending and repurchase agreements -
Total collateral granted by third parties in connection with derivatives: -
of which:
Bank deposits -
Debentures -
Equities -
The income that is obtained from the securities lending and repurchase agreements for the entire period under review, including direct and indirect expenses and fees that were incurred
Allianz Telemedia -A- -
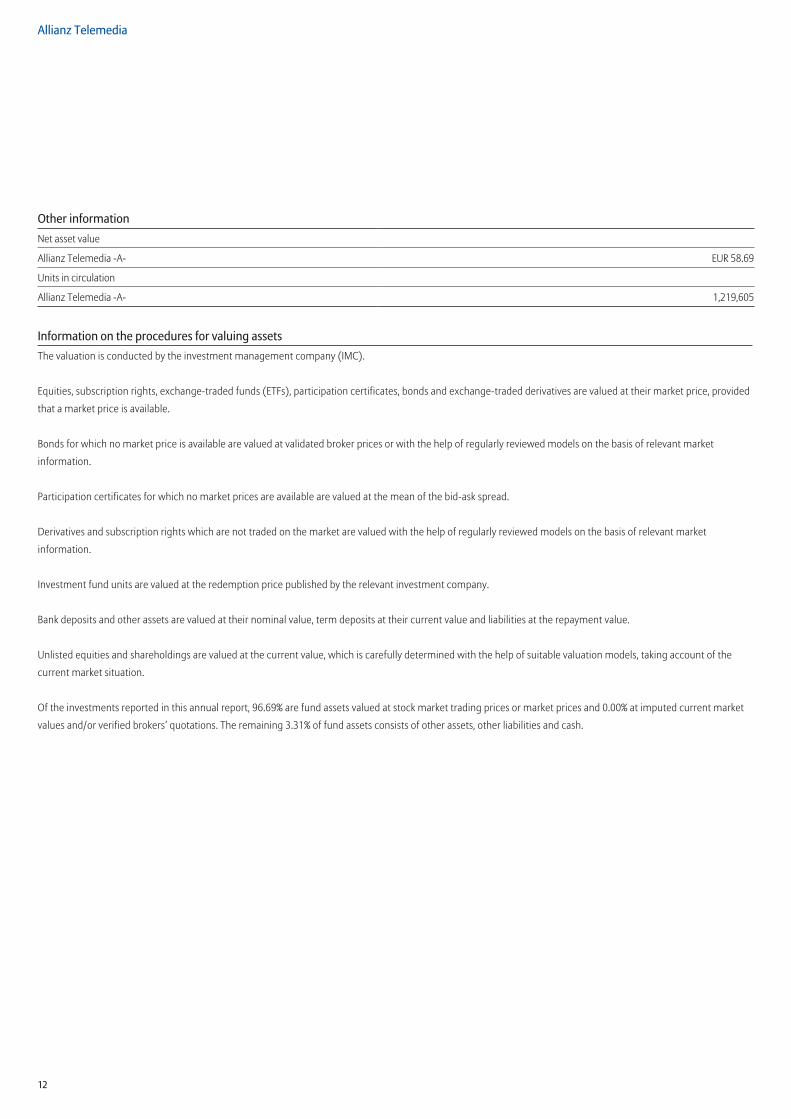
12
Allianz Telemedia
Other informationNet asset value
Allianz Telemedia -A- EUR 58.69
Units in circulation
Allianz Telemedia -A- 1,219,605
Information on the procedures for valuing assetsThe valuation is conducted by the investment management company (IMC).
Equities, subscription rights, exchange-traded funds (ETFs), participation certificates, bonds and exchange-traded derivatives are valued at their market price, provided
that a market price is available.
Bonds for which no market price is available are valued at validated broker prices or with the help of regularly reviewed models on the basis of relevant market
information.
Participation certificates for which no market prices are available are valued at the mean of the bid-ask spread.
Derivatives and subscription rights which are not traded on the market are valued with the help of regularly reviewed models on the basis of relevant market
information.
Investment fund units are valued at the redemption price published by the relevant investment company.
Bank deposits and other assets are valued at their nominal value, term deposits at their current value and liabilities at the repayment value.
Unlisted equities and shareholdings are valued at the current value, which is carefully determined with the help of suitable valuation models, taking account of the
current market situation.
Of the investments reported in this annual report, 96.69% are fund assets valued at stock market trading prices or market prices and 0.00% at imputed current market
values and/or verified brokers‘ quotations. The remaining 3.31% of fund assets consists of other assets, other liabilities and cash.
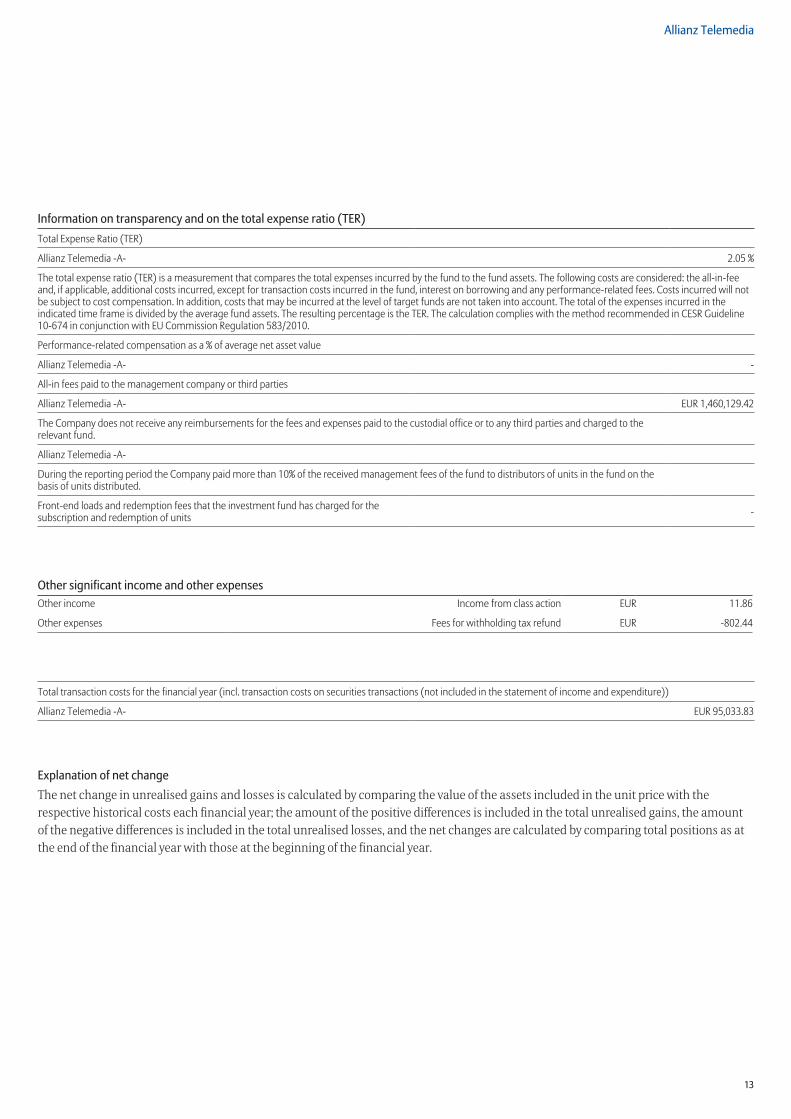
13
Allianz Telemedia
Information on transparency and on the total expense ratio (TER)Total Expense Ratio (TER)
Allianz Telemedia -A- 2.05 %
The total expense ratio (TER) is a measurement that compares the total expenses incurred by the fund to the fund assets. The following costs are considered: the all-in-fee and, if applicable, additional costs incurred, except for transaction costs incurred in the fund, interest on borrowing and any performance-related fees. Costs incurred will not be subject to cost compensation. In addition, costs that may be incurred at the level of target funds are not taken into account. The total of the expenses incurred in the indicated time frame is divided by the average fund assets. The resulting percentage is the TER. The calculation complies with the method recommended in CESR Guideline 10-674 in conjunction with EU Commission Regulation 583/2010.
Performance-related compensation as a % of average net asset value
Allianz Telemedia -A- -
All-in fees paid to the management company or third parties
Allianz Telemedia -A- EUR 1,460,129.42
The Company does not receive any reimbursements for the fees and expenses paid to the custodial office or to any third parties and charged to the relevant fund.
Allianz Telemedia -A-
During the reporting period the Company paid more than 10% of the received management fees of the fund to distributors of units in the fund on the basis of units distributed.
Front-end loads and redemption fees that the investment fund has charged for the subscription and redemption of units -
Other significant income and other expensesOther income Income from class action EUR 11.86
Other expenses Fees for withholding tax refund EUR -802.44
Total transaction costs for the financial year (incl. transaction costs on securities transactions (not included in the statement of income and expenditure))
Allianz Telemedia -A- EUR 95,033.83
Explanation of net changeThe net change in unrealised gains and losses is calculated by comparing the value of the assets included in the unit price with the respective historical costs each financial year; the amount of the positive differences is included in the total unrealised gains, the amount of the negative differences is included in the total unrealised losses, and the net changes are calculated by comparing total positions as at the end of the financial year with those at the beginning of the financial year.

14
Auditor’s Report
Frankfurt/Main, 18 April 2016
To Allianz Global Investors GmbH, Frankfurt/Main
Allianz Global Investors GmbH engaged us to audit the Annual Report of the Fund Allianz Telemedia for the financial year from 1 January 2015 to 31 December 2015 pursuant to Section 102 of the Investment Code (KAGB).
Management’s Responsibility
As stipulated in the German Investment Code (KAGB), the preparation of the annual report is the responsibility of the legal representatives of the investment management company.
Auditor‘s Responsibility
Our responsibility is to express an opinion on the annual report based on our audit.
We conducted our audit in accordance with Section 102 KAGB and the generally accepted standards for the audit of financial statements promulgated by the German Institut der Wirtschaftsprüfer (Institute of Public Auditors in Germany) (IDW). Those standards require that we plan and perform the audit such that misstatements materially affecting the annual report are detected with reasonable assurance. Knowledge of the management of the investment fund and evaluations of possible misstatements are taken into account in the determination of audit procedures. The effectiveness of the accounting-related internal control system and the evidence supporting the annual report are examined primarily on a test basis within the framework of the audit. The audit includes assessing the
accounting principles used for the annual report and significant estimates made by the legal representatives of the Investment Management Company. We believe that our audit provides a reasonable basis for our opinion.
Opinion
In our opinion, based on the findings of our audit, the Annual Report for the financial year from 1 January 2015 to 31 December 2015 complies with the legal requirements.
Frankfurt/Main, 18 April 2016
KPMG AGWirtschaftsprüfungsgesellschaft
Warnke SteinbrennerAuditor Auditor
Allianz Global Investors GmbHThe Board of Management
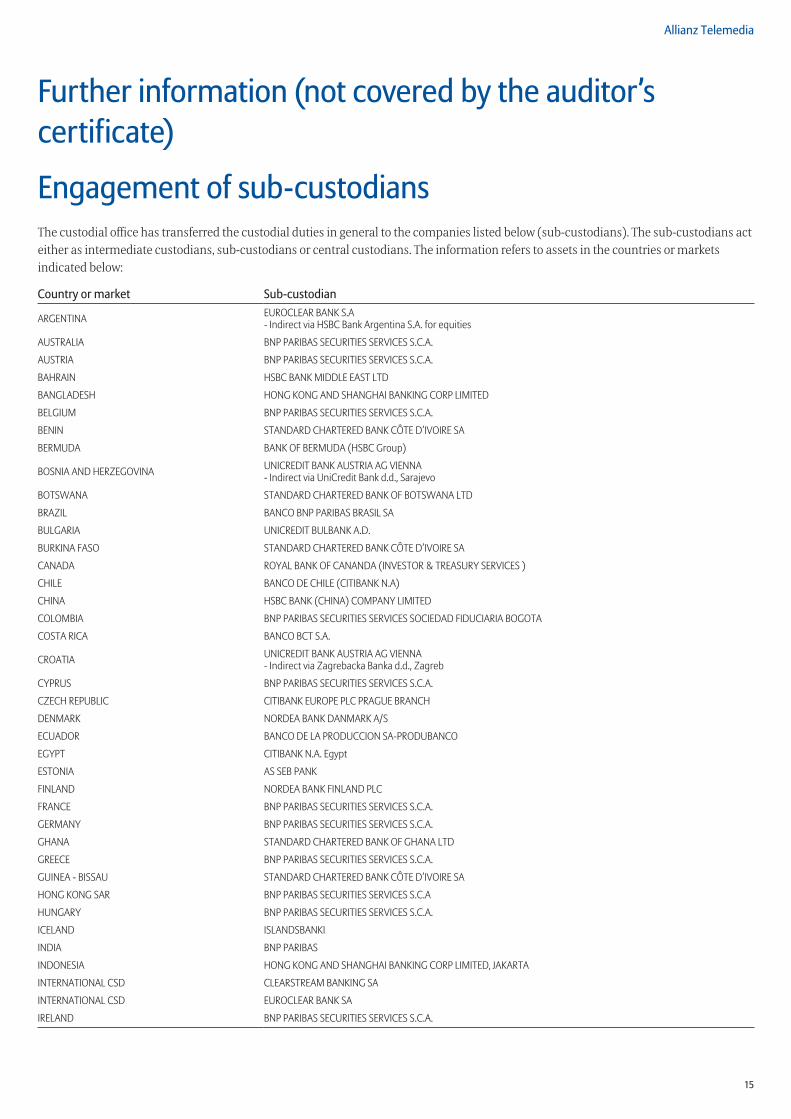
15
Allianz Telemedia
Further information (not covered by the auditor’s certificate)
Engagement of sub-custodiansThe custodial office has transferred the custodial duties in general to the companies listed below (sub-custodians). The sub-custodians act either as intermediate custodians, sub-custodians or central custodians. The information refers to assets in the countries or markets indicated below:
Country or market Sub-custodian
ARGENTINA EUROCLEAR BANK S.A- Indirect via HSBC Bank Argentina S.A. for equities
AUSTRALIA BNP PARIBAS SECURITIES SERVICES S.C.A.
AUSTRIA BNP PARIBAS SECURITIES SERVICES S.C.A.
BAHRAIN HSBC BANK MIDDLE EAST LTD
BANGLADESH HONG KONG AND SHANGHAI BANKING CORP LIMITED
BELGIUM BNP PARIBAS SECURITIES SERVICES S.C.A.
BENIN STANDARD CHARTERED BANK CÔTE D’IVOIRE SA
BERMUDA BANK OF BERMUDA (HSBC Group)
BOSNIA AND HERZEGOVINA UNICREDIT BANK AUSTRIA AG VIENNA- Indirect via UniCredit Bank d.d., Sarajevo
BOTSWANA STANDARD CHARTERED BANK OF BOTSWANA LTD
BRAZIL BANCO BNP PARIBAS BRASIL SA
BULGARIA UNICREDIT BULBANK A.D.
BURKINA FASO STANDARD CHARTERED BANK CÔTE D’IVOIRE SA
CANADA ROYAL BANK OF CANANDA (INVESTOR & TREASURY SERVICES )
CHILE BANCO DE CHILE (CITIBANK N.A)
CHINA HSBC BANK (CHINA) COMPANY LIMITED
COLOMBIA BNP PARIBAS SECURITIES SERVICES SOCIEDAD FIDUCIARIA BOGOTA
COSTA RICA BANCO BCT S.A.
CROATIA UNICREDIT BANK AUSTRIA AG VIENNA- Indirect via Zagrebacka Banka d.d., Zagreb
CYPRUS BNP PARIBAS SECURITIES SERVICES S.C.A.
CZECH REPUBLIC CITIBANK EUROPE PLC PRAGUE BRANCH
DENMARK NORDEA BANK DANMARK A/S
ECUADOR BANCO DE LA PRODUCCION SA-PRODUBANCO
EGYPT CITIBANK N.A. Egypt
ESTONIA AS SEB PANK
FINLAND NORDEA BANK FINLAND PLC
FRANCE BNP PARIBAS SECURITIES SERVICES S.C.A.
GERMANY BNP PARIBAS SECURITIES SERVICES S.C.A.
GHANA STANDARD CHARTERED BANK OF GHANA LTD
GREECE BNP PARIBAS SECURITIES SERVICES S.C.A.
GUINEA - BISSAU STANDARD CHARTERED BANK CÔTE D’IVOIRE SA
HONG KONG SAR BNP PARIBAS SECURITIES SERVICES S.C.A
HUNGARY BNP PARIBAS SECURITIES SERVICES S.C.A.
ICELAND ISLANDSBANKI
INDIA BNP PARIBAS
INDONESIA HONG KONG AND SHANGHAI BANKING CORP LIMITED, JAKARTA
INTERNATIONAL CSD CLEARSTREAM BANKING SA
INTERNATIONAL CSD EUROCLEAR BANK SA
IRELAND BNP PARIBAS SECURITIES SERVICES S.C.A.

16
Allianz Telemedia
Country or market Sub-custodianISRAEL CITIBANK N.A. ISRAEL
ITALY BNP PARIBAS SECURITIES SERVICES S.C.A.
IVORY COAST STANDARD CHARTERED BANK CÔTE D’IVOIRE SA
JAPAN HONG KONG AND SHANGHAI BANKING CORP LIMITED, TOKYO
JORDAN STANDARD CHARTERED BANK, JORDAN BRANCH
KAZAKHSTAN JSC CITIBANK KAZAKHSTAN
KENYA STANDARD CHARTERED BANK PLC
KOREA, REPUBLIC OF HONG KONG AND SHANGHAI BANKING CORP LIMITED, SEOUL
KUWAIT HSBC BANK MIDDLE EAST LTD
LATVIA AS SEB BANKA
LEBANON HSBC BANK MIDDLE EAST LTD
LITHUANIA AB SEB BANKAS
MALAYSIA HSBC BANK MALAYSIA BERHAD, KUALA LUMPUR
MALI STANDARD CHARTERED BANK CÔTE D’IVOIRE SA
MALTA CLEARSTREAM BANKING SA
MAURITIUS HONG KONG AND SHANGHAI BANKING CORP LIMITED, PORT-LOUIS
MEXICO BANCO NACIONAL DE MEXICO (BANAMEX)
MOROCCO BANQUE MAROCAINE POUR LE COMMERCE ET L’INDUSTRIE
NAMIBIA STANDARD BANK OF NAMIBIA LIMITED
NETHERLANDS BNP PARIBAS SECURITIES SERVICES S.C.A.
NEW ZEALAND BNP PARIBAS SECURITIES SERVICES S.C.A.
NIGER STANDARD CHARTERED BANK CÔTE D’IVOIRE SA
NIGERIA STANBIC IBTC BANK
NORWAY NORDEA BANK NORGE ASA
OMAN HSBC BANK OMAN SAOG
PAKISTAN CITIBANK N.A. KARACHI
PERU CITIBANK DEL PERU
PHILIPPINES HONG KONG AND SHANGHAI BANKING CORP LIMITED, MANILA
POLAND BNP PARIBAS SECURITIES SERVICES S.C.A.
PORTUGAL BNP PARIBAS SECURITIES SERVICES S.C.A.
QATAR HSBC BANK MIDDLE EAST LTD
ROMANIA CITIBANK EUROPE PLC BUCHAREST BRANCH
RUSSIA AO CITIBANK (JOINT STOCK COMPANY COMMERCIAL BANK CITIBANK)
SAUDI ARABIA SAUDI ARABIA BRITISH BANK( HSBC GROUP)
SENEGAL STANDARD CHARTERED BANK CÔTE D’IVOIRE SA
SERBIA UNICREDIT BANK AUSTRIA AG VIENNA- Indirect via UniCredit Bank Srbija d.d., Belgrade
SINGAPORE BNP PARIBAS SECURITIES SERVICES S.C.A- Indirect via United Overseas Bank LTD for government bonds
SLOVAK REPUBLIC CITIBANK EUROPE PLC BRATISLAVA BRANCH
SLOVENIA UNICREDIT BANKA SLOVENIJA D.D. LJUBLJANA- Indirect via UniCredit Bank Slovenija d.d., Ljubljana
SOUTH AFRICA STANDARD BANK OF SOUTH AFRICA LIMITED
SPAIN BNP PARIBAS SECURITIES SERVICES S.C.A.
SRI LANKA HONG KONG AND SHANGHAI BANKING CORP LIMITED, COLOMBO
SWAZILAND STANDARD BANK OF SWAZILAND LIMITED
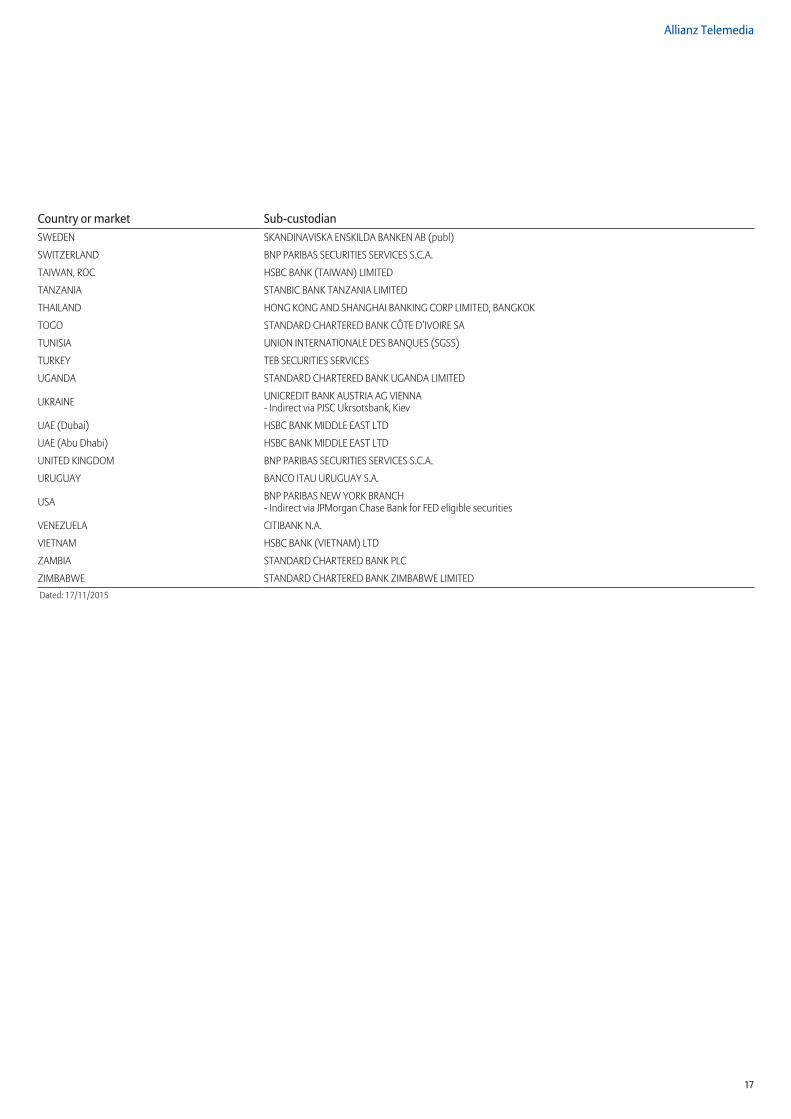
17
Allianz Telemedia
Country or market Sub-custodianSWEDEN SKANDINAVISKA ENSKILDA BANKEN AB (publ)
SWITZERLAND BNP PARIBAS SECURITIES SERVICES S.C.A.
TAIWAN, ROC HSBC BANK (TAIWAN) LIMITED
TANZANIA STANBIC BANK TANZANIA LIMITED
THAILAND HONG KONG AND SHANGHAI BANKING CORP LIMITED, BANGKOK
TOGO STANDARD CHARTERED BANK CÔTE D’IVOIRE SA
TUNISIA UNION INTERNATIONALE DES BANQUES (SGSS)
TURKEY TEB SECURITIES SERVICES
UGANDA STANDARD CHARTERED BANK UGANDA LIMITED
UKRAINE UNICREDIT BANK AUSTRIA AG VIENNA- Indirect via PJSC Ukrsotsbank, Kiev
UAE (Dubai) HSBC BANK MIDDLE EAST LTD
UAE (Abu Dhabi) HSBC BANK MIDDLE EAST LTD
UNITED KINGDOM BNP PARIBAS SECURITIES SERVICES S.C.A.
URUGUAY BANCO ITAU URUGUAY S.A.
USA BNP PARIBAS NEW YORK BRANCH- Indirect via JPMorgan Chase Bank for FED eligible securities
VENEZUELA CITIBANK N.A.
VIETNAM HSBC BANK (VIETNAM) LTD
ZAMBIA STANDARD CHARTERED BANK PLC
ZIMBABWE STANDARD CHARTERED BANK ZIMBABWE LIMITEDDated: 17/11/2015

18

19
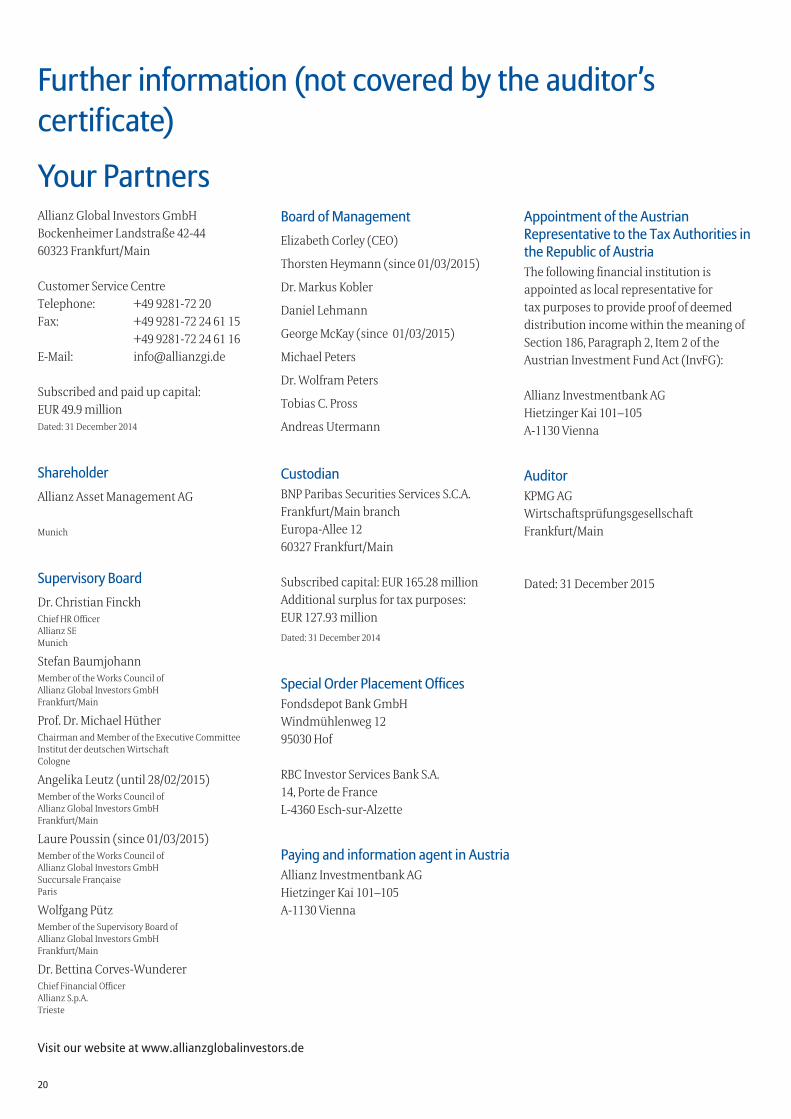
20
Further information (not covered by the auditor’s certificate)
Your PartnersAllianz Global Investors GmbHBockenheimer Landstraße 42-4460323 Frankfurt/Main
Customer Service CentreTelephone: +49 9281-72 20Fax: +49 9281-72 24 61 15
+49 9281-72 24 61 16E-Mail: [email protected]
Subscribed and paid up capital:EUR 49.9 millionDated: 31 December 2014
ShareholderAllianz Asset Management AG
Munich
Supervisory BoardDr. Christian FinckhChief HR OfficerAllianz SEMunich
Stefan BaumjohannMember of the Works Council ofAllianz Global Investors GmbHFrankfurt/Main
Prof. Dr. Michael HütherChairman and Member of the Executive CommitteeInstitut der deutschen Wirtschaft Cologne
Angelika Leutz (until 28/02/2015)Member of the Works Council ofAllianz Global Investors GmbHFrankfurt/Main
Laure Poussin (since 01/03/2015)Member of the Works Council ofAllianz Global Investors GmbHSuccursale FrançaiseParis
Wolfgang PützMember of the Supervisory Board ofAllianz Global Investors GmbHFrankfurt/Main
Dr. Bettina Corves-WundererChief Financial OfficerAllianz S.p.A.Trieste
Board of ManagementElizabeth Corley (CEO)
Thorsten Heymann (since 01/03/2015)
Dr. Markus Kobler
Daniel Lehmann
George McKay (since 01/03/2015)
Michael Peters
Dr. Wolfram Peters
Tobias C. Pross
Andreas Utermann
CustodianBNP Paribas Securities Services S.C.A.Frankfurt/Main branchEuropa-Allee 1260327 Frankfurt/Main
Subscribed capital: EUR 165.28 millionAdditional surplus for tax purposes:EUR 127.93 millionDated: 31 December 2014
Special Order Placement OfficesFondsdepot Bank GmbHWindmühlenweg 1295030 Hof
RBC Investor Services Bank S.A. 14, Porte de France L-4360 Esch-sur-Alzette
Paying and information agent in AustriaAllianz Investmentbank AGHietzinger Kai 101–105A-1130 Vienna
Appointment of the Austrian Representative to the Tax Authorities in the Republic of AustriaThe following financial institution isappointed as local representative for tax purposes to provide proof of deemed distribution income within the meaning ofSection 186, Paragraph 2, Item 2 of theAustrian Investment Fund Act (InvFG):
Allianz Investmentbank AGHietzinger Kai 101–105A-1130 Vienna
AuditorKPMG AGWirtschaftsprüfungsgesellschaftFrankfurt/Main
Dated: 31 December 2015
Visit our website at www .allianzglobalinvestors .de

21
Further information (not covered by the auditor’s certificate)
Information for investors in the Republic of AustriaThe sale of units in the fund Allianz Telemedia in the Republic of Austria has been registered with the Finanzmarktaufsicht (Vienna) in accordance with Section 140 of the Investment Fund Act (Investmentfondsgesetz – InvFG).
Redemption requests for units in the aforementioned fund can be submitted to the Austrian paying and information agent and the redemption proceeds, possible distributions and any other payments can be paid out to the unitholders by the Austrian paying and information agent, at their request, in euro cash.
Investors may obtain all necessary information from the Austrian payment and information agent for free, for example· the prospectus, · the investment terms and conditions,· the key investor information,· the annual and semi-annual reports,· the issue and redemption prices.
Prior to acquiring units of the fund, investors are recommended to ascertain whether the income data on the unit class that is required for tax purposes is published by the Oesterreichische Kontrollbank.

Allianz Global Investors GmbHBockenheimer Landstraße 42–4460323 Frankfurt/[email protected]

AnnuAl RepoRt31 DecembeR 2015
Industria
AllIAnz GlobAl InvestoRs GmbH
This report is a non-binding translation of the German original excluding the tax information for investors resident in Germany.
Contents
Industria
Activity report . . . . . . . . . . . . . . . . . . . . . . . . . . . . . . . . . . . . . . . . . . . . . . . . . . . . . 1
Asset overview at 31/12/2015 . . . . . . . . . . . . . . . . . . . . . . . . . . . . . . . . . . . . . . . 3
Investment portfolio at 31/12/2015 . . . . . . . . . . . . . . . . . . . . . . . . . . . . . . . . . . 4
Unit classes . . . . . . . . . . . . . . . . . . . . . . . . . . . . . . . . . . . . . . . . . . . . . . . . . . . . . . . . 18
Annex . . . . . . . . . . . . . . . . . . . . . . . . . . . . . . . . . . . . . . . . . . . . . . . . . . . . . . . . . . . . . 19
Auditor’s Report . . . . . . . . . . . . . . . . . . . . . . . . . . . . . . . . . . . . . . . . . . . . . . . . . . . . 23
Further information (not covered by the auditor’s certificate)
Engagement of sub-custodians . . . . . . . . . . . . . . . . . . . . . . . . . . . . . . . . . . . . . . 24
Your Partners . . . . . . . . . . . . . . . . . . . . . . . . . . . . . . . . . . . . . . . . . . . . . . . . . . . . . . 28
Information for investors in the Republic of Austria . . . . . . . . . . . . . . . . . . . . 29
1
IndustriaActivity report
The Fund invests primarily in shares of companies domiciled in Europe (including Turkey and Russia). The investment objective is to generate capital growth over the long term.
During the year under review ending in December 2015, healthcare stocks and IT providers remained significantly overweighted compared to the benchmark index. The above-average exposure to energy stocks was also expanded at what appeared to be a favourable price level. However, the initial emphasis on producers of cyclical consumer goods was reduced. Stocks from the non-cyclical consumer goods segment were represented on a selective basis. The proportion of financial stocks was also considerably lower than in the benchmark index, explained by the continued weak earnings in the bank segment. Exposure to producers of basic materials was again somewhat increased. The struggling utilities segment continued to be fully avoided. The proportion of British equities somewhat increased as a result of reallocations at stock level, but remained lower than on the benchmark index. The proportion of German and French stocks fell substantially, while exposure to Scandinavian companies increased. On the periphery of the eurozone, there were selective positions on the Spanish and Italian markets. Funds that cover special investment segments in Europe were selected in order to tap into additional opportunities; however, their weighting was appreciably reduced. Moreover, additional positions in individual stock-market segments or securities were taken via derivative financial instruments.
With this investment policy the Fund obtained a significant gain above the level of its benchmark index. The absolute result reflected in particular the upward trend on the equity market in the eurozone, which was supported by the brighter economic outlook and the expansive monetary policy of the European Central Bank. In contrast, British and Swiss stocks performed more poorly in general. The appreciable additional income earned by the Fund in comparison with the benchmark index was in particular due to active stock-picking in the health, financial and IT sectors.
The performance, which was calculated according to the BVI method, amounted to 11.32% for unit class A (EUR) and to 11.80% for unit class P (EUR) during the reporting period. The MSCI Europe Total Return (Net) performance benchmark over the same period was 8.22%.
In order to quantify the market price risks achieved during the reporting year, the Company calculates the volatility of the value of the fund units during this period. The calculated volatility is
compared to the volatility of a global mixed equity/bond index portfolio. If the achieved volatility of the fund is significantly higher than that of the index portfolio, the market price risk of the fund is classified as “high”. If the volatility of the fund is similar to that of the index portfolio, the risk is classified as “medium”. And if the fund’s volatility is considerably lower than that of the index portfolio, the market price risk is classified as “low”.
The fund Industria achieved a high market price risk during the reporting period.
Any effects which the exchange-rate movements of a foreign currency versus the fund’s base currency may have had on the fund’s value are assessed on the basis of the extent to which the fund had invested in assets denominated in foreign currencies during the reporting year, including any hedging transactions.
During the reporting period, a moderate proportion of the fund Industria was invested in assets whose value is directly affected by movements of the foreign currency versus the fund’s base currency.
The liquidity risks taken by the fund during the reporting period are assessed according to the proportion of assets which may not be easy to sell or which may possibly be sold only at a lower price.
The fund Industria was subject to a low liquidity risk during the reporting period.
In order to quantify the risks of settlement default taken during the reporting period the Company analyses the proportion of assets for which a default risk exists and their default potential. If a considerable proportion of the fund’s money was invested in assets with a high default risk and high default potential, the fund’s risk of settlement default is classified as “high”. If the proportion of assets with a high default risk was moderate or if the default potential is medium, the risk is classified as “medium”. If the fund invested only a small proportion in assets with a high default risk or if the default potential was low, the risk of settlement default is classified as “low”.
During the reporting period, the fund Industria had invested a small proportion of its money in assets with a high default risk.
In order to assess the operational risks of the Company’s procedures, the Company conducts detailed risk assessments for relevant processes identified by a risk-oriented overview, identifies
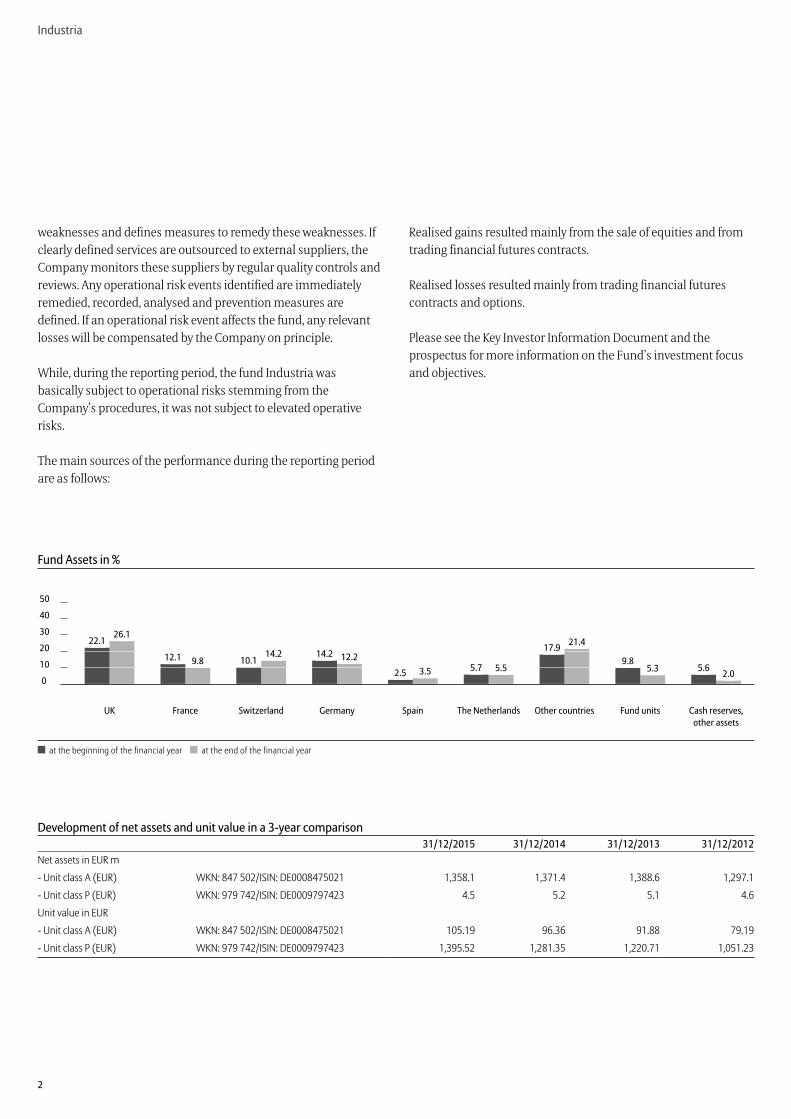
2
Industria
weaknesses and defines measures to remedy these weaknesses. If clearly defined services are outsourced to external suppliers, the Company monitors these suppliers by regular quality controls and reviews. Any operational risk events identified are immediately remedied, recorded, analysed and prevention measures are defined. If an operational risk event affects the fund, any relevant losses will be compensated by the Company on principle.
While, during the reporting period, the fund Industria was basically subject to operational risks stemming from the Company’s procedures, it was not subject to elevated operative risks.
The main sources of the performance during the reporting period are as follows:
Realised gains resulted mainly from the sale of equities and from trading financial futures contracts.
Realised losses resulted mainly from trading financial futures contracts and options.
Please see the Key Investor Information Document and the prospectus for more information on the Fund’s investment focus and objectives.
Fund Assets in %
50
40
30
20
10
0
UK France Switzerland Germany Spain The Netherlands Other countries Fund units Cash reserves, other assets
at the beginning of the financial year at the end of the financial year
22 .126 .1
12 .1 9 .8 10 .114 .2 14 .2 12 .2
2 .5 3 .5 5 .7 5 .5
17 .9 21 .4
9 .85 .3 5 .6 2 .0
Development of net assets and unit value in a 3-year comparison31/12/2015 31/12/2014 31/12/2013 31/12/2012
Net assets in EUR m
- Unit class A (EUR) WKN: 847 502/ISIN: DE0008475021 1,358.1 1,371.4 1,388.6 1,297.1
- Unit class P (EUR) WKN: 979 742/ISIN: DE0009797423 4.5 5.2 5.1 4.6
Unit value in EUR
- Unit class A (EUR) WKN: 847 502/ISIN: DE0008475021 105.19 96.36 91.88 79.19
- Unit class P (EUR) WKN: 979 742/ISIN: DE0009797423 1,395.52 1,281.35 1,220.71 1,051.23
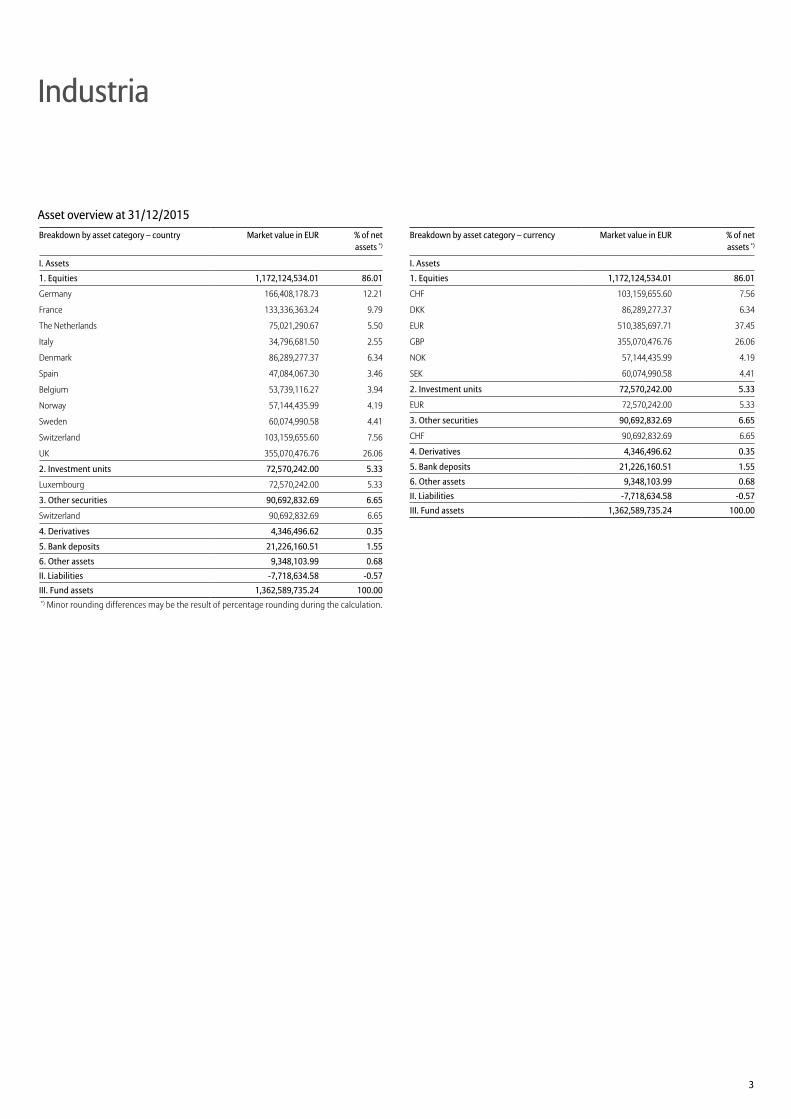
3
Industria
Asset overview at 31/12/2015Breakdown by asset category – country Market value in EUR % of net
assets *)
I . Assets
1 . Equities 1,172,124,534 .01 86 .01
Germany 166,408,178.73 12.21
France 133,336,363.24 9.79
The Netherlands 75,021,290.67 5.50
Italy 34,796,681.50 2.55
Denmark 86,289,277.37 6.34
Spain 47,084,067.30 3.46
Belgium 53,739,116.27 3.94
Norway 57,144,435.99 4.19
Sweden 60,074,990.58 4.41
Switzerland 103,159,655.60 7.56
UK 355,070,476.76 26.06
2 . Investment units 72,570,242 .00 5 .33
Luxembourg 72,570,242.00 5.33
3 . Other securities 90,692,832 .69 6 .65
Switzerland 90,692,832.69 6.65
4 . Derivatives 4,346,496 .62 0 .35
5 . Bank deposits 21,226,160 .51 1 .55
6 . Other assets 9,348,103 .99 0 .68II . Liabilities -7,718,634 .58 -0 .57III . Fund assets 1,362,589,735 .24 100 .00*) Minor rounding differences may be the result of percentage rounding during the calculation.
Breakdown by asset category – currency Market value in EUR % of netassets *)
I . Assets
1 . Equities 1,172,124,534 .01 86 .01
CHF 103,159,655.60 7.56
DKK 86,289,277.37 6.34
EUR 510,385,697.71 37.45
GBP 355,070,476.76 26.06
NOK 57,144,435.99 4.19
SEK 60,074,990.58 4.41
2 . Investment units 72,570,242 .00 5 .33
EUR 72,570,242.00 5.33
3 . Other securities 90,692,832 .69 6 .65
CHF 90,692,832.69 6.65
4 . Derivatives 4,346,496 .62 0 .35
5 . Bank deposits 21,226,160 .51 1 .55
6 . Other assets 9,348,103 .99 0 .68II . Liabilities -7,718,634 .58 -0 .57III . Fund assets 1,362,589,735 .24 100 .00

4
Industria
Investment portfolio at 31/12/2015ISIN Securities Market Shares/ Balance Purchases Redemptions Price Market value % of net
Units/ 31/12/2015 EUR assetsCurrency in the period under review
Exchange-traded securities 1,257,024,674 .42 92 .24Equities 1,166,331,841 .73 85 .59Germany 166,408,178 .73 12 .21DE000A0WMPJ6 AIXTRON SE Namens-Aktien SHS 3,087,730 410,000 0 EUR 4.102 12,665,868.46 0.93DE0006231004 Infineon Technologies AG Namens-Aktien SHS 2,453,820 0 3,445,500 EUR 13.545 33,236,991.90 2.44DE0008430026 Münchener Rückvers.-Ges. AG vink.Namens-Aktien SHS 202,100 0 0 EUR 185.900 37,570,390.00 2.76DE0007164600 SAP SE Inhaber-Aktien SHS 1,122,107 341,500 0 EUR 73.910 82,934,928.37 6.08France 133,336,363 .24 9 .79FR0010313833 Arkema S.A. Actions au Porteur SHS 522,187 0 0 EUR 65.230 34,062,258.01 2.50FR0010667147 Coface S.A. Actions Port. SHS 2,173,942 0 0 EUR 9.221 20,045,919.18 1.47FR0000120321 L‘Oréal S.A. Actions Port. SHS 326,404 0 133,950 EUR 158.050 51,588,152.20 3.79FR0000120271 Total S.A. Actions au Porteur SHS 655,210 655,210 0 EUR 42.185 27,640,033.85 2.03The Netherlands 75,021,290 .67 5 .50NL0000009082 Kon. KPN N.V. Aandelen aan toonder SHS 14,242,370 0 5,625,200 EUR 3.504 49,905,264.48 3.66NL0000009827 Koninklijke DSM N.V. Aandelen aan toonder SHS 532,627 0 0 EUR 47.155 25,116,026.19 1.84Italy 34,796,681 .50 2 .55IT0003796171 Poste Italiane S.p.A. Azioni nom. SHS 4,876,900 4,876,900 0 EUR 7.135 34,796,681.50 2.55Denmark 86,289,277 .37 6 .34DK0010244508 A.P.Møller-Mærsk A/S Navne-Aktier B SHS 18,415 0 0 DKK 8,980.000 22,162,046.83 1.63DK0060534915 Novo-Nordisk AS Navne-Aktier B SHS 1,195,350 0 0 DKK 400.300 64,127,230.54 4.71Spain 47,084,067 .30 3 .46ES0148396007 Industria de Diseño Textil SA Acciones Port. SHS 1,464,740 0 0 EUR 32.145 47,084,067.30 3.46Belgium 53,739,116 .27 3 .94BE0974268972 bpost S.A. Actions Nom. Compartm. A SHS 2,358,013 0 180,100 EUR 22.790 53,739,116.27 3.94Norway 57,144,435 .99 4 .19NO0010096985 Statoil ASA Navne-Aksjer SHS 4,416,360 979,750 0 NOK 123.900 57,144,435.99 4.19Sweden 60,074,990 .58 4 .41SE0000427361 Nordea Bank AB Namn-Aktier SHS 5,884,910 680,200 0 SEK 93.250 60,074,990.58 4.41Switzerland 103,159,655 .60 7 .56CH0010532478 Actelion Ltd. Namens-Aktien SHS 229,300 76,400 111,650 CHF 140.700 29,756,561.20 2.18CH0012005267 Novartis AG Namens-Aktien SHS 904,372 0 83,100 CHF 88.000 73,403,094.40 5.38UK 349,277,784 .48 25 .64GB0008762899 BG Group PLC Reg.Shares SHS 3,555,800 3,555,800 0 GBP 9.974 48,067,307.01 3.53GB0004544929 Imperial Tobacco Group PLC Reg.Shares SHS 1,492,005 0 0 GBP 35.750 72,291,864.60 5.31GB0007099541 Prudential PLC Reg.Shares SHS 2,816,848 0 0 GBP 15.450 58,984,105.57 4.33GB00B01C3S32 Randgold Resources Ltd. Reg.Shares SHS 669,100 669,100 0 GBP 42.380 38,432,185.69 2.82GB00B03MLX29 Royal Dutch Shell Reg.Shares Cl.A SHS 2,068,475 0 1,140,600 GBP 15.570 43,649,773.12 3.20GB00B1VYCH82 Thomas Cook Group PLC Reg.Shares SHS 23,211,180 0 0 GBP 1.215 38,222,280.85 2.81JE00B8KF9B49 WPP PLC Reg.Shares SHS 2,325,000 0 0 GBP 15.750 49,630,267.64 3.64Other securities 90,692,832 .69 6 .65Switzerland 90,692,832 .69 6 .65CH0012032048 Roche Holding AG Inhaber-Genußscheine SHS 352,692 127,150 0 CHF 278.800 90,692,832.69 6.65Securities admitted to or included in regulated markets 5,792,692 .28 0 .42Equities 5,792,692 .28 0 .42UK 5,792,692 .28 0 .42GB00B08F4599 Borders & Southern Petroleum Reg.Shares SHS 33,921,782 0 0 GBP 0.016 748,013.28 0.05GB00B0130H42 ITM Power PLC Reg.Shares SHS 15,811,897 0 0 GBP 0.235 5,044,679.00 0.37Securities fund units 72,570,242 .00 5 .33Group investment fund units 72,570,242 .00 5 .33Luxembourg 72,570,242 .00 5 .33LU0986130051 AGIF-All.Europe Mid Cap Equity Inhaber Anteile I UNT 42,300 0 7,700 EUR 1,253.580 53,026,434.00 3.89LU1190323003 AGIF-Allianz Eur.Inc.and Grow. Inhaber-Anteile W UNT 6,000 6,000 0 EUR 902.800 5,416,800.00 0.40LU0542502660 AGIF-Allianz Euroland Equ. SRI Inhaber Anteile W UNT 11,200 11,200 0 EUR 1,261.340 14,127,008.00 1.04Total securities 3) EUR 1,335,387,608 .70 97 .99Derivatives
(The positions marked with a minus sign have been sold)Derivatives on individual securitiesSecurities options 3,115,387 .24 0 .23
Receivables/payablesEquity options 3,115,387 .24 0 .23
ArcelorMittal (ARRB) Put Jan. 16 5 EUREX SHS -1,000,000 EUR 1.120 -1,120,000.00 -0.08BP PLC (BPE5) Call Feb. 16 4 LIFFE SHS -10,000,000 GBP 0.023 -304,947.88 -0.02BP PLC (BPE5) Call Juni 16 3,7 LIFFE SHS 20,000,000 GBP 0.168 4,540,335.12 0.33
Securities futures -126,987 .65 0 .00Securities futures on equities -126,987 .65 0 .00Explanations can be found in the footnotes below the table.

5
Industria
Investment portfolio at 31/12/2015ISIN Securities Market Shares/ Balance Purchases Redemptions Price Market value % of net
Units/ 31/12/2015 EUR assetsCurrency in the period under review
Aalberts Industries N.V. Future (AAIF) Jan. 16 EUREX SHS -35,700 EUR 3.369 -120,266.16 -0.01Aberdeen Asset Management PLC (324) Future März 16 AEX SHS -190,000 GBP -0.034 8,729.64 0.00adidas AG Future (ADS) Jan. 16 EUREX SHS 14,200 EUR 16.835 239,059.84 0.02Aéroports de Paris S.A. Future (W7L) Apr. 16 EUREX SHS -9,200 EUR -0.617 5,673.64 0.00Aggreko PLC Future (4A4B) Jan. 16 EUREX SHS -46,000 GBP -1.032 64,323.54 0.00Air Liquide-SA Future (AIL) Jan. 16 EUREX SHS -8,900 EUR -3.567 31,746.30 0.00Airbus Group (le.EADS) Future (AIR) Jan. 16 EUREX SHS -16,100 EUR 6.217 -100,085.65 -0.01Amec Foster Wheeler PLC Future (AQ4) Jan. 16 EUREX SHS 85,000 GBP -3.508 -404,118.29 -0.03Anheuser-Busch InBev Future (ITK) Jan. 16 EUREX SHS 8,900 EUR 2.476 22,034.62 0.00Antofagasta PLC Future (UNTH) Jan. 16 EUREX SHS 128,000 GBP -1.168 -202,560.42 -0.01ARM Holdings PLC Future (ARM) Jan. 16 EUREX SHS -80,000 GBP 1.112 -120,532.21 -0.01ASOS Future Jan. 16 LIFFE SHS 25,000 GBP 4.333 146,801.91 0.01BAE Systems Future (BAFF) Jan. 16 EUREX SHS 151,000 GBP 0.486 99,405.93 0.01Barry Callebaut Future (BCBF) Jan. 16 EUREX SHS -1,000 CHF 38.980 -35,952.09 0.00BASF SE Future (BAS) März 16 EUREX SHS -100,000 EUR 1.300 -130,010.00 -0.01Bayer AG Future (BAYN) Jan. 16 EUREX SHS 8,200 EUR 3.825 31,367.46 0.00British American Tobacco Future (BMTF) Jan. 16 EUREX SHS 22,000 GBP 0.734 21,891.41 0.00Bureau Veritas SA Future (VTSG) Jan. 16 EUREX SHS 56,900 EUR -1.092 -62,129.11 0.00Compass Group PLC (XGR1) Apr. 16 EUREX SHS -60,000 GBP 0.166 -13,470.65 0.00Covestro Future (1COF) Apr. 16 EUREX SHS 31,000 EUR 1.975 61,225.00 0.00Danone S.A. Future (BSN) Jan. 16 EUREX SHS -18,600 EUR 5.752 -106,983.48 -0.01Deutsche Telekom AG Future (DTE) Jan. 16 EUREX SHS -119,400 EUR 1.533 -182,980.50 -0.01Diageo PLC Future (GUI) Jan. 16 EUREX SHS 41,000 GBP 1.003 55,736.48 0.00Enel Future (ENLG) Jan. 16 EUREX SHS 241,000 EUR -0.112 -26,967.90 0.00ENI S.p.A. Future (ENTG) Jan. 16 EUREX SHS -1,868,000 EUR -0.753 1,406,604.00 0.10Eurofins Scientific S.A. Future (ESF) Jan. 16 EUREX SHS -3,300 EUR 33.399 -110,215.38 -0.01Fraport AG Future (FRAG) Jan. 16 EUREX SHS 20,200 EUR 3.847 77,703.34 0.01GlaxoSmithKline Future (GSKG) Jan. 16 EUREX SHS -108,000 GBP 1.175 -171,967.62 -0.01Hannover Rück SE Future (HNR1) Jan. 16 EUREX SHS -10,100 EUR 15.350 -155,035.00 -0.01HSBC Holdings PLC (HBC1) Jan. 16 EUREX SHS -5,800,000 GBP 0.252 -1,984,478.42 -0.15Iberdrola S.A. Future (IBE1) Jan. 16 EUREX SHS -252,500 EUR 0.466 -117,564.00 -0.01IMI PLC (IMI1) Future Jan. 16 EUREX SHS 65,000 GBP -1.754 -154,480.57 -0.01Infineon Technologies AG Future (IFXG) Jan. 16 EUREX SHS 109,500 EUR 3.137 343,545.30 0.03Ingenico Group S.A. Future (IIEF) Jan. 16 EUREX SHS 8,900 EUR 11.903 105,939.37 0.01J. Sainsbury PLC Future (SUY1) März 16 EUREX SHS -4,000,000 GBP 0.277 -1,504,095.11 -0.11Kering S.A. Future (PPX) Jan. 16 EUREX SHS -6,500 EUR 6.305 -40,979.25 0.00Kon. KPN N.V. Future (KPN) Jan. 16 EUREX SHS 385,000 EUR 0.341 131,246.50 0.01Kon. Philips El. N.V.Future (PHI1) Jan. 16 EUREX SHS -42,000 EUR 2.181 -91,589.40 -0.01Legrand S.A. Future (LRC) Jan. 16 EUREX SHS -29,000 EUR 5.501 -159,514.50 -0.01Lloyds Banking Group PLC Future (LLD) Feb. 16 EUREX SHS 39,000,000 GBP 0.053 2,822,333.30 0.21Matthey Johnson PLC Future (JMAF) März 16 EUREX SHS 420,000 GBP 1.925 1,095,643.91 0.08Münchener Rückvers.-Ges. AG Future (MUV2) Jan. 16 EUREX SHS 5,700 EUR 17.538 99,966.60 0.01Nokia Corp. Future (NO3G) Apr. 16 EUREX SHS 156,500 EUR 0.292 45,698.00 0.00Norsk Hydro ASA Future (NHYG) Jan. 16 EUREX SHS -305,000 EUR 0.102 -30,988.00 0.00Novo-Nordisk AS Future (NOVC) März 16 XCSE SHS 25,800 DKK 11.490 39,728.44 0.00OSRAM Licht AG (OSR) Future Jan. 16 EUREX SHS 23,800 EUR -11.814 -281,170.82 -0.02Pernod-Ricard S.A. Future (PER) Jan. 16 EUREX SHS -9,500 EUR 1.221 -11,598.55 0.00Reed Elsevier PLC Future (RELB) Jan. 16 EUREX SHS -81,000 GBP 0.662 -72,694.94 -0.01Roche Holding AG Future (ROG) Jan. 16 EUREX SHS 3,800 CHF 28.176 98,751.32 0.01Rocket Internet SE (RKET) Future Jan. 16 EUREX SHS 27,500 EUR -2.188 -60,175.50 0.00Saipem S.p.A. Future (SPEH) Jan. 16 EUREX SHS -105,000 EUR -0.935 98,164.50 0.01Schneider Electric S.A. Future (SNDH) Jan. 16 EUREX SHS 16,300 EUR 2.073 33,794.79 0.00Spirax-Sarco Engineering PLC Future (1LNA) Jan. 16 LIFFE SHS 27,000 GBP 3.455 126,427.73 0.01STMicroelectronics N.V. Future (SGM) Jan. 16 EUREX SHS -149,000 EUR -0.010 1,415.50 0.00Swedbank AB Future (SWEF) Jan. 16 EUREX SHS 52,000 EUR -0.213 -11,050.00 0.00TeliaSonera AB Future (TLSG) Jan. 16 EUREX SHS -190,600 EUR -0.019 3,602.34 0.00Tesco Future (TCO) März 16 EUREX SHS 5,000,000 GBP 0.081 550,071.76 0.04
Explanations can be found in the footnotes below the table.

6
Industria
Investment portfolio at 31/12/2015ISIN Securities Market Shares/ Balance Purchases Redemptions Price Market value % of net
Units/ 31/12/2015 EUR assetsCurrency in the period under review
Total S.A. Future (TOTB) Jan. 16 EUREX SHS 680,000 EUR -0.051 -34,544.00 0.00TUI AG Future (TUI1) Jan. 16 EUREX SHS 63,200 EUR 0.355 22,410.72 0.00Umicore S.A. Future (NVJN) März 16 EUREX SHS -377,000 EUR 4.604 -1,735,783.40 -0.13United Internet AG Future (UTDG) Jan. 16 EUREX SHS 47,000 EUR 4.181 196,525.80 0.01Vodafone Group Future (VODI) Jan. 16 EUREX SHS 436,000 GBP 0.138 81,445.49 0.01Whitbread PLC Future (WHF4) Apr. 16 EUREX SHS 15,000 GBP -3.082 -62,650.39 0.00Wirecard AG (WDI) Future Jan. 16 EUREX SHS -25,200 EUR 3.812 -96,069.96 -0.01WM.Morrison Superm.PLC Future (MZP) Jan. 16 EUREX SHS -415,000 GBP -0.211 118,892.67 0.01Wolters Kluwer N.V. Future (WOSF) Jan. 16 EUREX SHS 48,200 EUR 3.002 144,701.22 0.01Yara International ASA Future (IU2) März 16 OM SHS 170,000 NOK -9.401 -166,894.75 -0.01
Total derivatives on individual securities EUR 2,988,399 .59 0 .23Derivatives on equity index
Receivables/payablesFutures contracts on equity index -534,412 .50 -0 .03
DAX-Index Future (FDAX) März 16 EUREX EUR Quantity -3 -17,137.50 0.00ESTX 50 Dividenden Index Future (FEXD) Dez. 17 EUREX EUR Quantity 1,500 855,000.00 0.06ESTX 50 Dividenden Index Future (FEXD) Dez. 18 EUREX EUR Quantity 1,000 620,000.00 0.05ESTX 50 Dividenden Index Future (FEXD) Dez. 19 EUREX EUR Quantity 3,000 -1,100,000.00 -0.08ESTX 50 Dividenden Index Future (FEXD) Dez. 20 EUREX EUR Quantity 1,000 -800,000.00 -0.06ESTX Telecomm. Index Future (SXKE) März 16 EUREX EUR Quantity -66 -25,740.00 0.00STXE 600 Healthcare Index Future (SXDP) März 16 EUREX EUR Quantity -24 -33,000.00 0.00STXE 600 Indust. G.&S. Index Future (SXNP) März 16 EUREX EUR Quantity 42 1,050.00 0.00STXE 600 Oil & Gas Index Future (SXEP) März 16 EUREX EUR Quantity -62 -1,860.00 0.00STXE 600 Travel + Lei. Index Future (Q1G) März 16 EUREX EUR Quantity -77 -32,725.00 0.00
OptionsOptions on equity index 1,892,509 .53 0 .15
DAX-Index (DAX) Put März 16 8600 EUREX Quantity -1,300 EUR 31.000 -201,500.00 -0.01DAX-Index (DAX) Put März 16 9500 EUREX Quantity 2,500 EUR 94.000 1,175,000.00 0.09DAX-Index (DAX) Put März 16 9700 EUREX Quantity 1,300 EUR 122.500 796,250.00 0.06DJ Euro Stoxx50 Index (SX5E) Call Juni 16 3750 EUREX Quantity 500 EUR 21.200 106,000.00 0.01FTSE 100 (F100) Call März 16 6500 IFEU Quantity 150 GBP 68.500 139,259.53 0.01STXE 600 Basic Res. Index (SXPP) Put Jan. 16 240 EUREX Quantity -500 EUR 4.900 -122,500.00 -0.01
Total equity index derivatives EUR 1,358,097 .03 0 .12Bank deposits, money market paper and money market fundsBank depositsEUR deposits with custodial office
BNP PARIBAS Securities Services S.C.A. EUR 15,174,499.87 % 100.000 15,174,499.87 1.11Deposits in other EU/EEA currencies
BNP PARIBAS Securities Services S.C.A. DKK 2,485,394.68 % 100.000 333,086.61 0.02BNP PARIBAS Securities Services S.C.A. NOK 44,395,344.74 % 100.000 4,636,343.55 0.34BNP PARIBAS Securities Services S.C.A. SEK 1,311,655.49 % 100.000 143,590.21 0.01
Deposits in non EU/EEA currenciesBNP PARIBAS Securities Services S.C.A. CHF 1,010,319.82 % 100.000 931,844.53 0.07BNP PARIBAS Securities Services S.C.A. USD 7,433.38 % 100.000 6,795.74 0.00
Total bank deposits EUR 21,226,160 .51 1 .55Total bank deposits, money market paper and money market funds EUR 21,226,160 .51 1 .55Other assets
Accrued dividends EUR 1,392,553.79 1,392,553.79 0.10Receivables from unit transactions EUR 156,325.54 156,325.54 0.01Receivables from withholding tax refunds EUR 7,799,224.66 7,799,224.66 0.57
Total other assets EUR 9,348,103 .99 0 .68Short-term liabilitiesLoans in other EU/EEA currenciesExplanations can be found in the footnotes below the table.
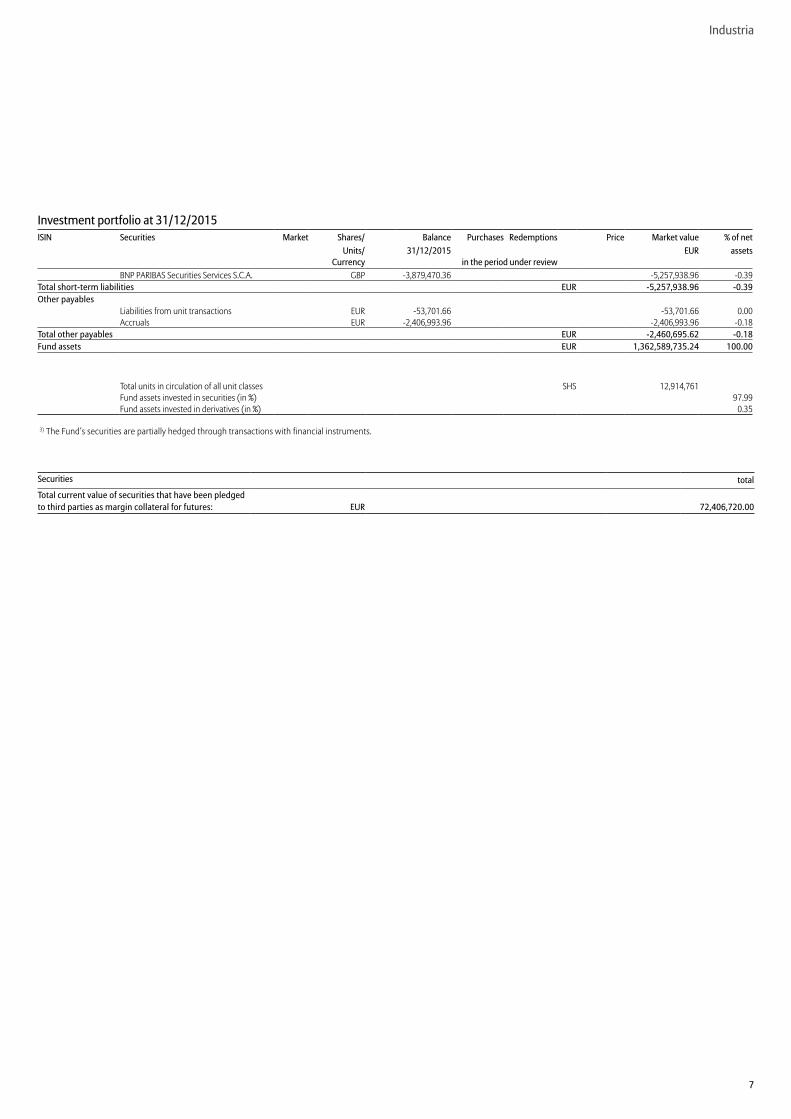
7
Industria
Investment portfolio at 31/12/2015ISIN Securities Market Shares/ Balance Purchases Redemptions Price Market value % of net
Units/ 31/12/2015 EUR assetsCurrency in the period under review
BNP PARIBAS Securities Services S.C.A. GBP -3,879,470.36 -5,257,938.96 -0.39Total short-term liabilities EUR -5,257,938 .96 -0 .39Other payables
Liabilities from unit transactions EUR -53,701.66 -53,701.66 0.00Accruals EUR -2,406,993.96 -2,406,993.96 -0.18
Total other payables EUR -2,460,695 .62 -0 .18Fund assets EUR 1,362,589,735 .24 100 .00
Total units in circulation of all unit classes SHS 12,914,761Fund assets invested in securities (in %) 97.99Fund assets invested in derivatives (in %) 0.35
3) The Fund’s securities are partially hedged through transactions with financial instruments.
Securities total
Total current value of securities that have been pledged to third parties as margin collateral for futures: EUR 72,406,720 .00

8
Industria
Industria A (EUR)ISIN DE0008475021
Fund assets 1,358,114,123.12
Units in circulation 12,911,554.015
Unit value 105.19
Industria P (EUR)ISIN DE0009797423
Fund assets 4,475,612.12
Units in circulation 3,207.120
Unit value 1,395.52
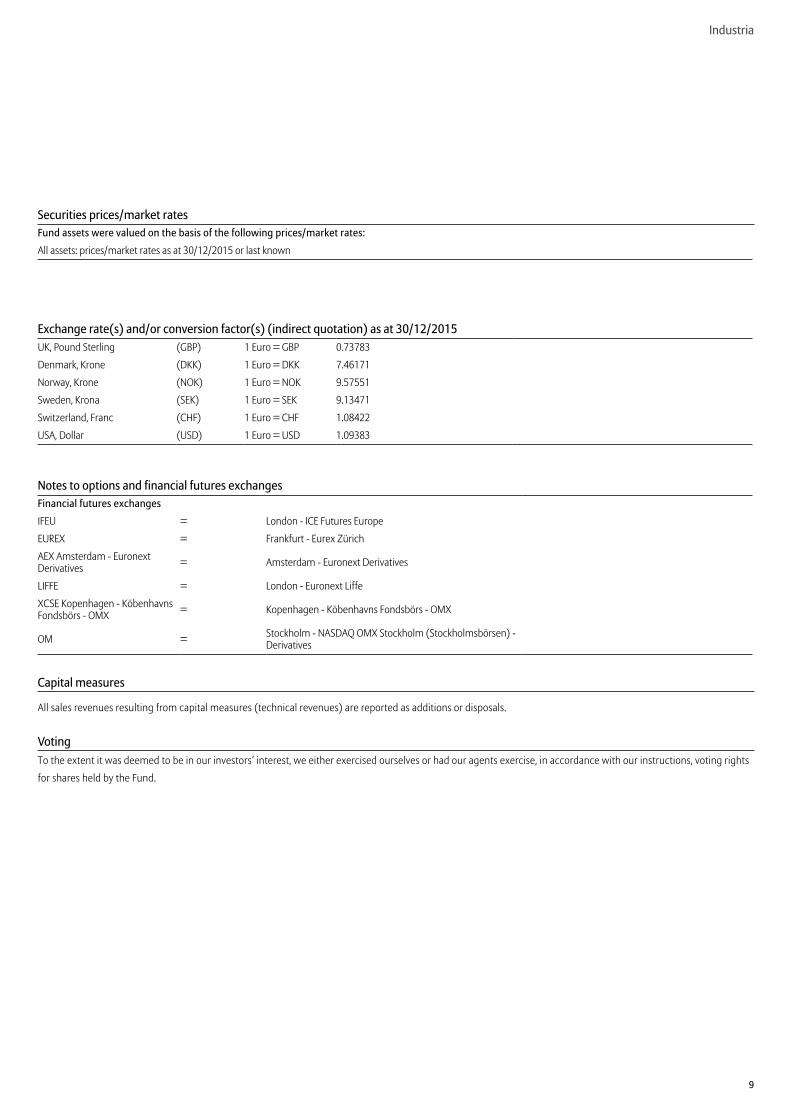
9
Industria
Securities prices/market ratesFund assets were valued on the basis of the following prices/market rates:
All assets: prices/market rates as at 30/12/2015 or last known
Exchange rate(s) and/or conversion factor(s) (indirect quotation) as at 30/12/2015UK, Pound Sterling (GBP) 1 Euro = GBP 0.73783
Denmark, Krone (DKK) 1 Euro = DKK 7.46171
Norway, Krone (NOK) 1 Euro = NOK 9.57551
Sweden, Krona (SEK) 1 Euro = SEK 9.13471
Switzerland, Franc (CHF) 1 Euro = CHF 1.08422
USA, Dollar (USD) 1 Euro = USD 1.09383
Notes to options and financial futures exchangesFinancial futures exchanges
IFEU = London - ICE Futures Europe
EUREX = Frankfurt - Eurex Zürich
AEX Amsterdam - Euronext Derivatives = Amsterdam - Euronext Derivatives
LIFFE = London - Euronext Liffe
XCSE Kopenhagen - Köbenhavns Fondsbörs - OMX = Kopenhagen - Köbenhavns Fondsbörs - OMX
OM = Stockholm - NASDAQ OMX Stockholm (Stockholmsbörsen) - Derivatives
Capital measures
All sales revenues resulting from capital measures (technical revenues) are reported as additions or disposals.
VotingTo the extent it was deemed to be in our investors’ interest, we either exercised ourselves or had our agents exercise, in accordance with our instructions, voting rights
for shares held by the Fund.
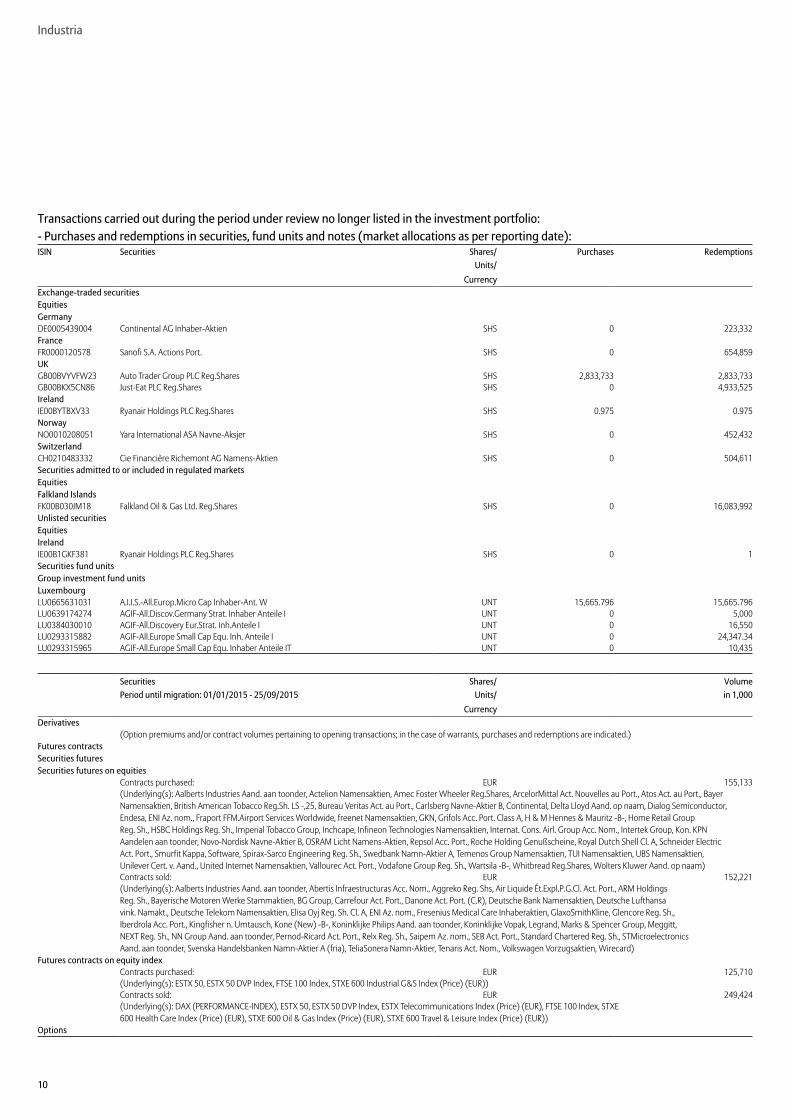
10
Industria
Transactions carried out during the period under review no longer listed in the investment portfolio:- Purchases and redemptions in securities, fund units and notes (market allocations as per reporting date):ISIN Securities Shares/ Purchases Redemptions
Units/Currency
Exchange-traded securitiesEquitiesGermanyDE0005439004 Continental AG Inhaber-Aktien SHS 0 223,332FranceFR0000120578 Sanofi S.A. Actions Port. SHS 0 654,859UKGB00BVYVFW23 Auto Trader Group PLC Reg.Shares SHS 2,833,733 2,833,733GB00BKX5CN86 Just-Eat PLC Reg.Shares SHS 0 4,933,525IrelandIE00BYTBXV33 Ryanair Holdings PLC Reg.Shares SHS 0.975 0.975NorwayNO0010208051 Yara International ASA Navne-Aksjer SHS 0 452,432SwitzerlandCH0210483332 Cie Financière Richemont AG Namens-Aktien SHS 0 504,611Securities admitted to or included in regulated marketsEquitiesFalkland IslandsFK00B030JM18 Falkland Oil & Gas Ltd. Reg.Shares SHS 0 16,083,992Unlisted securitiesEquitiesIrelandIE00B1GKF381 Ryanair Holdings PLC Reg.Shares SHS 0 1Securities fund unitsGroup investment fund unitsLuxembourgLU0665631031 A.I.I.S.-All.Europ.Micro Cap Inhaber-Ant. W UNT 15,665.796 15,665.796LU0639174274 AGIF-All.Discov.Germany Strat. Inhaber Anteile I UNT 0 5,000LU0384030010 AGIF-All.Discovery Eur.Strat. Inh.Anteile I UNT 0 16,550LU0293315882 AGIF-All.Europe Small Cap Equ. Inh. Anteile I UNT 0 24,347.34LU0293315965 AGIF-All.Europe Small Cap Equ. Inhaber Anteile IT UNT 0 10,435
Securities Shares/ VolumePeriod until migration: 01/01/2015 - 25/09/2015 Units/ in 1,000
CurrencyDerivatives
(Option premiums and/or contract volumes pertaining to opening transactions; in the case of warrants, purchases and redemptions are indicated.)Futures contractsSecurities futuresSecurities futures on equities
Contracts purchased: EUR 155,133(Underlying(s): Aalberts Industries Aand. aan toonder, Actelion Namensaktien, Amec Foster Wheeler Reg.Shares, ArcelorMittal Act. Nouvelles au Port., Atos Act. au Port., Bayer Namensaktien, British American Tobacco Reg.Sh. LS -,25, Bureau Veritas Act. au Port., Carlsberg Navne-Aktier B, Continental, Delta Lloyd Aand. op naam, Dialog Semiconductor, Endesa, ENI Az. nom., Fraport FFM.Airport Services Worldwide, freenet Namensaktien, GKN, Grifols Acc. Port. Class A, H & M Hennes & Mauritz -B-, Home Retail Group Reg. Sh., HSBC Holdings Reg. Sh., Imperial Tobacco Group, Inchcape, Infineon Technologies Namensaktien, Internat. Cons. Airl. Group Acc. Nom., Intertek Group, Kon. KPN Aandelen aan toonder, Novo-Nordisk Navne-Aktier B, OSRAM Licht Namens-Aktien, Repsol Acc. Port., Roche Holding Genußscheine, Royal Dutch Shell Cl. A, Schneider Electric Act. Port., Smurfit Kappa, Software, Spirax-Sarco Engineering Reg. Sh., Swedbank Namn-Aktier A, Temenos Group Namensaktien, TUI Namensaktien, UBS Namensaktien, Unilever Cert. v. Aand., United Internet Namensaktien, Vallourec Act. Port., Vodafone Group Reg. Sh., Wartsila -B-, Whitbread Reg.Shares, Wolters Kluwer Aand. op naam)Contracts sold: EUR 152,221(Underlying(s): Aalberts Industries Aand. aan toonder, Abertis Infraestructuras Acc. Nom., Aggreko Reg. Shs, Air Liquide Ét.Expl.P.G.Cl. Act. Port., ARM Holdings Reg. Sh., Bayerische Motoren Werke Stammaktien, BG Group, Carrefour Act. Port., Danone Act. Port. (C.R), Deutsche Bank Namensaktien, Deutsche Lufthansa vink. Namakt., Deutsche Telekom Namensaktien, Elisa Oyj Reg. Sh. Cl. A, ENI Az. nom., Fresenius Medical Care Inhaberaktien, GlaxoSmithKline, Glencore Reg. Sh., Iberdrola Acc. Port., Kingfisher n. Umtausch, Kone (New) -B-, Koninklijke Philips Aand. aan toonder, Koninklijke Vopak, Legrand, Marks & Spencer Group, Meggitt, NEXT Reg. Sh., NN Group Aand. aan toonder, Pernod-Ricard Act. Port., Relx Reg. Sh., Saipem Az. nom., SEB Act. Port., Standard Chartered Reg. Sh., STMicroelectronics Aand. aan toonder, Svenska Handelsbanken Namn-Aktier A (fria), TeliaSonera Namn-Aktier, Tenaris Act. Nom., Volkswagen Vorzugsaktien, Wirecard)
Futures contracts on equity indexContracts purchased: EUR 125,710(Underlying(s): ESTX 50, ESTX 50 DVP Index, FTSE 100 Index, STXE 600 Industrial G&S Index (Price) (EUR))Contracts sold: EUR 249,424(Underlying(s): DAX (PERFORMANCE-INDEX), ESTX 50, ESTX 50 DVP Index, ESTX Telecommunications Index (Price) (EUR), FTSE 100 Index, STXE 600 Health Care Index (Price) (EUR), STXE 600 Oil & Gas Index (Price) (EUR), STXE 600 Travel & Leisure Index (Price) (EUR))
Options
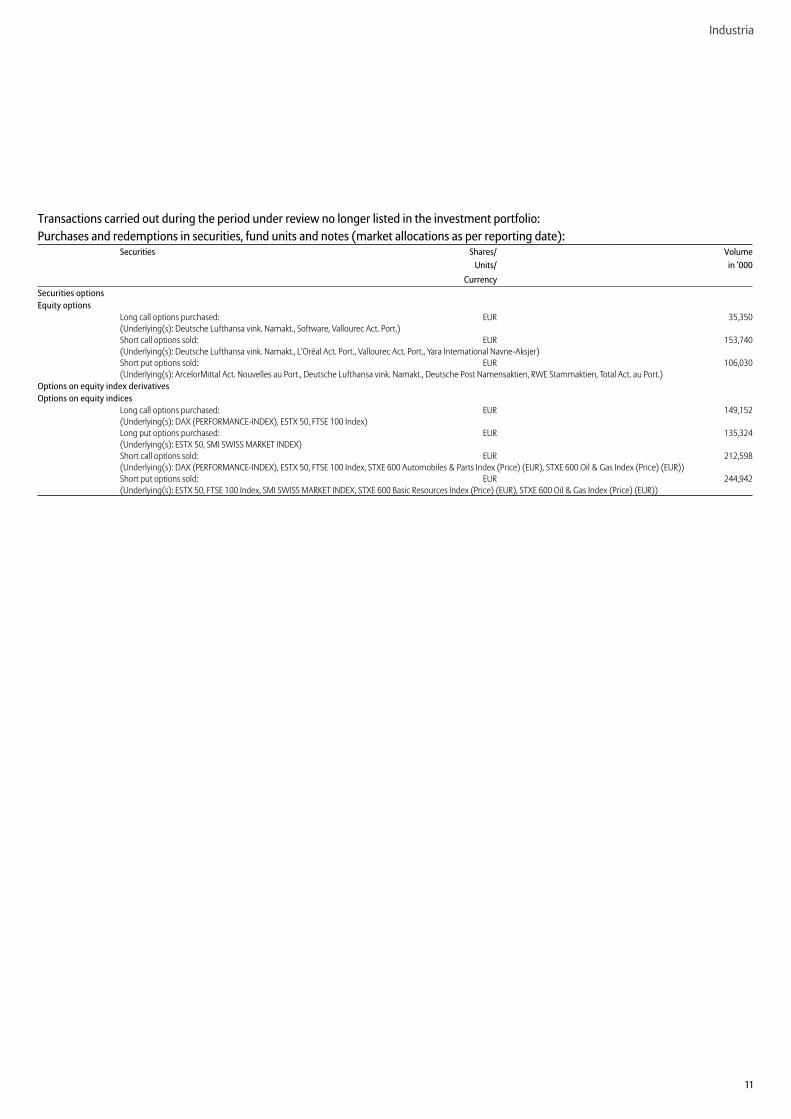
11
Industria
Transactions carried out during the period under review no longer listed in the investment portfolio:Purchases and redemptions in securities, fund units and notes (market allocations as per reporting date):
Securities Shares/ VolumeUnits/ in ’000
CurrencySecurities optionsEquity options
Long call options purchased: EUR 35,350(Underlying(s): Deutsche Lufthansa vink. Namakt., Software, Vallourec Act. Port.)Short call options sold: EUR 153,740(Underlying(s): Deutsche Lufthansa vink. Namakt., L‘Oréal Act. Port., Vallourec Act. Port., Yara International Navne-Aksjer)Short put options sold: EUR 106,030(Underlying(s): ArcelorMittal Act. Nouvelles au Port., Deutsche Lufthansa vink. Namakt., Deutsche Post Namensaktien, RWE Stammaktien, Total Act. au Port.)
Options on equity index derivativesOptions on equity indices
Long call options purchased: EUR 149,152(Underlying(s): DAX (PERFORMANCE-INDEX), ESTX 50, FTSE 100 Index)Long put options purchased: EUR 135,324(Underlying(s): ESTX 50, SMI SWISS MARKET INDEX)Short call options sold: EUR 212,598(Underlying(s): DAX (PERFORMANCE-INDEX), ESTX 50, FTSE 100 Index, STXE 600 Automobiles & Parts Index (Price) (EUR), STXE 600 Oil & Gas Index (Price) (EUR))Short put options sold: EUR 244,942(Underlying(s): ESTX 50, FTSE 100 Index, SMI SWISS MARKET INDEX, STXE 600 Basic Resources Index (Price) (EUR), STXE 600 Oil & Gas Index (Price) (EUR))

12
Industria
Securities Shares/ VolumePeriod after migration: 26/09/2015 - 31/12/2015 Units/ in 1,000
CurrencyDerivatives
(Option premiums and/or contract volumes pertaining to opening transactions; in the case of warrants, purchases and redemptions are indicated.)Futures contractsSecurities futuresSecurities futures on equities
Contracts purchased: EUR 105,809(Underlying(s): adidas AG Namens-Aktien, Amec Foster Wheeler PLC Reg.Shares, Antofagasta PLC Reg.Shares, BAE Systems PLC Reg.Shares, Bayer AG Namens-Aktien, British American Tobacco PLC Reg.Shares, Bureau Veritas SA Actions au Porteur, ENEL S.p.A. Azioni nom., ENI S.p.A. Azioni nom., Fraport AG Ffm.Airport.Ser.AG Inhaber-Aktien, IMI PLC Reg.Shares, Infineon Technologies AG Namens-Aktien, Ingenico Group S.A. Actions Port., Johnson, Matthey PLC Reg.Shares, Kon. KPN N.V. Aandelen aan toonder, Lloyds Banking Group PLC Reg.Shares, Moncler S.p.A. Azioni nom., Münchener Rückvers.-Ges. AG vink.Namens-Aktien, Novo-Nordisk AS Navne-Aktier B, Roche Holding AG Inhaber-Genußscheine, Rocket Internet SE Inhaber-Aktien, Schneider Electric SE Actions Port., Smurfit Kappa Group PLC Reg.Shares, Spirax-Sarco Engineering PLC Reg.Shares, Swedbank AB Namn-Aktier A, Temenos Group AG Namens-Aktien, Tesco PLC Reg.Shares, TUI AG Namens-Aktien, United Internet AG Namens-Aktien, Vodafone Group PLC Reg.Shares, Wolters Kluwer N.V. Aandelen op naam, Yara International ASA Navne-Aksjer)Contracts sold: EUR 97,452(Underlying(s): Aalberts Industries N.V. Aandelen aan toonder, Aberdeen Asset Management PLC Reg.Shares, Abertis Infraestructuras S.A. Acciones Nom., Aggreko PLC Reg.Shares, Air Liquide-SA Ét.Expl.P.G.Cl. Actions Port., Airbus Group SE Aandelen op naam, ARM Holdings PLC Reg.Shares, BASF SE Namens-Aktien, Danone S.A. Actions Port.(C.R), Deutsche Telekom AG Namens-Aktien, ENI S.p.A. Azioni nom., GlaxoSmithKline PLC Reg.Shares, Hannover Rück SE Namens-Aktien, HSBC Holdings PLC Reg.Shares, Iberdrola S.A. Acciones Port., J. Sainsbury PLC Reg.Shares, Koninklijke Philips N.V. Aandelen aan toonder, Legrand S.A. Actions au Porteur, Norsk Hydro ASA Navne-Aksjer, Relx PLC Reg.Shares, Saipem S.p.A. Azioni nom., Standard Chartered PLC Reg.Shares, STMicroelectronics N.V. Aandelen aan toonder, Svenska Handelsbanken AB Namn-Aktier A, Svenska Handelsbanken AB Namn-Aktier A (fria), TeliaSonera AB Namn-Aktier, Wirecard AG Inhaber-Aktien)
Futures contracts on equity indexContracts purchased: EUR 44,562(Underlying(s): DJES 50 Index (Price) (EUR), ESTX 50 DVP INDEX, STXE 600 INDUSTRIAL G. & S. INDEX (PRICE) (EUR))Contracts sold: EUR 21,836(Underlying(s): DAX (PERFORMANCE-INDEX), DJES 50 Index (Price) (EUR), ESTX Telecommunications Index (Price) (EUR), STXE 600 HEALTH CARE INDEX (PRICE) (EUR), STXE 600 OIL & GAS INDEX (PRICE) (EUR), STXE 600 TRAVEL & LEIS. INDEX (PRICE) (EUR))
OptionsSecurities optionsEquity options
Long call options purchased: EUR 135,380(Underlying(s): BP PLC Reg.Shares, Vodafone Group PLC Reg.Shares)Short call options sold: EUR 125,931(Underlying(s): BP PLC Reg.Shares, Cie Financière Richemont AG Namens-Aktien)Short put options sold: EUR 49,288(Underlying(s): ArcelorMittal S.A. Actions Nouvelles Nominat., RWE AG Inhaber-Stammaktien, Vodafone Group PLC Reg.Shares)
Options on equity index derivativesOptions on equity indices
Long call options purchased: EUR 76,016(Underlying(s): DAX (PERFORMANCE-INDEX), DJES 50 Index (Price) (EUR), FTSE 100 INDEX)Long put options purchased: EUR 8,125(Underlying(s): DJES 50 Index (Price) (EUR))Short call options sold: EUR 163,850(Underlying(s): DAX (PERFORMANCE-INDEX), DJES 50 Index (Price) (EUR), STXE 600 AUTOMOBILES & PARTS INDEX (PRICE) (EUR), STXE 600 Basic Resources Index (Price) (EUR))Short put options sold: EUR 158,167(Underlying(s): DAX (PERFORMANCE-INDEX), FTSE 100 INDEX, STXE 600 Basic Resources Index (Price) (EUR), STXE 600 OIL & GAS INDEX (PRICE) (EUR))
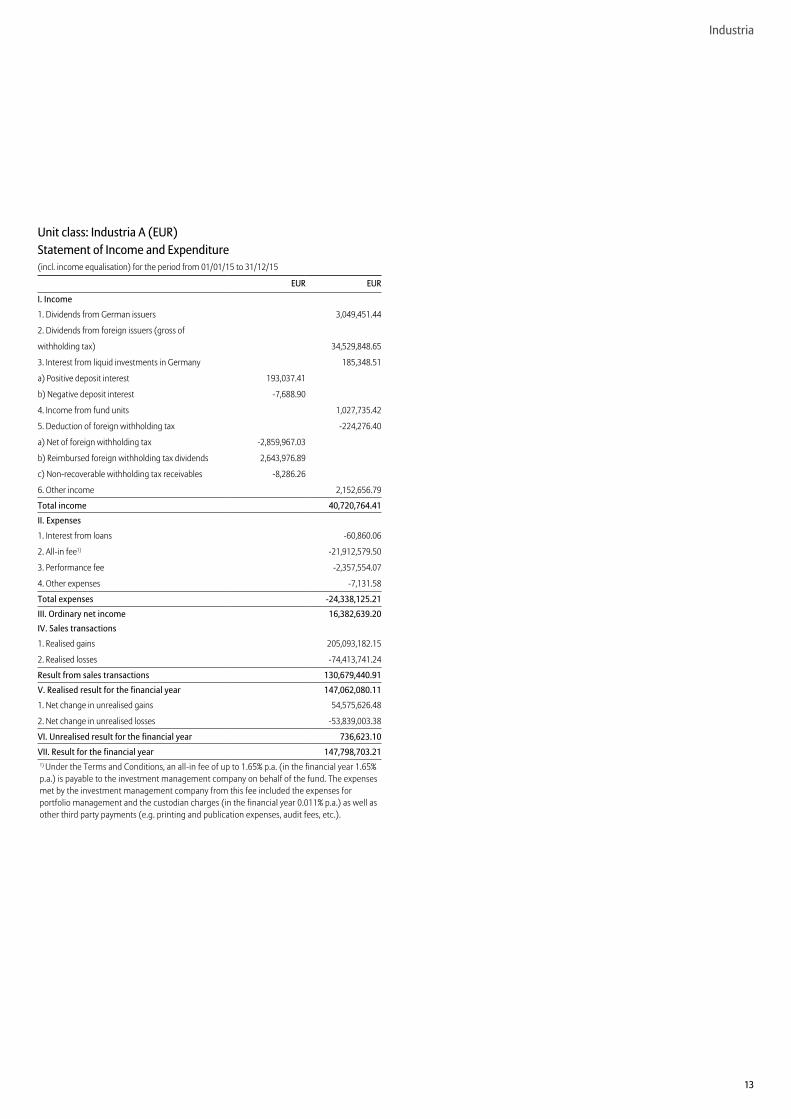
13
Industria
Unit class: Industria A (EUR)Statement of Income and Expenditure(incl. income equalisation) for the period from 01/01/15 to 31/12/15
EUR EUR
I . Income
1. Dividends from German issuers 3,049,451.44
2. Dividends from foreign issuers (gross of
withholding tax) 34,529,848.65
3. Interest from liquid investments in Germany 185,348.51
a) Positive deposit interest 193,037.41
b) Negative deposit interest -7,688.90
4. Income from fund units 1,027,735.42
5. Deduction of foreign withholding tax -224,276.40
a) Net of foreign withholding tax -2,859,967.03
b) Reimbursed foreign withholding tax dividends 2,643,976.89
c) Non-recoverable withholding tax receivables -8,286.26
6. Other income 2,152,656.79
Total income 40,720,764 .41
II . Expenses
1. Interest from loans -60,860.06
2. All-in fee1) -21,912,579.50
3. Performance fee -2,357,554.07
4. Other expenses -7,131.58
Total expenses -24,338,125 .21
III . Ordinary net income 16,382,639 .20IV . Sales transactions
1. Realised gains 205,093,182.15
2. Realised losses -74,413,741.24
Result from sales transactions 130,679,440 .91
V . Realised result for the financial year 147,062,080 .11
1. Net change in unrealised gains 54,575,626.48
2. Net change in unrealised losses -53,839,003.38
VI . Unrealised result for the financial year 736,623 .10
VII . Result for the financial year 147,798,703 .211) Under the Terms and Conditions, an all-in fee of up to 1.65% p.a. (in the financial year 1.65% p.a.) is payable to the investment management company on behalf of the fund. The expenses met by the investment management company from this fee included the expenses for portfolio management and the custodian charges (in the financial year 0.011% p.a.) as well as other third party payments (e.g. printing and publication expenses, audit fees, etc.).
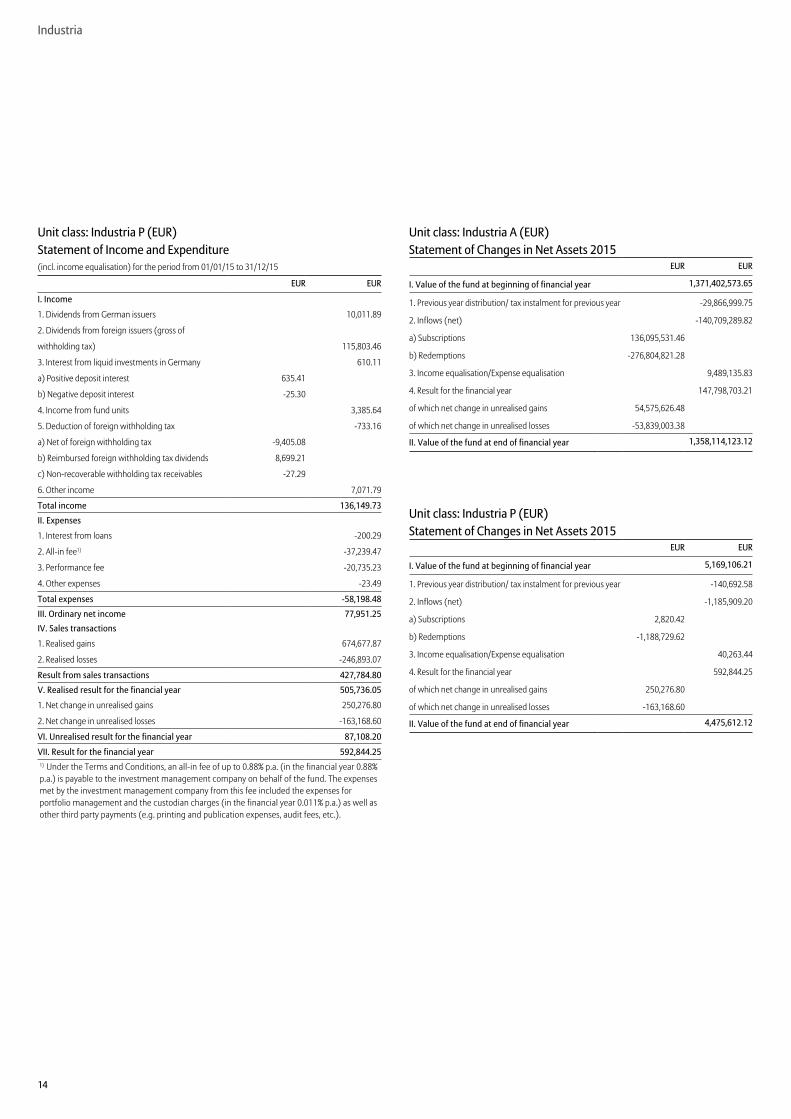
14
Industria
Unit class: Industria P (EUR)Statement of Income and Expenditure(incl. income equalisation) for the period from 01/01/15 to 31/12/15
EUR EUR
I . Income
1. Dividends from German issuers 10,011.89
2. Dividends from foreign issuers (gross of
withholding tax) 115,803.46
3. Interest from liquid investments in Germany 610.11
a) Positive deposit interest 635.41
b) Negative deposit interest -25.30
4. Income from fund units 3,385.64
5. Deduction of foreign withholding tax -733.16
a) Net of foreign withholding tax -9,405.08
b) Reimbursed foreign withholding tax dividends 8,699.21
c) Non-recoverable withholding tax receivables -27.29
6. Other income 7,071.79
Total income 136,149 .73
II . Expenses
1. Interest from loans -200.29
2. All-in fee1) -37,239.47
3. Performance fee -20,735.23
4. Other expenses -23.49
Total expenses -58,198 .48
III . Ordinary net income 77,951 .25IV . Sales transactions
1. Realised gains 674,677.87
2. Realised losses -246,893.07
Result from sales transactions 427,784 .80
V . Realised result for the financial year 505,736 .05
1. Net change in unrealised gains 250,276.80
2. Net change in unrealised losses -163,168.60
VI . Unrealised result for the financial year 87,108 .20
VII . Result for the financial year 592,844 .251) Under the Terms and Conditions, an all-in fee of up to 0.88% p.a. (in the financial year 0.88% p.a.) is payable to the investment management company on behalf of the fund. The expenses met by the investment management company from this fee included the expenses for portfolio management and the custodian charges (in the financial year 0.011% p.a.) as well as other third party payments (e.g. printing and publication expenses, audit fees, etc.).
Unit class: Industria A (EUR)Statement of Changes in Net Assets 2015
EUR EUR
I . Value of the fund at beginning of financial year 1,371,402,573 .65
1. Previous year distribution/ tax instalment for previous year -29,866,999.75
2. Inflows (net) -140,709,289.82
a) Subscriptions 136,095,531.46
b) Redemptions -276,804,821.28
3. Income equalisation/Expense equalisation 9,489,135.83
4. Result for the financial year 147,798,703.21
of which net change in unrealised gains 54,575,626.48
of which net change in unrealised losses -53,839,003.38
II . Value of the fund at end of financial year 1,358,114,123 .12
Unit class: Industria P (EUR)Statement of Changes in Net Assets 2015
EUR EUR
I . Value of the fund at beginning of financial year 5,169,106 .21
1. Previous year distribution/ tax instalment for previous year -140,692.58
2. Inflows (net) -1,185,909.20
a) Subscriptions 2,820.42
b) Redemptions -1,188,729.62
3. Income equalisation/Expense equalisation 40,263.44
4. Result for the financial year 592,844.25
of which net change in unrealised gains 250,276.80
of which net change in unrealised losses -163,168.60
II . Value of the fund at end of financial year 4,475,612 .12

15
Industria
Unit class: Industria A (EUR)Allocation of the fund’s incomeCalculation of distribution total EUR per unit EUR*)
I . Available for distribution
1. Balance carried forward from previous year 186,624,749.72 14.45
2. Realised result for the financial year 147,062,080.11 11.39
3. Transfers from the fund 0.00 0.00
II . Not used for distribution
1. Retained for reinvestment -113,587,066.57 -8.80
2. Balance carried forward -203,717,118.46 -15.78
III . Gross distribution 16,382,639 .20 1 .27
1. Interim distribution 0.00 0.00
2. Final distribution 16,382,639.20 1.27
Units in circulation as at 31/12/2015: 12,911,554 *) Unit values may be subject to rounding differences.
Unit class: Industria P (EUR)Allocation of the fund’s incomeCalculation of distribution total EUR per unit EUR*)
I . Available for distribution
1. Balance carried forward from previous year 616,415.18 192.20
2. Realised result for the financial year 505,736.05 157.69
3. Transfers from the fund 0.00 0.00
II . Not used for distribution
1. Retained for reinvestment -372,858.17 -116.26
2. Balance carried forward -671,341.81 -209.33
III . Gross distribution 77,951 .25 24 .31
1. Interim distribution 0.00 0.00
2. Final distribution 77,951.25 24.31
Units in circulation as at 31/12/2015: 3,207 *) Unit values may be subject to rounding differences.

16
Industria
Performance of the Industria A (EUR)Fund Benchmark
MSCI Europe Total Return (Net)
% %
1 year 31/12/2014 - 31/12/2015 11 .32 8 .22
2 years 31/12/2013 - 31/12/2015 18 .65 15 .63
3 years 31/12/2012 - 31/12/2015 39 .34 38 .55
4 years 31/12/2011 - 31/12/2015 63 .67 62 .50
5 years 31/12/2010 - 31/12/2015 45 .33 49 .37
10 years 31/12/2005 - 31/12/2015 34 .17 51 .16
Benchmark: index considered representative for the relevant investment segment, which is also the basis for the calculation of the performance fee – if any. Calculation basis: net asset value per unit (front-end loads excluded), distributions – if any – reinvested. Calculation in accordance with the BVI method (German Investment and Asset Management Association). Past figures are not a guarantee of future performance.
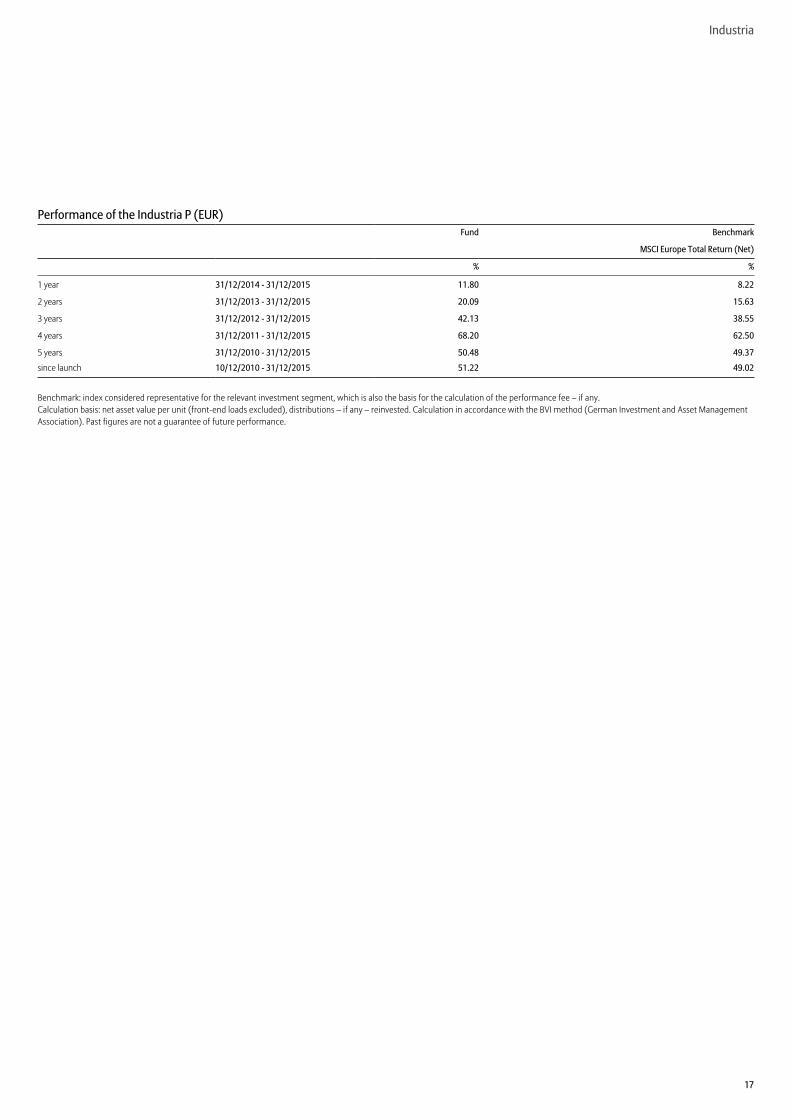
17
Industria
Performance of the Industria P (EUR)Fund Benchmark
MSCI Europe Total Return (Net)
% %
1 year 31/12/2014 - 31/12/2015 11 .80 8 .22
2 years 31/12/2013 - 31/12/2015 20 .09 15 .63
3 years 31/12/2012 - 31/12/2015 42 .13 38 .55
4 years 31/12/2011 - 31/12/2015 68 .20 62 .50
5 years 31/12/2010 - 31/12/2015 50 .48 49 .37
since launch 10/12/2010 - 31/12/2015 51 .22 49 .02
Benchmark: index considered representative for the relevant investment segment, which is also the basis for the calculation of the performance fee – if any. Calculation basis: net asset value per unit (front-end loads excluded), distributions – if any – reinvested. Calculation in accordance with the BVI method (German Investment and Asset Management Association). Past figures are not a guarantee of future performance.
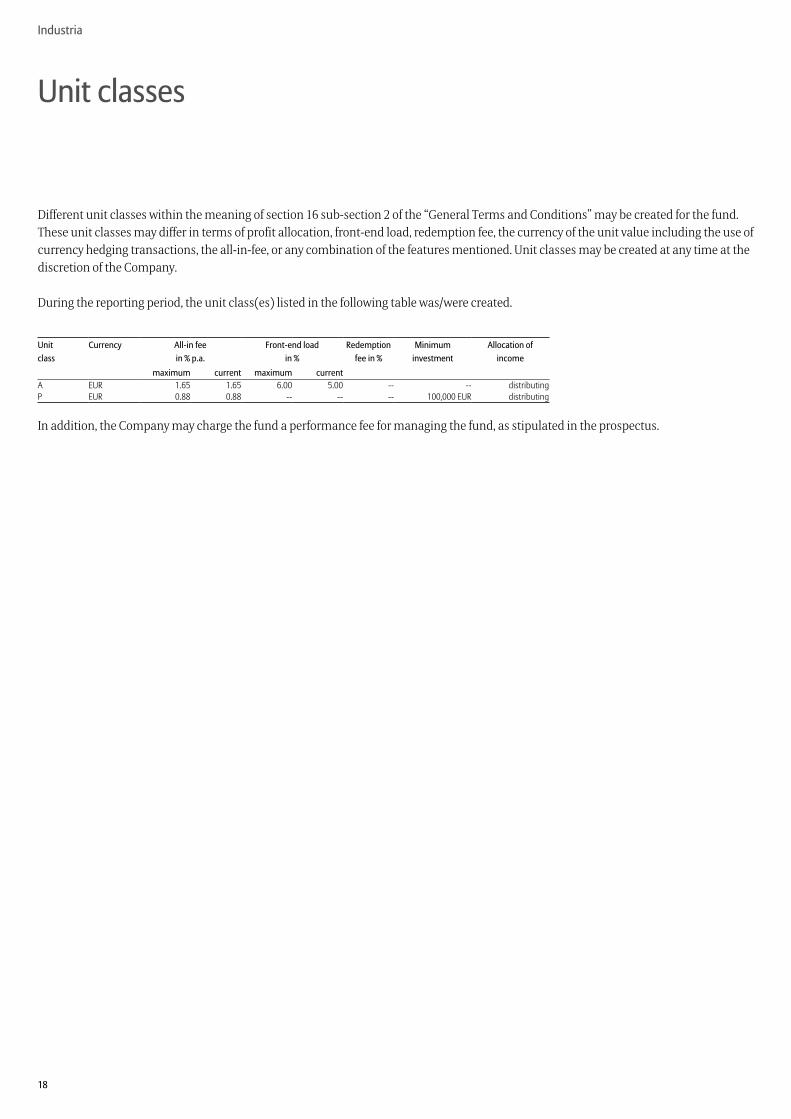
18
Industria
Unit classes
Different unit classes within the meaning of section 16 sub-section 2 of the “General Terms and Conditions” may be created for the fund. These unit classes may differ in terms of profit allocation, front-end load, redemption fee, the currency of the unit value including the use of currency hedging transactions, the all-in-fee, or any combination of the features mentioned. Unit classes may be created at any time at the discretion of the Company.
During the reporting period, the unit class(es) listed in the following table was/were created.
Unit Currency All-in fee Front-end load Redemption Minimum Allocation ofclass in % p .a . in % fee in % investment income
maximum current maximum currentA EUR 1.65 1.65 6.00 5.00 -- -- distributingP EUR 0.88 0.88 -- -- -- 100,000 EUR distributing
In addition, the Company may charge the fund a performance fee for managing the fund, as stipulated in the prospectus.

19
Industria
Annex
Information according to Section 7 No . 9 KARBV and Section 37 Para . 1 and 2 DerivateVThe exposure that is obtained through derivatives -
The counterparty to the derivative transactions AEX, Eurex (Eurex Frankfurt/Eurex Zürich), ICE Futures Europe, LIFFE, OM, OMX Københavns Fondsbørs - FUTOP 2)
Total collateral granted by third parties in connection with derivatives: -
of which:
Bank deposits -
Debentures -
Equities -1) The contracting partner for exchange-traded derivative transactions is generally the exchange on which the transaction is conducted.
Potential market risk amount (pursuant to Section 37 of the German Derivatives Regulation (DerivateV))Pursuant to the Derivatives Regulation [Derivateverordnung], the degree to which the upper limit for the market risk potential was reached (according to Sections 10 and 11 of DerivateV) was determined for this fund using the qualified method based on a benchmark fund.
The fund is monitored in accordance with Section 7 Paragraph 1 of the Derivatives Ordinance on the basis of the relative VaR method. The potential market risk amount is limited relative to a derivative-free benchmark.
Information based on the qualified method:
smallest potential value at risk 5.42 %
largest potential value at risk 9.11 %
average potential value at risk 6.99 %
Risk model used pursuant to Section 10 of DerivateV:
Delta-normal method
Parameters used pursuant to Section 11 of DerivateV:
assumed holding period: 10 daysone-sided forecast interval with a probability of 99%effective historic observation period of 250 days
Leverage from the use of derivatives during the period from 01/01/2015 to 31/12/2015 121.41 %
The expected leverage effect of the derivatives is calculated as the expected total sum of the nominal values of the derivatives, excluding offsetting effects. The actual total sum of the nominal values of the derivatives may occasionally exceed the expected total sum of the nominal values of the derivatives or change in future.
Derivatives may be employed by the Company with different objectives in mind, including hedging or speculative purposes. The nominal values of the derivatives are aggregated with no differentiation between the different purposes for using derivatives. As a result, the expected sum of the nominal values of the derivatives does not give any indication of the risk content of the fund.
Composition of the benchmark fund MSCI Europe Index
The exposure that is obtained through securities lending and repurchase agreements -
The counterparty to the securities lending and repurchase agreements -
Total collateral granted by third parties in connection with derivatives: -
of which:
Bank deposits -
Debentures -
Equities -
The income that is obtained from the securities lending and repurchase agreements for the entire period under review, including direct and indirect expenses and fees that were incurred
Industria -A- -
Industria -P- -

20
Industria
Other informationNet asset value
Industria -A- EUR 105.19
Industria -P- EUR 1,395.52
Units in circulation
Industria -A- 12,911,554.015
Industria -P- 3,207.120
Information on the procedures for valuing assetsThe valuation is conducted by the investment management company (IMC).
Equities, subscription rights, exchange-traded funds (ETFs), participation certificates, bonds and exchange-traded derivatives are valued at their market price, provided
that a market price is available.
Bonds for which no market price is available are valued at validated broker prices or with the help of regularly reviewed models on the basis of relevant market
information.
Participation certificates for which no market prices are available are valued at the mean of the bid-ask spread.
Derivatives and subscription rights which are not traded on the market are valued with the help of regularly reviewed models on the basis of relevant market
information.
Investment fund units are valued at the redemption price published by the relevant investment company.
Bank deposits and other assets are valued at their nominal value, term deposits at their current value and liabilities at the repayment value.
Unlisted equities and shareholdings are valued at the current value, which is carefully determined with the help of suitable valuation models, taking account of the
current market situation.
Of the investments reported in this annual report, 98.34% are fund assets valued at stock market trading prices or market prices and 0.00% at imputed current market
values and/or verified brokers’ quotations. The remaining 1.66% of fund assets consists of other assets, other liabilities and cash.
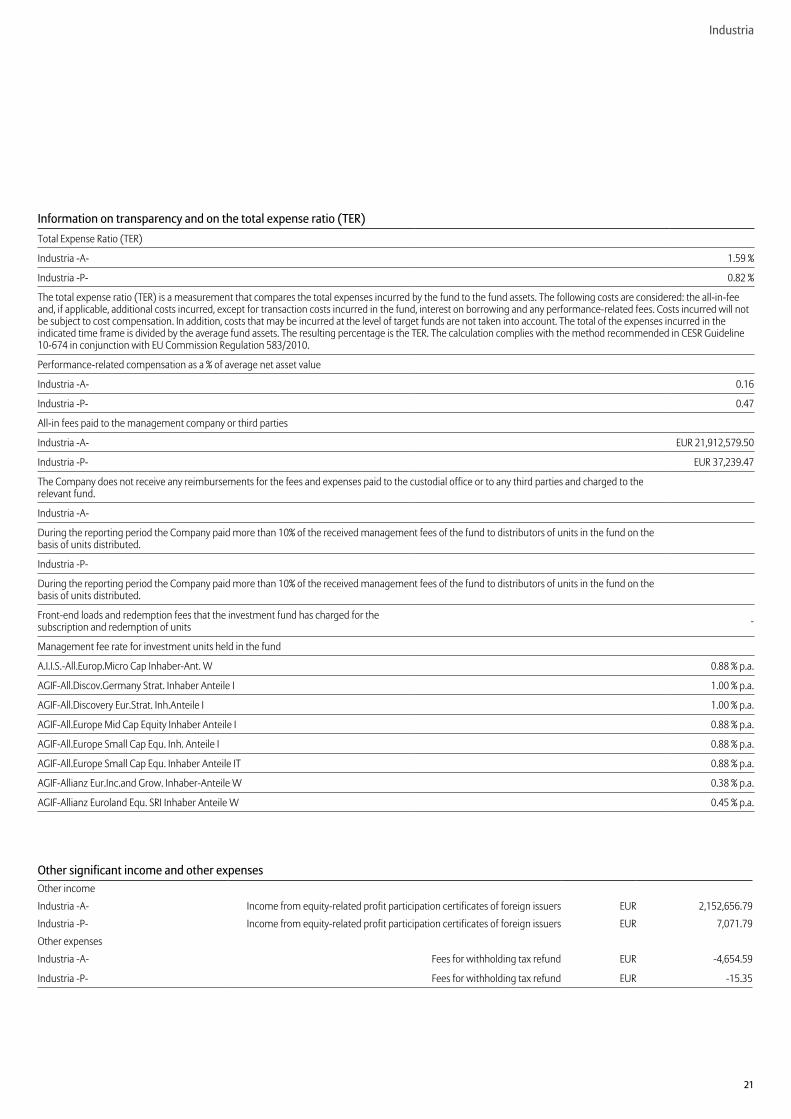
21
Industria
Information on transparency and on the total expense ratio (TER)Total Expense Ratio (TER)
Industria -A- 1.59 %
Industria -P- 0.82 %
The total expense ratio (TER) is a measurement that compares the total expenses incurred by the fund to the fund assets. The following costs are considered: the all-in-fee and, if applicable, additional costs incurred, except for transaction costs incurred in the fund, interest on borrowing and any performance-related fees. Costs incurred will not be subject to cost compensation. In addition, costs that may be incurred at the level of target funds are not taken into account. The total of the expenses incurred in the indicated time frame is divided by the average fund assets. The resulting percentage is the TER. The calculation complies with the method recommended in CESR Guideline 10-674 in conjunction with EU Commission Regulation 583/2010.
Performance-related compensation as a % of average net asset value
Industria -A- 0.16
Industria -P- 0.47
All-in fees paid to the management company or third parties
Industria -A- EUR 21,912,579.50
Industria -P- EUR 37,239.47
The Company does not receive any reimbursements for the fees and expenses paid to the custodial office or to any third parties and charged to the relevant fund.
Industria -A-
During the reporting period the Company paid more than 10% of the received management fees of the fund to distributors of units in the fund on the basis of units distributed.
Industria -P-
During the reporting period the Company paid more than 10% of the received management fees of the fund to distributors of units in the fund on the basis of units distributed.
Front-end loads and redemption fees that the investment fund has charged for the subscription and redemption of units -
Management fee rate for investment units held in the fund
A.I.I.S.-All.Europ.Micro Cap Inhaber-Ant. W 0.88 % p.a.
AGIF-All.Discov.Germany Strat. Inhaber Anteile I 1.00 % p.a.
AGIF-All.Discovery Eur.Strat. Inh.Anteile I 1.00 % p.a.
AGIF-All.Europe Mid Cap Equity Inhaber Anteile I 0.88 % p.a.
AGIF-All.Europe Small Cap Equ. Inh. Anteile I 0.88 % p.a.
AGIF-All.Europe Small Cap Equ. Inhaber Anteile IT 0.88 % p.a.
AGIF-Allianz Eur.Inc.and Grow. Inhaber-Anteile W 0.38 % p.a.
AGIF-Allianz Euroland Equ. SRI Inhaber Anteile W 0.45 % p.a.
Other significant income and other expensesOther income
Industria -A- Income from equity-related profit participation certificates of foreign issuers EUR 2,152,656.79
Industria -P- Income from equity-related profit participation certificates of foreign issuers EUR 7,071.79
Other expenses
Industria -A- Fees for withholding tax refund EUR -4,654.59
Industria -P- Fees for withholding tax refund EUR -15.35
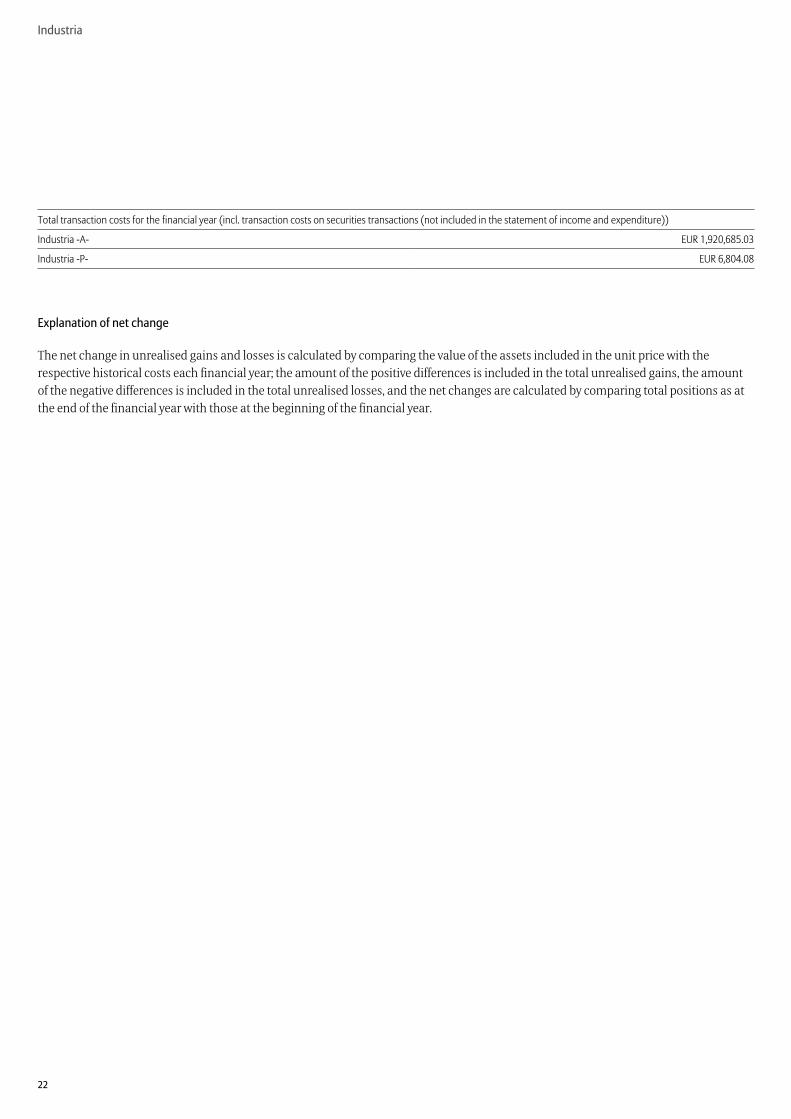
22
Industria
Total transaction costs for the financial year (incl. transaction costs on securities transactions (not included in the statement of income and expenditure))
Industria -A- EUR 1,920,685.03
Industria -P- EUR 6,804.08
Explanation of net change
The net change in unrealised gains and losses is calculated by comparing the value of the assets included in the unit price with the respective historical costs each financial year; the amount of the positive differences is included in the total unrealised gains, the amount of the negative differences is included in the total unrealised losses, and the net changes are calculated by comparing total positions as at the end of the financial year with those at the beginning of the financial year.

23
Auditor’s Report
Allianz Global Investors GmbH The Board of Management
To Allianz Global Investors GmbH, Frankfurt/Main
Allianz Global Investors GmbH engaged us to audit the Annual Report of the Fund Industria for the financial year from 1 January 2015 to 31 December 2015 pursuant to Section 102 of the Investment Code (KAGB).
Management’s Responsibility
As stipulated in the German Investment Code (KAGB), the preparation of the annual report is the responsibility of the legal representatives of the investment management company.
Auditor‘s Responsibility
Our responsibility is to express an opinion on the annual report based on our audit.
We conducted our audit in accordance with Section 102 KAGB and the generally accepted standards for the audit of financial statements promulgated by the German Institut der Wirtschaftsprüfer (Institute of Public Auditors in Germany) (IDW). Those standards require that we plan and perform the audit such that misstatements materially affecting the annual report are detected with reasonable assurance. Knowledge of the management of the investment fund and evaluations of possible misstatements are taken into account in the determination of audit procedures. The effectiveness of the accounting-related internal control system and the evidence supporting the annual report are examined primarily on a test basis within the framework of the audit. The audit includes assessing the
accounting principles used for the annual report and significant estimates made by the legal representatives of the Investment Management Company. We believe that our audit provides a reasonable basis for our opinion.
Opinion
In our opinion, based on the findings of our audit, the Annual Report for the financial year from 1 January 2015 to 31 December 2015 complies with the legal requirements.
Frankfurt/Main, 14 April 2016
KPMG AGWirtschaftsprüfungsgesellschaft
Warnke SteinbrennerAuditor Auditor
Frankfurt/Main, 14 April 2016
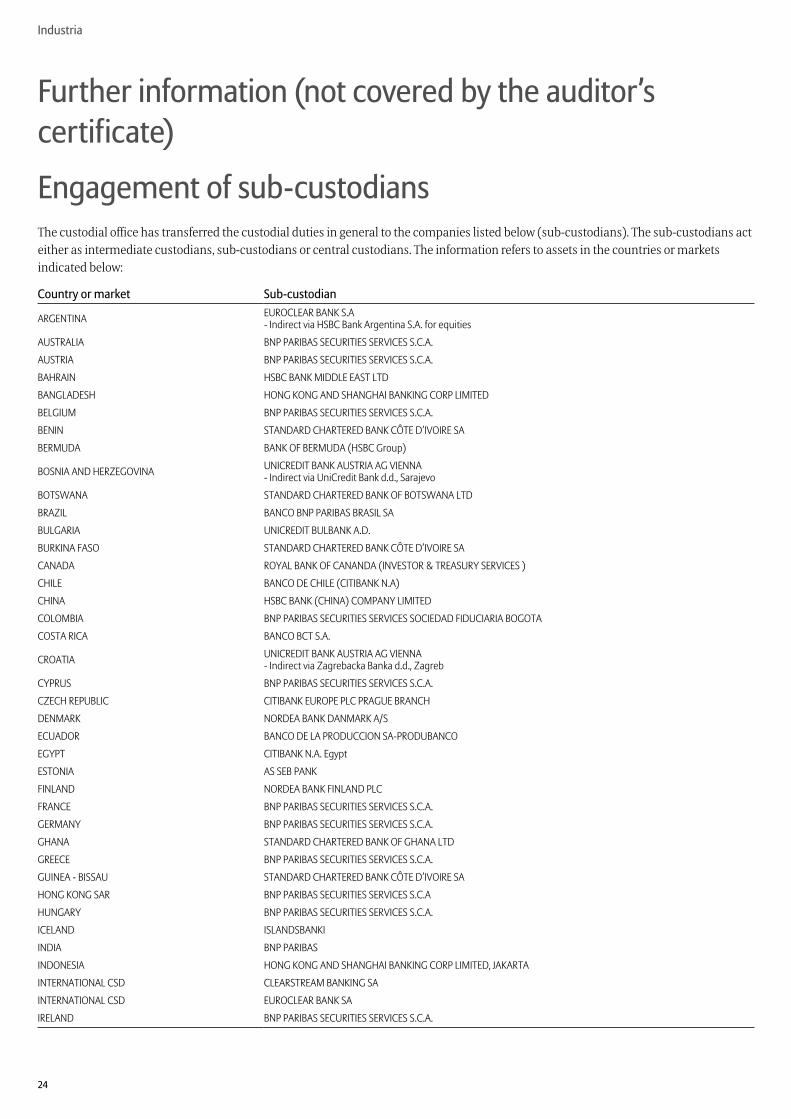
24
Industria
Further information (not covered by the auditor’s certificate)
Engagement of sub-custodiansThe custodial office has transferred the custodial duties in general to the companies listed below (sub-custodians). The sub-custodians act either as intermediate custodians, sub-custodians or central custodians. The information refers to assets in the countries or markets indicated below:
Country or market Sub-custodian
ARGENTINA EUROCLEAR BANK S.A- Indirect via HSBC Bank Argentina S.A. for equities
AUSTRALIA BNP PARIBAS SECURITIES SERVICES S.C.A.
AUSTRIA BNP PARIBAS SECURITIES SERVICES S.C.A.
BAHRAIN HSBC BANK MIDDLE EAST LTD
BANGLADESH HONG KONG AND SHANGHAI BANKING CORP LIMITED
BELGIUM BNP PARIBAS SECURITIES SERVICES S.C.A.
BENIN STANDARD CHARTERED BANK CÔTE D’IVOIRE SA
BERMUDA BANK OF BERMUDA (HSBC Group)
BOSNIA AND HERZEGOVINA UNICREDIT BANK AUSTRIA AG VIENNA- Indirect via UniCredit Bank d.d., Sarajevo
BOTSWANA STANDARD CHARTERED BANK OF BOTSWANA LTD
BRAZIL BANCO BNP PARIBAS BRASIL SA
BULGARIA UNICREDIT BULBANK A.D.
BURKINA FASO STANDARD CHARTERED BANK CÔTE D’IVOIRE SA
CANADA ROYAL BANK OF CANANDA (INVESTOR & TREASURY SERVICES )
CHILE BANCO DE CHILE (CITIBANK N.A)
CHINA HSBC BANK (CHINA) COMPANY LIMITED
COLOMBIA BNP PARIBAS SECURITIES SERVICES SOCIEDAD FIDUCIARIA BOGOTA
COSTA RICA BANCO BCT S.A.
CROATIA UNICREDIT BANK AUSTRIA AG VIENNA- Indirect via Zagrebacka Banka d.d., Zagreb
CYPRUS BNP PARIBAS SECURITIES SERVICES S.C.A.
CZECH REPUBLIC CITIBANK EUROPE PLC PRAGUE BRANCH
DENMARK NORDEA BANK DANMARK A/S
ECUADOR BANCO DE LA PRODUCCION SA-PRODUBANCO
EGYPT CITIBANK N.A. Egypt
ESTONIA AS SEB PANK
FINLAND NORDEA BANK FINLAND PLC
FRANCE BNP PARIBAS SECURITIES SERVICES S.C.A.
GERMANY BNP PARIBAS SECURITIES SERVICES S.C.A.
GHANA STANDARD CHARTERED BANK OF GHANA LTD
GREECE BNP PARIBAS SECURITIES SERVICES S.C.A.
GUINEA - BISSAU STANDARD CHARTERED BANK CÔTE D’IVOIRE SA
HONG KONG SAR BNP PARIBAS SECURITIES SERVICES S.C.A
HUNGARY BNP PARIBAS SECURITIES SERVICES S.C.A.
ICELAND ISLANDSBANKI
INDIA BNP PARIBAS
INDONESIA HONG KONG AND SHANGHAI BANKING CORP LIMITED, JAKARTA
INTERNATIONAL CSD CLEARSTREAM BANKING SA
INTERNATIONAL CSD EUROCLEAR BANK SA
IRELAND BNP PARIBAS SECURITIES SERVICES S.C.A.

25
Industria
Country or market Sub-custodianISRAEL CITIBANK N.A. ISRAEL
ITALY BNP PARIBAS SECURITIES SERVICES S.C.A.
IVORY COAST STANDARD CHARTERED BANK CÔTE D’IVOIRE SA
JAPAN HONG KONG AND SHANGHAI BANKING CORP LIMITED, TOKYO
JORDAN STANDARD CHARTERED BANK, JORDAN BRANCH
KAZAKHSTAN JSC CITIBANK KAZAKHSTAN
KENYA STANDARD CHARTERED BANK PLC
KOREA, REPUBLIC OF HONG KONG AND SHANGHAI BANKING CORP LIMITED, SEOUL
KUWAIT HSBC BANK MIDDLE EAST LTD
LATVIA AS SEB BANKA
LEBANON HSBC BANK MIDDLE EAST LTD
LITHUANIA AB SEB BANKAS
MALAYSIA HSBC BANK MALAYSIA BERHAD, KUALA LUMPUR
MALI STANDARD CHARTERED BANK CÔTE D’IVOIRE SA
MALTA CLEARSTREAM BANKING SA
MAURITIUS HONG KONG AND SHANGHAI BANKING CORP LIMITED, PORT-LOUIS
MEXICO BANCO NACIONAL DE MEXICO (BANAMEX)
MOROCCO BANQUE MAROCAINE POUR LE COMMERCE ET L’INDUSTRIE
NAMIBIA STANDARD BANK OF NAMIBIA LIMITED
NETHERLANDS BNP PARIBAS SECURITIES SERVICES S.C.A.
NEW ZEALAND BNP PARIBAS SECURITIES SERVICES S.C.A.
NIGER STANDARD CHARTERED BANK CÔTE D’IVOIRE SA
NIGERIA STANBIC IBTC BANK
NORWAY NORDEA BANK NORGE ASA
OMAN HSBC BANK OMAN SAOG
PAKISTAN CITIBANK N.A. KARACHI
PERU CITIBANK DEL PERU
PHILIPPINES HONG KONG AND SHANGHAI BANKING CORP LIMITED, MANILA
POLAND BNP PARIBAS SECURITIES SERVICES S.C.A.
PORTUGAL BNP PARIBAS SECURITIES SERVICES S.C.A.
QATAR HSBC BANK MIDDLE EAST LTD
ROMANIA CITIBANK EUROPE PLC BUCHAREST BRANCH
RUSSIA AO CITIBANK (JOINT STOCK COMPANY COMMERCIAL BANK CITIBANK)
SAUDI ARABIA SAUDI ARABIA BRITISH BANK( HSBC GROUP)
SENEGAL STANDARD CHARTERED BANK CÔTE D’IVOIRE SA
SERBIA UNICREDIT BANK AUSTRIA AG VIENNA- Indirect via UniCredit Bank Srbija d.d., Belgrade
SINGAPORE BNP PARIBAS SECURITIES SERVICES S.C.A- Indirect via United Overseas Bank LTD for government bonds
SLOVAK REPUBLIC CITIBANK EUROPE PLC BRATISLAVA BRANCH
SLOVENIA UNICREDIT BANKA SLOVENIJA D.D. LJUBLJANA- Indirect via UniCredit Bank Slovenija d.d., Ljubljana
SOUTH AFRICA STANDARD BANK OF SOUTH AFRICA LIMITED
SPAIN BNP PARIBAS SECURITIES SERVICES S.C.A.
SRI LANKA HONG KONG AND SHANGHAI BANKING CORP LIMITED, COLOMBO
SWAZILAND STANDARD BANK OF SWAZILAND LIMITED
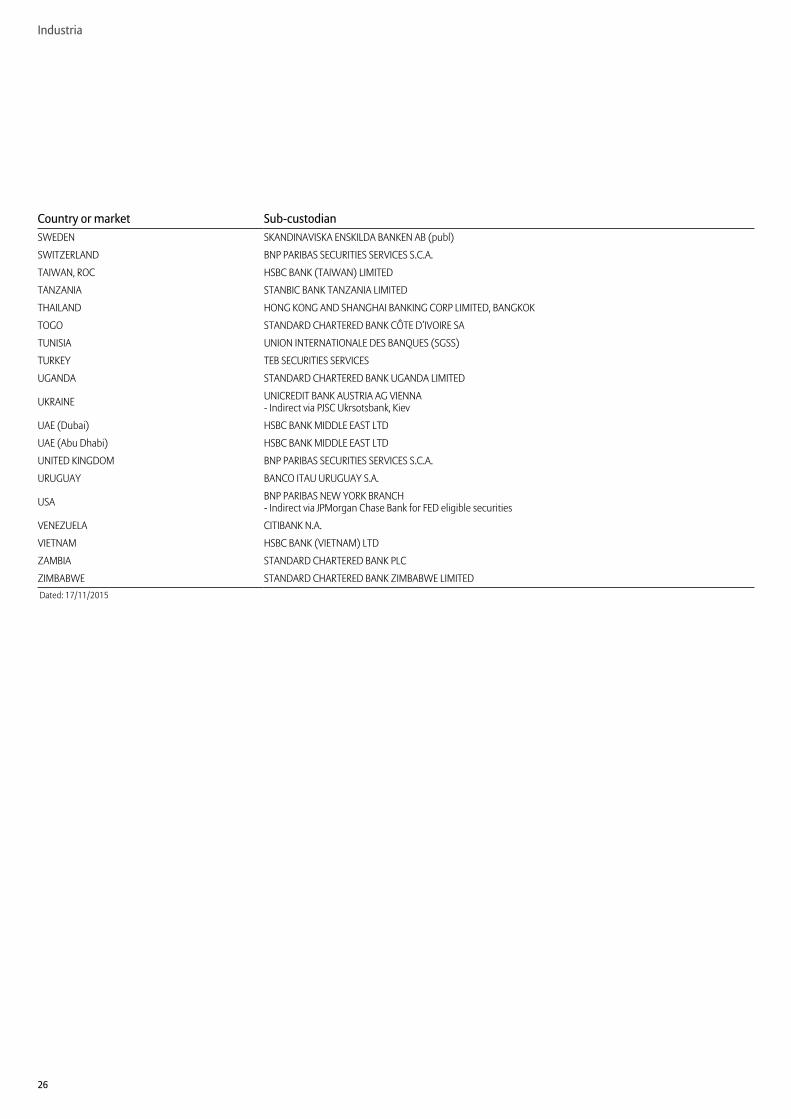
26
Industria
Country or market Sub-custodianSWEDEN SKANDINAVISKA ENSKILDA BANKEN AB (publ)
SWITZERLAND BNP PARIBAS SECURITIES SERVICES S.C.A.
TAIWAN, ROC HSBC BANK (TAIWAN) LIMITED
TANZANIA STANBIC BANK TANZANIA LIMITED
THAILAND HONG KONG AND SHANGHAI BANKING CORP LIMITED, BANGKOK
TOGO STANDARD CHARTERED BANK CÔTE D’IVOIRE SA
TUNISIA UNION INTERNATIONALE DES BANQUES (SGSS)
TURKEY TEB SECURITIES SERVICES
UGANDA STANDARD CHARTERED BANK UGANDA LIMITED
UKRAINE UNICREDIT BANK AUSTRIA AG VIENNA- Indirect via PJSC Ukrsotsbank, Kiev
UAE (Dubai) HSBC BANK MIDDLE EAST LTD
UAE (Abu Dhabi) HSBC BANK MIDDLE EAST LTD
UNITED KINGDOM BNP PARIBAS SECURITIES SERVICES S.C.A.
URUGUAY BANCO ITAU URUGUAY S.A.
USA BNP PARIBAS NEW YORK BRANCH- Indirect via JPMorgan Chase Bank for FED eligible securities
VENEZUELA CITIBANK N.A.
VIETNAM HSBC BANK (VIETNAM) LTD
ZAMBIA STANDARD CHARTERED BANK PLC
ZIMBABWE STANDARD CHARTERED BANK ZIMBABWE LIMITEDDated: 17/11/2015

27
28
Further information (not covered by the auditor’s certificate)
Your PartnersAllianz Global Investors GmbHBockenheimer Landstraße 42-4460323 Frankfurt/Main
Customer Service CentreTelephone: +49 9281-72 20Fax: +49 9281-72 24 61 15 +49 9281-72 24 61 16E-Mail: [email protected]
Subscribed and paid up capital:EUR 49.9 million
Dated: 31 December 2014
ShareholderAllianz Asset Management AG
Munich
Supervisory BoardDr. Christian FinckhChief HR OfficerAllianz SEMunich
Stefan BaumjohannMember of the Works Council ofAllianz Global Investors GmbHFrankfurt/Main
Prof. Dr. Michael HütherChairman and Member of the Executive CommitteeInstitut der deutschen Wirtschaft Cologne
Angelika Leutz (until 28/02/2015)Member of the Works Council ofAllianz Global Investors GmbHFrankfurt/Main
Laure Poussin (since 01/03/2015)Member of the Works Council ofAllianz Global Investors GmbHSuccursale FrançaiseParis
Wolfgang PützMember of the Supervisory Board ofAllianz Global Investors GmbHFrankfurt/Main
Dr. Bettina Corves-WundererChief Financial OfficerAllianz S.p.A.Trieste
Board of ManagementElizabeth Corley (CEO)
Thorsten Heymann (since 01/03/2015)
Dr. Markus Kobler
Daniel Lehmann
George McKay (since 01/03/2015)
Michael Peters
Dr. Wolfram Peters
Tobias C. Pross
Andreas Utermann
CustodianBNP Paribas Securities Services S.C.A.Frankfurt/Main branchEuropa-Allee 1260327 Frankfurt/Main
Subscribed capital: EUR 165.28 millionAdditional surplus for tax purposes:EUR 127.93 million
Dated: 31 December 2014
Special Order Placement OfficesFondsdepot Bank GmbHWindmühlenweg 1295030 Hof
RBC Investor Services Bank S.A. 14, Porte de France L-4360 Esch-sur-Alzette
Paying and information agent in AustriaAllianz Investmentbank AGHietzinger Kai 101–105A-1130 Vienna
Appointment of the Austrian Representative to the Tax Authorities in the Republic of AustriaThe following financial institution isappointed as local representative for tax purposes to provide proof of deemed distribution income within the meaning ofSection 186, Paragraph 2, Item 2 of theAustrian Investment Fund Act (InvFG):
Allianz Investmentbank AGHietzinger Kai 101–105A-1130 Vienna
AuditorKPMG AGWirtschaftsprüfungsgesellschaftFrankfurt/Main
Dated: 31 December 2015
Visit our website at www .allianzglobalinvestors .de
29
Further information (not covered by the auditor’s certificate)
Information for investors in the Republic of AustriaThe sale of units in the fund Industria in the Republic of Austria has been registered with the Finanzmarktaufsicht (Vienna) in accordance with Section 140 of the Investment Fund Act (Investmentfondsgesetz – InvFG).
Redemption requests for units in the aforementioned fund can be submitted to the Austrian paying and information agent and the redemption proceeds, possible distributions and any other payments can be paid out to the unitholders by the Austrian paying and information agent, at their request, in euro cash.
Investors may obtain all necessary information from the Austrian payment and information agent for free, for example· the prospectus, · the investment terms and conditions,· the key investor information,· the annual and semi-annual reports,· the issue and redemption prices.
Prior to acquiring units of the fund, investors are recommended to ascertain whether the income data on the unit class that is required for tax purposes is published by the Oesterreichische Kontrollbank.

Allianz Global Investors GmbHBockenheimer Landstraße 42–4460323 Frankfurt/[email protected]

Singapore RepresentativeAllianz Global InvestorsSingapore Limited6 Battery Road # 28-01Singapore 049909

Allianz Global Investors GmbHBockenheimer Landstraße 42–4460323 Frankfurt/[email protected]
Singapore Sales Contact
Allianz Global Investors Singapore Limited6 Battery Road # 28-01Singapore 049909Hotline: (1800) 438 0828Fax: 6311 8025Website: www.AllianzGlobalInvestors.com.sgCompany Regn No. 199907169ZE-mail: [email protected]