
Allegany County Community Health Needs Assessment · 2 support health, prevent and control...
23
1 Allegany County Community Health Needs Assessment Western Maryland Health System and Allegany County Health Department November 2011 Background National Prevention Strategy The Patient Protection and Affordable Care Act and the Health Care Education Reconciliation Act (known together as the Affordable Care Act) mandate the development of a National Prevention and Health Promotion Strategy and require non-profit hospitals to conduct a community health needs assessment in conjunction with public health entities. The vision of the National Prevention Strategy is “Working together to improve the health and quality of life for individuals, families and communities by moving the nation from a focus on sickness and disease to one based on prevention and wellness.” The goal is to increase the number of Americans who are healthy at every stage of life. The National Prevention Strategy recognizes that social, economic, and environmental factors all influence health. Many of the strongest predictors of health and wellbeing fall outside of the healthcare setting. State and local government, businesses, community organizations, and community members are encouraged to partner on the Strategy. Maryland Health Care Reform Coordinating Council The Maryland Health Care Reform Coordinating Council (HCRCC) was created to advise the State government on efficient and effective implementation of federal health care reform. HCRCC directed the Maryland Department of Health and Mental Hygiene to develop a State Health Plan in coordination with hospitals under the Health Services Cost Review Commission. HCRCC recommended development of interconnected state and local strategic plans to achieve improved health outcomes. Maryland’s Health Improvement Plan 2011-2014 will provide a framework to support improvements in the health of Marylanders and their communities. Improving the health of all Marylanders through population planning requires committed local partnerships that include hospitals, local health departments, community organizations, and the private sector. National and State Priorities National and State plans include engaging partners, aligning policies and programs, utilizing evidence-based research and best practices, and ensuring accountability. National priorities are: tobacco-free living, preventable drug abuse and excessive alcohol use, healthy eating, active living, injury and violence free living, reproductive and sexual health, and mental and emotional wellbeing. Maryland vision areas are: reproductive healthcare and birth outcomes, social environments that are safe and support health, physical environments that are safe and
Transcript of Allegany County Community Health Needs Assessment · 2 support health, prevent and control...
1
Allegany County Community Health Needs Assessment Western Maryland Health System and Allegany County Health Department
November 2011
Background
National Prevention Strategy
The Patient Protection and Affordable Care Act and the Health Care Education
Reconciliation Act (known together as the Affordable Care Act) mandate the development of a
National Prevention and Health Promotion Strategy and require non-profit hospitals to conduct a
community health needs assessment in conjunction with public health entities.
The vision of the National Prevention Strategy is “Working together to improve the
health and quality of life for individuals, families and communities by moving the nation from a
focus on sickness and disease to one based on prevention and wellness.” The goal is to increase
the number of Americans who are healthy at every stage of life.
The National Prevention Strategy recognizes that social, economic, and environmental
factors all influence health. Many of the strongest predictors of health and wellbeing fall outside
of the healthcare setting. State and local government, businesses, community organizations, and
community members are encouraged to partner on the Strategy.
Maryland Health Care Reform Coordinating Council
The Maryland Health Care Reform Coordinating Council (HCRCC) was created to
advise the State government on efficient and effective implementation of federal health care
reform. HCRCC directed the Maryland Department of Health and Mental Hygiene to develop a
State Health Plan in coordination with hospitals under the Health Services Cost Review
Commission.
HCRCC recommended development of interconnected state and local strategic plans to
achieve improved health outcomes. Maryland’s Health Improvement Plan 2011-2014 will
provide a framework to support improvements in the health of Marylanders and their
communities. Improving the health of all Marylanders through population planning requires
committed local partnerships that include hospitals, local health departments, community
organizations, and the private sector.
National and State Priorities
National and State plans include engaging partners, aligning policies and programs,
utilizing evidence-based research and best practices, and ensuring accountability. National
priorities are: tobacco-free living, preventable drug abuse and excessive alcohol use, healthy
eating, active living, injury and violence free living, reproductive and sexual health, and mental
and emotional wellbeing. Maryland vision areas are: reproductive healthcare and birth outcomes,
social environments that are safe and support health, physical environments that are safe and

2
support health, prevent and control infectious disease, prevent and control chronic disease, and
all Marylanders receive needed healthcare.
Allegany County Community Health Needs Assessment
The community health needs assessment will guide decision making for the community
and allow Allegany County to engage effectively with state and federal initiatives. The
community health needs assessment will be used to develop a Local Health Improvement Plan.
The Allegany County Health Department and the Western Maryland Health System
(WMHS) led community health needs assessment efforts. The Allegany County Health
Department works to promote health in Allegany County and WMHS is a Total Patient Revenue
hospital and the only hospital in the county, providing a unique opportunity to impact
community health. 72.5% of WMHS patients are Allegany County residents.
Management teams from the Allegany County Health Department and WMHS collected
and analyzed data from an array of sources to assist in identifying health needs in Allegany
County (see Appendix). Criteria to identify the most significant health issues included
magnitude, severity compared to target, and level of need for vulnerable populations.
Data were presented to a wide variety of local organizations and community members
who gave input and ranked community health priorities (see Community Input). WMHS,
Allegany County Health Department, and community partners will develop a Local Health
Improvement Plan with evidence-based strategies to address the top 13 health priorities.
Tasks Jan-
Mar
2011
Apr-
Jun
2011
July-
Sept
2011
Oct-
Dec
2011
Jan-
Mar
2012
Apr-
Jun
2012
July-
Sept
2012
Oct-
Dec
2012
Jan-
Mar
2013
Apr-
Jun
2013
July-
Sept
2013+
Data Collection & Analysis
Presentations & Priorities
Service Line Coordination
Summary of Needs, Gaps & Resources
Priorities, Best Practices & Partners
Approve Action Plan & Metrics
Community Benefit Report
Report to Public
Implement Plan & Report Quarterly
Update Timeline for Next 3 yr. cycle
3
Allegany County Overview
Demographics
Allegany County is located in rural Western Maryland and has a population of 72,598.
The county is part of the Appalachian region and has low education levels, limited racial
diversity, a large elderly population, and low household incomes.
Allegany County is 50.3% male and 49.7% female. A smaller percent of the population is
under 5 years old (4.6%) than in Maryland (6.7%) or the U.S. (6.9%). A larger percent of the
population is 65 years and older (18.1%) than in Maryland (11.8%) or the U.S. (12.6%). There is
less racial diversity in Allegany County than in the U.S.; 91.4% of the population is white, 6.2%
is black, 1.1% is Hispanic or Latino, and 1.1% is two or more races.
In Allegany County, the average household size is 2.25. The county has a larger
percentage of single parent households (33%) than the U.S. benchmark (20%). Of the
grandparents living with their grandchildren under age 18, there is a higher percentage
responsible for their grandchildren (54.2%) than in Maryland (36.7%) or the U.S. (33.4%). More
households in Allegany County are without a vehicle (11%) than in the U.S. (9%).
The median household income in Allegany County is well below the U.S. median
($36,810 v. $51,425), and 14.2% of individuals are living below the poverty line compared to
13.5% in the U.S. The unemployment rate is 8.9% in Allegany County compared to 6.6% in
Maryland. The percentage of Allegany County children living in poverty (19%) is higher than
the Maryland rate (10%) and the U.S. benchmark (11%).
While Allegany County has the same percentage of adults with a high school education
as the U.S. (85%), the county has only 15.2% of adults with a bachelor’s degree or higher
compared to 35.2% in Maryland and 27.5% in the U.S. In addition, 11% of Allegany County
residents age 16 and over are illiterate.
Community Needs Index
Catholic Healthcare West and Thomson Reuters developed the nation’s first standardized
Community Needs Index (CNI). It identifies the severity of health disparity in every zip code in
the U.S. and demonstrates a link between community need, access to care, and preventable
hospitalizations. CNI gathers data about the community’s socio-economy including barriers
related to income, culture/ language, education, insurance, and housing. A score of 1.0 indicates
a zip code with the lowest socio-economic barriers and 5.0 represents a zip code with the most
socio-economic barriers. The closer to 5 the more community need there is in a zip code. A
comparison of CNI scores to hospitalization shows a strong correlation between high need and
high use. In fact admission rates for the most highly needy communities are over 60% higher
than communities with the lowest need.
In Allegany County, the area of highest need is 21502 (Cumberland) with a CNI of 3.8.
Other high need areas include 21562 (Westernport), 21539 (Lonaconing), and 21532 (Frostburg)
all at 3.6. The area with the lowest need is 21557 (Rawlings) with a CNI of 2.2.

4
County Health Rankings
Recent population-based health information was received from the University of
Wisconsin Population Health Institute through a study funded by the Robert Wood Johnson
Foundation. The results show that Allegany County ranks 21st out of 24 Maryland jurisdictions
on health outcomes and 20th out of 24 on health factors. Breaking down the health factors, the
study shows that Allegany is 18th in health behaviors and social and economic factors, 24th in
clinical care, and 8th in physical environment.
Lifestyle and Environment
Health Behaviors
Lifestyle and behavioral risk factors substantially contribute to health. According to the
Community Health Status Reports from the U.S. Department of Health and Human Services, half
of all deaths can be attributed to these factors. Tobacco use accounts for 19% of all U.S. deaths,
poor diet and inactivity account for 14%, alcohol use accounts for 5%, and 12% are related to
factors including microbes, toxins, firearms, sexual behavior, motor vehicles and drug use. In
Allegany County unhealthy behaviors including tobacco use, substance abuse, and low levels of
physical activity contribute to poor health outcomes.
Tobacco and Alcohol Use
The Healthy People 2020 goal for adult smoking is 12% or less. In Allegany County,
26% of adults smoke, a larger percentage than in Maryland (18%) and well above the U.S.
benchmark (15%). According to the Centers for Disease Control and Prevention, the highest
smoking rates are found among vulnerable populations, including people with lower levels of
educational attainment. In the U.S. in 2008, 41% of people with a General Education
Development certificate smoked cigarettes, compared to 6% of people with a graduate degree.
The U.S. benchmark for excessive drinking is 8% and 16% of adults drink excessively in
Allegany County. 13.1% of fatal motor vehicle crashes in Allegany County are alcohol related.
County Health Ranking 2011 (University of Wisconsin)
% Adults Smoking% Adults Excessive
Drinking
Allegany 26 16
MD 18 15
US 15 8
Target 12 8
0
5
10
15
20
25
30
5
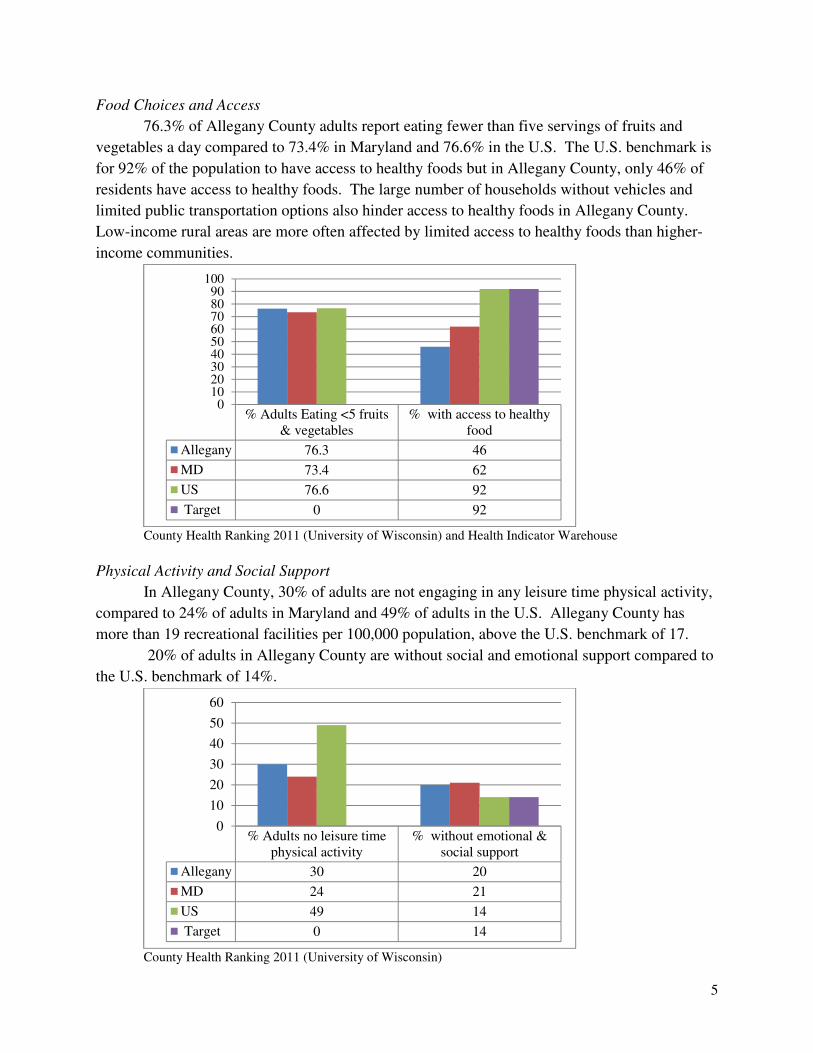
Food Choices and Access
76.3% of Allegany County adults report eating fewer than five servings of fruits and
vegetables a day compared to 73.4% in Maryland and 76.6% in the U.S. The U.S. benchmark is
for 92% of the population to have access to healthy foods but in Allegany County, only 46% of
residents have access to healthy foods. The large number of households without vehicles and
limited public transportation options also hinder access to healthy foods in Allegany County.
Low-income rural areas are more often affected by limited access to healthy foods than higher-
income communities.
County Health Ranking 2011 (University of Wisconsin) and Health Indicator Warehouse
Physical Activity and Social Support
In Allegany County, 30% of adults are not engaging in any leisure time physical activity,
compared to 24% of adults in Maryland and 49% of adults in the U.S. Allegany County has
more than 19 recreational facilities per 100,000 population, above the U.S. benchmark of 17.
20% of adults in Allegany County are without social and emotional support compared to
the U.S. benchmark of 14%.
County Health Ranking 2011 (University of Wisconsin)
% Adults Eating <5 fruits& vegetables
% with access to healthyfood
Allegany 76.3 46
MD 73.4 62
US 76.6 92
Target 0 92
0102030405060708090
100
% Adults no leisure timephysical activity
% without emotional &social support
Allegany 30 20
MD 24 21
US 49 14
Target 0 14
0
10
20
30
40
50
60

6
Health Needs and Disease Status
Birth Measures
The teen birth rate in Allegany County (35 per 1,000 births) is above the Maryland rate
(34 per 1,000) and U.S. benchmark (22 per 1,000). Allegany County has a high percentage of
unmarried women giving birth at 42.7%. In Allegany County, 19% of mothers do not receive
prenatal care in the first trimester compared to 19.8% in Maryland and 16.1% in the U.S.
Kids Count 2005-2011 and Maryland Vital Statistics
Tobacco and Drug Use during Pregnancy
In Allegany County, 41.3% of Medicaid eligible pregnant women report using tobacco
during pregnancy. This is more than double the Maryland rate (19.7%) and well above the target
level of less than 9%.
In Allegany County, 8.7% of Medicaid eligible pregnant women report using illicit drugs
during pregnancy compared to 5.7% in Maryland. In 2010, of the 1,058 deliveries at Western
Maryland Health System, 102 infants (9.6%) were drug exposed and 25 (2.4%) were drug
addicted.
Maryland Prenatal Risk Assessment FY10
Teen Birth Rate per 1000% No Care in First
Trimester
Allegany 35 19
MD 34 19.8
US 22 16.1
Target 22 12
05
10152025303540
% Tobacco Use DuringPregnancy
% Using Illicit Drugswithin past 6 months
Allegany 41.3 8.7
MD 19.7 5.7
Target 9 0
05
1015202530354045

7
Birth Weight and Infant Mortality
In Allegany County, 7.2% of infants are considered low birth weight, weighing less than
2500 grams. This is lower than the Maryland (9.2%) and U.S. (8.2%) rates. However, 1.9% of
infants in Allegany County are very low birth weight at less than 1500 grams. This is higher than
the Maryland (1.8%) and U.S. (1.5%) rates.
The infant mortality rate in Allegany County is 8.4 per 1,000 live births, higher than both
the Maryland (7.2) and U.S. (6.9) rates.
Kids Count 2005-2011 and Maryland Vital Statistics
Chronic Disease Risk Factors
The Centers for Disease Control and Prevention (CDC) define obesity as adults with a
body mass index of 30 or above. By this measure, 29% of Allegany County adults are obese
compared to 27% of Maryland adults and the U.S. benchmark of 25%. Obesity is associated with
increased risk of heart disease, stroke, type 2 diabetes, and certain types of cancer.
Allegany County has a higher percentage of adults with high blood pressure (32.9%) than
Maryland (30%) and the U.S. (28.7%). In addition, a higher percentage of Allegany County
adults have been diagnosed with diabetes (12.3%) than in Maryland (8.6%) or the U.S. (8.3%).
% Low Birth Wt.<2500 g/5lb8oz
% Very LowBirth Wt. <1500
g/3lb5oz
Infant Mortality(deaths per 1000
live births)
Allegany 7.2 1.9 8.4
MD 9.2 1.8 7.2
US 8.2 1.5 6.9
Target 7.8 1.4 6
0123456789
10

8
County Health Ranking, 2008 CDC Trends, and Community Health Status Indicators
Injuries
The Healthy People 2020 goal for injury-related emergency department visits is 7533.4
per 100,000 population and Allegany County has 14,361 injury-related emergency department
visits per 100,000. The target for injury-related hospital discharges is 555.8 per 100,000 and
Allegany County has 1,866 per 100,000.
DHMH Injuries 2005-2008
Behavioral Health
In Allegany County, there is a 6% prevalence of mental disorders in adults and 13%
prevalence among children ages 13-18. During the first three quarters of fiscal year 2011, mental
disorders have grown to be the fourth largest category of hospital admissions at Western
Maryland Health System, accounting for 8.01% of admissions. From 2001- 2005, there were 903
hospital discharges per 100,000 for substance abuse. In the past year, severe depression was the
% Adults withBody MassIndex >30
% Adults withhigh bloodpressure
% Adultsdiagnosed withdiabetes (age
adj)
Allegany 29 32.9 12.3
MD 27 30 8.6
US 25 28.7 8.3
Target 25 26.9 8.5
05
101520253035
0 5000 10000 15000 20000
ED visits per 100,000
Discharges per 100,000
ED visits per 100,000 Discharges per 100,000
Target 7533.4 555.8
US 8370.4 617.6
Allegany 14361 1866
Injuries per 100,000

9
sixth most prevalent reason for hospital admission. High rates of depression are found among
adults 65 and older. In the U.S. in 2006, 18% of women 65 and older and 10% of men 65 and
older reported depressive symptoms. People who report depressive symptoms often experience
higher rates of physical illness and higher health care resource utilization.
Dental Health
In Allegany County, 15.8% of residents report that they have not had a dental visit in the
past five years. 12.4% of Allegany County adults have lost all of their permanent teeth compared
to 3.4% of Maryland adults. It was only within the past ten years that most of the Allegany
County public water systems were fluoridated, which has contributed to poor oral health in the
County.
Tooth loss is associated with age and income. In the U.S., 42% of adults ages 65 and
older with incomes below the poverty line reported no natural teeth. Low-income adults without
dental coverage are most likely to seek care in the WMHS emergency department for dental
pain.
Self-Reported Health Status
20% of Allegany County adults report that they are in poor or fair health compared to
13% of Maryland adults and 17.1% of U.S. adults. When asked about their health in the past 30
days, Allegany County adults report a higher of number of poor physical health days (4.5) and
poor mental health days (4.2) than the U.S. benchmarks (2.6 physical, 2.3 mental).
County Health Ranking 2011 (University of Wisconsin)
Death Rates
In Allegany County, heart disease, cancer, stroke, and chronic respiratory disease are the
leading causes of death accounting for 63% of deaths.
% Adultsreporting poor orfair health (age
adj)
Avg. # poorphysical days inpast 30 (age adj)
Avg. # poormental days in
past 30 (age adj)
Allegany 20 4.5 4.2
MD 13 3.2 3.3
US 17.1 2.6 2.3
0
5
10
15
20
25

10
Maryland Vital Statistics & BRFSS 2009
Age-adjusted death rates (rate per 100,000) for heart disease, cancer, stroke, chronic
respiratory disease, suicide, and motor vehicle crashes are higher in Allegany County than in
Maryland.
Maryland Vital Statistics 2007-2009
Because the racial minority population is so small in Allegany County, death rates and
leading causes of death cannot be calculated by racial and ethnic groups. Deaths among minority
populations reflect what is seen in the overall County population.
The incidence rate for all types of cancer in Allegany County is 470.6 per 100,000
population compared to 464.5 per 100,000 in the U.S. Allegany County death rates for lung and
bronchus cancer (females) and non-Hodgkin lymphoma (males) are rising and are similar to U.S.
rates. Lung and bronchus cancer deaths among males are above the U.S rate and are remaining
stable. Deaths due to non-Hodgkin lymphoma in females and prostate cancer in males are similar
to U.S. rates and are stable. Allegany county deaths due to breast cancer and colorectal cancer
are decreasing along with U.S. rates.
29%
23%6%
5%3%
34%
% of Deaths by Cause
Heart
Cancer
Stroke
COPD
Diabetes
Other
0 50 100 150 200 250 300
Heart
Cancer
Stroke
Resp. Disease
Suicide
Motor Vehicle
Heart Cancer StrokeResp.
DiseaseSuicide
MotorVehicle
Target 169 160.6 33.8 35.1 8.4 12.4
MD 196.8 179.3 40 35.6 9.3 13
Allegany 256.8 190.2 50.3 46.2 12.4 15
Age Adjusted Death Rate per 100,000

11
Emergency Department Visits
In 2010, the top ten emergency department diagnoses at the Western Maryland Health
System (WMHS) were:
1. Chest Pain 6. Noninfectious Gastroenteritis
2. Abdominal Pain 7. Head Injury
3. Urinary Tract Infections 8. Otitis Media (Ear Infection)
4. Acute Bronchitis 9. Sprain of Neck
5. Sprain of Ankle 10. Headache
Hospital Admissions
From July 2010 to April 2011, the most prevalent diagnoses for admission to WMHS
were:
1. Natural Birth 7. Osteoarthritis
2. Coronary Atherosclerosis 8. Cesarean Birth
3. Pneumonia 9. Chest Pain
4. Rehabilitation Process 10. Atrial Fibrillation
5. Obstructive Chronic Bronchitis 11. Acute Chronic Systolic Failure
6. Recurring Depressive Disorder 12. Septicemia
Access to Care
Payor Mix
Allegany County has a larger percent of uninsured residents (15%) than the U.S.
benchmark (13%). The county also has more people with Medical Assistance (22.3% v. 18.8%)
and Medicare (21.4% v. 18.3%).
2011 County Health Ranking & Community Health Status Indicators
At Western Maryland Health System in 2010, 38.5% of patients receiving inpatient or
outpatient treatment and 25.9% of emergency department patients had Medicare. 10.2% of
patients receiving inpatient and outpatient treatment and 18% of emergency department patients
were covered by Maryland Physicians Care, a Medical Assistance Managed Care Organization.
15
22.3
21.4
41.3
Allegany County
Uninsured
Medicaid
Medicare
Other
13
18.8
18.3
49.9
United States
Uninsured
Medicaid
Medicare
Other

12
Western Maryland Health System
The majority of visits to the Allegany County Health Department mental health clinic are
covered by Medicaid (68%) and Medicare (23.3%). 86% of retail pharmacy costs are covered by
third party insurance.
Allegany County Health Department Mental Health Clinic Report 2010 and PharmaCare Network 2010
Providers
Allegany County is a designated health professional shortage area (HPSA) for primary
care for low-income populations, mental health care for Medical Assistance populations, and
dental care for low-income populations.
The top provider needs in Allegany County are primary care and psychiatry. According
to the County Health Rankings, the U.S. benchmark is to have one primary care provider for
every 631 people and Allegany County has one primary care provider for every 1,023 people. In
Maryland, there is one mental health provider for every 1,617 people, but in Allegany County
there is one mental health provider for every 2,271 people.
38.5
10.28.84.13.8
3.6
31
WMHS Inpatient and Outpatient
Medicare MD. Physicians CareCareFirst BC United HealthcareMeritain Health Private PayAll others
25.9
18
9.5
6.73.1
36.8
WMHS Emergency Department
Medicare MD. Physicians Care
Private Pay Carefirst BC
United Healthcare Other
68
6.10.5
23.3
2.1
ACHD Mental Health ClinicVisits
Medicaid Uninsured + Private Pay
Private Insurance Medicare
Non-Chargeable Service
8.43
5.54
86.01
Retail Pharmacy
Retail /No Insurance or Discount Plan
Medicaid
Third Party Insurance

13
Allegany County also needs specialty providers including medical oncology,
gastroenterology, vascular surgery, and urology, as well as dentists willing to provide care for
adults with no insurance or Medical Assistance.
Utilization and Barriers to Care
Preventable Hospital Stays and Preventive Services
Preventable hospital stays among Medicare enrollees (hospital utilization rates for
ambulatory care sensitive conditions) are 108 per 1,000 in Allegany County, more than double
the U.S. benchmark of 52 per 1,000.
For preventive services, the U.S. benchmark is for 74% of female Medicare enrollees to
receive a mammogram screening and Allegany County is at 74%. The Healthy People 2020
target is for 93% of females ages 18 and over to have a pap smear but currently Allegany County
is at 81% of females. The U.S. benchmark is for 89% of diabetic Medicare enrollees to receive
HbA1c screening and Allegany County is at 85%. The target is to have 80% of adults ages 65
and over vaccinated for the flu within the past 12 months and Allegany County has a 63.8%
vaccination rate among this population.
County Health Rankings 2011
Barriers to Care and Factors that Contribute to Poor Health
High rates of poverty are a major contributor to poor health status in Allegany County.
According to the Centers for Disease Control and Prevention, there is a direct correlation
between lower income and higher rates of premature mortality in the U.S. In a 2008 study for
the Appalachian Regional Commission, it was found that poverty and percentage of people
without health insurance consistently defined localized areas that suffered the highest rates of
premature mortality. The median household income in Allegany County is well below the U.S.
median and 14.2% of residents and 19% of children are living below the poverty line.
Social determinants associated with poverty including limited transportation,
unstable/unsafe housing, and limited access to healthy foods affect health outcomes in Allegany
Preventable HospitalStays (per 1000 Medicare
enrolles)
% 65 and over gettingflu vaccine within year
Allegany 108 63.8
MD 70 67.4
Target 52 80
0
20
40
60
80
100
120

14
County. Healthy People 2020, the evidence-based 10-year agenda for improving the nation’s
health, recognizes that addressing social determinants is vital to improving health. To improve
health outcomes, Healthy People 2020 indicates that we must address socioeconomic conditions,
transportation options, and resources to meet daily needs (e.g., safe housing, local food markets).
In Allegany County, 11% of households are without vehicles and transportation
represents a barrier to care. 25% of respondents to a 2011 community survey reported missing
health and human service appointments due to lack of transportation. Some transportation
services are available including fixed routes and demand response services from Allegany
County Transit. Half fares are available for those with Medicare, disabled, or senior citizen
cards. Demand Response is an ADA service. ADA service is limited to individuals with
disabilities who are unable to ride accessible, fixed route bus service because of disability.
Seniors ages 65 and older are provided with curb to curb transportation within the service area.
To be eligible for ADA service, one must live less than .75 miles from a bus route.
Allegany County has an Appalachian culture that is characterized by valuing self-reliance
and distrusting outsiders and formalized medical systems. The Appalachian culture can represent
a barrier to care, especially for preventive health services.
Health literacy is another significant barrier in Allegany County. According to the
National Action Plan to Improve Health Literacy, nearly 9 out of 10 adults have difficulty using
the everyday health information that is routinely available in health care facilities and in the
community. According to research from the U.S. Department of Education only 12% of English
speaking adults in the U.S. have proficient health literacy skills, and poor health literacy
disproportionately impacts lower socioeconomic groups.
Strengths and Resources
Strong partnerships exist in Allegany County that assist in addressing community health
needs. Organizations are working together to implement a variety of strategies. Western
Maryland Health System provides community health and wellness, clinical prevention, care
coordination, home care, and provider recruitment. As a Total Patient Revenue hospital it has a
vested interest in population health and prevention. The Allegany County Health Department
provides screening and prevention programs, family planning, WIC, inpatient and outpatient
behavioral health services, mental health care management, dental services, and food and water
protection. Many workgroups bring a variety of partners together to address specific needs in the
community. Examples include: Making Healthy Choices Easy (obesity and healthy living),
Community Wellness Coalition (integrated wellness), Workgroup on Access to Care and
Community Access Program (uninsured and underinsured), Mountain Health Alliance (adult
dental care), and Garrett Allegany Health Workforce Development Network (provider
recruitment and development).
In addition to existing partnerships and a culture of collaboration, Allegany has other
resources that assist in promoting community health. Allegany County has excellent air quality, a
large number of recreational facilities, and a hospital that is larger and provides more services
than in many other rural areas. Allegany College of Maryland and Frostburg State University

15
train local health care providers in nursing, psychology, dental hygiene, radiologic technology,
respiratory therapy, and other areas and support continuing education for health care
professionals. The Western Maryland Area Health Education Center (AHEC) facilitates
continuing education and training for health professionals, conducts health workforce
development activities, and promotes interdisciplinary health practice. Allegany County also has
a county government that recognizes the area’s health needs and supports public health.
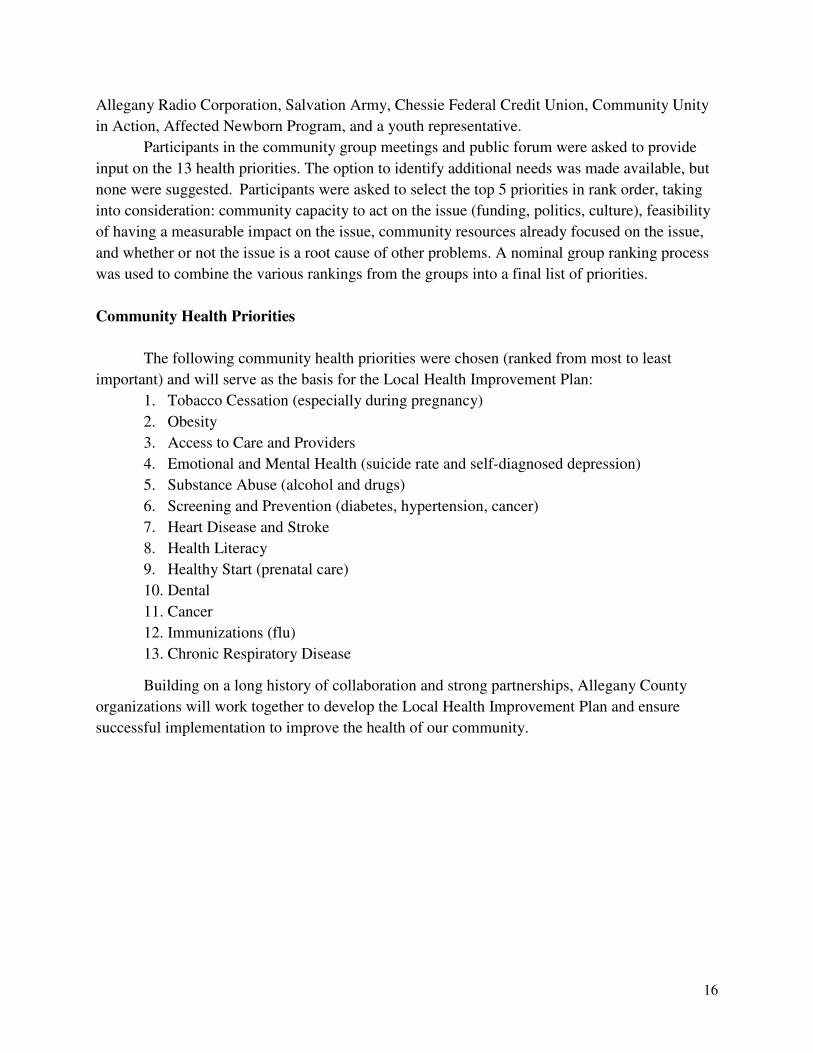
Community Input
Through extensive data collection and analysis, 13 health priorities were selected based
on magnitude, severity compared to target, and level of need for vulnerable populations. The 13
priorities were: tobacco cessation (especially during pregnancy); emotional and mental health
(suicide rate and self-diagnosed depression); prenatal care – healthy start; access to care and
providers; health literacy; screening and prevention (diabetes, hypertension, cancer); substance
abuse (alcohol and drugs); obesity; immunization (flu); heart disease and stroke; cancer; chronic
respiratory disease; dental.
From June 2011 to October 2011, WMHS and the Allegany County Health Department
met with more than 20 organizations and community groups to present community health data
and gather input on community health needs. The groups included:
• WMHS Board of Directors and Community Advisory Board
• Workgroup on Access to Care
• Local Drug and Alcohol Abuse Council
• Local Management Board
• Community Wellness Coalition
• Western Maryland Area Health Education Center (AHEC) Board
• School Health Council
• Mental Health Advisory Board
• Board of Health
• Cumberland Ministerial Association
• County United Way
• Cumberland Housing Rental Advisory Board
• Neighborhood Advisory Commission
• Community Trust Foundation
• Faculty and Allied Health Students at Allegany College of Maryland
• Community Forum (open to the public)
Many of these groups include a number of organizations. For example, the Local Drug
and Alcohol Abuse Council involves representatives from Department of Social Services,
Department of Juvenile Services, Regional Parole and Probation, State’s Attorney, District
Public Defender, County Sheriff, Administrative Judge of Circuit Court, substance abuse
provider, consumer of addictions treatment, Allegany County Health Department, Maryland
State Police, Board of Education, Frostburg State University, Allegany College of Maryland,
16
Allegany Radio Corporation, Salvation Army, Chessie Federal Credit Union, Community Unity
in Action, Affected Newborn Program, and a youth representative.
Participants in the community group meetings and public forum were asked to provide
input on the 13 health priorities. The option to identify additional needs was made available, but
none were suggested. Participants were asked to select the top 5 priorities in rank order, taking
into consideration: community capacity to act on the issue (funding, politics, culture), feasibility
of having a measurable impact on the issue, community resources already focused on the issue,
and whether or not the issue is a root cause of other problems. A nominal group ranking process
was used to combine the various rankings from the groups into a final list of priorities.
Community Health Priorities
The following community health priorities were chosen (ranked from most to least
important) and will serve as the basis for the Local Health Improvement Plan:
1. Tobacco Cessation (especially during pregnancy)
2. Obesity
3. Access to Care and Providers
4. Emotional and Mental Health (suicide rate and self-diagnosed depression)
5. Substance Abuse (alcohol and drugs)
6. Screening and Prevention (diabetes, hypertension, cancer)
7. Heart Disease and Stroke
8. Health Literacy
9. Healthy Start (prenatal care)
10. Dental
11. Cancer
12. Immunizations (flu)
13. Chronic Respiratory Disease
Building on a long history of collaboration and strong partnerships, Allegany County
organizations will work together to develop the Local Health Improvement Plan and ensure
successful implementation to improve the health of our community.

17
Appendix
A. Demographics – Community Characteristics
Measure US MD Target Allegany
MD
Source #
Social Characteristics Average Household Size 2.6 2.63 2.25 1
Number of Households/% family households 112.6m (67)
21m (67)
29,000 (61)
1
Single Parent Household 20 (bench) 32 33 3
Number Grandparents living with own grandchildren under18 yrs and % responsible
6.2m (33.4)
122,482 (36.7)
1084 (54.2)
1
Population 25 years and over 197m 3.7m 48,681 1
% High school graduate or higher 84.6 87.5 85.2 1
% of 9th grade cohort graduating in 4 years 92 (bench) 80 85 3
% Dropout (age 25+ not graduated/in high school 15 12 0 15 1
% Bachelor’s degree or higher 27.5 35.2 15.2 1
% Civilian Veterans (civilian 18 yrs and over) 10.1 10.9 13.5 1
% Foreign Born 12.4 12.3 1.3 1
% Speak a Language Other than English at home 19.6 14.9 3.6 1
% Languages spoken other than English Spanish 62 Other 38
Spanish 39 Other 61
Spanish 44 Other 55
1
% Population 16 and over Illiterate 11.2 11.3 3
% Population not proficient in English 6 1 3
Economic Characteristics % In Labor Force (16 yrs and over) 65 69.4 54.5 1
Unemployment (16 yrs and over seeking work) 6.6(Labor April 11)
8.5 8.9
3
Median household income (2009 inflation adj S) 51,425 69,475 36,810 1
%Families below poverty level 9.9 5.5 9.5 1
% Individuals below poverty level 13.5 8.2 14.2 1
% Children enrolled in public schools eligible for free lunch
19.4m (USDA)
33 36 3,5
% Children below poverty level 11 (bench) 10 19 3
Employment % Leading Industries 22
ED,Health, SocA. 12 Retail
22 ED,Health, SocA. 14 Prof,Sci
25 ED,Health, SocA. 12 Retail
1
% Private wage and salary worker 79 73 75 1
% Government worker 15 22 20 1
% Self employed 7 5 5 1
Travel to Work Mean travel time to work in minutes 25.2 31.1 21.4 1
% Drive alone 76 73 81 1
% Carpool 11 11 10 1
% Public Transportation 5 9 1 1
% Other 5 4 6 1
% Work at Home 4 4 2 1
Other income sources % Households receiving retirement income other than social security
17 20 25 1
% Households receiving Social Security 27 24 38 1

18
Housing Characteristics % Owner Occupied Housing Units 66.9 69.6 70.5 1
% Renter Occupied Housing Units 33.1 30.4 29.5 1
% Vacant Housing Units 11.8 9.5 12.7 1
% Single Unit Structures 67 73 76 1
% Multi Unit Structures 26 25 20 1
% Mobile Home 7 2 4 1
% Built since 1990 26 24 11 1
% Houses without Telephones 4 3.2 5 1
Houses without access to Vehicles 9 9.1 11 1
% Total occupants paying high housing costs (<30% income)/renters only
30/50 37/49 27/43 3/1
% Houses lacking complete plumbing facilities 0.5 0.3 0.3 1
% Houses without complete kitchen facilities 0.7 0.4 0.9 1
Demographic Estimates Total Population 72,598 1
% Male 49.3 48.4 50.3 1
% Female 50.7 51.6 49.7 1
Median Age 36.5 37.3 40.5 1
% Under 5 years 6.9 6.7 4.6 1
% 18 years and over 75.4 75.8 81.3 1
% 65 years and over 12.6 11.8 18.1 1
% White 74.5 60.9 91.4 1
% Black or African American 12.4 28.8 6.2 1
% American Indian & Alaska Native 0.8 0.3 0.2 1
% Asian 4.4 4.9 0.6 1
% Pacific Islander 0.1 0.1 0 1
% Other 5.6 3 0.5 1
% Two or more races 2.2 2 1.1 1
% Hispanic or Latino (of any race) 15.1 6.6 1.1 1
Population Density (people per sq. mile) 44 170 2
% Population living in rural area 14 26 3
Gini coefficient household income inequality 2005-07
43.8 0 43.4 36
m = million bench = U.S. benchmark
B. Health Needs and Disease Status
Measure US MD Target Allegany
MD
Source #
Average Life Expectancy median 76.5 77.9(CDC 07)
76.3 (77.4) 9
Deaths per 100,000 population all causes median 1136.9 768.4 (VS07-09)
890.8 853.6
2
% Poor or Fair Reported Health Status Adults –Age Adjusted
17.1 13 20 3
Poor physical health days-Avg # reported past 30 days age adjusted
2.6(bench) 3.2 4.5 3
Poor mental health days -Avg # reported past 30 days age adjusted
2.3(bench) 3.3 4.2 3
Adults report BMI>30 % 25(bench) 27 29 3
% Adults 20 years and over diagnosed with diabetes age adjusted
8.3 8.6 9-‘09
8.5 12.3 21

19
% Adults with high blood pressure 28.7 30 26.9 32.9 2
% Tooth loss-all permanent teeth 12.4 10
Birth Measures % Low Birth Wt (<2500 g) 8.2 9.2 7.8 7.2 5
% Very Low Birth Wt (<1500 g) 1.5 1.8 1.4 1.9 2
% Premature Births (<37 weeks) 12.7 12.1 2,22
Teen Birth Rate per 1000 22 (bench) 34 35 5
% Births to Women age 40-54 2.7 1.7 2
% Births to Unmarried Women 36.9 42.7 2
% No Care in First Trimester 16.1 19.8 <12 19 5
# Prenatal Risks Asst. Received for Medicaid eligible pregnant women
15938 414 26
-% Using illicit drugs within past 6 months 5.7 0 (HP) 8.7 26
-% Current or history of Mental health issues 8.9 18.1 26
-% Tobacco use during pregnancy 19.7 <9 41.3 26
Infant Mortality (deaths per 1000 live births) Infant Mortality 6.9 7.2 6 8.4 5,9
White/ Non Hispanic Infant Mortality 5.8 9 2
Black/Non Hispanic Infant Mortality 13.6 Nrf=<500 births + 5 events
2
Hispanic Infant Mortality 5.6 Nrf 2
Neonatal Infant Mortality-<28 days 4.5 4.1 (HP) 6 2
Post Neonatal Infant Mortality 2.3 2 (HP) 3.4 2
Mortality (premature death years of potential life lost before age 75, per 100,000population age adjusted)
5564 7535 8073 3
Death Measures (age adjusted per 100,000) Heart Disease 126.0 201.3
196.8 169
258.9 256.8
9
Cancer 178.4 182.6 179.3
160.6 186.8 190.2
9
Stroke 42.2 41.3 40 33.8 (HP)
52.7 50.3
9
Chronic Respiratory Disease 40.8 34.9 35.6
35.1 52.4 46.2
9
Accidents 25.8 25.3
29.4 35.5
9
Diabetes 22.4 21.8
<20 deaths 9
Flu & Pneumonia 18.7 17.8
<20 deaths 9
Septicemia 17.3 17.4
20.3 20.7
9
Alzheimers 17.1 16.9
<20 deaths 17
9
Nephritis 13.5 <20 deaths 9
Substance Abuse 12.6 11.3 (HP) 16.5 23
Suicide 10.9 9.3 8.4 (SHIP) 12.4 2
Motor Vehicle Crash Deaths per 100,000 population
12 (bench) 13 12.4 (HP)
15 3
Injuries (MD 63)not age adjusted 69 24
Unintentional Injury Mortality (No MVA) per 100,000 pop. Age adj. 1996-2005
40 36 12.70 36
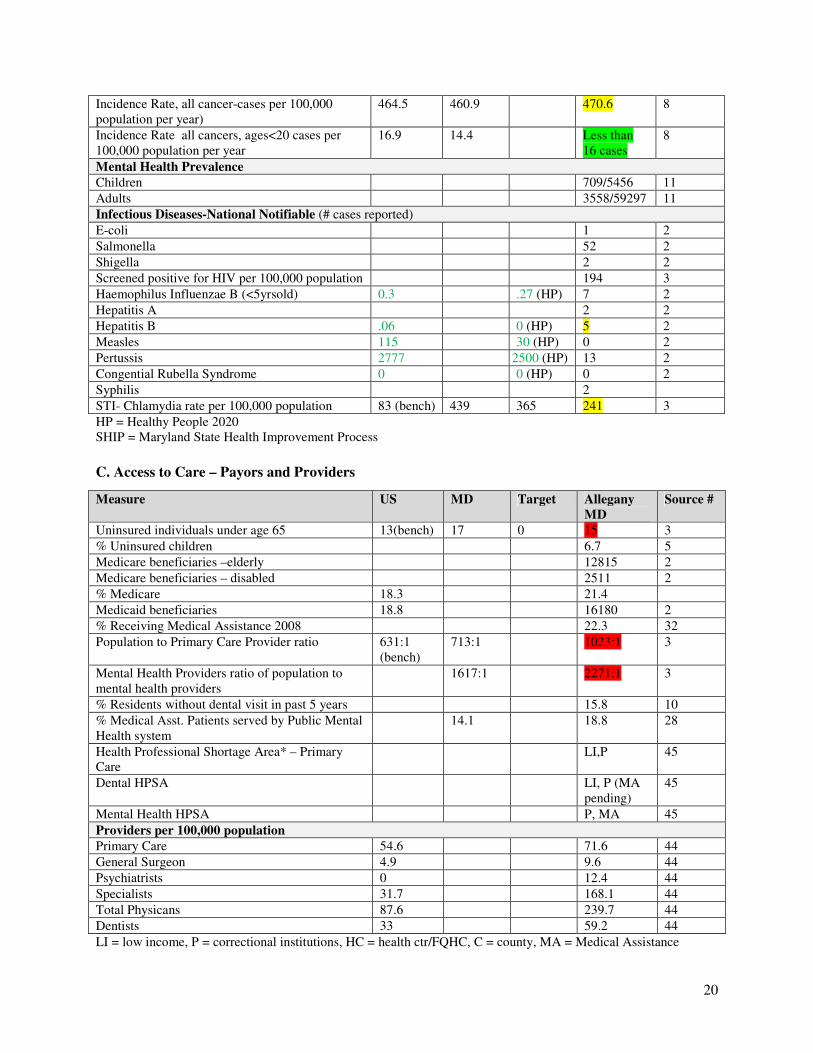
Cancer Rates
20
Incidence Rate, all cancer-cases per 100,000 population per year)
464.5 460.9 470.6 8
Incidence Rate all cancers, ages<20 cases per 100,000 population per year
16.9 14.4 Less than 16 cases
8
Mental Health Prevalence Children 709/5456 11
Adults 3558/59297 11
Infectious Diseases-National Notifiable (# cases reported)
E-coli 1 2
Salmonella 52 2
Shigella 2 2
Screened positive for HIV per 100,000 population 194 3
Haemophilus Influenzae B (<5yrsold) 0.3 .27 (HP) 7 2
Hepatitis A 2 2
Hepatitis B .06 0 (HP) 5 2
Measles 115 30 (HP) 0 2
Pertussis 2777 2500 (HP) 13 2
Congential Rubella Syndrome 0 0 (HP) 0 2
Syphilis 2
STI- Chlamydia rate per 100,000 population 83 (bench) 439 365 241 3
HP = Healthy People 2020 SHIP = Maryland State Health Improvement Process
C. Access to Care – Payors and Providers
Measure US MD Target Allegany
MD
Source #
Uninsured individuals under age 65 13(bench) 17 0 15 3
% Uninsured children 6.7 5
Medicare beneficiaries –elderly 12815 2
Medicare beneficiaries – disabled 2511 2
% Medicare 18.3 21.4
Medicaid beneficiaries 18.8 16180 2
% Receiving Medical Assistance 2008 22.3 32
Population to Primary Care Provider ratio 631:1 (bench)
713:1 1023:1 3
Mental Health Providers ratio of population to mental health providers
1617:1 2271:1 3
% Residents without dental visit in past 5 years 15.8 10
% Medical Asst. Patients served by Public Mental Health system
14.1 18.8 28
Health Professional Shortage Area* – Primary Care
LI,P 45
Dental HPSA LI, P (MA pending)
45
Mental Health HPSA P, MA 45
Providers per 100,000 population Primary Care 54.6 71.6 44
General Surgeon 4.9 9.6 44
Psychiatrists 0 12.4 44
Specialists 31.7 168.1 44
Total Physicans 87.6 239.7 44
Dentists 33 59.2 44
LI = low income, P = correctional institutions, HC = health ctr/FQHC, C = county, MA = Medical Assistance

21
D. Lifestyle Choices and Environment
Measure US MD Target Allegany
MD
Source #
Health Behaviors % Adults report smoking (100 +cigarettes) 15(bench) 18 12 (HP) 26 3
Excessive Drinking (Binge & Heavy) 8 (bench) 15 16 3
% Adults report Binge Drinking past 30 days 13 15 3
% Adults aged 20 and over reporting no leisure time physical activity
49 24 30 3
Socio-economic factors % Adults without Social/emotional Support 14(bench) 21 12 20 3
Violent Crime Rate per 100,000 population 100(bench) 649 360 3
Juvenile Arrest Relative Index rate 3.8 5
Juvenile Drug Arrest # (%-Marijuana) 68 (73.5) 25
Adult Drug Arrest # (%-Marijuana) 610(63.4) 25
Physical Environment Air Pollution- annual number of unhealthy air quality days due to fine particulate matter or ozone
4/16 0/0 3
Access to healthy foods 92 (bench) 62 46 3
% Adults report eating fewer than 5 fruits & vegetables per day 2007
76.6 73.4 76.3 36
Access to recreational facilities rate facilities per 100,000 population
17 (bench) 12 19 3
Liquor store density –number per 100,000 population
20 18 3
Toxic chemicals released annually pounds 2466905 2
New Wells: Number Fecal Contamination 65:0 20
Number people treated with post exposure prophylaxis Rabies
67 20
Food Bourne Disease –Number Outbreaks 1 20
Water Bourne Disease –Number Outbreaks 7 2 0 20
% Children 0-72 months tested Blood Lead Level 0.9 (HP) 27.4 20
% Children with Elevated Blood Level 1.1 20
Alcohol Related crashes % of total (fatal) 13.1 (0) 25
Domestic Violence 2009 #offenses (deaths) 306 (0) 35
Well Being Index (Rank of 436 Congressional districts)
Overall Rank 99 33
Life Evaluation 132 33
Emotional Health 264 33
Physical Health 206 33
Healthy Behavior 200 33
Work Environment 42 33
Basic Access 93 33
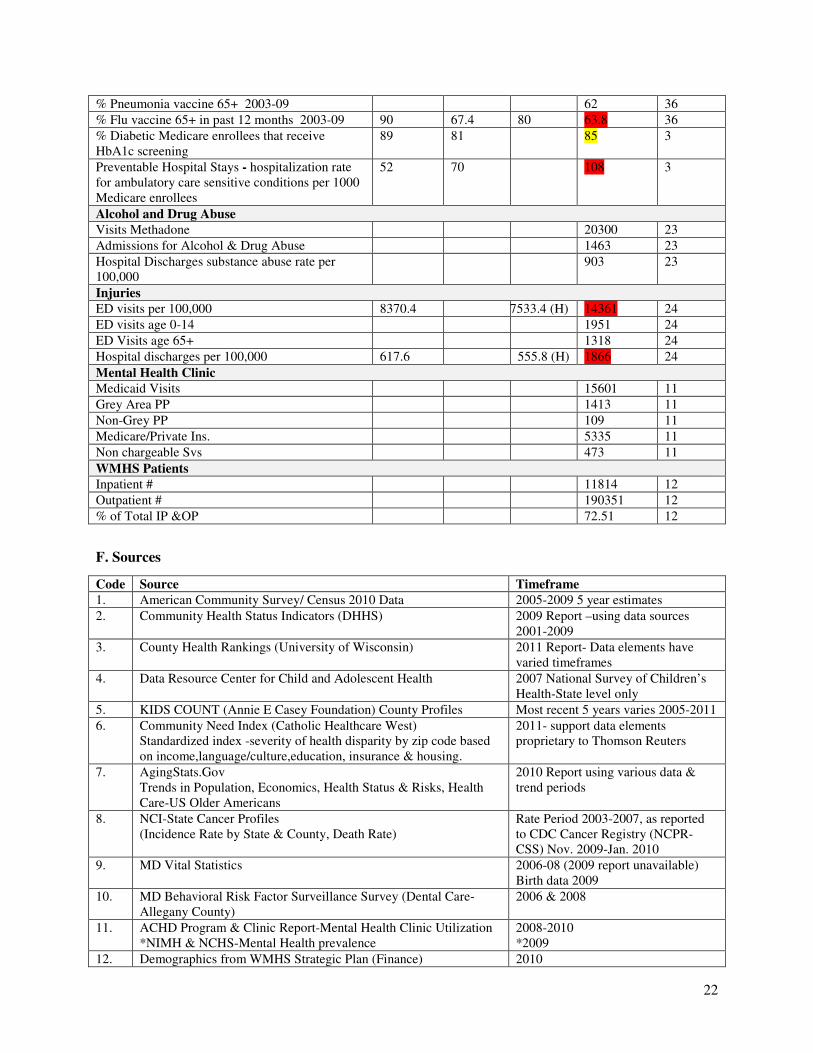
E. Continuum of Care and Utilization
Measure US MD Target Allegany
MD
Source #
Adult Preventive Services % Pap Smears age 18 and over 84.5 93 (HP) 81.6 2
% Female Medicare enrollees receive Mammogram screening
74 64 74 3
Sigmoidoscopy 50+ 42.3 44.6 2
22
% Pneumonia vaccine 65+ 2003-09 62 36
% Flu vaccine 65+ in past 12 months 2003-09 90 67.4 80 63.8 36
% Diabetic Medicare enrollees that receive HbA1c screening
89 81 85 3
Preventable Hospital Stays - hospitalization rate for ambulatory care sensitive conditions per 1000 Medicare enrollees
52 70 108 3
Alcohol and Drug Abuse Visits Methadone 20300 23
Admissions for Alcohol & Drug Abuse 1463 23
Hospital Discharges substance abuse rate per 100,000
903 23
Injuries ED visits per 100,000 8370.4 7533.4 (H) 14361 24
ED visits age 0-14 1951 24
ED Visits age 65+ 1318 24
Hospital discharges per 100,000 617.6 555.8 (H) 1866 24
Mental Health Clinic Medicaid Visits 15601 11
Grey Area PP 1413 11
Non-Grey PP 109 11
Medicare/Private Ins. 5335 11
Non chargeable Svs 473 11
WMHS Patients Inpatient # 11814 12
Outpatient # 190351 12
% of Total IP &OP 72.51 12
F. Sources
Code Source Timeframe
1. American Community Survey/ Census 2010 Data 2005-2009 5 year estimates
2. Community Health Status Indicators (DHHS) 2009 Report –using data sources 2001-2009
3. County Health Rankings (University of Wisconsin) 2011 Report- Data elements have varied timeframes
4. Data Resource Center for Child and Adolescent Health 2007 National Survey of Children’s Health-State level only
5. KIDS COUNT (Annie E Casey Foundation) County Profiles Most recent 5 years varies 2005-2011
6. Community Need Index (Catholic Healthcare West) Standardized index -severity of health disparity by zip code based on income,language/culture,education, insurance & housing.
2011- support data elements proprietary to Thomson Reuters
7. AgingStats.Gov Trends in Population, Economics, Health Status & Risks, Health Care-US Older Americans
2010 Report using various data & trend periods
8. NCI-State Cancer Profiles (Incidence Rate by State & County, Death Rate)
Rate Period 2003-2007, as reported to CDC Cancer Registry (NCPR-CSS) Nov. 2009-Jan. 2010
9. MD Vital Statistics 2006-08 (2009 report unavailable) Birth data 2009
10. MD Behavioral Risk Factor Surveillance Survey (Dental Care-Allegany County)
2006 & 2008
11. ACHD Program & Clinic Report-Mental Health Clinic Utilization *NIMH & NCHS-Mental Health prevalence
2008-2010 *2009
12. Demographics from WMHS Strategic Plan (Finance) 2010

23
13. Physician Needs Assessment-WMHS Foundation 2011
14. On Call Coverage Utilization 2010 anecdotal
15. Most Prevalent Diagnoses in ED (WMHS IT) CY2010
16. Payor Mix (Payor Mix for WMHS and ED only-by Ins Group IP,OP & combined and the same by just payor mix)
CY2010
17. Workforce Development Network Baseline Assessment (Western Maryland AHEC)
2011
18. Patient Satisfaction (HCAHPS, OP Survey, HomeCare CAHPS, Patient Satisfaction Team Plan)
FY10 (July 1, 2009-June 30, 2010)
19. Patient Feedback (Dept Comparison Report, Volume Complaint Type)
CY2010 (Jan-Dec)
20. ACHC Environmental Health Report-Rabies, New Wells MDE-Lead Poisoning Annual Report, DHMH Water & Food Bourne Illnesses
CY2007-10 Allegany County CY2006,2008, 2009 CY2008-10
21. CDC-County/State Data & Trends Diabetes Diagnosed, Physical Inactivity, Obesity
2008
22. Diversitydata.org US Census Bureau 2000 & 2010, MSA-Cumberland, MD
23. ACHD Clinic Records and Report- Alcohol & Substance Abuse (utilization, ED visits, arrests, etc)
2008-10 Allegany County 2001-05 Need for Substance Abuse Treatment-Maryland Final Report
24. DHMH Injuries (ED visits, discharges & death rates) 2005-08 Allegany County
25. CESAR-Uniform Crime Report MSP (drug arrests and alcohol related crashes)
2001-05 (2009 crashes) Allegany County
26. ACHD Perinatal Substance Abuse Intervention Program DHMH Division of Outreach & Care Admin. MD Prenatal Risk Asst.
FY10 and FY11 Mid-Year Reports FY08-10 Allegany County
27. DHMH Tobacco Use Prevention & Cessation Program-prevalence 2000, 2002, 2006, 2008
28. ACHD Mental Health Systems Office FY12-14 Plan FY08-10 Allegany County
29. Allegany County Transit –Fares, Routes, Benefits 2010
30. Local Findings-Community Strategies & Measurements to Prevent Obesity in US (various data sources)
Report 2010
31. Cumberland CDBG Consolidated Plan (2005-09) 2005
32. WMHS Community Benefit Report -Narrative FY 10
33. Gallup- Healthways Well Being Index Congressional Districts CY 2010
34. WMHS Inpatient Admissions (# patients, costs, % , by code groups)
FY10 & 11 thru 4-15
35. Maryland Network Against Domestic Violence Crime Report FY10 MD only
36. Health Indicator Warehouse via HealthyPeople.gov Dates vary with source
37. Inpatient Characteristics & Payor FY10 & Fy11 YTD
38. Nursing Vacancy Rate-Board Dashboard Human Resources FY10
39. Outmigration of Patients by Service Line CY2008
40. National Plan to Improve Health Literacy 2011 Report
41. Birth Data WMHS CY10
42. PharmaCare Network Top Rx and Payers CY10
43. Burden of Chronic Disease (MD Vital Statistics & BRFSS) 2009 Allegany County
44. HRSA Area Resource File (Provider data from AMA 2007) 2008
45. HRSA Shortage Designation 2011
46. ED use for Dental Reasons (WMHS) FY10
47. Transportation Survey (ACHD, WMHS-ED & TSCHC) July 2011


