
Allan Block Seismic Testing - Bowers Brothers
28
Transcript of Allan Block Seismic Testing - Bowers Brothers


Columbia University was founded in 1754as King’s College by royal charter of KingGeorge II of England. It is the oldest insti-tution of higher learning in the state ofNew York and the fifth oldest in theUnited States.
Since the first class in J uly of 1754 untiltoday, the college has emerged as a pre-eminent national center for educationalinnovation and scholarly achievement.
Thanks to concerted efforts to place theUniversity on the strongest possible foun-dations, Columbia is approaching the twenty-first century with a firm sense of the importance of what hasbeen accomplished in the past and confidence in what it can ac hieve in the years to come.
Seismic Testing For Allan Block and Huesker Geosynthetics
Table of Contents
Columbia University Pg. 1
Introduction Pg. 2
Executive Summary Pg. 3
Testing Summary/Results Pg. 7
Testing Photos Pg. 9
Allan Block Design Calculations Pg. 11
External Stability Pg. 14
Internal Stability Pg. 19
Summary of Calculations Pg. 23
Allan Block & Huesker Geosynthetics Pg. 25
Seismic Testing
1
Columbia University

Full Scale Seismic Testing:Setting new standards for SRW design and performance
Teamwork often produces e vents that indi viduals are not capable of on their o wn. So was the case when ColumbiaUniversity, Allan Block Corporation, Huesker Geosynthetics and the National Science Foundation teamed up to conductfull scale seismic testing on a group of geogrid reinforced soil structures faced with a segmental retaining wall block. Thefirst-ever-full scale testing took place in Tsukuba, Japan in cooperation with Dr.Yoshiyki Mohri at the National ResearchInstitute of Agriculture Engineering. Professor Hoe Ling from Columbia University and Professor Dov Leshchinsky fromthe University of Delaware, headed up the team as the Principle In vestigators of the ground breaking research.
Most research to this point had focused on the indi vidual components of the structure and performance in static condi-tions. Much of the research had indicated an overly conservative approach was used by over estimating loads and under-estimating the system performance of the geogrid reinforced SR W structures . Yet as is customary in the engineeringworld, change is not easily achieved. The intent of this study was to not only evaluate and substantiate system perform-ance with dynamic excitations, but illustrates the basic performance c haracteristics of these systems when used in staticenvironments.
The basic reinforcement configuration used on the test structures simulated typical designs found in structures for stat-ic loading conditions . Therefore it was expected that the first of the three test structure w ould experience some type ofcatastrophic failure. In fact the first structure performed so w ell under the initial excitations that the magnitude of theload was doubled and still performed extremely well.
An underlying question that has slowed the growth of these systems in man y highway applications has been the issue ofa positive mechanical connection betw een the geogrid and the SR W block facing. Many in the engineering communityhave theorized that without a mec hanical connection the system w as subject to premature failure in static and seismicloading conditions. It was therefore the intent of this stud y to validate the performance of a system that created a "roc k-lock" frictional connection between the SRW facing and the layers of geogrid reinforcement. Additionally, if an earthquakeevent that exceeded the magnitude of the K obe earthquake from 199 5 (7.2 on the Ric hter scale) could not damage thesecomposite structures, we could in fact validate performance for these structures in all en vironments.
This document contains an executi ve summary of this first round of seismic testing on SR W structures and one set ofhand calculations, completed by Allan Block, that were performed to predict the performance of the structures. For moreinformation contact the Allan Block Corporation.
Research Team:Professor Hoe Ling, Department of Civil Engineering, Columbia UniversityProfessor Dov Leshchinsky, Department of Civil Engineering, University of Delaware
Chief CollaboratorsDr.Yoshiyki Mohri, National Research Institute of Architecture Engineering, Japan Ministry ofAgriculture, Forestry and FisheriesMr. Kenichi Matsushima, National Research Institute of Architecture EngineeringDr. Mutsuo Takeuchi, National Research Institute of Architecture Engineering, Structural Division
Authors:Professor Hoe LingProfessor Dov LeshchinskyTim Bott, Allan Block Corporation
Introduction
2

Executive Summary for Seismic Testing performed by Professor Hoe Ling, Columbia University and
Professor Dov Leshchinsky, University of Delaware in 2002
Overview:
Reinforced soil structures faced with segmental retaining w alls have become a cost effective solution for retain-ing walls in residential, commercial and governmental land development. Over the past fifteen years the use ofthese types of systems has spurred a historical e volution in retaining w all design and construction. Change isseldom readil y embraced within the Ci vil Engineering community , but the merits of geogrid reinforced soilstructures captured the attention of the design and building community. Use of segmental blocks in conjunctionwith geogrid-reinforced soil has become a significant percentage of the different types of retaining walls.To date,most research has been compiled through numerical modeling, from instrumentation of walls and reduced scalelaboratory tests in static loading conditions . The intent of this venture is to evaluate the true performance char-acteristics under realistic earthquake loading to substantiate these systems for both seismic and static conditions.
Objectives:
• To analyze the internal and external performance c haracteristics of a full-scale geogrid reinforced soil masswith a concrete segmental wall facing when significant earthquake loads are applied to the structure.
• To determine the ramification of earthquake loading on current design standards and modify the design andreinforcement parameters to ensure a safe and cost effecti ve design solution.
• To evaluate observed behavior and loads when compared to design calculations .·• To evaluate the effectiveness of a block to geogrid connection based on rock-lock achieved through a hollow
core concrete unit.• To determine the performance characteristics of a structure with Fortrac geogrids in combination with Allan
Block retaining wall units.• To avoid possible scaling problems associated with reduced scale model tests, full-scale walls were construct-
ed using prototype blocks and geogrids.
Facilities and test setup:
Materials: A fine uniform sand with an angle of internal friction of 38° and an optimum unit w eight of 15 kN/m 3 was usedas the reinforced, retained and foundation soil.
Geogrids: Two types of F ortrac geogrids, manufactured by Huesker, were used in the stud y. Fortrac 35/20-20(PET, polyester) was used in all three tests , and in Test 3, the top layer of reinforcement was Fortrac 20 MP (PVA,polyvinyl alcohol) to illustrate the ability of the system to incorporate a rigid connection b y grout-filling the toptwo courses of block. PVA geogrid was utilized due to its strong resistance against an alkaline en vironment. Asthe names indicate the strength of these grids are 35 kN/m and 20 kN/m respecti vely.
Concrete segmental wall facing: Allan Block retaining wall blocks were used in all three tests. The units were 200mm high by 300 mm deep by 450 mm wide. The unique element of the Allan Bloc k wall product is hollow coredunits with a raised front shear key and the corresponding notch on the bottom front surface. The configuration ofthe block assemblies used for testing pro vided a 12° setback of the facing. The hollow core unit is 34 kg and pro-vides a configuration, which locks the geogrid into the w all assembly when the cores of the bloc k are filled withcompacted gravel.
Executive Summary
3

Input Motion:
The motion in the K obe earthquake was used since it represented a significant case history , magnitude of 7.2,which was well recorded and documented. Therefore the planned excitation w ould develop accelerations thatmet or exceeded the recorded results of the Kobe earthquake on January 17, 1995. The peak accelerations for dif-ferent components of Kobe earthquake are compiled in Table 1:
Table 1: Peak Accelerations for Different Components of Kobe Earthquake
Two horizontal excitations were applied for each of the three tests . In the first excitation, the peak was scaled to400 gal (0.4 g) and in the second, it was scaled to 800 gal (0.8 g). The second shaking w as applied an hour afterthe application of the first excitation w as completed. There were no modifications to the structure betw een thefirst and second shaking. Vertical excitations were applied to the third test, with the peak acceleration first scaledat 200 gal (0.2 g) and the second scaled at 400 gal (0.4 g), i.e., half the value of the peak horizontal accelerations .
Construction:
A three-sided steel box (2 m wide by 4 m deep by 3 m high) was built to provide a framework for the test on topof the shak e table. To prevent reflection w aves from the steel w all surfaces during shaking , EPS boards wereplaced at the front and back ends of the steel box. Side friction between the backfill and box was reduced usinga layer of grease, which was isolated from the sand with sheets of plastic .
Sand was placed in 200 mm lifts and compacted with a hand operated plate compactor. Water was mixed with thesand to ac hieve the desired density and compaction. Compaction results of 94% of standar d proctor w ereachieved during construction. Sand was placed directly to the back of the block with gravel only being placed intothe cores of the block. The hand operated plate compactor was also used to densify the gra vel in the cores of theblock by running the compactor o ver the top of the bloc ks. Thin seams of white sand w ere placed at differentheights to enable location of deformation and shear zones in the soil after completion of the test.Typical construc-tion time for each structure was five to seven days.
Reinforcement Layout and Instrumentation:
Each wall was constructed to a height of 2.8 m with a 20 cm foundation la yer of the same sand as the bac kfill.Detailed hand calculations were performed in advance of the testing using the Allan Block design methodology.Potential failure modes using these calculations indicated geogrid pullout from the soil at the top ele vation wasexpected. An allowable displacement of 51 mm was used in the analysis.
Reinforcement lengths for Tests 1 and 2 was L = 2.05 m throughout the height of the w all. This equates to 0.73H,where H is the wall height and is equal to 2.8 m. L was measured from the front end of the bloc k. In Test 3, thelength was reduced to 1.68 m (0.6H) for all but the top la yer, which was 2.52 m (0.9H). The first layer of geogridin each test was located on top of the first course of bloc k. Vertical spacing after the first layer of geogrid was 60cm, or every third course on Test 1 and 40 cm, every other course of bloc k on Tests 2 and 3. The modification ofreinforcement length and spacing was based on experience gained on eac h test and correlation of performancewith calculated values.
Directions Peak Accelerations
NS 0.59g
EW 0.63g
UD 0.34g
4
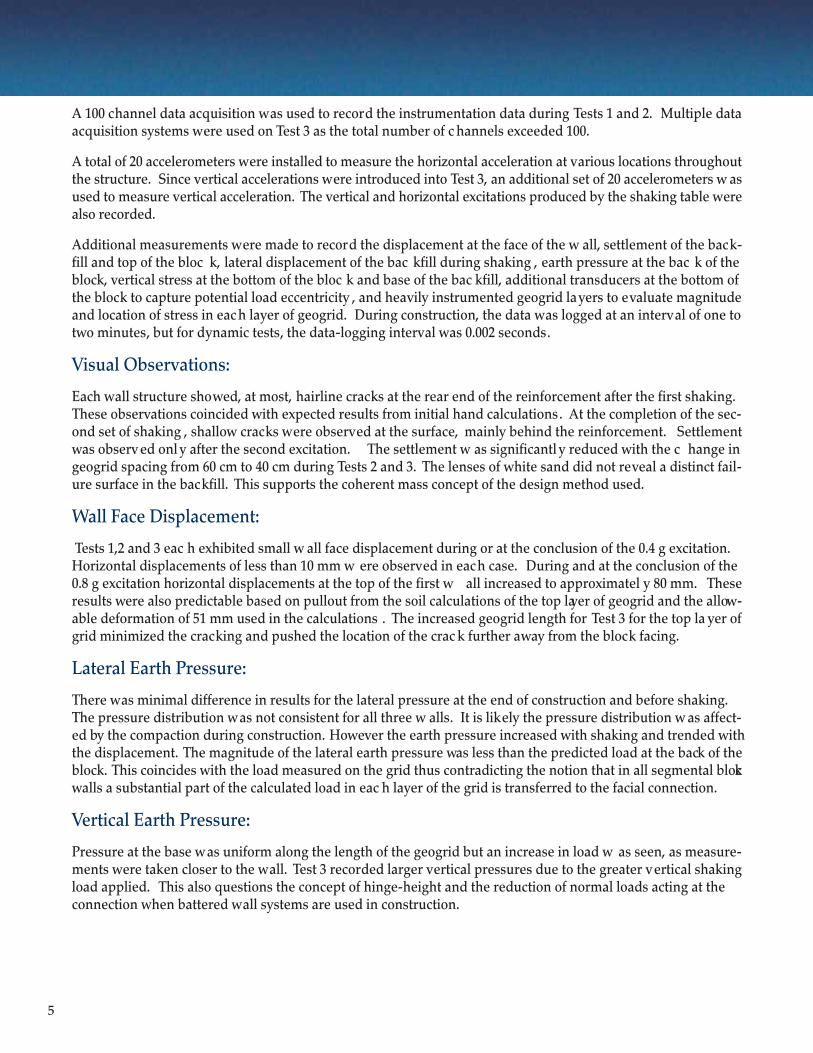
A 100 channel data acquisition was used to record the instrumentation data during Tests 1 and 2. Multiple dataacquisition systems were used on Test 3 as the total number of c hannels exceeded 100.
A total of 20 accelerometers were installed to measure the horizontal acceleration at various locations throughoutthe structure. Since vertical accelerations were introduced into Test 3, an additional set of 20 accelerometers w asused to measure vertical acceleration. The vertical and horizontal excitations produced by the shaking table werealso recorded.
Additional measurements were made to record the displacement at the face of the w all, settlement of the back-fill and top of the bloc k, lateral displacement of the bac kfill during shaking , earth pressure at the bac k of theblock, vertical stress at the bottom of the bloc k and base of the bac kfill, additional transducers at the bottom ofthe block to capture potential load eccentricity , and heavily instrumented geogrid layers to evaluate magnitudeand location of stress in each layer of geogrid. During construction, the data was logged at an interval of one totwo minutes, but for dynamic tests, the data-logging interval was 0.002 seconds.
Visual Observations:
Each wall structure showed, at most, hairline cracks at the rear end of the reinforcement after the first shaking.These observations coincided with expected results from initial hand calculations. At the completion of the sec-ond set of shaking , shallow cracks were observed at the surface, mainly behind the reinforcement. Settlementwas observ ed onl y after the second excitation. The settlement w as significantl y reduced with the c hange ingeogrid spacing from 60 cm to 40 cm during Tests 2 and 3. The lenses of white sand did not reveal a distinct fail-ure surface in the backfill. This supports the coherent mass concept of the design method used.
Wall Face Displacement:
Tests 1,2 and 3 eac h exhibited small w all face displacement during or at the conclusion of the 0.4 g excitation.Horizontal displacements of less than 10 mm w ere observed in each case. During and at the conclusion of the0.8 g excitation horizontal displacements at the top of the first w all increased to approximatel y 80 mm. Theseresults were also predictable based on pullout from the soil calculations of the top layer of geogrid and the allow-able deformation of 51 mm used in the calculations . The increased geogrid length for Test 3 for the top la yer ofgrid minimized the cracking and pushed the location of the crac k further away from the block facing.
Lateral Earth Pressure:
There was minimal difference in results for the lateral pressure at the end of construction and before shaking.The pressure distribution was not consistent for all three w alls. It is likely the pressure distribution w as affect-ed by the compaction during construction. However the earth pressure increased with shaking and trended withthe displacement. The magnitude of the lateral earth pressure was less than the predicted load at the back of theblock. This coincides with the load measured on the grid thus contradicting the notion that in all segmental blockwalls a substantial part of the calculated load in eac h layer of the grid is transferred to the facial connection.
Vertical Earth Pressure:
Pressure at the base was uniform along the length of the geogrid but an increase in load w as seen, as measure-ments were taken closer to the wall. Test 3 recorded larger vertical pressures due to the greater vertical shakingload applied. This also questions the concept of hinge-height and the reduction of normal loads acting at theconnection when battered wall systems are used in construction.
5

Backfill Surface Settlement:
Settlement after the first shaking (0.4 g) on all three structures was negligibly small. After the second shaking (0.8g), the settlement was largest behind the reinforced soil zone where surface crac ks developed. Test 1 exhibitedthe largest settlement behind the w all, which corresponds to the lo west pullout resistance in the soil of the toplayer of grid and increased spacing between grid layers. Settlement in Test 2 was reduced from 80 mm after Test1 to less than 20 mm with the geogrid spacing reduced from 600 mm to 400 mm. The settlement was reduced toapproximately 10 mm in Test 3 with a reduction in basic grid length from 0.73H to 0.6H but increase in the toplayer of grid to 0.9H. The top layer of geogrid was attached to the block facing with a standard flow-able grout toillustrate the ability of the system to incorporate a rigid connection at the top of the w all. Calculations for Test 3indicate an increase of rear-end pullout resistance due to longer embedment length of the geogrid in a soil zonewhere overburden pressure is lo w. This supports the reduction in displacement at the face and correspondingreduction in settlement.
Tensile Load in Geogrid:
The results showed that the largest strain de veloped at different locations for eac h layer of geogrid. The resultsalso indicated that the largest loads w ere not at the connection between the geogrids and the blocks. The largesttensile load recorded in the second shaking w as typically less than 5 kN/m or less than 14% of the ultimate loadof the reinforcement. During the introduction of a vertical acceleration in Test 3, an increase in loading at the facewas recorded, but the recorded values were always less than the projected values from the hand calculations. Thissupports the position that the anticipated loads at the face of the w all are substantiall y less than the calculatedmaximum tensile loads on the reinforcement. Contrary to calculated loading for geogrids during seismic e ventsat the top of the reinforced mass , loads did not increase during the horizontal and v ertical excitations.
Accelerations:
The accelerations in the w all indicated that the amplification w as small, less than 1.5. The blocks and bac kfillwere exhibiting similar results in amplification. In Test 3, with a longer top geogrid la yer; the phase of amplifi-cation was changed such that its magnitude became smaller.
The values of accelerations obtained at the base of shaking table are summarized in the Table 2. The amplifica-tion factor is given for the ratio of maximum acceleration in the bac kfill to the base acceleration. The maximumacceleration is typically recorded at the top of the w all.
Table 2. Acceleration Measured at Shaking Table and Acceleration Amplification
Test 1 Test 2 Test 3 Test 3 (vertical)
First Shaking 389.9 397.5 406.6 229.9
Second Shaking 858.2 854.8 815.5 395.0
Amplification 1.34 1.16 1.33 --
Unit: gal (1 gal=981cm/s2)
6

2.8 m
2.8 m
0 m
5-A 35/20-20 Geogrid
4-A 35/20-20 Geogrid
3-A 35/20-20 Geogrid
2-A 35/20-20 Geogrid
1-A 35/20-20 Geogrid
2.52 m
6-A 35/20-20 Geogrid
7-A 20 MP Geogrid
1.68 m
Grid Layer 7-A to have a grouted connection, utilize PVA grid and
have a total length of 2.52 m. Note: All grid lengths are measured
from the back of the lip of the block.
2.8 m
2.8 m
0 m
5-A 35/20-20 Geogrid
4-A 35/20-20 Geogrid
3-A 35/20-20 Geogrid
2-A 35/20-20 Geogrid
1-A 35/20-20 Geogrid
2.05 m
6-A 35/20-20 Geogrid
7-A 35/20-20 Geogrid
2.8 m
2.8 m
0 m
5-A 35/20-20 Geogrid
4-A 35/20-20 Geogrid
3-A 35/20-20 Geogrid
2-A 35/20-20 Geogrid
1-A 35/20-20 Geogrid
2.05 m
7
Testing Summary
Test Structures and Objectives for each Round of Testing
Structure One:
The first round of testing w as conducted on a typicalconfiguration of a reinforced soil mass . The base blockwas placed on 200 mm of sand.The first layer of grid wasplaced on the first course of bloc k and every 600 mm asthe wall was constructed. The lengths of the reinforce-ment were set at 0.73 times the total height of the w all(2.05 m). Sand was used for reinforced and retainedsoil zones . Sand w as placed to the bac kside of theblock facing and the cores of the bloc ks w ere filledwith a well-graded gravel.
Structure Two:
The second structure w as configured to minimize thesettlement that w as experienced during the seismicexcitation on the first structure. The onl y c hangeimplemented in the second structure w as to c hangethe spacing betw een la yers of geogrid. The secondstructure was constructed with geogrid every 400 mm.By decreasing the spacing there w as an expectationthat the structure would behave as a more comherentmass and the amount of settlement would be reduced.
Structure Three:
The third structure took into account what had beenobserved in the testing of the first tw o structures. Thelength of the geogrid w as shortened to an o veralllength of 0.6 times the total height of the wall (1.68 m).The top layer of grid was lengthened and grouted intothe top tw o rows of bloc ks. The top la yer of geogridwas changed to a Fortrac 20 MP to eliminate potentialdamage to the grouted section based on ele vated PHof the grouted connection. Additionally the top la yerwas lengthened to 0.9 times the total height of the wall(2.52 m). The main geogrid lengths w ere decreasedfrom the previous two structures based on the excep-tional performance during the first two rounds of test-ing. The top geogrid la yer was lengthened to transi-tion between the reinforced soil mass and the retainedsoil mass. The top layer was grouted to the Allan Blockunits to illustrate ho w an additional permanent con-nection element at the top of the w all, could be incor-porated into the design.
Structure One:
Structure Two:
Structure Three:

8
Testing Results
Summary of Test on the Individual Structures
Structure One:
Each structure was subjected to two independent excitations. The first excitation on Structure One w as a horizontal excita-tion of 0.4g. The observed state of the structure w as identical to the as built condition. Residual displacement of the face ofthe w all measured less than 8mm. Settlement of the reinforced mass measured less than 1mm. Recorded forces in thegeogrid layers were at as built levels.
One hour after the original excitation the structure w as exposed to a horizontal excitation of 0.8g. The observed state of the s truc-ture showed little change from the as built condition. Horizontal displacement was less than 70mm, settlement was largest at theback of the block and was recorded to be less than 90mm. Increase in the load on the grid was minimal and there was no evidenceof an internal failure plane. During the excitation it was observed that the reinforced soil mass and the facing were moving in phase.
Structure Two:
The first excitation on Structure Two was a horizontal excitation of 0.4g. The observed state of the structure w as identical to the asbuilt condition. Residual displacement of the face of the wall measured less than 5mm.Settlement of the reinforced mass measuredless than 1mm. Recorded forces in the geogrid layers were at as built levels.
One hour after the original excitation the structure w as exposed to a horizontal excitation of 0.8g. The observed state of the s truc-ture showed little change from the as built condition. Horizontal displacement was less than 60mm, settlement was largest at theback of the reinforced mass and was recorded to be less than 30mm. Increase in the load on the grid was minimal and there was noevidence of an internal failure plane. The reduced spacing between grid layers provided a positive benefit creating a structure thatperformed as a coherent mass. Significant cracking in the retained soil were observed when compared to the reinforced soil zone.
Structure Three:
The first excitation on Structure Three was a horizontal excitation of 0.4g and a vertical excitation of 0.2g. The observed state of thestructure was identical to the as built condition. Residual displacement of the face of the wall measured less than 5mm.Settlementof the reinforced mass measured less than 1mm. Recorded forces in the geogrid layers were at as built levels.
One hour after the original excitation the structure w as exposed to a horizontal excitation of 0.8g and a v ertical excitation of 0.4g.The observed state of the structure showed no change from the as built condition. Horizontal displacement was less than 50mm,settlement was largest at the back of the top layer of reinforcement and was recorded to be less than 40mm. Increase in the loadon the grid was minimal and there was no evidence of an internal failure plane. The increased grid length at the top of the stru c-ture pushed the soil cracking back away from the reinforced zone when compared to the first two structures. Even during a com-bined horizontal and vertical excitation significant loads were not observed at the block to grid connection.
Conclusions:The results of this stud y illustrated that the modular bloc k wall system utilizing Allan Bloc k retaining w all units and Huesk ergeogrid reinforcements performed well under simulated Kobe Earthquake conditions. The deformation and acceleration amplifi-cation were negligibly small when subjected to K obe Earthquake records, showing the reinforced structure absorbs energ y froma seismic event. The vertical spacing of 2 blocks (40 cm) and reinforcement lengths of 0.6H with a longer top geogrid la yer (0.9H)are adequate to resist a major earthquake provided a good quality backfill is used. Additionally this configuration illustrated thatthe system performed as a coherent structure with the indi vidual elements in the system remaining in phase during the horizon-tal and vertical excitations. The hand calculations performed according to the Allan Block Design Methodology provided conser-vative values based on the observed values on the structures.
It is noted that the reported good measured performance is limited to the tested particular bloc k system and geogrids. The inter-locking lip configuration of the Allan Block minimizes differential horizontal movement of the units during earthquake excitationand therefore ensures the integrity of the system. Hence, the results as reported should not be extrapolated to other wall systems,which have different blocks and geogrid reinforcement.

9
NRIAE Shaking Table Facility,Tsukuba, Japan
Research Team (Left to Right)Y. Okabe, Y. Mohri, H.I. Ling, T. Kawabata, D. Leshchinsky, D.Lee, O. Leshchinsky, H. Liu, C. Burke, K. Matsushima
Load Transducers for Measuring Vertical Earth Pressure LVDT and Markers on the Backfill Surface
Earth Pressure Transducer Behind the Block and Strain Gages onthe Geogrid
A Layer of White Sand Seam Used to Identify Post-Test ShearLocation
Testing Photos

10
Hair Crack Behind Reinforced Zone after First Shaking LoadApplication
Completed Structure on Shake Table Steel Container for Wall Construction
Surface Cracks at the Retained Soil
General Appearance of Test Wall after Second Shaking LoadApplication
Images of the Seismic Tests using Allan Block and Huesker Geosynthetics

IInnppuutt IInnffoorrmmaattiioonn
Wall Number: Test 3 with 0.8g horizontal acceleration
Cross Section: Fortrac 35/20-20 Geogrid @ 0.6H and 20MP Geogrid @ 0.9H
UUnniitt DDeeffiinniittiioonn
kN: = 1000 N
kPa: = 1000 Pa
SSuurrcchhaarrggee PPaarraammeetteerrss
Surcharge: q = 0 kPa
Surcharge Type: xq = 3
SSooiill PPaarraammeetteerrss
Infill Soil: Retained Soil Foundation Soil
Friction Angle: �i = 38° Friction Angle: �i = 38° Friction Angle: �f = 38°
Unit Weight: �i = 19 kN/m3
Unit Weight: �i = 19 kN/m3
Cohesion: cf = 0 kPa
Unit Weight: �f = 19 kN/m3
DDeessiiggnn CCaallccuullaattiioonnss ffoorr SSttaattiicc aanndd SSeeiissmmiicc LLooaaddiinngg
uussiinngg AAllllaann BBlloocckk DDeessiiggnn MMeetthhooddoollooggyy
AAllllaann BBlloocckk PPaarraammeetteerrss WWaallll PPaarraammeetteerrss FFoooottiinngg DDiimmeennssiioonnss
Block Height: h = 200 mm Number of Block Courses: N = 14 Footing Width: Lwidth = 1.22 m
Block Depth: t = 296 mm Total Wall Height: H = nh = 2.8 m Footing Depth: Ldepth = 0.3 m
Block Length: l = 448 mm Embedment Depth in Courses: e = 0 Toe Extension: Ltoe = 0.3 m
Unit Percentage Concrete: c = 60% Total Embedment Depth: D = e(h) = 0 m
Unit Percent Voids: v = 40% Geogrid Length: L = 1.68 m
Block Setback v = 12°
Surcharge Types:
1 = Retained soil dead load
2 = Retained soil live load
3 = Infill soil dead load
4 = Infill soil live load
BBaacckk SSllooppee PPaarraammeetteerrss
Back Slope angle: i = 0°
Back Slope height: hi = 15 m
SSeeiissmmiicc PPaarraammeetteerrss
Acceleration Coefficient: Ao = 0.8
Allowable Lateral Deflection:
Internal: di = 50.8 mm
External: dr = 50.8 mm
PPooiinntt LLooaadd PPaarraammeetteerrss
Point Load: P = 0 kN
Contact area boundaries from toe of wall:
Starting Point: x1 = 0 m
Ending Point: x2 = 0 m
PPrroojjeecctt NNaammee:: Seismic Testing
Columbia University
PPrroojjeecctt NNuummbbeerr:: 1006.02
DDaattee:: 10/09/02
PPrreeppaarreedd BByy:: FMBott, TABott
11
Design Calculations Performed by Allan Block

12
GGeeooggrriidd PPaarraammeetteerrss
Number of geogrid layers: g = 7 layers
Geogrid Type A: A = Fortrac 35/20-20
Geogrid Type B: B = Fortrac 20 MP
Long-term Allowable Design Strength
Geogrid Type A: LTDS_A = 19.3 kN/m
Geogrid Type B: LTDS_B = 13.6 kN/m
Reduction Factor for Long-term Creep
Geogrid Type A: RFcr_A = 1.67
Geogrid Type B: RFcr_B = 1.67
Factor of Safety Geogrid Overstress: FSos = 1.5
Geogrid Interaction Coefficient: Ci = 0.75
CCoonnnneeccttiioonn SSttrreennggtthh PPaarraammeetteerrss
Peak Connection Capacity, in the form of linear equation, y = Mx + B
Where y = Connection Strength
and x = Normal Load
Geogrid Type A
Segment #1: y intercept: B1a = 19.16 kN/m Slope M1a = 0.14
Segment #2: y intercept: B2a = 19.16 kN/m Slope M2a = 0.14
Intersecting Normal Load
Ninta = B2a - B1a Ninta = 0 kN/m
M1a - M2a
Geogrid Type B
Segment #1: y intercept: B1b = 10.59 kN/m Slope M1b = 0.0524
Segment #2: y intercept: B2b = 10.59 kN/m Slope M2b = 0.0524
Intersecting Normal Load
Nintb = B2b - B1b Nintb = 0 kN/m
M1b - M2b
BBrrookkeenn BBaacckk SSllooppee DDeetteerrmmiinnaattiioonn
Broken Back Slope Calculations, i’, only if the horizontal length of the slope is less than twice the wall height.
Determine the true back slope angle:
i’ = atan i’ = 69.528° i = if (i’ > i,i,i’) Therefore: i = o°
GGeeooggrriiddCCoouurrssiinngg
GGeeooggrriidd TTyyppee GGeeooggrriiddLLeennggtthh
gridj = typej = lengthj =
13 B 2.5 m
11 A L
9 A L
7 A L
5 A L
3 A L
1 A L
GGeeooggrriidd LLaayyoouutt PPaarraammeetteerrss
Range of Geogrid Layers: J = g
hi
2(H)( )

CCaallccuullaattiioonn ooff SSttaattiicc aanndd DDyynnaammiicc EEaarrtthh PPrreessssuurree CCooeeffffiicciieennttss
Weighted Friction Angle: �wi = 0.67(�i) = 25.333° �wr = 0.67(�r) = 25.333°
Wall Batter: � = 90° - � � = 78°
Setback per Block: s = 0.0315m + tan(w) s = 0.053m
Effective Wall Height: He = H + [L - (t - s)] tan(i) He = 2.8m
SSttaattiicc
Active Earth Pressure Coefficient:
Infill Soil Retained Soil
Kai = Kar =
Kai = 0.143 Kai = 0.143
DDyymmaanniicc
Seismic Coefficients:
Kv = 0
Internal Stability External Stability
Khi1 = (1.45 - Ao)Ao For: di = 0 mm Khr1 = Ao For: dr = 0 mm
Khi2 = 0.67(Ao) For: di > = 25mm Khr2 = 0.67(Ao) For: dr > = 25mm
Khi = if(di = Omm, Khi1, Khi2) Khi = 0.425 Khr = if(dr = Omm, Khr1, Khr2) Khr = 0.425
�i = atan �i = 23.005° �r = atan �r = 23.005°
Dymanic Earth Pressure Coefficient
Infill Soil Retained Soil
Kaei = Kaer =
Kaei = if(Ao = 0, 0, Kaei) Kaei = 0.471 Kaer = if(Ao = 0, 0, Kaer) Kaer = 0.471
sin (� + �wr) + sin (�r + �wr) sin (�r - i)
sin (� - i)[ ]
( )
[ ]
( )( )
csc (�) sin (� - �r ) csc (�) sin (� - �i )
(Ao)(25mm)
di
( )h
2
2
cos (�i + � - �i )2
cos (�i ) cos (�)2
cos (�wi - � + �i )
2
0.25
( )
Khi1 + Kv
Khr1 + Kv( )
(Ao)(25mm)
di
0.25
( )
1 +
2
( )cos (�r + � - �r )2
cos (�r ) cos (�)2
cos (�wr - � + �r )
( )sin (�r + �wr) sin(�r - i - �r )
cos (�wr - � + �r ) cos(� + i)1 +
2sin (�i + �wi ) sin(�i - i - �i )
cos (�wi - � + �i ) cos(� + i)
sin (� + �wi ) + sin (�i + �wi ) sin (�i - i)
sin (� - i)
13

14
EExxtteerrnnaall SSttaabbiilliittyy
FFrreeee BBooddyy DDiiaaggrraamm
Where:
He = Effective Wall Height
H = Total Wall Height
Wi = Weight of the Back Slope
Wq = Infill Surcharge Dead
Load
Wf = Weight of the
Allan Block Facing
Ws = Weight of the Geogrid
Reinforced Soil Mass
Pir = Seismic Inertial Force
for each Gravity Force
Hir = Pir Resultant Vertical
Location
P = Point Load Surcharge
Qpt = Translated Point Load
DFdyn = Dynamic Earth Force
Fq = Surcharge Force
FQpt = Point Load Force
YQpt = Translated Point Load
Vertical Location
Fa = Active EarthForce
DDrriivviinngg FFoorrccee CCaallccuullaattiioonnss
AAccttiivvee EEaarrtthh FFoorrccee MMoommeenntt AArrmmss::
Fa = 0.5(Kar)(�r)(He2) = 10.667 kN/m FaArmh = 0.33(He) = 0.933 m
Fah = Fa(cos)(�wr) = 9.642 kN/m FaArmv = L + s + .33(He)(tan(�)) = 1.931 m
Fav = Fa(sin)(�wr) = 4.564 kN/m
DDyymmaanniicc EEaarrtthh FFoorrccee MMoommeenntt AArrmmss::
Fae = 0.5(1 + Kv)(Kaer)(�r)(He2) = 35.07 kN/m
DFdyn = if (Ao = 0, 0 kN/m, DFdyn) = 24.402 kN/m DFdynArmh = 0.6(He) = 1.68 m
DFdynh = DFdyn(cos(�wr)) = 22.06 kN/m DFdynArmv = L + s + (0.6)(He)(tan)(�) = 2.09 m
DFdynv = DFdyn(sin(�wr)) = 10.44 kN/m
DFdynv = Fae - Fa = 24.4 kN/m
SSuurrcchhaarrggee FFoorrccee MMoommeenntt AArrmmss::
Fq = (q)(Kar)(He) = 0 kN/m FqArmh = (0.5)(He) = 1.4 m
Fqh = (Fq)(cos(�wr)) = 0 kN/m FqArmhv = L + s + (0.5)(He)(tan(�)) = 2.03 m
Fqv = if [xq = 1, Fq(sin(�wr)), if (xq = 3, Fq(sin(�wr)), 0 kN/m)]
= 0 kN/m
PPooiinntt LLooaadd SSuurrcchhaarrggee
Elevation of Surcharge above top of wall:
Qh = [x1 - (t + H(tan(�)))]tan(i) = 0 m
Location of the end of grid at the top of the wall plus the influence zone buffer of H/4:
Endg = L + s + H(tan)(�) + H/4 = 3.028 m
He
H
Hir
Fr
Pir Pir
Wf Ws
0.5H
Wi
Wq
Pir
P
Qpt
DFdyn
Fq
FQpt
Fa
1/3 He0.5 YQpt
0.5 He0.6 He
YQpt
Concrete Unit Weight: �c = 21.207 kN/m3
Unit Fill Unit Weight: �uf = 19.636 kN/m3
External Stability

Minimum application distance for zero influence:
Location of the translated point load surcharge:
YQpt = [H + (x1 - (t + H(tan(�)))) tan(i)] - (x1 - L - s - )(tan (45° - �r/2)) 1 + sin(45° - �r/2)
YQpt = if(x1 > Endg, YQpt, He)
YQpt = 2.8 m
Location of the end of the grid at the YQpt elevation plus the influence zone buffer of H/4.
EndgYQpt = L + s + YQpt(tan)(�) + H/4 = 3.028 m
The point load will be distributed over its contact area, Qp and translated through the soil if it acts behind the
reinforced mass, Qpt.
Qpi = = 0 kPa
Qpti = = 0 kPa
Point Load Surcharge Influence
If the point load contact is only with the reinforced mass it will add stability to the wall structure, therefore the loads are
only considered in the internal stability calculations.
Qp = if (x2 > L + s + H(tan)(�) - 0.6 m Qpi, 0 kPa)
If the point load contact is beyond the reinforced mass and its influence zone buffer, it will only affect the external
stability. If it overlaps both the influence zone and retained soil it will effect both internal and external stability.
Qpt = if (x1 > Endg, Qpti, Qp)
If the point load contact is beyond the reinforced mass plus its influence zone buffer it will have no effect on the wall.
Qpt = 0.
Qpt = if (x1 > Minx1, 0 kPa, Qpt) = 0 kPa
NNoottee:: Qpt is the translated distributed point load surcharge used to determine the point load force that will be influencing the external
stability of the retaining wall structure. Qpt is a function of the location of the contact area with respect to the geogrid reinforcement.
Qp will be used to calculate the point load surcharge if it acts directly on top of the reinforced soil. No translation calculations are
necessary for Qp because its applications area is on top of the reinforced mass and its influence zone buffer.
[ ]( )
( )
H
tan(45° - �r/2)+ H/4 + L + s - t - H(tan)(�) (tan (i))(sin(90° + i))
Minx1 = L + s + H/4 + +
Minx1 = 8.174 m
H
4
H
tan (45° - �r/2)sin (45° - �r/2 - i)
cos (45° - �r/2)
( )[ ]sin(90° + �)tan(�)
sin(45° + �r/2 - (�))
( )P
(x2 - x1)
( )P
[x1 - EndgYQpt)(2) + (x2 - x1)]
15

16
PPooiinntt LLooaadd SSuurrcchhaarrggee MMoommeenntt AArrmmss::
FQpt = (Qpt)(Kar)(Yqpt) = 0 kN/m FQptArmh = YQpt/2 = 1.4 m
FQpth = FQpt(cos(�wr)) = 0 kN/m
PPooiinntt LLooaadd SSuurrcchhaarrggee WWeeiigghhtt MMoommeenntt AArrmmss::
WQpt1 = Qpi(x2 - 1) WQptArm1 = x1 +
WQpt2 = Qpi(L + s + H(tan(�)) - x1)
WQpt = if (x2 < L + s + H(tan(�)) - 0.6 m, WQpt1, WQpt2) WQptArm2 = x1 +
WQpt = if (x1 < L + s + H(tan(�)), 0 kN/m, WQpt)
WQpt = 0 kN/m WQptArm = if (x2 < L + s + H(tan(�))
- 0.6 m, WQptArm1, WQptArm2)
WQptArm = 0 m
RReessiissttiinngg FFoorrccee CCaallccuullaattiioonnss MMoommeenntt AArrmmss::
WWeeiigghhtt ooff tthhee BBaacckk SSllooppee
Wi = 0.5 �y(He - H)[L - (t - s)] = 0 kN/m WiArm = 0.67 [L - (t - s)] + H(tan(�)) + t = 1.849 m
WWeeiigghhtt ooff tthhee DDeeaadd LLooaadd SSuurrcchhaarrggee
Wq = if (xq = 3, [L - (t - s)] q, 0 kN/m) WqArm = 0.5 [L - (t - s)] + H(tan(�)) + t = 1.61 m
WWeeiigghhtt ooff tthhee FFaacciinngg
Wf = H(t)[(c)(�c) + (v)(�uf)] = 17.056 kN/m
WWeeiigghhtt ooff tthhee RReeiinnffoorrcceedd SSooiill MMaassss
Ws = H[L - (t - s)] �i = 76.435 kN/m
TToottaall WWeeiigghhtt
Wt = Wf + Ws = 93.491 kN/m WtArm = 0.5 (L + s) + 0.5 H(tan(�)) = 1.164m
SSlliiddiinngg RReessiissttaannccee
Frstatic = (Fav + Fqv + Wi + Wq + Wf + Ws) tan(�i) Frseismic = (Fav + DFdynv + Fqv + Wi + Wq + Wf
= 76.609 kN/m + Ws) tan(�i) = 84.767 kN/m
SSeeiissmmiicc IInneerrttiiaall FFoorrccee
The weight of each component of the wall structure has a horizontal inertial force acting at its centroid during a seismic event. The
three components that have this inertial force are the block facing, the reinforced soil mass and the Back Slope soil. The resultant Pir is
the sum of all three. The weight of the reinforced soil mass and the Back Slope soil is based on a reinforcement length of 0.5 H.
Weight of the Block Face
Wf = 17.056 kN/m
SSeeiissmmiicc IInneerrttiiaall FFoorrccee
Pir = Khr(Wf + Ws’ + Wi ’) = 33.37 kN/m
MMoommeenntt AArrmm
Hir = = 1.4 m
( )
(x2 - x1)
2
(Endg - H/4 - x1)
2
Khr (Wf)(H/2) + Khr(Ws)(H/2) + Khr(Wi’) H + 0.33[0.5 H - (t - s)] tan (i)
Pir
[ ]
Weight of the Reinforced Soil Mass
Ws’ = [0.5 H - (t - s)] �i H = 61.539 kN/m
Weight of the Back Slope
Wi’ = 0.5 [0.5 H - (t - s)]2 �r tan (i) = 0 kN/m

EExxtteerrnnaall SSttaabbiilliittyy FFaaccttoorrss ooff SSaaffeettyy
FFaaccttoorr ooff SSaaffeettyy ffoorr SSlliiddiinnggStatic Conditions: FSstaticsliding > 1.5
FSstaticsliding = = 7.95
Seismic Conditions: FSseismicsliding > 1.1
FSseismicsliding = = 1.3
Factor oof SSafety ffor OOverturningStatic Conditions: FSstaticoverturning > 2.0
FSstaticoverturning = = 13.07
Seismic Conditions: FSseismicoverturning > 1.5
FSseismicoverturning =
= 1.5
BBeeaarriinngg CCaappaacciittyy CCaallccuullaattiioonnss - SSttaannddaarrdd MMeetthhoodd
Vertical Force ResultantR = Wf + Ws + Wi + Wq + Fav + DFdynv + Fqv + WQpt = 108.497 kN/m
Location of the Resultant Forcepositive = Wt(WtArm) + Wi(WiArm) + Wq(WqArm) + WQpt(WQptArm) + Fav(FavArmv) + DFdynv(DFdynArmv) + Fqv(FqArmv)negative = Fah(FaArmh) + DFdynh(DFdynArmh) + Fqh(FqArmh) + FQpth(FQptArmh) + Pir(Hir)
positive = 139.455 kNnegative = 92.77 kN
x = = 0.43 m
Determine the eccentricity, E, of the resultant vertical force.E = 0.5 (L + s) - x = 0.436 m
Determine the average bearing pressure acting at the centerline of the wall.�avg = = 62.615 kPa
Determine the moment about the centerline of the wall due to the resultant bearing load.Mcl = R(E) = 47.314 kN/m2
section modulus S = = 0.5 m3
FrstaticFah + Fqh + FQpth
FrseismicFah + DFdynh + Fqh + FQpth + Pir
positive - negativeR
(1.0 m)(L + s)2
6
R(L + s)
Wt(WtArm) + Wi(WiArm) + Wq(WqArm) + Fav(FaArmv) + Fqv(FqArmv)Fah (FaArmh) + Fqh(FqArmh) + FQpth(FQptArmh)
Wt(WtArm) + Wi(WiArm) + Wq(WqArm) + Fav(FaArmv) + Fqv(FqArmv) + DFdynv(DFdynArmv)Fah (FaArmh) + DFdynh(DFdynArmh) + Fqh(FqArmh) + FQpth(FQptArmh) + Pir(Hir)
17

18
Difference in bearing pressure due to the eccentric loading.
�mom = = 94.551 kPa
Therefore:
�max = �avg + �mom = 157.166 kPa
�min = �avg - �mom = 31.936 kPa
UUllttiimmaattee BBeeaarriinngg CCaappaacciittyy CCaallccuullaattiioonnss
Meyerhoff bearing capacity equation
�ult = 0.5* �f* Lwidth* N� + cf*Nc + �f* (Ldepth + D)*Nq
Where: Nq = (exp(� tan(�f)))[tan(45° + )]2
= 48.933
Nc = (Nq - 1) cot(�f) = 61.352
N� = (Nq - 1) (tan((1.4)(�f))) = 64.074
Therefore:
�ult = 0.5(�f)(Lwidth)(N�) + cf(Nc) + �f(Ldepth + D)Nq = 1021.534 kPa
Factor of Safety
FSbearing = FSbearing = 6.5
�f
2
�ult�max
Mcl (1 m)
S

IInntteerrnnaall SSttaabbiilliittyy
FFrreeee BBooddyy DDiiaaggrraamm
Where:
Dj = Depth to each Geogrid Layer
0.3H= Orientation of line of Maximum Tension
45+phi/2 = Orientation of the line of Maximum
Tension
Acj = Influence area of each Geogrid Layer
Hei = Effective Wall Height for Internal Stability
Grid Elevation: elevj = gridj(h)
Hei = H + [0.3 H - (t - s)] tan(i) = 2.8 m
NNoottee:: For internal stability calculations sample calculations will be shown for grid layer #1. All other grid layers will be shown through
tabular calculations at the end of this section.
DDeetteerrmmiinnaattiioonn OOff TThhee FFoorrccee AAccttiinngg OOnn EEaacchh GGrriidd LLaayyeerr
SSttaattiicc LLooaaddss, use the subscript “s”.
Influence Area
Acj = if j = 1, ,
if j = g, Hei - , -
= 0.4 m
Active Earth Pressure
Gj = if j = g, Hei - , Hei - + Hei -
Faij = Kai (cos)(�wi)(�i)(Acj)(0.5) if j = 1, Hei + Hei - , Gj
Faij = 2.558 kN/m
Surcharge Pressure
Fqij = if xq = 3, q(Kai)(cos (�wi))(Acj ), if xq = 4, q(Kai)(cos(�wi))(Acj ), 0 Kn/m = 0 kN/m
Point Load Surcharge Pressure
FQptij= if x1 > (L + s + H tan(�) + 0.6 m, 0 kN/m, Qpt(Kai)(cos(�wi))(Acj ) = 0 kN/m
( ( ) )
0.3 H
D1
D2
D3
D4
D5
Dj
Acj
Ac5
Ac4
Ac3
Ac2
Ac1
45+phi/2
Hei
Line of MaximumTension
( )
( ))( ) ( )
( )
( )
grid j + 1 (h) + grid j (h)
2
grid j (h) + grid j - 1 (h)
2
grid j + 1(h) + grid j (h)
2
grid j (h) + grid j - 1 (h)
2
grid j + 1(h) + grid j (h)
2
( )( )
( )
( ) )
( ) ( )grid j (h) + grid j - 1 (h)
2
grid j + 1(h) + grid j (h)
2
grid j (h) + grid j - 1 (h)
2
19
Internal Stability

SSeeiissmmiicc ((DDyynnaammiicc)) LLooaaddss, use the subscript “d”.
Dynamic Earth Pressure
DFdynij = 0.8 - (0.6) Kaei (cos(�wi))(�i)(Hei)(Acj) = 2.199 kN/m
Seismic Inertial Force
Pirij = Khi(t) (c)(�c) + v(�uf) Acj = 1.034 kN/m
TTeennssiillee FFoorrccee oonn EEaacchh GGeeooggrriidd
Static Seismic
Fisj = Faij + Fqij + FQptij = 2.558 kN/m Fidj = Faij + Fqij + FQptij + DFdynij + Pirij = 5.792 kN/m
GGeeooggrriidd TTeennssiill OOvveerrssttrreessss
Geogrid Tensil Strength
LTDSj = if (typej = A, LTDS_A, LTDS_B) = 19.3 kN/m
RFcrj = if (typej = A, RFcr_A, RFcr_B) = 1.67
FFaaccttoorr ooff SSaaffeettyy,, SSttaattiicc FFaaccttoorr ooff SSaaffeettyy,, SSeeiissmmiicc
FSoverstresss = = 7.545 FSoverstressdj = = 5.565
GGeeooggrriidd // BBlloocckk CCoonnnneeccttiioonn CCaappaacciittyy
Normal Load
Nj = (H - gridj - h)[c(�c) + v(�uf)t = 15.837 kN/m
Peak Connection Strength
Fcsj = if [typej = A, if (Nj < Ninta, B1a + M1a(Nj)), if (Nj < Nintb, B1b + M1b(Nj), B2b + M2b(Nj)] = 21.377 kN/m
FFaaccttoorr ooff SSaaffeettyy CCoonnnneeccttiioonn SSttrreennggtthh,, SSttaattiicc FFaaccttoorr ooff SSaaffeettyy CCoonnnneeccttiioonn SSttrreennggtthh,, SSeeiissmmiicc
FSconnsj = = 12.529 FSconndj = = 5.534
GGeeooggrriidd PPuulllloouutt ffrroomm tthhee SSooiill
Equations for each segment of the line of maximum tension:
segment #1: y1 = tan(45° + �/2)(x-t) where x = distance to the line of maximum tension.
segment #2: x = (H)(0.3 + tan(�))
Setting these two equations equal to each other yields the elevation of their intersection point.
yint = tan(45° + �i/2) [H(0.3 + tan(�)) - t] = 2.336 m
Therefore the length of geogrid embedded beyond the line of maximum tension if the following.
For geogrid elevation < yint
Le1j = (lengthj + s) - + t + (tan(�))[(gridj )(h)]
20
(( ) )
LTDSj
Fisj
LTDSj(RFcrj )
Fidj
Fcsj
Fisj(0.667)
gridj (h)
tan(45° + �i/2)
Fcsj
Fidj(0.667)
( )
( )
( )Hei - gridj (h)
Hei
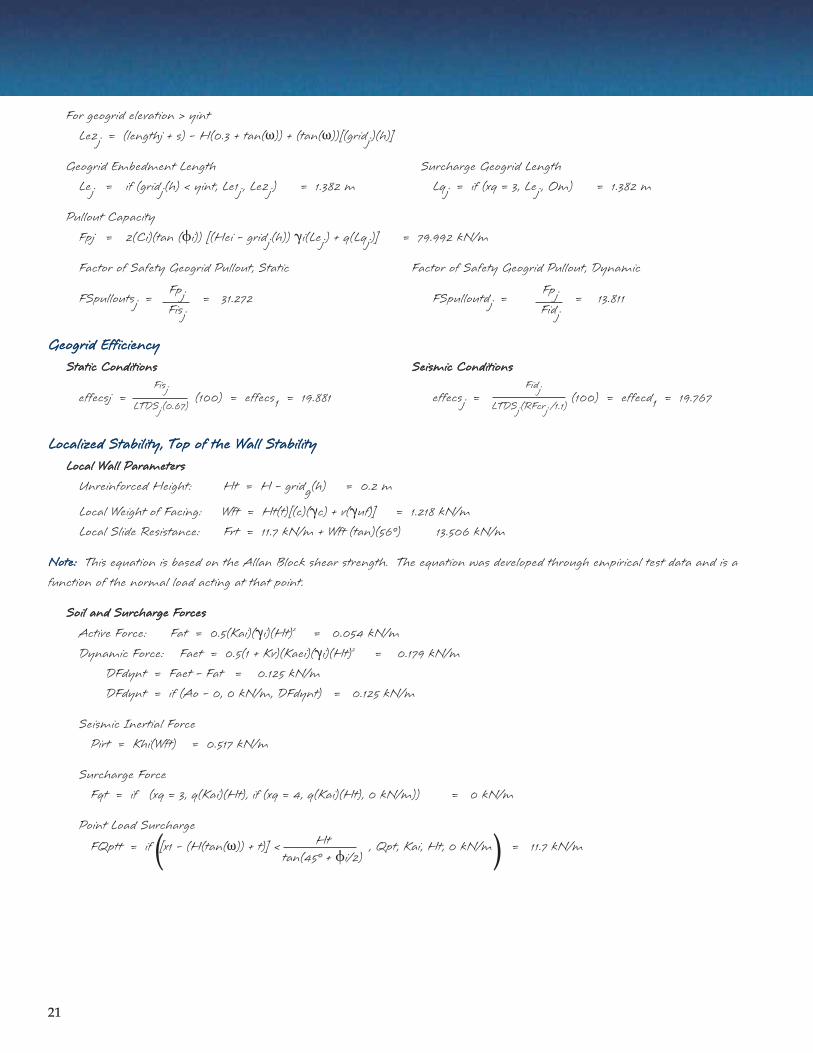
For geogrid elevation > yint
Le2j = (lengthj + s) - H(0.3 + tan(�)) + (tan(�))[(gridj )(h)]
Geogrid Embedment Length Surcharge Geogrid Length
Lej = if (gridj (h) < yint, Le1j , Le2j ) = 1.382 m Lqj = if (xq = 3, Lej , Om) = 1.382 m
Pullout Capacity
Fpj = 2(Ci)(tan (�i)) [(Hei - gridj (h)) �i(Lej ) + q(Lqj )] = 79.992 kN/m
Factor of Safety Geogrid Pullout, Static Factor of Safety Geogrid Pullout, Dynamic
FSpulloutsj = = 31.272 FSpulloutdj = = 13.811
GGeeooggrriidd EEffffiicciieennccyy
SSttaattiicc CCoonnddiittiioonnss SSeeiissmmiicc CCoonnddiittiioonnss
effecsj = (100) = effecs1 = 19.881 effecsj = (100) = effecd1 = 19.767
LLooccaalliizzeedd SSttaabbiilliittyy,, TToopp ooff tthhee WWaallll SSttaabbiilliittyy
LLooccaall WWaallll PPaarraammeetteerrss
Unreinforced Height: Ht = H - gridg(h) = 0.2 m
Local Weight of Facing: Wft = Ht(t)[(c)(�c) + v(�uf)] = 1.218 kN/m
Local Slide Resistance: Frt = 11.7 kN/m + Wft (tan)(56°) 13.506 kN/m
NNoottee:: This equation is based on the Allan Block shear strength. The equation was developed through empirical test data and is a
function of the normal load acting at that point.
SSooiill aanndd SSuurrcchhaarrggee FFoorrcceess
Active Force: Fat = 0.5(Kai)(�i)(Ht)2
= 0.054 kN/m
Dynamic Force: Faet = 0.5(1 + Kv)(Kaei)(�i)(Ht)2
= 0.179 kN/m
DFdynt = Faet - Fat = 0.125 kN/m
DFdynt = if (Ao - 0, 0 kN/m, DFdynt) = 0.125 kN/m
Seismic Inertial Force
Pirt = Khi(Wft) = 0.517 kN/m
Surcharge Force
Fqt = if (xq = 3, q(Kai)(Ht), if (xq = 4, q(Kai)(Ht), 0 kN/m)) = 0 kN/m
Point Load Surcharge
FQptt = if [x1 - (H(tan(�)) + t)] < , Qpt, Kai, Ht, 0 kN/m = 11.7 kN/m( )
Fisj
LTDSj (0.67)
Ht
tan(45° + �i/2)
Fidj
LTDSj (RFcrj /1.1)
Fpj
Fisj
Fpj
Fidj
21

22
FFaaccttoorr ooff SSaaffeettyy LLooccaall SSlliiddiinngg,, SSttaattiicc
FSslidingst = = 274.559
FFaaccttoorr ooff SSaaffeettyy LLooccaall SSlliiddiinngg,, SSeeiissmmiicc
FSslidingdt = = 21.465
FFaaccttoorr ooff SSaaffeettyy LLooccaall OOvveerrttuurrnniinngg -- SSttaattiicc
FSoverturningst =
FSoverturningst = 65.077
FFaaccttoorr ooff SSaaffeettyy LLooccaall OOvveerrttuurrnniinngg -- SSttaattiicc
FSoverturningst =
FSoverturningdt = 3.439
FFoorr tthhee mmaatthhccaadd ffiillee,, pplleeaassee ccoonnttaacctt tthhee AABB EEnnggiinneeeerriinngg DDeeppaarrttmmeenntt..
( ) ( ) ( )tan(�) + + Fat (sin (�wi)) (tan(�)) + t + Fqt (sin (�wi)) tan(�) + t
Fat (cos (�wi)) + Fqt (cos (�wi)) + FQptt (cos (�wi)) ( )( )( )
Frt
(Fat + Fqt + FQptt) cos(�wi)
Ht2
t2
Ht3
Ht2Wft
Frt
(Fat + DFdynt + Fqt + FQptt + Pirt) cos(�wi)
Ht3
Ht2
Ht2
( ) ( ) ( )(tan(�)) + + Fat (sin (�wi)) (tan(�)) + t + Fqt (sin (�wi)) (tan(�)) + t + DFdynt (sin (�wi))(0.6 (Ht) + t)
Fat (cos (�wi)) + DFdynst (cos (�wi))[(0.6)(Ht)]+ Fqt (cos(�wi)) + FQptt (cos (�wi)) + Pirt( )( )( )
Ht2
t2
Ht3
Ht2Wft
Ht3
Ht2
Ht2 ( )Ht
2

SSuummmmaarryy ooff RReessuullttss
DDeessiiggnn PPaarraammeetteerrss::
Wall Height H = 2.8 mBlock Setback � = 12°Back Slope Angle i = 0°Back Slope Height hi = 0 mSurcharge Load q = 0 kPaPoint Load Surcharge P = 0 kNPoint Load Location x1 = 0 m
x2 = 0 mSeismic Coefficient Ao = 0.8Allowable Deflection
Internal di = 50.8 mmExternal dr = 50.8
EExxtteerrnnaall SSttaabbiilliittyyStatic Conditions Seismic Conditions
Factor of Safety for Sliding Factor of Safety for SlidingFSstaticsliding = 7.95 FSseismicsliding = 1.3
Factor of Safety for Overturning Factor of Safety for OverturningFSstaticoverturning = 13.07 FSseismicoverturning = 1.5
Bearing CapacityUltimate Bearing �ult = 1022 kPaBearing Pressure �max = 157 kPaFactor of Safety FSbearing = 6.5
Note: The minimum footing dimensions are 150 mm deep by 600 mm wide. If the values specifying the footing dimen-sions are not greater than 150 mm deep by 600 mm wide, the minimum size should be used. When geogrid reinforcementis present the minimum footing depth shall be 300 mm to provide 150 mm of cover above and below the geogrid.
IInntteerrnnaall SSttaabbiilliittyy Local TTop oof WWall SStabilityStatic Conditions Seismic Conditions
Factor of Safety for Sliding Factor of Safety for SlidingFSslidest = 274.56 FSslidingdt = 21.46
Factor of Safety for Overturning Factor of Safety for OverturningFSoverturningst = 65.08 FSoverturningdt = 3.44
SSooiill PPaarraammeetteerrss::
Infill Soil �i = 38°�i = 19 kN/m3
Retained Soil �r= 38°�r = 19 kN/m3
Foundation Soil �f = 38°�f = 19 kN/m3
cf = 0 kPa
GGeeooggrriidd PPaarraammeetteerrss::
Geogrid Type A A = Fortrac 35/20-20Geogrid Type B B = Fortrac 20 MpNumber of Layers g = 7 layersGeogrid Length L = 1.68 m
Base Footing DimensionsWidth of Footing LWidth = 1.22 mWidth of Reinforcement Lgrid = 1.22 mToe Extension Ltoe = 0.3 m
Depth of Footing Ldepth = 0.3 m
When reinforcement is present it shall always beplaced 150 mm from the bottom of the footing.
23
Summary of Calculations

IInntteerrnnaall SSttaabbiilliittyy
Seismic Conditions
Geogrid Length L = 1.68 m
Top Layer L = 2.52 m
GGeeooggrriidd
NNuummbbeerr
GGeeooggrriidd
EElleevvaattiioonn
mm
AAlllloowwaabbllee
LLooaadd
kkNN//mm
TTeennssiillee
FFoorrccee
kkNN//mm
FFaaccttoorr ooff SSaaffeettyy
OOvveerrssttrreessss
FFaaccttoorr ooff SSaaffeettyy
PPuulllloouutt,, BBlloocckk
FFaaccttoorr ooff SSaaffeettyy
PPuulllloouutt,, SSooiill
GGeeooggrriidd
EEffffeecciieennccyy,, %%
j = elevj = Fidj = FSoverstressdj = FSconndj = FSpulloutdj = effecdj =
7 2.6 20.647 8.088 2.808 1.975 0.92 39.173
6 2.2 29.301 7.706 4.183 3.827 1.441 26.298
5 1.8 29.301 7.323 4.401 4.097 2.863 24.992
4 1.4 29.301 6.94 4.644 4.397 4.723 23.685
3 1.0 29.301 6.557 4.915 4.732 7.1 22.379
2 0.6 29.301 6.175 5.22 5.108 10.089 21.073
1 0.2 29.301 5.792 5.565 5.534 13.811 19.767
( )
24
IInntteerrnnaall SSttaabbiilliittyy
Static Conditions
Geogrid Length L = 1.68 m
Top Layer L = 2.52 m
GGeeooggrriidd
NNuummbbeerr
GGeeooggrriidd
EElleevvaattiioonn
mm
AAlllloowwaabbllee
LLooaadd
kkNN//mm
TTeennssiillee
FFoorrccee
kkNN//mm
FFaaccttoorr ooff SSaaffeettyy
OOvveerrssttrreessss
FFaaccttoorr ooff SSaaffeettyy
PPuulllloouutt,, BBlloocckk
FFaaccttoorr ooff SSaaffeettyy
PPuulllloouutt,, SSooiill
GGeeooggrriidd
EEffffeecciieennccyy,, %%
j = elevj =LTDSj1.5
Fisj = FSoverstresssj = FSconnsj = FSpulloutsj = effecsj =
7 2.6 9.067 0.197 69.117 81.176 37.802 2.17
6 2.2 12.867 0.59 32.695 49.962 18.816 4.588
5 1.8 12.867 0.984 19.617 30.497 21.307 7.646
4 1.4 12.867 1.377 14.012 22.155 23.798 10.705
3 1.0 12.867 1.771 10.898 17.52 26.289 13.764
2 0.6 12.867 2.164 8.917 14.571 28.78 16.822
1 0.2 12.867 2.558 7.545 12.529 31.272 19.881
=
=LTDSjRFcrj
1.1

Allan Block Corporation and Huesker Geosynthetics
25
Huesker Geosynthetics
The company was founded as a weaving mill in 1861. HUESKER has been producing geotextiles since the 1950's . Today,HUESKER provides a wide, application-oriented range of synthetic wovens, geogrids, composites, clay liners as well asnonwovens and drainage composites.Much of the manufacturing equipment has been internall y developed, being optimized to suit specific product lines .HUESKER uses synthetic filament yarns and fibers of various high quality polymers in the manufacturing of technicaltextile products.
In addition to its standard products, HUESKER works closely with customers, engineering consultants, research bodiesand test institutes to develop individual products and solutions for the most v aried of construction-industry applica-tions.
Allan Block Corporation
The Allan Block Company was started in 1986 by Robert Allan (Bob) Gravier. Over the last decade, Allan Block hasbecome a prominent retaining wall company worldwide. The company began with the introduction of their patentedsegmental retaining wall product - the Original Allan Bloc k. The introduction of this stackable retaining wall systemwas an overwhelming industry success.
The patented system offers the easiest, most durable and most cost effective product on the market. This coupled withthe flexibility of design, wide assortment of sizes, styles and colors makes the Allan Block product line the preferredproduct for retaining wall construction around the world. Allan Block’s commitment and investment into research andtesting gives our consumers confidence in a quality product.
The Allan Block network is a team of professionals dedicated to producing , distributing, designing and constructingthe Allan Block products. This network is continually expanding, as enthusiasm and support for our compan y rapidlygrows. We have built strong relationships with over 40 manufacturers in North America and o ver 30 overseas, whohelp us transfer our products and tec hnology across the globe.
Allan Blockreinforcedwith Hueskergeogrid.

26

Allan Block Corporation • 5300 Edina Industrial Blvd., Edina, MN 55439 • (800) 899-5309 (952) 835-5309 Fax (952) 835-0013 • ICBO #5087 US Patents #4,909,010 & #5,484,236 • Canadian Patents #2,012,286 & #2,133,675 • Australian Patents #684,394 & #133,306Taiwan Patent #NI-090824 • Int’l and Other Patents Pending • Copyright 2003 • DOC. #R0903