ALLAN, ANDREW,BEN, DAN, JUSTINE, &MARISA P15044 DETAILED DESIGN REVIEW.
71
ALLAN, ANDREW,BEN, DAN, JUSTINE, &MARISA P15044 DETAILED DESIGN REVIEW
-
Upload
denis-chambers -
Category
Documents
-
view
213 -
download
0
Transcript of ALLAN, ANDREW,BEN, DAN, JUSTINE, &MARISA P15044 DETAILED DESIGN REVIEW.

A L L A N , A N D R E W , B E N , D A N , J U S T I N E , & M A R I S A
P15044DETAILED DESIGN REVIEW

ENGINEERING SPECIFICATIONS
rqmt. # Importance Source Function Engr. Requirement (metric) Unit of MeasureMinimum
ValueTarget Value
Maximum Value
S1 3 C1 Detection Differentiates between obstacles, overhangs, and walls yes/no yes
S2 3 C1 Detection Response time seconds 0 0.25 1
S3 3 C1 Detection Percentage of false negatives/positives (accuracy of detection) % 0 5 10
S4 3 C2 Detection Detects drop offs in front of the cane through a swept arc yes/no yesS5 3 C3 Detection Start of detection range (distance from the tip of the cane) feet 6 7 13
S6 3 C3 Detection Detection angle/arc (at maximum length) degrees (°) 2 3 3
S7 3 C4 Feedback Percentage of feedback correctly interpreted by user % 80 90 100
S8 3 C5 Fabrication Materials cost $ 0 125 125
S9 2 C6 Use User assembly time seconds 30 60 90
S10 2 C7 Fabrication Maximum weight of feedback and detection components ounces 4 4 16
S11 2 C8 Battery Battery life hours 8 8 /
S12 2 C9 Dimensions Cane length (when in use) centimeters 129 134 139
S13 2 C9 Dimensions Cane handle circumference centimeters 10.8 11.4 12
S14 1 C10 Battery Battery recharge cycle hours 2 2 3
S15 1 C11 Storage Cane length (when collapsed) inches 0 13 15
S16 1 C11 Storage Cane width (when collapsed) inches 0 8 8
S17 3 C2 Detection Dropoff Height height 1 6 7
S18 3 C2 Detection Dropoff Length size(") 12 12 14
S19 3 C2 Detection Dropoff Range range 6 7 13
S20 3 C1/C2 Detection Compensate for user sweep heights height 0 6 12
S21 3 C1/C2 Detection Compensate for user sweep angles angle 30 60 120
S22 2 C9 Use Operating Temperature (°C) 25 30 35
S23 3 C4 Use Feedback Intensity intensity(g) 0.2 ?? 3
S24 3 C4 Use Feedback Frequency frequency (Hz) 20 200 500
S25 2 C8 Detection Detect Battery Life tolerance (hr) 0.25 0.25 0.5
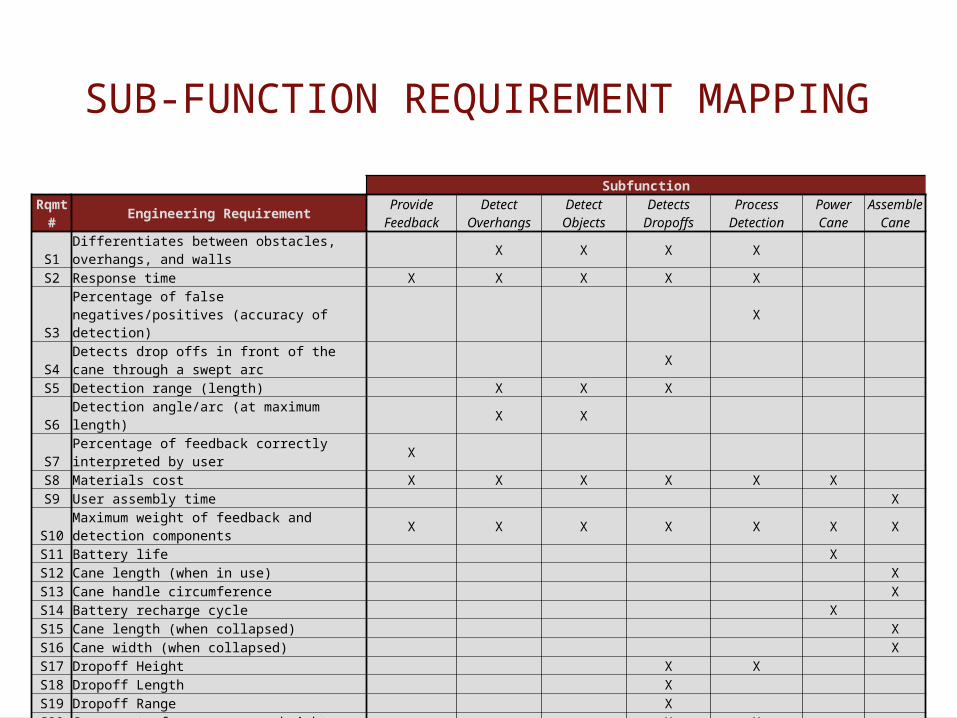
SUB-FUNCTION REQUIREMENT MAPPING
SubfunctionRqmt
# Engineering Requirement Provide Feedback
Detect Overhangs Detect Objects Detects
DropoffsProcess
DetectionPower Cane
Assemble Cane
S1 Differentiates between obstacles, overhangs, and walls X X X X S2 Response time X X X X X
S3Percentage of false negatives/positives (accuracy of detection) X
S4Detects drop offs in front of the cane through a swept arc X
S5 Detection range (length) X X X S6 Detection angle/arc (at maximum length) X X S7 Percentage of feedback correctly interpreted by user X S8 Materials cost X X X X X X S9 User assembly time X
S10Maximum weight of feedback and detection components X X X X X X X
S11 Battery life X S12 Cane length (when in use) XS13 Cane handle circumference XS14 Battery recharge cycle X S15 Cane length (when collapsed) XS16 Cane width (when collapsed) XS17 Dropoff Height X X S18 Dropoff Length X S19 Dropoff Range X S20 Compensate for user sweep heights X X S21 Compensate for user sweep angles X X S22 Operating Temperature X X XS23 Feedback Intensity X S24 Feedback Frequency X S25 Detect Battery Life X X X

SUBSYSTEM DECOMPOSITION

FEEDBACK DECOMPOSITION

DETECTION DECOMPOSITION

ULTRASONIC TRANSDUCER TEST RESULTS
Risk Risk Mitigation ResultsMaximum sensor distance too low. Perform compliance testing to
verify the maximum sensor distance.
HC-SR04 did not meet specifications after compliance testing, MB1010 exceeded specifications.MB1010 selected.
Sensor deadzone is too large Analytically determine minimum deadzone for sensors to perform under desired conditions.
Determined that the deadzone was acceptable (matches the Engineering Requirement for the start of the detection range).
Low sensor accuracy Perform multiple test trials and verify results with datasheet specifications. Measure the variances of the data.
Average variance for dowel detection is 0.9997 (in comparison to 1), and average variance for sheet detection is 0.9988 ( in comparison to 1).
Slow sensor response time Determine analytically maximum time between sensor detection and haptic feedback.
Maximum time between detection and feedback was determined to be insignificant in comparison to average human reaction time of 250 milliseconds.
Too wide sensor beam angle Perform compliance testing to verify the sensor beam angle. Determine analytically if the angle satisfies the deadzone requirement.
Verified that the sensor beam angle was appropriate for use with the deadzone specified by the Engineering Requirements.
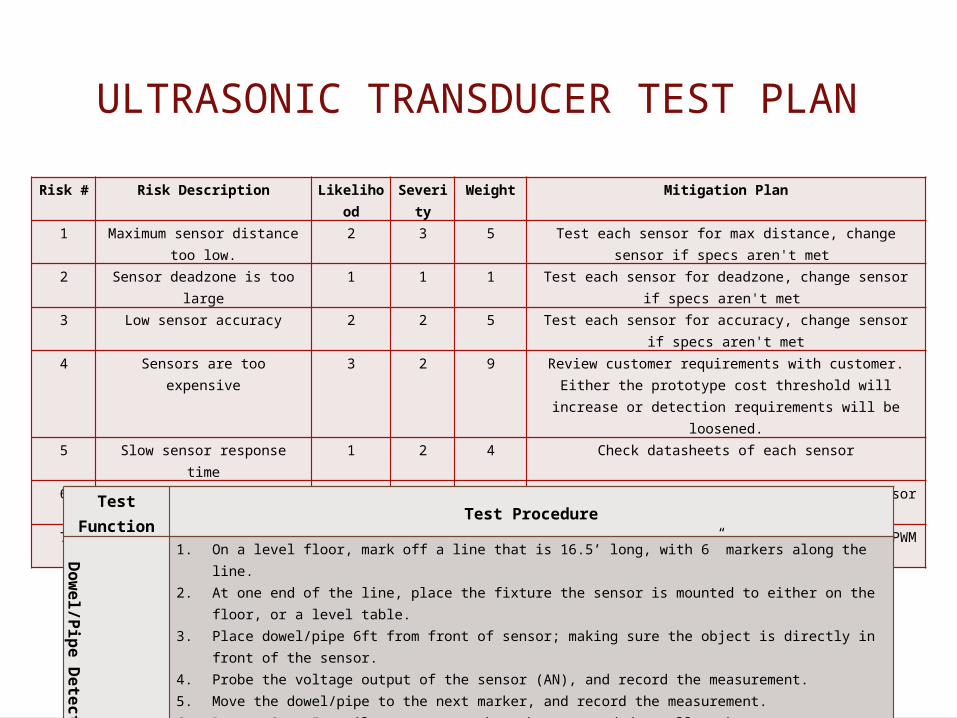
ULTRASONIC TRANSDUCER TEST PLAN
Risk # Risk Description Likelihood
Severity
Weight Mitigation Plan
1 Maximum sensor distance too low.
2 3 5 Test each sensor for max distance, change sensor if specs aren't met
2 Sensor deadzone is too large 1 1 1 Test each sensor for deadzone, change sensor if specs aren't met
3 Low sensor accuracy 2 2 5 Test each sensor for accuracy, change sensor if specs aren't met
4 Sensors are too expensive 3 2 9 Review customer requirements with customer. Either the prototype cost threshold will increase or detection
requirements will be loosened.5 Slow sensor response time 1 2 4 Check datasheets of each sensor6 Too wide sensor beam angle 2 2 6 Test each sensor for beam angle, change sensor if
specs aren't met7 Sensor draws too much
power1 2 3 Check datasheets, reduce amount of pinging/PWM the
transmitter, or change sensor.
Test Function
Test Procedure
Dowel/Pipe
Detection
1. On a level floor, mark off a line that is 16.5’ long, with 6” markers along the line.2. At one end of the line, place the fixture the sensor is mounted to either on the floor, or a level
table.3. Place dowel/pipe 6ft from front of sensor; making sure the object is directly in front of the
sensor. 4. Probe the voltage output of the sensor (AN), and record the measurement.5. Move the dowel/pipe to the next marker, and record the measurement.6. Repeat Step 5 until measurements have been recorded at all markers.
Risks Addressed1,2,3
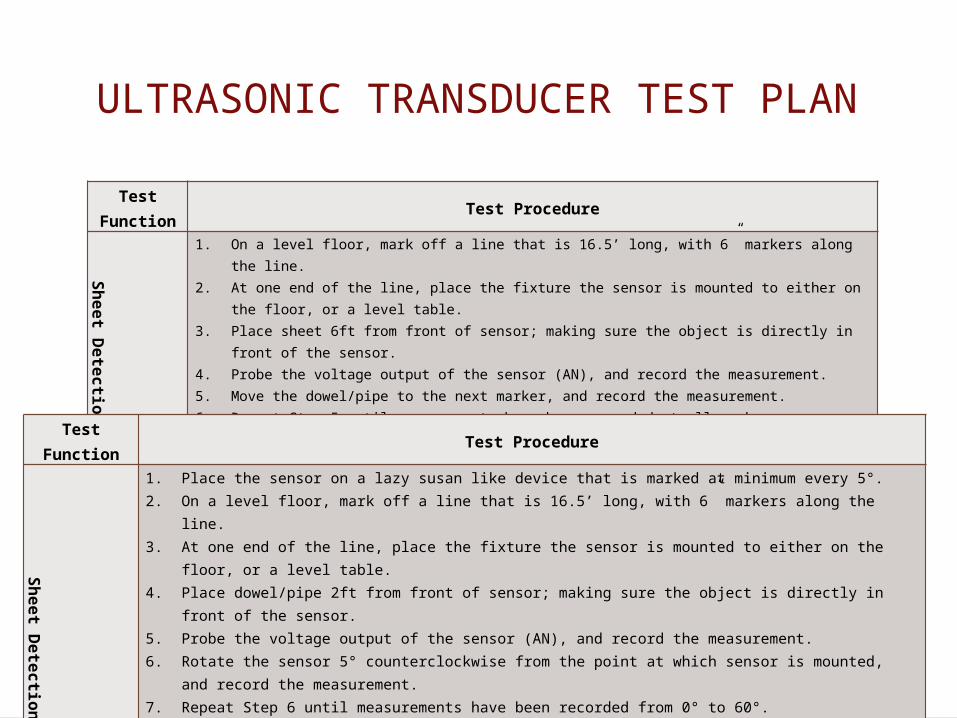
ULTRASONIC TRANSDUCER TEST PLAN
Test Function
Test Procedure
Sheet Detecti
on
1. On a level floor, mark off a line that is 16.5’ long, with 6” markers along the line.2. At one end of the line, place the fixture the sensor is mounted to either on the floor, or a
level table.3. Place sheet 6ft from front of sensor; making sure the object is directly in front of the
sensor. 4. Probe the voltage output of the sensor (AN), and record the measurement.5. Move the dowel/pipe to the next marker, and record the measurement.6. Repeat Step 5 until measurements have been recorded at all markers.
Risks Addressed1,2,3
Test Function
Test Procedure
Sheet Detectio
n
1. Place the sensor on a lazy susan like device that is marked at minimum every 5°.2. On a level floor, mark off a line that is 16.5’ long, with 6” markers along the line.3. At one end of the line, place the fixture the sensor is mounted to either on the floor, or a level
table.4. Place dowel/pipe 2ft from front of sensor; making sure the object is directly in front of the sensor. 5. Probe the voltage output of the sensor (AN), and record the measurement.6. Rotate the sensor 5° counterclockwise from the point at which sensor is mounted, and record the
measurement.7. Repeat Step 6 until measurements have been recorded from 0° to 60°.8. Repeat Steps 6-7, however rotate the sensor 5° clockwise.9. Repeat the whole test with the dowel/pipe 4ft, 6ft, 8ft, and 10ft from the front of the sensor.
Risks Addressed3,6

ULTRASONIC TESTINGDetecting Pipe-Like Objects
HC-SR04 MB1010
Summary:• MB1010 Analog output matches
expected outcome (from datasheet) with little error.
• HC-SR04 output does not correlate to the expected outcome from the datasheet.
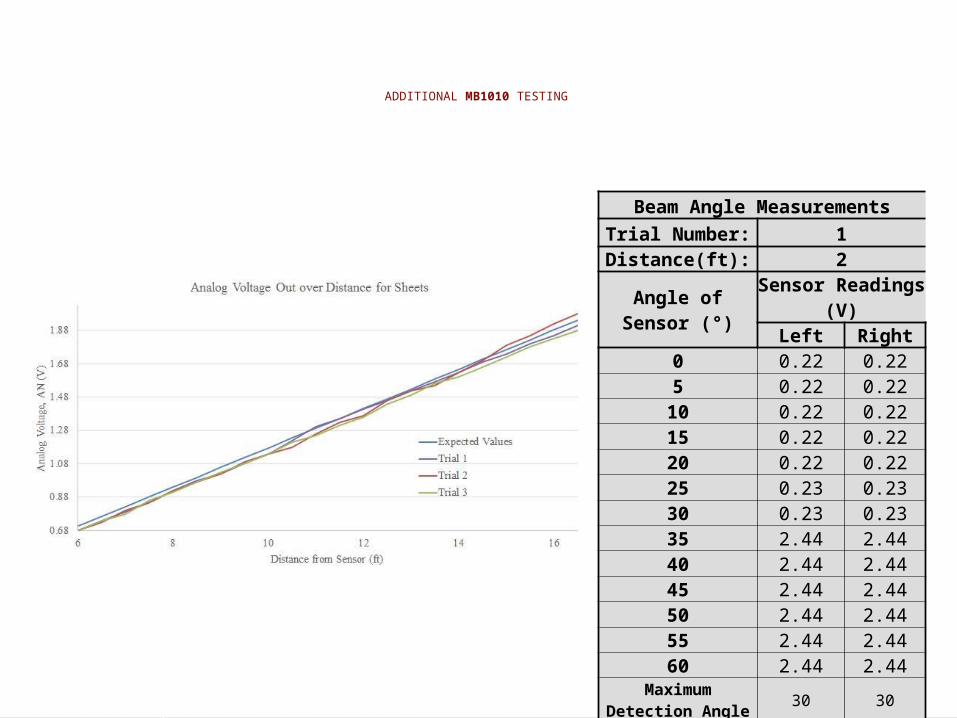
ADDITIONAL MB1010 TESTING
Beam Angle Measurements
Trial Number: 1Distance(ft): 2
Angle of Sensor (°) Sensor Readings (V)
Left Right0 0.22 0.225 0.22 0.22
10 0.22 0.2215 0.22 0.2220 0.22 0.2225 0.23 0.2330 0.23 0.2335 2.44 2.4440 2.44 2.4445 2.44 2.4450 2.44 2.4455 2.44 2.4460 2.44 2.44
Maximum Detection Angle
30 30
Beam Angle Sweep 60

SENSOR BEAM PATTERN
Case C
Distance from sensor (in)
Sensor spread length at distance (in)
Length of the hypotenuse (in)
Resolution beam angle (°)
12 6 13.41640786 53.13010235
24 12 26.83281573 53.13010235
42 21 46.95742753 53.13010235
48 24 53.66563146 53.13010235
72 27 76.89603371 41.11209044
96 36 102.5280449 41.11209044
120 27 123 25.36076698
144 6 144.1249458 4.771888061
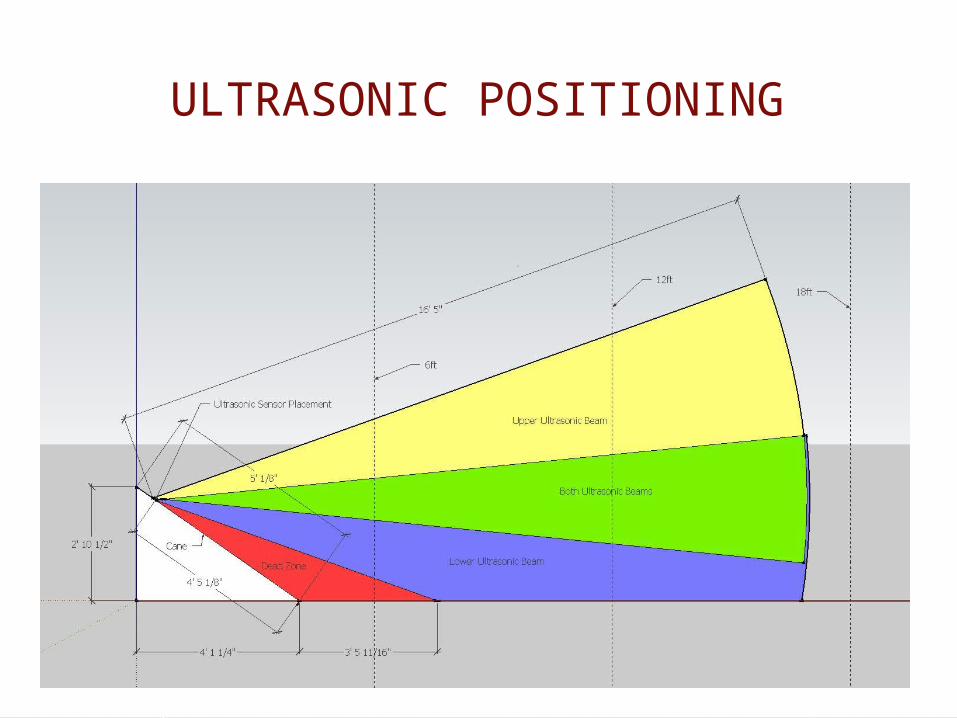
ULTRASONIC POSITIONING

ULTRASONIC POSITIONING
ResultsAngle of the Bottom Sensor (°)
10.05 9.55 10.98
Angle of the Top Sensor (°)
40.80 42.79 39.46
Parameters
Case (Ideal)
Case (Worst Case
Positive)
Case (Worst Case Negative)
Cane Length (in) 53.15 55.15 51.15Handle Length (in) 7 7 4Enclosure Length (in) 4 4 4Height Above Ground (in) 34.5 37.5 31.5Bottom Sensor (Distance from lowest edge of enclosure) [in] 1 2 1Top Sensor (Distance from lowest edge of enclosure) [in] 2 3 1

INFRARED TRANSDUCER TESTING
Summary of Risks Summary of Testing
• Risks can be categorized in two ways: risks that can be addressed through transducer specifications, and risks that can be addressed through compliance testing.
• Specification Risks:• Sensor draws too much power• Sensors are too expensive• Sensor response time is too
slow• Testing Risks:
• Maximum distance of object is not far enough from sensor
• Sensor deadzone is too large• Sensor is not accurate• Sensor beam angle is not
appropriate
• Two ultrasonic sensors were checked for appropriate specifications and tested for requirement compliance.
• The GP2Y0A02YK0F and GP2Y0A710YK0F are comparable in price and other datasheet specifications
• The GP2Y0A02YK0F did not provide a suitable range for our requirements, however the GP2Y0A710YK0F did meet the specification.

INFRARED ULTRASONIC TRANSDUCER TEST RESULTS
Risk Risk Mitigation ResultsMaximum sensor distance too low. Perform compliance testing to
verify the maximum sensor distance.
GP2Y0A02YK0F did not meet specifications after compliance testing, GP2Y0A710YK0F exceeded specifications.GP2Y0A710YK0F selected.
Sensor deadzone is too large Analytically determine minimum deadzone for sensors to perform under desired conditions.
Determined that the deadzone was acceptable (matches the Engineering Requirement for the start of the detection range).
Low sensor accuracy Perform multiple test trials and verify results with datasheet specifications. Measure the variances of the data.
Average variance for dowel detection is 0.9997 (in comparison to 1), and average variance for sheet detection is 0.8659( in comparison to 1).
Slow sensor response time Determine analytically maximum time between sensor detection and haptic feedback.
Maximum time between detection and feedback was determined to be insignificant in comparison to human reaction time.
Too narrow sensor beam angle Perform compliance testing to verify the sensor beam angle. Determine analytically if the angle satisfies the deadzone requirement.
Verified that the sensor beam angle was appropriate for use with the deadzone specified by the Engineering Requirements.
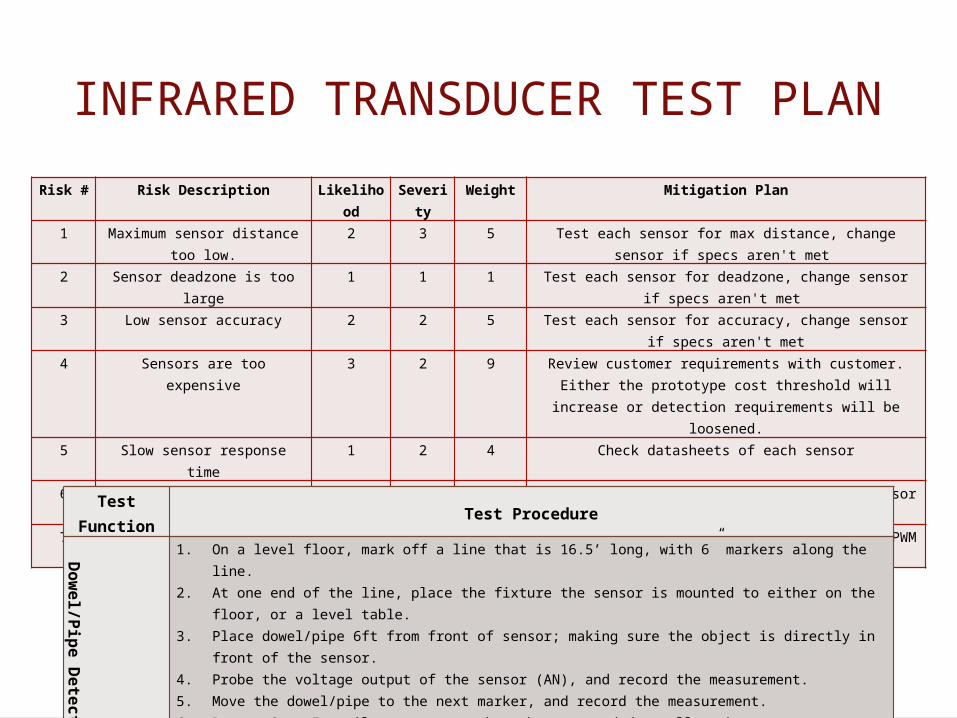
INFRARED TRANSDUCER TEST PLAN
Risk # Risk Description Likelihood
Severity
Weight Mitigation Plan
1 Maximum sensor distance too low.
2 3 5 Test each sensor for max distance, change sensor if specs aren't met
2 Sensor deadzone is too large 1 1 1 Test each sensor for deadzone, change sensor if specs aren't met
3 Low sensor accuracy 2 2 5 Test each sensor for accuracy, change sensor if specs aren't met
4 Sensors are too expensive 3 2 9 Review customer requirements with customer. Either the prototype cost threshold will increase or detection
requirements will be loosened.5 Slow sensor response time 1 2 4 Check datasheets of each sensor6 Too narrow sensor beam
angle2 2 6 Test each sensor for beam angle, change sensor if
specs aren't met7 Sensor draws too much
power1 2 3 Check datasheets, reduce amount of pinging/PWM the
transmitter, or change sensor.
Test Function
Test Procedure
Dowel/Pipe
Detection
1. On a level floor, mark off a line that is 16.5’ long, with 6” markers along the line.2. At one end of the line, place the fixture the sensor is mounted to either on the floor, or a level
table.3. Place dowel/pipe 6ft from front of sensor; making sure the object is directly in front of the
sensor. 4. Probe the voltage output of the sensor (AN), and record the measurement.5. Move the dowel/pipe to the next marker, and record the measurement.6. Repeat Step 5 until measurements have been recorded at all markers.
Risks Addressed1,2,3
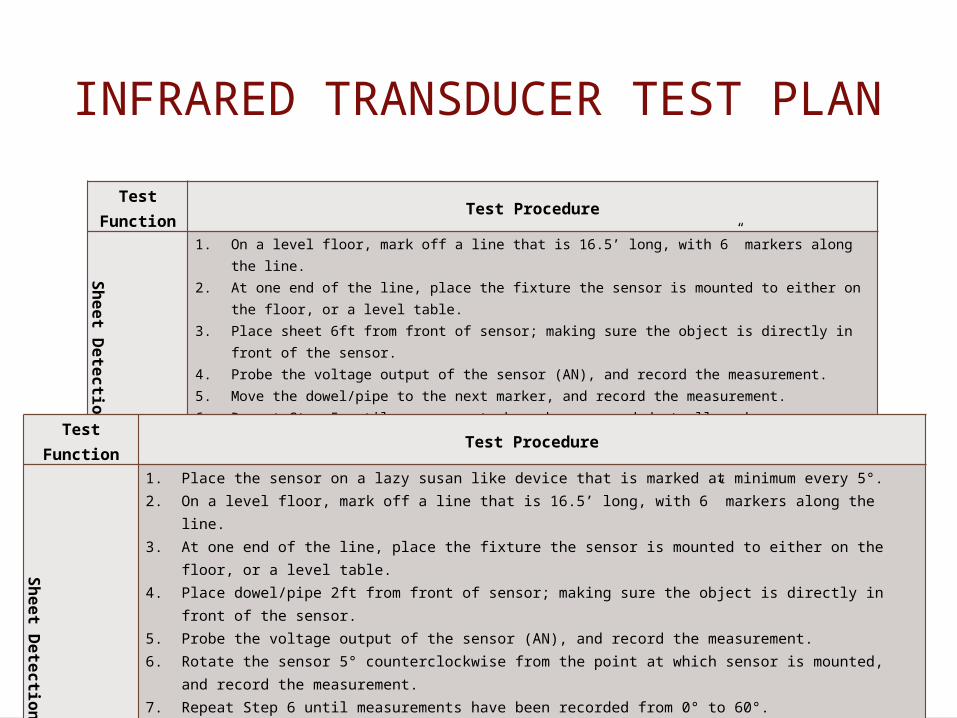
INFRARED TRANSDUCER TEST PLAN
Test Function
Test Procedure
Sheet Detecti
on
1. On a level floor, mark off a line that is 16.5’ long, with 6” markers along the line.2. At one end of the line, place the fixture the sensor is mounted to either on the floor, or a
level table.3. Place sheet 6ft from front of sensor; making sure the object is directly in front of the
sensor. 4. Probe the voltage output of the sensor (AN), and record the measurement.5. Move the dowel/pipe to the next marker, and record the measurement.6. Repeat Step 5 until measurements have been recorded at all markers.
Risks Addressed1,2,3
Test Function
Test Procedure
Sheet Detectio
n
1. Place the sensor on a lazy susan like device that is marked at minimum every 5°.2. On a level floor, mark off a line that is 16.5’ long, with 6” markers along the line.3. At one end of the line, place the fixture the sensor is mounted to either on the floor, or a level
table.4. Place dowel/pipe 2ft from front of sensor; making sure the object is directly in front of the sensor. 5. Probe the voltage output of the sensor (AN), and record the measurement.6. Rotate the sensor 5° counterclockwise from the point at which sensor is mounted, and record the
measurement.7. Repeat Step 6 until measurements have been recorded from 0° to 60°.8. Repeat Steps 6-7, however rotate the sensor 5° clockwise.9. Repeat the whole test with the dowel/pipe 4ft, 6ft, 8ft, and 10ft from the front of the sensor.
Risks Addressed3,6

INFRARED TRANSDUCER TESTINGDistance For Sheet and Pipe-Like Objects
GP2Y0A02YK0F GP2Y0A710YK0F
Takeaways:• Range of GP2Y0A02YK0F is not
sufficient.• Range of GP2Y0A710YK0F• is sufficient.• Both sets of results show that
IR sensors are not as desirable for object detection due to the non-linear response.

INFRARED DROPOFF TESTING
Summary:• Using the GP2Y0A710YK0F
sensor, dropoffs can be detected by a microprocessor as a sharp decrease in voltage (as seen by the nulls in the data on the right).

IR SENSOR POSITIONING
ResultsAngle of the IR Sensor (°) 17.3474 14.2109 21.1775Maximum Sweep Height (in) 5.7120
5.7480 5.5440
***Angle is with respect to the cane.Worst Case Positive with Ideal Angle
Worst Case Negative with Ideal Angle
Dist B1 [ft] 8.57 5.79Maximum Sweep Height (in) 3.24 8.244
ParametersCase
(Ideal)
Case (Worst Case
Positive)
Case (Worst Case Negative)
Cane Length (in) 53.15 55.15 51.15Sensor Height (ft) 2.44 2.27 2.61Handle Length (in) 7 7 4Sensor Mount Length (ft) 4.10 4.26 3.93Enclosure Length (in) 4 4 4Height Above Ground (in) 34.5 37.5 31.5IR Sensor (Distance from lowest edge of enclosure) [in] 0 0 0Dist B1 [ft] 7 7 7Dropoff height (in) 6 6 6
BATTERY LONGEVITY TESTING
Summary of Risks Summary of Testing
• The only risk associated with batteries is that the batteries chosen do not provide enough power to run the system for the required maximum operation time.
• Calculations were completed to determine the required number of batteries to power our system.
• Two test runs were performed determine the actual mAh of the chosen batteries in comparison to the value specified on the datasheet.
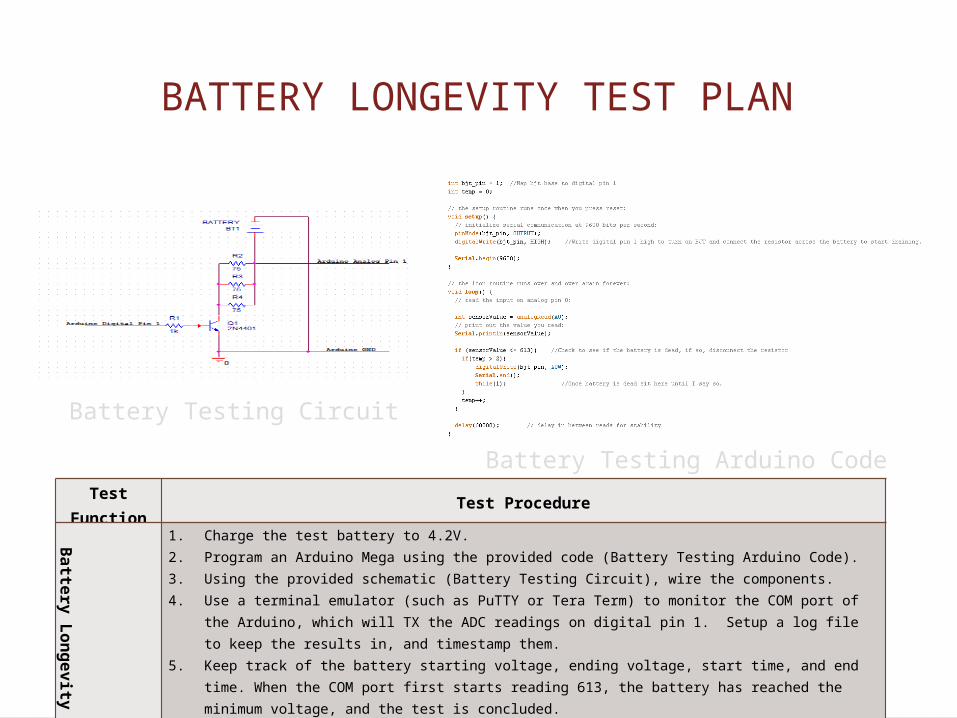
BATTERY LONGEVITY TEST PLAN
Battery Testing Circuit
Battery Testing Arduino CodeTest
FunctionTest Procedure
Battery Longevi
ty
1. Charge the test battery to 4.2V.2. Program an Arduino Mega using the provided code (Battery Testing Arduino Code).3. Using the provided schematic (Battery Testing Circuit), wire the components.4. Use a terminal emulator (such as PuTTY or Tera Term) to monitor the COM port of the Arduino,
which will TX the ADC readings on digital pin 1. Setup a log file to keep the results in, and timestamp them.
5. Keep track of the battery starting voltage, ending voltage, start time, and end time. When the COM port first starts reading 613, the battery has reached the minimum voltage, and the test is concluded.
6. Graph the logged values as a function of time to view the voltage characteristic curve.
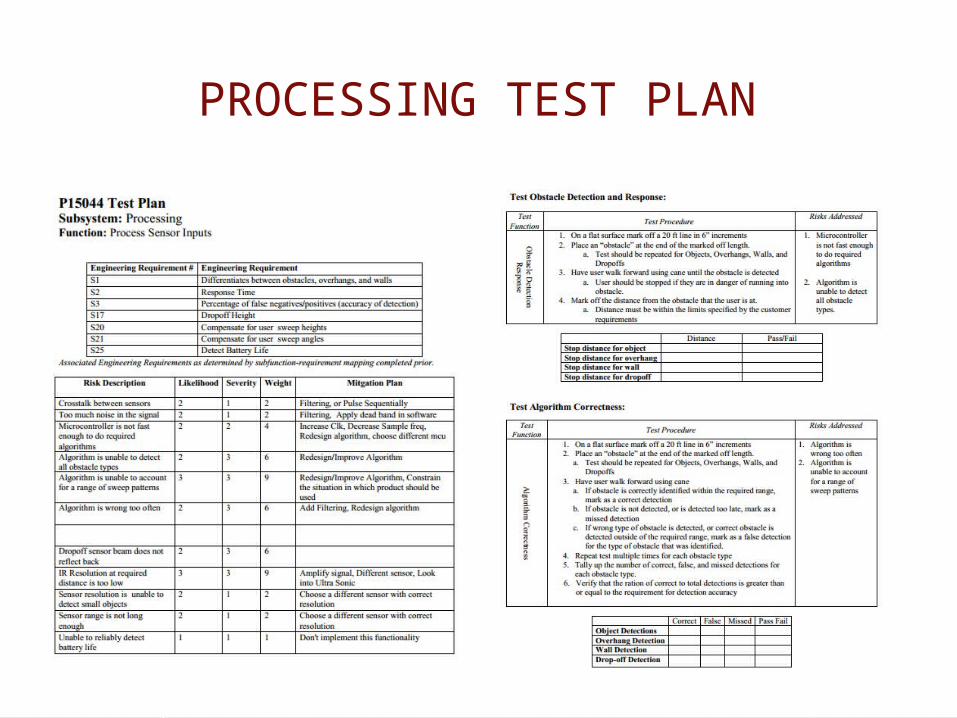
PROCESSING TEST PLAN

MAIN PROGRAM LOGIC
Setup:• Initializes The Interrupt
Services• Sets default settings
values
Loop:• Checks the various
program state flags• Handles outputs
accordingly

FUNCTIONSLow Power Handler:• Indicates Low Power to
User• Goes into deep sleep
mode
Detection Handler:• Turns the
corresponding indication motor on or off
Settings Handler:• Indicates new vibration
intensity• Returns to previous
state

DETECTION ISR’S

MCU RESOURCE ALLOCATIONS
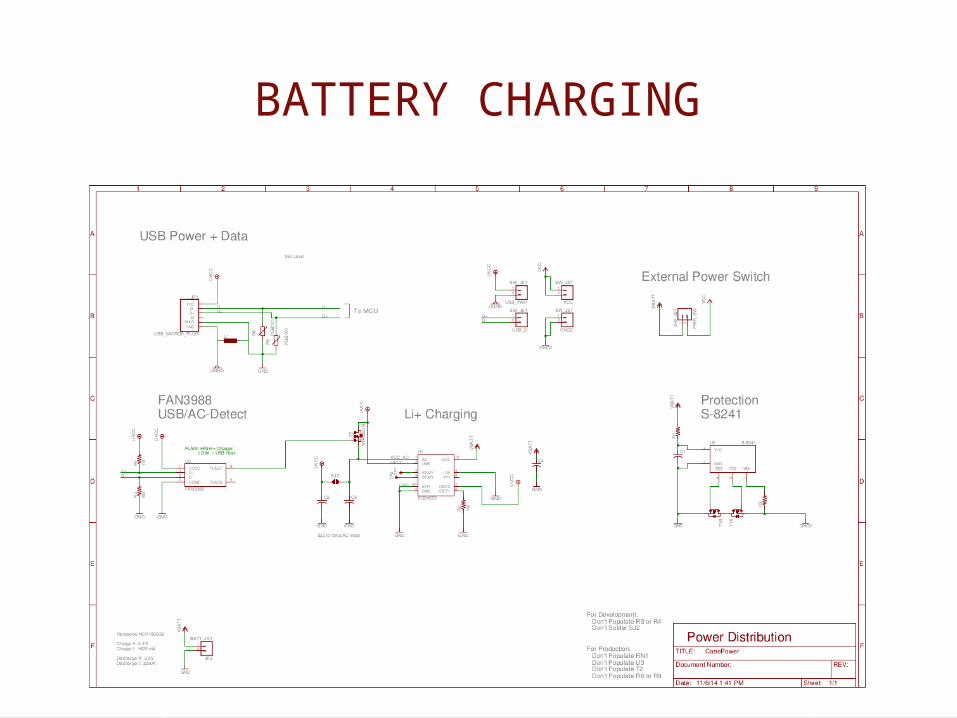
BATTERY CHARGING

POWER DISTRIBUTION
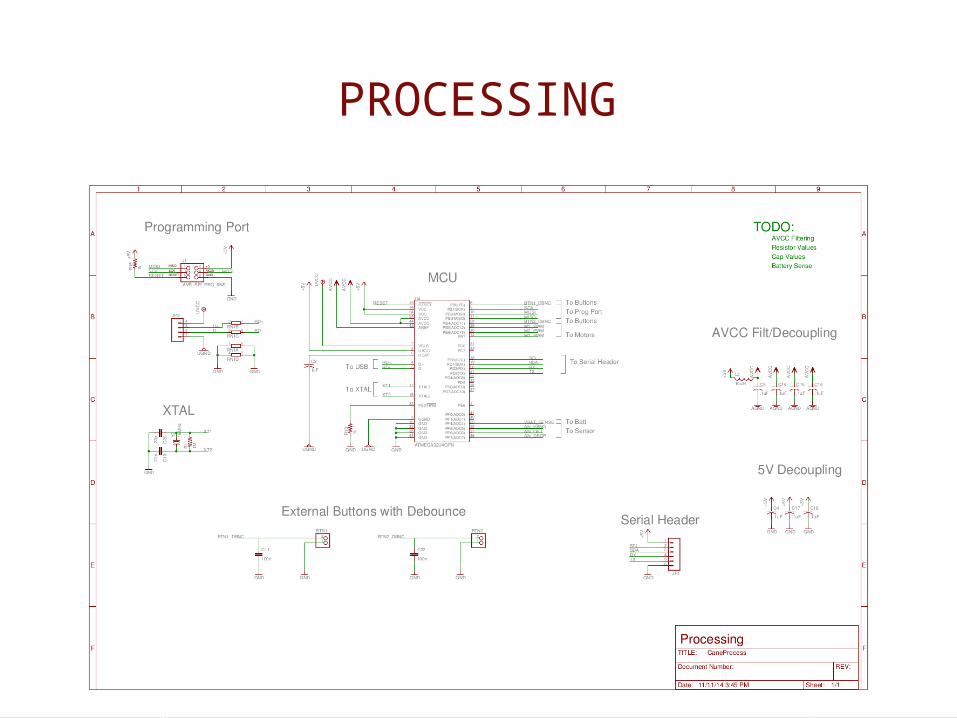
PROCESSING
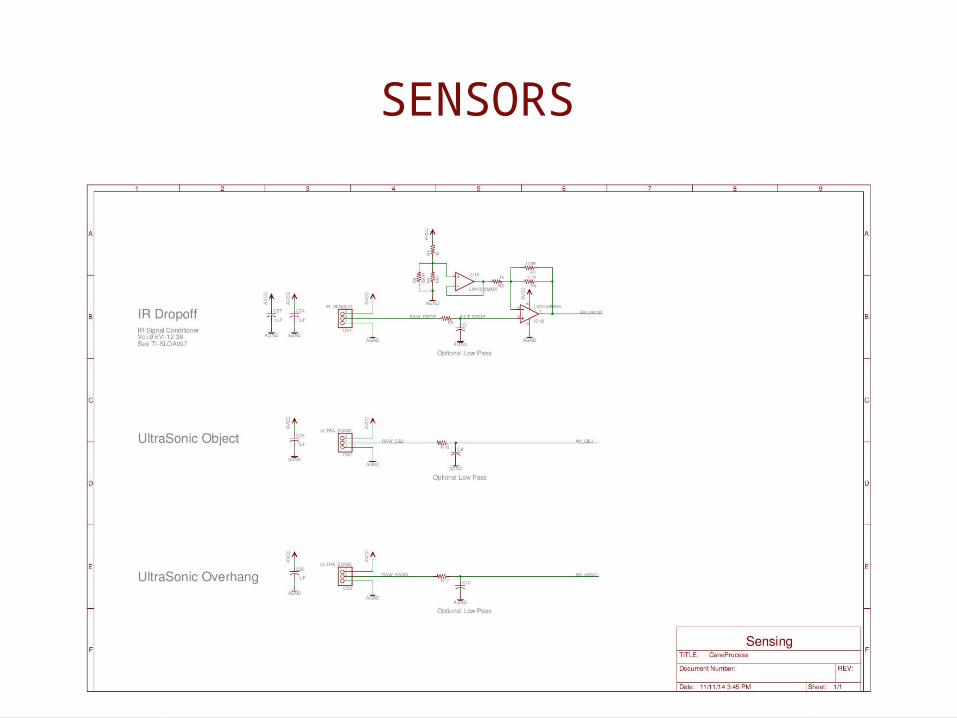
SENSORS
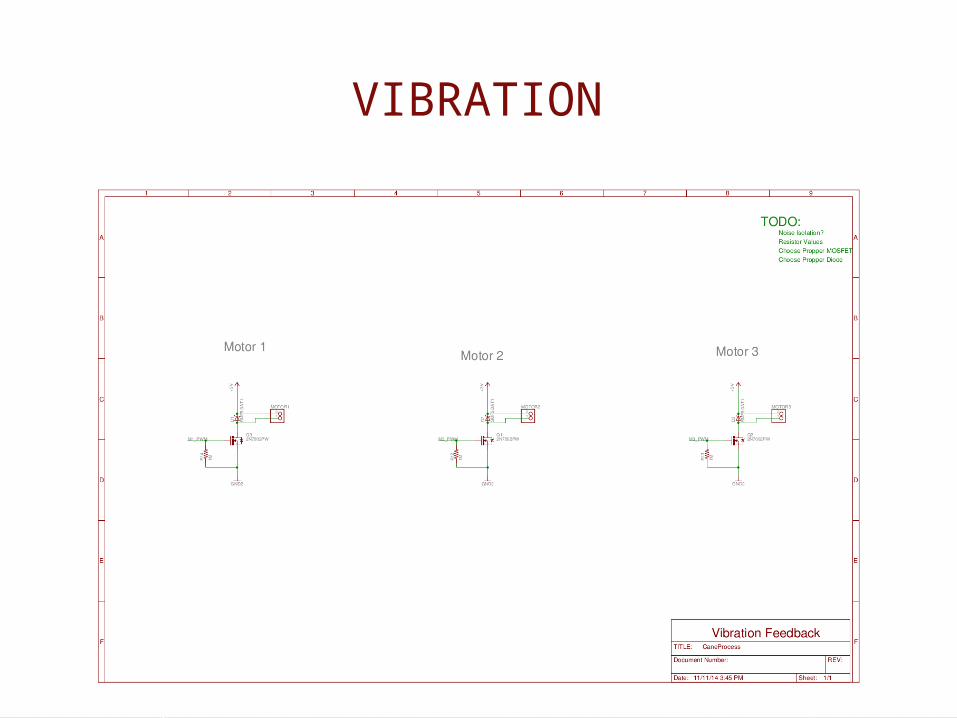
VIBRATION
DROP OFF DETECTION
• Algorithm testing via Matlab Simulation
• Two Stages:• Data Created based off assumptions• Data Collected from actual use
• Collected Data was not as noisy as expected which makes filtering considerably easier• Alleviates processing power risks
• Detection Delay = .25s• Motor Delay = .1s• Response Distance = .35s*1m/s = .35m ≈ 1
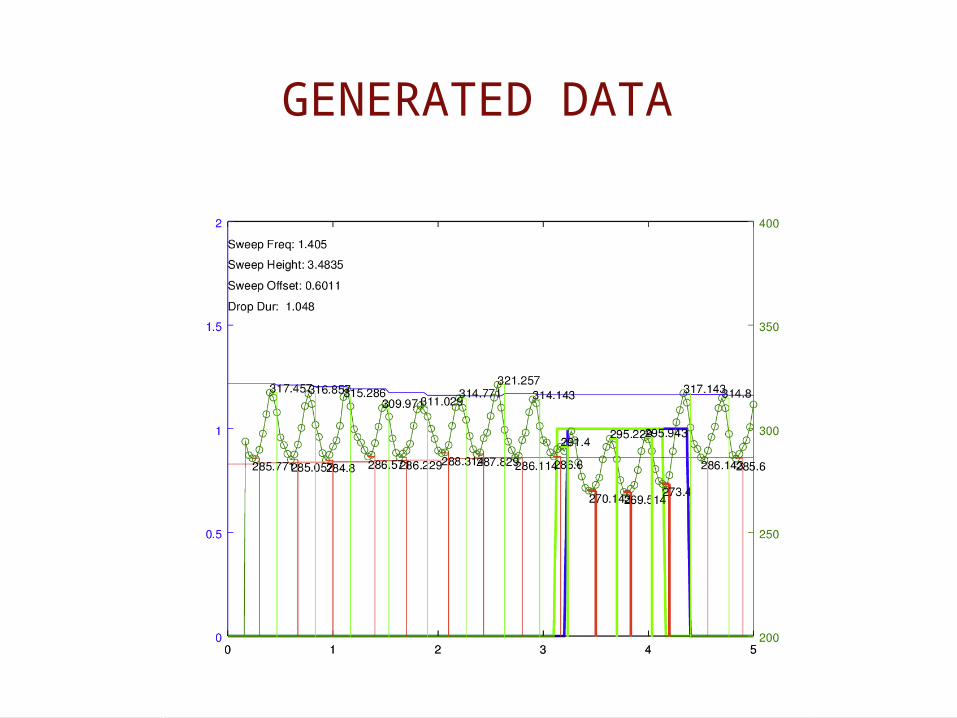
GENERATED DATA
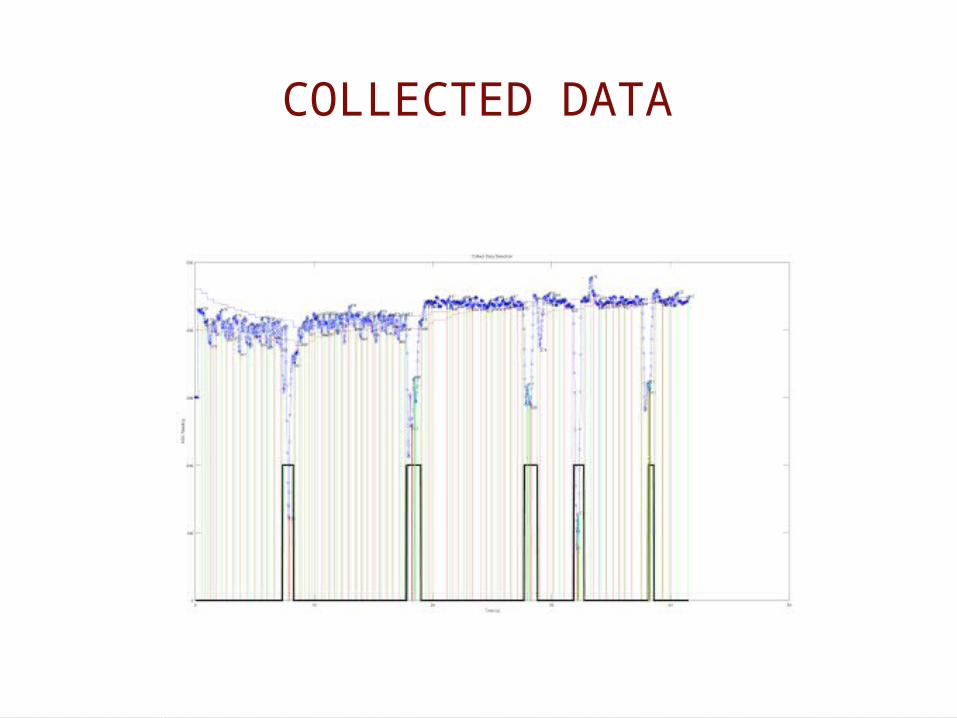
COLLECTED DATA
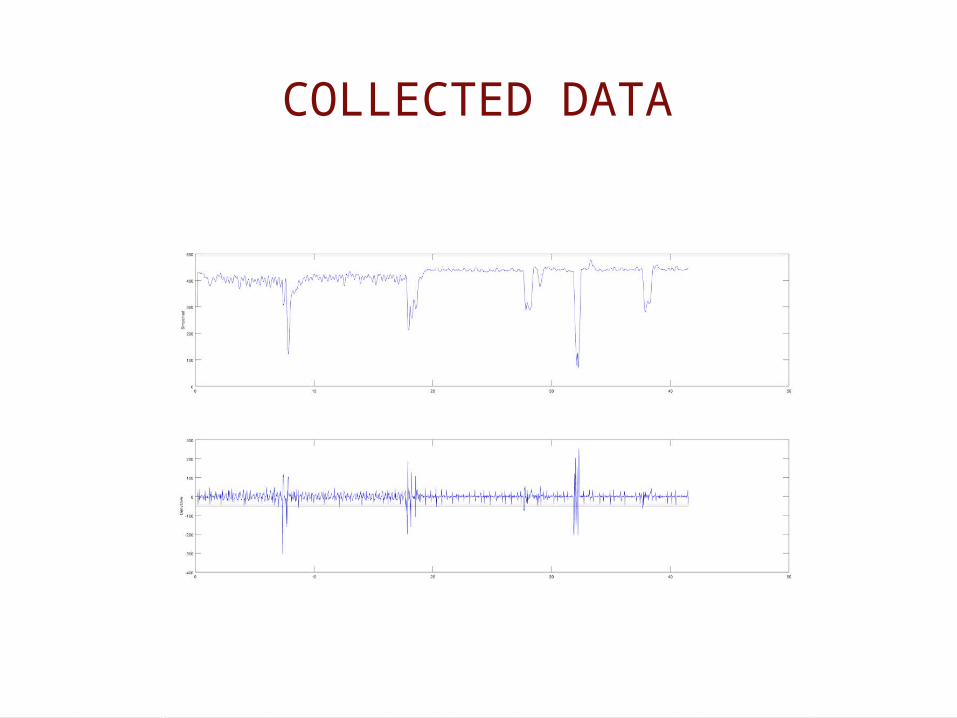
COLLECTED DATA

COLLECTED DATA

COLLECTED DATA

WEIGHT FEASIBILITY
Component SystemQty
Weight
Ext. Weight
Li+ 18650 Electronics 1 45 45GP2Y0A710K0F Sensor 1 9 9MAX EZ Sonar Sensor 2 4.3 8.6Circuit Components Electronics 1 28 28Wires+Connectors Electronics 1 10 10Feedback Motor Feedback 3 1.5 4.5Enclosure Enclosure 1 50 50
Maximum Weight 450gDesired Weight 140gUsed Weight 155.1gWeight Left (Desired State) -15.1gWeight Left (Maximum State) 294.9g

PRODUCT MODEL
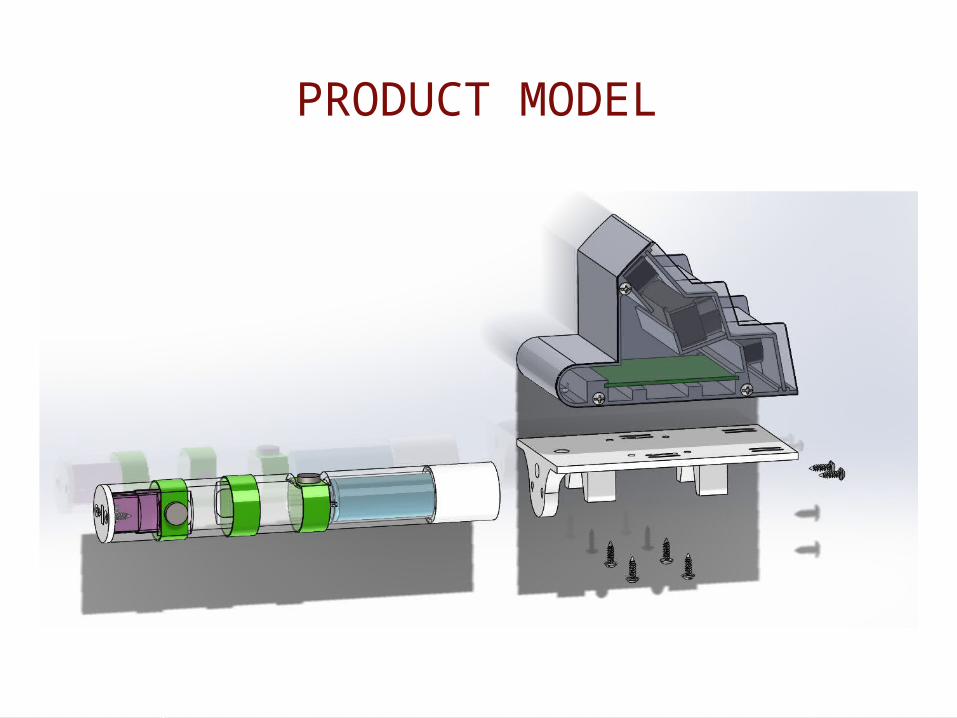
PRODUCT MODEL
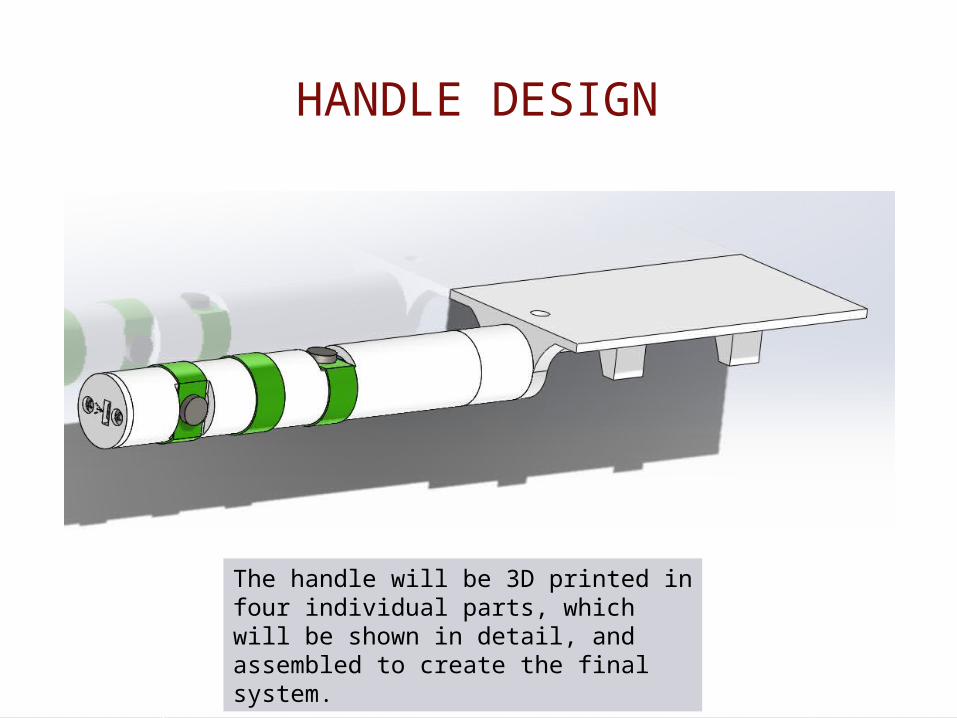
HANDLE DESIGN
The handle will be 3D printed in four individual parts, which will be shown in detail, and assembled to create the final system.
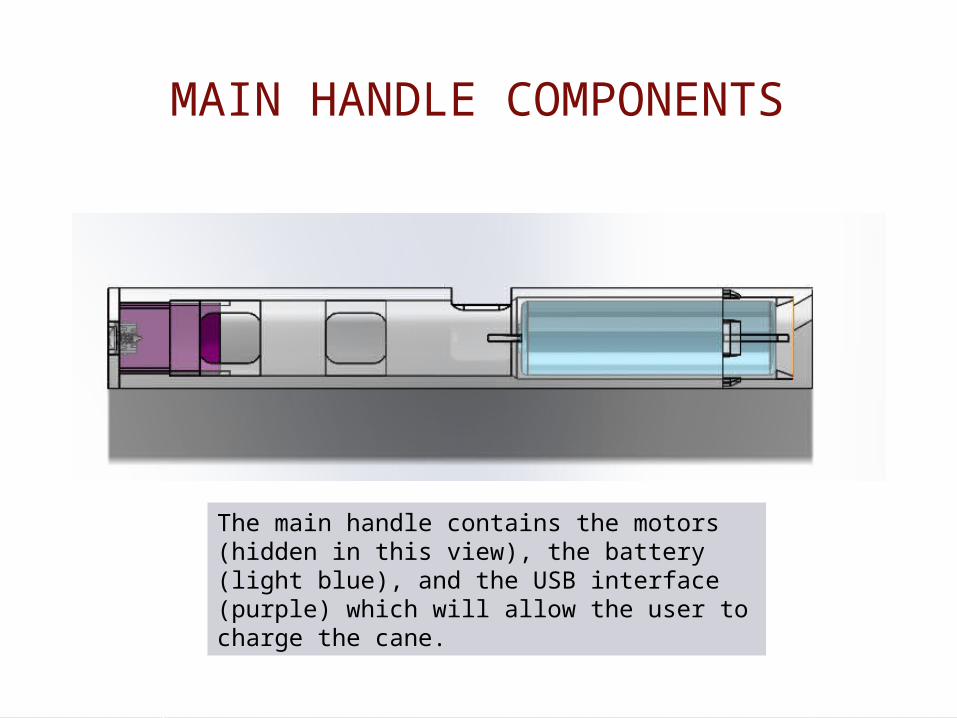
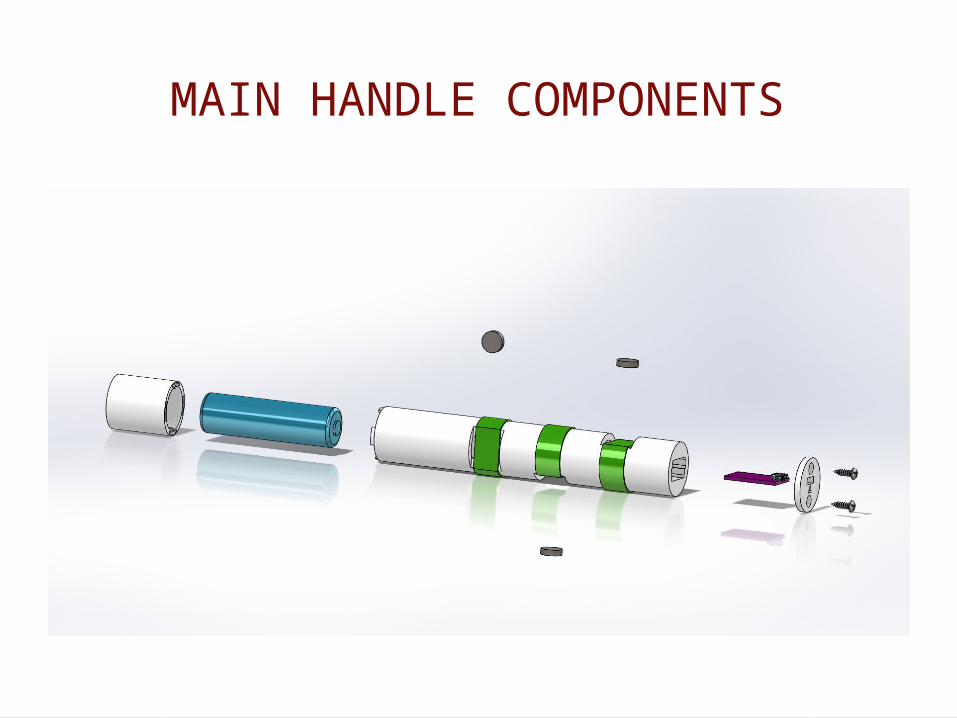
MAIN HANDLE COMPONENTS
The main handle contains the motors (hidden in this view), the battery (light blue), and the USB interface (purple) which will allow the user to charge the cane.
MAIN HANDLE COMPONENTS
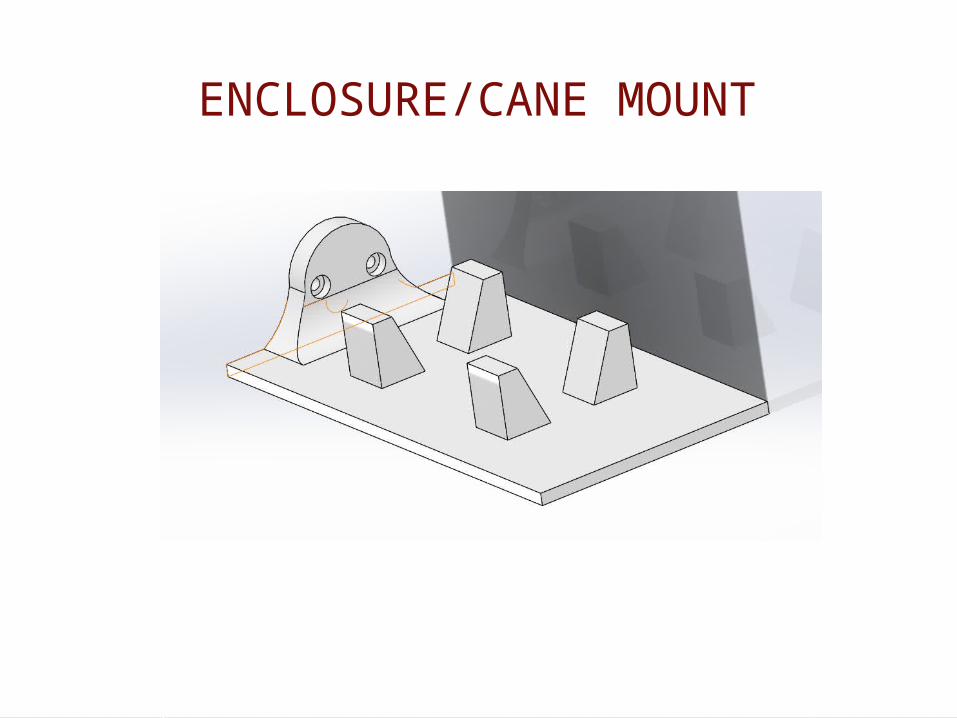
ENCLOSURE/CANE MOUNT
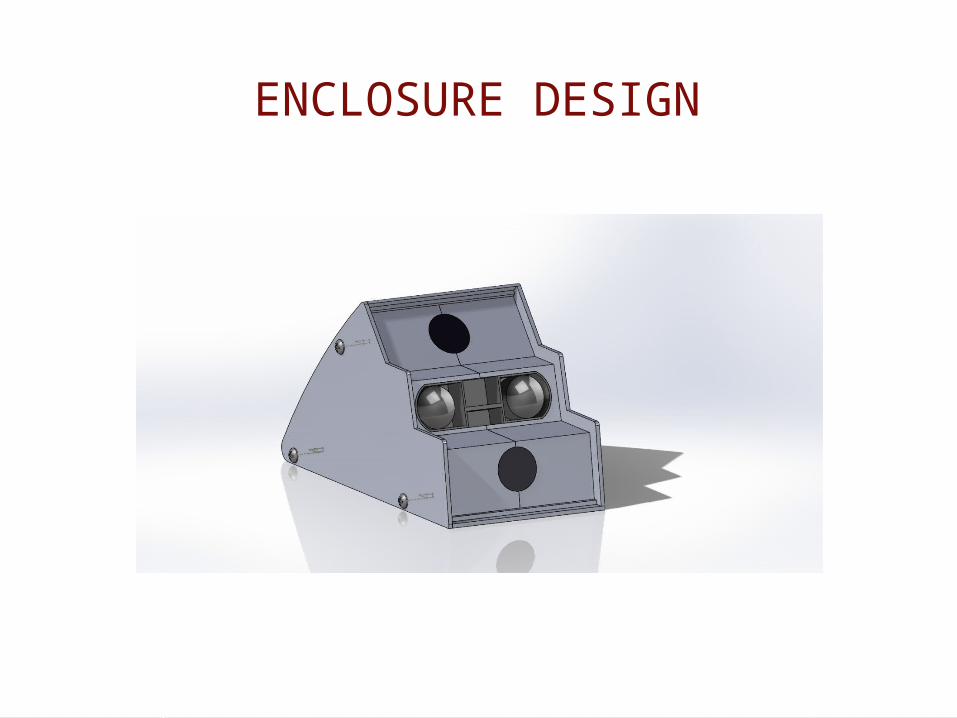
ENCLOSURE DESIGN
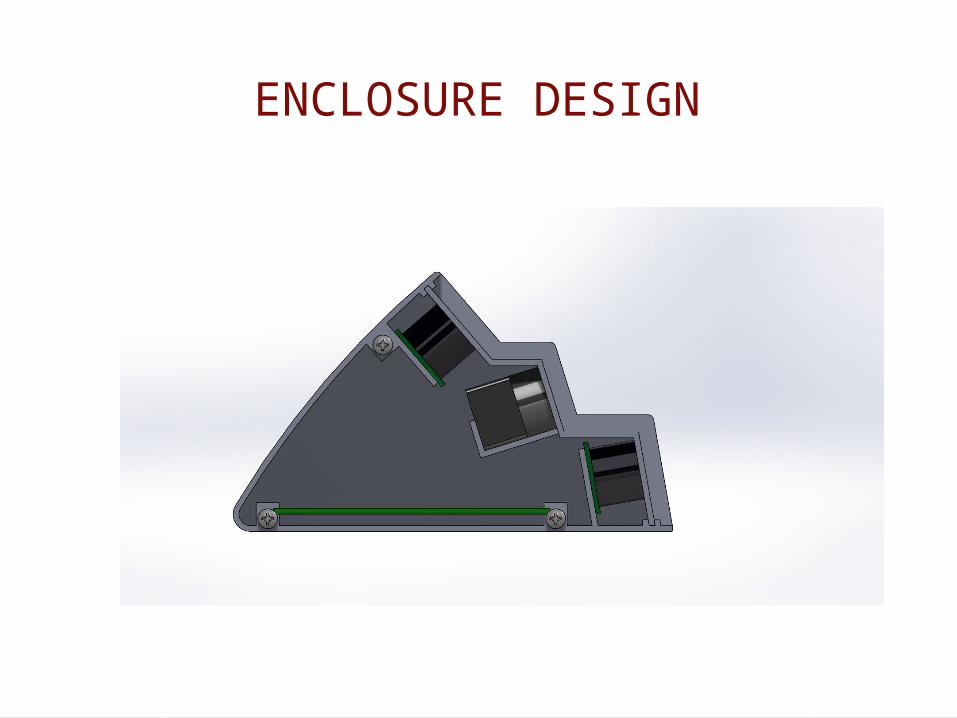
ENCLOSURE DESIGN
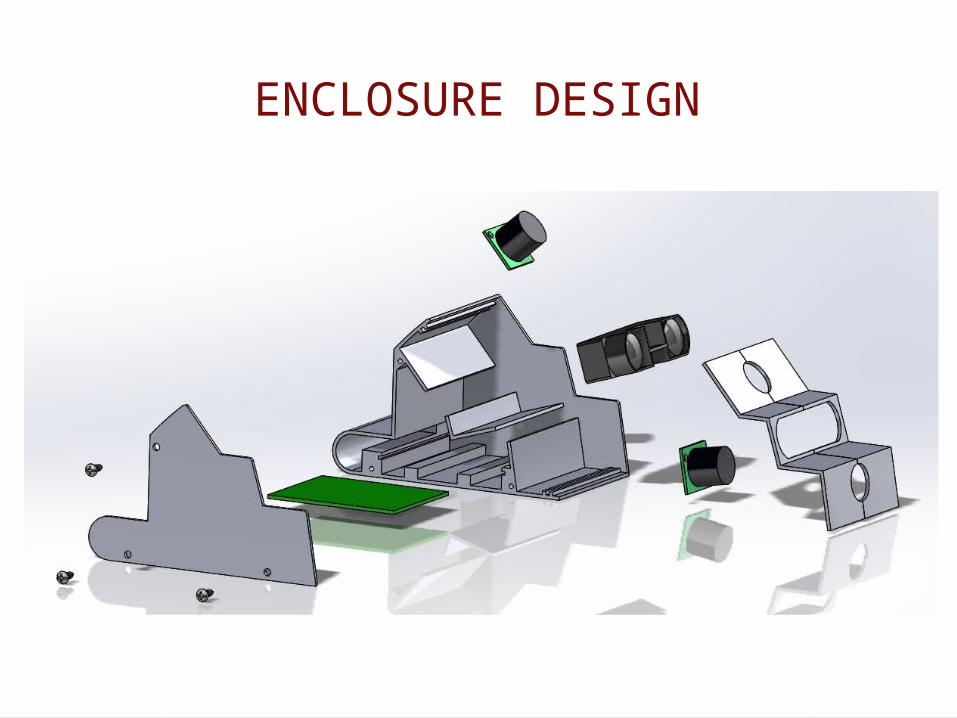
ENCLOSURE DESIGN

HANDLE TEST RESULTS
• Prototype handles revealed that proposed motor mounting system is valid.
• Longevity testing revealed that motors can run for extended periods with negligible changes in heat, and no changes in power requirements.
• Motor response time confirmed to be 50 ms (average).
• To be addressed on Friday, November 21st:• Ability to differentiate between motor locations• Ability to differentiate between vibrational intensity

PROTOTYPE TEST PLAN
3 prototype handles will be created, each with different motor locations, as shown in the diagrams below:
Users will be asked to indicate which motor configuration is more clear in terms of response, as well as to indicate the ability to differentiate between intensity levels

PROTOTYPE TEST PLAN

PROJECT BOM/BUDGET

PROJECT BOM/BUDGET CON’T
Based on the Updated Risk Plan going forward into MSD 2, it was determined that 60% of the budget needs to be saved for use in MSD 2.
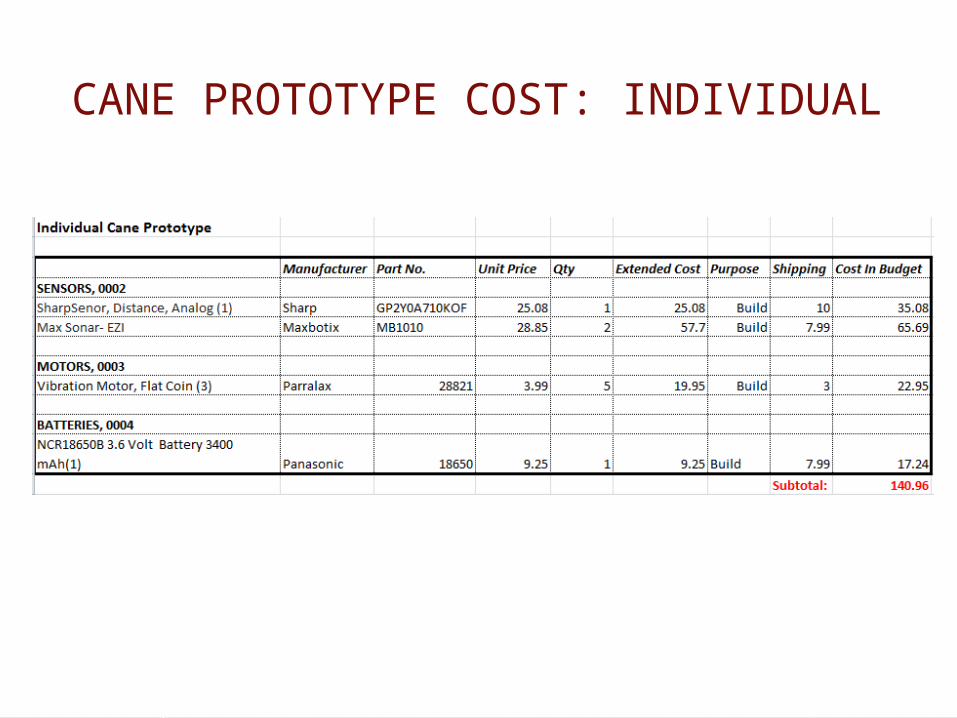
CANE PROTOTYPE COST: INDIVIDUAL
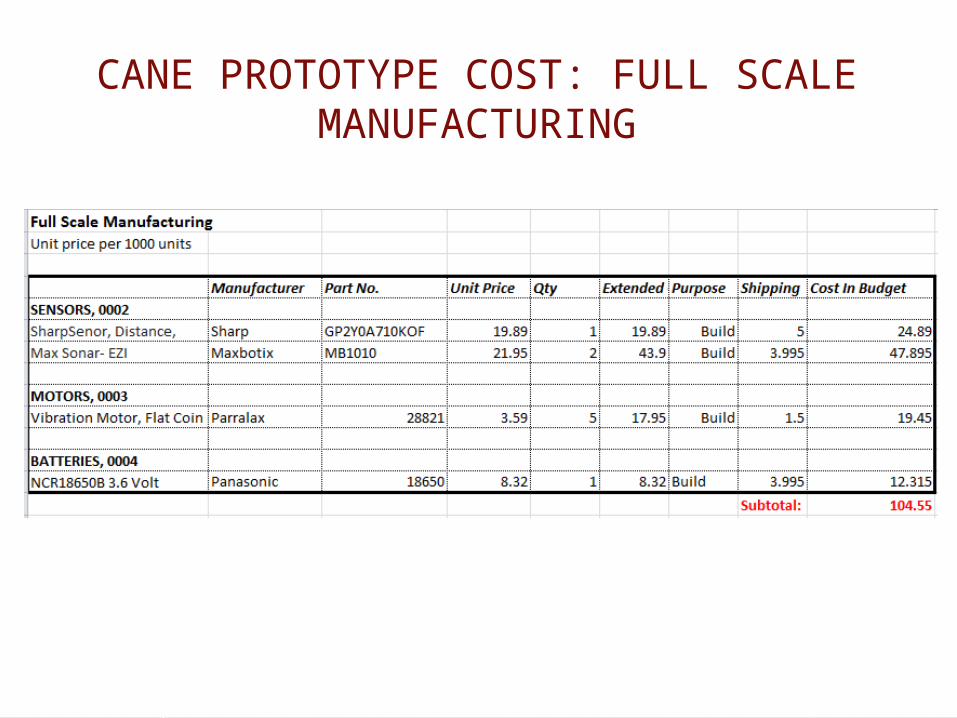
CANE PROTOTYPE COST: FULL SCALE MANUFACTURING

PREDICTED BUDGET: MSD 2

PROJECT PLAN: FINAL WEEKS OF MSD 1

PROJECT PLAN: FINAL WEEKS OF MSD 1

MANAGERIAL LESSONS LEARNED
• Ensure that entire team is involved with developing potential risk scenarios
• Involve guide more throughout the design process in order to save time when it comes closer to presentation time
• Base budgeting decisions on possible material replacements, rather than allocating entire budget to separate portions of the design
ENGINEERING LESSONS LEARNED
• Verify concept analytically before component selection. • Initial IR sensor range was not adequate for dropoff
detection.
• Test multiple solutions to engineering problems to verify which is the most effective. • Often, initial assumptions are not the most effective.
• Don’t overlook tools required to perform tests. • Second IR sensor did not come with a cable.

LOOKING FORWARD: MSD 2

QUESTIONS

ASSEMBLY DRAWING

ASSEMBLY DRAWING

ASSEMBLY DRAWING
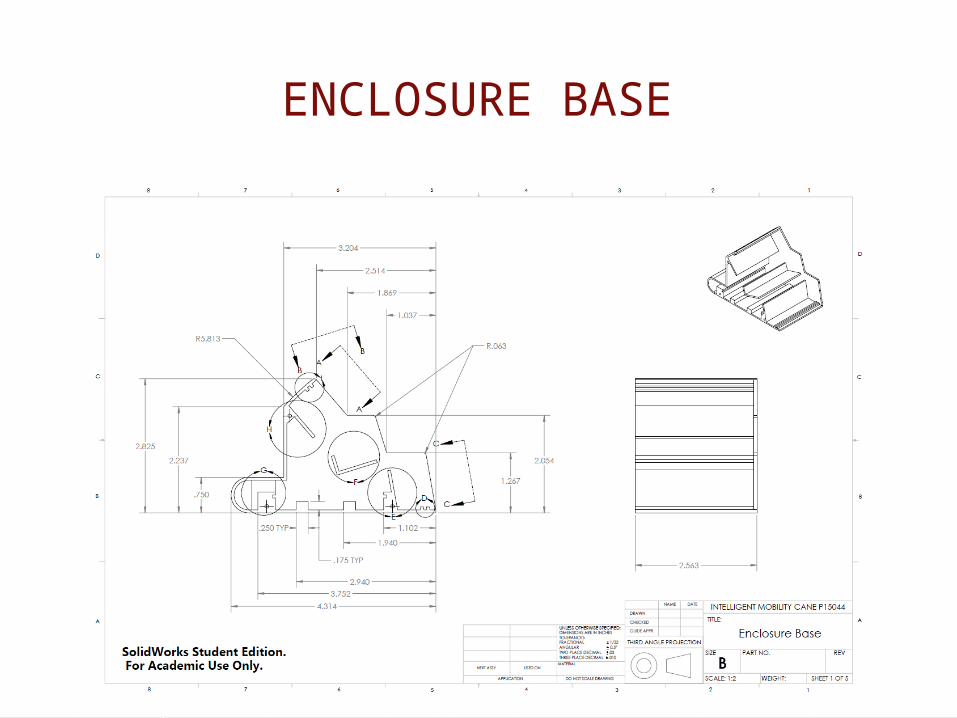
ENCLOSURE BASE
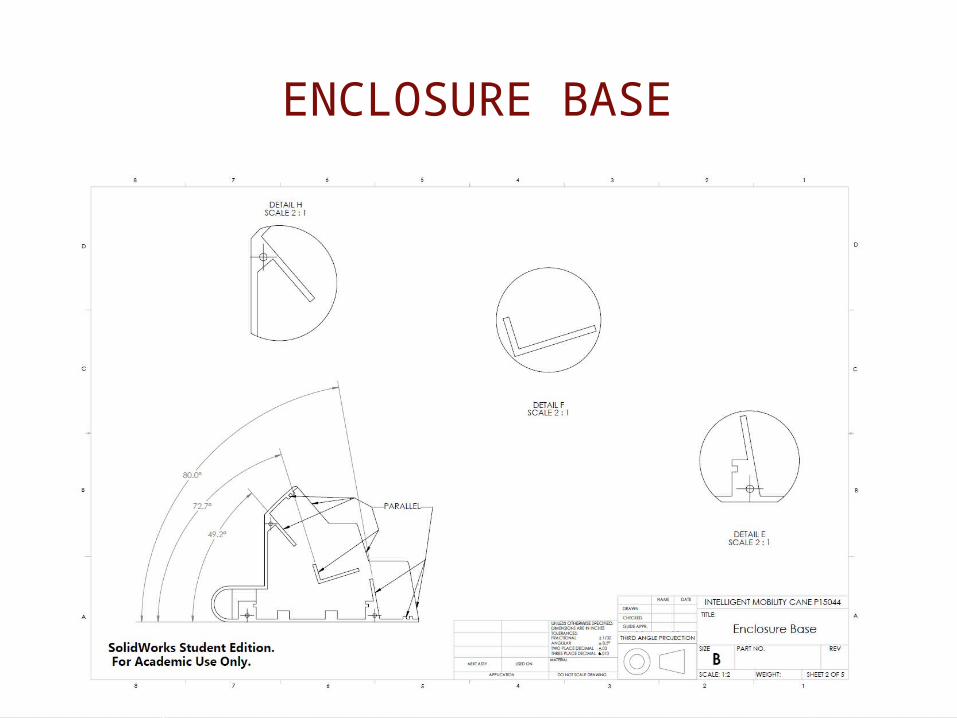
ENCLOSURE BASE
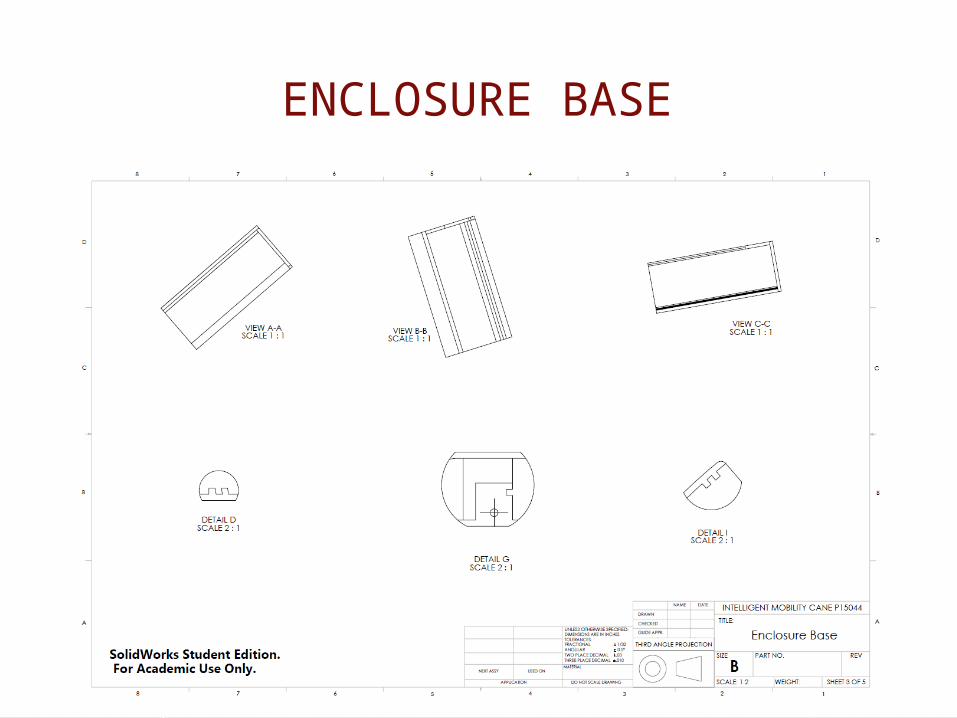
ENCLOSURE BASE

ENCLOSURE COVER
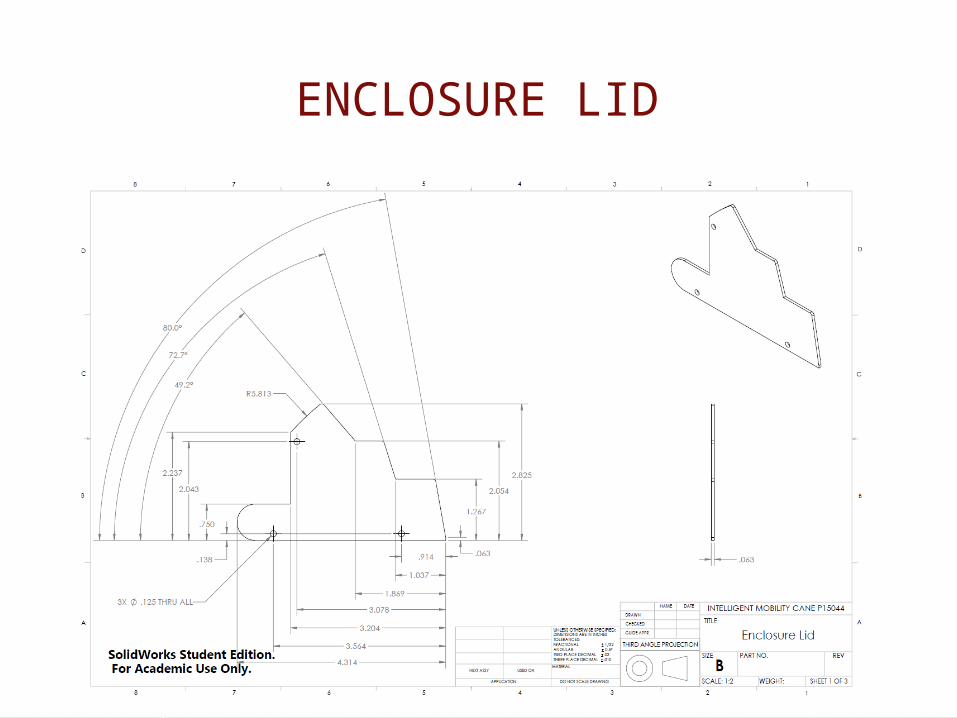
ENCLOSURE LID