All-Connect and Shuttle Express would like to extend our ... Shippers Choice.pdf · Annual...
9
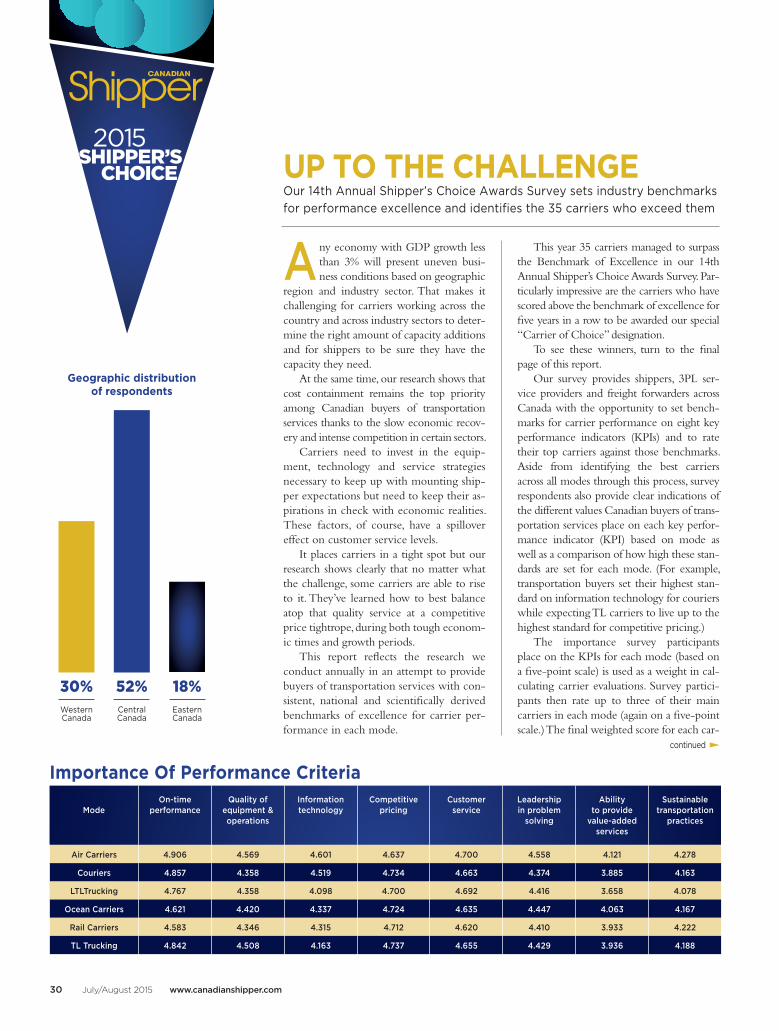
A ny economy with GDP growth less than 3% will present uneven busi- ness conditions based on geographic region and industry sector. That makes it challenging for carriers working across the country and across industry sectors to deter- mine the right amount of capacity additions and for shippers to be sure they have the capacity they need. At the same time, our research shows that cost containment remains the top priority among Canadian buyers of transportation services thanks to the slow economic recov- ery and intense competition in certain sectors. Carriers need to invest in the equip- ment, technology and service strategies necessary to keep up with mounting ship- per expectations but need to keep their as- pirations in check with economic realities. These factors, of course, have a spillover effect on customer service levels. It places carriers in a tight spot but our research shows clearly that no matter what the challenge, some carriers are able to rise to it. They’ve learned how to best balance atop that quality service at a competitive price tightrope, during both tough econom- ic times and growth periods. This report reflects the research we conduct annually in an attempt to provide buyers of transportation services with con- sistent, national and scientifically derived benchmarks of excellence for carrier per- formance in each mode. This year 35 carriers managed to surpass the Benchmark of Excellence in our 14th Annual Shipper’s Choice Awards Survey. Par- ticularly impressive are the carriers who have scored above the benchmark of excellence for five years in a row to be awarded our special “Carrier of Choice” designation. To see these winners, turn to the final page of this report. Our survey provides shippers, 3PL ser- vice providers and freight forwarders across Canada with the opportunity to set bench- marks for carrier performance on eight key performance indicators (KPIs) and to rate their top carriers against those benchmarks. Aside from identifying the best carriers across all modes through this process, survey respondents also provide clear indications of the different values Canadian buyers of trans- portation services place on each key perfor- mance indicator (KPI) based on mode as well as a comparison of how high these stan- dards are set for each mode. (For example, transportation buyers set their highest stan- dard on information technology for couriers while expecting TL carriers to live up to the highest standard for competitive pricing.) The importance survey participants place on the KPIs for each mode (based on a five-point scale) is used as a weight in cal- culating carrier evaluations. Survey partici- pants then rate up to three of their main carriers in each mode (again on a five-point scale.) The final weighted score for each car- 30 July/August 2015 www.canadianshipper.com UP TO THE CHALLENGE Our 14th Annual Shipper’s Choice Awards Survey sets industry benchmarks for performance excellence and identifies the 35 carriers who exceed them 2015 SHIPPER’S CHOICE continued Geographic distribution of respondents 18% Western Canada 30% Eastern Canada 52% Central Canada Importance Of Performance Criteria Mode On-time performance Quality of equipment & operations Information technology Competitive pricing Customer service Leadership in problem solving Ability to provide value-added services Sustainable transportation practices Air Carriers 4.906 4.569 4.601 4.637 4.700 4.558 4.121 4.278 Couriers 4.857 4.358 4.519 4.734 4.663 4.374 3.885 4.163 LTLTrucking 4.767 4.358 4.098 4.700 4.692 4.416 3.658 4.078 Ocean Carriers 4.621 4.420 4.337 4.724 4.635 4.447 4.063 4.167 Rail Carriers 4.583 4.346 4.315 4.712 4.620 4.410 3.933 4.222 TL Trucking 4.842 4.508 4.163 4.737 4.655 4.429 3.936 4.188
Transcript of All-Connect and Shuttle Express would like to extend our ... Shippers Choice.pdf · Annual...
Any economy with GDP growth less than 3% will present uneven busi-ness conditions based on geographic
region and industry sector. That makes it challenging for carriers working across the country and across industry sectors to deter-mine the right amount of capacity additions and for shippers to be sure they have the capacity they need.
At the same time, our research shows that cost containment remains the top priority among Canadian buyers of transportation services thanks to the slow economic recov-ery and intense competition in certain sectors.
Carriers need to invest in the equip-ment, technology and service strategies necessary to keep up with mounting ship-per expectations but need to keep their as-pirations in check with economic realities. These factors, of course, have a spillover effect on customer service levels.
It places carriers in a tight spot but our research shows clearly that no matter what the challenge, some carriers are able to rise to it. They’ve learned how to best balance atop that quality service at a competitive price tightrope, during both tough econom-ic times and growth periods.
This report reflects the research we conduct annually in an attempt to provide buyers of transportation services with con-sistent, national and scientifically derived benchmarks of excellence for carrier per-formance in each mode.
This year 35 carriers managed to surpass the Benchmark of Excellence in our 14th Annual Shipper’s Choice Awards Survey. Par-ticularly impressive are the carriers who have scored above the benchmark of excellence for five years in a row to be awarded our special “Carrier of Choice” designation.
To see these winners, turn to the final page of this report.
Our survey provides shippers, 3PL ser-vice providers and freight forwarders across Canada with the opportunity to set bench-marks for carrier performance on eight key performance indicators (KPIs) and to rate their top carriers against those benchmarks. Aside from identifying the best carriers across all modes through this process, survey respondents also provide clear indications of the different values Canadian buyers of trans-portation services place on each key perfor-mance indicator (KPI) based on mode as well as a comparison of how high these stan-dards are set for each mode. (For example, transportation buyers set their highest stan-dard on information technology for couriers while expecting TL carriers to live up to the highest standard for competitive pricing.)
The importance survey participants place on the KPIs for each mode (based on a five-point scale) is used as a weight in cal-culating carrier evaluations. Survey partici-pants then rate up to three of their main carriers in each mode (again on a five-point scale.) The final weighted score for each car-
30 July/August 2015 www.canadianshipper.com
UP TO THE CHALLENGEOur 14th Annual Shipper’s Choice Awards Survey sets industry benchmarks
for performance excellence and identifies the 35 carriers who exceed them
2015SHIPPER’S
CHOICE
continued
Geographic distribution of respondents
18% Western Canada
30% Eastern Canada
52% Central Canada
Importance Of Performance Criteria
ModeOn-time
performanceQuality of
equipment & operations
Information technology
Competitive pricing
Customer service
Leadership in problem
solving
Ability to provide
value-added services
Sustainable transportation
practices
Air Carriers 4.906 4.569 4.601 4.637 4.700 4.558 4.121 4.278
Couriers 4.857 4.358 4.519 4.734 4.663 4.374 3.885 4.163
LTLTrucking 4.767 4.358 4.098 4.700 4.692 4.416 3.658 4.078
Ocean Carriers 4.621 4.420 4.337 4.724 4.635 4.447 4.063 4.167
Rail Carriers 4.583 4.346 4.315 4.712 4.620 4.410 3.933 4.222
TL Trucking 4.842 4.508 4.163 4.737 4.655 4.429 3.936 4.188we’re putting value in motion
OAKVILLE HAWKESBURY MONTREAL KITCHENER PITTSBURGH
1.800.388.7947w w w . a l l c o n n e c t . c a
Hazardous GoodsTemperature ControlledWarehousing & DistributionFlatbeds / Stepdecks / Rolltites
Truckload & LTLRegular or Expedited
Freight TransportationBull Ring Equipped Trailers
All-Connect and Shuttle Express would like to
extend our sincerest gratitude to all of our
customers for helping us set & achieve the
industry standard in the LTL & Truckload
categories for the 5th year in a row
Thank You!
p30-47 CdnShipper JulyAug2015_ShippersChoice3.indd 30 15-07-06 2:54 PM

rier is derived by multiplying the carrier’s average performance score by the average importance rating for each key performance indicator for that mode.
Because survey participants are first asked to rate the importance they place on each of the eight KPIs when making their carrier se-lections, and that data is used as a weight on their carrier evaluations, we feel that the benchmarks set are truly standards of excel-lence. In other words, carrier performance is judged against an ideal of what shippers ex-pect and the areas given the most weight are the ones that matter most to buyers of trans-portation services. As a result, of the hundreds of carriers rated in our survey, only a very few are deemed by participants’ evaluations as providing a service so superior that it war-rants a Shipper’s Choice Award.
Carriers receive the Shipper’s Choice Award when their total score meets or sur-passes the total benchmark of excellence for their mode. Only those carriers who exceed this benchmark have their names and scores included in the following tables.
Average shipper satisfaction ratings for each KPI are shown by mode. The final col-umn on the right shows the total bench-mark of excellence set for each mode. The benchmarks for each of the eight KPIs per mode are indicated with each modal table on the following pages.
Invitations were sent to more than 6,000 of our readers who are buyers of transporta-tion services in the manufacturing, retail and other sectors as well as to individuals respon-sible for managing shipments within the freight forwarding and 3PL sectors.
Carriers must receive a minimum num-ber of evaluations in order to qualify for the award. It should be noted that this year win-ning was made all the more difficult because we once again raised the number of evalua-tions necessary to qualify for the award for almost every mode. In order to boost re-sponse, carriers were given the opportunity to forward the survey to their own customer lists. Not all carriers chose to do so, however. To prevent tampering, we check for multiple cases submitted by known respondents. If
32 July/August 2015 www.canadianshipper.com
Shipper Satisfaction Ratings By Mode
ModeOn-time
performanceQuality of
equipment & operations
Information technology
Competitive pricing
Customer service
Leadership in problem
solving
Ability to provide
value-added services
Sustainable transportation
practices
Total satisfaction
score
Air Carriers 21.42 19.54 18.94 19.03 19.71 18.35 16.01 16.89 149.878
Couriers 20.72 18.39 18.70 19.01 18.38 16.36 14.44 16.29 142.306
LTLTrucking 20.44 18.50 16.36 19.87 19.89 17.78 14.57 16.57 143.982
Ocean Carriers 19.14 18.19 17.17 19.43 19.11 17.41 15.59 16.30 142.344
Rail Carriers 17.04 16.84 16.92 18.71 16.60 15.15 13.27 15.67 130.200
TL Trucking 21.31 19.63 16.64 20.29 20.41 18.50 16.04 17.37 150.193
Your LTL carrier for Ontario and QuébecPeace of mind transportation from our family to yours
www.MinimaxExpress.com 800-465-6657Now serving Northern Ontario!
continued
WE DID IT AGAIN! Thank You to our loyal clients and the GX team!
LTL • DEDICATED • TL • DIRECT • EXPEDITED • DRY VAN • REEFER • LOGISTICS • DISTRIBUTIONROAD • RAIL • AIR • OCEAN
1-877-740-3940 | www.gxts.com | [email protected]
We are proud to receive the Shipper’s Choice Award for Performance Excellence for the fourth consecutive year.
Thank you GX Customers for your continued support. We will continue to go the extra mile for you.
Thank you GX Team for surpassing industry benchmarks of excellence once again.
Outstanding Results delivered by Outstanding People.
2015SHIPPER’S
CHOICE
p30-47 CdnShipper JulyAug2015_ShippersChoice3.indd 32 15-07-06 2:54 PM

34 July/August 2015 www.canadianshipper.com
there is more than one case, then only the newest one is considered. Likewise, we check for similar IP addresses. As a final check on tampering, we separate and check the evalua-tions submitted by participants from our own e-mail list versus the e-mail lists of carrier customers. Winners must have evaluations submitted by transportation buyers from our own e-mail list to qualify for the award.
More than 2,000 buyers of transporta-tion services participated in our survey, which makes Shipper’s Choice the largest of the several surveys we conduct annually. Thanks to those who took the time to com-plete our survey. (Participants receive an ad-vance electronic copy of the results.) About 10,000 evaluations of carriers from all modes providing services in the Canadian market were cast.
As with past years, participants represent every region across Canada and buy trans-portation services for companies with an-nual sales ranging from less than $5 million
up to more than $2 billion. Their annual supply chain budgets range from less than $100,000 up to more than $25 million. More than a third spend over 70% of their supply chain budgets on transportation.
The Shipper’s Choice Awards Survey was undertaken once again in partnership with CITT and the Freight Management Associa-tion of Canada (FMA), two associations whose members responsible for the purchase of trans-portation number in the thousands. As in pre-vious years, the research was conducted by an independent research firm.
Winning carriers are listed alphabetically, and not by their total score. Those wanting to compare the scores among the winners should keep in mind the high probability that these carriers, although they are being compared to an industry benchmark, have been evaluated by different shippers. This survey is intended as a measure of which carriers exceed industry expectations and not a ranking of the carriers involved.
11%
Over 30 million to 60 million
30%
5 million or less
5%
Over 500 million to 2 billion
12%
Over 15 million to 30 million
11%
Over 100 million to 500 million
20%
Over 5 million to 15 million
7%
Over 60 million to 100 million
7%
Over 2 billion
Gross annual sales
Sectoral distribution of respondents
42%
12% 17%
6%
23%
Manufacturing
Retail
Third-party logistics
Other sectors
Freight forwarding
Annual supply chain budget
21%
10% 25%
13%
12%
13%
7%
$1M - $5M
$5M - $10M
$10M - $20M
More than $20M
$500,000 - $1M
$100,000 - $500,000
Less than $100,000
Thank you for trusting Meyers Transportation Services for nearly 90 years.
Jacquie Meyers-President
1.855.214.0480
2015SHIPPER’S
CHOICE
p30-47 CdnShipper JulyAug2015_ShippersChoice3.indd 34 15-07-06 2:54 PM
36 July/August 2015 www.canadianshipper.com
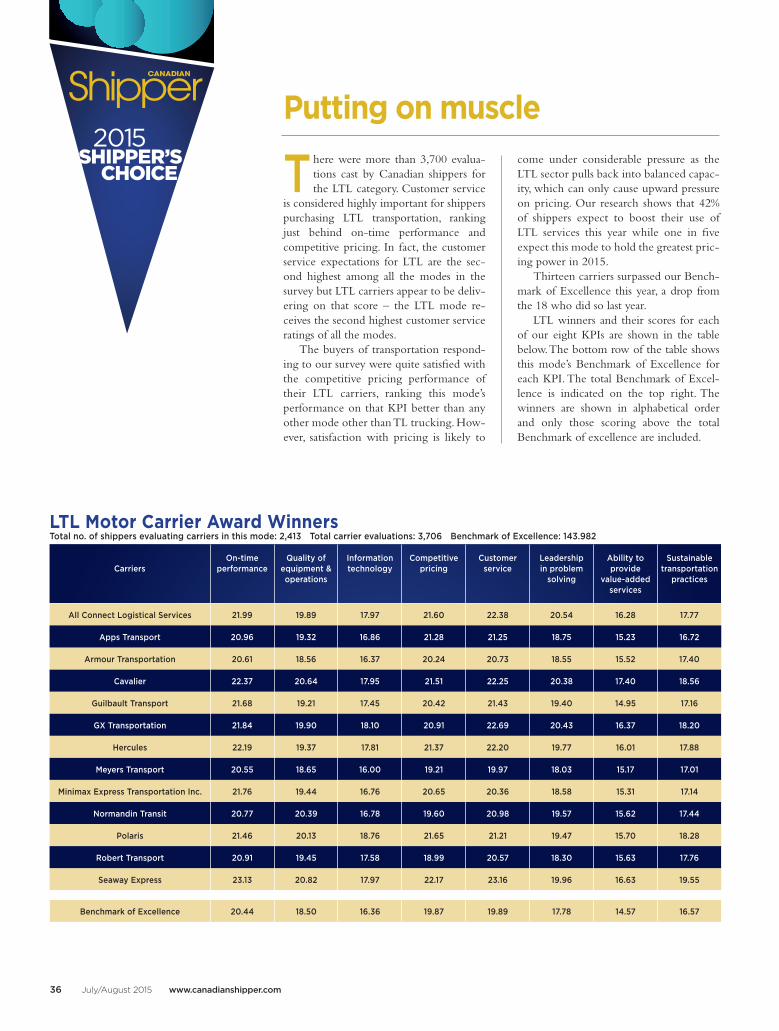
LTL Motor Carrier Award WinnersTotal no. of shippers evaluating carriers in this mode: 2,413 Total carrier evaluations: 3,706 Benchmark of Excellence: 143.982
CarriersOn-time
performanceQuality of
equipment & operations
Information technology
Competitive pricing
Customer service
Leadership in problem
solving
Ability to provide
value-added services
Sustainable transportation
practices
All Connect Logistical Services 21.99 19.89 17.97 21.60 22.38 20.54 16.28 17.77
Apps Transport 20.96 19.32 16.86 21.28 21.25 18.75 15.23 16.72
Armour Transportation 20.61 18.56 16.37 20.24 20.73 18.55 15.52 17.40
Cavalier 22.37 20.64 17.95 21.51 22.25 20.38 17.40 18.56
Guilbault Transport 21.68 19.21 17.45 20.42 21.43 19.40 14.95 17.16
GX Transportation 21.84 19.90 18.10 20.91 22.69 20.43 16.37 18.20
Hercules 22.19 19.37 17.81 21.37 22.20 19.77 16.01 17.88
Meyers Transport 20.55 18.65 16.00 19.21 19.97 18.03 15.17 17.01
Minimax Express Transportation Inc. 21.76 19.44 16.76 20.65 20.36 18.58 15.31 17.14
Normandin Transit 20.77 20.39 16.78 19.60 20.98 19.57 15.62 17.44
Polaris 21.46 20.13 18.76 21.65 21.21 19.47 15.70 18.28
Robert Transport 20.91 19.45 17.58 18.99 20.57 18.30 15.63 17.76
Seaway Express 23.13 20.82 17.97 22.17 23.16 19.96 16.63 19.55
Benchmark of Excellence 20.44 18.50 16.36 19.87 19.89 17.78 14.57 16.57
There were more than 3,700 evalua-tions cast by Canadian shippers for the LTL category. Customer service
is considered highly important for shippers purchasing LTL transportation, ranking just behind on-time performance and competitive pricing. In fact, the customer service expectations for LTL are the sec-ond highest among all the modes in the survey but LTL carriers appear to be deliv-ering on that score – the LTL mode re-ceives the second highest customer service ratings of all the modes.
The buyers of transportation respond-ing to our survey were quite satisfied with the competitive pricing performance of their LTL carriers, ranking this mode’s performance on that KPI better than any other mode other than TL trucking. How-ever, satisfaction with pricing is likely to
come under considerable pressure as the LTL sector pulls back into balanced capac-ity, which can only cause upward pressure on pricing. Our research shows that 42% of shippers expect to boost their use of LTL services this year while one in five expect this mode to hold the greatest pric-ing power in 2015.
Thirteen carriers surpassed our Bench-mark of Excellence this year, a drop from the 18 who did so last year.
LTL winners and their scores for each of our eight KPIs are shown in the table below. The bottom row of the table shows this mode’s Benchmark of Excellence for each KPI. The total Benchmark of Excel-lence is indicated on the top right. The winners are shown in alphabetical order and only those scoring above the total Benchmark of excellence are included.
Putting on muscle
CELEBRATING 30 YEARS OF GROWTHFor 30 years, Hercules has rejuvenated the level of service available in the market
on US to Canada LTL shipments. We will continue to work hard to introduce
innovations that others want to imitate, and traffic staff will enjoy.
Thank you to the shipping community for your tremendous support, allowing
a small forwarder to develop into a national award winning motor carrier.
Hercules looks forward to introducing what’s next!
herculesfreight.com
youtube.com/user/herculesfreight
���������������������� �������������������������������������������������
2015SHIPPER’S
CHOICE
p30-47 CdnShipper JulyAug2015_ShippersChoice3.indd 36 15-07-06 2:54 PM

38 July/August 2015 www.canadianshipper.com
TL Motor Carrier Award WinnersTotal no. of shippers evaluating carriers in this mode: 1,600 Total carrier evaluations: 2,073 Benchmark of Excellence: 150.193
CarriersOn-time
performanceQuality of
equipment & operations
Information technology
Competitive pricing
Customer service
Leadership in problem
solving
Ability to provide
value-added services
Sustainable transportation
practices
All Connect Logistical Services 23.45 20.99 18.97 22.24 22.77 20.73 17.61 18.88
Armour Transport/ Polestar 22.06 19.91 17.33 20.68 21.76 19.29 17.45 17.79
Cavalier Transport 23.08 20.52 18.15 21.98 22.19 20.48 18.39 18.94
Guilbault Transport 22.47 20.65 17.96 20.53 21.50 20.10 16.85 18.51
Hercules 23.56 20.88 19.37 22.44 22.58 21.30 18.51 19.39
IFS - Interstate Freight Systems 22.52 20.19 16.56 20.29 20.34 19.26 16.90 17.68
Keltic Transportation 22.47 20.00 17.32 19.80 20.77 20.50 16.94 18.78
MacKinnon Transport Inc. 22.74 21.06 18.48 20.87 21.68 20.21 18.05 18.31
Meyers Transport 21.13 18.83 17.56 20.98 20.19 17.89 16.90 17.37
Penner Truck Lines 22.51 21.19 17.56 21.59 22.37 19.47 16.74 17.90
Transpro Freight Systems 23.33 21.77 19.35 22.55 22.38 21.08 18.48 19.70
XTL Transport 22.60 20.47 18.24 20.60 22.39 19.55 17.37 18.41
Bison Transport* 20.18 19.57 17.25 19.87 20.35 18.81 15.87 17.98
Kriska Transportation* 20.87 20.20 17.56 19.69 19.95 17.44 15.96 17.68
Benchmark of Excellence 21.31 19.63 16.64 20.29 20.41 18.50 16.04 17.37
*Honorable mention
This has traditionally been the most hotly contested mode in our Ship-per’s Choice Awards and this year is
no different. You have to bring your A game to please Canadian buyers of TL ser-vices and the carriers that make the cut re-ally deliver an excellent service offering based on the survey results.
Once again, the TL category has the highest satisfaction score, making it more difficult to be named to the circle of win-ners in this modal category than any other. The TL mode leads all other modes in satis-faction scores for six of our eight KPIs – quality of equipment & operations; custom-er service; leadership in problem solving; ability to provide value-added services; and sustainable transportation practices. And to top it off, buyers of transportation services score the TL mode highest when it comes to satisfaction with competitive pricing.
Like their LTL counterparts, Canadian TL carriers have been challenged since the recession with the need to replace their ag-
ing fleet. They are now starting to add to their fleets – 2014 was the sixth best year in Class 8 truck sales since 1999 and 2015 will likely be a bit better but buyers of transpor-tation services are concerned trucking fleets are not growing fast enough and be-lieve TL to already be in a tight capacity situation. About a third of the shippers be-lieve this gives TL carriers the greatest pric-ing power in 2015.
More than 1,600 shippers cast more than 2,000 carrier evaluations for the TL category. Twelve carriers surpassed our Benchmark of Excellence this year and two earned honorable mention.
TL winners and their scores for each of our eight KPIs are shown in the table be-low. The bottom row of the table shows this mode’s Benchmark of Excellence for each KPI. The total Benchmark of Excellence is indicated on the top right. The winners are shown in alphabetical order and only those scoring above the total Benchmark of ex-cellence are included.
Perennial leaders
1.888.880.3801 www.groupeguilbault.com
For the fourth consecutive year, we have exceeded the industry benchmark in TL and LTL categories for the excellence of our services.
Our image has taken a turn for the better !
The Guilbault Group is now more visible than ever with a fresh new look, one that is every bit as dynamic and professional as the services we offer.
Your vote of confidence fuels our success!
TO ALL OUR LOYAL CUSTOMERS AND DEDICATED EMPLOYEES,
WE SAY THANKS!2015
SHIPPER’SCHOICE
p30-47 CdnShipper JulyAug2015_ShippersChoice3.indd 38 15-07-06 2:54 PM
40 July/August 2015 www.canadianshipper.com
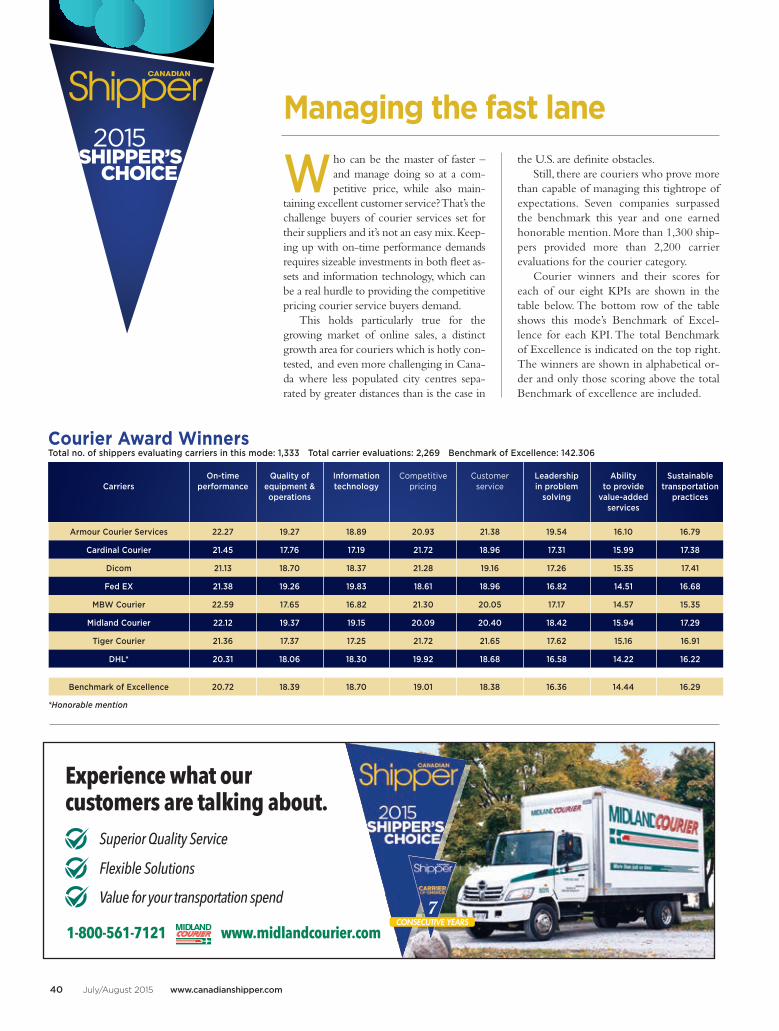
Courier Award WinnersTotal no. of shippers evaluating carriers in this mode: 1,333 Total carrier evaluations: 2,269 Benchmark of Excellence: 142.306
CarriersOn-time
performanceQuality of
equipment & operations
Information technology
Competitive pricing
Customer service
Leadership in problem
solving
Ability to provide
value-added services
Sustainable transportation
practices
Armour Courier Services 22.27 19.27 18.89 20.93 21.38 19.54 16.10 16.79
Cardinal Courier 21.45 17.76 17.19 21.72 18.96 17.31 15.99 17.38
Dicom 21.13 18.70 18.37 21.28 19.16 17.26 15.35 17.41
Fed EX 21.38 19.26 19.83 18.61 18.96 16.82 14.51 16.68
MBW Courier 22.59 17.65 16.82 21.30 20.05 17.17 14.57 15.35
Midland Courier 22.12 19.37 19.15 20.09 20.40 18.42 15.94 17.29
Tiger Courier 21.36 17.37 17.25 21.72 21.65 17.62 15.16 16.91
DHL* 20.31 18.06 18.30 19.92 18.68 16.58 14.22 16.22
Benchmark of Excellence 20.72 18.39 18.70 19.01 18.38 16.36 14.44 16.29
*Honorable mention
Who can be the master of faster – and manage doing so at a com-petitive price, while also main-
taining excellent customer service? That’s the challenge buyers of courier services set for their suppliers and it’s not an easy mix. Keep-ing up with on-time performance demands requires sizeable investments in both fleet as-sets and information technology, which can be a real hurdle to providing the competitive pricing courier service buyers demand.
This holds particularly true for the growing market of online sales, a distinct growth area for couriers which is hotly con-tested, and even more challenging in Cana-da where less populated city centres sepa-rated by greater distances than is the case in
the U.S. are definite obstacles. Still, there are couriers who prove more
than capable of managing this tightrope of expectations. Seven companies surpassed the benchmark this year and one earned honorable mention. More than 1,300 ship-pers provided more than 2,200 carrier evaluations for the courier category.
Courier winners and their scores for each of our eight KPIs are shown in the table below. The bottom row of the table shows this mode’s Benchmark of Excel-lence for each KPI. The total Benchmark of Excellence is indicated on the top right. The winners are shown in alphabetical or-der and only those scoring above the total Benchmark of excellence are included.
Managing the fast lane
Superior Quality Service
Flexible Solutions
Value for your transportation spend
Experience what our customers are talking about.
1-800-561-7121 www.midlandcourier.comCONSECUTIVE YEARS
7
Armour Transportation Systems is the only carrier in Canada to win the Shipper’s Choice Award in all 3 modes for the last 2 years.
From all of us at Armour, we would like to say thank you for your continued support!
CONSECUTIVE YEARS AS THE SHIPPER’S CHOICE IN...
COURIER • LTL • TRUCKLOAD
2015SHIPPER’S
CHOICE
p30-47 CdnShipper JulyAug2015_ShippersChoice3.indd 40 15-07-06 2:54 PM

42 July/August 2015 www.canadianshipper.com
www.cardinalcouriers.com1.800.387.3199
Airfreight is a high cost business for both the buyers and the providers of the service. And in this game on-
time performance is definitely king. That’s followed by the highest customer service expectations of all modes. Not many can make the cut against such high demands but every year a few select air carriers do.
Airfreight carrier winners and their scores for each of our eight KPIs are shown in the table below. The bottom row of the table shows this mode’s Benchmark of Ex-cellence for each KPI. The winners are shown in alphabetical order and only those scoring above the total Benchmark of ex-cellence are included.
Rising above it all2015SHIPPER’S
CHOICE
Air Carrier Award WinnersTotal no. of shippers evaluating carriers in this mode: 345 Total carrier evaluations: 628 Benchmark of Excellence: 149.878
CarriersOn-time
performanceQuality of
equipment & operations
Information technology
Competitive pricing
Customer service
Leadership in problem
solving
Ability to provide
value-added services
Sustainable transportation
practices
Cathay Pacific 21.49 18.50 18.62 18.99 22.16 18.67 17.00 17.86
Cargojet 22.95 20.25 18.94 19.96 21.78 19.89 17.05 18.16
Lufthansa* 21.33 20.06 20.20 17.14 19.82 18.04 15.66 16.92
Benchmark of Excellence 21.42 19.54 18.94 19.03 19.71 18.35 16.01 16.89
*Honorable mention
p30-47 CdnShipper JulyAug2015_ShippersChoice3.indd 42 15-07-06 2:54 PM

44 July/August 2015 www.canadianshipper.com
Ocean Carrier Award WinnersTotal no. of shippers evaluating carriers in this mode: 526 Total carrier evaluations: 561 Benchmark of Excellence: 142.344
CarriersOn-time
performanceQuality of
equipment & operations
Information technology
Competitive pricing
Customer service
Leadership in problem
solving
Ability to provide
value-added services
Sustainable transportation
practices
Oceanex 19.42 18.64 17.25 18.90 18.90 17.75 15.37 16.50
Benchmark of Excellence 19.14 18.19 17.17 19.43 19.11 17.41 15.59 16.30
Price is repeatedly the top criteria in select-ing a marine carrier in our survey. Yet the many newbuilds leave investment costs
that have to be recovered. The industry’s major players have been forming alliances in an at-tempt to shore up freight rates as well as raise ROI and reduce high-capital investments. Buy-ers of marine services however remain con-cerned about the impact on customer service
and on-time performance.Marine winners and their scores for each of
our eight KPIs are shown in the table below. The bottom row of the table shows this mode’s Benchmark of Excellence for each KPI. The total Benchmark of Excellence is indicated on the top right. The winners are shown in alpha-betical order and only those scoring above the total Benchmark of excellence are included.
Looking for the next crest2015SHIPPER’S
CHOICE
At Cavalier, we deliver on the promises we make. We listen to the challenges our customers are facing and respond with unique, results driven solutions.
We are accessible, accommodating and accountable. Our footprint is comprised of strong relationships and personalized performance that carries
through each aspect of our operation.
Expanding Customer Service ThroughInnovation, Creativity and Teamwork!
Thank you for naming Cavalier as your Shipper’s Choice!
Daily LTL Service SchedulesBetween Canada & the USA
Over 35 Years Experienceas a Full Service 3PL
Transportation Provider
Integrated Solutions to CoverAll Aspects of Your Supply Chain
Cost Effective & Innovative Logistics for Canada & the USA
p30-47 CdnShipper JulyAug2015_ShippersChoice3.indd 44 15-07-06 2:54 PM

Cross Border LTL and Truckload
Freight Management Logistics
Warehousing and Distribution
Thank you for voting us as your 2015 Carrier of Choice!
DECORATED CARRIER FOR TRANSBORDER LTL & TL SHIPPING
transprofreight.com 1.800.268.6857
46 July/August 2015 www.canadianshipper.com
Congratulations to the 2015 Carriers of Choice • All Connect
Logistical Services• Cardinal Couriers
• Cargojet• FedEx• Hercules
• Mackinnon Transport• Midland Courier• Polaris Transportation
• Robert Transport• Transpro Freight
Systems
CARRIERS OF CHOICEConsistency of performance deserves a special award
Carriers are presented with this pres-tigious award if they have demon-strated the consistency necessary to
attain the highest levels of service by sur-passing the industry Benchmarks of Excel-lence set in the Shipper’s Choice Awards Survey for a minimum of five consecutive years. This is a particularly difficult task be-cause aside from having to maintain consis-
tent excellence in their operations, carriers will have to meet a likely rising standard set by shippers from year to year while also re-sponding to changing priorities.
To remain part of this exclusive frater-nity, carriers must requalify each year by having surpassed the Shipper’s Choice Awards Benchmark of Excellence for five consecutive years.
CARRIEROF CHOICE
THANK YOU FOR NAMING POLARIS
ONCE AGAIN YOUR CARRIER OF CHOICE
FOLLOW US
2015SHIPPER’S
CHOICE
p30-47 CdnShipper JulyAug2015_ShippersChoice3.indd 46 15-07-06 2:54 PM